Comparison of Methods for Estimating Dietary Food and Nutrient Intakes and Intake Densities from Household Consumption and Expenditure Data in Mongolia

 ,
,  and
and
Abstract
:1. Introduction
- to compare (a) per-capita estimates of household food and nutrient consumption obtained from household-level measurements with (b) per-capita dietary measurements that were obtained from individuals in the same households;
- to compare (a) estimates of individuals’ food and nutrient intake obtained by applying the AME disaggregation method to household consumption measurements with (b) direct measurements of dietary intake obtained from the same individuals;
- to compare (a) estimates of individuals’ food and nutrient intake obtained by applying the statistical disaggregation method to household consumption measurements with (b) direct measurements of dietary intake obtained from the same individuals; and,
- To evaluate the ability of household survey data to predict individuals’ dietary nutrient intake given the availability of (i) direct dietary measurements and (ii) a broad set of household- and individual level characteristics that were obtained from the same individuals.
2. Materials and Methods
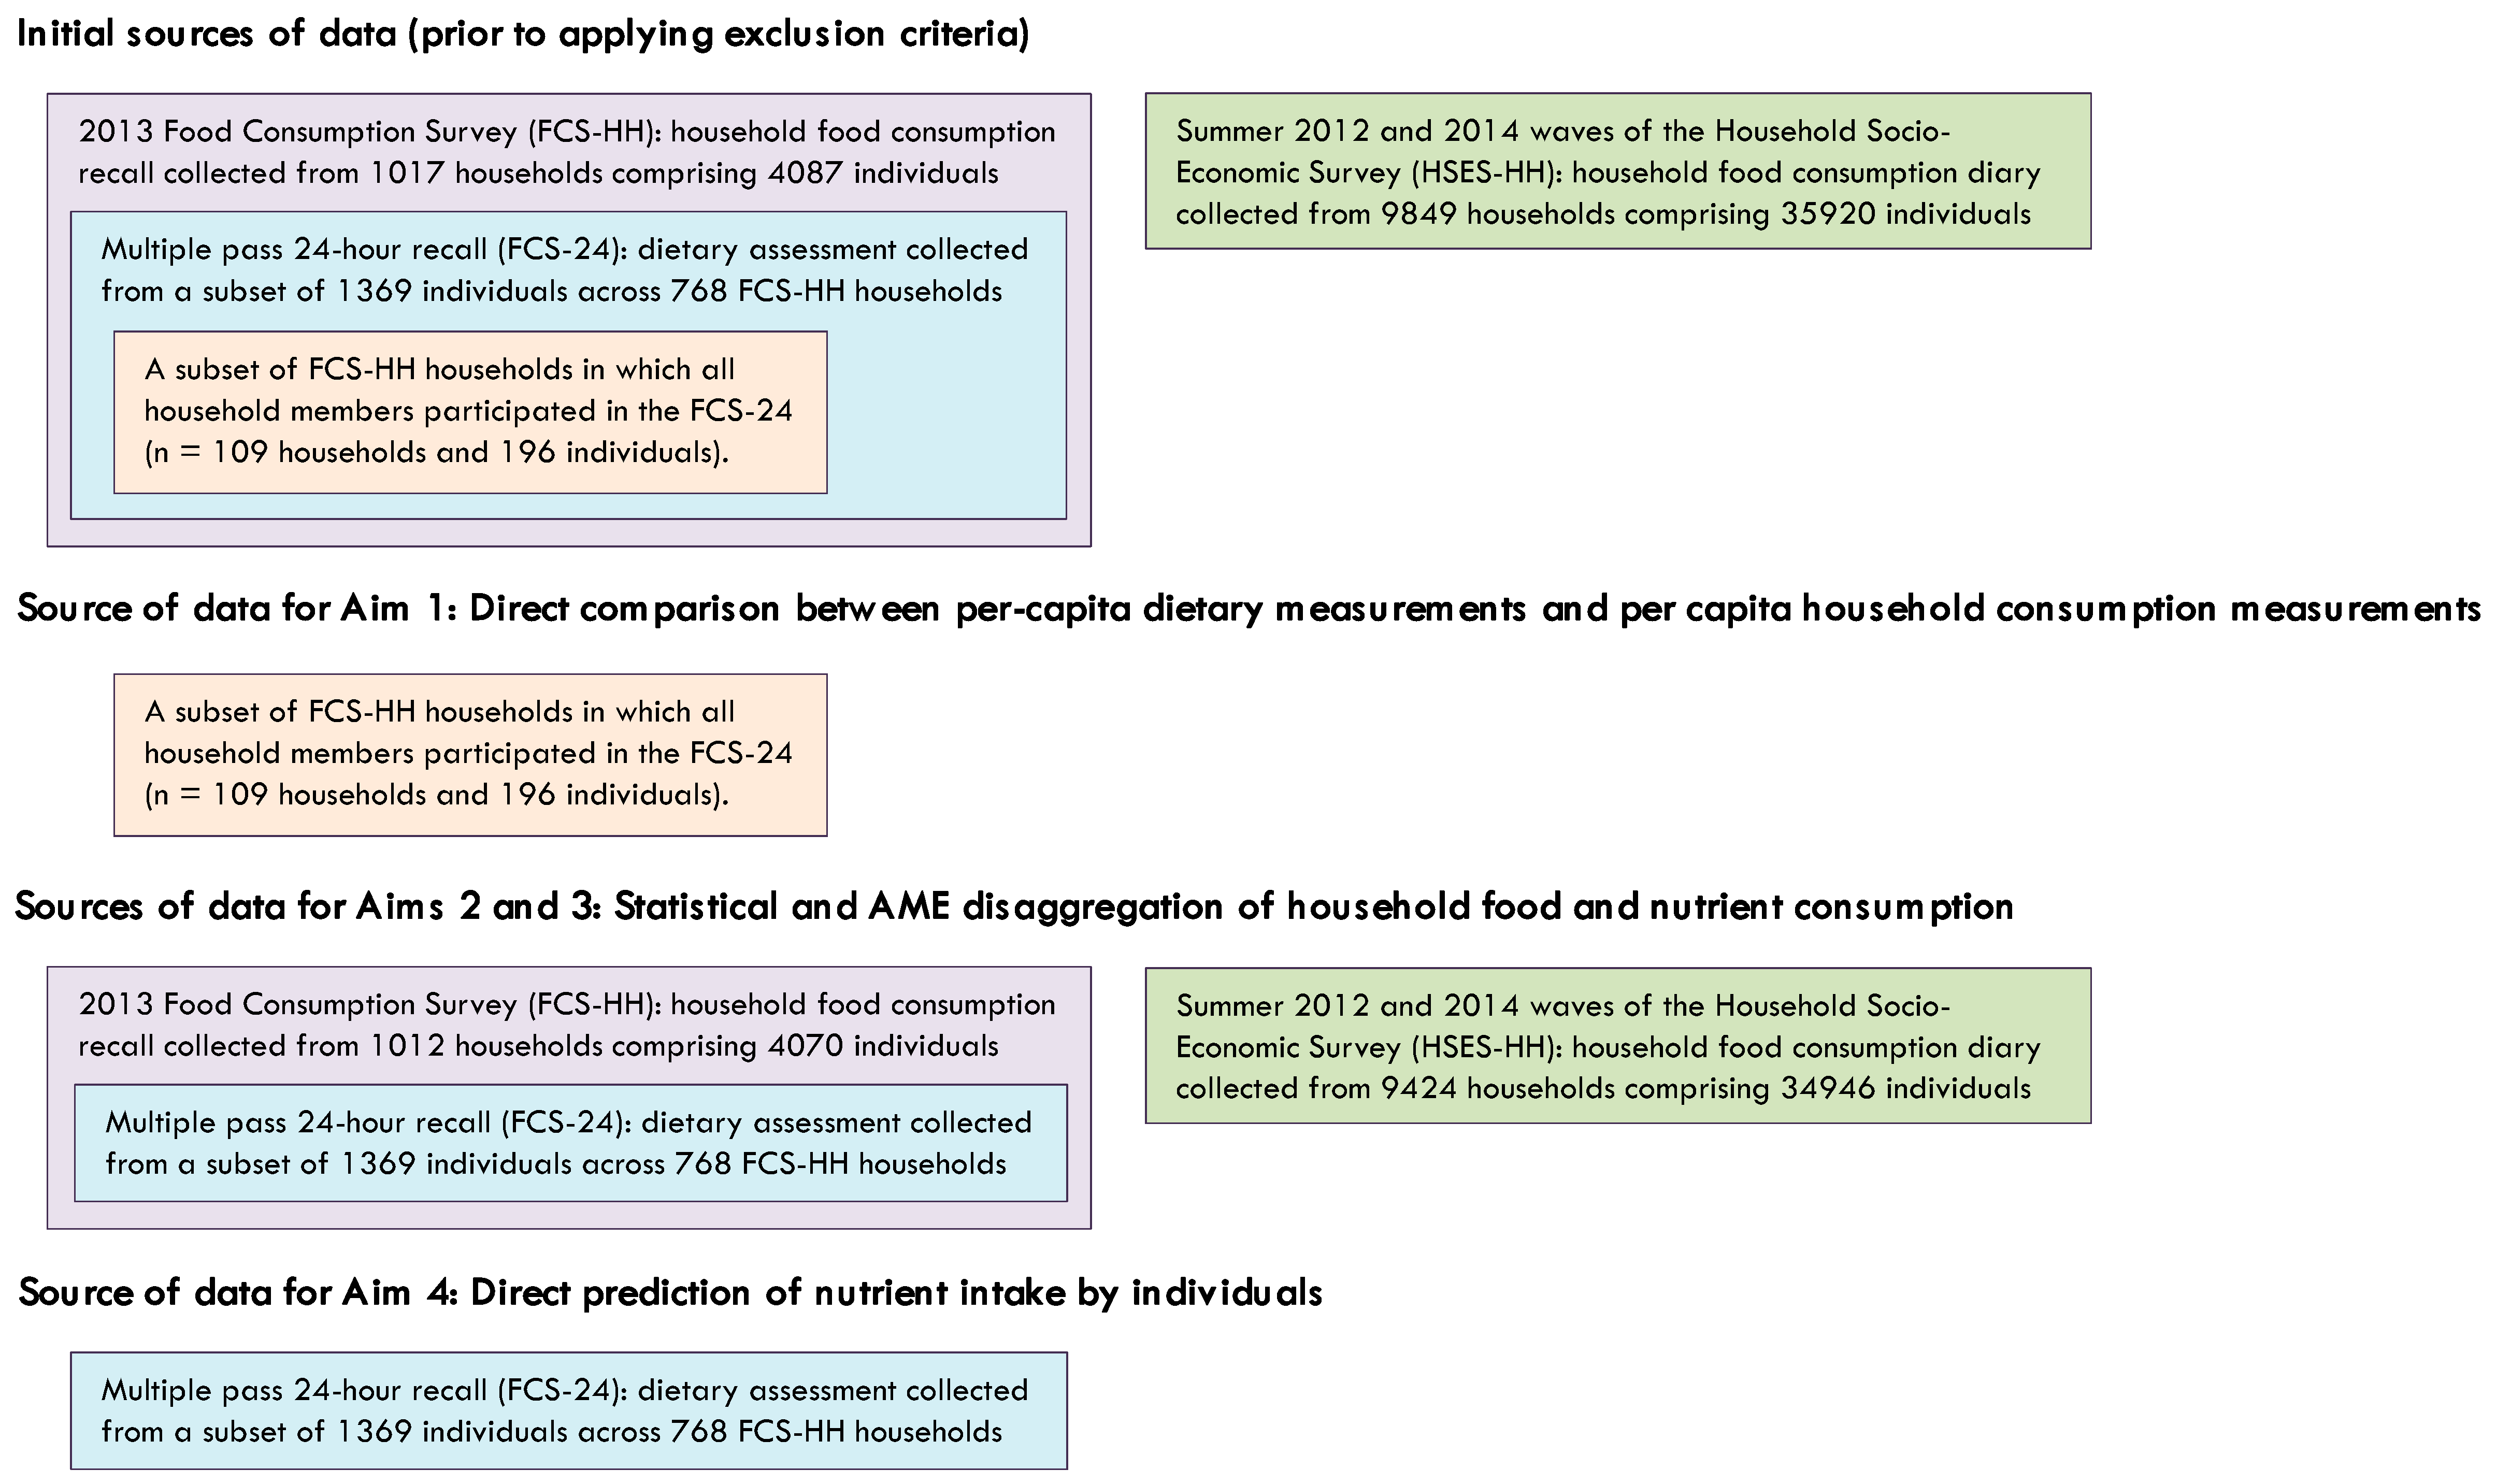
2.1. Sources of Household Food Consumption Data
2.2. Sources of Dietary Intake Data
2.3. Preparation of Data for Analysis
2.4. Exclusion Criteria and Descriptive Statistics
2.5. Aim 1: Direct Comparison between Per-Capita Household Consumption and Per-Capita Dietary Measurements from the Same Households
2.6. Statistical Disaggregation of Household Food and Nutrient Consumption
2.7. AME Disaggregation of Household Food and Nutrient Consumption
2.8. Comparison between Disaggregated Household Consumption Estimates and Individual Dietary Intake Measurements (Aims 2 and 3)
- (1)
- Bias (observed—predicted value) was calculated for each of the 1356 individuals thatanalyzed in the FCS-24, between (a) the individual’s 24HR dietary intake or intake density measurement and (b) the corresponding statistical or AME disaggregated household estimate predicted for the individual based on their age group and sex. Mean bias was calculated for each food group or nutrient and within both the FCS-HH and HSES-HH by averaging bias over all 1356 individuals.
- (2)
- Coverage probability, which was calculated as the proportion of FCS-24 dietary intake or intake density measurements contained within the 95% confidence limits of the estimate predicted by each of the two household consumption disaggregation methods that were based on each individuals’ age and sex, was assessed across all 1356 individuals analyzed in the FCS-24.
- (3)
- For both the statistical and AME methods, disaggregated household consumption and consumption density estimates for each of the 14 age-sex groups captured by the FCS-24 sample (i.e., not including males and females aged 0–4, 5–9, and 10–14 years, which were represented in HSES-HH and FCS-HH, but not in the nested FCS-24) was assigned a rank from 1 to 14. From each rank was subtracted the rank of mean observed dietary intake or intake density for the same age-sex group in the FCS-24 to produce an age- and sex-specific absolute rank bias. Mean absolute rank bias was then calculated for each of the two disaggregation methods by averaging absolute rank bias across the 14 age-sex groups.
2.9. Aim 4: Direct Prediction of Dietary Nutrient Intake by Individuals
3. Results
3.1. Characteristics of Study Populations
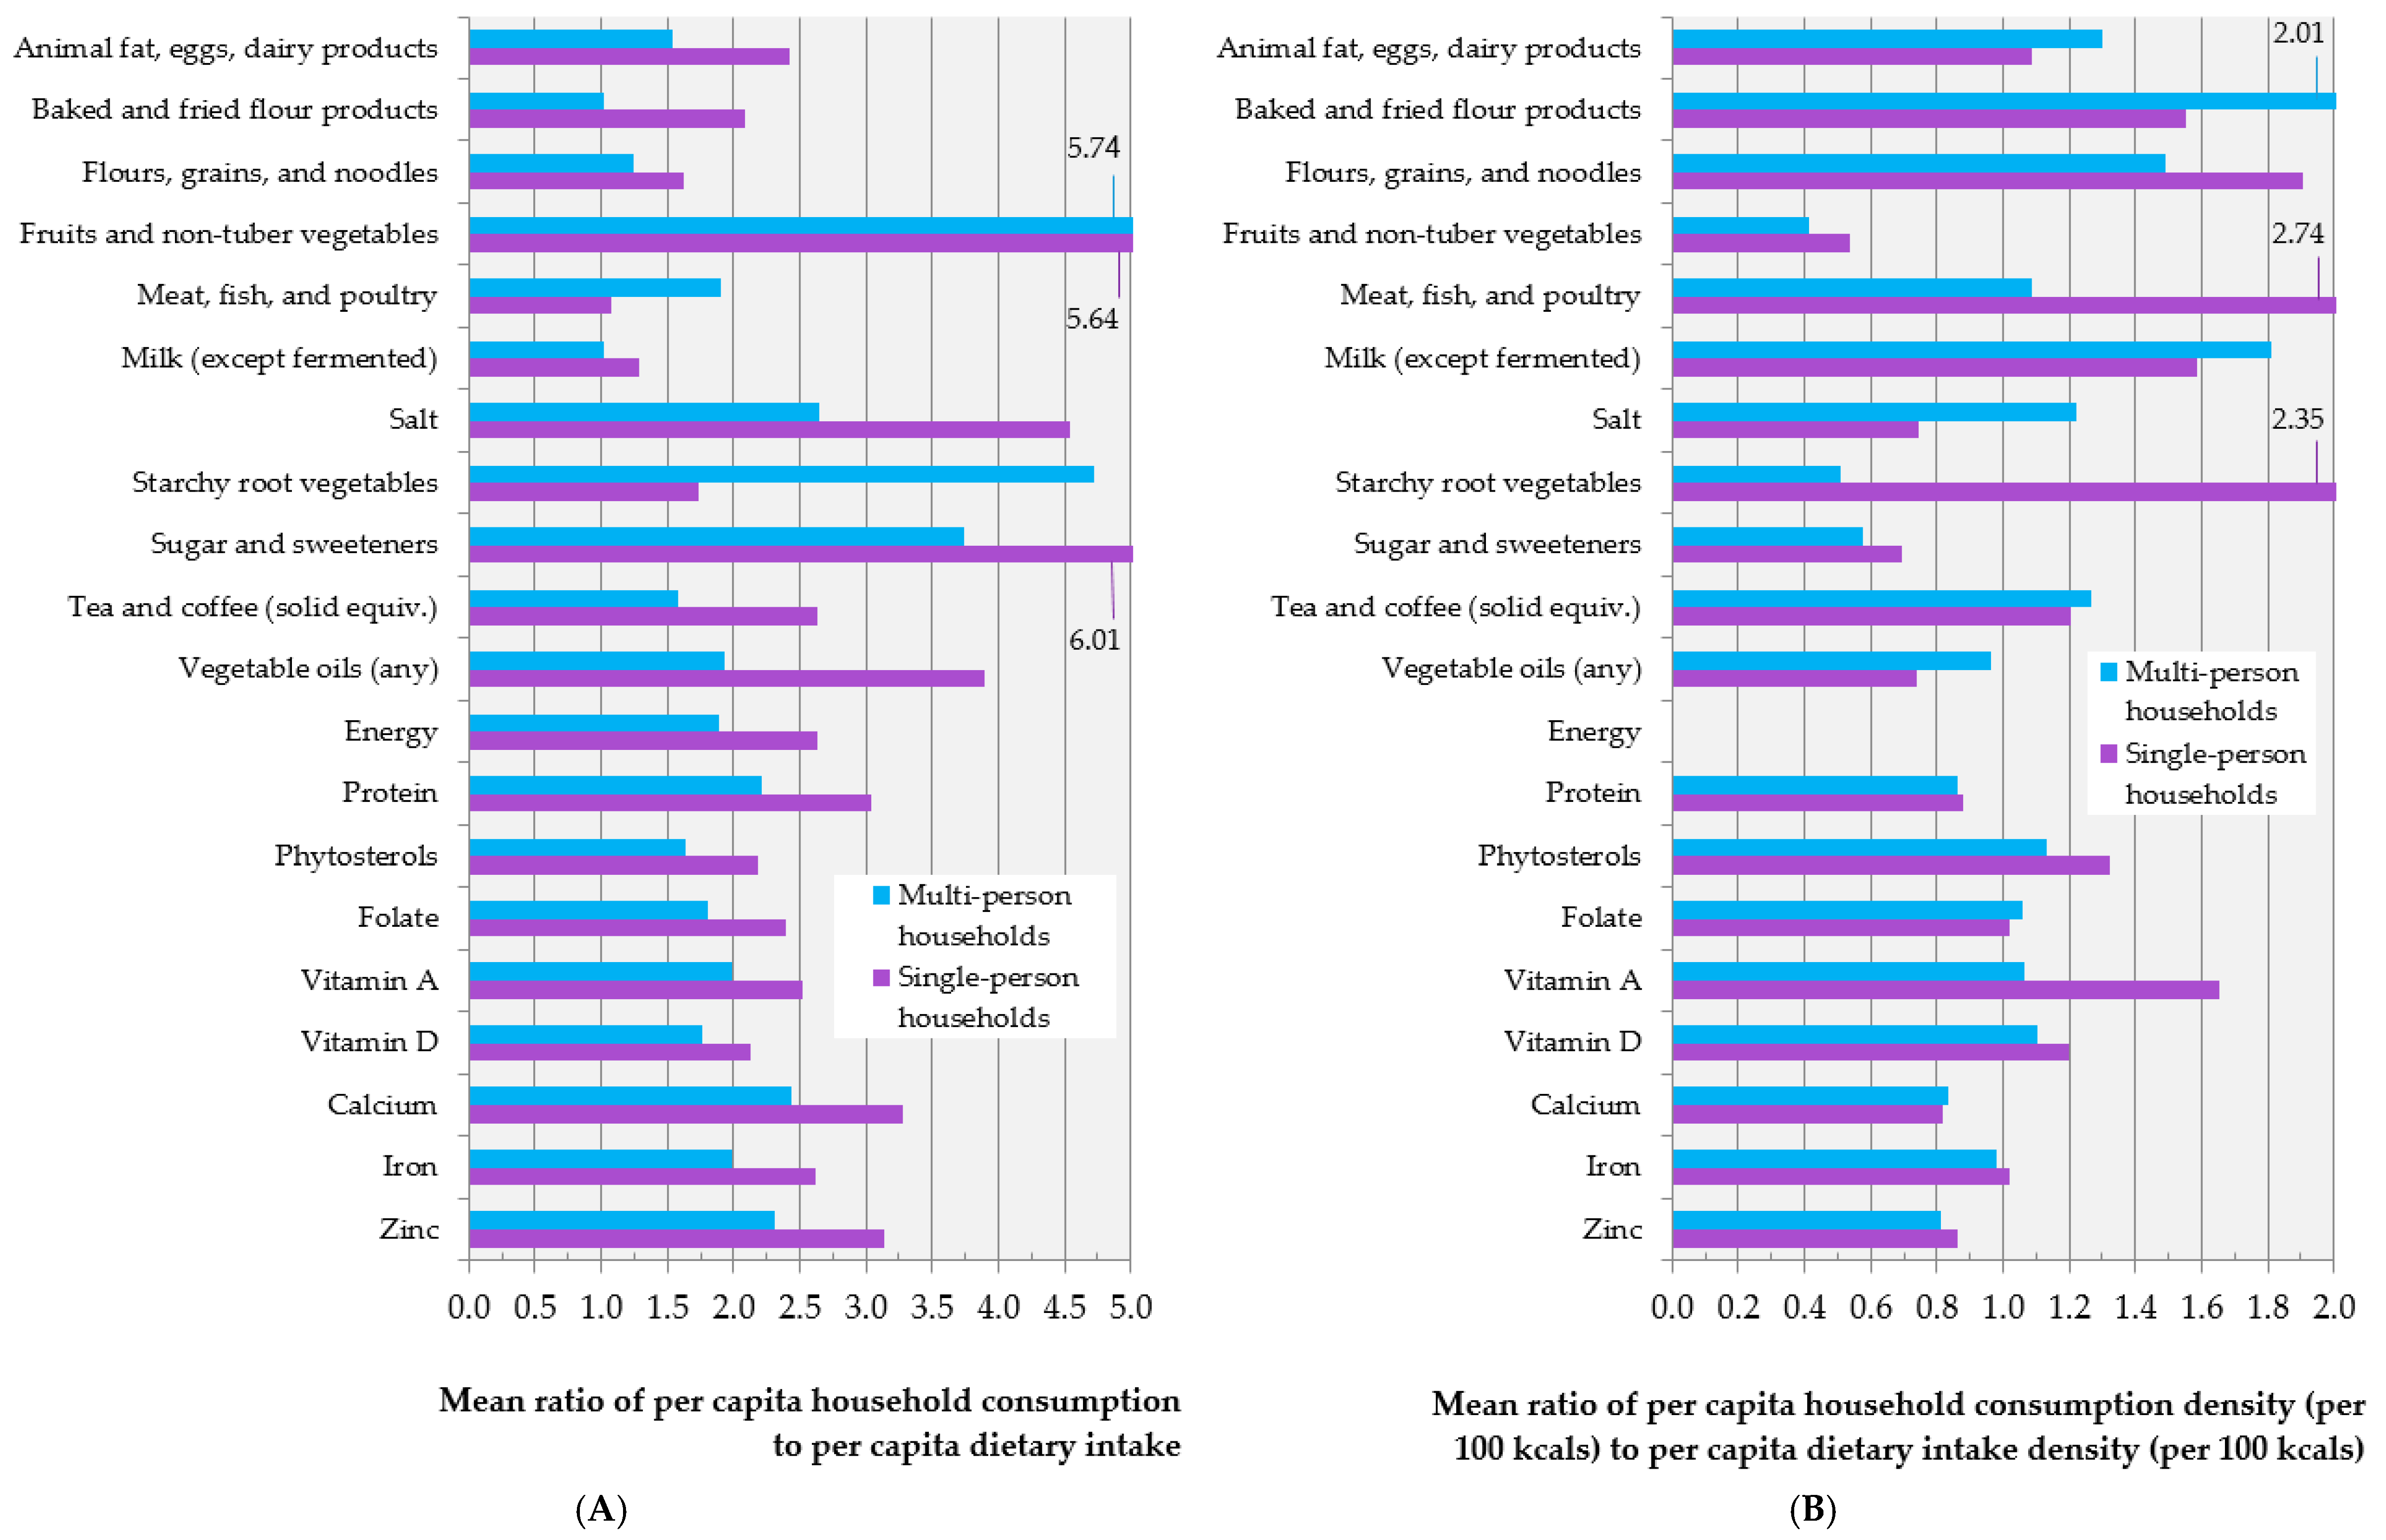
3.2. Aim 1: Direct Comparison between Per-Capita Household Consumption and Per-Capita Dietary Measurements from the Same Households
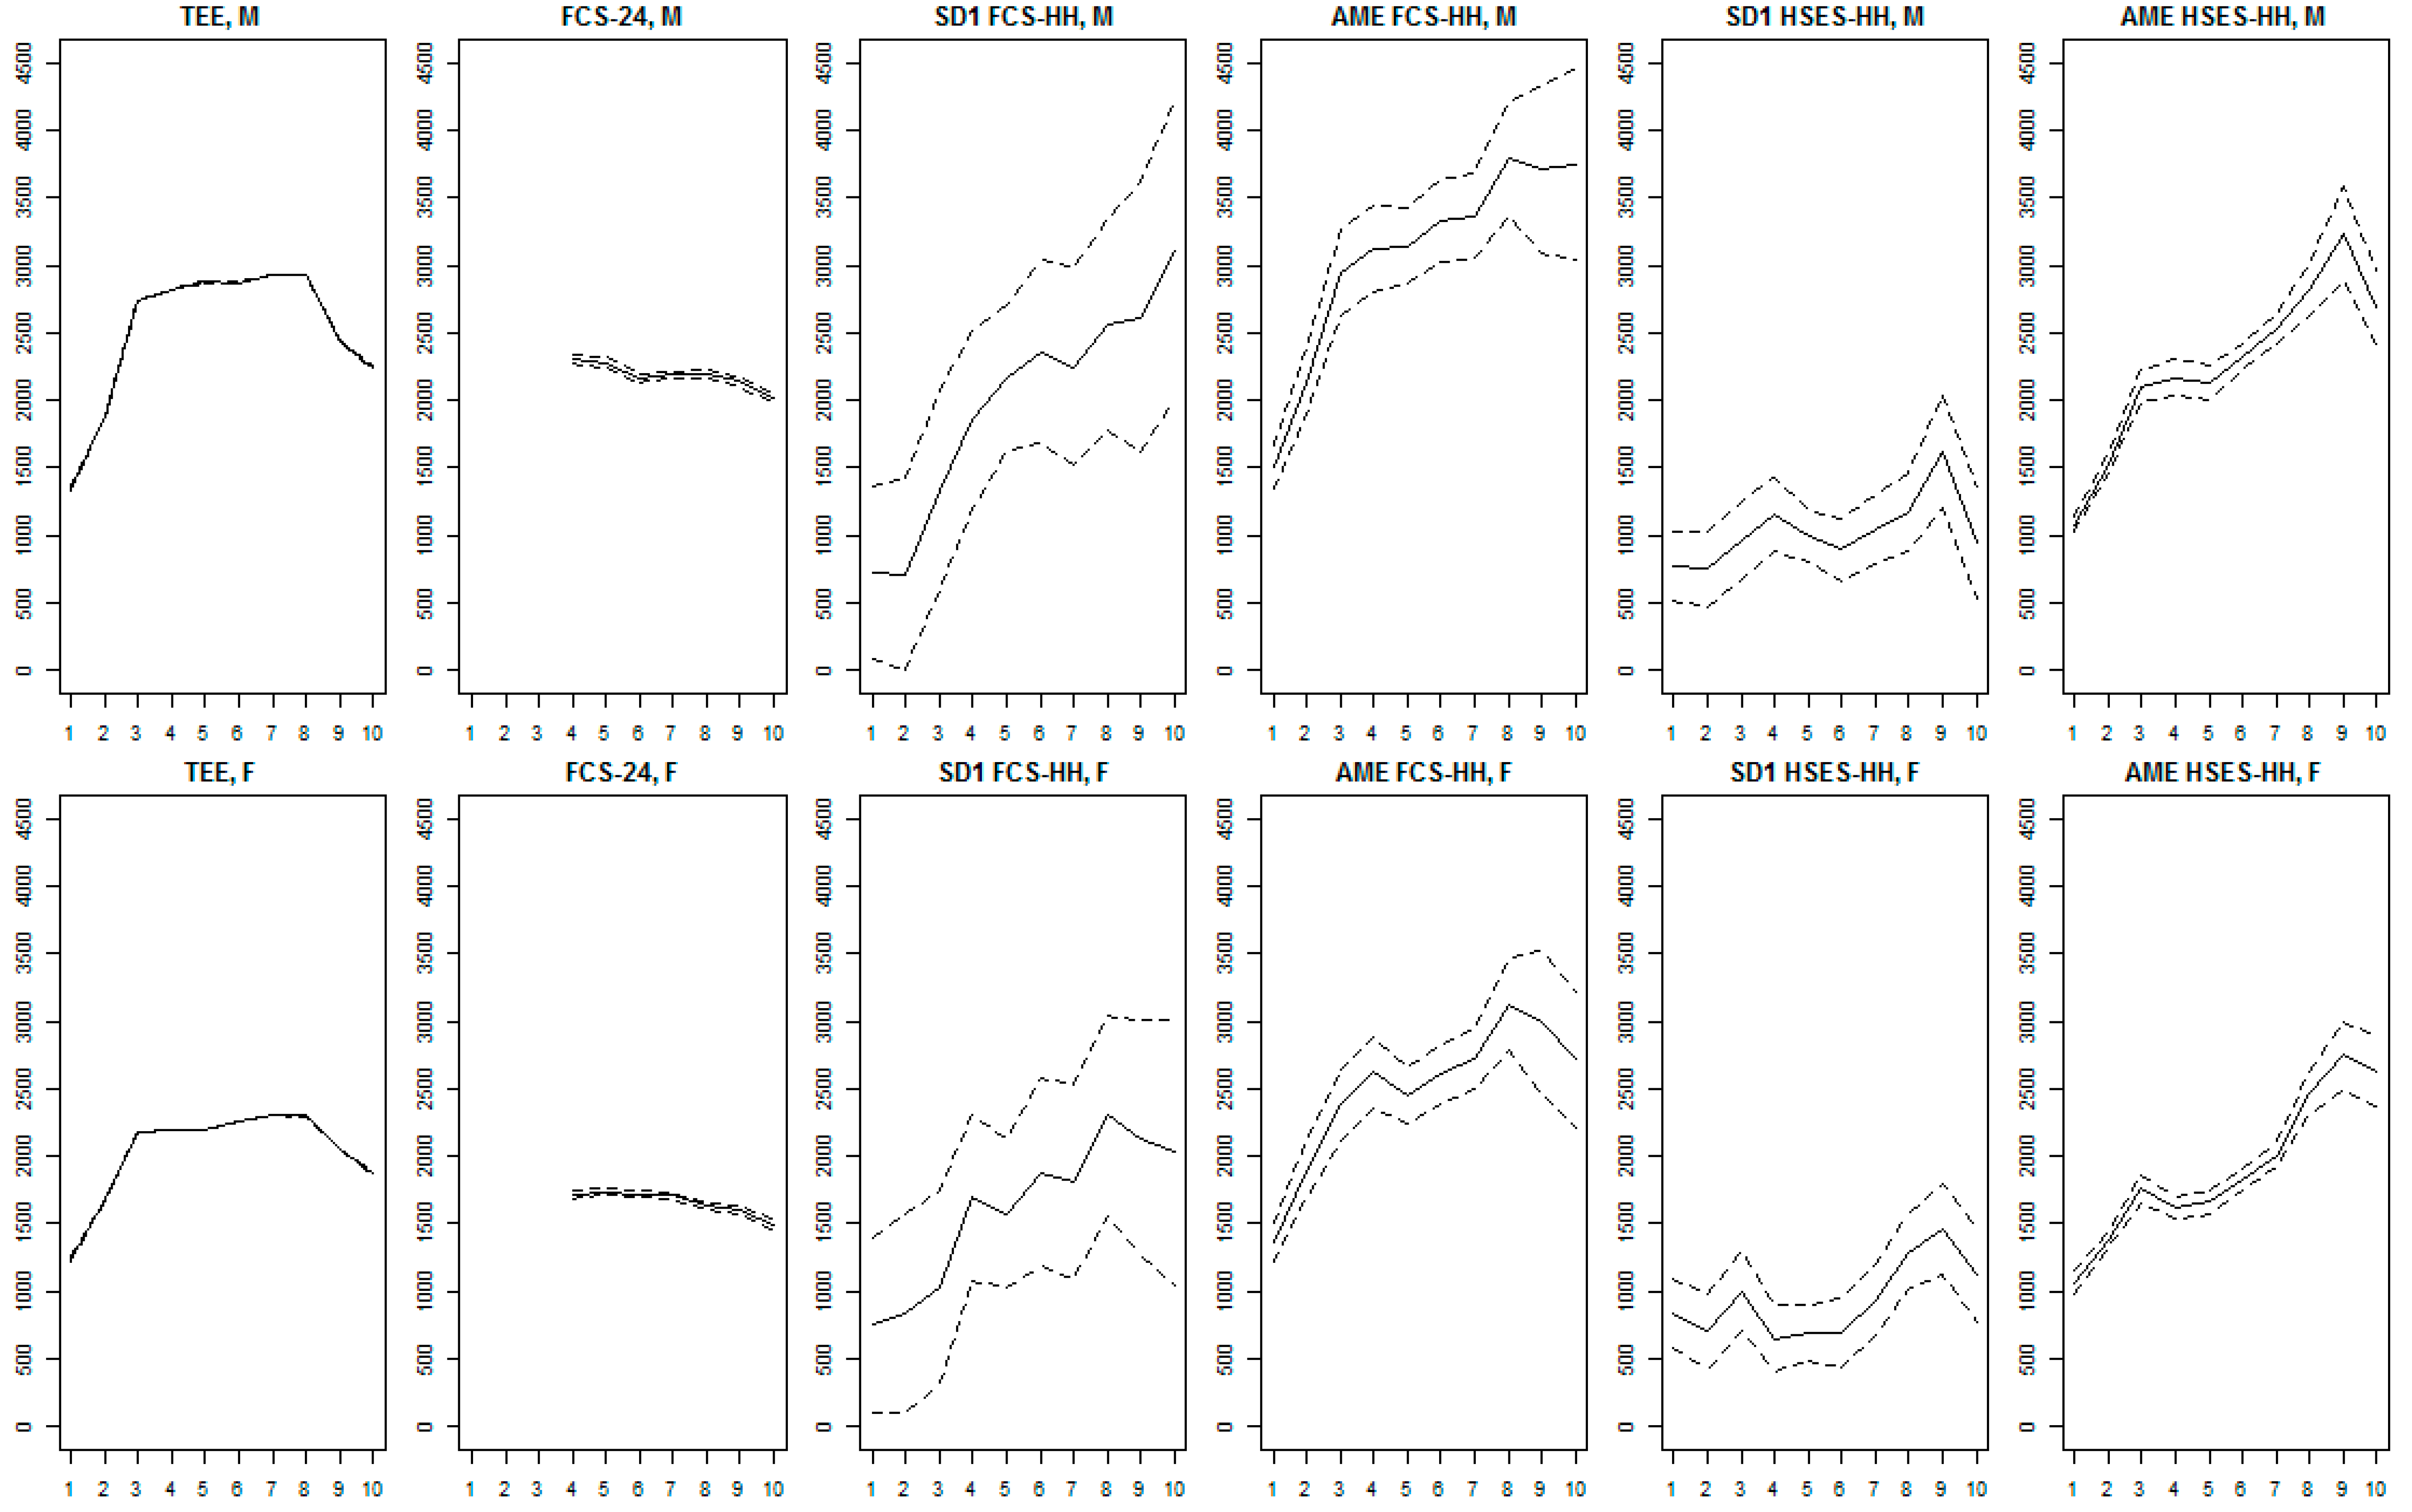
3.3. Aims 2 and 3: Comparison between Disaggregated Household Consumption Estimates and Individual Dietary Intake Measurements
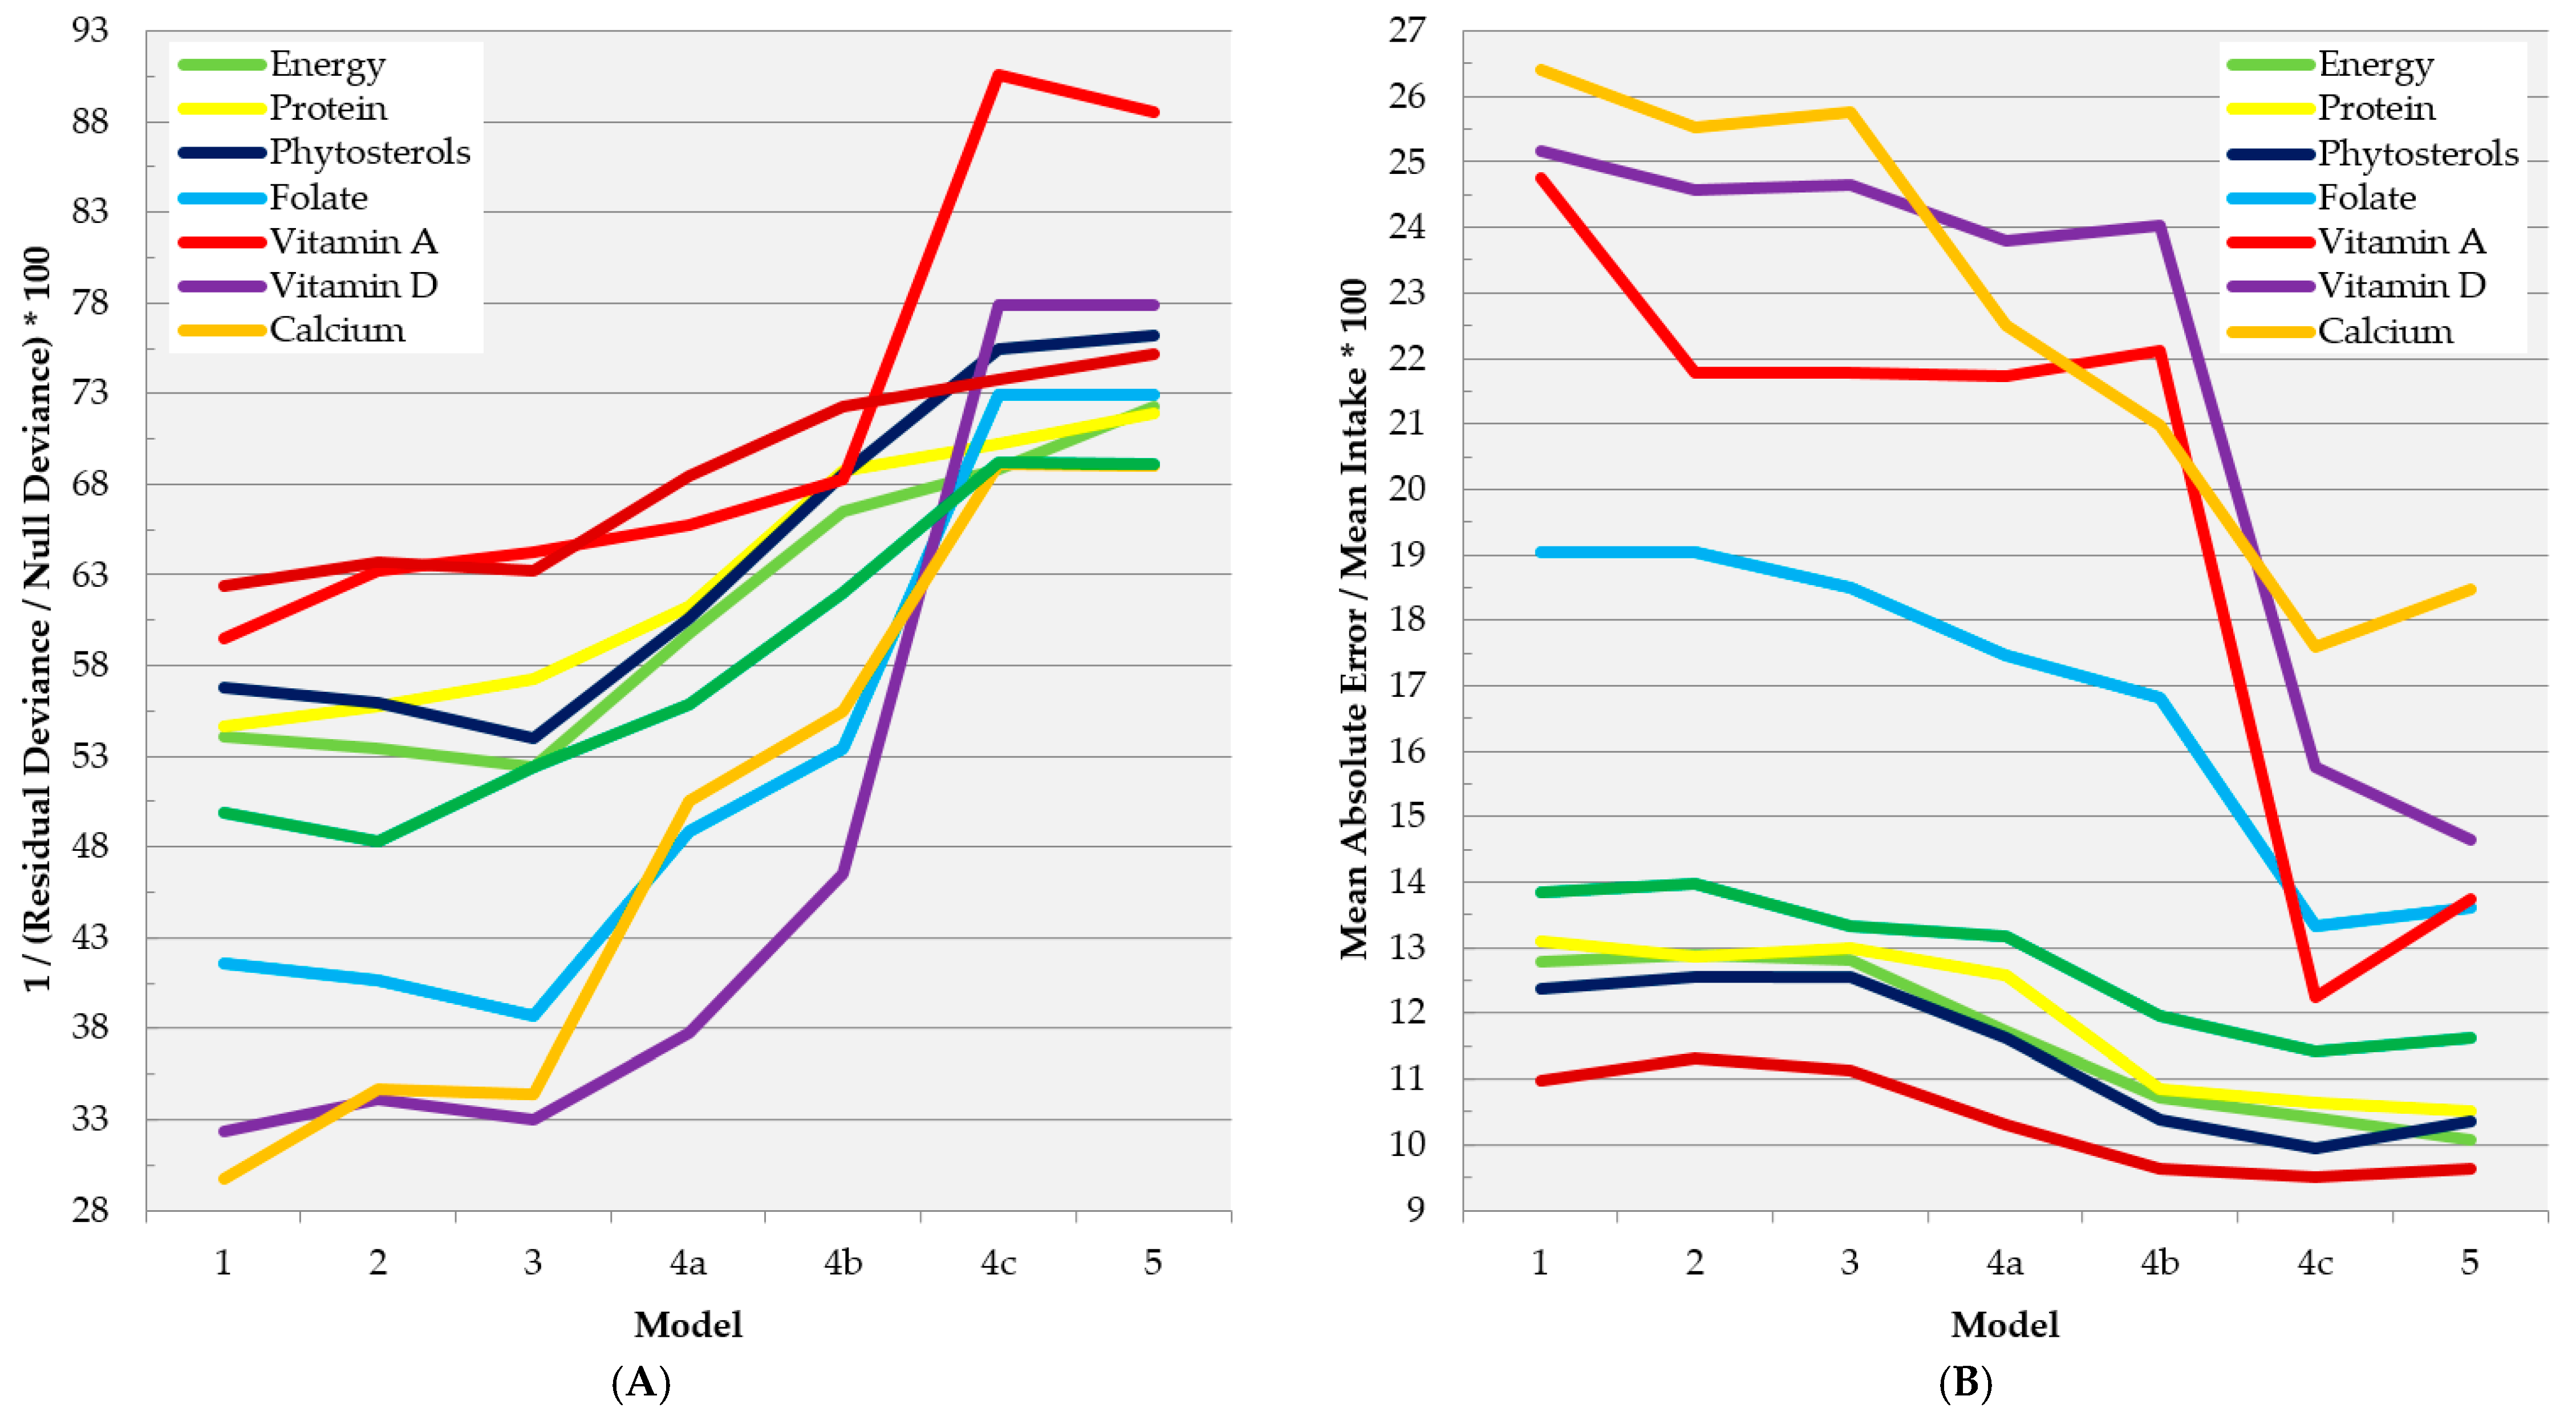
3.4. Aim 4: Direct Prediction of Dietary Nutrient Intake by Individuals
4. Discussion
4.1. Aim 1: Direct Comparison between Per-Capita Household Consumption and Per-Capita Dietary Measurements from the Same Households
4.2. Aims 2 and 3: Comparison between Disaggregated Household Consumption Estimates and Individual Dietary Intake Measurements
4.3. Aim 4: Direct Prediction of Dietary Nutrient Intake by Individuals
4.4. Strengths and Limitations
5. Conclusions
Supplementary Materials
Author Contributions
Acknowledgments
Conflicts of Interest
Appendix A. Details of Multiple Pass 24-h Recall
Appendix B. Creation of Food Groups, Age Groups, and Other Derived Variables
Appendix C. Derivation and Application of Survey Weights
Appendix D. Adjustment of Household Food Consumption Measurements
Appendix E. Calculation of Dietary Nutrient Intake and Total Household Nutrient Consumption
Appendix F. Adjustment of Dietary Nutrient Intakes for Within-Person Variance
Appendix G. Equations for Describing the Statistical and AME Disaggregation Methods
Appendix G.1. Statistical Method
- HCi = total household consumption of a food group or nutrient.
- Xij = the number of persons in the j-th age-sex group within the i-th household (j = 1, …, 20).
- Zi = a vector of covariates (education, family composition, locality, outside food consumption, caloric contribution of impermanent members).
- l = 1012 or 9424 households in the FCS-HH and HSES-HH, respectively.
Appendix G2. AME Method
References
- Neufeld, L.M.; Tolentino, L. Nutritional surveillance: Developing countries. In Encyclopedia of Human Nutrition, 3rd ed.; Caballero, B., Allen, L., Prentice, A., Eds.; Elsevier: Oxford, UK, 2013; pp. 289–302. [Google Scholar]
- Harris, E.W. Nutritional surveillance: Developed countries. In Encyclopedia of Human Nutrition, 3rd ed.; Caballero, B., Allen, L., Prentice, A., Eds.; Elsevier: Oxford, UK, 2013; pp. 278–288. [Google Scholar]
- Ferro-Luzzi, A. Individual food intake survey methods. In Measurement and Assessment of Food Deprivation and Undernutrition; Food and Agriculture Organization of the United Nations: Rome, Italy, 2003; pp. 101–106. [Google Scholar]
- Coates, J.C.; Colaiezzi, B.A.; Bell, W.; Charrondiere, U.R.; Leclercq, C. Overcoming Dietary Assessment Challenges in Low-Income Countries: Technological Solutions Proposed by the International Dietary Data Expansion (INDDEX) Project. Nutrients 2017, 9, 289. [Google Scholar] [CrossRef] [PubMed]
- Swindale, A.; Ohri-Vachaspati, P. Measuring Household Food Consumption: A Technical Guide; Food and Nutrition Technical Assistance (FANTA) Project, Academy for Educational Development (AED): Washington, DC, USA, 2005. [Google Scholar]
- Kennedy, G.; Ballard, T.; Dop, M. Guidelines for Measuring Household and Individual Dietary Diversity; Food and Agriculture Organization of the United Nations: Rome, Italy, 2011. [Google Scholar]
- Fiedler, J.L. Towards overcoming the food consumption information gap: Strengthening household consumption and expenditures surveys for food and nutrition policymaking. Glob. Food Secur. 2013, 2, 56–63. [Google Scholar] [CrossRef]
- Fiedler, J.L.; Martin-Prével, Y.; Moursi, M. Relative costs of 24-hour recall and Household Consumption and Expenditures Surveys for nutrition analysis. Food Nutr. Bull. 2013, 34, 318–330. [Google Scholar] [CrossRef] [PubMed]
- Gibson, R.S.; Cavalli-Sforza, T. Using reference nutrient density goals with food balance sheet data to identify likely micronutrient deficits for fortification planning in countries in the Western Pacific region. Food Nutr. Bull. 2012, 33, S214–S220. [Google Scholar] [PubMed]
- Smith, L.C.; Dupriez, O.; Troubat, N. Assessment of the Reliability and Relevance of the Food Data Collected in National Household Consumption and Expenditure Surveys; IHSN Working Paper No. 008; International Household Survey Network: Washington, DC, USA; 2014. [Google Scholar]
- Coates, J.; Colaiezzi, B.; Fiedler, J.L.; Wirth, J.; Lividini, K.; Rogers, B. Applying Dietary Assessment Methods for Food Fortification and Other Nutrition Programs; Global Alliance for Improved Nutrition (GAIN): Geneva, Switzerland, 2012. [Google Scholar]
- Sibrian, R. (Ed.) Deriving food Security Information from National Household Budget Surveys: Experiences Achievements, Challenges; Food and Agriculture Organization of the United Nations: Rome, Italy, 2008. [Google Scholar]
- Fiedler, J.L. Strengthening Household Income and Expenditure Surveys as a Tool for Designing and Assessing Food Fortification Programs; IHSN Working Paper 001; International Household Survey Network: Washington DC, USA; 2009. [Google Scholar]
- Dary, O.; Imhoff-Kunsch, B. Guide to Estimating Per-Capita Consumption of Staple Foods Using Household Income and Expenditure Survey (HIES) Data; ECSA/A2Z Monitoring and Evaluation Workshop: Kampala, Uganda, 2010. [Google Scholar]
- Weisell, R.; Dop, M.C. The adult male equivalent concept and its application to Household Consumption and Expenditures Surveys (HSES). Food Nutr. Bull. 2012, 33, S157–S162. [Google Scholar] [CrossRef] [PubMed]
- Berti, P.R. Intrahousehold distribution of food: A review of the literature and discussion of the implications for food fortification programs. Food Nutr. Bull. 2012, 33, S163–S169. [Google Scholar] [CrossRef] [PubMed]
- Engle, R.F.; Granger, C.W.J.; Rice, J.; Weiss, A. Semiparametric estimates of the relation between weather and electricity sales. J. Am. Stat. Assoc. 1986, 81, 310–320. [Google Scholar] [CrossRef]
- Chesher, A. Diet revealed?: Semiparametric estimation of nutrient intake–age relationships. J. R. Stat. Soc. Ser. B 1997, 160, 389–428. [Google Scholar] [CrossRef]
- Mongolian Center for Improved Nutrition. Food Consumption Survey 2013–2014; Mongolian University of Science and Technology: Ulaanbaatar, Mongolia, 2016. [Google Scholar]
- National Statistics Office of Mongolia. Household Socio-Economic Survey 2014; National Statistics Office of Mongolia: Ulaanbaatar, Mongolia, 2014. [Google Scholar]
- Troubat, N.; Grünberger, K. Impact of survey design in the estimation of habitual food consumption: A study based on urban households of Mongolia. Food Policy 2017, 72, 132–145. [Google Scholar] [CrossRef]
- Bromage, S.; Chung, H.Y.; Bonville, H.; Sprenger, J.C.; Lander, R.; Ganmaa, D. Trained Cohorts of University Students are a Useful Resource for Conducting Dietary Surveys in Mongolia. Food Nutr. Bull. 2017, 38, 267–272. [Google Scholar] [CrossRef] [PubMed]
- Mulligan, A.A.; Luben, R.N.; Bhaniani, A.; Parry-Smith, D.J.; O’Connor, L.; Khawaja, A.P.; Forouhi, N.G.; Khaw, K.T.; EPIC-Norfolk FFQ Study. A new tool for converting food frequency questionnaire data into nutrient and food group values: FETA research methods and availability. BMJ Open 2014, 27, e004503. [Google Scholar] [CrossRef] [PubMed]
- Jørgensen, B. Theory of Dispersion Models; Chapman and Hall: London, UK, 1997. [Google Scholar]
- Dorjdagva, J. Explaining differences in education-related inequalities in health between urban and rural areas in Mongolia. Int. J. Equity Health 2015, 14, 154. [Google Scholar] [CrossRef] [PubMed]
- Wood, S.N. Stable and efficient multiple smoothing parameter estimation for generalized additive models. J. Am. Stat. Assoc. 2004, 99, 673–686. [Google Scholar] [CrossRef]
- Chesher, A. Individual demands from household aggregates: Time and age variation in the composition of diet. J. Appl. Econom. 1998, 13, 505–524. [Google Scholar] [CrossRef]
- Willett, W.C. Implications of Total Energy Intake for Epidemiologic Analyses. In Nutritional Epidemiology, 3rd ed.; Willett, W.C., Ed.; Oxford University Press: New York, NY, USA, 2013; Chapter 11. [Google Scholar]
- Friedman, F.; Hastie, T.; Tibshirani, R. Regularization Paths for Generalized Linear Models via Coordinate Descent. J. Stat. Softw. 2010, 33, 1–22. [Google Scholar] [CrossRef] [PubMed]
- Trichopoulou, A.; Lagiou, P. (Eds.) Methodology for the Exploitation of HBS and Results on Food Availability in five European Countries; European Commission: Luxembourg, 1997. [Google Scholar]
- Zezzaa, A.; Carlettoa, C.; Fiedler, J.; Gennarib, P.; Jolliffea, D. Food counts. Measuring food consumption and expenditures in household consumption and expenditure surveys (HCES). Introduction to the special issue. Food Policy 2017, 72, 1–6. [Google Scholar] [CrossRef]
- Friel, S.; Nelson, M.; McCormack, K.; Kelleher, C.; Thriskos, P. Methodological issues using household budget survey expenditure data for individual food availability estimation: Irish experience in the DAFNE pan-European project. Public Health Nutr. 2001, 4, 1143–1147. [Google Scholar] [PubMed]
- Naska, A.; Paterakis, S.; Eeckman, H.; Remaut, A.M.; Trygg, K. Methodology for rendering household budget and individual nutrition surveys comparable, at the level of the dietary information collected. Public Health Nutr. 2001, 4, 1153–1158. [Google Scholar] [PubMed]
- Becker, W. Comparability of household and individual food consumption data—Evidence from Sweden. Public Health Nutr. 2001, 4, 1177–1182. [Google Scholar] [PubMed]
- Sekula, W.; Nelson, M.; Figurska, K.; Oltarzewski, M.; Weisell, R.; Szponar, L. Comparison between household budget survey and 24-hour recall data in a nationally representative sample of Polish households. Public Health Nutr. 2005, 8, 430–439. [Google Scholar] [CrossRef] [PubMed]
- Friedman, J.; Beegle, K.; De Weerdt, J.; Gibson, J. Decomposing response error in food consumption measurement: Implications for survey design from a randomized survey experiment in Tanzania. Food Policy 2017, 72, 94–111. [Google Scholar] [CrossRef]
- Willett, W.C. Food Frequency Methods. In Nutritional Epidemiology, 3rd ed.; Willett, W.C., Ed.; Oxford University Press: New York, NY, USA, 2013; Chapter 5. [Google Scholar]
- Willett, W.C. 24-Hour Recall and Diet Record Methods. In Nutritional Epidemiology, 3rd ed.; Willett, W.C., Ed.; Oxford University Press: New York, NY, USA, 2013; Chapter 4. [Google Scholar]
- Conforti, P.; Grünberger, K.; Troubat, N. The impact of survey characteristics on the measurement of food consumption. Food Policy 2017, 72, 43–52. [Google Scholar] [CrossRef]
- Willett, W.C. Reproducibility and Validity of Food Frequency Questionnaires. In Nutritional Epidemiology, 3rd ed.; Willett, W.C., Ed.; Oxford University Press: New York, NY, USA, 2013; Chapter 6. [Google Scholar]
- Illner, A.K.; Freisling, H.; Boeing, H.; Huybrechts, I.; Crispim, S.P.; Slimani, N. Review and evaluation of innovative technologies for measuring diet in nutritional epidemiology. Int. J. Epidemiol. 2012, 41, 1187–1203. [Google Scholar] [CrossRef] [PubMed]
- Caeyers, B.; Chalmers, N.; De Weerdt, J. A Comparison of CAPI and PAPI through a Randomized Field Experiment; Oxford University: Oxford, UK, 2009. [Google Scholar]
- Brinkerhoff, K.M.; Brewster, P.J.; Clark, E.B.; Jordan, K.C.; Cummins, M.R.; Hurdle, J.F. Linking supermarket sales data to nutritional information: An informatics feasibility study. AMIA Annu. Symp. Proc. 2011, 2011, 598–606. [Google Scholar] [PubMed]
- Earnst and Young. Issue MTIN2015002: Mongolia Adopts New VAT Law. 2015. Available online: http://www.ey.com/Publication/vwLUAssets/EY-mongolia-adopts-new-vat-law/$FILE/EY-mongolia-adopts-new-vat-law.pdf (accessed on 17 May 2018).
- KPMG. Investment in Mongolia. 2016. Available online: https://assets.kpmg.com/content/dam/kpmg/mn/pdf/mn-investment-in-mongolia-2016-new.pdf (accessed on 17 May 2018).
- Dary, O.; Jariseta, Z.R. Validation of dietary applications of Household Consumption and Expenditures Surveys against a 24-hour recall method in Uganda. Food Nutr. Bull. 2012, 33, S190–S198. [Google Scholar] [CrossRef] [PubMed]
- Jariseta, Z.R.; Dary, O.; Fiedler, J.L.; Franklin, N. Comparison of estimates of the nutrient density of the diet of women and children in Uganda by Household Consumption and Expenditures Surveys (HSES) and 24-hour recall. Food Nutr. Bull. 2012, 33, S199–S207. [Google Scholar] [CrossRef] [PubMed]
- Sununtnasuk, C.; Fiedler, J.L. Can household-based food consumption surveys be used to make inferences about nutrient intakes and inadequacies? A Bangladesh case study. Food Policy 2017, 72, 121–131. [Google Scholar] [CrossRef]
- Food and Agriculture Organization of the United Nations. Human energy requirements: Report of a joint FAO/WHO/UNU Expert Consultation. Food Nutr. Bull. 2005, 26, 166. [Google Scholar]
- Engle-Stone, R.; Brown, K.H. Comparison of a Household Consumption and Expenditures Survey with Nationally Representative Food Frequency Questionnaire and 24-hour Dietary Recall Data for Assessing Consumption of Fortifiable Foods by Women and Young Children in Cameroon. Food Nutr. Bull. 2015, 36, 211–230. [Google Scholar] [CrossRef] [PubMed]
- Coates, J.; Rogersa, B.L.; Blaub, A.; Lauera, J.; Robac, A. Filling a dietary data gap? Validation of the adult male equivalent method of estimating individual nutrient intakes from household-level data in Ethiopia and Bangladesh. Food Policy 2017, 72, 27–42. [Google Scholar] [CrossRef]
- Willett, W.C. Nature of Variation in Diet. In Nutritional Epidemiology, 3rd ed.; Willett, W.C., Ed.; Oxford University Press: New York, NY, USA, 2013; Chapter 3. [Google Scholar]
- Vasdekis, V.G.; Trichopoulou, A. Nonparametric estimation of individual food availability along with bootstrap confidence intervals in household budget surveys. Stat. Probab. Lett. 2000, 46, 337–345. [Google Scholar] [CrossRef]
- Miquel, R.; Laisney, F. Consumption and nutrition: Age–intake profiles for Czechoslovakia 1989-92. Econ. Transit. 2001, 9, 115–151. [Google Scholar] [CrossRef]
- Vasdekis, V.G.; Stylianou, S.; Naska, A. Estimation of age-and gender-specific food availability from household budget survey data. Public Health Nutr. 2001, 4, 1149–1151. [Google Scholar]
- Naska, A.; Vasdekis, V.G.; Trichopoulou, A. A preliminary assessment of the use of household budget survey data for the prediction of individual food consumption. Public Health Nutr. 2001, 4, 1159–1165. [Google Scholar] [PubMed]
- De Agostini, P. The Relationship between Food Consumption and Socio-Economic Status: Evidence among British Youths; University of Essex: Colchester, UK, 2005. [Google Scholar]
- Allais, O.; Tressou, J. Using decomposed household food acquisitions as inputs of a kinetic dietary exposure model. Stat. Model. 2009, 9, 27–50. [Google Scholar] [CrossRef]
- Bonnet, C.; Dubois, P.; Orozco, V. Household food consumption, individual caloric intake and obesity in France. Empir. Econ. 2014, 46, 1143–1166. [Google Scholar] [CrossRef]
- Sonomtseren, M.; Baatar, E. (Eds.) 2010 Population and Housing Census of Mongolia: National Report; National Statistical Office of Mongolia: Ulaanbaatar, Mongolia, 2011. [Google Scholar]
- Rifas-Shiman, S.L.; Willett, W.C.; Lobb, R.; Kotch, J.; Dart, C.; Gillman, M.W. PrimeScreen, a brief dietary screening tool: Reproducibility and comparability with both a longer food frequency questionnaire and biomarkers. Public Health Nutr. 2001, 4, 249–254. [Google Scholar] [CrossRef] [PubMed]
- Fuwa, N. Intrahousehold Analysis Using Household Consumption Data: Would the Potential Benefit of Collecting Individual-Level Consumption Data Justify Its Cost? MPRA Paper No. 23689; MPRA: Munich, Germany, 2010. [Google Scholar]
- Schofield, W.N. Predicting basal metabolic rate, new standards and review of previous work. Hum. Nutr Clin. Nutr. 1985, 39 (Suppl. 1), 5–41. [Google Scholar] [PubMed]
- Food and Agriculture Organization of the United Nations. FAO/INFOODS Density Database Version 2.0; Food and Agriculture Organization of the United Nations: Rome, Italy, 2012. [Google Scholar]
- Haytowitz, D.B. USDA National Nutrient Database for Standard Reference, Release 24; U.S. Department of Agriculture: Washington, DC, USA, 2011.
- Ministry of Agriculture, Fisheries and Food and National Statistics. National Food Survey 1999; Annual Report on Food Expenditure, Consumption and Nutrient Intakes; The Stationery Office: London, UK, 1999; pp. 11–125. [Google Scholar]
- Lander, R.; Enkhjargal, T.S.; Batjargal, J.; Bolormaa, N.; Enkhmyagmar, D.; Tserendolgor, U.; Tungalag, S.; Bailey, K.; Gibson, R.S. Poor dietary quality of complementary foods is associated with multiple micronutrient deficiencies during early childhood in Mongolia. Public Health Nutr. 2010, 13, 1304–1313. [Google Scholar] [CrossRef] [PubMed]
- Food and Agriculture Organization of the United Nations. FAO/INFOODS e-Learning Course on Food Composition Data; Food and Agriculture Organization of the United Nations: Rome, Italy, 2013. [Google Scholar]
- Hartmann, B.M.; Bell, S.; Vásquez-Caicedo, A.L. Bundeslebensmittelschlüssel. II 3.1; Federal Research Centre for Nutrition and Food (BfEL): Karlsruhe, Germany, 2005. [Google Scholar]
- Nutrient Data Laboratory. USDA Table of Nutrient Retention Factors; United States Department of Agriculture Agricultural Research Service: Beltsville, MD, USA, 2007.
- Mathhews, R.H.; Garrison, Y.J. Food Yields Summarized by Different Stages of Preparation; Agriculture Handbook No. 102; United States Department of Agriculture Agricultural Research Service: Washington, DC, USA, 1975.
- Bognár, A. Tables on Weight Yield of Food and Retention Factors of Food Constituents for the Calculation of Nutrient Composition of Cooked Foods (Dishes); Bundesforschungsanstalt für Ernährung: Karlsruhe, Germany, 2002. [Google Scholar]
- Showell, B.A.; Williams, J.R.; Duvall, M.; Howe, J.C.; Patterson, K.Y.; Roseland, J.M.; Holden, J.M. USDA Table of Cooking Yields for Meat and Poultry; United States Department of Agriculture: Baltimore, MD, USA, 2012.
- Institute of Medicine (US) Subcommittee on Interpretation and Uses of Dietary Reference Intakes; Institute of Medicine (US) Standing Committee on the Scientific Evaluation of Dietary Reference Intakes (Eds.) DRI Dietary Reference Intakes: Applications in Dietary Planning; National Academies Press: Washington, DC, USA, 2000.
- Rosner, B.; Polk, B.F. Predictive values of routine blood pressure measurements in screening for hypertension. Am. J. Epidemiol. 1983, 117, 429–442. [Google Scholar] [CrossRef] [PubMed]


| Characteristic | FCS-HH | HSES-HH | |
|---|---|---|---|
| Household Characteristics | Households (n) | 1012 | 9424 |
| Location, n (%) | |||
| Ulaanbaatar | 472 (46.6) | 2332 (24.7) | |
| Provincial/county center | 168 (16.6) | 4937 (52.4) | |
| Rural | 372 (36.8) | 2155 (23.3) | |
| Household size, mean (SD) | 4.0 ± 1.7 | 3.3 ± 1.6 | |
| Family composition n (%) | |||
| 1 man | 40 (4.0) | 574 (6.1) | |
| 1 woman | 34 (3.4) | 662 (7.0) | |
| 2 or more adults | 326 (32.2) | 2922 (31.0) | |
| Adult(s) and children | 612 (60.5) | 5235 (55.5) | |
| Children only | 0 (0.0) | 31 (0.3) | |
| Maximum education (years), n (%) | |||
| 0 to 4 | 32 (3.2) | 694 (7.4) | |
| 6 to 10 | 593 (58.6) | 4719 (50.1) | |
| 14+ | 387 (38.2) | 4011 (42.6) | |
| % TEE from impermanent members, mean (SD) | 1.81 ± 3.28 | 2.5 ± 8.2 | |
| % food spending outside home, mean (SD) | 12.1 ± 12.3 | 9.1 ± 24.6 | |
| Household TEI/TEE, mean (SD) | 1.35 ± 0.65 | 1.09 ± 0.79 | |
| Individual Characteristics | Individuals (n) | 4070 | 34,946 |
| Age (years), mean (SD) | 28.7 ± 19.6 | 28.4 ± 19.1 | |
| Sex, n (%) | |||
| Female | 2140 (52.6) | 17,873 (51.1) | |
| Male | 1930 (47.4) | 17,073 (48.9) | |
| Married or living with partner, n (%) | 1648 (40.5) | 17,667 (50.6) | |
| TEI/TEE, mean (SD) | 0.77 ± 0.14 | - |
| Validation Metric: | Mean Bias in Intake | Mean Bias in Intake Density (Per 100 kcal) | |||||||||||||
|---|---|---|---|---|---|---|---|---|---|---|---|---|---|---|---|
| Household Survey: | FCS-HH (n = 1012) | HSES-HH (n = 9424) | FCS-HH (n = 1012) | HSES-HH (n = 9424) | |||||||||||
| Disaggregation Method: | Intake | SD1 | SD2 | AME | SD1 | SD2 | AME | Density | SD1 | SD2 | AME | SD1 | SD2 | AME | |
| Food Groups | Animal fat, eggs, and dairy products (g) | 92.1 | −6.3 | 109.7 | 128.6 | −61.9 | −13.2 | 16.2 | 4.90 | −0.72 | 1.19 | 5.44 | −1.32 | −1.16 | 3.41 |
| Baked and fried flour products (g) | 115.0 | −16.2 | 64.1 | 63.6 | −75.0 | 0.3 | 19.6 | 6.06 | −1.23 | −0.54 | 2.22 | −1.62 | −0.57 | 4.09 | |
| Flours, grains, and noodles (g) | 231.9 | −29.7 | 49.0 | 64.1 | −146.8 | −48.6 | −38.8 | 12.06 | −1.75 | −2.99 | 1.17 | −2.96 | −3.29 | −0.17 | |
| Fruits and non-tuber vegetables (g) | 31.6 | 9.1 | 101.5 | 90.0 | −7.7 | 42.7 | 57.2 | 1.77 | 0.27 | 2.57 | 5.09 | 0.63 | 1.94 | 5.17 | |
| Meat, fish, and poultry (g) | 114.4 | 2.7 | 126.7 | 89.0 | −47.6 | 50.7 | 53.4 | 5.88 | −0.14 | 1.67 | 2.77 | 0.99 | 1.87 | 3.97 | |
| Milk (except fermented) (g) | 77.9 | 36.3 | 232.6 | 189.6 | 0.4 | 133.2 | 148.7 | 4.18 | 1.38 | 5.33 | 8.21 | 3.94 | 5.23 | 9.69 | |
| Salt (g) | 1.8 | 2.8 | 6.7 | 6.0 | −0.3 | 3.2 | 3.5 | 0.10 | 0.14 | 0.17 | 0.38 | 0.07 | 0.14 | 0.34 | |
| Starchy root vegetables (g) | 30.7 | 35.4 | 75.7 | 82.4 | −0.8 | 28.3 | 42.9 | 1.69 | 1.61 | 1.70 | 5.02 | 1.44 | 1.15 | 4.19 | |
| Sugar and sweeteners (g) | 3.6 | 7.6 | 14.1 | 16.9 | 4.3 | 13.7 | 14.8 | 0.20 | 0.35 | 0.35 | 0.79 | 0.63 | 0.61 | 1.18 | |
| Tea or coffee (solid equivalent) (g) | 3.6 | −1.0 | 1.8 | 1.8 | −1.1 | 2.4 | 2.2 | 0.20 | −0.07 | −0.02 | 0.13 | 0.03 | 0.08 | 0.31 | |
| Vegetable oils (any) (g) | 6.6 | 1.3 | 8.7 | 8.9 | −2.5 | 2.7 | 5.4 | 0.33 | 0.05 | 0.14 | 0.43 | 0.09 | 0.10 | 0.69 | |
| Macronutrients | Energy (kcal) | 1864 | 163 | 1335 | 1088 | −918 | 267 | 302 | N/A | N/A | N/A | N/A | N/A | N/A | N/A |
| Carbohydrates (g) | 241.10 | 19.13 | 132.57 | 123.41 | −127.89 | 4.79 | 16.54 | 12.920 | 0.052 | −1.166 | 0.890 | −0.783 | −1.295 | 0.669 | |
| Protein (g) | 70.09 | 7.54 | 64.14 | 49.69 | −32.71 | 18.11 | 18.35 | 3.777 | 0.032 | 0.377 | 0.319 | 0.192 | 0.362 | 0.637 | |
| Total fat (g) | 66.38 | 3.62 | 67.62 | 47.04 | −29.79 | 20.24 | 21.98 | 3.574 | −0.194 | 0.523 | 0.220 | 0.235 | 0.471 | 0.268 | |
| Alcohol (g) | 1.47 | −1.23 | −0.90 | −0.51 | −1.46 | −0.88 | −0.18 | 0.067 | −0.049 | −0.055 | 0.204 | −0.048 | −0.040 | 0.441 | |
| Water (g) | 572.27 | 96.92 | 704.75 | 558.11 | −208.99 | 335.68 | 325.36 | 31.081 | 1.629 | 8.337 | 11.702 | 6.622 | 11.052 | 18.846 | |
| Fiber (g) | 8.6 | 1.6 | 6.4 | 5.8 | −4.0 | 0.8 | 1.4 | 0.47 | 0.04 | 0.01 | 0.11 | 0.03 | −0.01 | 0.10 | |
| Phytosterols (mg) | 424 | 104 | 309 | 256 | −229 | −22 | −9 | 22.9 | 3.6 | 0.2 | 3.7 | −1.9 | −3.8 | 0.5 | |
| Vitamins | Thiamin (mg) | 0.784 | 0.164 | 0.723 | 0.563 | −0.318 | 0.228 | 0.278 | 0.0426 | 0.0043 | 0.0045 | 0.0073 | 0.0071 | 0.0054 | 0.0148 |
| Riboflavin (mg) | 1.220 | 0.184 | 1.225 | 0.990 | −0.486 | 0.463 | 0.484 | 0.0661 | 0.0033 | 0.0103 | 0.0127 | 0.0097 | 0.0119 | 0.0216 | |
| Niacin (mg) | 13.064 | 2.539 | 12.945 | 9.419 | −5.335 | 3.891 | 4.392 | 0.7093 | 0.0625 | 0.1066 | 0.1304 | 0.1044 | 0.0910 | 0.2470 | |
| Pantothenic acid (mg) | 3.111 | 0.668 | 3.099 | 2.383 | −1.238 | 1.218 | 1.146 | 0.1686 | 0.0176 | 0.0247 | 0.0240 | 0.0265 | 0.0336 | 0.0406 | |
| Vitamin B6 (mg) | 0.628 | 0.150 | 0.684 | 0.534 | −0.279 | 0.170 | 0.187 | 0.0342 | 0.0044 | 0.0071 | 0.0124 | 0.0022 | 0.0036 | 0.0119 | |
| Folate (µg) | 132 | 4 | 95 | 76 | −65 | 21 | 27 | 7.1 | −0.4 | 0.0 | 0.2 | 0.2 | 0.1 | 1.2 | |
| Vitamin B12 (µg) | 6.35 | −0.85 | 2.29 | 1.98 | −3.00 | 0.48 | 0.54 | 0.339 | −0.058 | −0.057 | 0.019 | −0.007 | −0.021 | 0.036 | |
| Vitamin C (mg) | 12.4 | 4.1 | 24.0 | 20.7 | −3.4 | 10.0 | 12.6 | 0.70 | 0.12 | 0.45 | 1.00 | 0.26 | 0.39 | 0.99 | |
| Vitamin A (µg) | 448 | −112 | 187 | 173 | −200 | −2 | 54 | 23.7 | −6.6 | −2.8 | 6.5 | 0.6 | −2.5 | 4.7 | |
| Vitamin D (IU) | 26 | 1 | 30 | 22 | −12 | 10 | 12 | 1.4 | −0.1 | 0.3 | 0.6 | 0.0 | 0.3 | 0.4 | |
| Vitamin E (mg) | 5.28 | 0.24 | 5.24 | 4.33 | −2.68 | 0.92 | 1.57 | 0.286 | −0.016 | 0.040 | 0.113 | −0.008 | 0.010 | 0.137 | |
| Minerals | Calcium (mg) | 432 | 100 | 544 | 466 | −151 | 255 | 288 | 23.6 | 2.4 | 6.4 | 9.2 | 5.8 | 8.1 | 13.6 |
| Copper (mg) | 0.986 | 0.097 | 0.600 | 0.483 | −0.447 | 0.100 | 0.119 | 0.0528 | 0.0019 | −0.0019 | 0.0065 | 0.0035 | −0.0010 | 0.0078 | |
| Iron (mg) | 10.03 | 1.07 | 7.47 | 5.84 | −4.73 | 1.53 | 1.92 | 0.541 | 0.009 | 0.007 | 0.044 | 0.027 | 0.006 | 0.102 | |
| Magnesium (mg) | 168 | 29 | 141 | 115 | −77 | 41 | 41 | 9.1 | 0.7 | 0.6 | 1.0 | 0.6 | 0.8 | 1.6 | |
| Manganese (mg) | 2.172 | 0.196 | 1.308 | 1.220 | −0.998 | 0.394 | 0.434 | 0.1171 | 0.0008 | −0.0075 | 0.0193 | 0.0073 | 0.0040 | 0.0347 | |
| Phosphorus (mg) | 907 | 93 | 835 | 660 | −446 | 200 | 211 | 48.9 | 0.4 | 5.1 | 3.5 | 0.4 | 2.8 | 5.8 | |
| Potassium (mg) | 1436 | 207 | 1637 | 1209 | −620 | 625 | 591 | 78.1 | 2.1 | 16.7 | 18.0 | 7.7 | 18.7 | 27.5 | |
| Zinc (mg) | 10.85 | 0.91 | 11.20 | 7.80 | −4.97 | 3.58 | 3.52 | 0.587 | −0.011 | 0.096 | 0.084 | 0.030 | 0.086 | 0.159 | |
| Validation Metric: | Nutrient Intake Coverage Probability | Nutrient Density Coverage Probability | |||||||
|---|---|---|---|---|---|---|---|---|---|
| Household Survey: | FCS-HH (n = 1012) | HSES-HH (n = 9294) | FCS-HH (n = 1012) | HSES-HH (n = 9294) | |||||
| Disaggregation Method: | SD1 | SD2 | AME | SD1 | SD2 | AME | AME | AME | |
| Macronutrients | Energy (kcal) | 88.5 | 13.2 | 3.0 | 10.4 | 37.5 | 13.8 | N/A | N/A |
| Carbohydrates (g) | 76.7 | 25.8 | 5.2 | 3.2 | 23.2 | 10.7 | 37.0 | 17.8 | |
| Protein (g) | 79.9 | 18.0 | 2.0 | 8.1 | 24.1 | 8.1 | 24.2 | 2.8 | |
| Total fat (g) | 79.1 | 26.4 | 5.3 | 33.1 | 46.4 | 16.1 | 27.9 | 8.6 | |
| Alcohol (g) | 45.4 | 26.4 | 27.5 | 37.8 | 32.2 | 7.4 | 1.6 | 0.1 | |
| Water (g) | 71.5 | 20.3 | 3.9 | 21.8 | 10.8 | 3.2 | 8.9 | 2.4 | |
| Fiber (g) | 76.3 | 12.4 | 2.0 | 6.8 | 32.6 | 11.4 | 13.4 | 6.0 | |
| Phytosterols (mg) | 72.5 | 18.9 | 2.7 | 3.4 | 23.2 | 16.3 | 22.0 | 29.3 | |
| Vitamins | Thiamin (mg) | 71.0 | 13.5 | 2.5 | 16.0 | 28.7 | 7.0 | 17.4 | 1.6 |
| Riboflavin (mg) | 79.5 | 23.4 | 2.7 | 16.8 | 21.2 | 5.0 | 14.8 | 2.0 | |
| Niacin (mg) | 75.9 | 7.0 | 1.6 | 10.5 | 25.2 | 5.1 | 21.4 | 1.4 | |
| Pantothenic acid (mg) | 71.3 | 14.0 | 2.5 | 15.5 | 17.4 | 4.7 | 19.1 | 2.4 | |
| Vitamin B6 (mg) | 71.0 | 10.7 | 2.7 | 13.0 | 20.8 | 5.4 | 10.5 | 3.5 | |
| Folate (µg) | 80.8 | 24.3 | 6.7 | 9.1 | 23.7 | 8.1 | 24.6 | 5.5 | |
| Vitamin B12 (µg) | 71.6 | 40.7 | 12.0 | 20.9 | 23.9 | 15.0 | 23.8 | 7.1 | |
| Vitamin C (mg) | 84.6 | 14.9 | 0.6 | 50.3 | 9.6 | 0.7 | 1.6 | 0.1 | |
| Vitamin A (µg) | 69.3 | 30.8 | 12.3 | 59.0 | 49.4 | 13.6 | 9.7 | 3.0 | |
| Vitamin D (IU) | 76.2 | 28.6 | 4.5 | 67.0 | 47.1 | 13.4 | 13.8 | 7.9 | |
| Vitamin E (mg) | 81.9 | 24.3 | 3.6 | 11.1 | 38.2 | 11.1 | 11.5 | 2.7 | |
| Minerals | Calcium (mg) | 80.2 | 25.7 | 5.1 | 30.5 | 17.2 | 4.4 | 10.7 | 1.8 |
| Copper (mg) | 63.8 | 21.0 | 7.6 | 12.5 | 26.4 | 10.1 | 18.0 | 6.2 | |
| Iron (mg) | 77.2 | 15.1 | 3.3 | 6.8 | 27.3 | 8.2 | 31.0 | 2.7 | |
| Magnesium (mg) | 68.4 | 14.2 | 2.4 | 11.5 | 22.9 | 9.4 | 17.4 | 2.7 | |
| Manganese (mg) | 78.4 | 19.7 | 2.9 | 8.1 | 27.0 | 9.7 | 24.8 | 2.2 | |
| Phosphorus (mg) | 79.7 | 16.9 | 2.7 | 9.6 | 23.9 | 9.9 | 25.3 | 5.6 | |
| Potassium (mg) | 74.4 | 15.4 | 1.8 | 15.4 | 14.6 | 4.1 | 10.4 | 0.8 | |
| Zinc (mg) | 82.3 | 16.6 | 1.9 | 7.9 | 26.2 | 7.3 | 21.8 | 1.9 | |
| Models in Which Each Category Was Considered for Selection | |||||||||
|---|---|---|---|---|---|---|---|---|---|
| Category | Variables Comprised by Each Category | 1 | 2 | 3 | 4a | 4b | 4c | 5 | |
| Household and individual demographic, socioeconomic, and lifestyle characteristics | Household-level variables: Weekday of assessment; province and location (capital, provincial/county center, rural) of household; numbers of men, women, boy, and girl household members; presence of students, herders, pensioners, married men or women, and members of the agricultural, industrial, or service industries in the household; total household income; average daily value of all foods consumed by the household; average daily value of foods eaten outside home; sum and maximum of household members’ years of education; household family composition; average daily energy expenditure of all household members; average daily energy expenditure of all guests and visitors. Individual-level variables: Age, sex, relationship to head of household, marriage status, current pregnancy or lactation, years of education, occupation, industry of employment, any food allergy, self-evaluated physical activity level; overall health, presence of any metabolic disease, and presence of any other serious disease in past 6 months. | √ | √ | √ | √ | √ | √ | √ | |
| Quantitative total household consumption of food groups and nutrients | Household-level variables: Average daily quantitative household consumption of 12 food groups and 27 nutrients from all sources combined (purchased, produced at home, and received as gifts). | √ | √ | √ | √ | √ | √ | ||
| Individuals’ self-evaluation of nutrition knowledge and its application to their lives | Individual-level variables: “Qualitatively evaluate your bodyweight”; “Do you know of and understand the Mongolian national dietary guidelines?”; “Do you understand the importance of dietary diversity?”, “Do you understand the importance of eating regularly?”; “Do you try to cook with and eat less sugar and sugary foods, less fat and fatty foods, more fresh foods, more fruits, and more vegetables?”, “Do you understand what a healthy and balance diet is?”; “How would you evaluate the quality your diet?”; “Do you understand that nutrition is important for health maintenance, or for your child’s health?”, “How important is your nutrition knowledge to your health?”; “How do you evaluate your nutrition knowledge?”; “Do you pay attention to each of the following: nutrition facts, ingredient labels, health claims, expiration dates”; “Have you attended any nutrition training?”; “Do you take any nutritional supplements?”. | √ | √ | √ | √ | √ | |||
| Cursory qualitative 24-h recall and assessment of eating behaviors | Individual-level variables: Binary (yes or no) consumption of 12 food groups yesterday; “Did you ever out in the past year?”; “Did you skip any meals in the past 2 days?”; “Did you miss any meals with your family yesterday?”; “Did you eat more, less, or the same amount today as yesterday?”; “Did you eat any foods outside home yesterday?”; “Did you miss any meals yesterday (breakfast, lunch dinner)?”; “Did you eat any snacks yesterday?”. | √ | |||||||
| Cursory semiquantitative 24-h recall and assessment of eating behaviors | Individual-level variables: Number of foods eaten yesterday from each of 12 food groups; frequency of snack consumption and eating out in the past year; number of meals (breakfast, lunch, dinner) skipped in last 2 days; “Did you eat more, less, or the same today as yesterday?”; sum of meals (breakfast, lunch, dinner) eaten with family yesterday; total number of food items eaten in each of the following places yesterday: home, outside, someone else’s house, elsewhere; total number of food items eaten yesterday for each meal (breakfast, lunch, dinner) and as snacks. | √ | |||||||
| Detailed semiquantitative 24-h recall | Individual-level variables: Binary (yes or no) consumption of 136 different foods during the past 24 h. | √ | √ | ||||||
| Measured anthropometry | Individual-level variables: Measured height and weight; body-mass index; measured waist, hip, mid-arm, and wrist circumference. | √ | |||||||
© 2018 by the authors. Licensee MDPI, Basel, Switzerland. This article is an open access article distributed under the terms and conditions of the Creative Commons Attribution (CC BY) license (http://creativecommons.org/licenses/by/4.0/).
Share and Cite
Bromage, S.; Rosner, B.; Rich-Edwards, J.W.; Ganmaa, D.; Tsolmon, S.; Tserendejid, Z.; Odbayar, T.-O.; Traeger, M.; Fawzi, W.W. Comparison of Methods for Estimating Dietary Food and Nutrient Intakes and Intake Densities from Household Consumption and Expenditure Data in Mongolia. Nutrients 2018, 10, 703. https://doi.org/10.3390/nu10060703
Bromage S, Rosner B, Rich-Edwards JW, Ganmaa D, Tsolmon S, Tserendejid Z, Odbayar T-O, Traeger M, Fawzi WW. Comparison of Methods for Estimating Dietary Food and Nutrient Intakes and Intake Densities from Household Consumption and Expenditure Data in Mongolia. Nutrients. 2018; 10(6):703. https://doi.org/10.3390/nu10060703
Chicago/Turabian StyleBromage, Sabri, Bernard Rosner, Janet W. Rich-Edwards, Davaasambuu Ganmaa, Soninkhishig Tsolmon, Zuunnast Tserendejid, Tseye-Oidov Odbayar, Margaret Traeger, and Wafaie W. Fawzi. 2018. "Comparison of Methods for Estimating Dietary Food and Nutrient Intakes and Intake Densities from Household Consumption and Expenditure Data in Mongolia" Nutrients 10, no. 6: 703. https://doi.org/10.3390/nu10060703
APA StyleBromage, S., Rosner, B., Rich-Edwards, J. W., Ganmaa, D., Tsolmon, S., Tserendejid, Z., Odbayar, T.-O., Traeger, M., & Fawzi, W. W. (2018). Comparison of Methods for Estimating Dietary Food and Nutrient Intakes and Intake Densities from Household Consumption and Expenditure Data in Mongolia. Nutrients, 10(6), 703. https://doi.org/10.3390/nu10060703