Food Sources and Potential Determinants of Dietary Vitamin C Intake in Chinese Adults: A Cross-Sectional Study


 , ,
, ,
Abstract
:1. Introduction
2. Materials and Methods
2.1. Study Population
2.2. Measurement of Dietary Intake
2.3. Dietary Estimation and Food Sources of Vitamin C
2.4. Dietary Estimation of Total Energy
2.5. Assessment of Fresh Fruit and Vegetable Consumption Frequency
2.6. Anthropometry
2.7. Measurement of Sociodemographic Characteristics
2.8. Statistical Analysis
3. Results
3.1. Basic Characteristics of the Study Population
3.2. Dietary Vitamin C Intake Level by Sociodemographic Factors
3.3. Prevalence of Risk of Insufficient Dietary Vitamin C Intake in the Study Population and Proportion of Subjects with a Lower Risk of Insufficient Dietary Vitamin C in Relation to Sociodemographic Factors
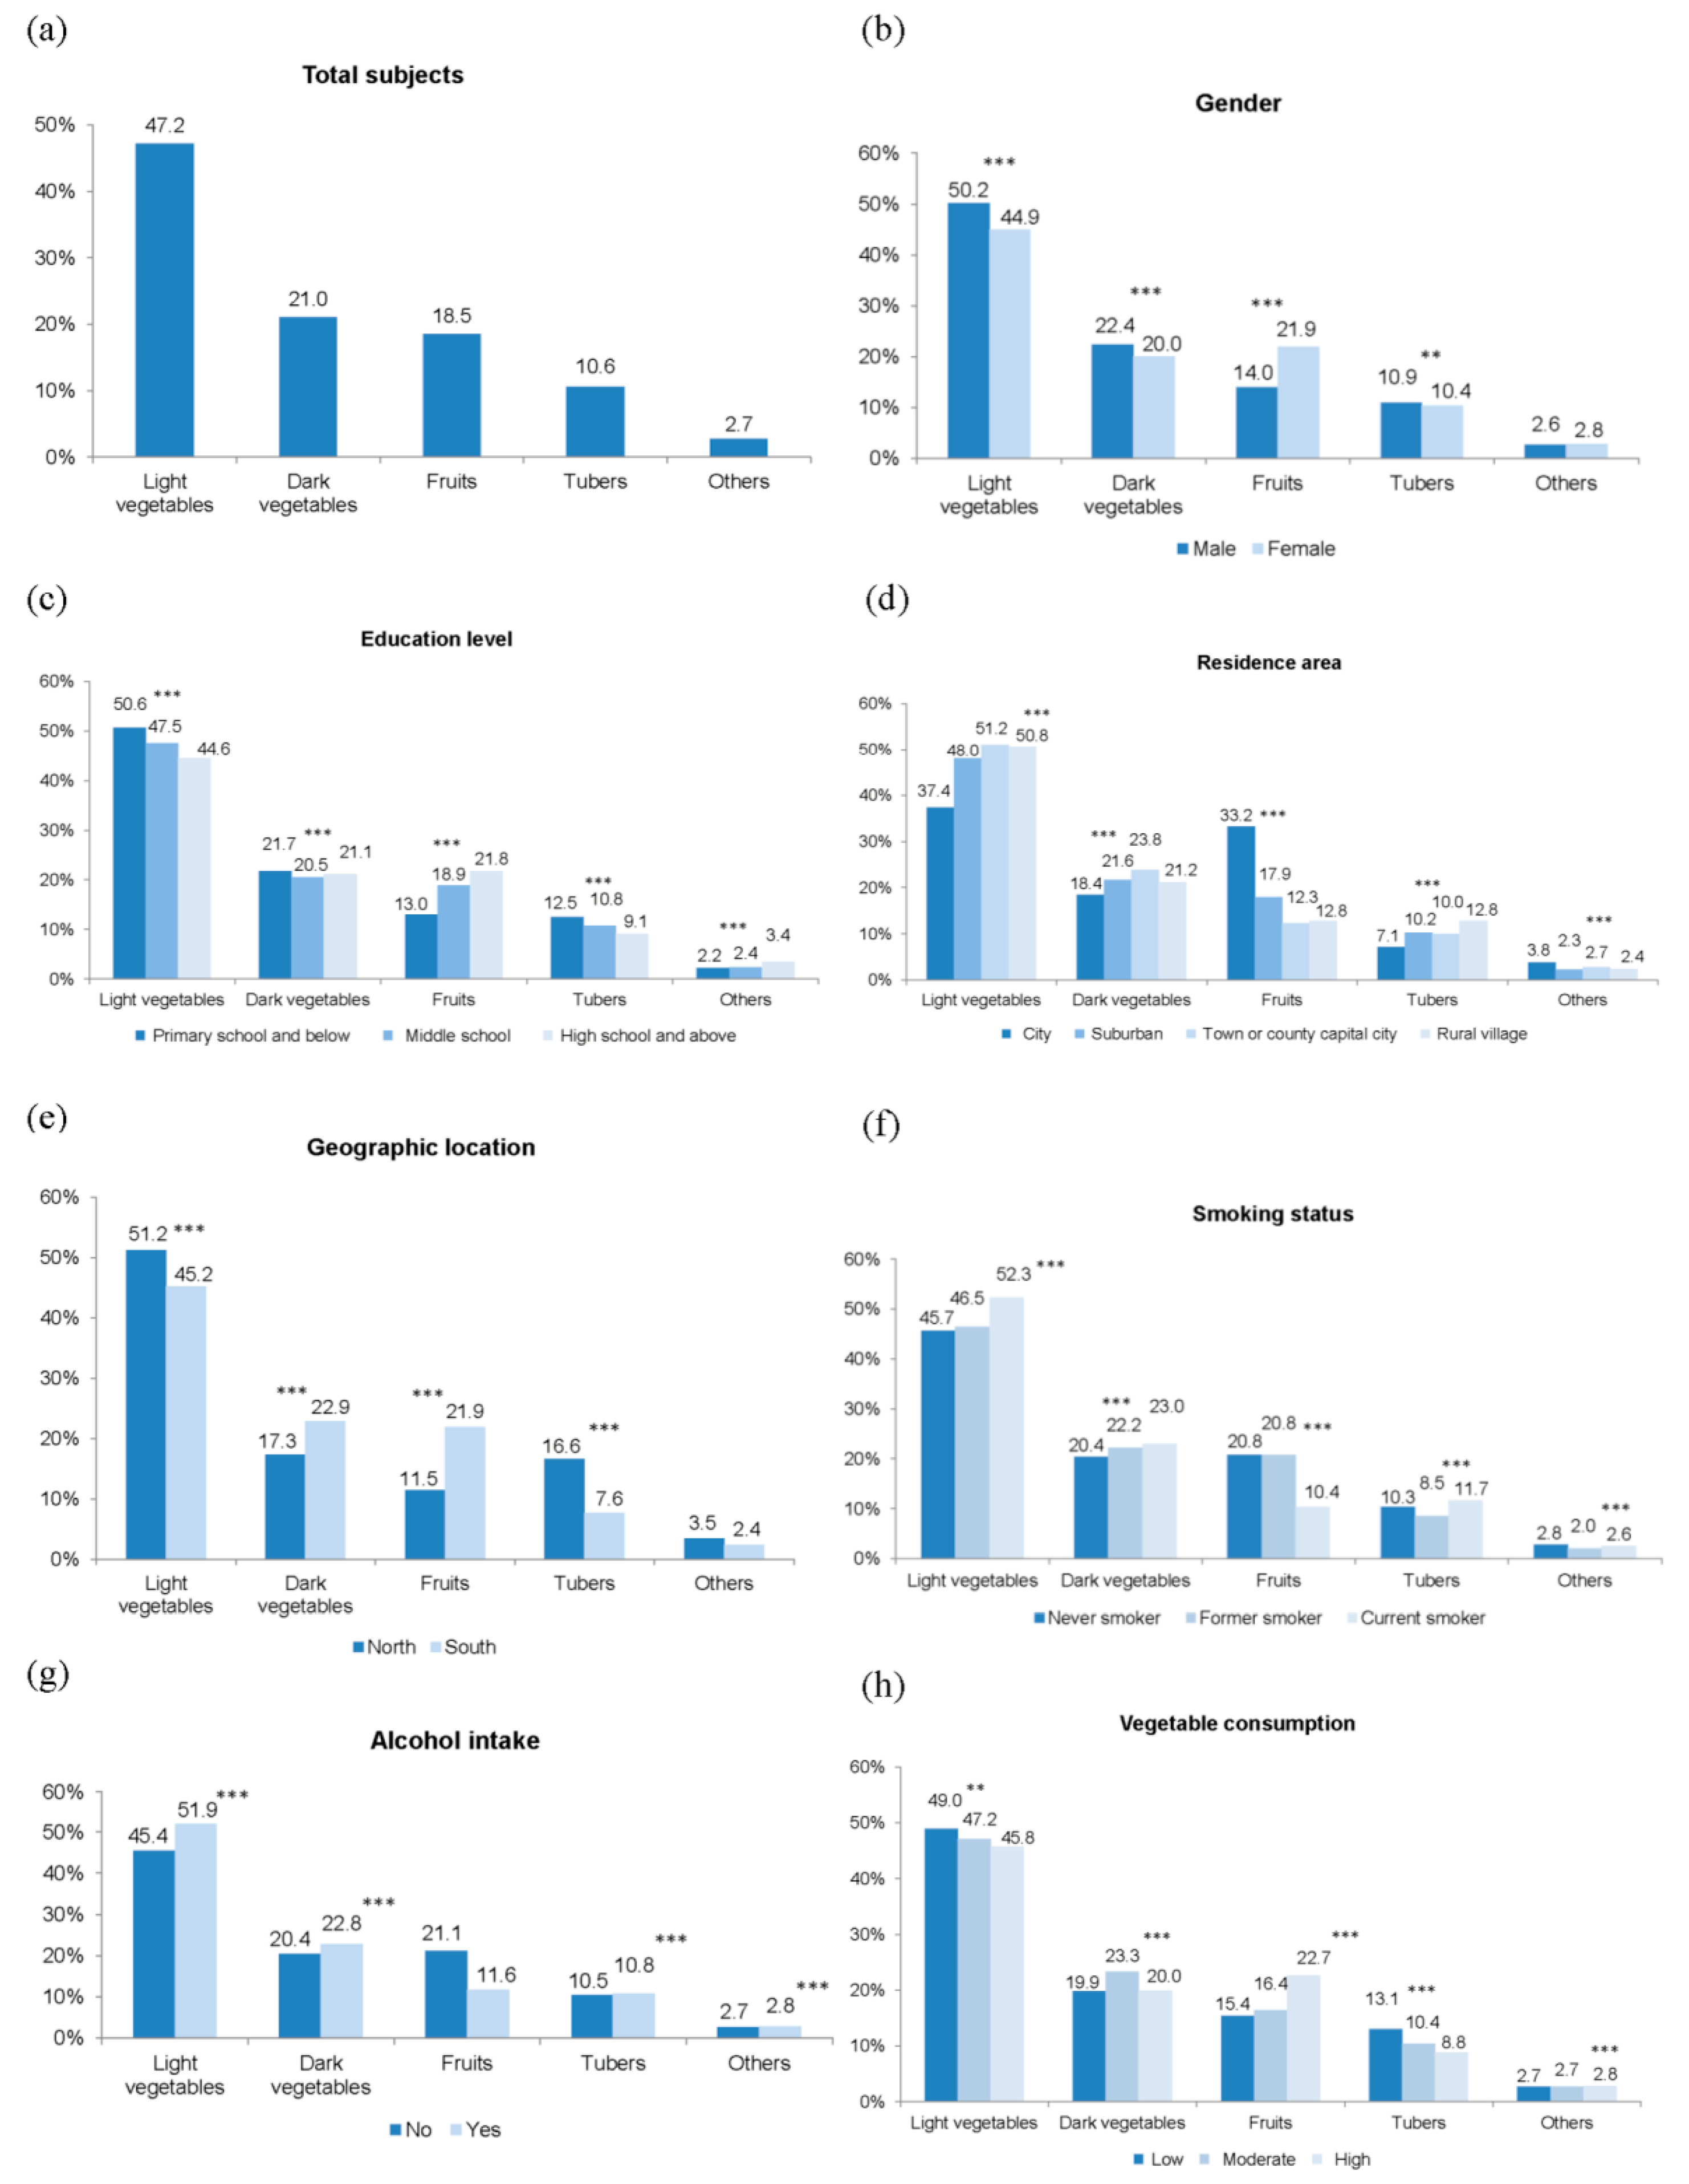
3.4. Contribution Percentages of Food Sources to the Total Dietary Vitamin C Intake in Relation to Sociodemographic Factors
3.5. Potential Determinants of the Dietary Vitamin C Intake Status
4. Discussion
5. Conclusions
Supplementary Materials
Acknowledgments
Author Contributions
Conflicts of Interest
References
- Martin-Calvo, N.; Martinez-Gonzalez, M.A. Vitamin C Intake is Inversely Associated with Cardiovascular Mortality in a Cohort of Spanish Graduates: The SUN Project. Nutrients 2017, 9, 954. [Google Scholar] [CrossRef] [PubMed]
- Chinese Nutrition Society. Chinese Dietary Reference Intakes, 2013 ed.; China Science Publishing House: Beijing, China, 2014; pp. 383–391. [Google Scholar]
- Zhang, J.; Wang, Z.; Wang, H.; Du, W.; Su, C.; Zhang, J.; Jiang, H.; Jia, X.; Huang, F.; Zhai, F.; et al. Association between dietary patterns and blood lipid profiles among Chinese women. Public Health Nutr. 2016, 19, 3361–3368. [Google Scholar] [CrossRef] [PubMed]
- Zhang, B.; Zhai, F.Y.; Du, S.F.; Popkin, B.M. The China Health and Nutrition Survey, 1989–2011. Obes. Rev. 2014, 15 (Suppl. 1), 2–7. [Google Scholar] [CrossRef] [PubMed]
- Zhai, F.Y.; Du, S.F.; Wang, Z.H.; Zhang, J.G.; Du, W.W.; Popkin, B.M. Dynamics of the Chinese diet and the role of urbanicity, 1991–2011. Obes. Rev. 2014, 15 (Suppl. 1), 162–166. [Google Scholar] [CrossRef] [PubMed]
- Ma, Y.; Zhang, B.; Wang, H.; Du, W.; Su, C.; Zhai, F. Nutrients intake trends of Chinese population in nine provinces from 1989 to 2009 (IX) Dietary vitamin C intake trend of Chinese adults aged 18–49 years. Acta Nutr. Sin. 2012, 34, 427–435. [Google Scholar]
- He, Y.; Wang, Z.; Zhao, L.; Fang, Y.; Yang, X.; Zhao, W. Dietary intake of vitamins in Chinese population from 2010 to 2012. Acta Nutr. Sin. 2017, 39, 112–115. [Google Scholar]
- Olsen, A.; Halkjaer, J.; van Gils, C.H.; Buijsse, B.; Verhagen, H.; Jenab, M.; Boutron-Ruault, M.C.; Ericson, U.; Ocké, M.C.; Peeters, P.H.; et al. Dietary intake of the water-soluble vitamins B1, B2, B6, B12 and C in 10 countries in the European Prospective Investigation into Cancer and Nutrition. Eur. J. Clin. Nutr. 2009, 63, S122–S149. [Google Scholar] [CrossRef] [PubMed]
- Olza, J.; Aranceta-Bartrina, J.; Gonzalez-Gross, M.; Ortega, R.M.; Serra-Majem, L.; Varela-Moreiras, G.; Gil, A. Reported Dietary Intake and Food Sources of Zinc, Selenium, and Vitamins A, E and C in the Spanish Population: Findings from the ANIBES Study. Nutrients 2017, 9, 697. [Google Scholar] [CrossRef] [PubMed]
- Sharma, S.; Sheehy, T.; Kolonel, L. Sources of vegetables, fruits and vitamins A, C and E among five ethnic groups: Results from a multiethnic cohort study. Eur. J. Clin. Nutr. 2014, 68, 384–391. [Google Scholar] [CrossRef] [PubMed]
- Junior, E.V.; Cesar, C.L.; Fisberg, R.M.; Marchioni, D.M. Socio-economic variables influence the prevalence of inadequate nutrient intake in Brazilian adolescents: Results from a population-based survey. Public Health Nutr. 2011, 14, 1533–1538. [Google Scholar] [CrossRef] [PubMed]
- Schectman, G.; Byrd, J.C.; Gruchow, H.W. The Influence of Smoking on Vitamin C Status in Adults. Am. J. Public Health 1989, 79, 158–162. [Google Scholar] [CrossRef] [PubMed]
- Wang, Z.; Zhang, B.; Wang, H.; Zhang, J.; Du, W.; Su, C.; Zhang, J.; Zhai, F. Trend in dietary vitamin C intake among Chinese children and adolescents between 1991 and 2009. Chin. J. Prev. Med. 2012, 46, 1069–1073. [Google Scholar]
- Du, W.W.; Zhang, B.; Wang, H.J.; Wang, Z.H.; Su, C.; Zhang, J.G.; Zhang, J.; Jia, X.F.; Jiang, H.R. Gender difference in the association between food away-from-home consumption and body weight outcomes among Chinese adults. Public Health Nutr. 2016, 19, 2984–2990. [Google Scholar] [CrossRef] [PubMed]
- Popkin, B.M.; Du, S.; Zhai, F.; Zhang, B. Cohort Profile: The China Health and Nutrition Survey—Monitoring and understanding socio-economic and health change in China, 1989–2011. Int. J. Epidemiol. 2010, 39, 1435–1440. [Google Scholar] [CrossRef] [PubMed]
- Yang, Y.X.; Wang, G.Y.; Pan, X.C. China Food Composition Table, 2nd ed.; Peking University Medical Press: Beijing, China, 2009. [Google Scholar]
- World Health Organization. Physical Status: The Use and Interpretation of Anthropometry; WHO Expert Committee: Geneva, Switzerland, 1995. [Google Scholar]
- Xu, X.; Hall, J.; Byles, J.; Shi, Z. Dietary Pattern Is Associated with Obesity in Older People in China: Data from China Health and Nutrition Survey (CHNS). Nutrients 2015, 7, 8170–8188. [Google Scholar] [CrossRef] [PubMed]
- Wilson, R.; Willis, J.; Gearry, R.; Skidmore, P.; Fleming, E.; Frampton, C.; Carr, A. Inadequate Vitamin C Status in Prediabetes and Type 2 Diabetes Mellitus: Associations with Glycaemic Control, Obesity, and Smoking. Nutrients 2017, 9, 997. [Google Scholar] [CrossRef] [PubMed]
- Gibson, R.S.; Charrondiere, U.R.; Bell, W. Measurement errors in dietary assessment using self-reported 24-hour recalls in low-income countries and strategies for their prevention. Adv. Nutr. 2017, 8, 980–991. [Google Scholar] [CrossRef] [PubMed]
- Moshfegh, A.; Goldman, J.; Cleveland, L. What We Eat in America, NHANES 2001–2002: Usual Nutrient Intakes from Food Compared to Dietary Reference Intakes; USDA/ARS: Washington, DC, USA, 2005. [Google Scholar]
- Zhang, R.; Wang, Z.; Fei, Y.; Zhou, B.; Zheng, S.; Wang, L.; Huang, L.; Jiang, S.; Liu, Z.; Jiang, J.; et al. The Difference in Nutrient Intakes between Chinese and Mediterranean, Japanese and American Diets. Nutrients 2015, 7, 4661–4688. [Google Scholar] [CrossRef] [PubMed]
- Vereecken, C.; Pedersen, T.P.; Ojala, K.; Krolner, R.; Dzielska, A.; Ahluwalia, N.; Giacchi, M.; Kelly, C. Fruit and vegetable consumption trends among adolescents from 2002 to 2010 in 33 countries. Eur. J. Public Health 2015, 25 (Suppl. 2), 16–19. [Google Scholar] [CrossRef] [PubMed]
- Zhai, F.Y.; He, Y.N.; Ma, G.S.; Li, Y.P.; Wang, Z.H.; Hu, Y.S.; Zhao, L.Y.; Cui, Z.H.; Li, Y.; Yang, X.G. Study on the current status and trend of food consumption among Chinese population. Zhonghua Liu Xing Bing Xue Za Zhi 2005, 26, 485–488. (In Chinese) [Google Scholar] [PubMed]
- Xiao, Y.; Su, C.; Ouyang, Y.; Zhang, B. Trends of vegetables and fruits consumption among Chinese adults aged 18 to 44 years old from 1991 to 2011. Zhonghua Liu Xing Bing Xue Za Zhi 2015, 36, 232–236. (In Chinese) [Google Scholar] [PubMed]
- Jablonowska-Lietz, B.; Jarosz, A.; Nowicka, G. Dietary intake of antioxidant vitamins in healthy adults in relation to current recommended intake. Rocz. Panstw. Zakl. Hig. 2013, 64, 43–48. [Google Scholar] [PubMed]
- Grant, E.; Gearry, R.B.; Wilson, R.; Pearson, J.; Skidmore, P.M.L. Home availability of fruit and vegetables and obesogenic foods as an indicator of nutrient intake in 50 year olds from Canterbury, New Zealand. Asia Pac. J. Clin. Nutr. 2017, 26, 524–530. [Google Scholar] [PubMed]
- Lyle, B.J.; Mares-Perlman, J.A.; Klein, B.E.; Klein, R.; Greger, J.L. Supplement users differ from non-users in demographic, lifestyle, dietary and health characteristics. J. Nutr. 1998, 128, 2355–2362. [Google Scholar] [CrossRef] [PubMed]
- Chinese Nutrition Society. The Chinese Dietary Guidelines, 2016 ed.; People’s Medical Publishing House: Beijing, China, 2016; p. 57. [Google Scholar]

| Parameters | N (%) | Vitamin C Intake (mg/Day) | p-Value | |
|---|---|---|---|---|
| Mean ± SD | Median (Interquartile Range) | |||
| Total subjects | 11,357 (100) | 78.1 ± 54.6 | 65.4 (61.4) | |
| Age group (years) | 0.069 | |||
| 18–49 | 6290 (55.4) | 76.9 ± 53.1 | 64.7 (60.6) | |
| 50–65 | 5067 (44.6) | 79.5 ± 56.4 | 66.3 (62.2) | |
| Gender | 0.001 | |||
| male | 4944 (43.5) | 79.4 ± 53.7 | 67.6 (64.1) | |
| female | 6413 (56.5) | 77.1 ± 55.3 | 63.9 (59.3) | |
| Education level | 0.003 | |||
| primary school and below a | 3070 (27.0) | 75.5 ± 52.6 | 63.9 (58.1) | |
| middle school b,c | 3998 (35.2) | 80.4 ± 56.2 | 67.1 (66.1) | |
| high school and above a,c | 4289 (37.8) | 77.8 ± 54.8 | 65.3 (59.9) | |
| Annual household income level (thousand yuan/per capital) 1 | 0.463 | |||
| low | 0.9 ± 0.7 | 77.6 ± 54.8 | 64.7 (63.4) | |
| moderate | 6.1 ± 2.4 | 78.4 ± 54.0 | 66.1 (60.7) | |
| high | 27.6 ± 19.1 | 78.3 ± 55.1 | 65.3 (59.8) | |
| Residence area | <0.001 | |||
| city a | 2276 (20.0) | 81.2 ± 61.7 | 65.8 (65.4) | |
| suburban b | 1865 (16.4) | 87.9 ± 57.5 | 75.2 (69.8) | |
| town or county capital city c | 1979 (17.4) | 72.7 ± 49.3 | 60.5 (57.7) | |
| rural village a,c | 5237 (46.1) | 75.3 ± 51.6 | 64.2 (57.6) | |
| Geographic location | <0.001 | |||
| north | 4283 (37.7) | 73.8 ± 51.7 | 62.2 (56.7) | |
| south | 7074 (62.3) | 80.7 ± 56.2 | 67.5 (64.6) | |
| Smoking status | 0.015 | |||
| never smoker | 8482 (74.7) | 77.6 ± 55.1 | 64.6 (60.0) | |
| former smoker | 225 (2.0) | 81.9 ± 53.4 | 68.7 (62.1) | |
| current smoker | 2650 (23.3) | 79.5 ± 53.1 | 68.1 (66.2) | |
| Alcohol intake | <0.001 | |||
| no | 8130 (71.6) | 77.3 ± 55.2 | 64.2 (60.3) | |
| yes | 3227 (28.4) | 80.1 ± 53.1 | 68.8 (64.5) | |
| Fruit consumption (times/day) 1 | 0.073 | |||
| low | 0.2 ± 0.1 | 78.3 ± 52.7 | 66.0 (61.9) | |
| moderate | 0.5 ± 0.1 | 76.9 ± 54.7 | 64.5 (60.4) | |
| high | 1.2 ± 0.4 | 79.1 ± 56.4 | 66.2 (61.6) | |
| Vegetable consumption (times/day) 1 | <0.001 | |||
| low a | 1.2 ± 04 | 71.4 ± 50.2 | 60.5 (55.9) | |
| moderate b | 2.3 ± 0.3 | 77.9 ± 53.6 | 65.4 (59.7) | |
| high c | 4.3 ± 1.3 | 85.0 ± 58.8 | 71.6 (68.6) | |
| Body mass index (kg/m2) | 0.084 | |||
| <18.5 | 469 (4.1) | 76.2 ± 52.8 | 65.9 (58.2) | |
| 18.5–24 | 5388 (47.4) | 76.8 ± 52.7 | 64.6 (61.6) | |
| 24–28 | 3938 (34.7) | 79.1 ± 57.0 | 65.3 (62.1) | |
| ≥28 | 1562 (13.8) | 80.8 ± 55.3 | 68.3 (59.5) | |
| Parameters | Subjects at Risk of Insufficient Dietary Vitamin C Intake (<85 mg/Day) | Subjects with a Lower Likelihood of Inadequate Dietary Vitamin C Intake (≥100 mg/Day) | ||
|---|---|---|---|---|
| N (%) | p-Value | N (%) | p-Value | |
| Total subjects | 7396 (65.1) | 2938 (25.9) | ||
| Age group (years) | 0.367 | 0.193 | ||
| 18–49 | 4119 (65.5) | 1597 (25.4) | ||
| 50–65 | 3277 (64.7) | 1341 (26.5) | ||
| Gender | <0.001 | 0.001 | ||
| male | 3118 (63.1) | 1360 (27.5) | ||
| female | 4278 (66.7) | 1578 (24.6) | ||
| Education level | <0.001 | <0.001 | ||
| primary school and below | 2071 (67.5) | 733 (23.9) | ||
| middle school | 2512 (62.8) | 1123 (28.1) | ||
| high school and above | 2813 (65.6) | 1082 (25.2) | ||
| Household income level | 0.612 | 0.220 | ||
| low | 2460 (65.0) | 1003 (26.5) | ||
| moderate | 2453 (64.8) | 978 (25.8) | ||
| high | 2483 (65.6) | 957 (25.3) | ||
| Residence area | <0.001 | <0.001 | ||
| city | 1460 (64.2) | 615 (27.0) | ||
| suburban | 1059 (56.8) | 633 (33.9) | ||
| town or county capital city | 1359 (68.7) | 452 (22.8) | ||
| rural village | 3518 (67.2) | 1238 (23.6) | ||
| Geographic location | <0.001 | <0.001 | ||
| north | 2948 (68.8) | 953 (22.3) | ||
| south | 4448 (62.9) | 1985 (28.1) | ||
| Smoking status | 0.003 | 0.002 | ||
| never smoker | 5599 (66.0) | 2124 (25.0) | ||
| former smoker | 137 (60.9) | 67 (29.8) | ||
| current smoker | 1660 (62.6) | 747 (28.2) | ||
| Alcohol intake | <0.001 | 0.002 | ||
| no | 5375 (66.1) | 2039 (25.1) | ||
| yes | 2021 (62.6) | 899 (27.9) | ||
| Fruit consumption | 0.648 | 0.749 | ||
| low | 2432 (64.7) | 1002 (26.6) | ||
| moderate | 2558 (66.5) | 949 (24.7) | ||
| high | 2406 (64.2) | 987 (26.3) | ||
| Vegetable consumption | <0.001 | <0.001 | ||
| low | 2659 (70.3) | 798 (21.1) | ||
| moderate | 2506 (66.2) | 958 (25.3) | ||
| high | 2231 (58.9) | 1182 (31.2) | ||
| Body mass index (kg/m2) | 0.208 | 0.536 | ||
| <18.5 | 314 (67.0) | 117 (25.0) | ||
| 18.5–24 | 3522 (65.4) | 1386 (25.7) | ||
| 24–28 | 2562 (65.1) | 1025 (26.0) | ||
| ≥28 | 998 (63.9) | 410 (26.3) | ||
| Independent Variables | <85 vs. ≥85 mg/Day of Dietary Vitamin C Intake | |
|---|---|---|
| OR (95% CI) | p-Value | |
| Gender | ||
| male | 1.0 | |
| female | 0.93 (0.83, 1.04) | 0.205 |
| Education level | ||
| primary school and below | 1.0 | |
| middle school | 0.84 (0.76, 0.93) | 0.001 |
| high school and above | 0.95 (0.85, 1.07) | 0.406 |
| Residence area | ||
| city | 1.0 | |
| suburban | 0.72 (0.63, 0.82) | <0.001 |
| town or county capital city | 1.20 (1.05, 1.37) | 0.007 |
| rural village | 1.17 (1.04, 1.32) | 0.009 |
| Geographic location | ||
| north | 1.0 | |
| south | 0.85 (0.78, 0.92) | <0.001 |
| Smoking status | ||
| never smoker | 1.0 | |
| former smoker | 0.90 (0.67, 1.20) | 0.470 |
| current smoker | 0.97 (0.86, 1.09) | 0.582 |
| Alcohol intake | ||
| no | 1.0 | |
| yes | 1.00 (0.89, 1.11) | 0.924 |
| Vegetable consumption | ||
| low | 1.0 | |
| moderate | 0.91 (0.82, 1.01) | 0.064 |
| high | 0.68 (0.62, 0.75) | <0.001 |
| Total daily energy intake | ||
| low | 1.0 | |
| moderate | 0.60 (0.54, 0.66) | <0.001 |
| high | 0.33 (0.30, 0.37) | <0.001 |
© 2018 by the authors. Licensee MDPI, Basel, Switzerland. This article is an open access article distributed under the terms and conditions of the Creative Commons Attribution (CC BY) license (http://creativecommons.org/licenses/by/4.0/).
Share and Cite
Jia, X.; Wang, Z.; Zhang, B.; Su, C.; Du, W.; Zhang, J.; Zhang, J.; Jiang, H.; Huang, F.; Ouyang, Y.; et al. Food Sources and Potential Determinants of Dietary Vitamin C Intake in Chinese Adults: A Cross-Sectional Study. Nutrients 2018, 10, 320. https://doi.org/10.3390/nu10030320
Jia X, Wang Z, Zhang B, Su C, Du W, Zhang J, Zhang J, Jiang H, Huang F, Ouyang Y, et al. Food Sources and Potential Determinants of Dietary Vitamin C Intake in Chinese Adults: A Cross-Sectional Study. Nutrients. 2018; 10(3):320. https://doi.org/10.3390/nu10030320
Chicago/Turabian StyleJia, Xiaofang, Zhihong Wang, Bing Zhang, Chang Su, Wenwen Du, Jiguo Zhang, Ji Zhang, Hongru Jiang, Feifei Huang, Yifei Ouyang, and et al. 2018. "Food Sources and Potential Determinants of Dietary Vitamin C Intake in Chinese Adults: A Cross-Sectional Study" Nutrients 10, no. 3: 320. https://doi.org/10.3390/nu10030320
APA StyleJia, X., Wang, Z., Zhang, B., Su, C., Du, W., Zhang, J., Zhang, J., Jiang, H., Huang, F., Ouyang, Y., Wang, Y., Li, L., & Wang, H. (2018). Food Sources and Potential Determinants of Dietary Vitamin C Intake in Chinese Adults: A Cross-Sectional Study. Nutrients, 10(3), 320. https://doi.org/10.3390/nu10030320