The Relationship between Dietary Habits and Frailty in Rural Japanese Community-Dwelling Older Adults: Cross-Sectional Observation Study Using a Brief Self-Administered Dietary History Questionnaire


 , ,
, ,
Abstract
1. Introduction
2. Materials and Methods
2.1. Exclusion Criteria
2.2. Measurement of Body Composition
2.3. Diagnosis of Frailty
2.4. Dietary Survey
2.5. Statistical Analysis
3. Results
3.1. Basic Characteristics and the Prevalence of Frailty
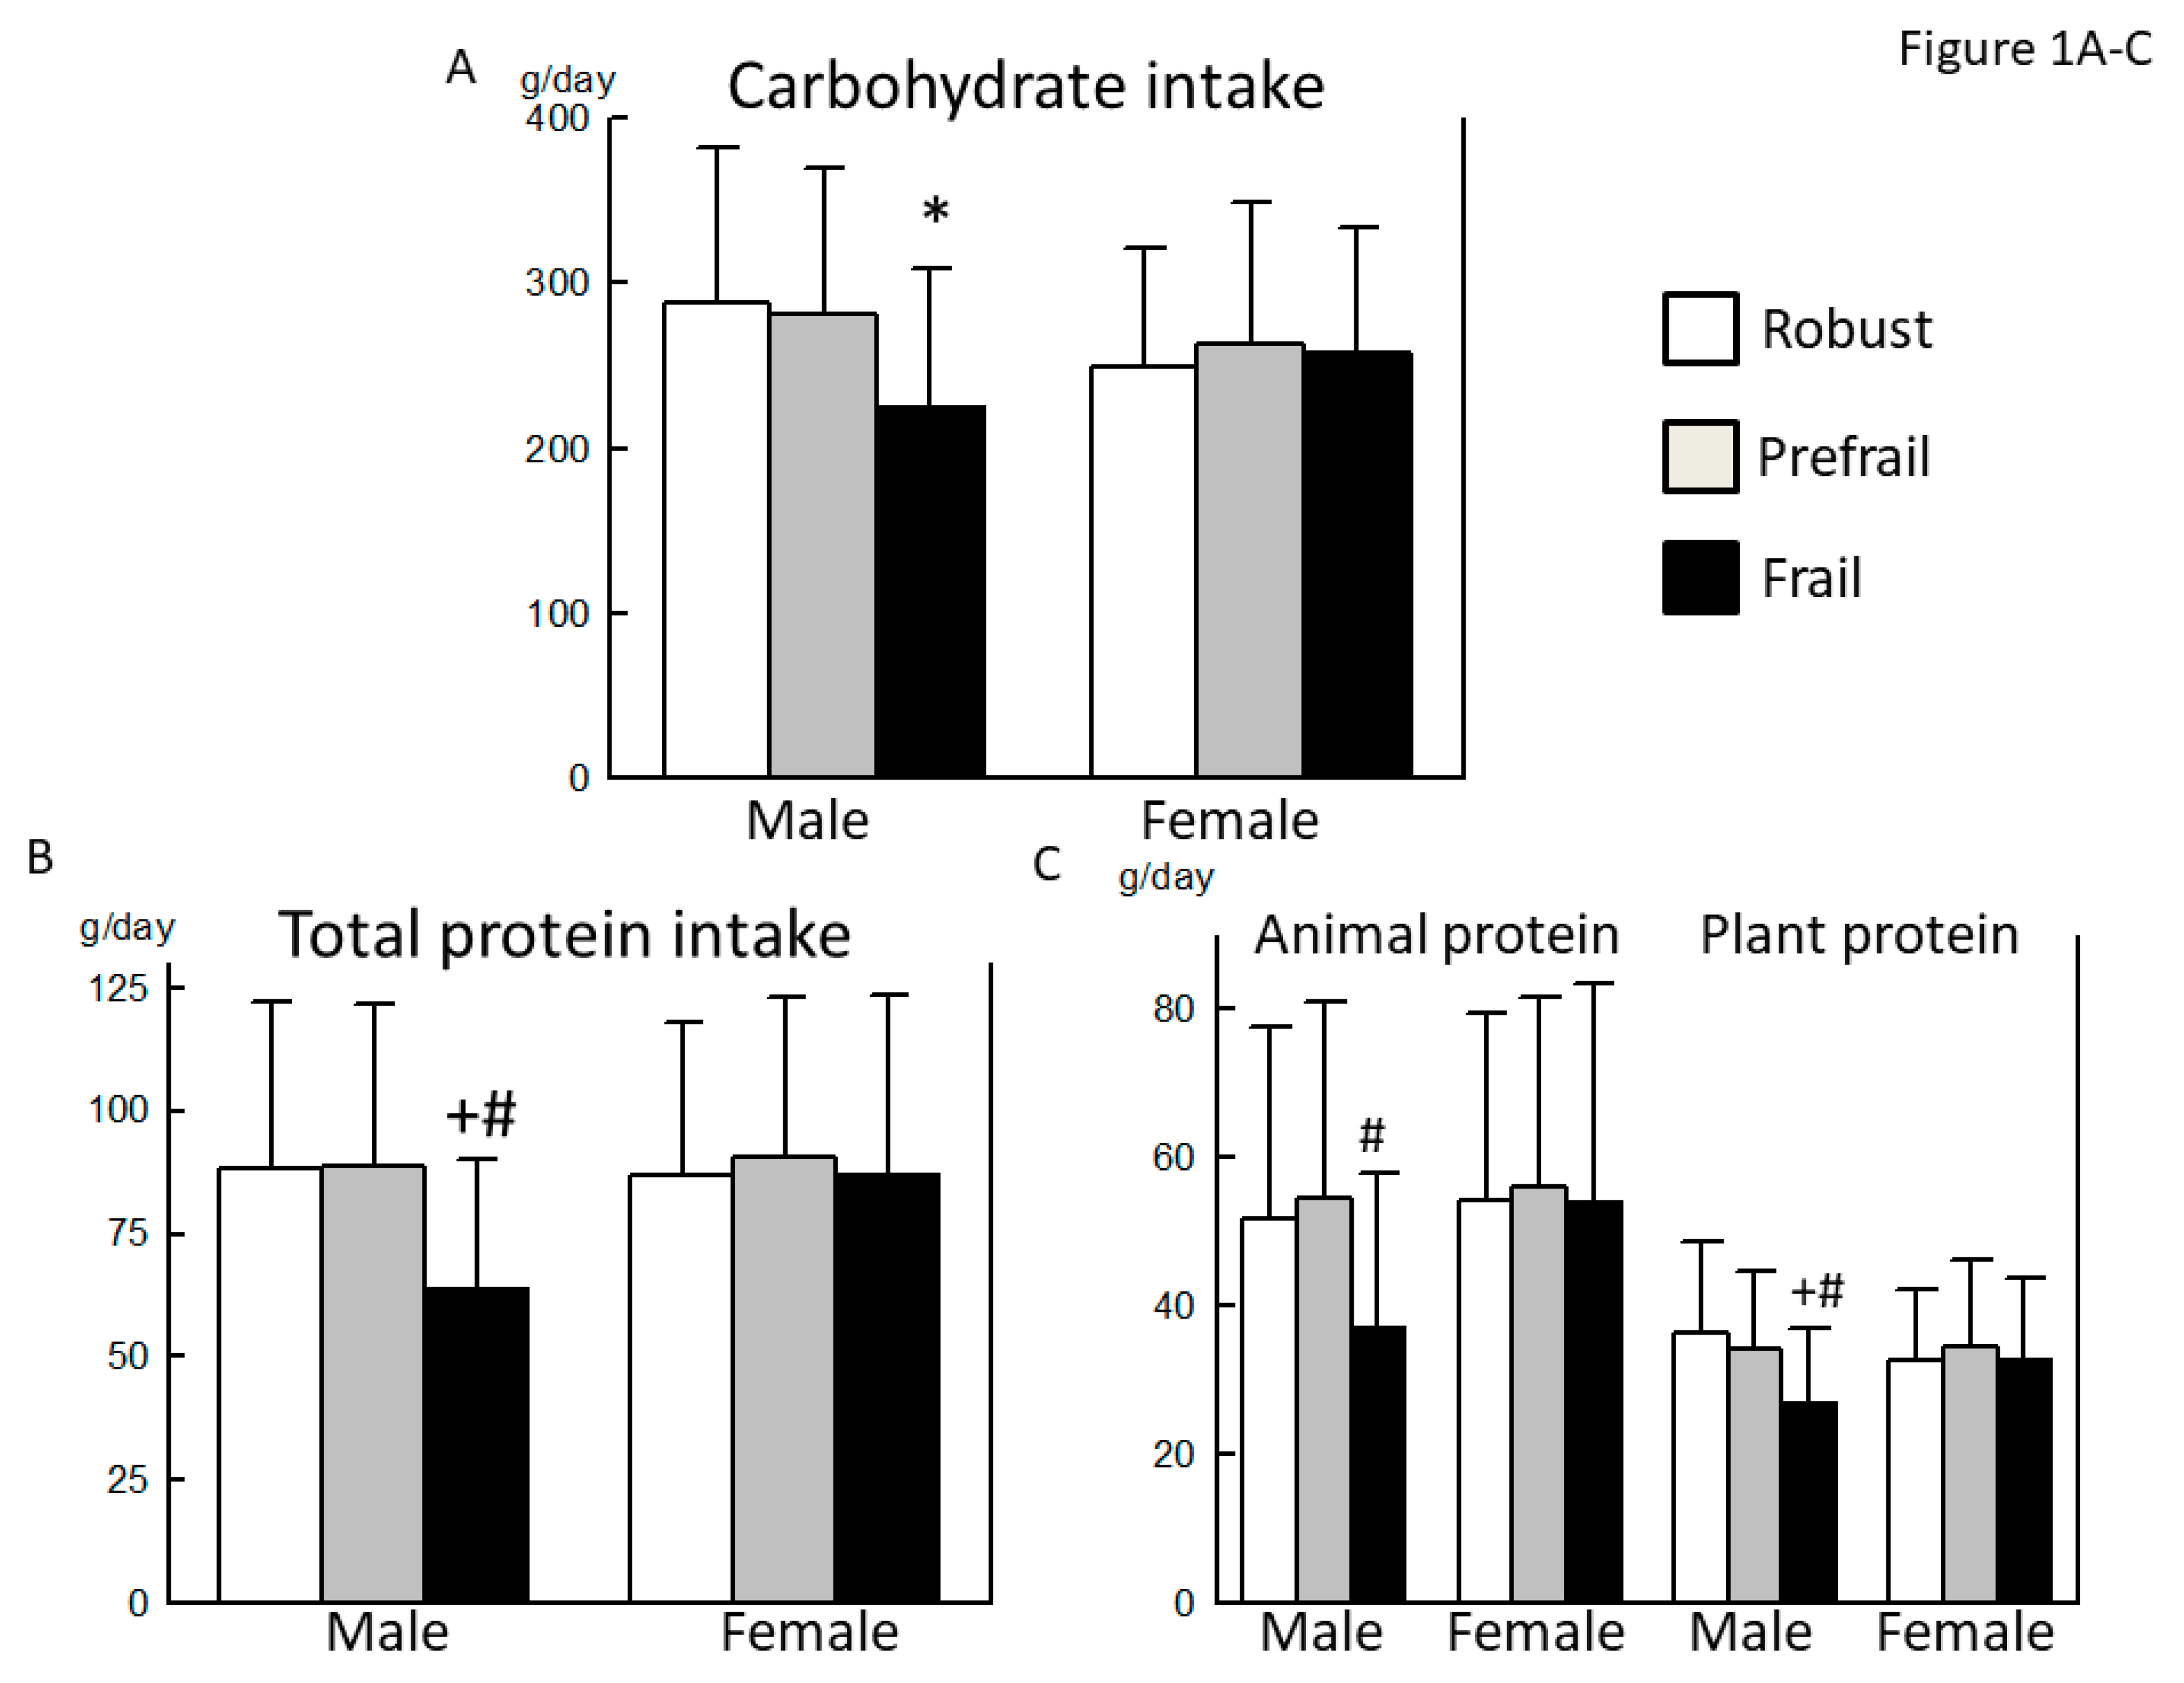
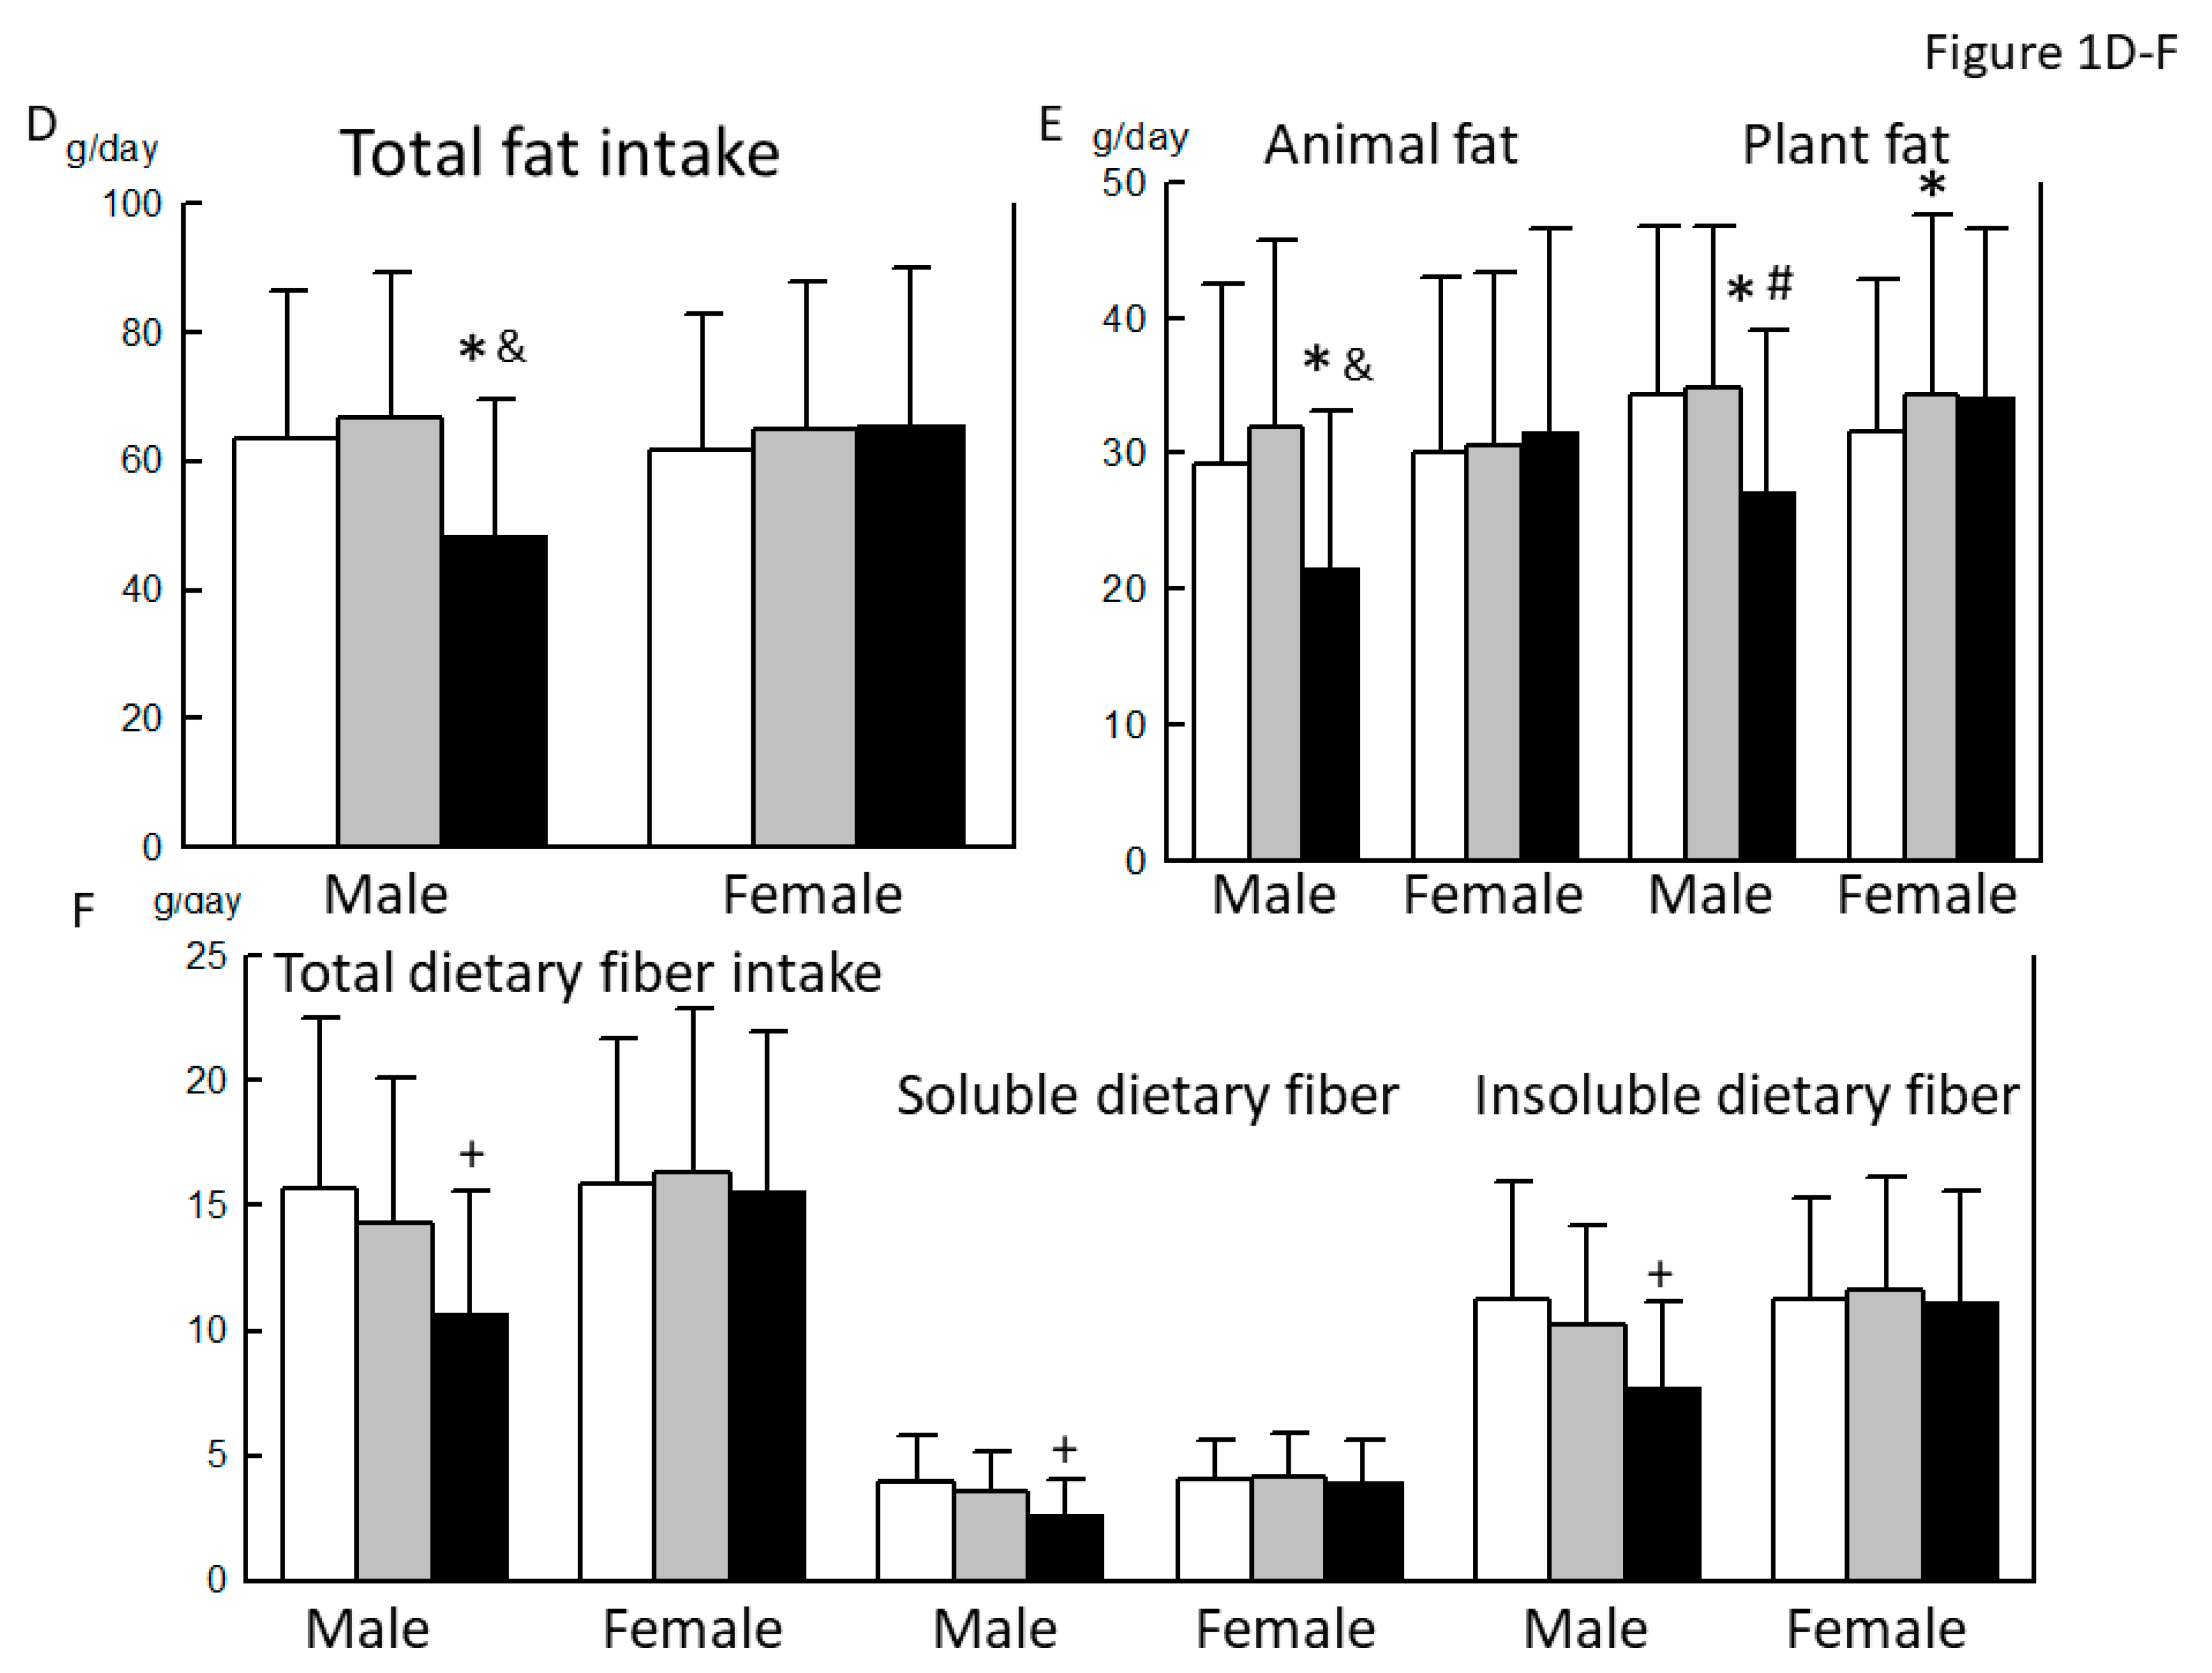
3.2. Comparison of the Basic Characteristics, Nutrient Intake, and Dietary Habits between Robust, Prefrail, and Frail Individuals, Diagnosed by the KCL Criteria
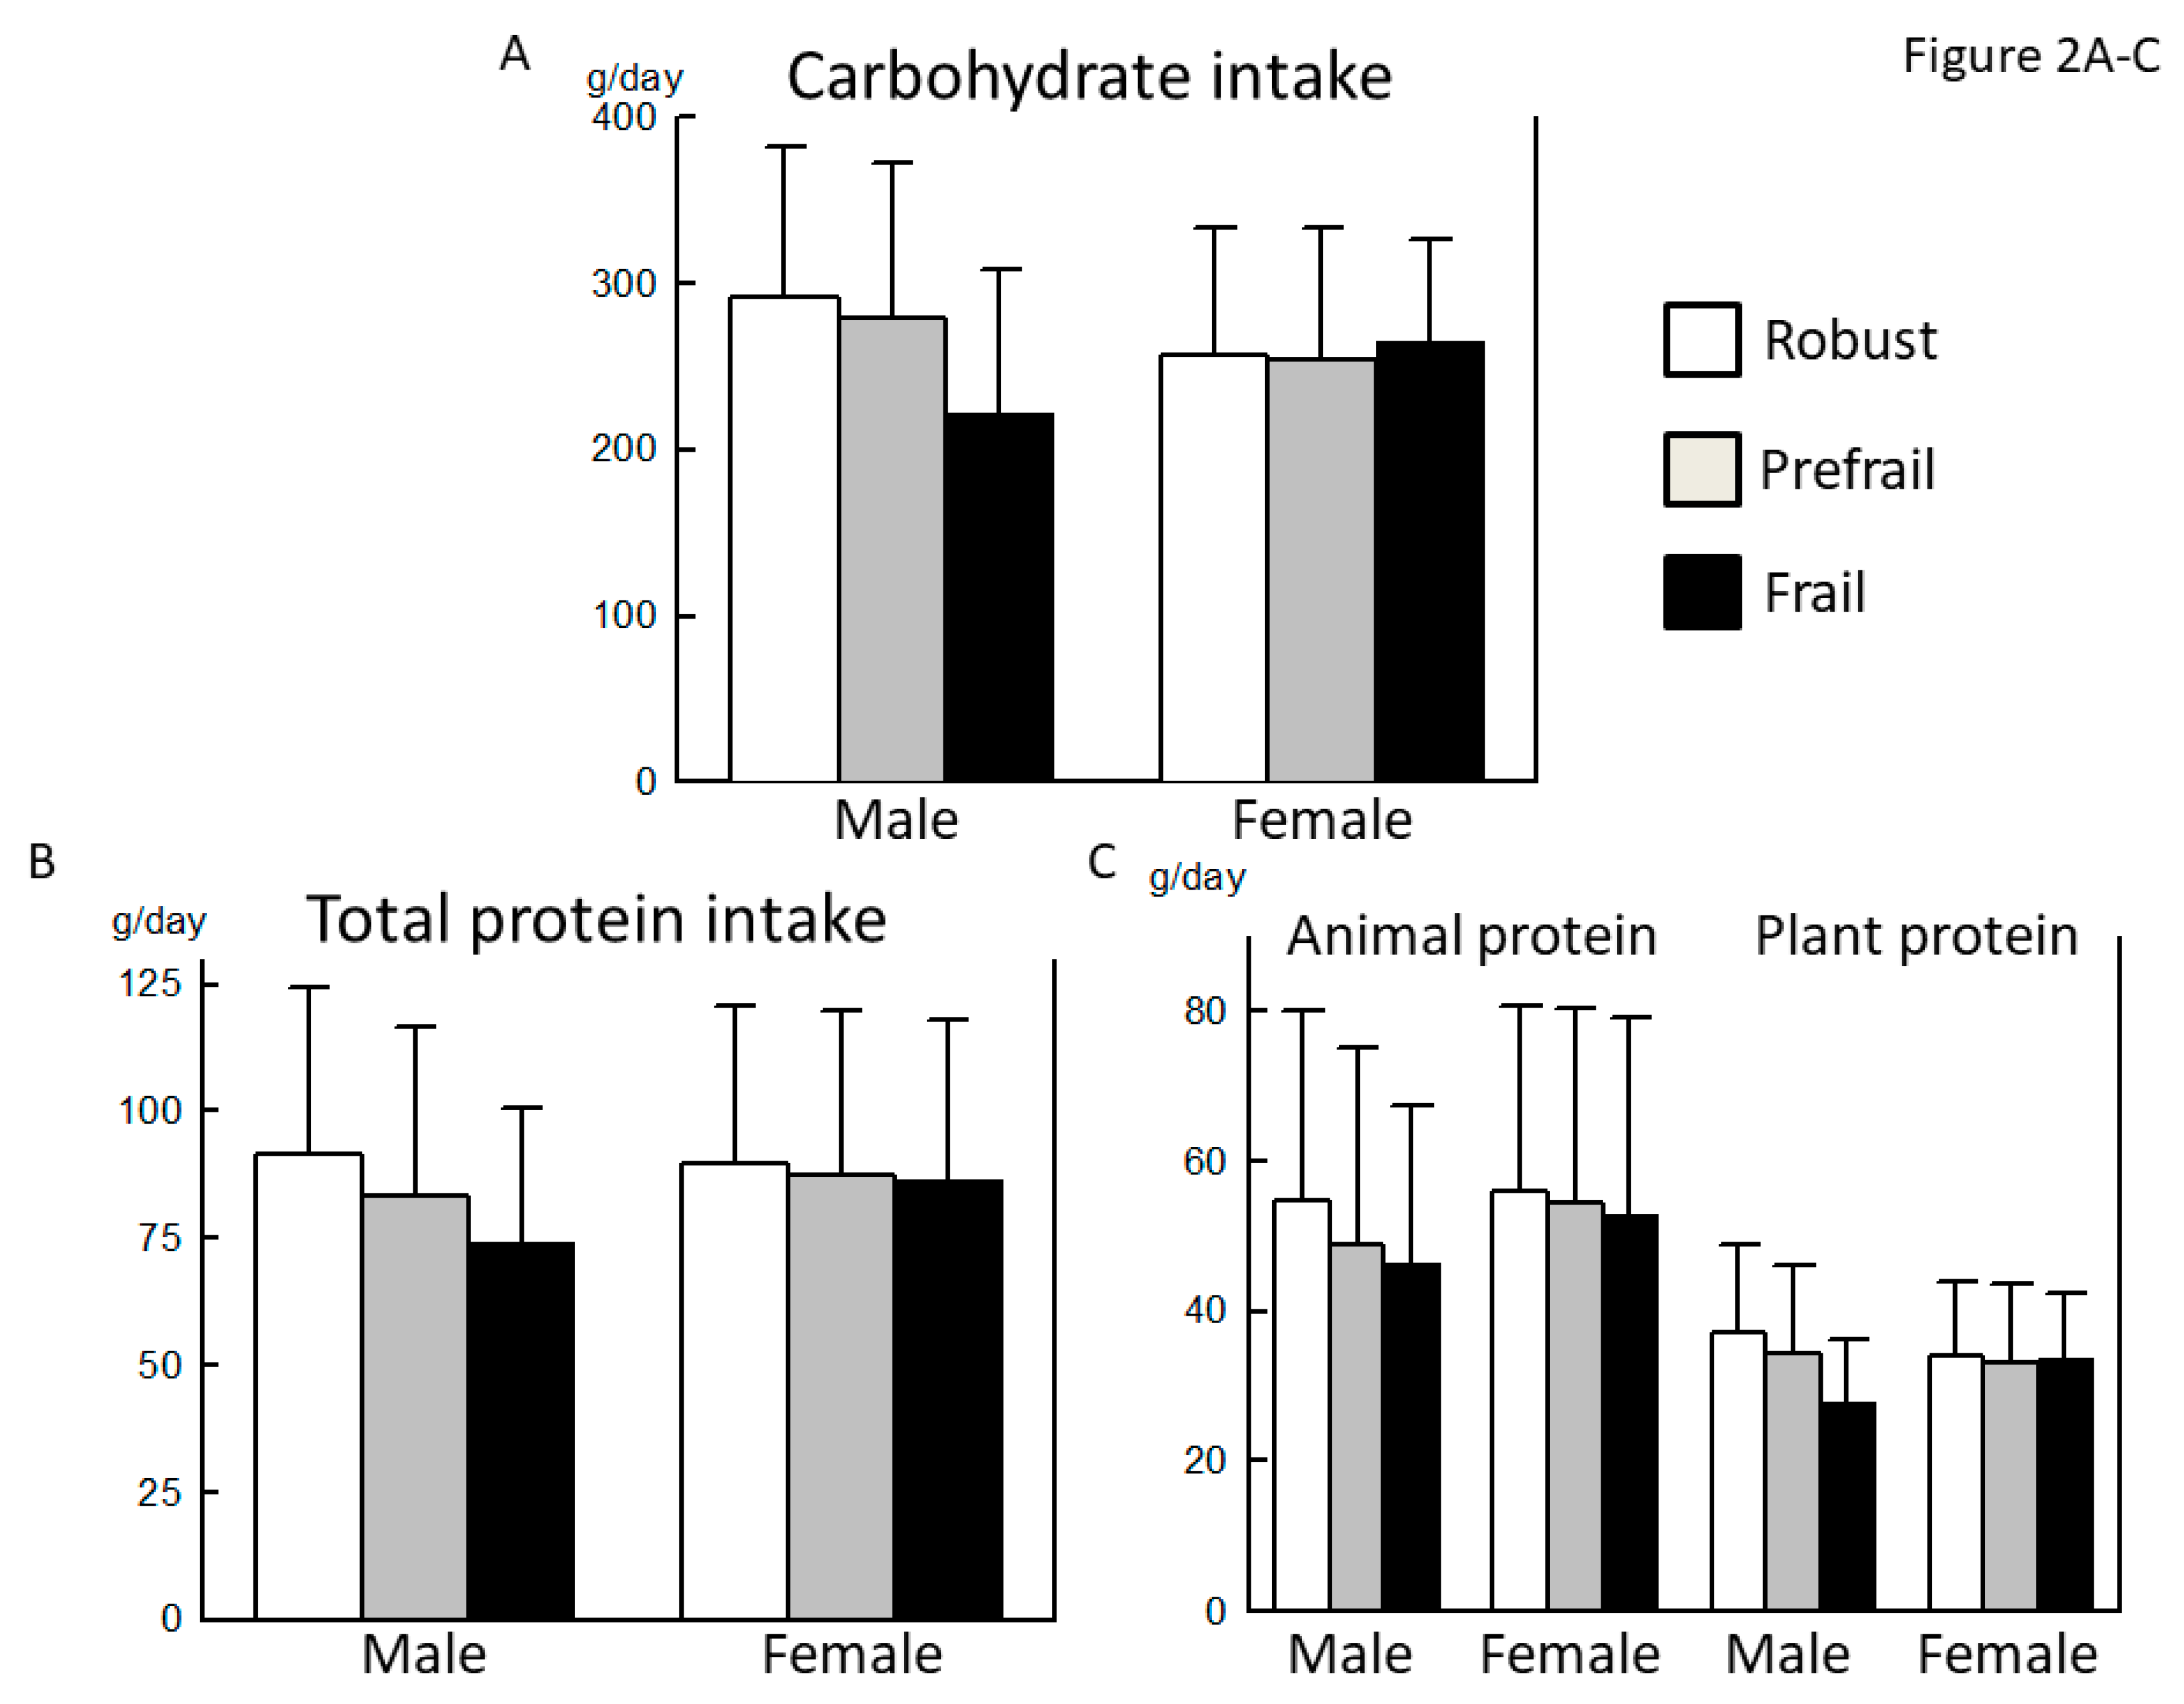
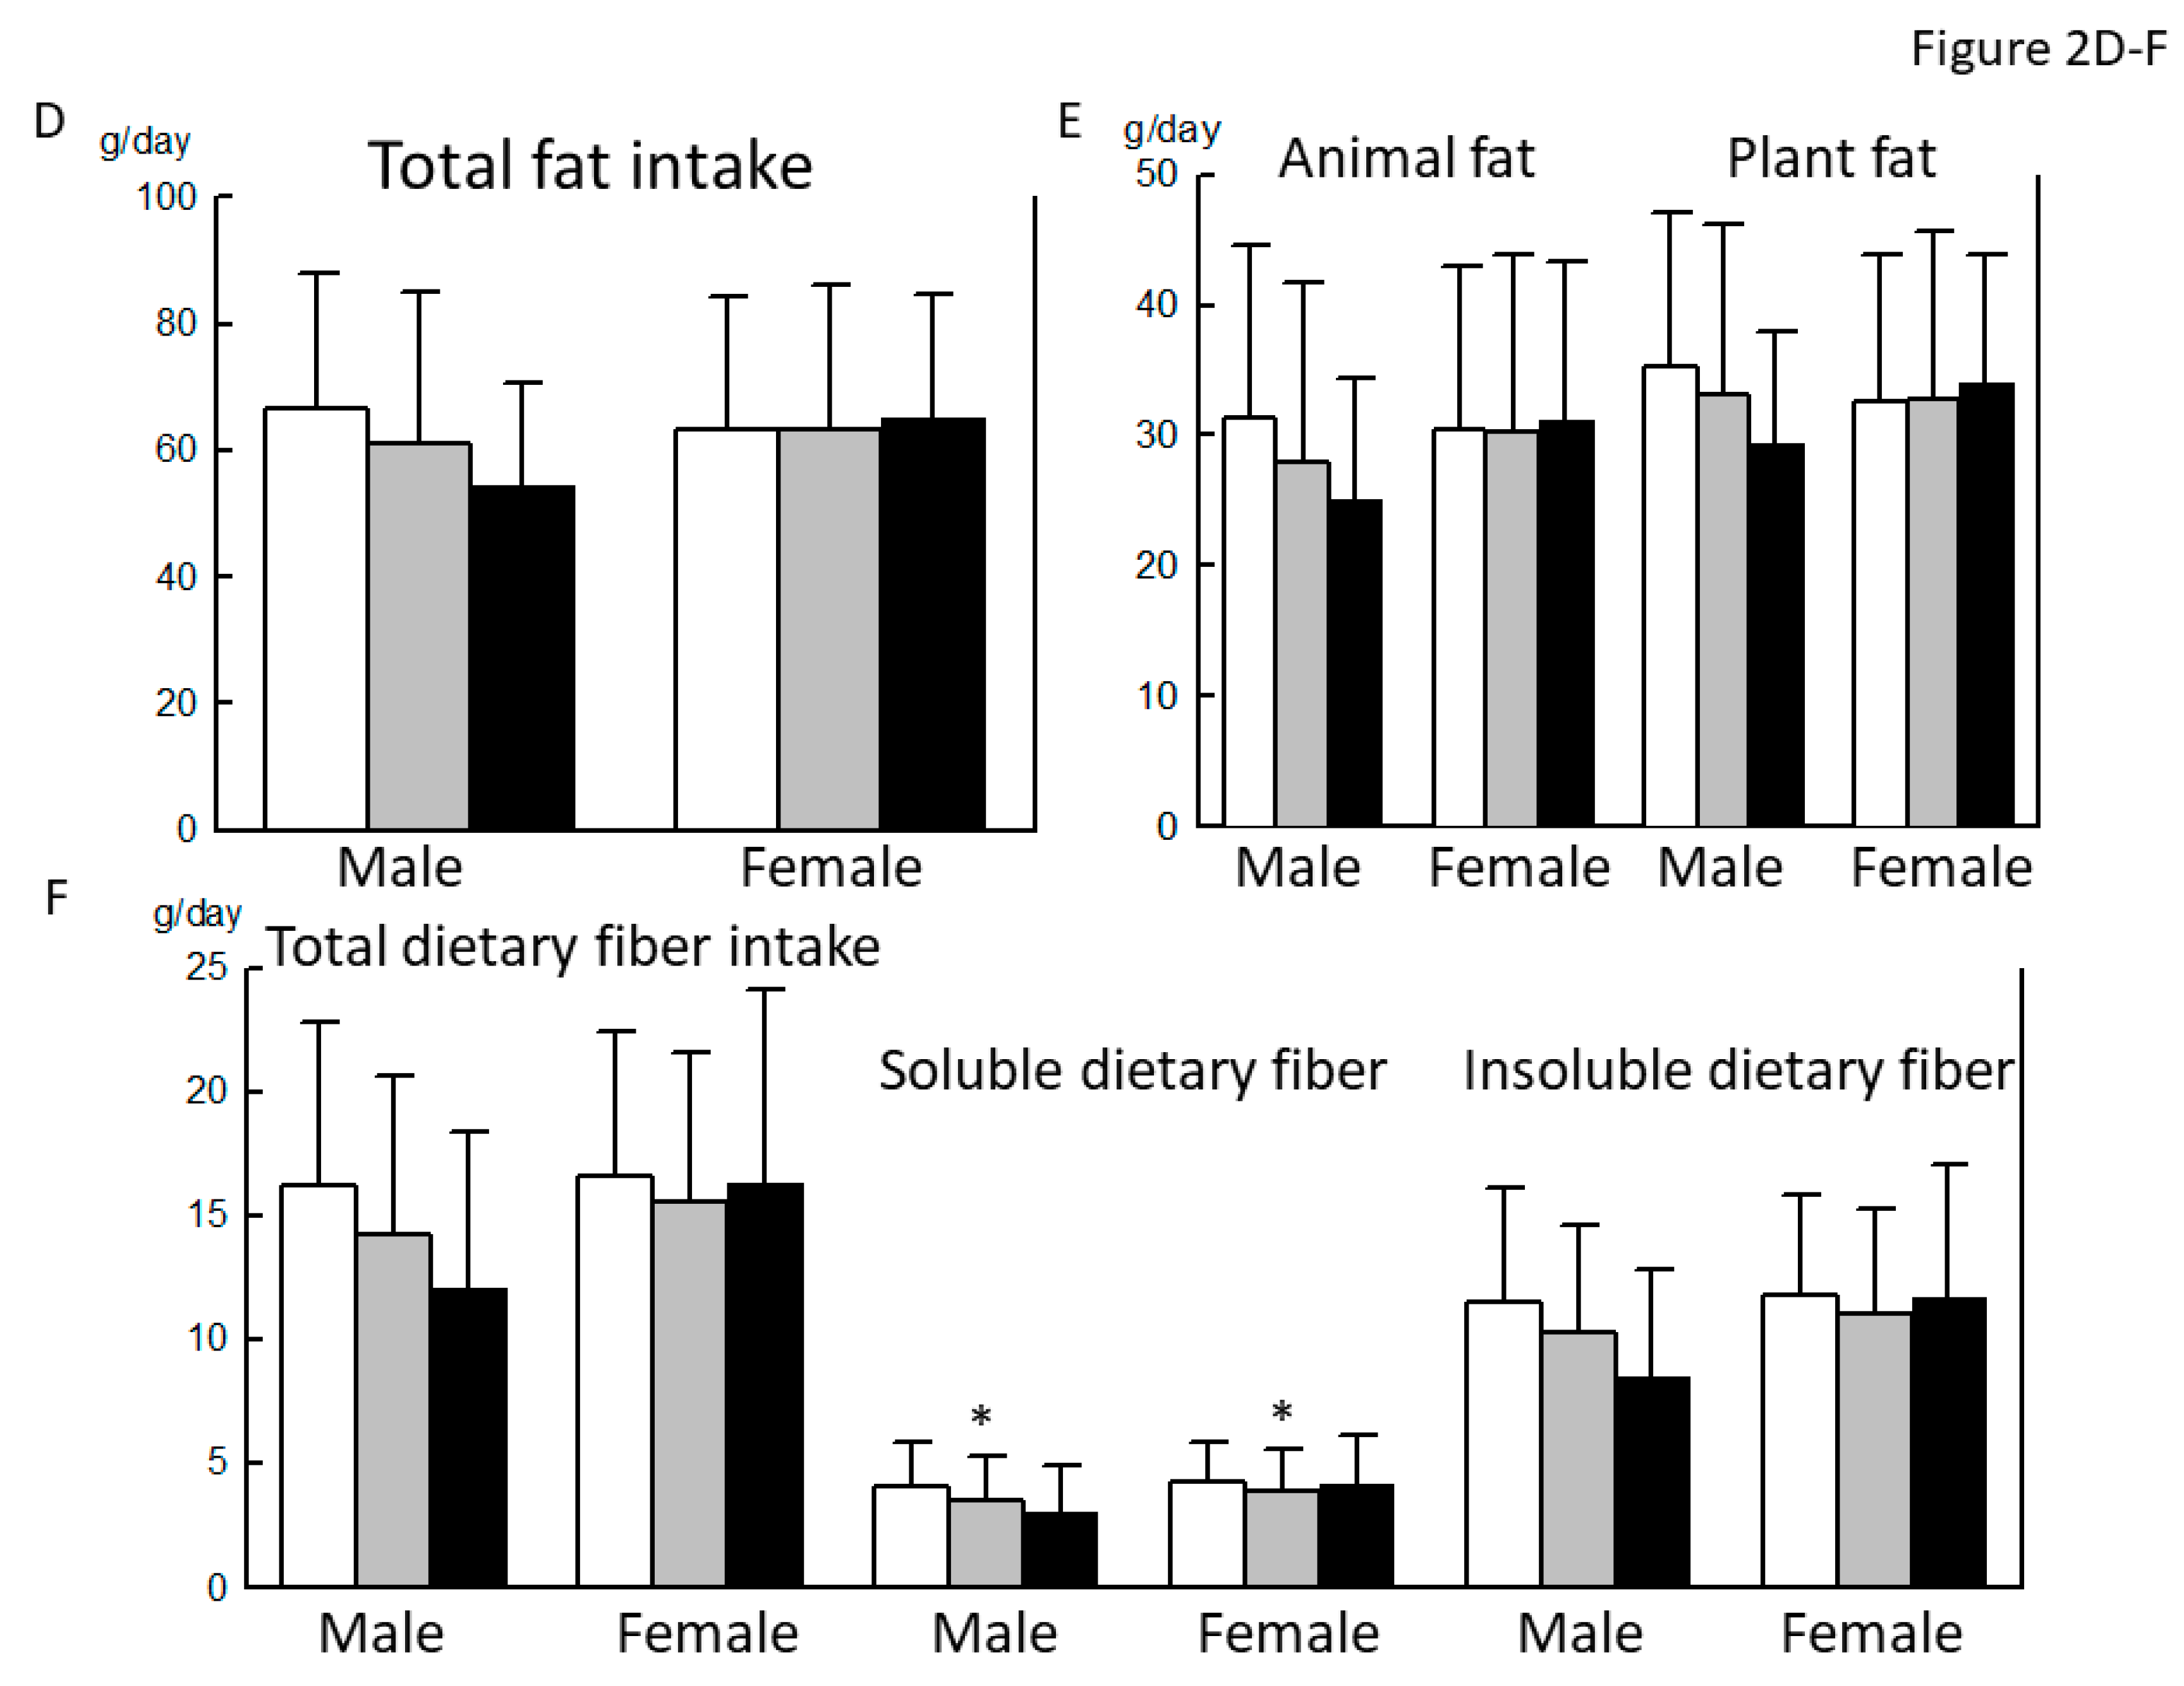
3.3. Comparison of the Basic Characteristics, Nutrient Intake, and Dietary Habits between Robust, Prefrail, and Frail Individuals, Diagnosed by the J-CHS Criteria
3.4. Reevaluation of Significant Associations of the Intakes of Soluble Dietary Fiber, Potassium, Folate, and Vitamin C with a Frail Status by ANCOVA
4. Discussion
Author Contributions
Funding
Acknowledgments
Conflicts of Interest
References
- Bergman, H.; Ferrucci, L.; Guralnik, J.; Hogan, D.B.; Hummel, S.; Karunananthan, S.; Wolfson, C. Frailty: An emerging research and clinical paradigm--issues and controversies. J. Gerontol. A Biol. Sci. Med. Sci. 2007, 62, 731–737. [Google Scholar] [CrossRef] [PubMed]
- Morley, J.E.; Vellas, B.; van Kan, G.A.; Anker, S.D.; Bauer, J.M.; Bernabei, R.; Cesari, M.; Chumlea, W.C.; Doehner, W.; Evans, J.; et al. Frailty consensus: A call to action. J. Am. Med. Dir. Assoc. 2013, 14, 392–397. [Google Scholar] [CrossRef]
- Xue, Q.L.; Bandeen-Roche, K.; Varadhan, R.; Zhou, J.; Fried, L.P. Initial manifestations of frailty criteria and the development of frailty phenotype in the Women’s Health and Aging Study II. J. Gerontol. A Biol. Sci. Med. Sci. 2008, 63, 984–990. [Google Scholar] [CrossRef] [PubMed]
- Bonnefoy, M.; Berrut, G.; Lesourd, B.; Ferry, M.; Gilbert, T.; Guerin, O.; Hanon, O.; Jeandel, C.; Paillaud, E.; Raynaud-Simon, A.; et al. Frailty and nutrition: Searching for evidence. J. Nutr. Health Aging 2015, 19, 250–257. [Google Scholar] [CrossRef] [PubMed]
- Yannakoulia, M.; Ntanasi, E.; Anastasiou, C.A.; Scarmeas, N. Frailty and nutrition: From epidemiological and clinical evidence to potential mechanisms. Metabolism 2017, 68, 64–76. [Google Scholar] [CrossRef] [PubMed]
- Bartali, B.; Frongillo, E.A.; Bandinelli, S.; Lauretani, F.; Semba, R.D.; Fried, L.P.; Ferrucci, L. Low nutrient intake is an essential component of frailty in older persons. J. Gerontol. A Biol. Sci. Med. Sci. 2006, 61, 589–593. [Google Scholar] [CrossRef] [PubMed]
- Kim, H.K.; Suzuki, T.; Saito, K.; Yoshida, H.; Kobayashi, H.; Kato, H.; Katayama, M. Effects of exercise and amino acid supplementation on body composition and physical function in community-dwelling elderly Japanese sarcopenic women: A randomized controlled trial. J. Am. Geriatr. Soc. 2012, 60, 16–23. [Google Scholar] [CrossRef]
- Kobayashi, S.; Murakami, K.; Sasaki, S.; Okubo, H.; Hirota, N.; Notsu, A.; Fukui, M.; Date, C. Comparison of relative validity of food group intakes estimated by comprehensive and brief-type self-administered diet history questionnaires against 16 d dietary records in Japanese adults. Public Health Nutr. 2011, 14, 1200–1211. [Google Scholar] [CrossRef]
- Lorenzo-Lopez, L.; Maseda, A.; de Labra, C.; Regueiro-Folgueira, L.; Rodriguez-Villamil, J.L.; Millan-Calenti, J.C. Nutritional determinants of frailty in older adults: A systematic review. BMC Geriatr. 2017, 17, 108. [Google Scholar] [CrossRef]
- Rahi, B.; Colombet, Z.; Gonzalez-Colaco Harmand, M.; Dartigues, J.F.; Boirie, Y.; Letenneur, L.; Feart, C. Higher Protein but Not Energy Intake Is Associated with a Lower Prevalence of Frailty Among Community-Dwelling Older Adults in the French Three-City Cohort. J. Am. Med. Dir. Assoc. 2016, 17, 672.e7–672.e11. [Google Scholar] [CrossRef]
- Yamaguchi, M.; Yamada, Y.; Nanri, H.; Nozawa, Y.; Itoi, A.; Yoshimura, E.; Watanabe, Y.; Yoshida, T.; Yokoyama, K.; Goto, C.; et al. Association between the Frequency of Protein-Rich Food Intakes and Kihon-Checklist Frailty Indices in Older Japanese Adults: The Kyoto-Kameoka Study. Nutrients 2018, 10, 84. [Google Scholar] [CrossRef]
- Chevalier, S.; Gougeon, R.; Nayar, K.; Morais, J.A. Frailty amplifies the effects of aging on protein metabolism: Role of protein intake. Am. J. Clin. Nutr. 2003, 78, 422–429. [Google Scholar] [CrossRef] [PubMed]
- Morais, J.A.; Chevalier, S.; Gougeon, R. Protein turnover and requirements in the healthy and frail elderly. J. Nutr. Health Aging 2006, 10, 272–283. [Google Scholar] [PubMed]
- Coelho-Junior, H.J.; Rodrigues, B.; Uchida, M.; Marzetti, E. Low Protein Intake Is Associated with Frailty in Older Adults: A Systematic Review and Meta-Analysis of Observational Studies. Nutrients 2018, 10, 1334. [Google Scholar] [CrossRef] [PubMed]
- Balboa-Castillo, T.; Struijk, E.A.; Lopez-Garcia, E.; Banegas, J.R.; Rodriguez-Artalejo, F.; Guallar-Castillon, P. Low vitamin intake is associated with risk of frailty in older adults. Age Ageing 2018, 47, 872–879. [Google Scholar] [CrossRef] [PubMed]
- Satake, S.; Senda, K.; Hong, Y.J.; Miura, H.; Endo, H.; Sakurai, T.; Kondo, I.; Toba, K. Validity of the Kihon Checklist for assessing frailty status. Geriatr. Gerontol. Int. 2016, 16, 709–715. [Google Scholar] [CrossRef] [PubMed]
- Fried, L.P.; Tangen, C.M.; Walston, J.; Newman, A.B.; Hirsch, C.; Gottdiener, J.; Seeman, T.; Tracy, R.; Kop, W.J.; Burke, G.; et al. Frailty in older adults: Evidence for a phenotype. J. Gerontol. A Biol. Sci. Med. Sci. 2001, 56, M146–M156. [Google Scholar] [CrossRef] [PubMed]
- Shimada, H.; Makizako, H.; Doi, T.; Yoshida, D.; Tsutsumimoto, K.; Anan, Y.; Uemura, K.; Ito, T.; Lee, S.; Park, H.; et al. Combined prevalence of frailty and mild cognitive impairment in a population of elderly Japanese people. J. Am. Med. Dir. Assoc. 2013, 14, 518–524. [Google Scholar] [CrossRef]
- Kobayashi, S.; Honda, S.; Murakami, K.; Sasaki, S.; Okubo, H.; Hirota, N.; Notsu, A.; Fukui, M.; Date, C. Both comprehensive and brief self-administered diet history questionnaires satisfactorily rank nutrient intakes in Japanese adults. J. Epidemiol. 2012, 22, 151–159. [Google Scholar] [CrossRef]
- Ministry of Education, C., Sports, Science and Technology. The 5th revision of Standard Food Composition Table of Japanese Foods (in Japanese). Available online: http://www.mext.go.jp/b_menu/shingi/gijyutu/gijyutu3/houkoku/1298713.htm (accessed on 1 February 2012).
- Shinmura, K. Cardiac Senescence, Heart Failure, and Frailty: A Triangle in Elderly People. Keio. J. Med. 2016, 65, 25–32. [Google Scholar] [CrossRef]
- Lieber, C.S. The influence of alcohol on nutritional status. Nutr. Rev. 1988, 46, 241–254. [Google Scholar] [CrossRef] [PubMed]
- Fedarko, N.S. The biology of aging and frailty. Clin. Geriatr. Med. 2011, 27, 27–37. [Google Scholar] [CrossRef]
- Fulop, T.; Larbi, A.; Witkowski, J.M.; McElhaney, J.; Loeb, M.; Mitnitski, A.; Pawelec, G. Aging, frailty and age-related diseases. Biogerontology 2010, 11, 547–563. [Google Scholar] [CrossRef] [PubMed]
- Bauer, J.; Biolo, G.; Cederholm, T.; Cesari, M.; Cruz-Jentoft, A.J.; Morley, J.E.; Phillips, S.; Sieber, C.; Stehle, P.; Teta, D.; et al. Evidence-based recommendations for optimal dietary protein intake in older people: A position paper from the PROT-AGE Study Group. J. Am. Med. Dir. Assoc. 2013, 14, 542–559. [Google Scholar] [CrossRef]
- Vina, E.R.; Kwoh, C.K. Epidemiology of osteoarthritis: Literature update. Curr. Opin. Rheumatol. 2018, 30, 160–167. [Google Scholar] [CrossRef] [PubMed]
- Holscher, H.D. Dietary fiber and prebiotics and the gastrointestinal microbiota. Gut Microbes 2017, 8, 172–184. [Google Scholar] [CrossRef] [PubMed]
- Koh, A.; De Vadder, F.; Kovatcheva-Datchary, P.; Backhed, F. From Dietary Fiber to Host Physiology: Short-Chain Fatty Acids as Key Bacterial Metabolites. Cell 2016, 165, 1332–1345. [Google Scholar] [CrossRef]
- Cai, D.; Zhao, S.; Li, D.; Chang, F.; Tian, X.; Huang, G.; Zhu, Z.; Liu, D.; Dou, X.; Li, S.; et al. Nutrient Intake Is Associated with Longevity Characterization by Metabolites and Element Profiles of Healthy Centenarians. Nutrients 2016, 8, 564. [Google Scholar] [CrossRef]
- Shikany, J.M.; Barrett-Connor, E.; Ensrud, K.E.; Cawthon, P.M.; Lewis, C.E.; Dam, T.T.; Shannon, J.; Redden, D.T.; Osteoporotic Fractures in Men (MrOS) Research Group. Macronutrients, diet quality, and frailty in older men. J. Gerontol. A Biol. Sci. Med. Sci. 2014, 69, 695–701. [Google Scholar] [CrossRef]


| Total (n = 800) | Male (n = 254) | Female (n = 546) | p-Value | |
|---|---|---|---|---|
| Age (years) | 72.6 ± 5.8 | 73.1 ± 6.2 | 72.4 ± 5.6 | n.s. |
| Height (cm) | 155.5 ± 8.1 | 164.1 ± 5.8 | 151.5 ± 5.6 | <0.001 |
| BW (kg) | 54.9 ± 9.4 | 62.7 ± 9.0 | 51.3 ± 7.1 | <0.001 |
| BMI (kg/m2) | 22.6 ± 2.9 | 23.2 ± 2.9 | 22.3 ± 2.9 | <0.001 |
| SBP (mmHg) | 138.9 ± 17.6 | 137.5 ± 18.2 | 139.6 ± 17.4 | n.s. |
| DBP (mmHg) | 80.5 ± 10.7 | 80.3 ± 11.4 | 80.6 ± 10.3 | n.s. |
| MMSE score | 28.3 ± 1.8 | 28.2 ± 1.8 | 28.4 ± 1.8 | n.s. |
| Smoking habit | ||||
| Never | 579 (72.4) | 71 (28.0) | 508 (93.0) | |
| Past | 181 (22.6) | 155 (61.0) | 26 (4.8) | |
| Current | 40 (5.0) | 28 (11.0) | 12 (2.2) | <0.001 |
| Alcohol drinking | 349 (43.6) | 192 (75.6) | 157 (28.8) | <0.001 |
| Exercise habit | 508 (63.5) | 154 (60.6) | 354 (64.8) | n.s. |
| Comorbidities | ||||
| Hypertension | 362 (45.3) | 128 (50.4) | 234 (42.9) | 0.046 |
| DM | 98 (12.3) | 50 (19.7) | 48 (8.8) | <0.001 |
| Dyslipidemia | 192 (24.0) | 44 (17.3) | 148 (27.1) | 0.003 |
| Chronic liver disease | 34 (4.3) | 16 (6.3) | 18 (3.3) | n.s. |
| CKD | 27 (3.4) | 11 (4.3) | 16 (2.9) | n.s. |
| CVD | 70 (8.8) | 34 (13.4) | 36 (6.6) | 0.002 |
| Gastrointestinal disease | 48 (6.0) | 18 (7.1) | 30 (5.5) | n.s. |
| Asthma and COPD | 24 (3.0) | 7 (2.8) | 17 (3.1) | n.s. |
| Thyroid disease | 35 (4.4) | 8 (3.1) | 27 (4.9) | n.s. |
| Osteoporosis | 97 (12.1) | 3 (1.2) | 94 (17.2) | <0.001 |
| RA and collagen disease | 17 (2.1) | 4 (1.6) | 13 (2.4) | n.s. |
| History of cancer | 58 (7.3) | 30 (11.8) | 28 (4.2) | <0.001 |
| Frailty diagnosis by the KCL criteria | (n = 800) | (n = 254) | (n = 546) | |
| Robust | 476 (59.5) | 163 (64.3) | 313 (57.3) | |
| Prefrail | 257 (32.1) | 72 (28.2) | 185 (33.9) | |
| Frail | 67 (8.4) | 19 (7.5) | 48 (8.8) | n.s. |
| Frailty diagnosis by the J-CHS criteria | (n = 796) | (n = 252) | (n = 544) | |
| Robust | 331 (41.6) | 104 (41.3) | 227 (41.7) | |
| Prefrail | 436 (54.8) | 139 (55.2) | 294 (54.0) | |
| Frail | 32 (4.0) | 9 (3.6) | 23 (4.2) | n.s. |
| Sarcopenia diagnosis by the AWGS criteria | (n = 788) | (n = 250) | (n = 538) | |
| Robust | 542 (68.8) | 182 (72.8) | 360 (66.9) | |
| Presarcopenia | 217 (27.5) | 65 (26.0) | 152 (28.3) | |
| Sarcopenia | 29 (3.7) | 3 (1.2) | 26 (4.8) | 0.026 |
| Robust (n = 163) | Prefrail (n = 72) | Frail (n = 19) | p-Value | |
|---|---|---|---|---|
| Age (years) | 72.4 ± 5.6 | 74.7 ± 7.0 | 73.3 ± 6.9 | 0.026 (R vs. P) |
| Height (cm) | 164.3 ± 5.8 | 163.6 ± 6.4 | 163.7 ± 4.0 | n.s. |
| BW (kg) | 63.2 ± 8.5 | 62.1 ± 10.1 | 60.0 ± 8.2 | n.s. |
| BMI (kg/m2) | 23.4 ± 2.8 | 23.1 ± 3.2 | 22.4 ± 3.1 | n.s. |
| SBP (mmHg) | 137.5 ± 19.0 | 136.9 ± 15.9 | 138.7 ± 19.8 | n.s. |
| DBP (mmHg) | 81.4 ± 11.6 | 77.7 ± 10.6 | 80.9 ± 11.3 | n.s. |
| MMSE score | 28.3 ± 1.8 | 28.0 ± 1.9 | 28.1 ± 1.9 | n.s. |
| Smoking Habit | ||||
| Never | 48 (29.4) | 18 (25.0) | 5 (26.3) | |
| Past | 98 (60.1) | 49 (68.1) | 8 (42.1) | |
| Current | 17 (10.4) | 5 (6.9) | 6 (31.6) | 0.033 |
| Alcohol drinking | 126 (77.3) | 51 (70.8) | 15 (78.9) | n.s. |
| Exercise habit | 106 (65.0) | 39 (54.2) | 9 (47.4) | n.s. |
| Comorbidities | ||||
| Hypertension | 81 (49.7) | 38 (52.8) | 9 (47.4) | n.s. |
| DM | 32 (19.6) | 17 (23.6) | 1 (5.3) | n.s. |
| Dyslipidemia | 26 (16.0) | 17 (23.6) | 1 (5.3) | n.s. |
| Chronic liver disease | 10 (6.1) | 4 (5.6) | 2 (10.5) | n.s. |
| CKD | 9 (5.5) | 1 (1.4) | 1 (5.3) | n.s. |
| CVD | 20 (12.3) | 13 (18.1) | 1 (5.3) | n.s. |
| Gastrointestinal disease | 13 (8.0) | 4 (5.6) | 1 (5.3) | n.s. |
| Asthma/ COPD | 5 (3.1) | 1 (1.4) | 1 (5.3) | n.s. |
| Thyroid disease | 6 (3.7) | 2 (2.8) | 0 | n.s. |
| Osteoporosis | 1 (0.6) | 2 (2.8) | 0 | |
| RA and collagen disease | 2 (1.2) | 2 (2.8) | 0 | |
| History of cancer | 21 (12.9) | 7 (9.7) | 2 (10.5) | n.s. |
| Robust (n = 163) | Prefrail (n = 72) | Frail (n = 19) | p-value | |
| Energy intake (kcal/day) | 2250 ± 633 | 2239 ± 623 | 1807 ± 575 | 0.021 (R vs. F) 0.048 (P vs. F) |
| Energy intake/BW (kcal/day/kg) | 36.2 ± 11.2 | 36.9 ± 11.9 | 30.6 ± 10.1 | n.s. |
| Macro- and micronutrients | ||||
| Carbohydrate (% energy/day) | 51.4 ± 8.3 | 50.3 ± 8.1 | 49.8 ± 8.5 | n.s. |
| Total protein (% energy/day) | 15.5 ± 3.0 | 15.8 ± 3.6 | 14.4 ± 3.8 | n.s. |
| Fat (% energy/day) | 25.2 ± 5.0 | 26.7 ± 4.8 | 24.6 ± 8.0 | n.s. |
| Sodium (g/day) | 5.14 ± 1.74 | 5.18 ± 1.63 | 4.05 ± 1.26 | 0.021 (R vs. F) 0.026 (P vs. F) |
| Potassium (g/day) | 3.32 ± 1.32 | 3.18 ± 1.22 | 2.37 ± 0.98 | 0.007 (R vs. F) 0.039 (F vs. F) |
| Calcium (mg/day) | 780 ± 365 | 768 ± 314 | 502 ± 245 | 0.003 (R vs. F) 0.009 (P vs. F) |
| Magnesium (mg/day) | 332 ± 124 | 316 ± 109 | 239 ± 87 | 0.003 (R vs. F) 0.031 (P vs. F) |
| Phosphorus (mg/day) | 1388 ± 555 | 1377 ± 500 | 980 ± 387 | 0.005 (R vs. F) 0.011 (P vs. F) |
| Iron (mg/day) | 10.2 ± 4.1 | 9.8 ± 3.8 | 7.2 ± 3.1 | 0.005 (R vs. F) 0.033 (P vs. F) |
| Zinc (mg/day) | 9.98 ± 3.39 | 9.88 ± 3.43 | 7.53 ± 2.77 | 0.008 (R vs. F) 0.019 (P vs. F) |
| Manganese (mg/day) | 3.82 ± 1.32 | 3.49 ± 1.28 | 2.93 ± 1.14 | n.s. |
| Copper (mg/day) | 1.43 ± 0.49 | 1.34 ± 0.45 | 1.07 ± 0.44 | 0.007 (R vs. F) |
| Retinol equivalent (μg /day) | 1104 ± 867 | 1099 ± 833 | 792 ± 651 | n.s. |
| α-Carotene (μg/day) | 507 ± 402 | 437 ± 373 | 333 ± 262 | n.s. |
| β-Carotene (equivalent μg/day) | 5098 ± 3113 | 4507 ± 2948 | 3043 ± 1973 | 0.014 (R vs. F) |
| Vitamin D (μg/day) | 22.3 ± 16.5 | 21.8 ± 15.5 | 13.6 ± 11.1 | n.s. |
| α-Tocopherol (mg/day) | 9.32 ± 3.61 | 9.27 ± 3.45 | 6.53 ± 3.06 | 0.004 (R vs. F) 0.008 (P vs. F) |
| γ-Tocopherol (mg/day) | 15.0 ± 5.4 | 15.4 ± 5.4 | 12.1 ± 6.1 | 0.049 (P vs. F) |
| Vitamin K (mg/day) | 430 ± 239 | 369 ± 208 | 295 ± 176 | 0.038 (R vs. F) |
| Vitamin B1 (mg/day) | 0.95 ± 0.36 | 0.95 ± 0.35 | 0.68 ± 0.29 | 0.007 (R vs. F) 0.012 (P vs. F) |
| Vitamin B2 (mg/day) | 1.69 ± 0.65 | 1.67 ± 0.64 | 1.23 ± 0.50 | 0.009 (R vs. F) 0.021 (P vs. F) |
| Niacin (mg/day) | 21.0 ± 8.3 | 21.1 ± 8.6 | 16.5 ± 7.2 | n.s. |
| Vitamin B6 (mg/day) | 1.64 ± 0.62 | 1.59 ± 0.60 | 1.26 ± 0.53 | 0.028 (R vs. F) |
| Vitamin B12 (μg/day) | 13.7 ± 8.7 | 13.9 ± 8.5 | 9.9 ± 7.2 | n.s. |
| Folate (μg/day) | 471 ± 205 | 425 ± 188 | 329 ± 151 | 0.009 (R vs. F) |
| Pantothenic acid (mg/day) | 8.22 ± 2.99 | 8.07 ± 2.93 | 6.09 ± 2.53 | 0.009 (R vs. F) 0.026 (P vs. F) |
| Vitamin C (mg/day) | 161 ± 83 | 144 ± 73 | 104 ± 57 | 0.008 (R vs. F) |
| Cryptoxanthin (μg/day) | 427 ± 402 | 405 ± 358 | 199 ± 192 | 0.036 (R vs. F) |
| Food group (g/day) | ||||
| Cereals | 441 ± 170 | 424 ± 186 | 364 ± 161 | n.s. |
| Potatoes | 64.1 ± 60.6 | 60.2 ± 57.4 | 56.0 ± 50.3 | n.s. |
| Sugar and sweeteners | 6.01 ± 4.10 | 7.20 ± 5.43 | 4.28 ± 4.55 | 0.036 (P vs. F) |
| Soy products | 90.8 ± 56.5 | 81.1 ± 50.5 | 62.3 ± 47.9 | n.s. |
| Total vegetables | 355 ± 204 | 322 ± 186 | 245 ± 142 | n.s. |
| Fruits | 159 ± 137 | 152 ± 119 | 119 ± 83 | 0.041 (R vs. F) |
| Fish and shellfish | 114 ± 77 | 115 ± 79 | 79 ± 77 | n.s. |
| Meats | 72.1 ± 41.5 | 81.7 ± 54.7 | 66.1 ± 52.9 | n.s. |
| Eggs | 49.0 ± 31.8 | 51.1 ± 36.3 | 32.2 ± 26.2 | n.s. |
| Dairy products | 174 ± 126 | 199 ± 146 | 115 ± 141 | 0.039 (P vs. F) |
| Oil | 12.0 ± 5.3 | 12.6 ± 5.8 | 10.3 ± 6.9 | n.s. |
| Confectioneries | 64.9 ± 53.9 | 62.0 ± 48.9 | 42.8 ± 49.8 | n.s. |
| Robust (n = 313) | Prefrail (n = 185) | Frail (n = 48) | p-Value | |
|---|---|---|---|---|
| Age (years) | 71.7 ± 5.5 | 72.9 ± 5.6 | 75.4 ± 5.7 | <0.001 (R vs. F) 0.042 (R vs. P) 0.018 (P vs. F) |
| Height (cm) | 152.1 ± 5.3 | 151.2 ± 5.7 | 148.5 ± 6.2 | <0.001 (R vs. F) 0.009 (P vs. F) |
| BW (kg) | 51.8 ± 7.0 | 50.6 ± 7.1 | 50.4 ± 7.6 | n.s. |
| BMI (kg/m2) | 22.4 ± 2.7 | 22.2 ± 3.0 | 22.8 ± 3.5 | n.s. |
| SBP (mmHg) | 139.5 ± 16.6 | 139.1 ± 18.5 | 142.3 ± 17.9 | n.s. |
| DBP (mmHg) | 80.8 ± 10.1 | 80.4 ± 10.9 | 80.6 ± 9.6 | n.s. |
| MMSE score | 28.5 ± 1.8 | 28.4 ± 1.8 | 28.0 ± 1.8 | n.s. |
| Smoking Habit Never | 293 (93.6) | 170 (91.9) | 45 (93.8) | |
| Past | 13 (4.2) | 11 (5.9) | 2 (4.2) | |
| Current | 7 (2.2) | 4 (2.2) | 1 (2.1) | n.s. |
| Alcohol drinking | 99 (31.6) | 52 (28.1) | 6 (12.5) | 0.024 |
| Exercise habit | 215 (68.7) | 119 (64.3) | 20 (41.7) | 0.001 |
| Comorbidities | ||||
| Hypertension | 125 (39.9) | 84 (45.4) | 25 (52.1) | n.s. |
| DM | 24 (7.7) | 17 (9.2) | 7 (14.6) | n.s. |
| Dyslipidemia | 88 (28.1) | 49 (26.5) | 11 (22.9) | n.s. |
| Chronic liver disease | 11 (3.5) | 4 (2.2) | 3 (6.3) | n.s. |
| CKD | 6 (1.9) | 5 (2.7) | 5 (10.4) | 0.005 |
| CVD | 18 (5.8) | 16 (8.6) | 4 (8.3) | n.s. |
| Gastrointestinal disease | 13 (4.2) | 9 (4.9) | 8 (16.7) | 0.002 |
| Asthma/ COPD | 4 (1.3) | 10 (5.4) | 3 (6.3) | 0.016 |
| Thyroid disease | 13 (4.2) | 13 (7.0) | 1 (2.1) | n.s. |
| Osteoporosis | 42 (13.4) | 40 (21.6) | 12 (25.0) | 0.021 |
| RA and collagen disease | 9 (2.9) | 4 (2.2) | 0 | |
| History of cancer | 12 (3.8) | 10 (5.4) | 6 (12.5) | 0.039 |
| Robust (n = 313) | Prefrail (n = 185) | Frail (n = 48) | p-value | |
| Energy intake (kcal/day) | 1928 ± 537 | 2032 ± 594 | 1994 ± 624 | 0.031 (R vs. P) |
| Energy intake/BW (kcal/day/kg) | 38.0 ± 12.3 | 40.9 ± 13.4 | 40.4 ± 13.6 | n.s. |
| Macro- and micronutrients | ||||
| Carbohydrate (% energy/day) | 51.9 ± 7.0 | 51.9 ± 7.7 | 52.2 ± 6.7 | n.s. |
| Total protein (% energy/day) | 18.0 ± 3.3 | 17.8 ± 3.5 | 17.2 ± 3.1 | n.s. |
| Fat (% energy/day) | 28.7 ± 4.8 | 28.6 ± 5.2 | 29.5 ± 4.8 | n.s. |
| Sodium (g/day) | 4.66 ± 1.53 | 4.92 ± 1.56 | 4.71 ± 1.77 | n.s. |
| Potassium (g/day) | 3.41 ± 1.14 | 3.52 ± 1.29 | 3.33 ± 1.27 | n.s. |
| Calcium (mg/day) | 790 ± 291 | 827 ± 336 | 737 ± 272 | n.s. |
| Magnesium (mg/day) | 321 ± 105 | 334 ± 115 | 311 ± 114 | n.s. |
| Phosphorus (mg/day) | 1364 ± 483 | 1422 ± 519 | 1340 ± 542 | n.s. |
| Iron (mg/day) | 10.2 ± 3.5 | 10.5 ± 3.6 | 10.1 ± 3.8 | n.s. |
| Zinc (mg/day) | 9.56 ± 3.07 | 9.90 ± 3.08 | 9.58 ± 3.55 | n.s. |
| Manganese (mg/day) | 3.86 ± 1.11 | 3.92 ± 1.22 | 3.70 ± 1.20 | n.s. |
| Copper (mg/day) | 1.34 ± 0.40 | 1.39 ± 0.45 | 1.35 ± 0.47 | n.s. |
| Retinol equivalent (μg /day) | 1019 ± 688 | 1018 ± 586 | 934 ± 478 | n.s. |
| α-Carotene (μg/day) | 649 ± 423 | 689 ± 490 | 592 ± 399 | n.s. |
| β-Carotene equivalent (μg/day) | 5820 ± 3188 | 6076 ± 3433 | 5558 ± 3201 | n.s. |
| Vitamin D (μg/day) | 24.1 ± 15.9 | 25.7 ± 16.0 | 22.2 ± 16.1 | n.s. |
| α-Tocopherol (mg/day) | 9.44 ± 3.37 | 9.93 ± 3.69 | 9.86 ± 4.16 | n.s. |
| γ-Tocopherol (mg/day) | 13.6 ± 4.8 | 14.7 ± 5.7 | 14.7 ± 5.3 | n.s. |
| Vitamin K (mg/day) | 413 ± 202 | 423 ± 216 | 399 ± 232 | n.s. |
| Vitamin B1 (mg/day) | 0.98 ± 0.33 | 1.01 ± 0.35 | 0.97 ± 0.38 | n.s. |
| Vitamin B2 (mg/day) | 1.70 ± 0.54 | 1.73 ± 0.59 | 1.66 ± 0.57 | n.s. |
| Niacin (mg/day) | 21.3 ± 8.5 | 21.9 ± 8.2 | 20.9 ± 9.8 | n.s. |
| Vitamin B6 (mg/day) | 1.63 ± 0.59 | 1.67 ± 0.61 | 1.62 ± 0.68 | n.s. |
| Vitamin B12 (μg/day) | 13.7 ± 8.1 | 14.4 ± 8.2 | 13.3 ± 9.1 | n.s. |
| Folate (μg/day) | 479 ± 178 | 484 ± 188 | 454 ± 185 | n.s. |
| Pantothenic acid (mg/day) | 8.00 ± 2.59 | 8.20 ± 2.83 | 7.99 ± 2.97 | n.s. |
| Vitamin C (mg/day) | 182 ± 75 | 183 ± 84 | 175 ± 78 | n.s. |
| Cryptoxanthin (μg/day) | 489 ± 352 | 519 ± 437 | 454 ± 331 | n.s. |
| Food group (g/day) | ||||
| Cereals | 336 ± 142 | 356 ± 147 | 348 ± 139 | n.s. |
| Potatoes | 68.9 ± 53.7 | 73.0 ± 62.2 | 74.3 ± 62.9 | n.s. |
| Sugar and sweeteners | 5.90 ± 4.15 | 6.39 ± 5.03 | 6.48 ± 4.55 | n.s. |
| Soy products | 88.0 ± 45.8 | 91.6 ± 54.1 | 84.0 ± 46.3 | n.s. |
| Total vegetables | 377 ± 186 | 392 ± 201 | 365 ± 184 | n.s. |
| Fruits | 180 ± 114 | 180 ± 135 | 178 ± 116 | n.s. |
| Fish and shellfish | 120 ± 76 | 128 ± 79 | 120 ± 100 | n.s. |
| Meats | 79.9 ± 51.5 | 77.3 ± 39.2 | 81.6 ± 60.6 | n.s. |
| Eggs | 43.9 ± 26.3 | 44.8 ± 31.0 | 54.0 ± 35.6 | n.s. |
| Dairy products | 174 ± 97 | 179 ± 119 | 159 ± 88 | n.s. |
| Oil | 10.0 ± 5.0 | 11.0 ± 5.4 | 12.0 ± 5.4 | 0.036 (R vs. F) |
| Confectioneries | 67.7 ± 50.2 | 73.3 ± 63.4 | 76.6 ± 49.0 | n.s. |
| Robust (n = 104) | Prefrail (n = 139) | Frail (n = 9) | p-Value | |
|---|---|---|---|---|
| Age (years) | 73.4 ± 5.0 | 72.8 ± 7.0 | 74.9 ± 7.0 | n.s. |
| Height (cm) | 164.4 ± 6.0 | 163.8 ± 5.8 | 165.6 ± 5.4 | n.s. |
| BW (kg) | 62.6 ± 8.7 | 62.8 ± 9.1 | 61.4 ± 11.0 | n.s. |
| BMI (kg/m2) | 23.2 ± 2.9 | 23.4 ± 2.9 | 22.4 ± 4.2 | n.s. |
| SBP (mmHg) | 136.3 ± 16.5 | 137.8 ± 19.6 | 142.6 ± 14.0 | n.s. |
| DBP (mmHg) | 78.7 ± 10.9 | 81.3 ± 11.8 | 81.9 ± 10.0 | n.s. |
| MMSE score | 28.2 ± 1.9 | 28.1 ± 1.9 | 28.3 ± 1.8 | n.s. |
| Smoking Habit | ||||
| Never | 30 (28.8) | 39 (28.3) | 2 (22.2) | |
| Past | 65 (62.5) | 83 (59.7) | 5 (55.6) | |
| Current | 9 (8.7) | 17 (12.2) | 2 (22.2) | n.s. |
| Alcohol drinking | 76 (73.1) | 108 (77.7) | 7 (77.8) | n.s. |
| Exercise habit | 104 (100.0) | 50 (75.2) | 0 | |
| Comorbidities | ||||
| Hypertension | 45 (43.3) | 77 (55.4) | 5 (55.6) | n.s. |
| DM | 26 (25.0) | 20 (14.4) | 3 (33.3) | n.s. |
| Dyslipidemia | 19 (18.3) | 24 (17.3) | 0 | |
| Chronic liver disease | 9 (8.7) | 7 (5.0) | 0 | |
| CKD | 6 (5.8) | 4 (2.9) | 1 (11.1) | n.s. |
| CVD | 17 (16.3) | 17 (12.2) | 0 | |
| Gastrointestinal disease | 9 (8.7) | 9 (6.5) | 0 | |
| Asthma/ COPD | 4 (3.8) | 2 (1.4) | 1 (11.1) | n.s. |
| Thyroid disease | 4 (3.8) | 4 (2.9) | 0 | |
| Osteoporosis | 1 (1.0) | 1 (0.7) | 1 (11.1) | 0.02 |
| RA and collagen disease | 1 (1.0) | 3 (2.2) | 0 | |
| History of cancer | 14 (13.5) | 14 (10.1) | 2 (22.2) | n.s. |
| Robust (n = 104) | Prefrail (n = 139) | Frail (n = 9) | p-value | |
| Energy intake (kcal/day) | 2305 ± 605 | 2170 ± 644 | 1809 ± 567 | n.s. |
| Energy intake/BW (kcal/day/kg) | 37.4 ± 11.0 | 35.2 ± 11.5 | 30.6 ± 11.6 | n.s. |
| Macro- and micronutrients | ||||
| Carbohydrate (% energy/day) | 50.7 ± 7.9 | 51.6 ± 8.4 | 48.4 ± 9.2 | n.s. |
| Total protein (% energy/day) | 15.8 ± 3.0 | 15.2 ± 3.3 | 16.6 ± 4.4 | n.s. |
| Fat (% energy/day) | 25.9 ± 4.6 | 25.1 ± 5.6 | 28.0 ± 6.7 | n.s. |
| Sodium (g/day) | 5.26 ± 1.63 | 4.93 ± 1.75 | 4.71 ± 1.44 | n.s. |
| Potassium (g/day) | 3.47 ± 1.31 | 3.04 ± 1.25 | 2.64 ± 1.29 | 0.029 (R vs. P) |
| Calcium (mg/day) | 814 ± 354 | 723 ± 344 | 560 ± 325 | n.s. |
| Magnesium (mg/day) | 342 ± 123 | 308 ± 116 | 265 ± 95 | n.s. |
| Phosphorus (mg/day) | 1440 ± 535 | 1300 ± 532 | 1156 ± 472 | n.s. |
| Iron (mg/day) | 10.68 ± 4.03 | 9.32 ± 3.44 | 8.15 ± 2.92 | 0.023 (R vs. P) |
| Zinc (mg/day) | 10.29 ± 3.36 | 9.46 ± 3.44 | 8.53 ± 2.68 | n.s. |
| Manganese (mg/day) | 3.83 ± 1.29 | 3.60 ± 1.34 | 2.78 ± 0.90 | n.s. |
| Copper (mg/day) | 1.46 ± 0.50 | 1.33 ± 0.47 | 1.15 ± 0.41 | n.s. |
| Retinol equivalent (μg /day) | 1210 ± 1028 | 984 ± 665 | 1094 ± 946 | n.s. |
| α-Carotene (μg/day) | 530 ± 400 | 440 ± 371 | 420 ± 479 | n.s. |
| β-Carotene equivalent (μg/day) | 5405 ± 3113 | 4401 ± 2930 | 3742 ± 3093 | 0.029 (R vs. P) |
| Vitamin D (μg/day) | 22.9 ± 16.4 | 20.3 ± 15.3 | 19.0 ± 14.6 | n.s. |
| α-Tocopherol (mg/day) | 9.69 ± 3.41 | 8.69 ± 3.69 | 7.80 ± 2.80 | n.s. |
| γ-Tocopherol (mg/day) | 15.2 ± 5.2 | 14.7 ± 5.7 | 13.9 ± 4.6 | n.s. |
| Vitamin K (mg/day) | 443 ± 238 | 380 ± 224 | 313 ± 140 | n.s. |
| Vitamin B1 (mg/day) | 1.00 ± 0.35 | 0.88 ± 0.36 | 0.81 ± 0.38 | 0.024 (R vs. P) |
| Vitamin B2 (mg/day) | 1.78 ± 0.65 | 1.57 ± 0.63 | 1.33 ± 0.56 | 0.032 (R vs. P) |
| Niacin (mg/day) | 22.0 ± 8.5 | 19.8 ± 8.3 | 17.7 ± 6.5 | n.s. |
| Vitamin B6 (mg/day) | 1.72 ± 0.61 | 1.52 ± 0.60 | 1.27 ± 0.60 | 0.026 (R vs. P) |
| Vitamin B12 (μg/day) | 14.4 ± 8.8 | 12.7 ± 8.3 | 11.5 ± 6.5 | n.s. |
| Folate (μg/day) | 493 ± 208 | 419 ± 190 | 365 ± 175 | 0.011 (R vs. P) |
| Pantothenic acid (mg/day) | 8.60 ± 3.01 | 7.67 ± 2.93 | 6.80 ± 2.61 | 0.043 (R vs. P) |
| Vitamin C (mg/day) | 171 ± 82 | 140 ± 76 | 118 ± 90 | 0.008 (R vs. P) |
| Cryptoxanthin (μg/day) | 484 ± 429 | 358 ± 325 | 358 ± 455 | n.s. |
| Food group (g/day) | ||||
| Cereals | 427 ± 166 | 438 ± 181 | 381 ± 178 | n.s. |
| Potatoes | 70.2 ± 61.5 | 56.7 ± 54.9 | 65.0 ± 82.7 | n.s. |
| Sugar and sweeteners | 6.47 ± 4.20 | 5.93 ± 4.62 | 6.95 ± 7.11 | n.s. |
| Soy products | 93.1 ± 59.9 | 81.4 ± 48.9 | 61.0 ± 34.0 | n.s. |
| Total vegetables | 369 ± 194 | 317 ± 197 | 281 ± 206 | n.s. |
| Fruits | 172 ± 150 | 137 ± 109 | 107 ± 104 | n.s. |
| Fish and shellfish | 118 ± 78 | 106 ± 74 | 96 ± 60 | n.s. |
| Meats | 80.1 ± 48.1 | 70.1 ± 46.3 | 76.7 ± 30.5 | n.s. |
| Eggs | 51.2 ± 29.7 | 45.9 ± 33.8 | 45.0 ± 35.1 | n.s. |
| Dairy products | 188 ± 122 | 174 ± 144 | 122 ± 101 | n.s. |
| Oil | 12.1 ± 5.4 | 12.0 ± 5.7 | 11.7 ± 5.3 | n.s. |
| Confectioneries | 70.7 ± 56.1 | 59.0 ± 49.9 | 30.7 ± 20.3 | 0.038 (R vs. F) |
| Robust (n = 227) | Prefrail (n = 294) | Frail (n = 23) | p-Value | |
|---|---|---|---|---|
| Age (years) | 72.2 ± 5.4 | 72.3 ± 5.5 | 76.5 ± 7.8 | 0.002 (R vs. F) 0.002 (P vs. F) |
| Height (cm) | 152.2 ± 5.2 | 151.2 ± 5.4 | 147.6 ± 7.6 | <0.001(R vs. F) 0.007 (P vs. F) |
| BW (kg) | 51.0 ± 6.4 | 51.7 ± 7.5 | 49.1 ± 8.9 | n.s. |
| BMI (kg/m2) | 22.0 ± 2.5 | 22.6 ± 3.0 | 22.5 ± 4.2 | 0.042 (R vs. P) |
| SBP (mmHg) | 138.8 ± 17.3 | 140.0 ± 17.4 | 142.6 ± 17.8 | n.s. |
| DBP (mmHg) | 80.5 ± 10.7 | 80.8 ± 10.2 | 80.4 ± 9.2 | n.s. |
| MMSE score | 28.4 ± 1.7 | 28.4 ± 1.8 | 27.6 ± 1.9 | n.s. |
| Smoking Habit | ||||
| Never | 215 (94.7) | 269 (91.5) | 22 (95.7) | |
| Past | 7 (3.1) | 19 (6.5) | 0 | |
| Current | 5 (2.2) | 6 (2.0) | 1 (4.3) | n.s. |
| Alcohol drinking | 65 (28.6) | 89 (30.3) | 2 (8.7) | n.s. |
| Exercise habit | 227 (100.0) | 121 (41.2) | 3 (13.0) | <0.001 |
| Comorbidities | ||||
| Hypertension | 90 (39.6) | 129 (43.9) | 14 (60.9) | n.s. |
| DM | 20 (8.8) | 24 (8.2) | 4 (17.4) | n.s. |
| Dyslipidemia | 50 (22.0) | 94 (32.0) | 3 (13.0) | 0.012 |
| Chronic liver disease | 5 (2.2) | 10 (3.4) | 3 (13.0) | 0.021 |
| CKD | 1 (0.4) | 12 (4.1) | 2 (8.7) | 0.009 |
| CVD | 11 (4.8) | 23 (7.8) | 2 (8.7) | n.s. |
| Gastrointestinal disease | 8 (3.5) | 18 (6.1) | 4 (17.4) | 0.017 |
| Asthma/ COPD | 4 (1.8) | 11 (3.7) | 2 (8.7) | n.s. |
| Thyroid disease | 8 (3.5) | 17 (5.8) | 2 (8.7) | n.s. |
| Osteoporosis | 29 (12.8) | 60 (20.4) | 4 (17.4) | n.s. |
| RA and collagen disease | 7 (3.1) | 4 (1.4) | 1 (4.3) | n.s. |
| History of cancer | 10 (4.4) | 15 (5.1) | 3 (13.0) | n.s. |
| Robust (n = 227) | Prefrail (n = 294) | Frail (n = 23) | p-value | |
| Energy intake (kcal/day) | 1978 ± 551 | 1962 ± 585 | 2010 ± 472 | n.s. |
| Energy intake/BW (kcal/day/kg) | 39.5 ± 12.6 | 38.7 ± 13.0 | 41.9 ± 12.3 | n.s. |
| Macro- and micronutrients | ||||
| Carbohydrate (% energy/day) | 52.0 ± 7.0 | 51.8 ± 7.5 | 53.3 ± 5.9 | n.s. |
| Total protein (% energy/day) | 18.1 ± 3.3 | 17.7 ± 3.4 | 16.8 ± 3.2 | n.s. |
| Fat (% energy/day) | 28.6 ± 4.8. | 28.8 ± 5.1 | 29.0 ± 4.5 | n.s. |
| Sodium (g/day) | 4.78 ± 1.53 | 4.73 ± 1.61 | 4.72 ± 1.57 | n.s. |
| Potassium (g/day) | 3.57 ± 1.16 | 3.33 ± 1.21 | 3.47 ± 1.42 | 0.048 (R vs. P) |
| Calcium (mg/day) | 826 ± 302 | 776 ± 301 | 819 ± 381 | n.s. |
| Magnesium (mg/day) | 334 ± 106 | 317 ± 110 | 325 ± 123 | n.s. |
| Phosphorus (mg/day) | 1414 ± 492 | 1357 ± 504 | 1379 ± 529 | n.s. |
| Iron (mg/day) | 10.6 ± 3.5 | 10.1 ± 3.6 | 10.4 ± 3.7 | n.s. |
| Zinc (mg/day) | 9,78 ± 3.11 | 9.61 ± 3.16 | 9.56 ± 3.07 | n.s. |
| Manganese (mg/day) | 3.92 ± 1.12 | 3.83 ± 1.18 | 3.87 ± 1.14 | n.s. |
| Copper (mg/day) | 1.38 ± 0.42 | 1.33 ± 0.43 | 1.41 ± 0.45 | n.s. |
| Retinol equivalent (μg /day) | 1080 ± 732 | 958 ± 555 | 1016 ± 580 | n.s. |
| α-Carotene (μg/day) | 680 ± 423 | 633 ± 445 | 703 ± 565 | n.s. |
| β-Carotene equivalent (μg/day) | 6111 ± 3083 | 5657 ± 3236 | 6295 ± 4494 | n.s. |
| Vitamin D (μg/day) | 25.5 ± 16.2 | 23.9 ± 15.8 | 21.6 ± 15.1 | n.s. |
| α-Tocopherol (mg/day) | 9.80 ± 3.33 | 9.45 ± 3.60 | 10.52 ± 4.70 | n.s. |
| γ-Tocopherol (mg/day) | 14.0 ± 4.9 | 14.0 ± 5.4 | 15.6 ± 4.5 | n.s. |
| Vitamin K (mg/day) | 432 ± 203 | 401 ± 205 | 421 ± 280 | n.s. |
| Vitamin B1 (mg/day) | 1.01 ± 0.33 | 0.97 ± 0.35 | 0.95 ± 0.33 | n.s. |
| Vitamin B2 (mg/day) | 1.75 ± 0.54 | 1.67 ± 0.57 | 1.75 ± 0.60 | n.s. |
| Niacin (mg/day) | 22.0 ± 8.3 | 21.2 ± 8.7 | 19.9 ± 8.1 | n.s. |
| Vitamin B6 (mg/day) | 1.69 ± 0.58 | 1.61 ± 0.61 | 1.60 ± 0.63 | n.s. |
| Vitamin B12 (μg/day) | 14.1 ± 7.9 | 13.8 ± 8.4 | 13.1 ± 9.0 | n.s. |
| Folate (μg/day) | 499 ± 181 | 462 ± 176 | 480 ± 224 | 0.049 (R vs. P) |
| Pantothenic acid (mg/day) | 8.31 ± 2.65 | 7.89 ± 2.73 | 8.08 ± 2.62 | n.s. |
| Vitamin C (mg/day) | 193 ± 78 | 173 ± 75 | 180 ± 103 | 0.013 (R vs. P) |
| Cryptoxanthin (μg/day) | 527 ± 378 | 474 ± 380 | 477 ± 437 | n.s. |
| Food group (g/day) | ||||
| Cereals | 340 ± 137 | 345 ± 149 | 376 ± 134 | n.s. |
| Potatoes | 76.8 ± 60.4 | 65.7 ± 55.5 | 73.4 ± 47.4 | n.s. |
| Sugar and sweeteners | 6.26 ± 4.14 | 5.94 ± 4.78 | 6.87 ± 4.50 | n.s. |
| Soy products | 91.5 ± 47.3 | 87.0 ± 49.6 | 89.9 ± 52.8 | n.s. |
| Total vegetables | 391 ± 185 | 372 ± 185 | 385 ± 262 | n.s. |
| Fruits | 193 ± 123 | 170 ± 116 | 190 ± 166 | n.s. |
| Fish and shellfish | 124 ± 75 | 120 ± 80 | 123 ± 108 | n.s. |
| Meats | 79.5 ± 50.4 | 80.6 ± 48.4 | 58.7 ± 23.2 | n.s. |
| Eggs | 44.3 ± 26.0 | 44.5 ± 29.6 | 60.1 ± 42.4 | 0.036 (R vs. F) 0.033 (P vs. F). |
| Dairy products | 179 ± 101 | 169 ± 104 | 211 ± 133 | n.s. |
| Oil | 10.4 ± 5.2 | 10.6 ± 5.2 | 11.7 ± 4.8 | n.s. |
| Confectioneries | 70.1 ± 53.8 | 71.8 ± 56.8 | 59.2 ± 39.5 | n.s. |
© 2018 by the authors. Licensee MDPI, Basel, Switzerland. This article is an open access article distributed under the terms and conditions of the Creative Commons Attribution (CC BY) license (http://creativecommons.org/licenses/by/4.0/).
Share and Cite
Tamaki, K.; Kusunoki, H.; Tsuji, S.; Wada, Y.; Nagai, K.; Itoh, M.; Sano, K.; Amano, M.; Maeda, H.; Hasegawa, Y.; et al. The Relationship between Dietary Habits and Frailty in Rural Japanese Community-Dwelling Older Adults: Cross-Sectional Observation Study Using a Brief Self-Administered Dietary History Questionnaire. Nutrients 2018, 10, 1982. https://doi.org/10.3390/nu10121982
Tamaki K, Kusunoki H, Tsuji S, Wada Y, Nagai K, Itoh M, Sano K, Amano M, Maeda H, Hasegawa Y, et al. The Relationship between Dietary Habits and Frailty in Rural Japanese Community-Dwelling Older Adults: Cross-Sectional Observation Study Using a Brief Self-Administered Dietary History Questionnaire. Nutrients. 2018; 10(12):1982. https://doi.org/10.3390/nu10121982
Chicago/Turabian StyleTamaki, Kayoko, Hiroshi Kusunoki, Shotaro Tsuji, Yosuke Wada, Koutatsu Nagai, Masako Itoh, Kyoko Sano, Manabu Amano, Hatsuo Maeda, Yoko Hasegawa, and et al. 2018. "The Relationship between Dietary Habits and Frailty in Rural Japanese Community-Dwelling Older Adults: Cross-Sectional Observation Study Using a Brief Self-Administered Dietary History Questionnaire" Nutrients 10, no. 12: 1982. https://doi.org/10.3390/nu10121982
APA StyleTamaki, K., Kusunoki, H., Tsuji, S., Wada, Y., Nagai, K., Itoh, M., Sano, K., Amano, M., Maeda, H., Hasegawa, Y., Kishimoto, H., Shimomura, S., & Shinmura, K. (2018). The Relationship between Dietary Habits and Frailty in Rural Japanese Community-Dwelling Older Adults: Cross-Sectional Observation Study Using a Brief Self-Administered Dietary History Questionnaire. Nutrients, 10(12), 1982. https://doi.org/10.3390/nu10121982