Acute Endothelial Benefits of Fat Restriction over Carbohydrate Restriction in Type 2 Diabetes Mellitus: Beyond Carbs and Fats

 ,
,
Abstract
1. Introduction
2. Materials and Methods
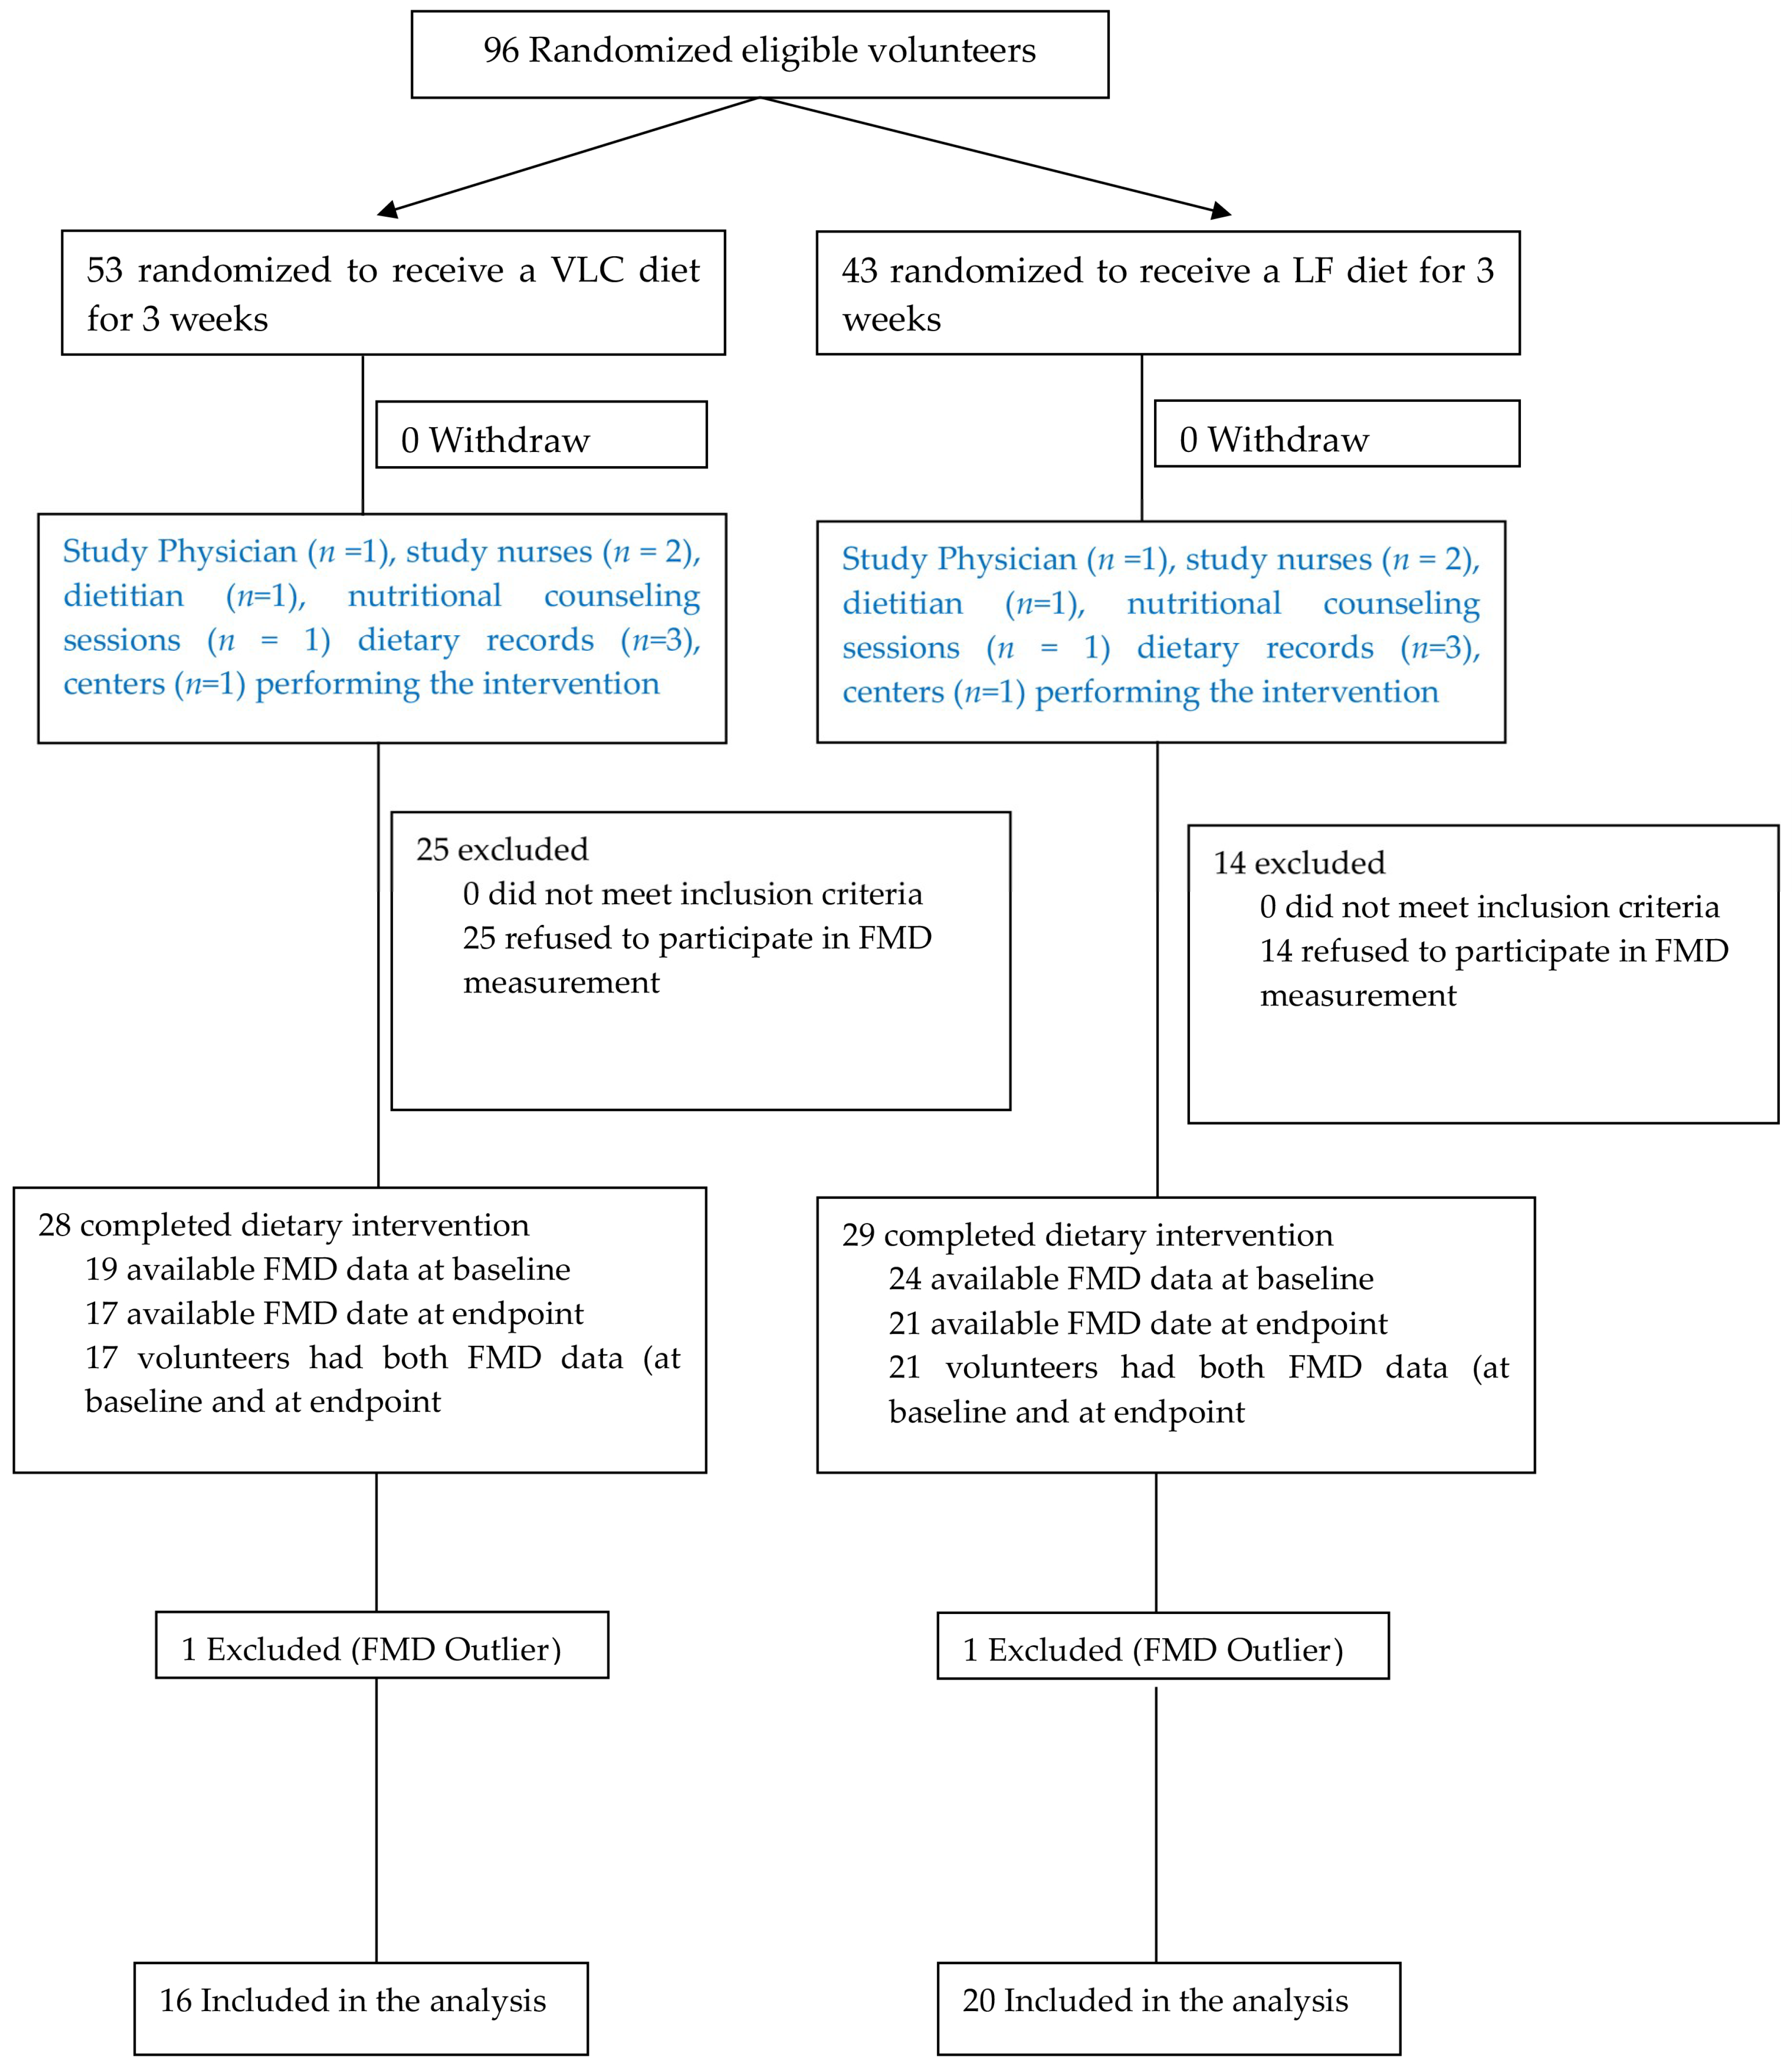
2.1. Participants and Study Design
2.2. Dietary Intervention
2.3. Body Weight and Body Composition
2.4. Liver Fat and Visceral Fat
2.5. Clinical Parameters
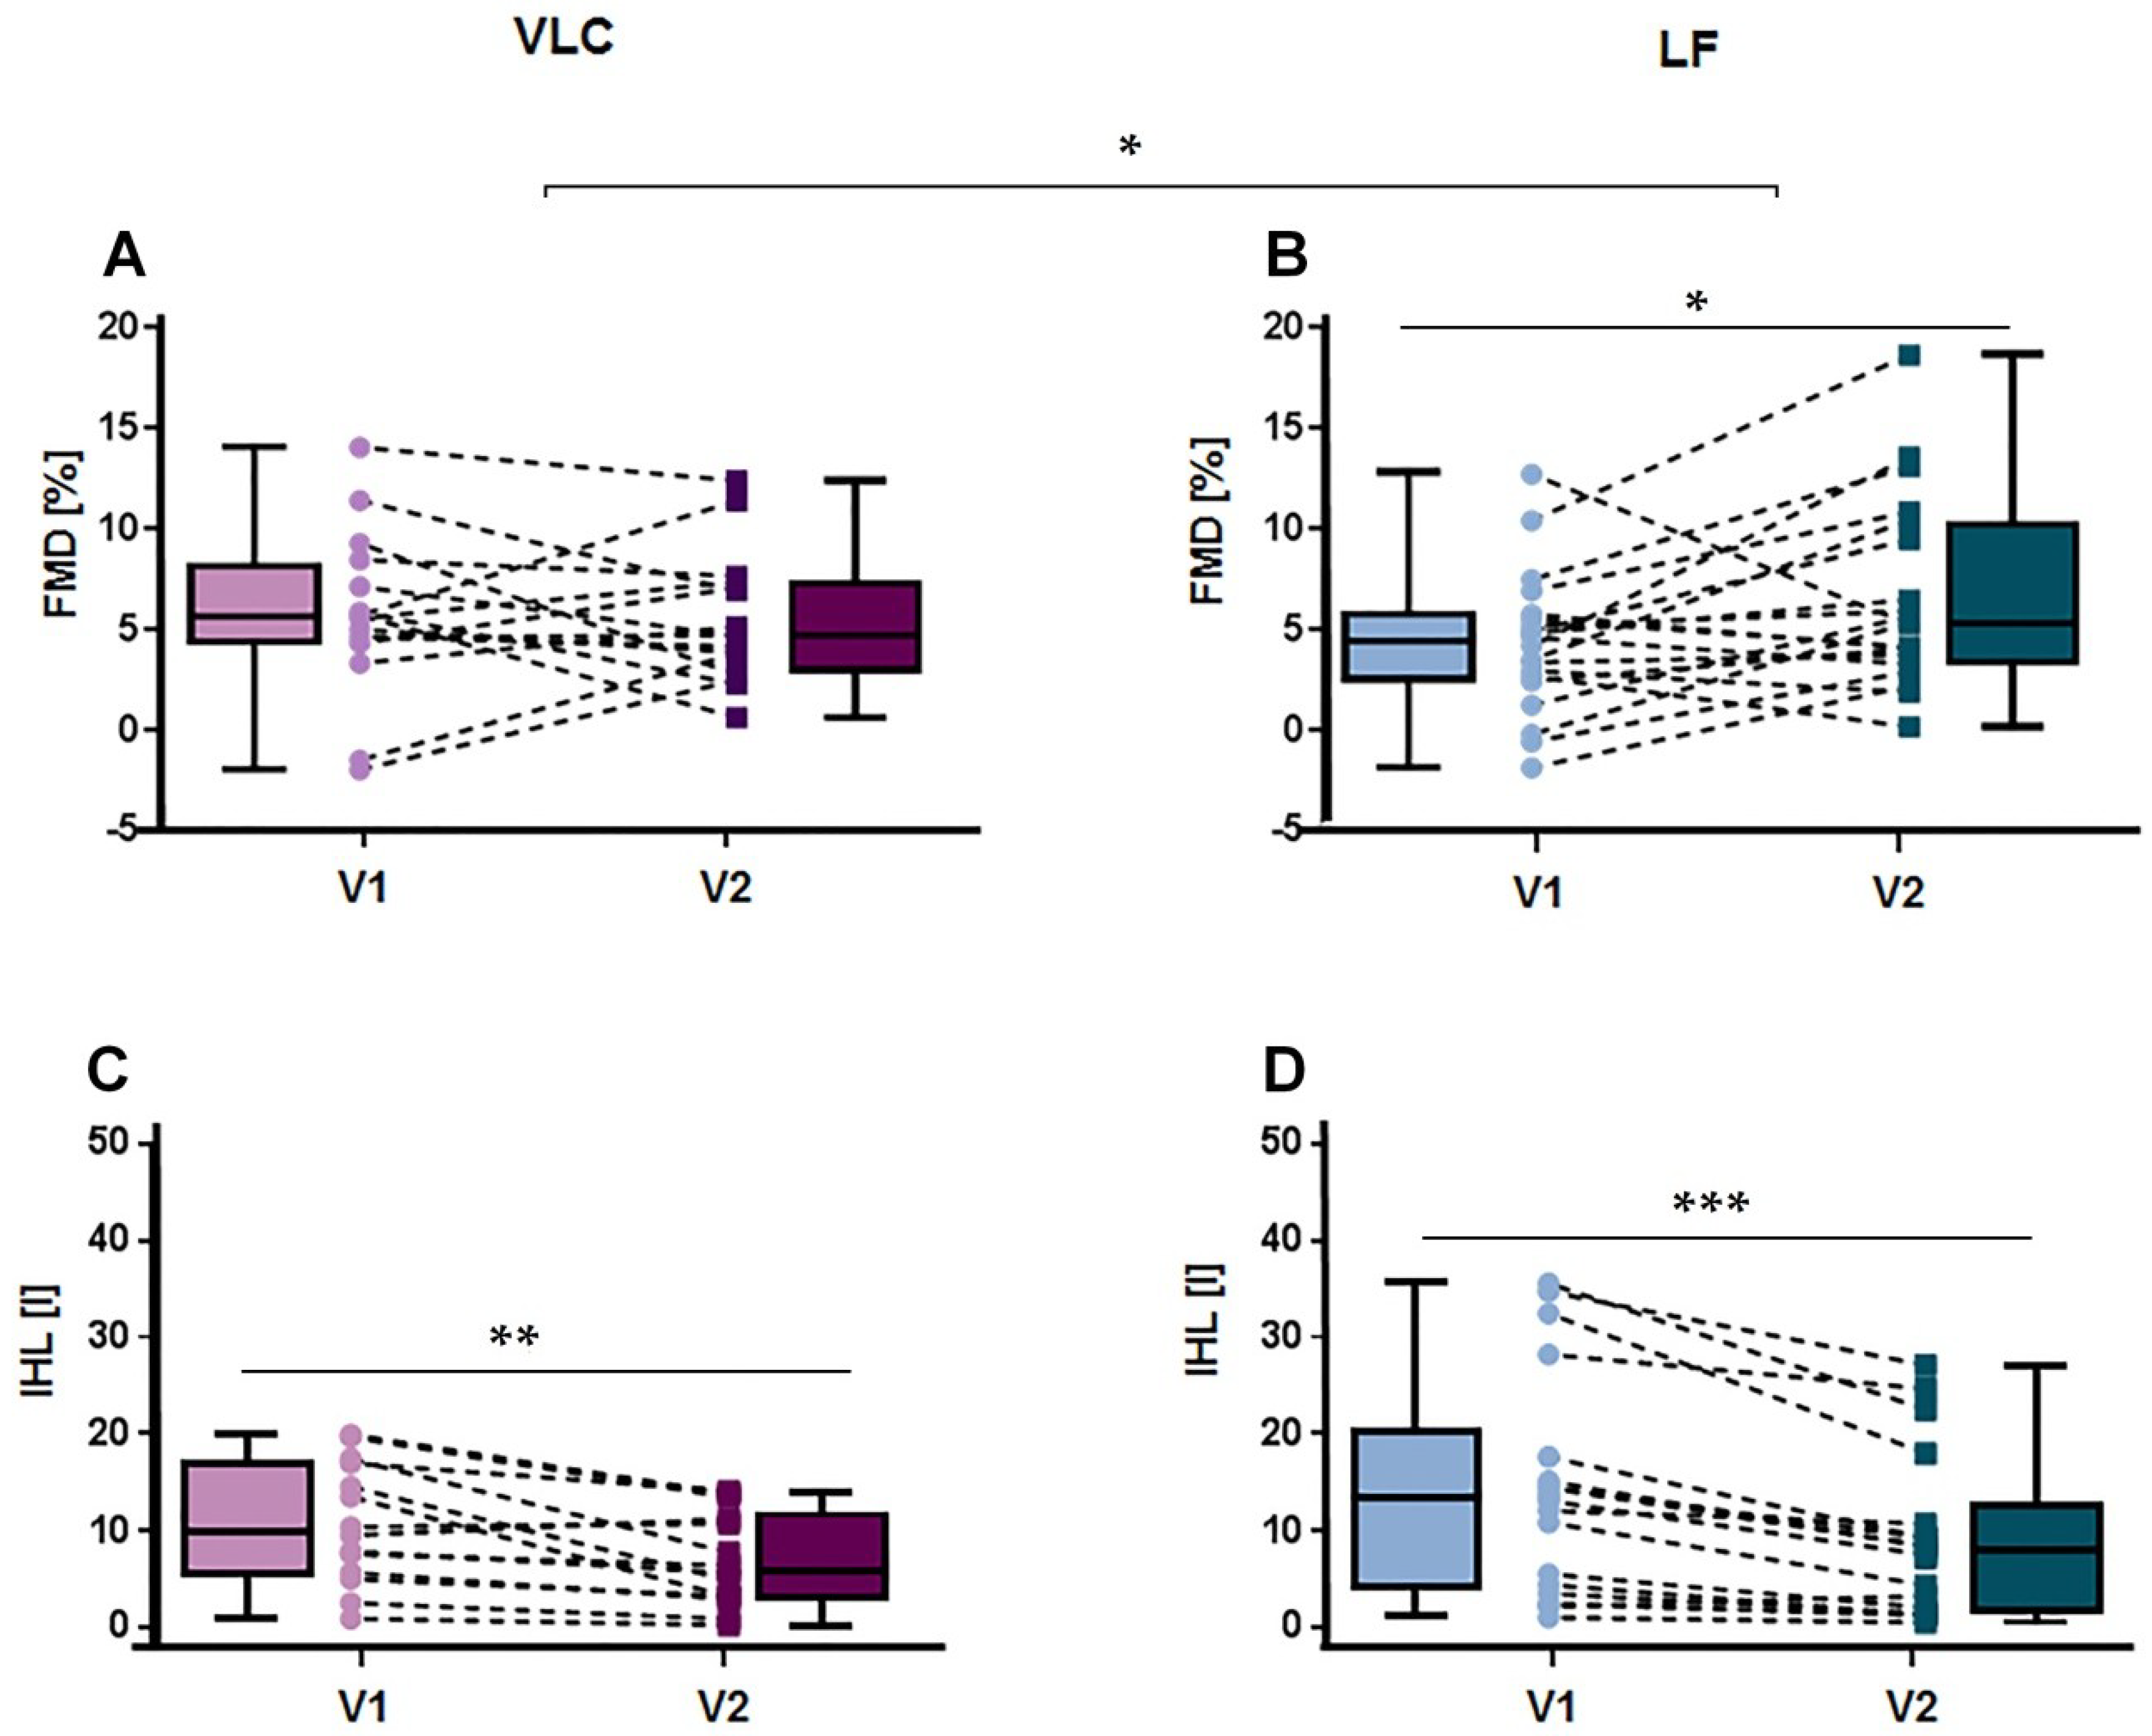
2.6. Endothelial Function
2.7. Diet Compliance and Evaluation
2.8. Statistical Analysis
3. Results
4. Discussion
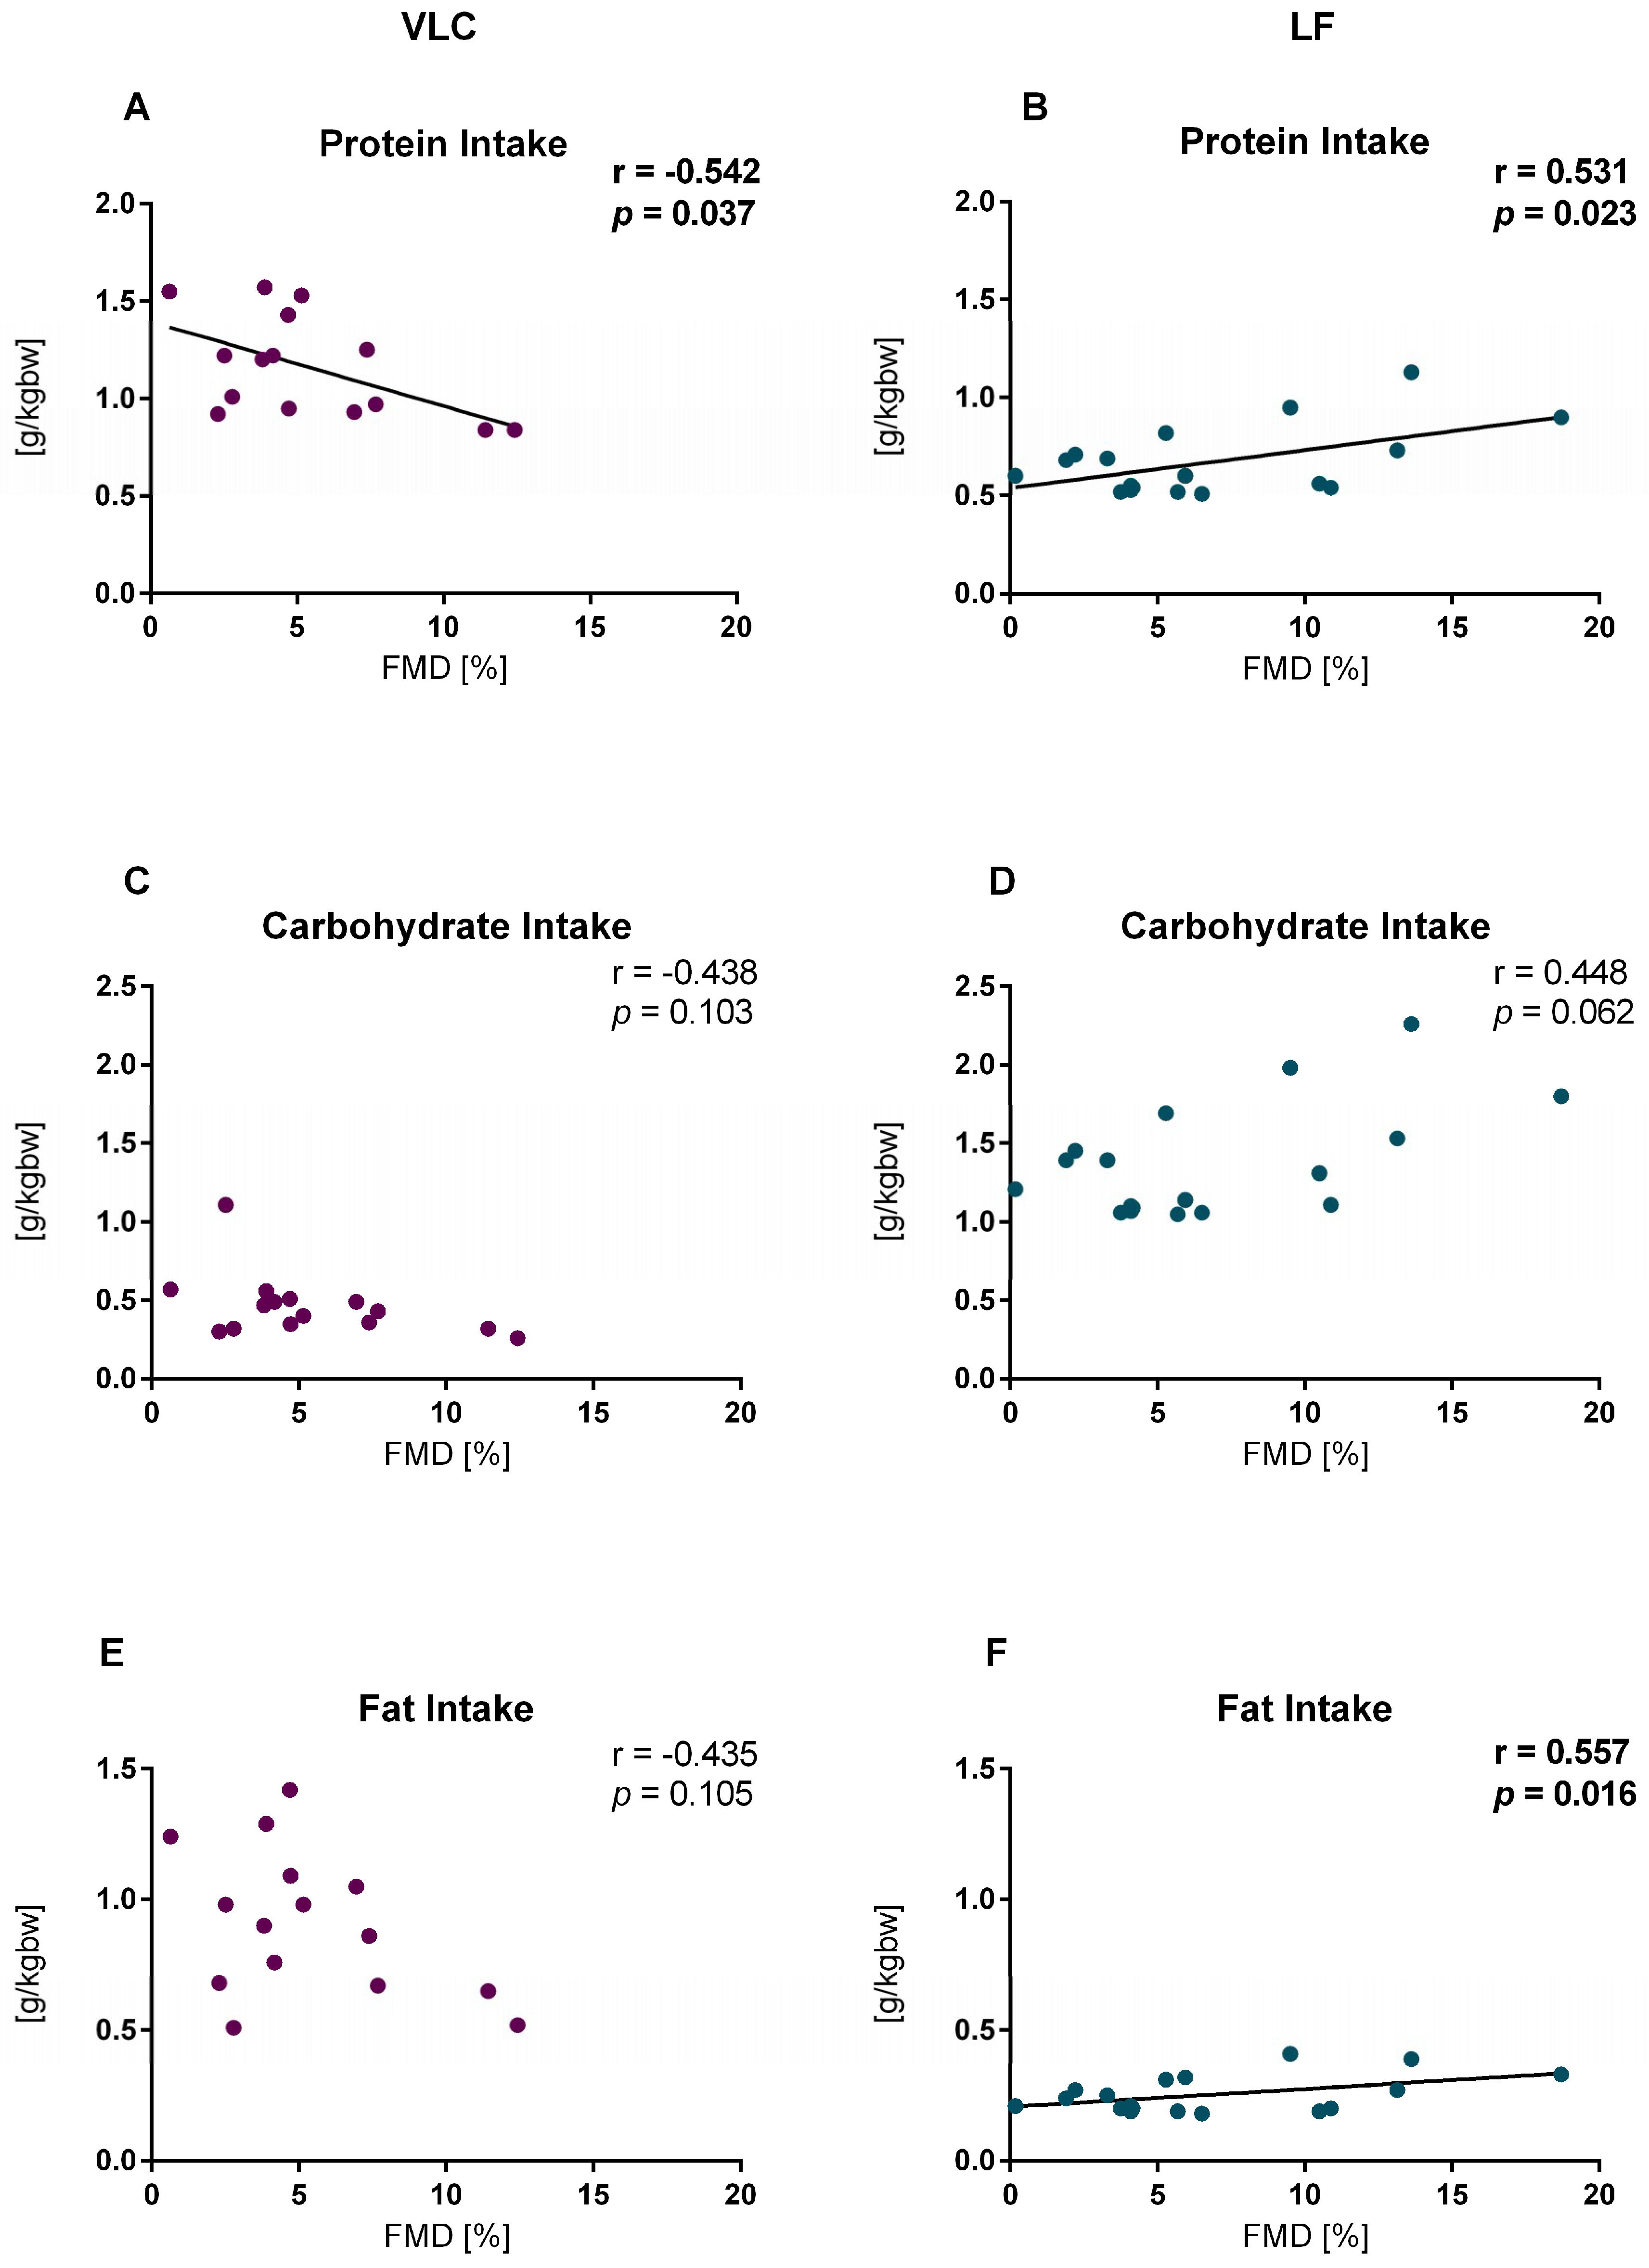
4.1. Protein Intake
4.2. Fat Intake
4.3. Carbohydrate Intake
5. Conclusions
Supplementary Materials
Author Contributions
Funding
Acknowledgments
Conflicts of Interest
References
- Gastaldelli, A.; Cusi, K.; Pettiti, M.; Hardies, J.; Miyazaki, Y.; Berria, R.; Buzzigoli, E.; Sironi, A.M.; Cersosimo, E.; Ferrannini, E.; et al. Relationship between hepatic/visceral fat and hepatic insulin resistance in nondiabetic and type 2 diabetic subjects. Gastroenterology 2007, 133, 496–506. [Google Scholar] [CrossRef] [PubMed]
- Gaggini, M.; Morelli, M.; Buzzigoli, E.; DeFronzo, R.A.; Bugianesi, E.; Gastaldelli, A. Non-alcoholic fatty liver disease (NAFLD) and its connection with insulin resistance, dyslipidemia, atherosclerosis and coronary heart disease. Nutrients 2013, 5, 1544–1560. [Google Scholar] [CrossRef] [PubMed]
- Matheus, A.S.; Tannus, L.R.; Cobas, R.A.; Palma, C.C.; Negrato, C.A.; Gomes, M.B. Impact of diabetes on cardiovascular disease: An update. Int. J. Hypertens. 2013, 2013, 653789. [Google Scholar] [CrossRef] [PubMed]
- Luscher, T.F.; Barton, M. Biology of the endothelium. Clin. Cardiol. 1997, 20 (Suppl. 2), Ii-3–Ii-10. [Google Scholar]
- Henry, R.M.; Ferreira, I.; Kostense, P.J.; Dekker, J.M.; Nijpels, G.; Heine, R.J.; Kamp, O.; Bouter, L.M.; Stehouwer, C.D. Type 2 diabetes is associated with impaired endothelium-dependent, flow-mediated dilation, but impaired glucose metabolism is not; The Hoorn Study. Atherosclerosis 2004, 174, 49–56. [Google Scholar] [CrossRef] [PubMed]
- Colak, Y.; Senates, E.; Yesil, A.; Yilmaz, Y.; Ozturk, O.; Doganay, L.; Coskunpinar, E.; Kahraman, O.T.; Mesci, B.; Ulasoglu, C.; et al. Assessment of endothelial function in patients with nonalcoholic fatty liver disease. Endocrine 2013, 43, 100–107. [Google Scholar] [CrossRef] [PubMed]
- Borel, J.C.; Roux-Lombard, P.; Tamisier, R.; Arnaud, C.; Monneret, D.; Arnol, N.; Baguet, J.P.; Levy, P.; Pepin, J.L. Endothelial dysfunction and specific inflammation in obesity hypoventilation syndrome. PLoS ONE 2009, 4, e6733. [Google Scholar] [CrossRef] [PubMed]
- Thijssen, D.H.; Black, M.A.; Pyke, K.E.; Padilla, J.; Atkinson, G.; Harris, R.A.; Parker, B.; Widlansky, M.E.; Tschakovsky, M.E.; Green, D.J. Assessment of flow-mediated dilation in humans: a methodological and physiological guideline. Am. J. Physiol. 2011, 300, H2–H12. [Google Scholar] [CrossRef] [PubMed]
- Bigornia, S.J.; Mott, M.M.; Hess, D.T.; Apovian, C.M.; McDonnell, M.E.; Duess, M.A.; Kluge, M.A.; Fiscale, A.J.; Vita, J.A.; Gokce, N. Long-term successful weight loss improves vascular endothelial function in severely obese individuals. Obesity (Silver Spring) 2010, 18, 754–759. [Google Scholar] [CrossRef] [PubMed]
- Joris, P.J.; Plat, J.; Kusters, Y.H.; Houben, A.J.; Stehouwer, C.D.; Schalkwijk, C.G.; Mensink, R.P. Diet-induced weight loss improves not only cardiometabolic risk markers but also markers of vascular function: A randomized controlled trial in abdominally obese men. Am. J. Clin. Nutr. 2017, 105, 23–31. [Google Scholar] [CrossRef] [PubMed]
- Joris, P.J.; Zeegers, M.P.; Mensink, R.P. Weight loss improves fasting flow-mediated vasodilation in adults: A meta-analysis of intervention studies. Atherosclerosis 2015, 239, 21–30. [Google Scholar] [CrossRef] [PubMed]
- Raitakari, M.; Ilvonen, T.; Ahotupa, M.; Lehtimäki, T.; Harmoinen, A.; Suominen, P.; Elo, J.; Hartiala, J.; Raitakari, O.T. Weight reduction with very-low-caloric diet and endothelial function in overweight adults: role of plasma glucose. Arterioscler. Thromb. Vasc. Biol. 2004, 24, 124–128. [Google Scholar] [CrossRef] [PubMed]
- Sasaki, S.; Higashi, Y.; Nakagawa, K.; Kimura, M.; Noma, K.; Hara, K.; Matsuura, H.; Goto, C.; Oshima, T.; Chayama, K. A low-calorie diet improves endothelium-dependent vasodilation in obese patients with essential hypertension. Am. J. Hypertens. 2002, 15, 302–309. [Google Scholar] [CrossRef]
- Mohler, E.R., 3rd; Sibley, A.A.; Stein, R.; Davila-Roman, V.; Wyatt, H.; Badellino, K.; Rader, D.J.; Klein, S.; Foster, G.D. Endothelial function and weight loss: comparison of low-carbohydrate and low-fat diets. Obesity (Silver Spring) 2013, 21, 504–509. [Google Scholar] [CrossRef] [PubMed]
- Wycherley, T.P.; Thompson, C.H.; Buckley, J.D.; Luscombe-Marsh, N.D.; Noakes, M.; Wittert, G.A.; Brinkworth, G.D. Long-term effects of weight loss with a very-low carbohydrate, low saturated fat diet on flow mediated dilatation in patients with type 2 diabetes: A randomised controlled trial. Atherosclerosis 2016, 252, 28–31. [Google Scholar] [CrossRef] [PubMed]
- Varady, K.A.; Bhutani, S.; Klempel, M.C.; Phillips, S.A. Improvements in vascular health by a low-fat diet, but not a high-fat diet, are mediated by changes in adipocyte biology. Nutr. J. 2011, 10, 8. [Google Scholar] [CrossRef] [PubMed]
- Phillips, S.A.; Jurva, J.W.; Syed, A.Q.; Syed, A.Q.; Kulinski, J.P.; Pleuss, J.; Hoffmann, R.G.; Gutterman, D.D. Benefit of low-fat over low-carbohydrate diet on endothelial health in obesity. Hypertension 2008, 51, 376–382. [Google Scholar] [CrossRef] [PubMed]
- Keogh, J.B.; Grieger, J.A.; Noakes, M.; Clifton, P.M. Flow-mediated dilatation is impaired by a high-saturated fat diet but not by a high-carbohydrate diet. Arterioscler. Thromb. Vasc. Biol. 2005, 25, 1274–1279. [Google Scholar] [CrossRef] [PubMed]
- Wycherley, T.P.; Brinkworth, G.D.; Keogh, J.B.; Noakes, M.; Buckley, J.D.; Clifton, P.M. Long-term effects of weight loss with a very low carbohydrate and low fat diet on vascular function in overweight and obese patients. J. Intern. Med. 2010, 267, 452–461. [Google Scholar] [CrossRef] [PubMed]
- Romero-Corral, A.; Sert-Kuniyoshi, F.H.; Sierra-Johnson, J.; Orban, M.; Gami, A.; Davison, D.; Singh, P.; Pusalavidyasagar, S.; Huyber, C.; Votruba, S.; et al. Modest visceral fat gain causes endothelial dysfunction in healthy humans. J. Am. Coll. Cardiol. 2010, 56, 662–666. [Google Scholar] [CrossRef] [PubMed]
- Fan, Y.; Wie, F.; Zhou, Y.; Zhang, H. Association of non-alcoholic fatty liver disease with impaired endothelial function by flow-mediated dilation: A meta-analysis. Hepatol. Res. 2016, 46, E165–E173. [Google Scholar] [CrossRef] [PubMed]
- Moura, F.A.; Figueiredo, V.N.; Teles, B.S.; Barbosa, M.A.; Pereira, L.R.; Costa, A.P.; Carvalho, L.S.; Cintra, R.M.; Almeida, O.L.; Quinaglia, E.; et al. Glycosylated hemoglobin is associated with decreased endothelial function, high inflammatory response, and adverse clinical outcome in non-diabetic STEMI patients. Atherosclerosis 2015, 243, 124–130. [Google Scholar] [CrossRef] [PubMed]
- Markova, M.; Pivovarova, O.; Hornemann, S.; Sucher, S.; Frahnow, T.; Wegner, K.; Machann, J.; Petzke, K.J.; Hierholzer, J.; Lichtinghagen, R.; et al. Isocaloric Diets High in Animal or Plant Protein Reduce Liver Fat and Inflammation in Individuals with Type 2 Diabetes. Gastroenterology 2017, 152, 571–585. [Google Scholar] [CrossRef] [PubMed]
- Wurslin, C.; Machann, J.; Rempp, H.; Claussen, C.; Yang, B.; Schick, F. Topography mapping of whole body adipose tissue using A fully automated and standardized procedure. J. Magn. Reson. Imaging 2010, 31, 430–439. [Google Scholar] [CrossRef] [PubMed]
- Szczepaniak, L.S.; Nurenberg, P.; Leonard, D.; Browning, J.D.; Reingold, J.S.; Grundy, S.; Hobbs, H.H.; Dobbins, R.L. Magnetic resonance spectroscopy to measure hepatic triglyceride content: prevalence of hepatic steatosis in the general population. Am. J. Physiol. Endocrinol. Metab. 2005, 288, E462–E468. [Google Scholar] [CrossRef] [PubMed]
- Boutron, I.; Altman, D.G.; Moher, D.; Schulz, K.F.; Ravaud, P.; CONSORT N.P.T Group. CONSORT Statement for Randomized Trials of Nonpharmacologic Treatments: A 2017 Update and a CONSORT Extension for Nonpharmacologic Trial Abstracts. Ann. Intern. Med. 2017, 167, 40–47. [Google Scholar] [CrossRef] [PubMed]
- Fekete, A.A.; Givens, D.I.; Lovegrove, J.A. Can milk proteins be a useful tool in the management of cardiometabolic health? An updated review of human intervention trials. Proc. Nutr. Soc. 2016, 75, 328–341. [Google Scholar] [CrossRef] [PubMed]
- Ballard, K.D.; Kupchak, B.R.; Volk, B.M.; Mah, E.; Shkreta, A.; Liptak, C.; Ptolemy, A.S.; Kellogg, M.S.; Bruno, R.S.; Seip, R.L.; et al. Acute effects of ingestion of a novel whey-derived extract on vascular endothelial function in overweight, middle-aged men and women. Br. J. Nutr. 2013, 109, 882–893. [Google Scholar] [CrossRef] [PubMed]
- Petyaev, I.M.; Dovgalevsky, P.Y.; Klochkov, V.A.; Chalyk, N.E.; Kyle, N. Whey protein lycosome formulation improves vascular functions and plasma lipids with reduction of markers of inflammation and oxidative stress in prehypertension. Sci. World J. 2012, 2012, 269476. [Google Scholar] [CrossRef] [PubMed]
- Fekete, A.A.; Giromini, C.; Chatzidiakou, Y.; Givens, D.I.; Lovegrove, J.A. Whey protein lowers blood pressure and improves endothelial function and lipid biomarkers in adults with prehypertension and mild hypertension: results from the chronic Whey2Go randomized controlled trial. Am. J. Clin. Nutr. 2016, 104, 1534–1544. [Google Scholar] [CrossRef] [PubMed]
- Huang, H.; Weng, J.; Wang, M.H. EETs/sEH in diabetes and obesity-induced cardiovascular diseases. Prostag. Other Lipid Mediat. 2016, 125, 80–89. [Google Scholar] [CrossRef] [PubMed]
- Siniarski, A.; Haberka, M.; Mostowik, M.; Gołębiowska-Wiatrak, R.; Poręba, M.; Malinowski, K.P.; Gąsior, Z.; Konduracka, E.; Nessler, J.; Gajos, G. Treatment with omega-3 polyunsaturated fatty acids does not improve endothelial function in patients with type 2 diabetes and very high cardiovascular risk: A randomized, double-blind, placebo-controlled study (Omega-FMD). Atherosclerosis 2018, 271, 148–155. [Google Scholar] [CrossRef] [PubMed]


| General Parameters | Subset | Mean | ±SD |
|---|---|---|---|
| Age1 | 63 | (±8) | |
| N | % | ||
| Sex2 | ♀ | 22 | 60 |
| ♂ | 14 | 40 | |
| VLC | ♀ | 11 | 69 |
| ♂ | 5 | 31 | |
| LF | ♀ | 10 | 53 |
| ♂ | 9 | 47 | |
| Lifestyle2 | n | (%) | |
| Smoking Status | Never smoked | 14 | 39 |
| Smoker | 5 | 14 | |
| Ex-smoker | 17 | 47 | |
| Medication2 | |||
| Oral antihyperglycemic agents | 0 | 13 | 37 |
| 1 | 16 | 45 | |
| 2 | 4 | 11 | |
| Insulin | 0 | 30 | 86 |
| 1 | 3 | 9 | |
| Lipid lowering agents | 0 | 20 | 57 |
| 1 | 13 | 37 | |
| Blood pressure lowering agents | 0 | 6 | 18 |
| 1 | 15 | 46 | |
| 2 | 7 | 21 | |
| 3 | 4 | 12 | |
| 4 | 1 | 3 | |
| Bradycardic antihypertensive agents | 0 | 19 | 54 |
| 1 | 12 | 34 | |
| 2 | 2 | 6 |
| V1 vs V2 | VLC vs LF | |||||||||||||||
|---|---|---|---|---|---|---|---|---|---|---|---|---|---|---|---|---|
| Anthropometry | VLC | Δ | LF | Δ | VLC | LF | Δ | V1 | V2 | |||||||
| Visit | n | Mean | ±SD | n | Mean | ±SD | p-Value | p-Value | p-Value | p-Value | p-Value | |||||
| Weight (kg) | V1 | 16 | 93.9 | 20.7 | −4.1 | 20 | 97.6 | 22.6 | −5.2 | <0.001 | <0.001 | ns | ns | ns | ||
| V2 | 16 | 89.8 | 19.7 | 20 | 92.5 | 20.9 | ||||||||||
| BMI (kg/m2) | V1 | 16 | 32.1 | 4.5 | −1.3 | 20 | 32.7 | 4.9 | −1.6 | <0.001 | <0.001 | ns | ns | ns | ||
| V2 | 16 | 30.8 | 4.3 | 20 | 31.1 | 4.6 | ||||||||||
| TAT [l] | V1 | 14 | 23.4 | 6.9 | −1.7 | 18 | 22.9 | 5.3 | −1.7 | 0.001 | <0.001 | ns | ns | ns | ||
| V2 | 14 | 21.7 | 5.9 | 18 | 21.2 | 5.1 | ||||||||||
| VAT [l] | V1 | 14 | 5.3 | 1.4 | −0.4 | 18 | 6.8 | 2.5 | −0.7 | 0.024 | <0.001 | ns | 0.042 | ns | ||
| V2 | 14 | 4.9 | 1 | 18 | 6.1 | 2.3 | ||||||||||
| IHL (%) | V1 | 14 | 10.8 | 6.3 | −3.8 | 17 | 14.5 | 11.3 | −5.2 | 0.003 | <0.001 | ns | ns | ns | ||
| V2 | 14 | 7 | 4.9 | 17 | 9.3 | 8.4 | ||||||||||
| V1 vs V2 | VLC vs LF | |||||||||||||||
|---|---|---|---|---|---|---|---|---|---|---|---|---|---|---|---|---|
| Clinical Parameters | VLC | Δ | LF | Δ | VLC | LF | Δ | V1 | V2 | |||||||
| Visit | n | Mean | ±SD | n | Mean | ±SD | p-Value | p-Value | p-Value | p-Value | p-Value | |||||
| HbA1c (%) | V1 | 16 | 6.7 | 1 | −0.6 | 20 | 6.2 | 0.6 | −0.2 | <0.001 | ns | 0.001 | ns | ns | ||
| V2 | 16 | 6.1 | 0.7 | 20 | 6.1 | 0.6 | ||||||||||
| CRP (mg/L) | V1 | 16 | 3.1 | 4.1 | −1.3 | 20 | 3.1 | 2.7 | −1.1 | 0.025 * | 0.008 * | ns * | ns * | ns * | ||
| V2 | 16 | 1.7 | 1.5 | 20 | 2 | 2.8 | ||||||||||
| T. CHO (mg/dL) | V1 | 16 | 200 | 39 | −27 | 20 | 178 | 33 | −31 | 0.001 | <0.001 | ns | ns | 0.042 | ||
| V2 | 16 | 173 | 39 | 20 | 147 | 36 | ||||||||||
| HDL (mg/dL) | V1 | 16 | 56 | 16 | −2 | 20 | 49 | 18 | −4 | ns | ns | ns | ns | ns | ||
| V2 | 16 | 54 | 12 | 20 | 45 | 14 | ||||||||||
| LDL (mg/dL) | V1 | 16 | 127 | 36 | −21 | 20 | 109 | 28 | −26 | 0.004 | <0.001 | ns | ns | 0.035 | ||
| V2 | 16 | 106 | 31 | 20 | 83 | 31 | ||||||||||
| TAG (mg/dL) | V1 | 16 | 133 | 65 | −30 | 20 | 161 | 65 | −35 | 0.003 | 0.042 | ns | ns | ns | ||
| V2 | 16 | 103 | 72 | 20 | 127 | 77 | ||||||||||
| SBP (mmHg) | V1 | 15 | 134 | 17 | −9 | 19 | 134 | 21 | −6 | ns | ns | ns | ns | ns | ||
| V2 | 15 | 126 | 10 | 19 | 128 | 19 | ||||||||||
| DBP (mmHg) | V1 | 15 | 85 | 11 | −5 | 19 | 84 | 13 | −6 | ns | ns | ns | ns | ns | ||
| V2 | 15 | 80 | 9 | 19 | 78 | 11 | ||||||||||
| VLC | Δ | LF | Δ | VLC | LF | Δ | V1 | V2 | ||||||||
|---|---|---|---|---|---|---|---|---|---|---|---|---|---|---|---|---|
| Macronutrient Intake | Visit | n | Mean | ±SD | n | Mean | ±SD | p-Value | p-Value | p-Value | p-Value | p-Value | ||||
| Calories (kcal) | V1 | 14 | 2035 | 663 | −717 | 15 | 2022 | 790 | −1098 | <0.001 | <0.001 | <0.001 | ns | 0.001 | ||
| V2 | 14 | 1318 | 220 | 15 | 925 | 61 | ||||||||||
| Protein (g/kg bw) | V1 | 14 | 0.95 | 0.15 | 0.21 | 15 | 0.94 | 0.2 | −0.26 | 0.002 | <0.001 | <0.001 | ns | <0.001 | ||
| V2 | 14 | 1.16 | 0.26 | 15 | 0.67 | 0.18 | ||||||||||
| Carbohydrate (g) | V1 | 14 | 196 | 69 | −157 | 15 | 203 | 93 | −85 | <0.001 | 0.006 | 0.005 | ns | <0.001 | ||
| V2 | 14 | 39 | 10 | 15 | 118 | 11 | ||||||||||
| Fat (%) | V1 | 14 | 40 | 9 | 14 | 15 | 38 | 6 | −16 | ns | <0.001 | <0.001 | ns | <0.001 | ||
| V2 | 14 | 54 | 6 | 15 | 21 | 2 | ||||||||||
| VLC | Δ | LF | Δ | VLC | LF | Visit | Visit x Time | ||||||||
|---|---|---|---|---|---|---|---|---|---|---|---|---|---|---|---|
| Endothelial Function | Visit | n | Mean | ±SD | n | Mean | ±SD | p-Value | p-Value | p-Value | p-Value | ||||
| FMD (%) | V1 | 16 | 5.74 | 4.06 | −0.26 | 20 | 4.32 | 3.5 | 2.27 | ns | 0.024 | ns | 0.034 | ||
| V2 | 16 | 5.48 | 3.21 | 20 | 6.59 | 4.69 | |||||||||
© 2018 by the authors. Licensee MDPI, Basel, Switzerland. This article is an open access article distributed under the terms and conditions of the Creative Commons Attribution (CC BY) license (http://creativecommons.org/licenses/by/4.0/).
Share and Cite
Barbosa-Yañez, R.L.; Dambeck, U.; Li, L.; Machann, J.; Kabisch, S.; Pfeiffer, A.F.H. Acute Endothelial Benefits of Fat Restriction over Carbohydrate Restriction in Type 2 Diabetes Mellitus: Beyond Carbs and Fats. Nutrients 2018, 10, 1859. https://doi.org/10.3390/nu10121859
Barbosa-Yañez RL, Dambeck U, Li L, Machann J, Kabisch S, Pfeiffer AFH. Acute Endothelial Benefits of Fat Restriction over Carbohydrate Restriction in Type 2 Diabetes Mellitus: Beyond Carbs and Fats. Nutrients. 2018; 10(12):1859. https://doi.org/10.3390/nu10121859
Chicago/Turabian StyleBarbosa-Yañez, Renate Luzía, Ulrike Dambeck, Linna Li, Jürgen Machann, Stefan Kabisch, and Andreas F.H. Pfeiffer. 2018. "Acute Endothelial Benefits of Fat Restriction over Carbohydrate Restriction in Type 2 Diabetes Mellitus: Beyond Carbs and Fats" Nutrients 10, no. 12: 1859. https://doi.org/10.3390/nu10121859
APA StyleBarbosa-Yañez, R. L., Dambeck, U., Li, L., Machann, J., Kabisch, S., & Pfeiffer, A. F. H. (2018). Acute Endothelial Benefits of Fat Restriction over Carbohydrate Restriction in Type 2 Diabetes Mellitus: Beyond Carbs and Fats. Nutrients, 10(12), 1859. https://doi.org/10.3390/nu10121859