Modifications in the Consumption of Energy, Sugar, and Saturated Fat among the Mexican Adult Population: Simulation of the Effect When Replacing Processed Foods that Comply with a Front of Package Labeling System

 ,
,
Abstract
:1. Introduction
2. Materials and Methods
2.1. Design and Population
2.2. ENSANUT 2012
2.3. Dietary Information
2.4. INSP Food Composition Database
2.5. FOP Nutrition-Labeling Criteria
2.5.1. MCNE Nutrition Criteria
2.5.2. COFEPRIS Nutrition Criteria
2.6. Statistical Analysis
2.7. Ethical Considerations
3. Results
4. Discussion
4.1. Strengths of the Study
4.2. Limitations of the Study
5. Conclusions
Acknowledgments
Author Contributions
Conflicts of Interest
Appendix A

| Food Group | Definition | Nutritional Criteria | |
|---|---|---|---|
| Processed food and vegetables | All types of processed fruit & vegetables, with the exception of fruit juices and frozen fruit & vegetables without further processing. | Saturated fat | ≤1.1 g/100 g |
| Trans fat | ≤0.1 g/100 g | ||
| Sodium Added sugar Fiber | ≤100 mg/100 g | ||
| Not added | |||
| ≥0.65 g/100 g | |||
| Pasta and potatoes | Includes all kinds of tubers, pastas and similar products used for main dishes. | Saturated fat | ≤1.1 g/100 g |
| Trans fat | ≤0.1 g/100 g | ||
| Sodium Added sugar Fiber | ≤100 mg/100 g | ||
| Not added | |||
| ≥4 g/100 g | |||
| Beans and other legumes | All kinds of beans and legumes: cooked, processed, fresh or dried. | Saturated fat | ≤1.1 g/100 g |
| Trans fat | ≤0.1 g/100 g | ||
| Sodium | ≤250 mg/100 g | ||
| Added sugar | Not added | ||
| Fiber | ≥3.5 g/100 g | ||
| Corn and tortilla products | Tortilla and corn products | Saturated fat | ≤1.1 g/100 g |
| Trans fat | ≤0.1 g/100 g | ||
| Sodium | ≤100 mg/100 g | ||
| Added sugar | Not added | ||
| Fiber | ≥3.5 g/100 g | ||
| Rice and other grains | All kinds of grain products such as rice, wheat oatmeal, amaranto, barely, products used for main dishes. | Saturated fat | ≤1.1 g/100 g |
| Trans fat | ≤0.1 g/100 g | ||
| Sodium | ≤100 mg/100 g | ||
| Added sugar | Not added | ||
| Fiber | ≥3.5 g/100 g | ||
| Salted bread | All kinds of bread or substitutes for bread with the exception of breakfast cereals. | Saturated fat | ≤1.1 g/100 g |
| Trans fat | ≤0.1 g/100 g | ||
| Sodium | ≤500 mg/100 g | ||
| Added sugar | ≤13% energy | ||
| Fiber | ≥4 g/100 g | ||
| Sweet bread, pastry and cookies | All kinds of sweet baked goods, including industrialized and packaged rolls and pastries, and cereal bars. | Saturated fat | ≤1.1 g/100 g |
| Trans fat | ≤0.1 g/100 g | ||
| Sodium | ≤300 mg/100 g | ||
| Added sugar | ≤13% energy | ||
| Fiber | ≥4 g/100 g | ||
| Breakfast cereal products | All kinds of breakfast cereal products. | Saturated fat | ≤13% energy |
| Trans fat | ≤0.1 g/100 g | ||
| Sodium | ≤500 mg/100 g | ||
| Added sugar | ≤20 g/100 g | ||
| Fiber | ≥5 g/100 g | ||
| Milk and dairy products | All kinds of milk and dairy products. | Saturated fat | ≤1.9 g/100 g |
| Trans fat | ≤0.1 g/100 g | ||
| Sodium | ≤100 mg/100 g | ||
| Added sugar | ≤6 g /100 g | ||
| Cheese (products) | All kinds of cheese and cheese products. Natural cheeses (fresh or aged), processed cheeses (American cheese). | Saturated fat | ≤15 g/100 g |
| Trans fat | ≤0.1 g/100 g | ||
| Sodium | ≤400 mg/100 g | ||
| Added sugar | Not added | ||
| Processed Meat (fresh and cured sausages and meat substitutes) | All kinds of processed meats, including beef, chicken and (vegetable) meat substitutes. | Saturated fat | ≤1.1 g/100 g |
| Trans fat | ≤0.1 g/100 g | ||
| Sodium | ≤900 mg/100 g | ||
| Added sugar | Not added | ||
| Fish and shellfish (fresh or frozen) | All kinds of fresh fish and shellfish (including deep-frozen without further processing or preparation). | Saturated fat | ≤1.1 g/100 g ó 30% total fat |
| Trans fat | ≤0.1 g/100 g | ||
| Sodium | ≤100 mg/100 g | ||
| Added sugar | Not added | ||
| Oils, fats and fat containing spreads | All fats and oils used as spreads or to prepare food. | Saturated fat | ≤30% total fat |
| Trans fat | ≤1.3% energy | ||
| Sodium | ≤350 mg/ 100 g | ||
| Added sugar | Not added | ||
| Soups | All kinds of soups and broths. | Saturated fat | ≤1.1 g/100 g |
| Trans fat | ≤0.1 g/100 g | ||
| Sodium | ≤300 mg/100 g | ||
| Added sugar | ≤2.5 g/100 g | ||
| Energy | ≤100 kcal/100 g | ||
| Main course dishes | All Ready-to-Cook Meals that are intended to be eaten as main dish during lunch or dinner. | Saturated fat | ≤1.1 g/100 g ó 13 in % |
| Trans fat | ≤0.1 g/100 g ó 1.3 in % | ||
| Sodium | ≤300 mg/100 g | ||
| Added sugar | ≤2.5 g/100 g ó 13% energy | ||
| Fiber | ≥1.25 g/100 kcal | ||
| Energy | ≤150 kcal/ 100 g | ||
| Sauces (water based) | All sauces that constitute only a minor component of the meal (portion size < 35 g) without added emulsifying agent and with fat content < 10% w/w. | Saturated fat | ≤1.1 g/100 g |
| Trans fat | ≤0.1 g/100 g | ||
| Sodium | ≤550 mg/100 g | ||
| Added sugar | Not added | ||
| Energy | ≤100 kcal/100 g | ||
| Sauces (emulsions) | All sauces that constitute only a minor component of the meal (portion size < 35 g) to which an emulsifying agent is added or have a fat content ≥ 10% w/w. | Saturated fat | ≤1.1 g/100 g ó 30% energy |
| Trans fat | |||
| Sodium | ≤0.1 g/100 g ó 1.3% energy | ||
| Added sugar | |||
| ≤550 mg/100 g | |||
| Energy | ≤2.5 g/100 g ó 13% energy | ||
| ≤350 kcal/100 g | |||
| Snacks (savory and sweet) | All snack products intended to be eaten as a small snack between meals or as a minor component of a meal. | Saturated fat | ≤1.1 g/100 g |
| Trans fat | ≤0.1 g/100 g | ||
| Sodium | ≤131 mg/100 g | ||
| Added sugar | ≤20 g/100 g | ||
| Energy | ≤300 kcal/100 g | ||
| Liquid foods | Products that are normally consumed form a cup, mug or glass (including products packed in portions in packages, bottles, etc.); includes beverages with fruit juices, with the exception of dairy products. | Saturated fat | ≤1.1 g/100 mL |
| Trans fat | ≤0.1 g/100 mL | ||
| Sodium | ≤20 mg/100 mL | ||
| Added sugar | Not added | ||
| Energy | ≤10 kcal/100 mL | ||
Appendix B
| Food Group | Definition | Nutritional Criteria | |
|---|---|---|---|
| Fruits and vegetables, legumes, nuts, seeds and tubers (except snacks) | All types of fruits and vegetables, legumes, tubers, solid soy products (frozen, tined, dehydrated). | Saturated fat | ≤1.5 g/100 g |
| Sodium | ≤300 mg/100 g | ||
| Serving defined by COFEPRIS: 110 g | Total sugar | ≤15 g/100 g | |
| Energy | ≤170 kcal/serving | ||
| Fruit/vegetable based condiment | Fruit/vegetable-based condiments: >50 g fruit and/or vegetable per 100 g of finished products that constitute a minor component of the meal. | Saturated fat | ≤1.5 g/100 g |
| Sodium | ≤750 mg/100 g | ||
| Total sugar | ≤25 g/100 g | ||
| Serving defined by COFEPRIS: 20 g | Energy | ≤85 kcal/serving | |
| Soy liquid foods | Soy-made liquid foods with or without juice | Saturated fat | ≤0.5 g/100 mL |
| Sodium | ≤110 mg/100 mL | ||
| Total sugar | ≤15 g/100 mL | ||
| Serving defined by COFEPRIS: 200 mL | |||
| Energy | ≤140 kcal/serving | ||
| Tortillas and corn products | All kinds of tortillas and corn products. | Saturated fat | ≤5 g/100 g |
| Sodium | ≤670 mg/100 g | ||
| Serving defined by COFEPRIS: 30 g | Added sugar | ≤4 g/100 g | |
| Energy | ≤300 kcal/serving | ||
| Cereals (other than made for breakfast) | Cereals other than made for breakfast (rice, pasta, bread, crackers). | Saturated fat | ≤5 g/100 g |
| Sodium | ≤500 mg/100 g | ||
| Serving defined by COFEPRIS: 50 g | Total sugar | ≤5 g/100 g | |
| Energy | ≤340 kcal/serving | ||
| Cakes | All kinds of cakes. | Saturated fat | ≤10 g/100 g |
| Sodium | ≤450 mg/100 g | ||
| Serving defined by COFEPRIS: 45 g | Total sugar | ≤30 g/100 g | |
| Energy | ≤190 kcal/serving | ||
| Sweet bread | All kinds of sweet bread. | Saturated fat | ≤10 g/100 g |
| Sodium | ≤450 mg/100 g | ||
| Serving defined by COFEPRIS: 50 g | Total sugar | ≤30 g/100 g | |
| Energy | ≤190 kcal/serving | ||
| Cookies | All kinds of cookies. | Saturated fat | ≤10 g/100 g |
| Sodium | ≤450 mg/100 g | ||
| Serving defined by COFEPRIS: 30 g | Total sugar | ≤30 g/100 g | |
| Energy | ≤160 kcal/serving | ||
| Cereal bars | All kinds of cereal bars. | Saturated fat | ≤10 g/100 g |
| Sodium | ≤450 mg/100 g | ||
| Serving defined by COFEPRIS: 30 g | Total sugar | ≤35 g/100 g | |
| Energy | ≤160 kcal/serving | ||
| Breakfast cereals | All kinds of breakfast cereals | Saturated fat | ≤5 g/100 g |
| Sodium | ≤500 mg/100 g | ||
| Serving defined by COFEPRIS: 30 g | Total sugar | ≤30 g/100 g | |
| Energy | ≤210 kcal/serving | ||
| Milk products | Dairy products other than cheeses. | Saturated fat | ≤2.6 g/100 g |
| Serving defined by COFEPRIS: | Sodium | ≤300 mg/100 g | |
| -Liquids: 240 mL | Total sugar | ≤13.5 g/100 g | |
| -Drinking yogurt: 200 mL | Energy | ≤170 kcal/serving | |
| -Solid yogurt: 100 g | |||
| Fresh cheese | Fresh cheese. | Saturated fat | ≤10 g/100 g |
| Sodium | ≤800 mg/100 g | ||
| Serving defined by COFEPRIS: 30 g | Total sugar | ≤8 g/100 g | |
| Energy | ≤70 kcal/serving | ||
| Mature cheese | Mature cheese. | Saturated fat | ≤15 g/100 g |
| Serving defined by COFEPRIS: 30 g | Sodium | ≤900 mg/100 g | |
| Total sugar | ≤5 g/100 g | ||
| Energy | ≤85 kcal/serving | ||
| Meat based products | Meat-based products, all kind of processed meat/poultry. | Saturated fat | ≤6 g/100 g |
| Sodium | ≤800 mg/100 g | ||
| Serving defined by COFEPRIS: 45 g | Total sugar | ≤5 g/100 g | |
| Energy | ≤170 kcal/serving | ||
| Fishery products | Fish and shellfish products. | Saturated fat | ≤33% total fat |
| Serving defined by COFEPRIS: | Sodium | ≤450 mg/100 g | |
| -Fish: 50 g | Total sugar | ≤5 g/100 g | |
| -Shellfish: 100 g | |||
| Energy | ≤170 kcal/serving | ||
| Vegetable and animal fats and oils | All vegetable and animal fats and oils. | Poliunsaturated fat | ≥ 25% total fat |
| ≤33% total fat | |||
| Saturated fat | ≤500 mg/100 g | ||
| Sodium | |||
| Serving defined by COFEPRIS: 10 g | Total sugar | ≤5 g/100 g | |
| Energy | ≤85 kcal/serving | ||
| Soups | All kinds of soups. | Saturated fat | ≤1.5 g/100 g |
| Sodium | ≤350 mg/100 g | ||
| Serving defined by COFEPRIS: 200 mL | Total sugar | ≤7.5 g/100 g | |
| Energy | ≤170 kcal/serving | ||
| Dishes and sandwiches | Composed of dishes, main dishes and sandwiches. | Saturated fat | ≤5 g/100 g |
| Sodium | ≤400 mg/100 g | ||
| Serving defined by COFEPRIS: 200 g | Total sugar | ≤7.5 g/100 g | |
| Energy | ≤425 kcal/serving | ||
| Sauces for foods | Sauces for foods (>50 g of fruit and vegetables by 100 g of the total product). | Saturated fat | ≤1.5 g/100 g |
| Sodium | ≤500 mg/100 g | ||
| Total sugar | ≤10 g/100 g | ||
| Serving defined by COFEPRIS: 100 g | Energy | ≤100 kcal/serving | |
| Emulsions-based sauces | Emulsions-based sauces. | Saturated fat | ≤33% total fat |
| Sodium | ≤750 mg/100 g | ||
| Total sugar | ≤5 g/100 g | ||
| Serving defined by COFEPRIS: 15 g | Energy | ≤85 kcal/serving | |
| Salted snacks | Salted snacks. | Saturated fat | ≤6 g/100 g |
| Sodium | ≤800 mg/100 g | ||
| Serving defined by COFEPRIS: 45 g | Added sugar | ≤5 g/100 g | |
| Energy | ≤170 kcal/serving | ||
| Juices | All kinds of juices | Sodium | ≤10 mg/100 mL |
| Total sugar | ≤13 g/100 mL | ||
| Serving defined by COFEPRIS: 250 mL | Energy | ≤130 kcal/serving | |
| Nectars | All kinds of nectars | Sodium | ≤28 mg/100 mL |
| Total sugar | ≤13 g/100 mL | ||
| Serving defined by COFEPRIS: 200 mL | Energy | ≤104 kcal/serving | |
| Beverages with reduced energy content | Beverages with a reduced energy content. | Sodium | ≤28 mg/100 mL |
| Total sugar | ≤5 g/100 mL | ||
| Serving defined by COFEPRIS: 200 mL | Energy | ≤40 kcal/serving | |
| Ice cream and sorbets | All kinds of ice cream and sorbets | Saturated fat | ≤5 g/100 g |
| Sodium | ≤120 mg/100 g | ||
| Serving defined by COFEPRIS: 75 g | Total sugar | ≤20 g/100 g | |
| Energy | ≤110 kcal/serving | ||
| Jelly powders | Jelly powders to prepare jelly. | Saturated fat | ≤5 g/100 g |
| Sodium | ≤120 mg/100 g | ||
| Serving defined by COFEPRIS: 130 g | Total sugar | ≤20 g/100 g | |
| Energy | ≤110 kcal/serving | ||
| Foods excluded: sugar and sugar-based products; which include: chocolate products; jam or marmalade; sugar, honey or syrup; non-chocolate confectionary; soft drinks and other sugar products. | |||
Appendix C
Stratification for Analysis
| Sex | Group of Age | BMI | ||||||
|---|---|---|---|---|---|---|---|---|
| Women | Men | 20–39 | 40–59 | Underweight | Normal Weight | Overweight | Obesity | |
| Median (p25–p75) | Median (p25–p75) | Median (p25–p75) | Median (p25–p75) | Median (p25–p75) | Median (p25–p75) | Median (p25–p75) | Median (p25–p75) | |
| Energy (kcal) | ||||||||
| 1 | 1690 | 2134.4 (1631–2939.2) a | 1985.4 (1455.4–2624.4) a | 1787.1 (1313.4–2326.2) a | 2857.9 (2077.5–3160.6) a | 2013.8 (1468.6–2786.9) a | 1890.5 (1403.3–2424.6) a | 1860.5 (1320.5–2326.2) a |
| (1261.7–2153.7) a | ||||||||
| 2 | 1522.3 | 1916.9 (1417.7–2690.2) b | 1754.9 (1289.7–2355.3) b | 1628.8 (1222–2166.8) a | 2601.7 (1958.8–2853.1) a | 1853.8 (1317.1–2457.7) a | 1670.9 (1279.2–2201.1) b | 1637.7 (1196.6–2102.1) b |
| (1153.3–2004.3) b | ||||||||
| 3 | 1612.1 | 2017.7 (1393.6–2755.8) b | 1876.3 (1322.2–2511.1) b | 1722.3 (1199.4–2324) a | 3104.1 (1834.8–3406.2) a | 1924.7 (1351.9–2533.3) a | 1803.6 (1263.2–2398) a | 1716.7 (1197.3–2222.2) a |
| (1186.8–2084.5) a | ||||||||
| Saturated Fat (g) | ||||||||
| 1 | 19.7 (11.2–28.5) a | 24.5 (14.8–37.8) a | 23.1 (14.1–36.1) a | 20 (11–29.4) a | 49 (20.4–52) a | 23 (12.5–35.7) a | 21.6 (12.2–32.7) a | 20.6 (12.6–30) a |
| 2 | 15.2 (8.8–23.6) b | 19.8 (12.2–31) b | 18.1 (11.7–29.6) b | 15.8 (8.9–24.7) b | 21.8 (15.9–38.1) a | 18.1 (10.5–29.5) b | 17.1 (10.1–25.4) b | 16.8 (9–25.3) b |
| 3 | 15.7 (9.3–25.7) b | 20.5 (11.8–32) b | 19.3 (11–30.5) b | 16.2 (9.5–26.7) b | 28.3 (16–42.4) a | 19.9 (10.8–29.5) a | 17.5 (9.9–27.4) b | 15.9 (9.5–28.1) b |
| Trans fat (g) | ||||||||
| 1 | 0.24 (0.05–0.5) a | 0.26 (0.05–0.64) a | 0.26 (0.06–0.64) a | 0.23 (0.04–0.53) a | 0.35 (0.31–0.63) a | 0.27 (0.05–0.65) a | 0.24 (0.05–0.56) a | 0.26 (0.06–0.56) a |
| 2 | 0.2 (0.04–0.42) a | 0.22 (0.04–0.54) a | 0.22 (0.05–0.5) a | 0.19 (0.04–0.46) a | 0.33 (0.29–0.6) a | 0.23 (0.04–0.53) a | 0.19 (0.04–0.45) a | 0.19 (0.05–0.46) a |
| 3 | 0.2 (0.04–0.48) a | 0.2 (0.03–0.5) b | 0.19 (0.4–0.49) a | 0.21 (0.04–0.5) a | 0.62 (0.2–1.08) a | 0.22 (0.04–0.59) a | 0.18 (0.04–0.44) a | 0.18 (0.04–0.43) a |
| Tot sugar (g) | ||||||||
| 1 | 73.1 (43.8–117.7) a | 95.3 (58.2–138.6) a | 94.1 (53.6–136.9) a | 80.1 (43.7–115.8) a | 161.3(99.5–178.7) a | 86.1 (52.4–130.2) a | 82.9 (47.2–123.2) a | 88.1 (49–128.5) a |
| 2 | 51.1 (29.2–78.5) b | 53.1 (28.6–89.5) b | 54.3 (28.6–88.5) b | 49.5 (29.2–84.2) b | 111.8(74.6–135.7) a | 55.5 (29.8–89.5) b | 51 (28.4–84.5) b | 48.9 (28.5–80.8) b |
| 3 | 55.4 (31.8–83.9) b | 53.1 (30.3–89.5) b | 55.6 (28.9–90.8) b | 53.1 (32.7–82.8) b | 92.7 (63.2–111.6) a | 60 (33.3–90.6) b | 53.5 (30.8–85.5) b | 51.7 (28.1–81) b |
| Sodium (mg) | ||||||||
| 1 | 1967.9 | 2570.8 (1640.9–3866.8) a | 2313.7 (1507.2–3565.7) a | 2141.4 (1344.2–3212.4) a | 2737 (1550.3–5644.6) a | 2476.7 (1508–3766.1) a | 2141.4 (1377.6–3215.1) a | 2281.1 (1454.8–3220) a |
| (1271.7–2955.4) a | ||||||||
| 2 | 1792.3 | 2259.9 (1464.3–3460.7) a | 2061.9 (1370.6–3184.8) a | 1848.1 (1212.9–2984.7) a | 2329.1 (1102–5620.8) a | 2293.7 (1424.6–3455) a | 1868.4 (1286.9–2928.7) a | 1968.2 (1208.9–2942.1) a |
| (1170.8–2686.7) a | ||||||||
| 3 | 1889 | 2228.2 (1435.3–3627.7) a | 2114.3 (1321.8–3304) a | 1922 (1264.1–3062.3) a | 2348 (1221.1–3458.4) a | 2240.5 (1361.1–3542.3) a | 1938 (1253–3117.8) a | 1981.5 (1348.7–2970.9) a |
| (1170.4–2818.6) a | ||||||||
| Fiber (g) | ||||||||
| 1 | 20.1 (13.2–28.2) a | 23.4 (14.4–35.4) a | 20.3 (12.8–30.7) a | 22.1 (14–32.9) a | 17.5 (12.7–29) a | 21.4 (14.8–35) a | 21.9 (13.3–31.6) a | 19.8 (13–29.8) a |
| 2 | 22.2 (15–31.5) b | 26.3 (17–37.4) b | 22.9 (16.4–33.7) b | 24 (15.5–35.7) a | 29 (20.9–37.4) a | 24.5 (17.4–36.5) a | 23.7 (15.7–35.1) a | 22.7 (14.6–32.9) a |
| 3 | 23.3 (15.4–34) b | 26.4 (16.7–38.4) a | 24.9 (16.4–36.9) b | 24.5 (15.3–35.6) a | 24.4 (18.6–48.1) a | 25.5 (17.5–37) a | 24.8 (15.3–36.5) a | 23.3 (15.2–35.3) a |
Appendix D
| Locality | Region | Socio-Economic Level | ||||||
|---|---|---|---|---|---|---|---|---|
| Rural | Urban | North | South | Center and Mexico’s City | Low | Middle | High | |
| Median (p25–p75) | Median (p25–p75) | Median (p25–p75) | Median (p25–p75) | Median (p25–p75) | Median (p25–p75) | Median (p25–p75) | Median (p25–p75) | |
| Energy (kcal) | ||||||||
| 1 | 1846.3 | 1915.4 | 1906.1 | 1922.4 | 1869.1 | 1861 | 1928.1 | 1915.5 |
| (1320.8–2393.5) a | (1403.3–2519.2) a | (1428.4–2547.6) a | (1391.5–2486.7) a | (1335.2–2399.9) a | (1348.7–2424.6) a | (1403–2521.7) a | (1381–2491.4) a | |
| 2 | 1659.4 | 1692 | 1643.2 | 1770.9 | 1645.9 | 1719.2 | 1657.9 | 1689.2 |
| (1253.6–2203.4) b | ||||||||
| (1232.5–2166.8) a | (1266.8–2276.7) b | (1205.2–2210.5) b | (1300–2340) a | (1280.2–2194.8) a | (1253.6–2276.6) b | (1227.7–2281.5) b | ||
| 3 | 1745.6 | 1815.8 | 1762 | 1841.4 (1265.8–2476.9) a | 1790.6 | 1744.8 | 1836.2 | 1815.5 |
| (1233.4–2323.3) a | (1291.4–2427.2) b | (1199.7–2431.6) b | (1297.9–2367.8) a | (1204.3–2363.3) a | (1322.2–2461.7) a | (1296.6–2371.7) a | ||
| Saturated fat (g) | ||||||||
| 1 | 16.9 (9.3–26.9) a | 22.9 (13.9–35.3) a | 22.6 (13.1–34.7) a | 19.1 (10.7–30.3) a | 22.4 (13.4–33.7) a | 16.8 (9.2–27.3) a | 22.8 (13.3–33.3) a | 24 (14.8–36.3) a |
| 2 | 14 (7.8–22.1) b | 18.1 (11.3–28.1) b | 17.4 (9.6–26.9) b | 15.5 (9.3–24.2) b | 18.1 (11.2–28) b | 14.2 (7.5–22.5) b | 18.1 (10.5–26.2) b | 18.7 (12–29.4) b |
| 3 | 14.3 (8.1–22.7) b | 19.3 (10.8–30) b | 17.6 (10–28.8) b | 15.9 (9–26) b | 18.7 (10.5–30.7) b | 14.8 (8.1–24.5) a | 18.7 (10.1–28.5) b | 19.8 (12.3–30.4) b |
| Trans fat (g) | ||||||||
| 1 | 0.15 (0.02–0.43) a | 0.29 (0.07–0.62) a | 0.19 (0.04–0.53) a | 0.23 (0.04–0.5) a | 0.29 (0.07–0.63) a | 0.15 (0.03–0.41) a | 0.26 (0.06–0.54) a | 0.29 (0.09–0.65) a |
| 2 | 0.12 (0.02–0.39) a | 0.23 (0.05–0.53) a | 0.16 (0.04–0.48) a | 0.2 (0.03–0.42) a | 0.23 (0.05–0.53) a | 0.12 (0.02–0.39) a | 0.23 (0.04–0.46) a | 0.24 (0.06–0.59) a |
| 3 | 0.12 (0.02–0.36) a | 0.23 (0.05–0.54) a | 0.14 (0.03–0.53) a | 0.18 (0.03–0.42) a | 0.23 (0.05–0.51) a | 0.13 (0.03–0.42) a | 0.16 (0.03–0.45) a | 0.27 (0.06–0.55) a |
| Total Sugar (g) | ||||||||
| 1 | 67.1 (36–105.6) a | 92.8 (54.4–135.8) a | 91 (53.9–130.8) a | 76.5 (41.3–120.9) a | 88.7 (54.4–130.2) a | 69.3 (36.1–112.6) a | 86.9 (47–132.2) a | 94.1 (63–136.3) a |
| 2 | 46.5 (26.8–71.1) b | 54.3 (30.3–89.4) b | 45.2 (27.8–78.2) b | 50.3 (27.1–84.2) b | 55.3 (32.6–88.3) b | 43.6 (23.9–71.1) b | 48 (27.5–78.5) b | 60 (37.8–97.2) b |
| 3 | 47.2 (26.3–75.7) b | 57.7 (32–89.8) b | 50.4 (28.5–82.5) b | 51.6 (27.9–83.3) b | 59 (34.4–88.7) b | 44.2 (25.7–75.6) b | 52.8 (28.3–85.8) b | 65.8 (36.5–92.7) b |
| Sodium (mg) | ||||||||
| 1 | 1998.3 | 2306 | 2340.8 | 1992.6 | 2318.1 | 2010.4 | 2308.6 | 2340.8 |
| (1221.1–3231.9) a | (1521.5–3422.9) a | (1521.7–3660.3) a | (1249.1–3121.4) a | (1500.5–3422.9) a | (1223.1–3236.6) a | (1450.3–3509.8) a | (1596.4–3422.9) a | |
| 2 | 1789 | 2033.1 | 1988.1 | 1839.3 | 2121.7 | 1817.2 | 1963.8 (1288–3208.1) a | 2071.1 |
| (1107.4–2860.8) a | (1360.5–3171.7) b | (1293.3–3192.2) a | (1136.4–2823.6) a | (1392.5–3208.1) a | (1107.4–2901.6) a | (1423.7–3172.5) a | ||
| 3 | 1874 | 2052.9 | 2086.6 | 1824.1 | 2163.5 | 1922.5 | 2020.4 | 2142.9 |
| (1378.5–3421.4) a | ||||||||
| (1172.3–3042.3) a | (1358.7–3235.7) a | (1352.3–3189.6) a | (1200.8–2874.4) a | (1201.8–3041.8) a | (1229.1–3161.7) a | (1501.5–3381.7) a | ||
| Fiber (g) | ||||||||
| 1 | 25.1 (15.2–36.2) a | 20.3 (12.8–30.4) a | 17 (11.4–28) a | 24.1 (15.9–35.8) a | 21.2 (13.9–30.6) a | 24.4 (15.1–36.7) a | 21.2 (13.2–31.9) a | 19.7 (12.5–29.3) a |
| 2 | 27.5 (17.3–37.9) a | 22.8 (15.4–33.1) b | 21.3 (14–30.6) b | 26.6 (17.3–37.6) a | 23.1 (16.2–33.5) a | 26.4 (17.9–37.8) b | 22.6 (15.4–33.8) b | 21.9 (15.2–32.6) b |
| 3 | 27.1 (16.3–40) a | 23.9 (16–35.2) b | 23 (13.8–33.2) b | 27 (17–38.2) a | 23.9 (16–36.4) a | 27 (16.6–39.4) a | 24.2 (16.1–35.8) a | 23.4 (15.9–34.5) b |
References
- Barquera, S.; Campos, I.; Rivera, J.A. Mexico attempts to tackle obesity: The process, results, push backs and future challenges. Obes. Rev. 2013, 14 (Suppl. 2), 69–78. [Google Scholar] [CrossRef] [PubMed]
- Popkin, B.M.; Adair, L.S.; Ng, S.W. Global nutrition transition and the pandemic of obesity in developing countries. Nutr. Rev. 2012, 70, 3–21. [Google Scholar] [CrossRef] [PubMed]
- Hernández, M.; Rivera, J.; Shamah, T.; Cuevas, L.; Gómez, L.; Gaona, E.; Martínez, M.R.; Gómez-Humarán, I.M.; Hernández, P.S.; Hernández, S.V.; et al. Encuesta Nacional de Salud y Nutrición de Medio Camino 2016; Instituto Nacional de Salud Pública: Cuernavaca, Mexico, 2016. [Google Scholar]
- Alegre-Díaz, J.; Herrington, W.; López-Cervantes, M.; Gnatiuc, L.; Ramirez, R.; Hill, M.; Baigent, C.; McCarthy, M.I.; Lewington, S.; Collins, R.; et al. Diabetes and Cause-Specific Mortality in Mexico City. N. Engl. J. Med. 2016, 375, 1961–1971. [Google Scholar] [CrossRef] [PubMed]
- Stevens, G.; Dias, R.H.; Thomas, K.J.A.; Rivera, J.A.; Carvalho, N.; Barquera, S.; Hill, K.; Ezzati, M. Characterizing the epidemiological transition in Mexico: National and subnational burden of diseases, injuries, and risk factors. PLoS Med. 2008, 5. [Google Scholar] [CrossRef] [Green Version]
- Brinsden, H.; Lobstein, T.; Landon, J.; Kraak, V.; Sacks, G.; Kumanyika, S.; Swinburn, B.; Barquera, S.; Friel, S.; Hawkes, C.; et al. Monitoring policy and actions on food environments: Rationale and outline of the INFORMAS policy engagement and communication strategies. Obes. Rev. 2013, 14, 13–23. [Google Scholar] [CrossRef] [PubMed]
- Vandevijvere, S.; Swinburn, B. Towards global benchmarking of food environments and policies to reduce obesity and diet-related non-communicable diseases: Design and methods for nation-wide surveys. BMJ Open 2014, 4, e005339. [Google Scholar] [CrossRef] [PubMed]
- Cecchini, M.; Warin, L. Impact of food labeling systems on food choices and eating behaviours: A systematic review and meta-analysis of randomized studies. Obes. Rev. 2016, 17, 201–210. [Google Scholar] [CrossRef] [PubMed]
- Savoie, N.; Barlow, K.; Harvey, K.L.; Binnie, M.A.; Pasut, L. Consumer perceptions of front-of-package labeling systems and healthiness of foods. Can. J. Public Health 2013, 104, e359–e363. [Google Scholar] [CrossRef] [PubMed]
- Comisión Federal Para la Protección Contra Riesgos Sanitarios COFEPRIS. Manual de Etiquetado Frontal Nutrimental. 2015. Available online: http://www.cofepris.gob.mx/AS/Documents/COMISIÓN (accessed on 10 January 2018).
- Secretaría de Salud, D.R. Estrategia Nacional para la Prevención y el Control del Sobrepeso, la Obesidad y la Diabetes. Secr Salud.; 2013. Available online: http://www.gob.mx/cms/uploads/attachment/file/40477/EstrategiaNacionalSobrepeso.pdf (accessed on 10 January 2018).
- Diario Oficial de la Federación. NORMA Oficial Mexicana NOM-051-SCFI/SSA1-2010. Especificaciones Generales de Etiquetado Para Alimentos y Bebidas no Alcohólicas Preenvasados-Información Comercial y Sanitaria. 2010; pp. 1–31. Available online: http://dof.gob.mx/nota_detalle.php?codigo=5137518&fecha=05/04/2010 (accessed on 5 August 2017).
- Joint WHO/FAO Consultation. Diet, Nutrition, and the Prevention of Chronic Diseases; Technical Report Series No. 916; Joint WHO/FAO Consultation: Geneva, Switzerland, 2003. [Google Scholar]
- Lupton, J.R.; Balentine, D.A.; Black, R.M.; Hildwine, R.; Ivens, B.J.; Kennedy, E.T.; Packard, P.T.; Sperber, B.R.; Steffen, D.; Story, M. The Smart Choices front-of-package nutrition labeling program: Rationale and development of the nutrition criteria. Am. J. Clin. Nutr. 2010, 91, 1078S–1089S. [Google Scholar] [CrossRef] [PubMed]
- Roodenburg, A.J.; Popkin, B.M.; Seidell, J.C. Development of international criteria for a front of package food labeling system: The International Choices Programme. Eur. J. Clin. Nutr. 2011, 65, 1190–1200. [Google Scholar] [CrossRef] [PubMed]
- Diario Oficial de la Federación. ACUERDO Por El Que Se Emiten Los Lineamientos a Que Se Refiere El Artículo 25 Del Reglamento De Control Sanitario De Productos y Servicios Que Deberán Observar Los Productores De Alimentos y Bebidas No Alcohólicas Preenvasadas Para Efectos De La Información Que Deberán Ostentar En El Área Frontal De Exhibición, Así Como Los Criterios Y Las Características Para La Obtención y Uso Del Distintivo Nutrimental A Que Se Refiere El Artículo 25 Bis Del Reglamento De Control Sanitario De Productos y Servicios. Secretaría De Salud. Mexico; 2014. Available online: http://www.dof.gob.mx/nota_detalle.php?codigo=5340693&fecha=15/04/2014 (accessed on 27 June 2017).
- EU Pledge. Nutrition Criteria. White Paper; EU Pledge: Europe, 2015; Available online: http://www.eu-pledge.eu/sites/eu-pledge.eu/files/releases/EU_Pledge_Nutrition_White_Paper_Nov_2012.pdf (accessed on 27 June 2017).
- Bennett, C.; Manuel, D.G. Reporting guidelines for modelling studies. BMC Med. Res. Methodol. 2012, 12. [Google Scholar] [CrossRef] [PubMed]
- Grieger, J.A.; Johnson, B.J.; Wycherley, T.P.; Golley, R.K. Evaluation of Simulation Models that Estimate the Effect of Dietary Strategies on Nutritional Intake: A Systematic Review. J. Nutr. 2017, 147, 908–931. [Google Scholar] [CrossRef] [PubMed]
- INSP. 24-Hour Recall Database ENSANUT 2012. Available online: http://ensanut.insp.mx/inai1.php (accessed on 10 January 2018).
- Romero-Martínez, M.; Shamah-Levy, T.; Franco-Nunez, A.; Villalpando, S.; Cuevas-Nasu, L.; Gutierrez, J.P.; Rivera-Dommarco, J.A. National Health and Nutrition Survey 2012: Design and coverage. Salud Publica Mex. 2013, 55 (Suppl. 2), S332–S340. (In Spanish) [Google Scholar] [CrossRef] [PubMed]
- Zimmerman, T.P.; Hull, S.G.; McNutt, S.; Mittl, B.; Islam, N.; Guenther, P.M.; Thompson, F.E.; Potischman, N.A.; et al. Challenges in converting an interviewer-administered food probe database to self-administration in the National Cancer Institute Automated Self-administered 24-Hour Recall (ASA24). J. Food Compost. Anal. 2009, 22 (Suppl. 1), S48–S51. [Google Scholar] [CrossRef] [PubMed]
- Gutiérrez, J.P.; Rivera-Dommarco, J.; Shamah-Levy, T.; Villalpando-Hernández, S.; Franco, A.; Cuevas-Nasu, L.; Romero-Martínez, M.; Hernández-Ávila, M. Encuesta Nacional de Salud y Nutrición 2012; Instituto Nacional de Salud Pública: Cuernavaca, México, 2012. [Google Scholar]
- Blanton, C.A.; Moshfegh, A.J.; Baer, D.J.; Kretsch, M.J. The USDA automated multiple-pass method accurately estimates group total energy and nutrient intake. J. Nutr. 2006, 136, 2594–2599. [Google Scholar] [CrossRef] [PubMed]
- Goldberg, G.R.; Black, A.E.; Jebb, S.A.; Cole, T.J.; Murgatroyd, P.R.; Coward, W.A.; Prentice, A.M. Critical evaluation of energy intake data using fundamental principles of energy physiology: 1. Derivation of cut-off limits to identify under-recording. Eur. J. Clin. Nutr. 1991, 45, 569–581. [Google Scholar] [PubMed]
- López-Olmedo, N.; Carriquiry, A.L.; Rodríguez-Ramírez, S.; Ramírez-Silva, I.; Espinosa-Montero, J.; Hernández-Barrera, L.; Campirano, F.; Martínez-Tapia, B.; Rivera, J.A. Usual intake of added sugars and saturated fats is high while dietary fiber is low in the Mexican population. J. Nutr. 2016, 146, 1856S–1865S. [Google Scholar] [CrossRef] [PubMed]
- Instituto Nacional de Salud Pública. Bases de Datos del Valor Nutritivo de los Alimentos; Compilación del Instituto Nacional de Salud Pública: Cuernavaca, México, 2012. [Google Scholar]
- United States Department of Agriculture (USDA). USDA National Nutrient Database for Standard Reference. Agricultural Research Service. National Agricultural Library; 2011. Available online: http://ndb.nal.usda.gov/ (accessed on 10 January 2018).
- Pérez, L.A.; Palacios, G.B.; Castro, B.A. Sistema Mexicano de Alimentos Equivalentes, 3rd ed.; Fomento de Nutrición y Salud A.C.: Ciudad de México, México, 2008. [Google Scholar]
- Instituto Nacional de Ciencias Médicas y Nutrición Salvador Zubirán. Tablas de Composición de Alimentos; INNSZ: Ciudad de México, México, 1999; p. 248. [Google Scholar]
- United States Department of Agriculture (USDA). USDA Database for the Added Sugars Content of Selected Foods, Release 1; United States Department of Agriculture: Washington, DC, USA, 2006.
- Stata Corporation. Stata 7 Reference Manual Extract, Release 7; Stata Press: College Station, TX, USA, 2001. [Google Scholar]
- World Health Organization (WHO). Global Strategy on Diet, Physical Activity and Health; Resolution of the Fifty-Seventh World Health Assembly; World Health Organization: Geneva, Switzerland, 2004. [Google Scholar]
- Fletcher, R.H.; Fairfield, K.M. Vitamins for chronic disease prevention in adults: Clinical applications. JAMA 2002, 287, 3127–3129. [Google Scholar] [CrossRef] [PubMed]
- Barquera, S.; Hernández-Barrera, L.; Tolentino, M.L.; Espinosa, J.; Ng, S.W.; Rivera, J.; Popkin, B.M. Energy Intake from beverages is increasing among Mexican adolescents and adults. J. Nutr. 2008, 138, 2454–2461. [Google Scholar] [CrossRef] [PubMed]
- Vartanian, L.R.; Schwartz, M.B.; Brownell, K.D. Effects of soft drink consumption on nutrition and health: A systematic review and metanalysis. Am. J. Public Health 2007, 97, 667–675. [Google Scholar] [CrossRef] [PubMed]
- Malik, V.S.; Schulze, M.B.; Hu, F.B. Intake of sugar-sweetened beverages and weight gain: A systematic review. Am. J. Clin. Nutr. 2006, 84, 274–288. [Google Scholar] [PubMed]
- Schulze, M.B.; Manson, J.E.; Ludwig, D.S.; Colditz, G.A.; Stampfer, M.J.; Willett, W.C.; Hu, F.B. Sugar-sweetened beverages, weight gain, and incidence of type 2 diabetes in young and middle-aged women. JAMA 2004, 292, 927–934. [Google Scholar] [CrossRef] [PubMed]
- Roodenburg, A.J.; van Ballegooijen, A.J.; Dotsch-Klerk, M.; van der Voet, H.; Seidell, J.C. Modelling of usual nutrient intakes: Potential impact of the choices programme on nutrient intakes in young Dutch adults. PLoS ONE 2013, 8, e72378. [Google Scholar] [CrossRef] [PubMed] [Green Version]
- Roodenburg, A.J.; Schlatmann, A.; Dotsch-Klerk, M.; Daamen, R.; Dong, J.; Guarro, M.; Stergiou, M.; Sayed, N.; Ronoh, E.; Jansen, L.; et al. Potential effects of nutrient profiles on nutrient intakes in the Netherlands, Greece, Spain, USA, Israel, China and South-Africa. PLoS ONE 2011, 6, e14721. [Google Scholar] [CrossRef] [PubMed]
- Ni Mhurchu, C.; Eyles, H.; Choi, Y.H. Effects of a voluntary front-of-pack nutrition labelling system on packaged food reformulation: The health star rating system in New Zealand. Nutrients 2017, 9. [Google Scholar] [CrossRef] [PubMed]
- Yang, C.S.; Liu, X.; Ford, P.; Leishman, S.; Schubert, L. Analysis of Front-of-Pack labelling systems on packaged non-alcoholic beverages for Australian consumer guidance. Nutr. Diet. 2016, 73, 410–419. [Google Scholar] [CrossRef]
- Thomson, R.K.; McLean, R.M.; Ning, S.X.; Mainvil, L.A. Tick front-of-pack label has a positive nutritional impact on foods sold in New Zealand. Public Health Nutr. 2016, 19, 2949–2958. [Google Scholar] [CrossRef] [PubMed]
- Schickenberg, B.; Van Assema, P.; Brug, J.; Verkaik-Kloosterman, J.; Ocké, M.C.; De Vries, N.K. Replacing foods high in saturated fat by low-saturated fat alternatives: A computer simulation of the potential effects on reduction of saturated fat consumption. Br. J. Nutr. 2009, 102, 478–483. [Google Scholar] [CrossRef] [PubMed]
- Thomson, J.L.; Tussing-Humphreys, L.M.; Onufrak, S.J.; Zoellner, J.M.; Connell, C.L.; Bogle, M.L.; Yadrick, K. A simulation study of the potential effects of healthy food and beverage substitutions on diet quality and total energy intake in Lower Mississippi Delta adults. J. Nutr. 2011, 141, 2191–2197. [Google Scholar] [CrossRef] [PubMed]
- Verger, E.O.; Holmes, B.A.; Huneau, J.F.; Mariotti, F. Simple changes within dietary subgroups can rapidly improve the nutrient adequacy of the diet of French adults. J. Nutr. 2014, 144, 929–936. [Google Scholar] [CrossRef] [PubMed]
- Batis, C.; Rodríguez-Ramírez, S.; Ariza, A.C.; Rivera, J.A. Intakes of Energy and Discretionary Food in Mexico Are Associated with the Context of Eating: Mealtime, Activity, and Place. J. Nutr. 2016, 146, 1907S–1915S. [Google Scholar] [CrossRef] [PubMed]
- World Health Organization. Physical Status: The Use and Interpretation of Anthropometry; World Health Organization: Geneva, Switzerland, 1995. [Google Scholar]
| n | % + | |
|---|---|---|
| Sex | ||
| Women | 1258 | 52.1 |
| Men | 906 | 47.9 |
| Age (years) | ||
| 20–39 | 1192 | 54.6 |
| 40–59 | 972 | 45.4 |
| BMI * | ||
| Underweight | 22 | 0.7 |
| Normal weight | 564 | 28.2 |
| Overweight | 868 | 40.4 |
| Obesity | 710 | 30.7 |
| Region | ||
| North | 544 | 19.8 |
| South | 769 | 31.1 |
| Center and Mexico’s City | 851 | 49 |
| Locality | ||
| Rural | 756 | 25.3 |
| Urban | 1408 | 74.7 |
| Socioeconomic level | ||
| Low | 776 | 29.4 |
| Middle | 703 | 30.4 |
| High | 685 | 40.2 |
| Total | 2164 | 100 |
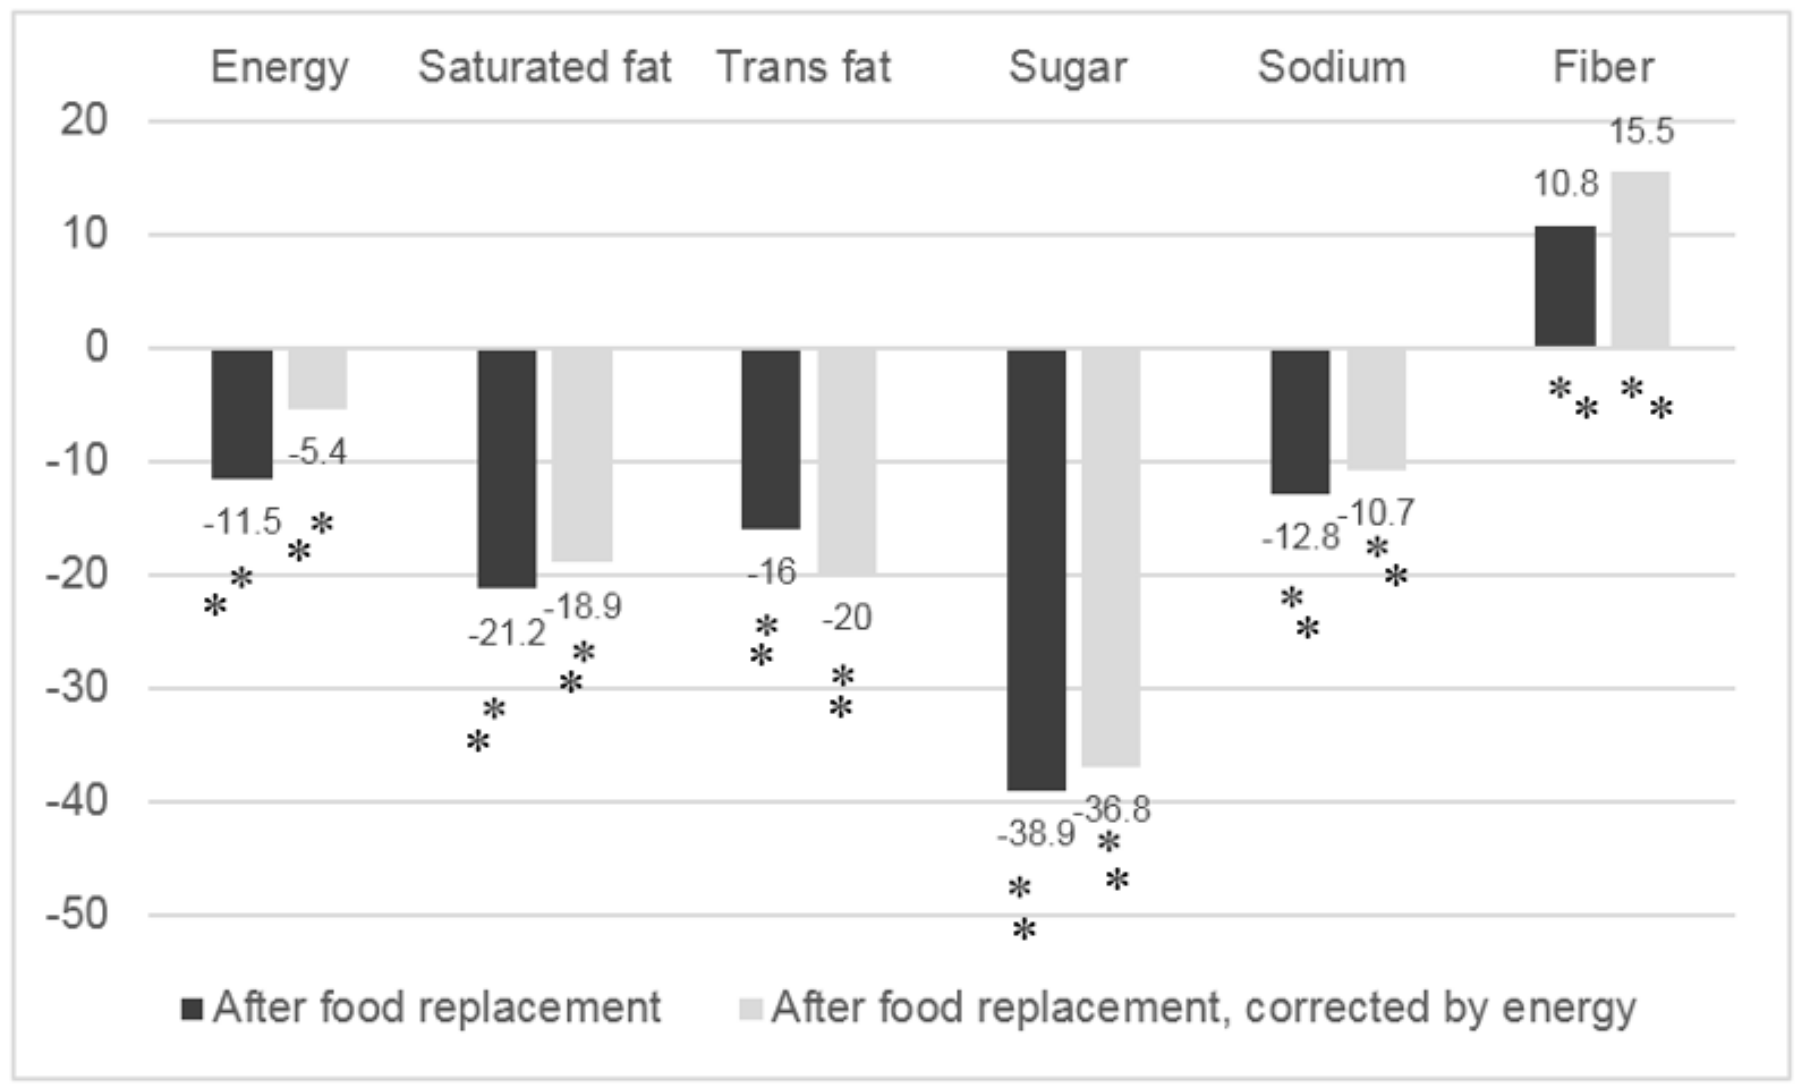
| With MCNE Criteria | With COFEPRIS Criteria | |
|---|---|---|
| National | National | |
| Median (p25–p75) + | Median (p25–p75) + | |
| Energy (kcal) | ||
| Scenario 1 Before replacement | 1905 (1383–2477) a | 1905 (1383–2477) a |
| Scenario 2 After replacement | 1685 (1262–2236) b,* | 1821 (1330–2407) a,* |
| Scenario 3 Corrected by energy | 1802 (1276–2407) b,* | 1884 (1375–2465) a,* |
| Saturated fat (g) | ||
| Scenario 1 Before replacement | 22 (13–33) a | 22 (13–33) a |
| Scenario 2 After replacement | 17 (10–26) b,* | 19 (12–30) a,* |
| Scenario 3 Corrected by energy | 18 (10–29) b,* | 21 (12–31) a,* |
| Trans fat (g) | ||
| Scenario 1 Before replacement | 0.25 (0.05–0.59) a | 0.25 (0.05–0.59) a |
| Scenario 2 After replacement | 0.21 (0.04–0.49) a | 0.19 (0.03–0.46) b |
| Scenario 3 Corrected by energy | 0.2 (0.04–0.49) b | 0.2 (0.03–0.46) b |
| Total Sugar (g) | ||
| Scenario 1 Before replacement | 86 (50–128) a | 86 (50–128) a |
| Scenario 2 After replacement | 52 (29–86) b,* | 84 (49–123) a,* |
| Scenario 3 Corrected by energy | 54 (31–86) b,* | 85 (49–126) a,* |
| Sodium (mg) | ||
| Scenario 1 Before replacement | 2257 (1454–3384) a | 2257 (1454–3384) a |
| Scenario 2 After replacement | 1968 (1288–3084) b | 2006 (1274–3082) b |
| Scenario 3 Corrected by energy | 2014 (1311–3177) b | 2039 (1287–3156) b |
| Fiber (g) | ||
| Scenario 1 Before replacement | 21 (14–32) a | 21 (14–32) a |
| Scenario 2 After replacement | 24 (16–35) b,* | 22 (15–32) a,* |
| Scenario 3 Corrected by energy | 25 (16–36) b,* | 23 (15–33) a,* |
© 2018 by the authors. Licensee MDPI, Basel, Switzerland. This article is an open access article distributed under the terms and conditions of the Creative Commons Attribution (CC BY) license (http://creativecommons.org/licenses/by/4.0/).
Share and Cite
Mendoza, R.; Tolentino-Mayo, L.; Hernández-Barrera, L.; Nieto, C.; Monterrubio-Flores, E.A.; Barquera, S. Modifications in the Consumption of Energy, Sugar, and Saturated Fat among the Mexican Adult Population: Simulation of the Effect When Replacing Processed Foods that Comply with a Front of Package Labeling System. Nutrients 2018, 10, 101. https://doi.org/10.3390/nu10010101
Mendoza R, Tolentino-Mayo L, Hernández-Barrera L, Nieto C, Monterrubio-Flores EA, Barquera S. Modifications in the Consumption of Energy, Sugar, and Saturated Fat among the Mexican Adult Population: Simulation of the Effect When Replacing Processed Foods that Comply with a Front of Package Labeling System. Nutrients. 2018; 10(1):101. https://doi.org/10.3390/nu10010101
Chicago/Turabian StyleMendoza, Rosario, Lizbeth Tolentino-Mayo, Lucia Hernández-Barrera, Claudia Nieto, Eric A. Monterrubio-Flores, and Simón Barquera. 2018. "Modifications in the Consumption of Energy, Sugar, and Saturated Fat among the Mexican Adult Population: Simulation of the Effect When Replacing Processed Foods that Comply with a Front of Package Labeling System" Nutrients 10, no. 1: 101. https://doi.org/10.3390/nu10010101
APA StyleMendoza, R., Tolentino-Mayo, L., Hernández-Barrera, L., Nieto, C., Monterrubio-Flores, E. A., & Barquera, S. (2018). Modifications in the Consumption of Energy, Sugar, and Saturated Fat among the Mexican Adult Population: Simulation of the Effect When Replacing Processed Foods that Comply with a Front of Package Labeling System. Nutrients, 10(1), 101. https://doi.org/10.3390/nu10010101