
Diurnal Cycle in Atmospheric Water over Switzerland


Abstract
1. Introduction
2. Instrument, Data and Analysis
2.1. The Microwave Radiometer TROWARA
- CF1: thin liquid water clouds (2.3 g/m< ILW < 30 g/m),
- CF2: thick supercooled liquid water clouds (ILW > 30 g/m and K),
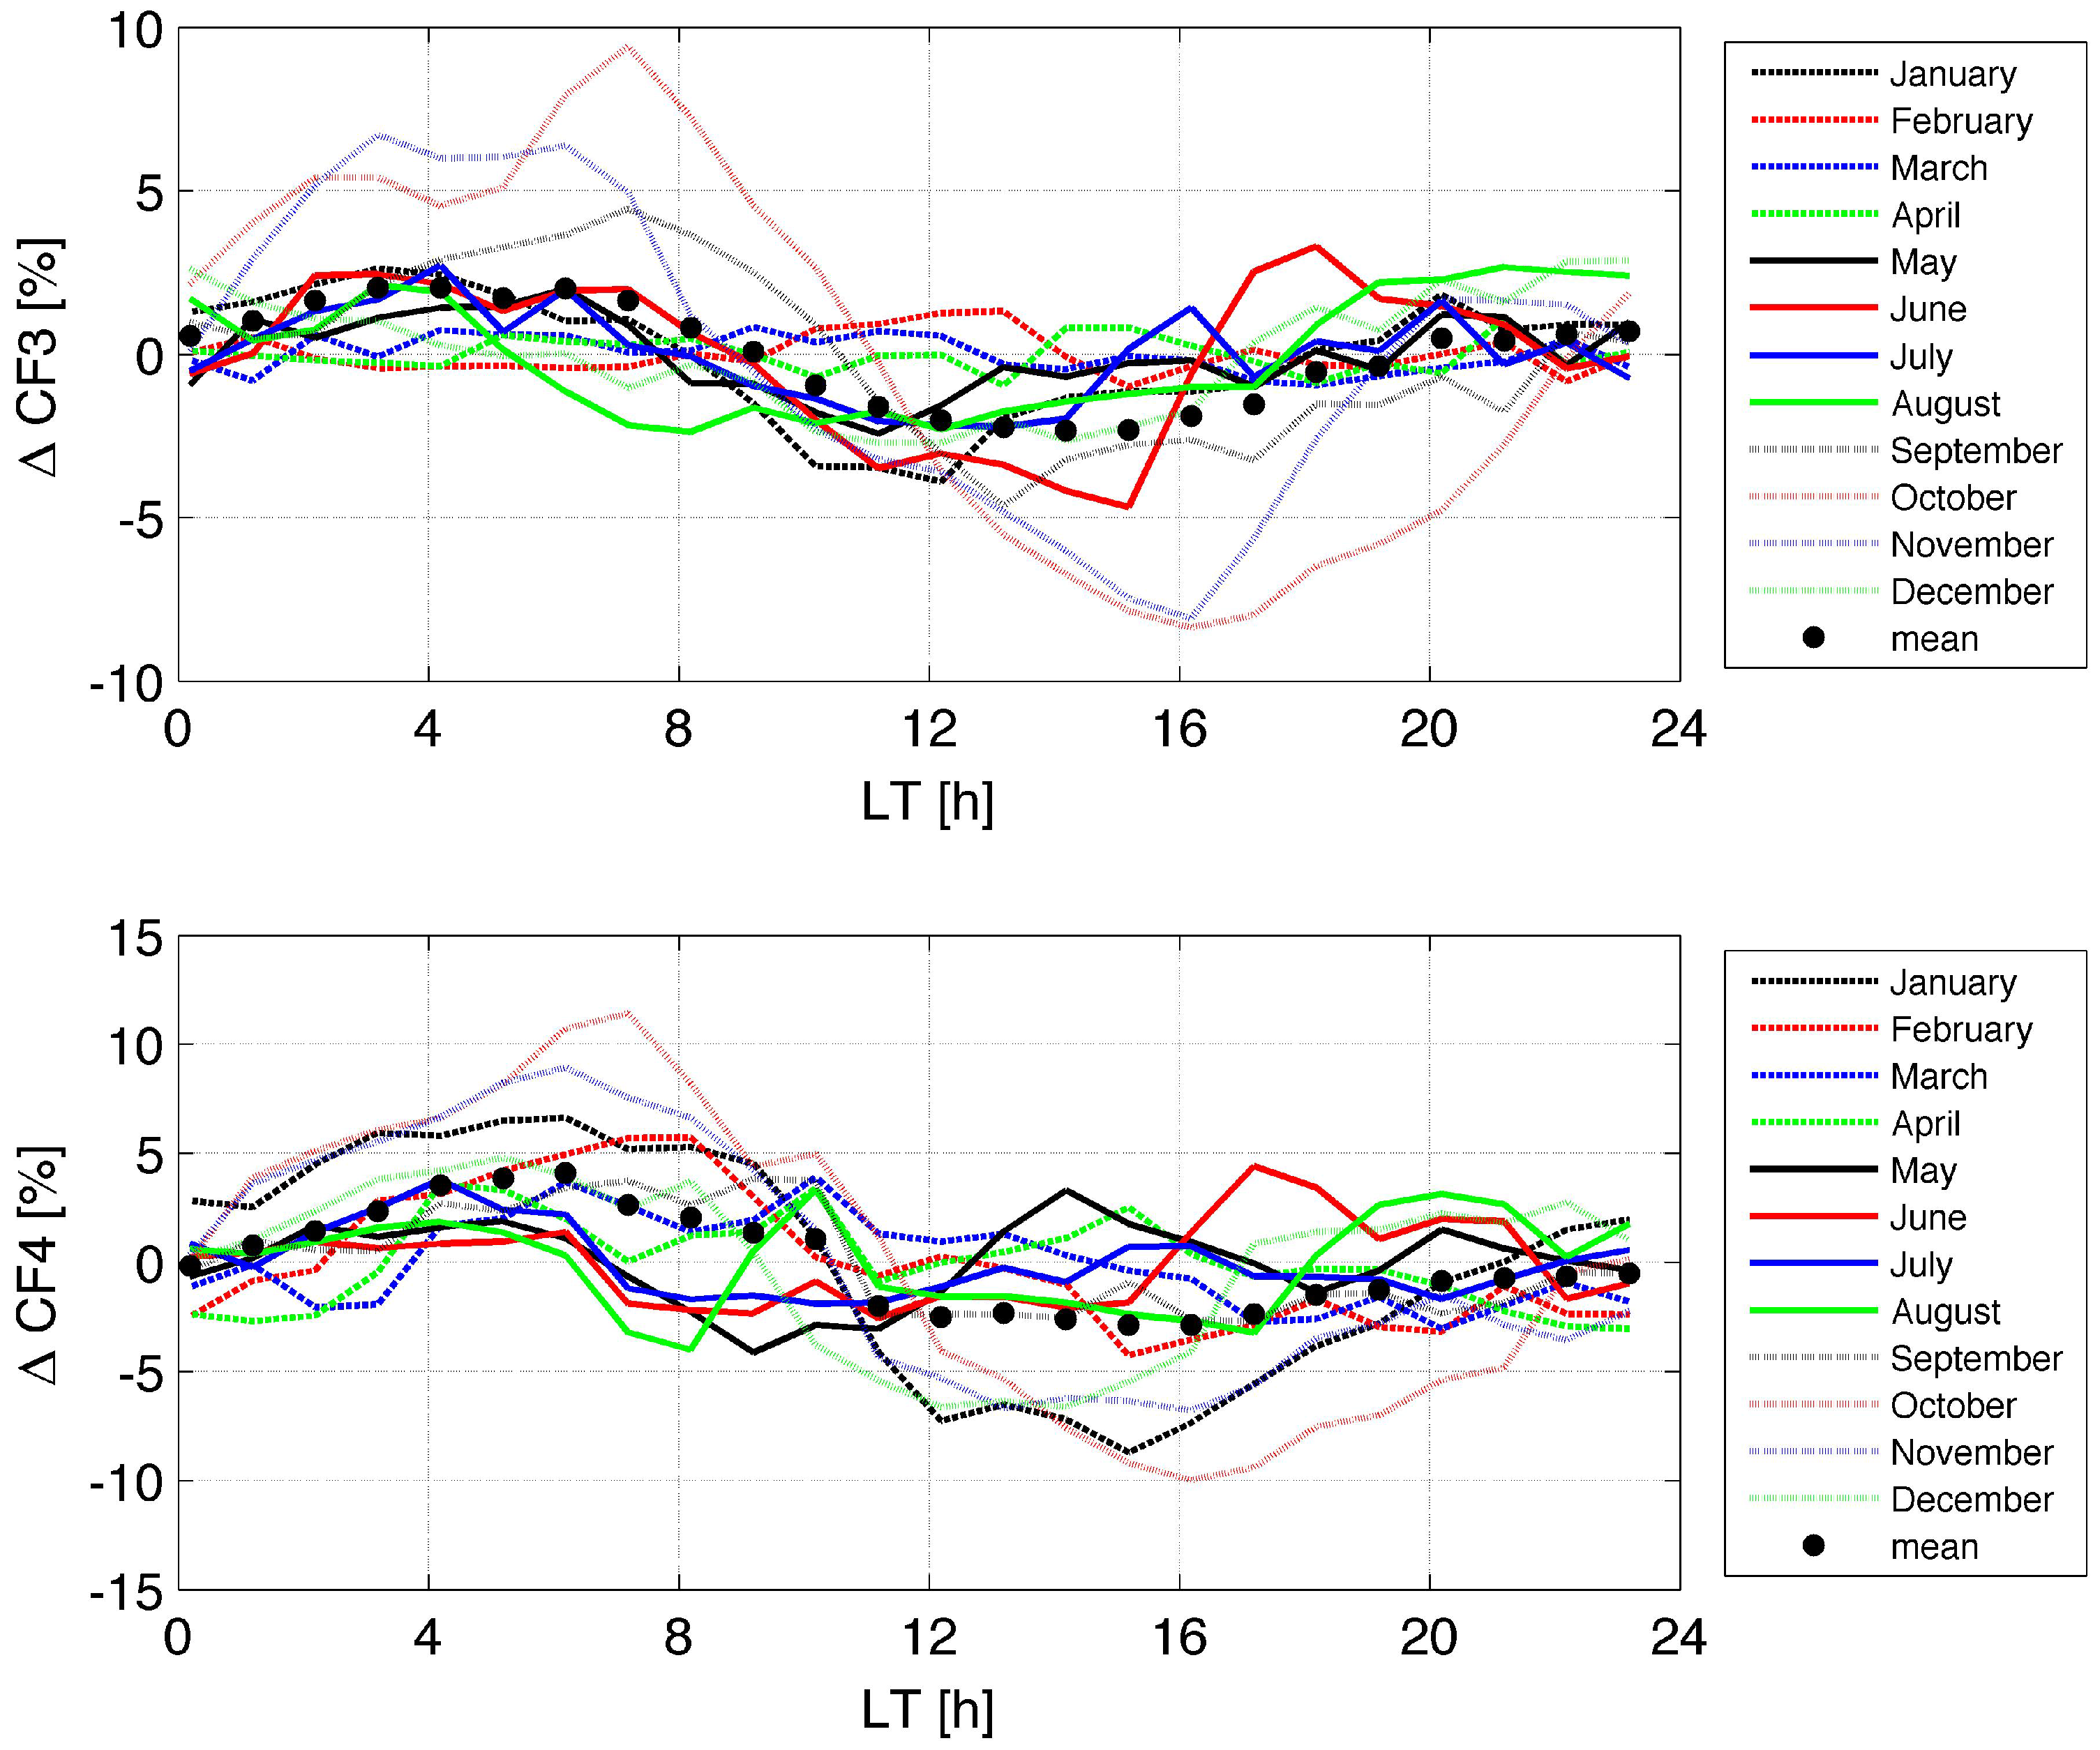
- CF3: thick warm liquid water clouds (ILW > 30 g/m and K),
- CF4: all liquid water clouds (ILW g/m).
2.2. Data Analysis
3. Results
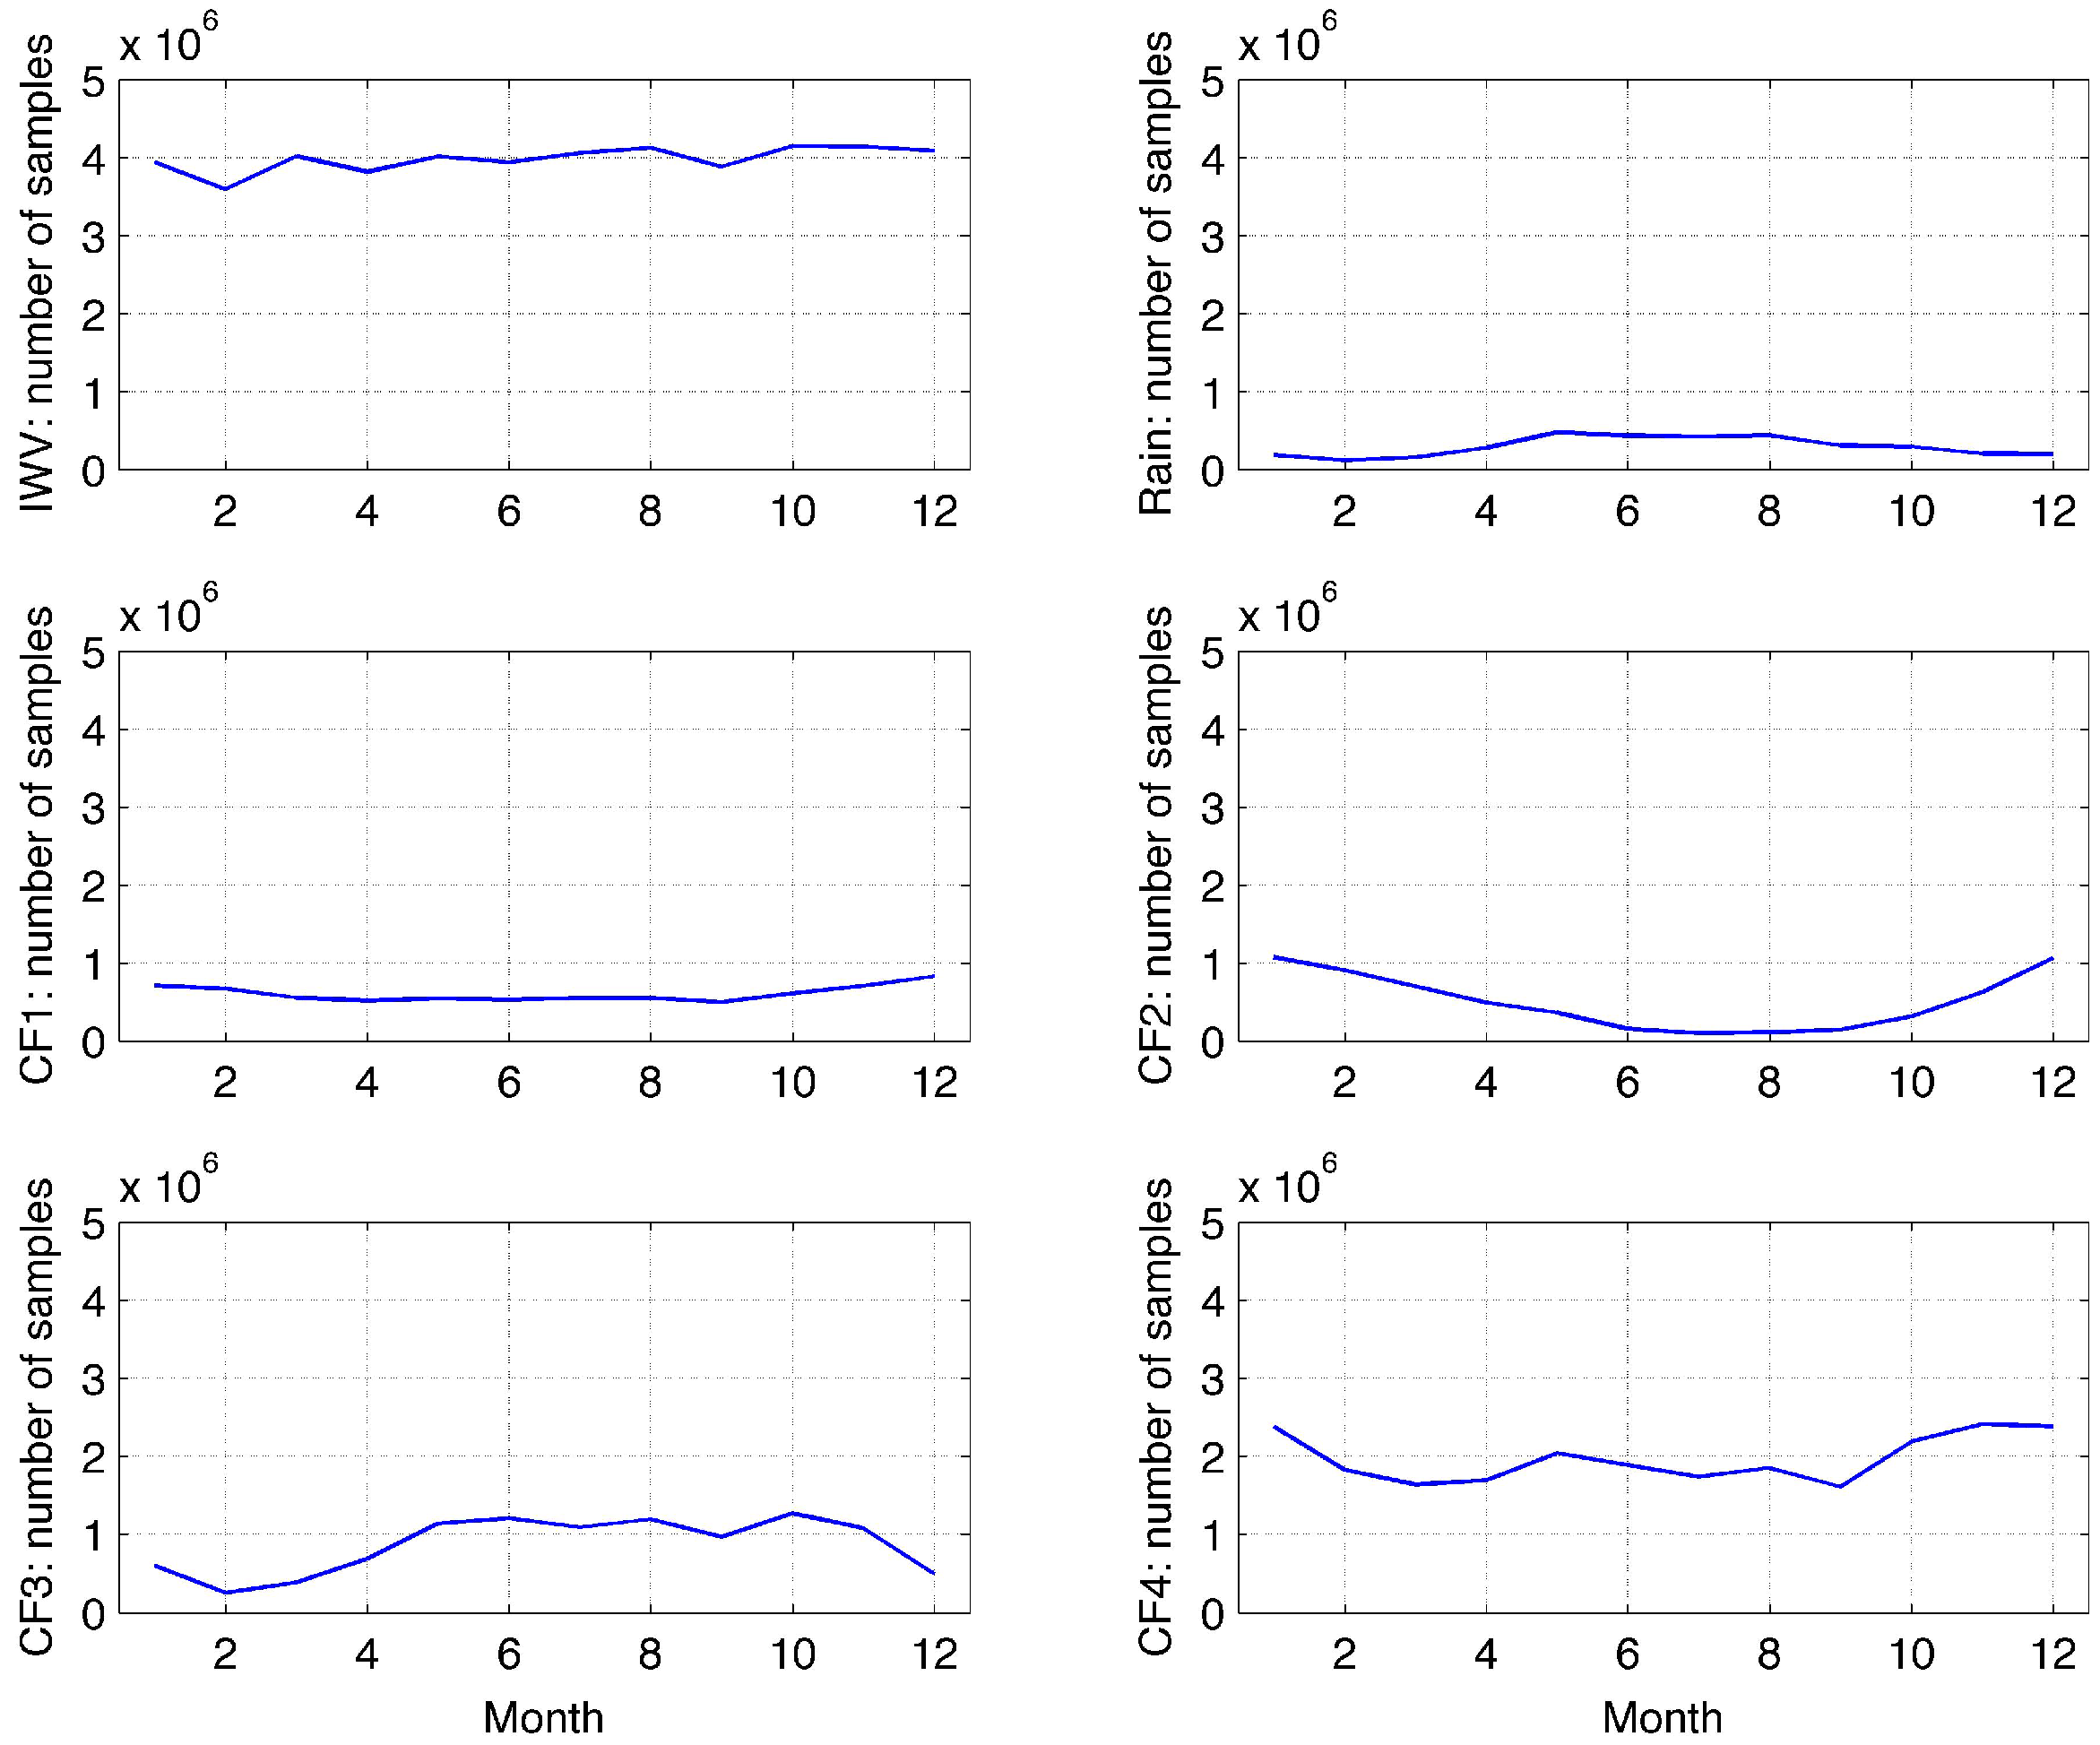
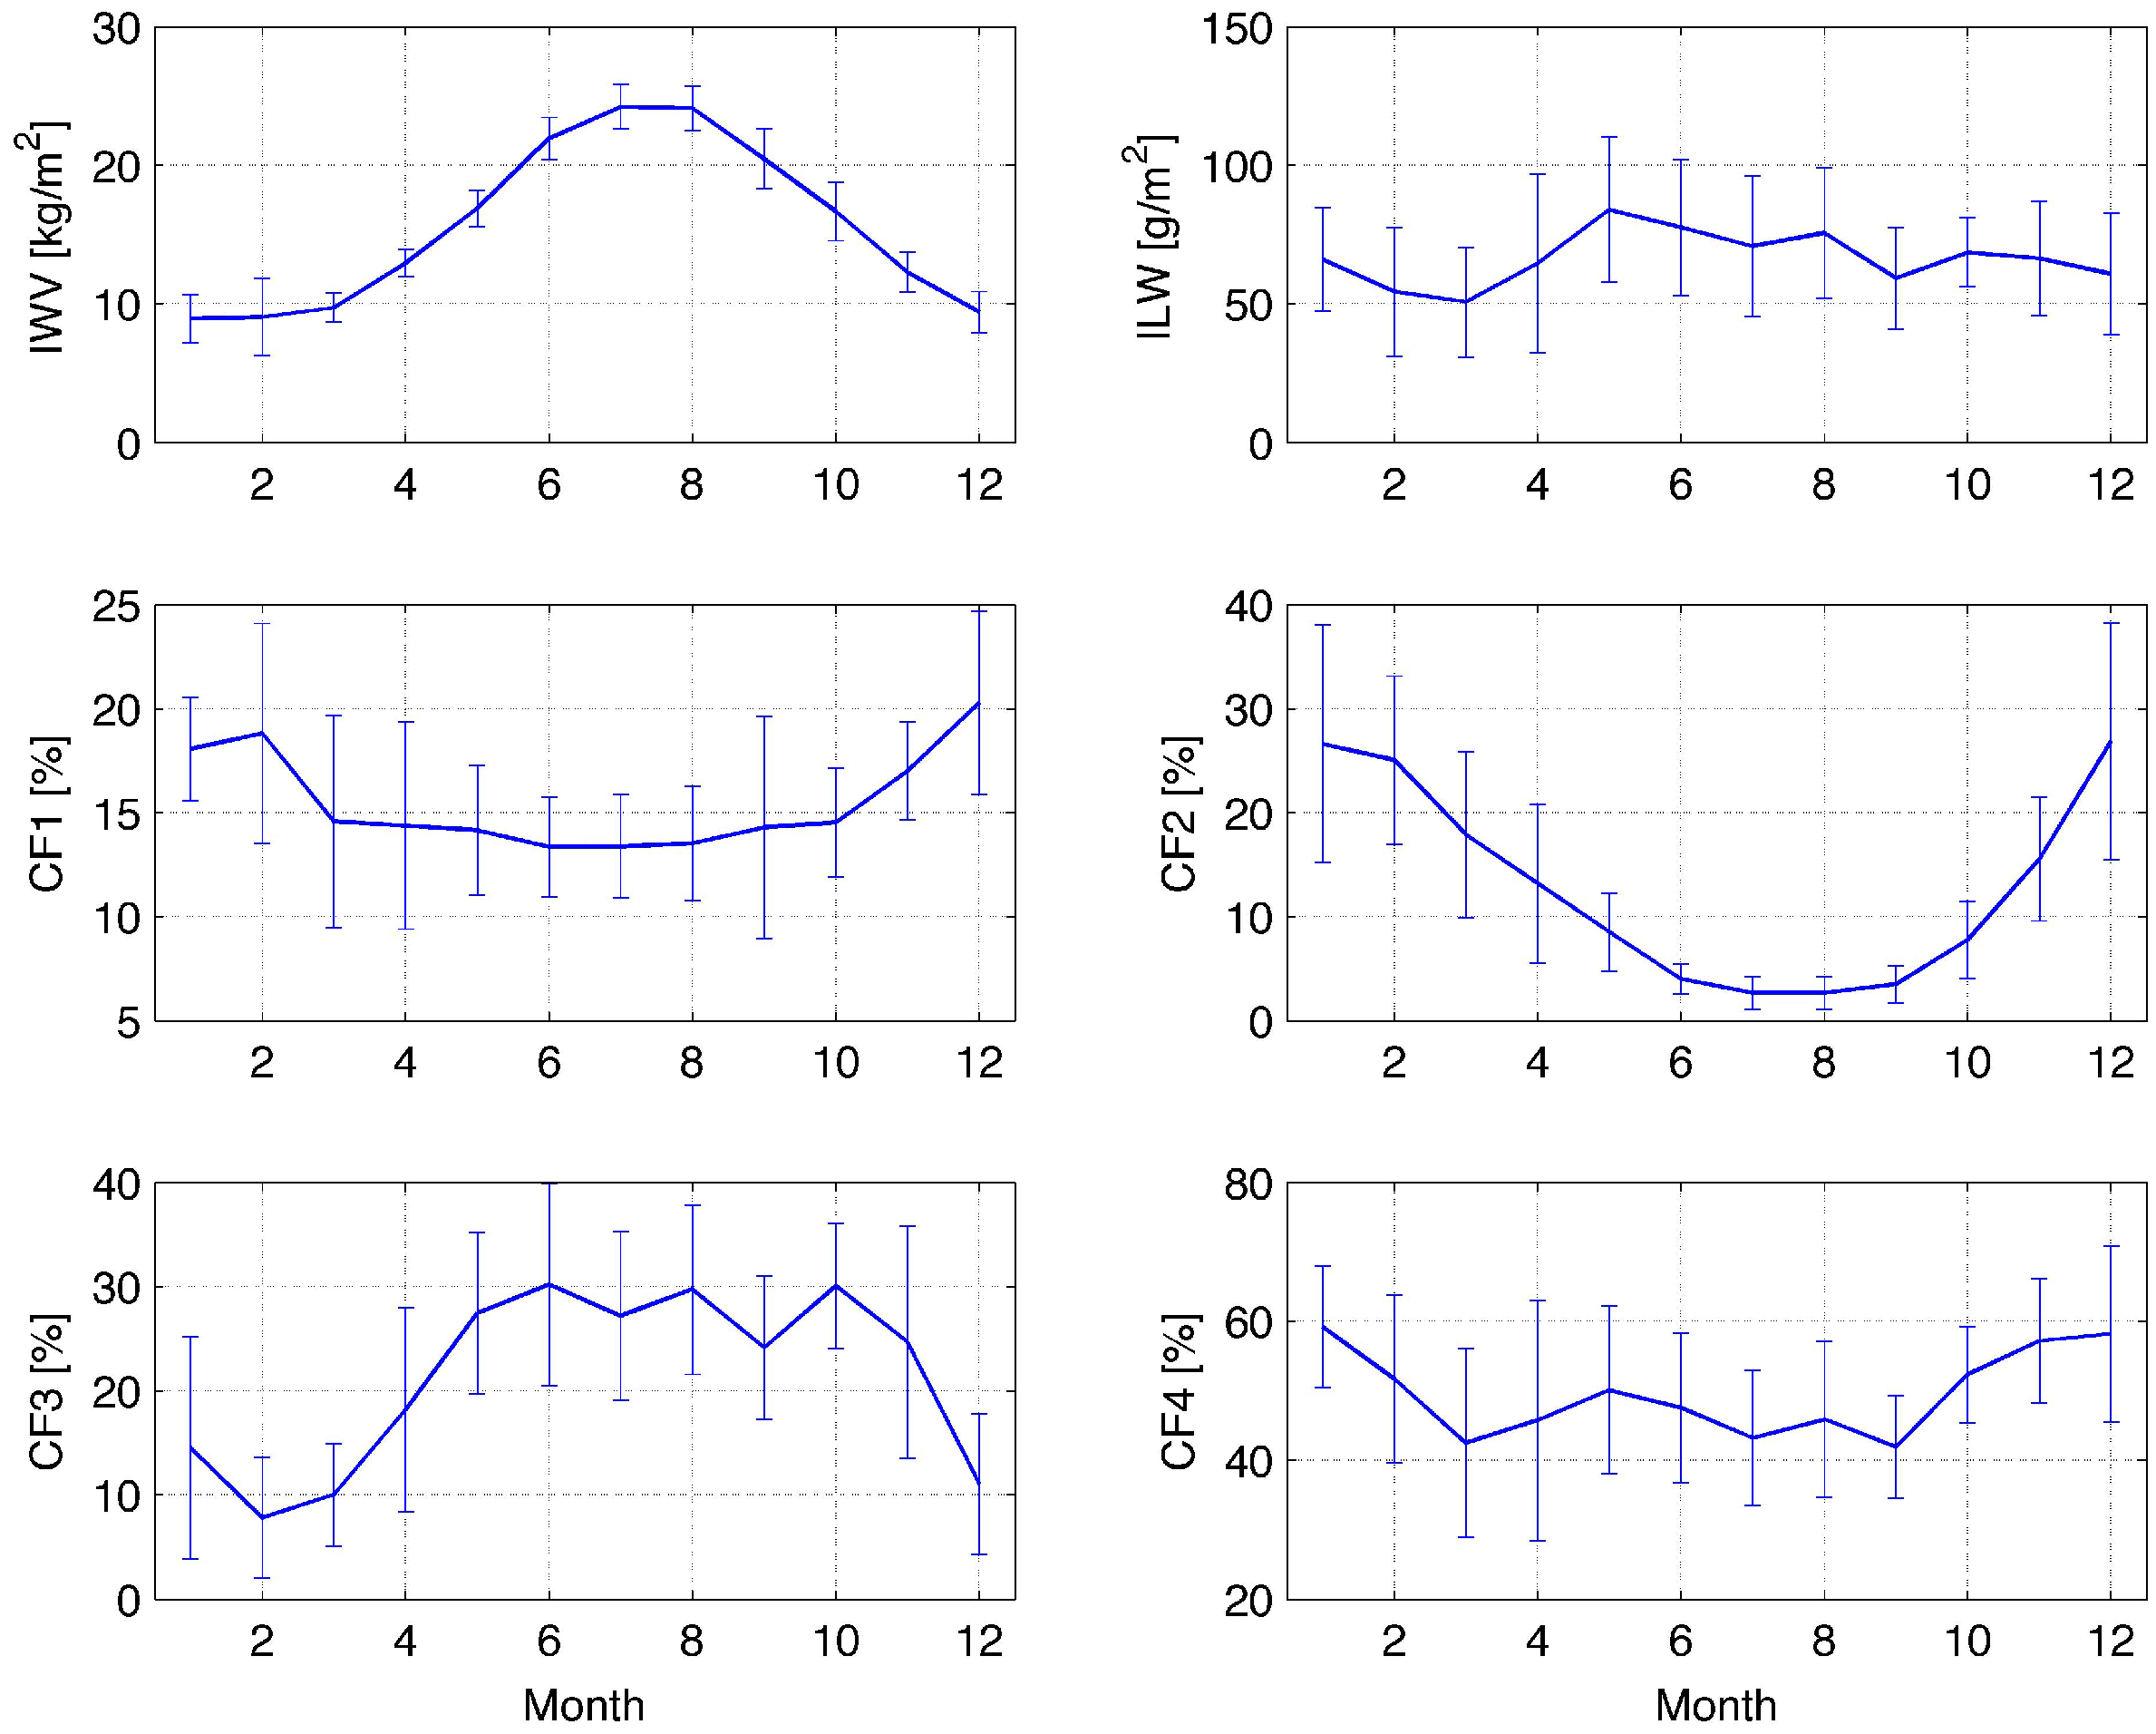
3.1. Climatologies
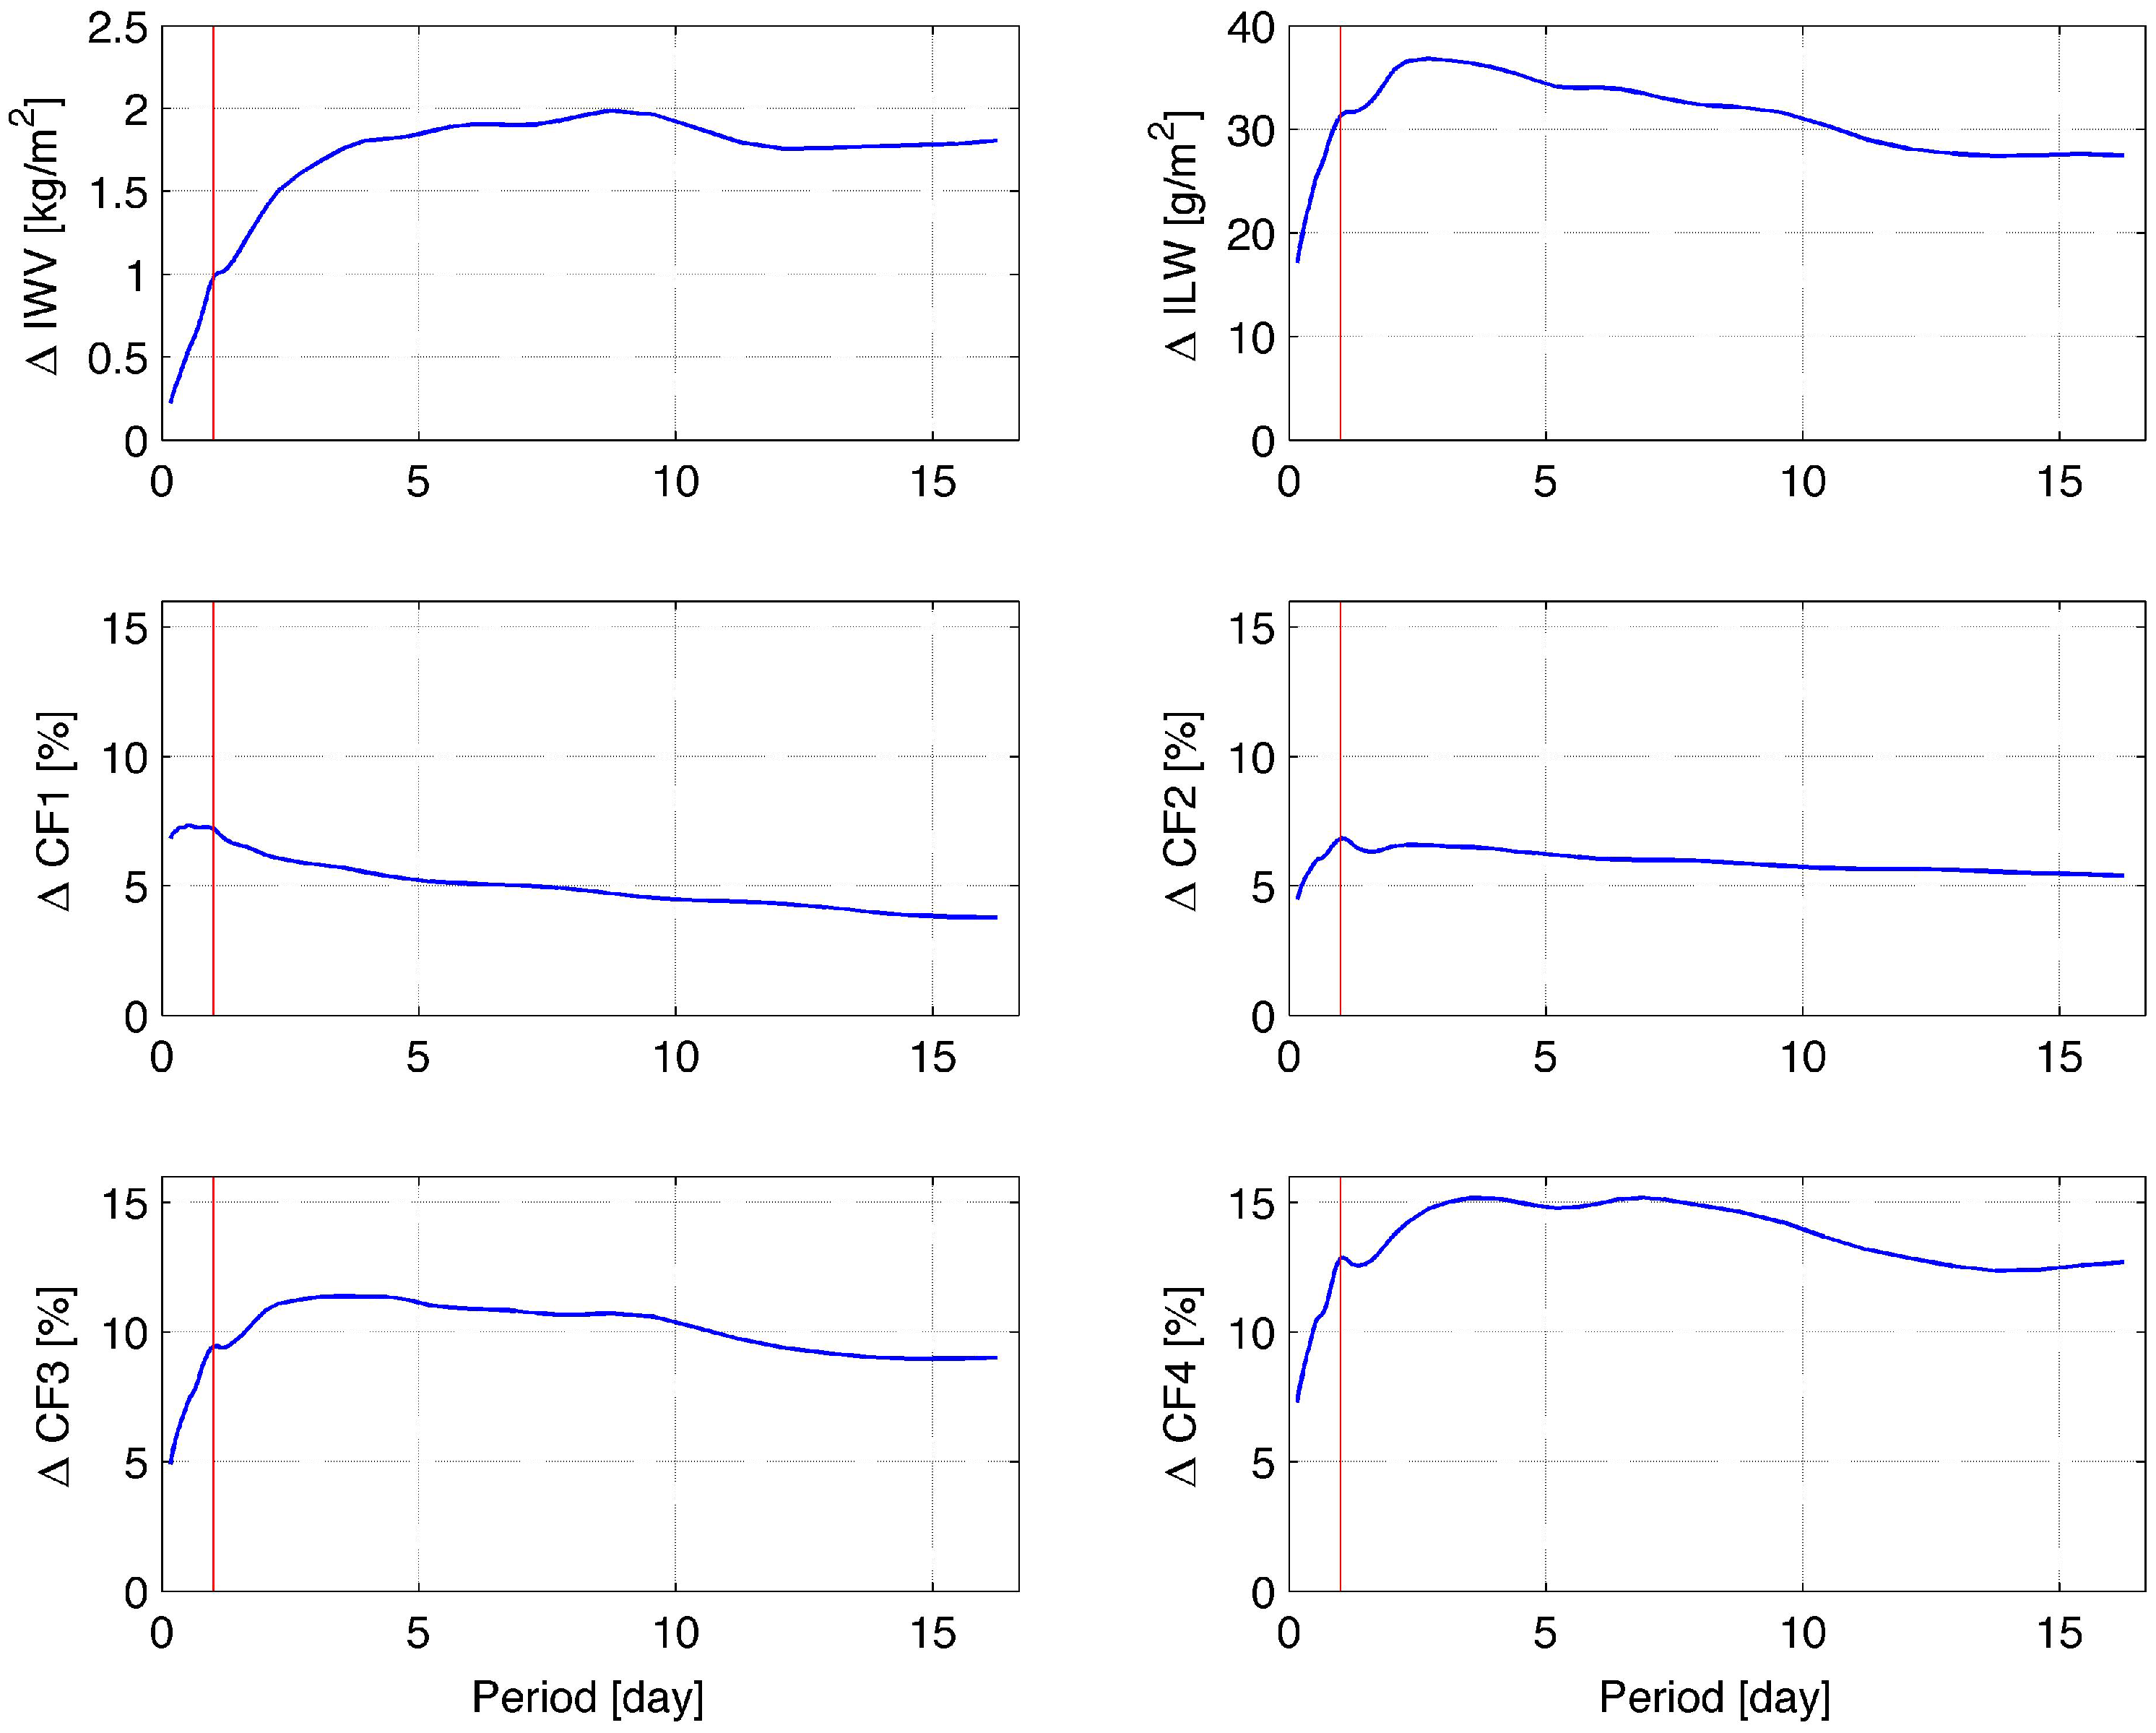
3.2. Spectral Behaviour of the Time Series
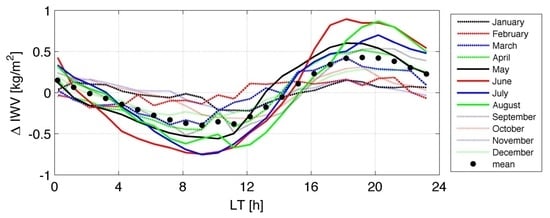
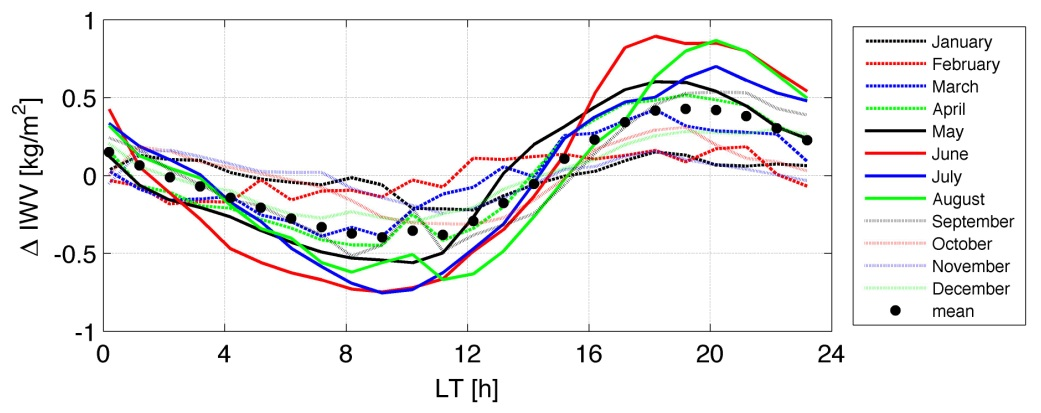
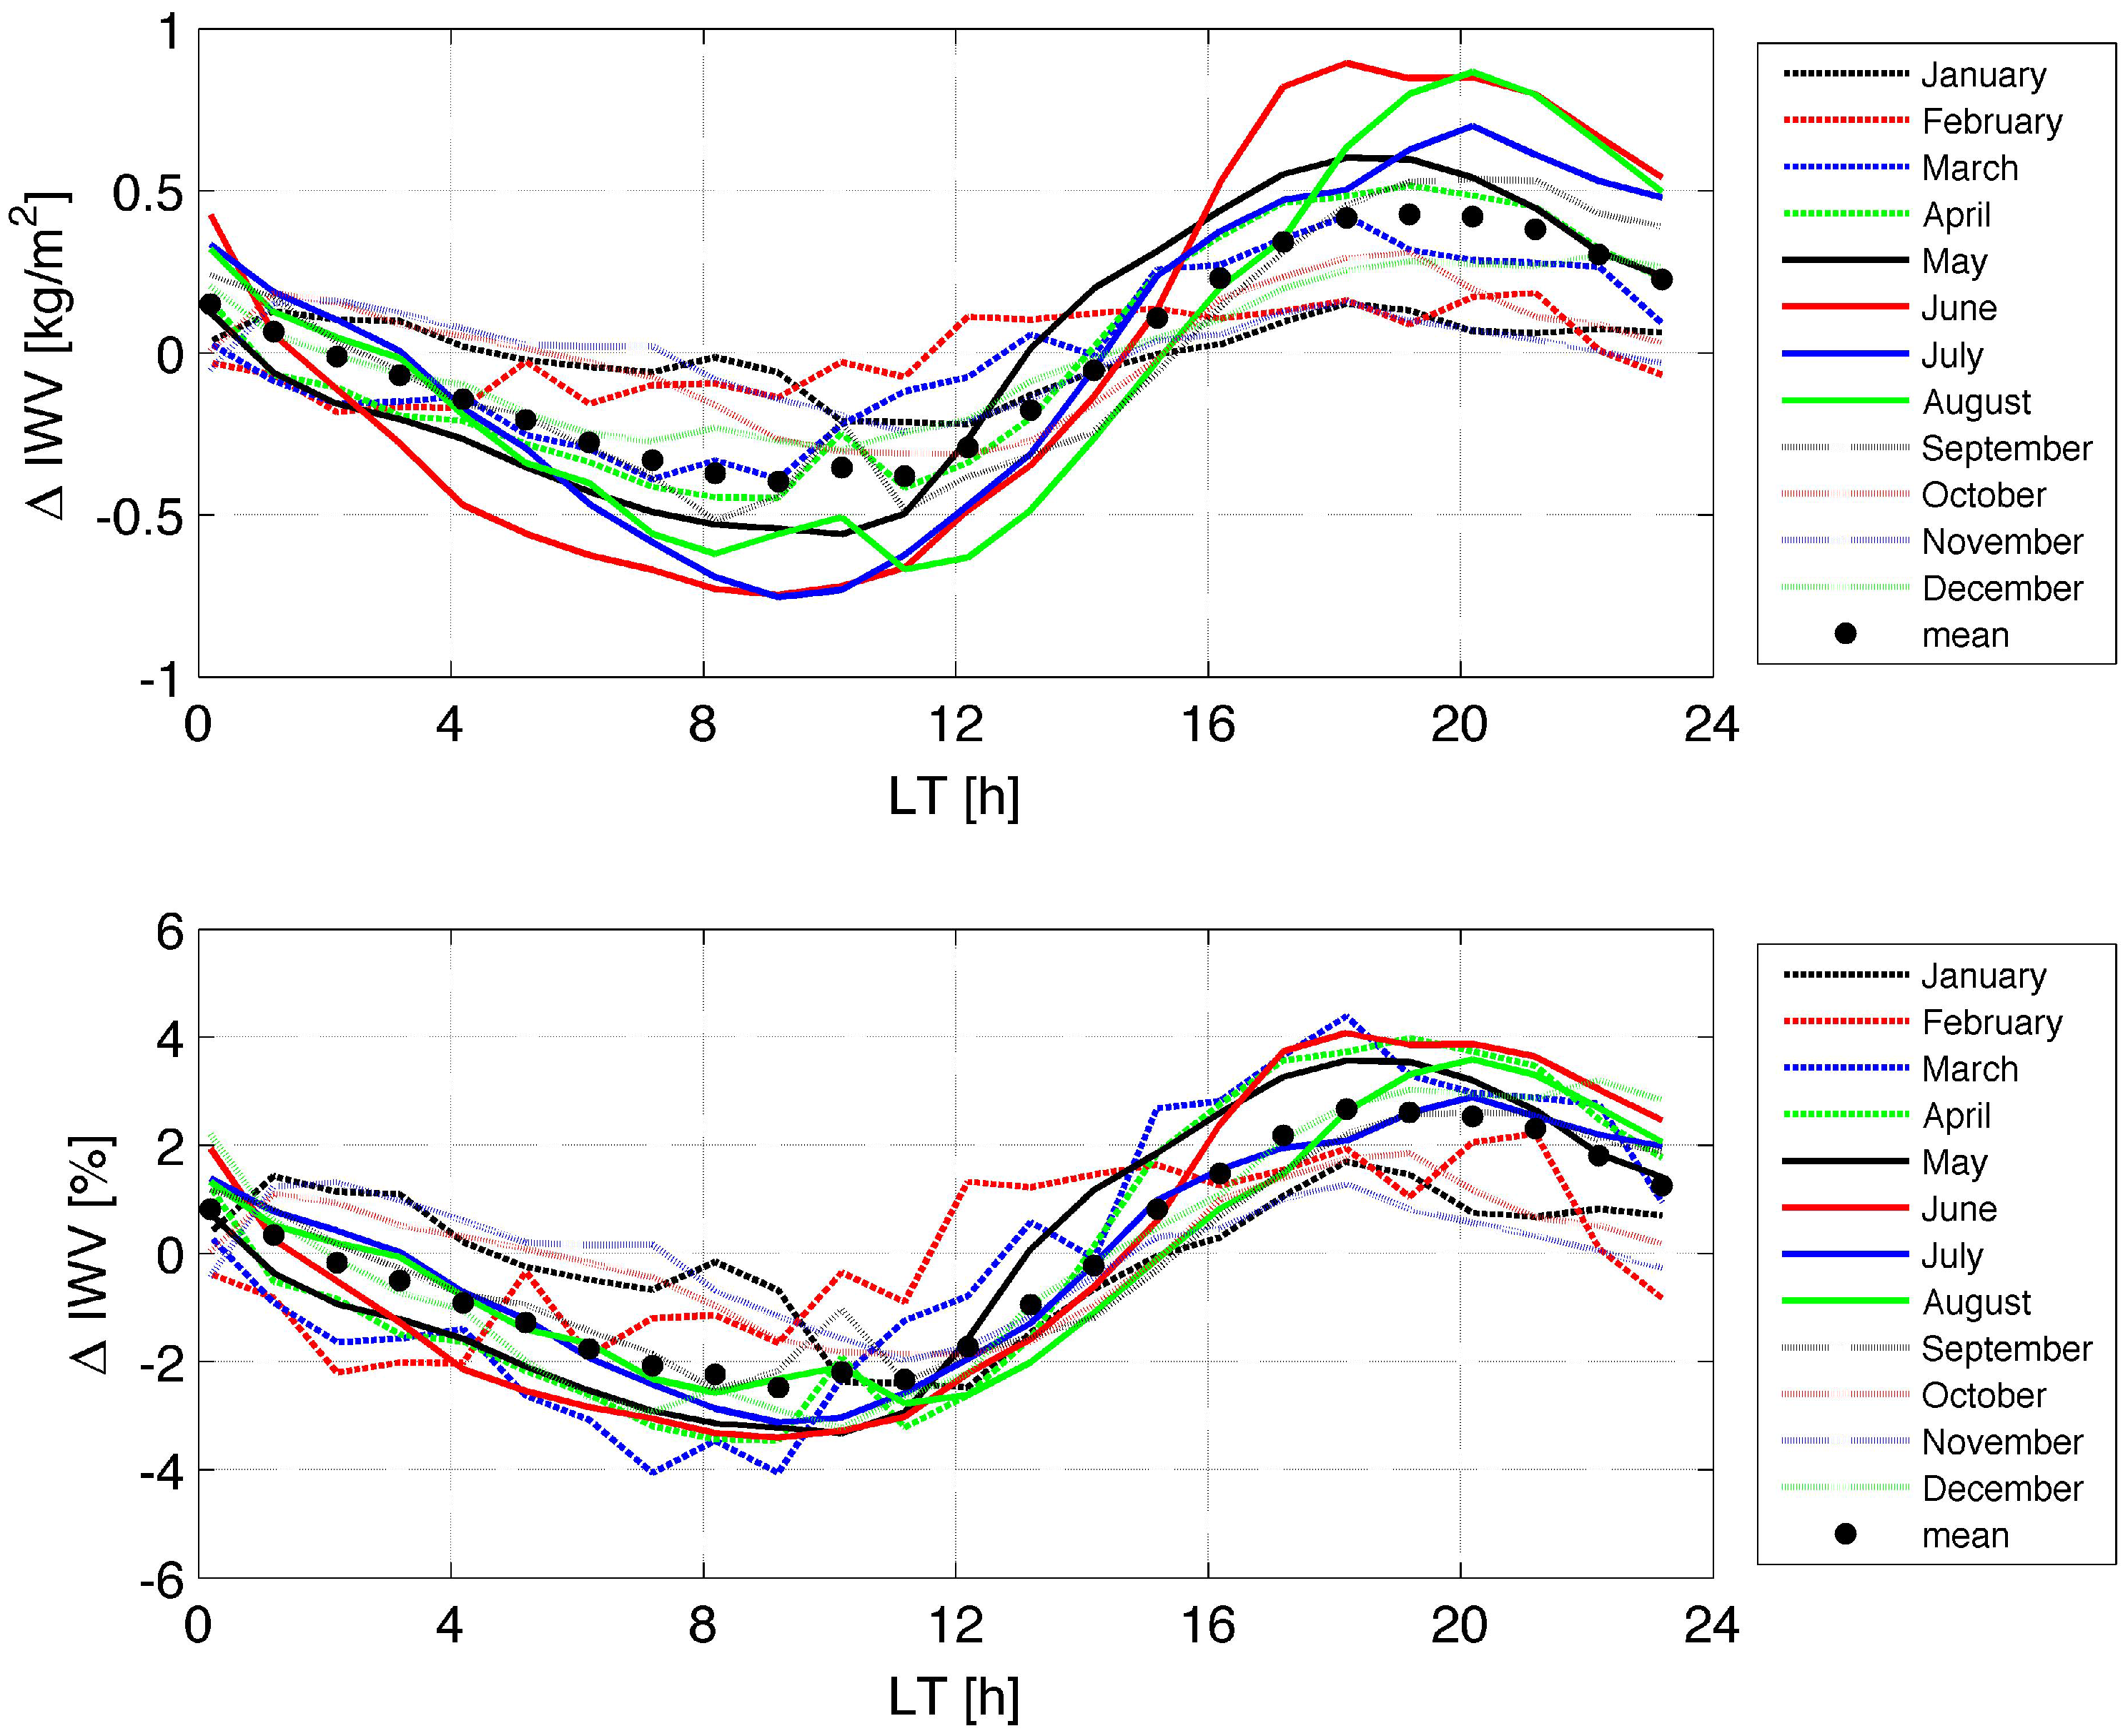
3.3. Seasonal Dependence and Annual Mean of the Diurnal Cycle in IWV
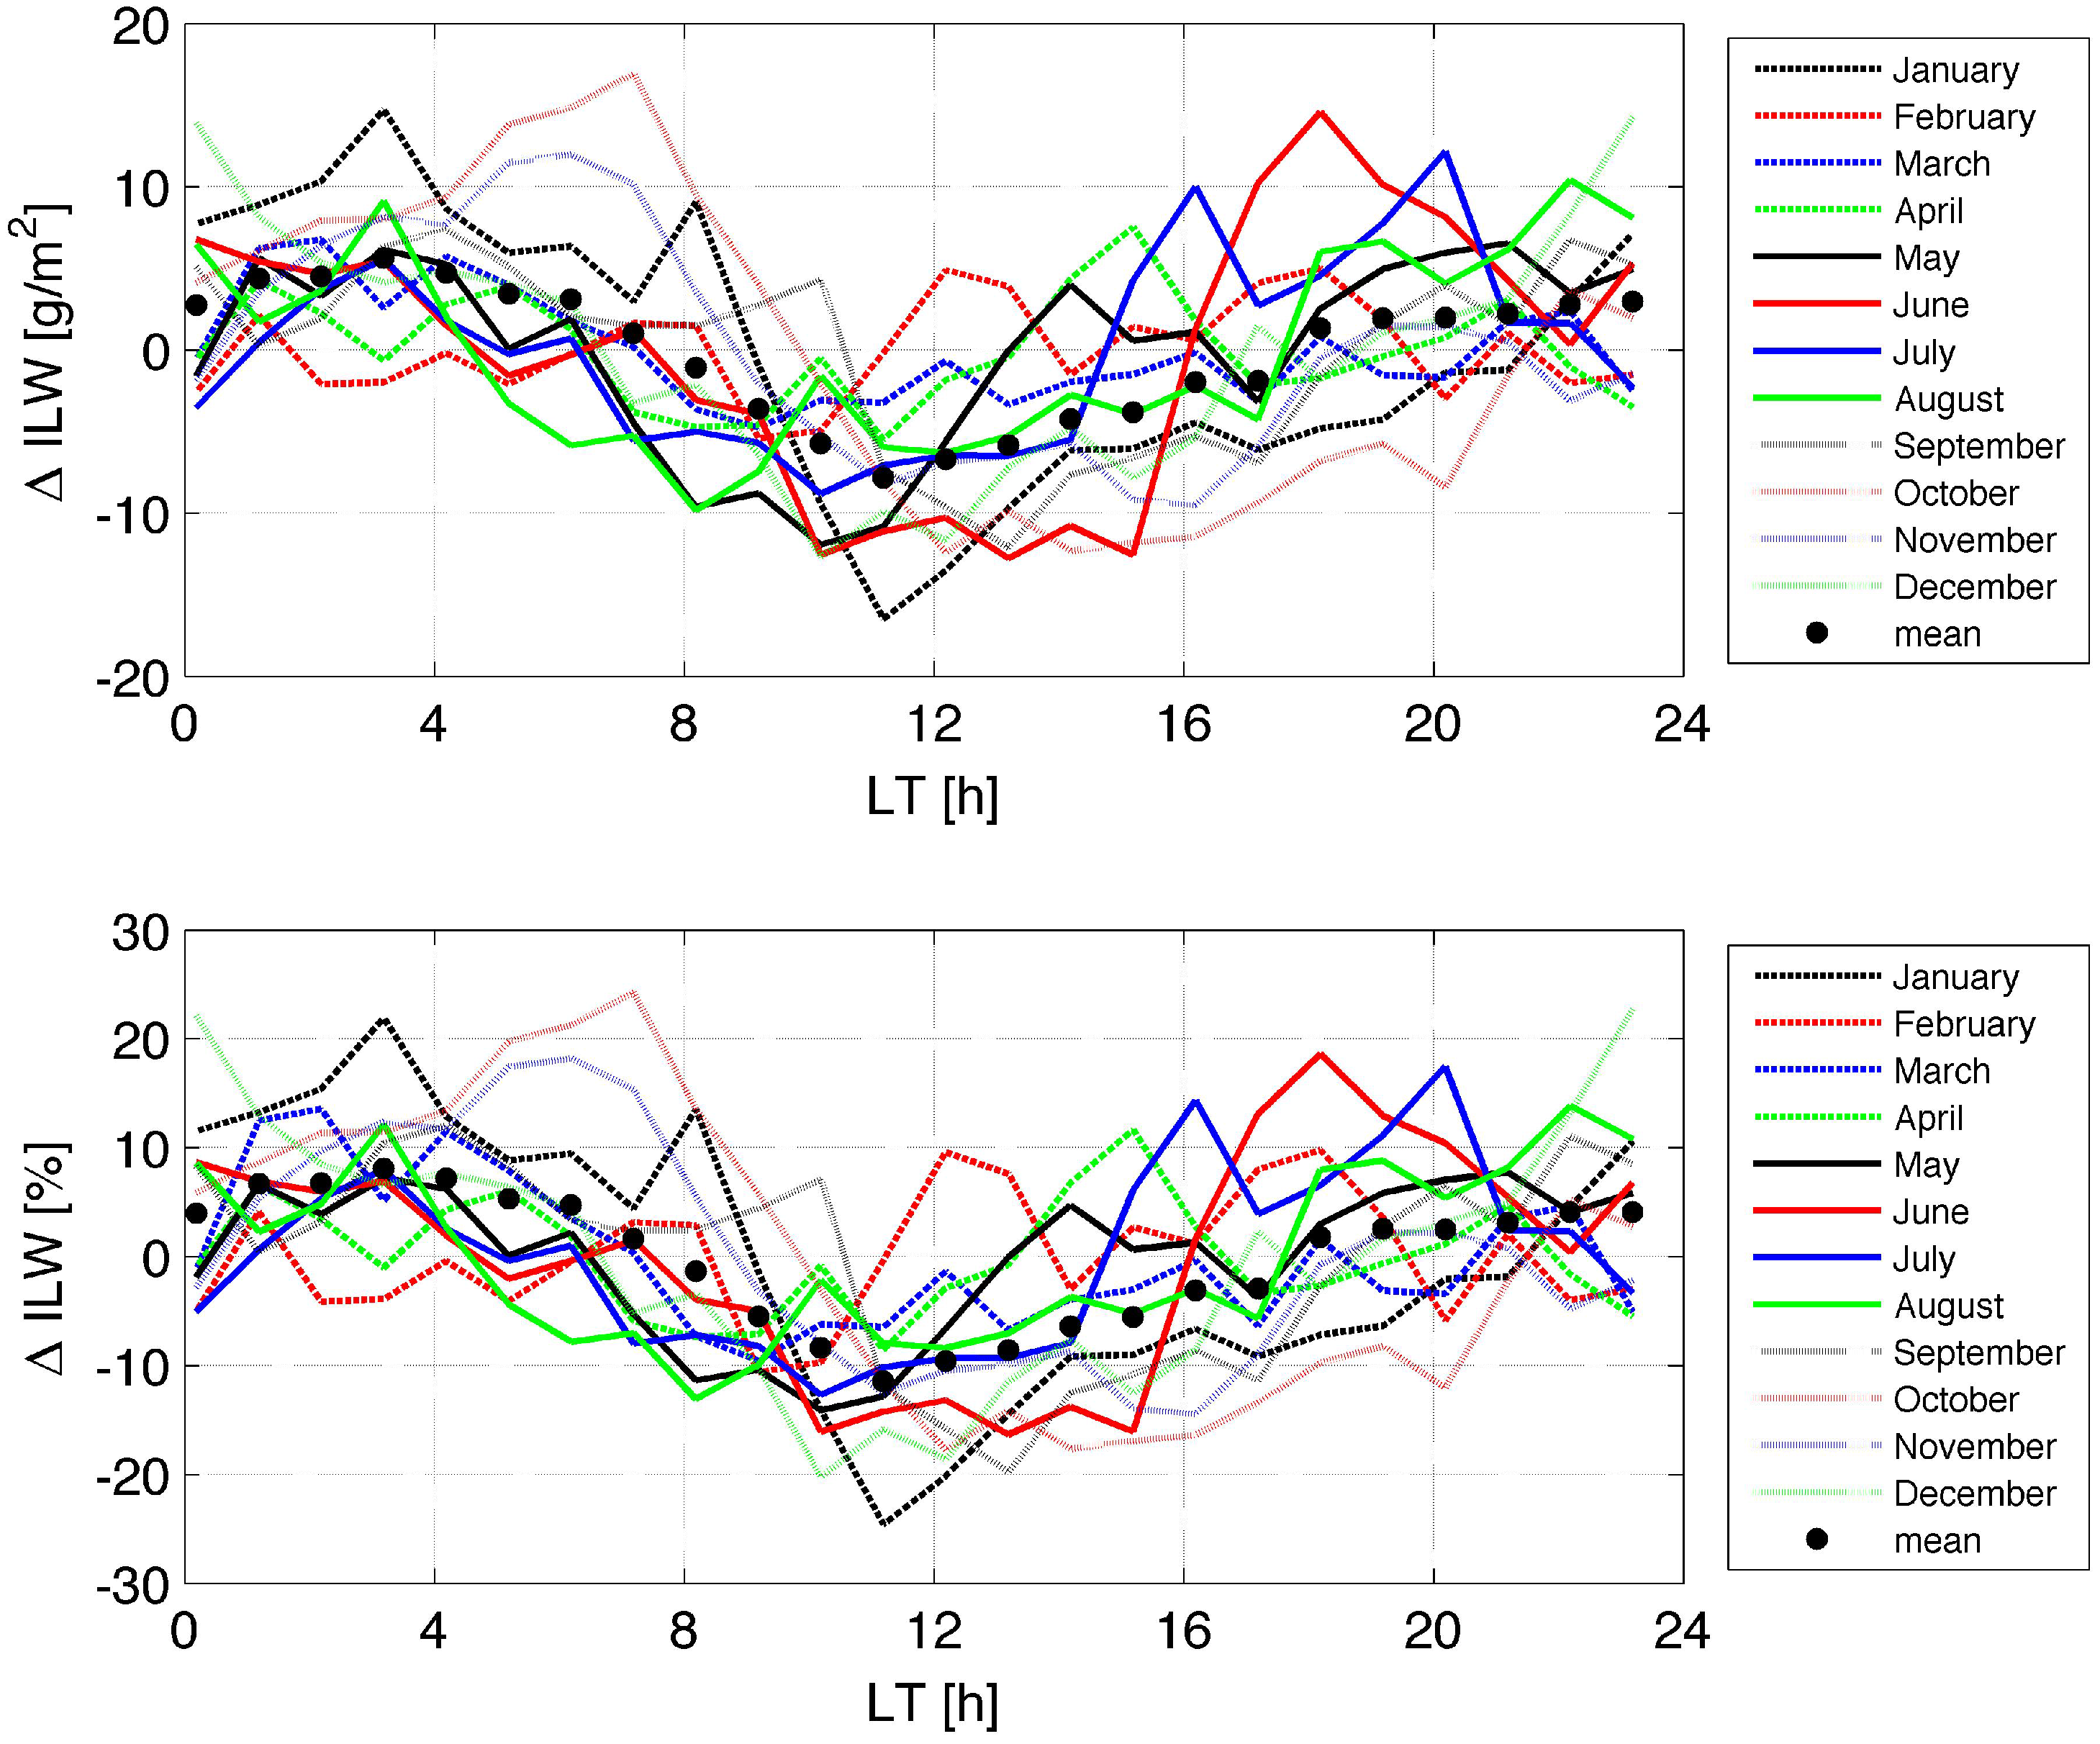
3.4. Seasonal Dependence and Annual Mean of the Diurnal Cycle in ILW
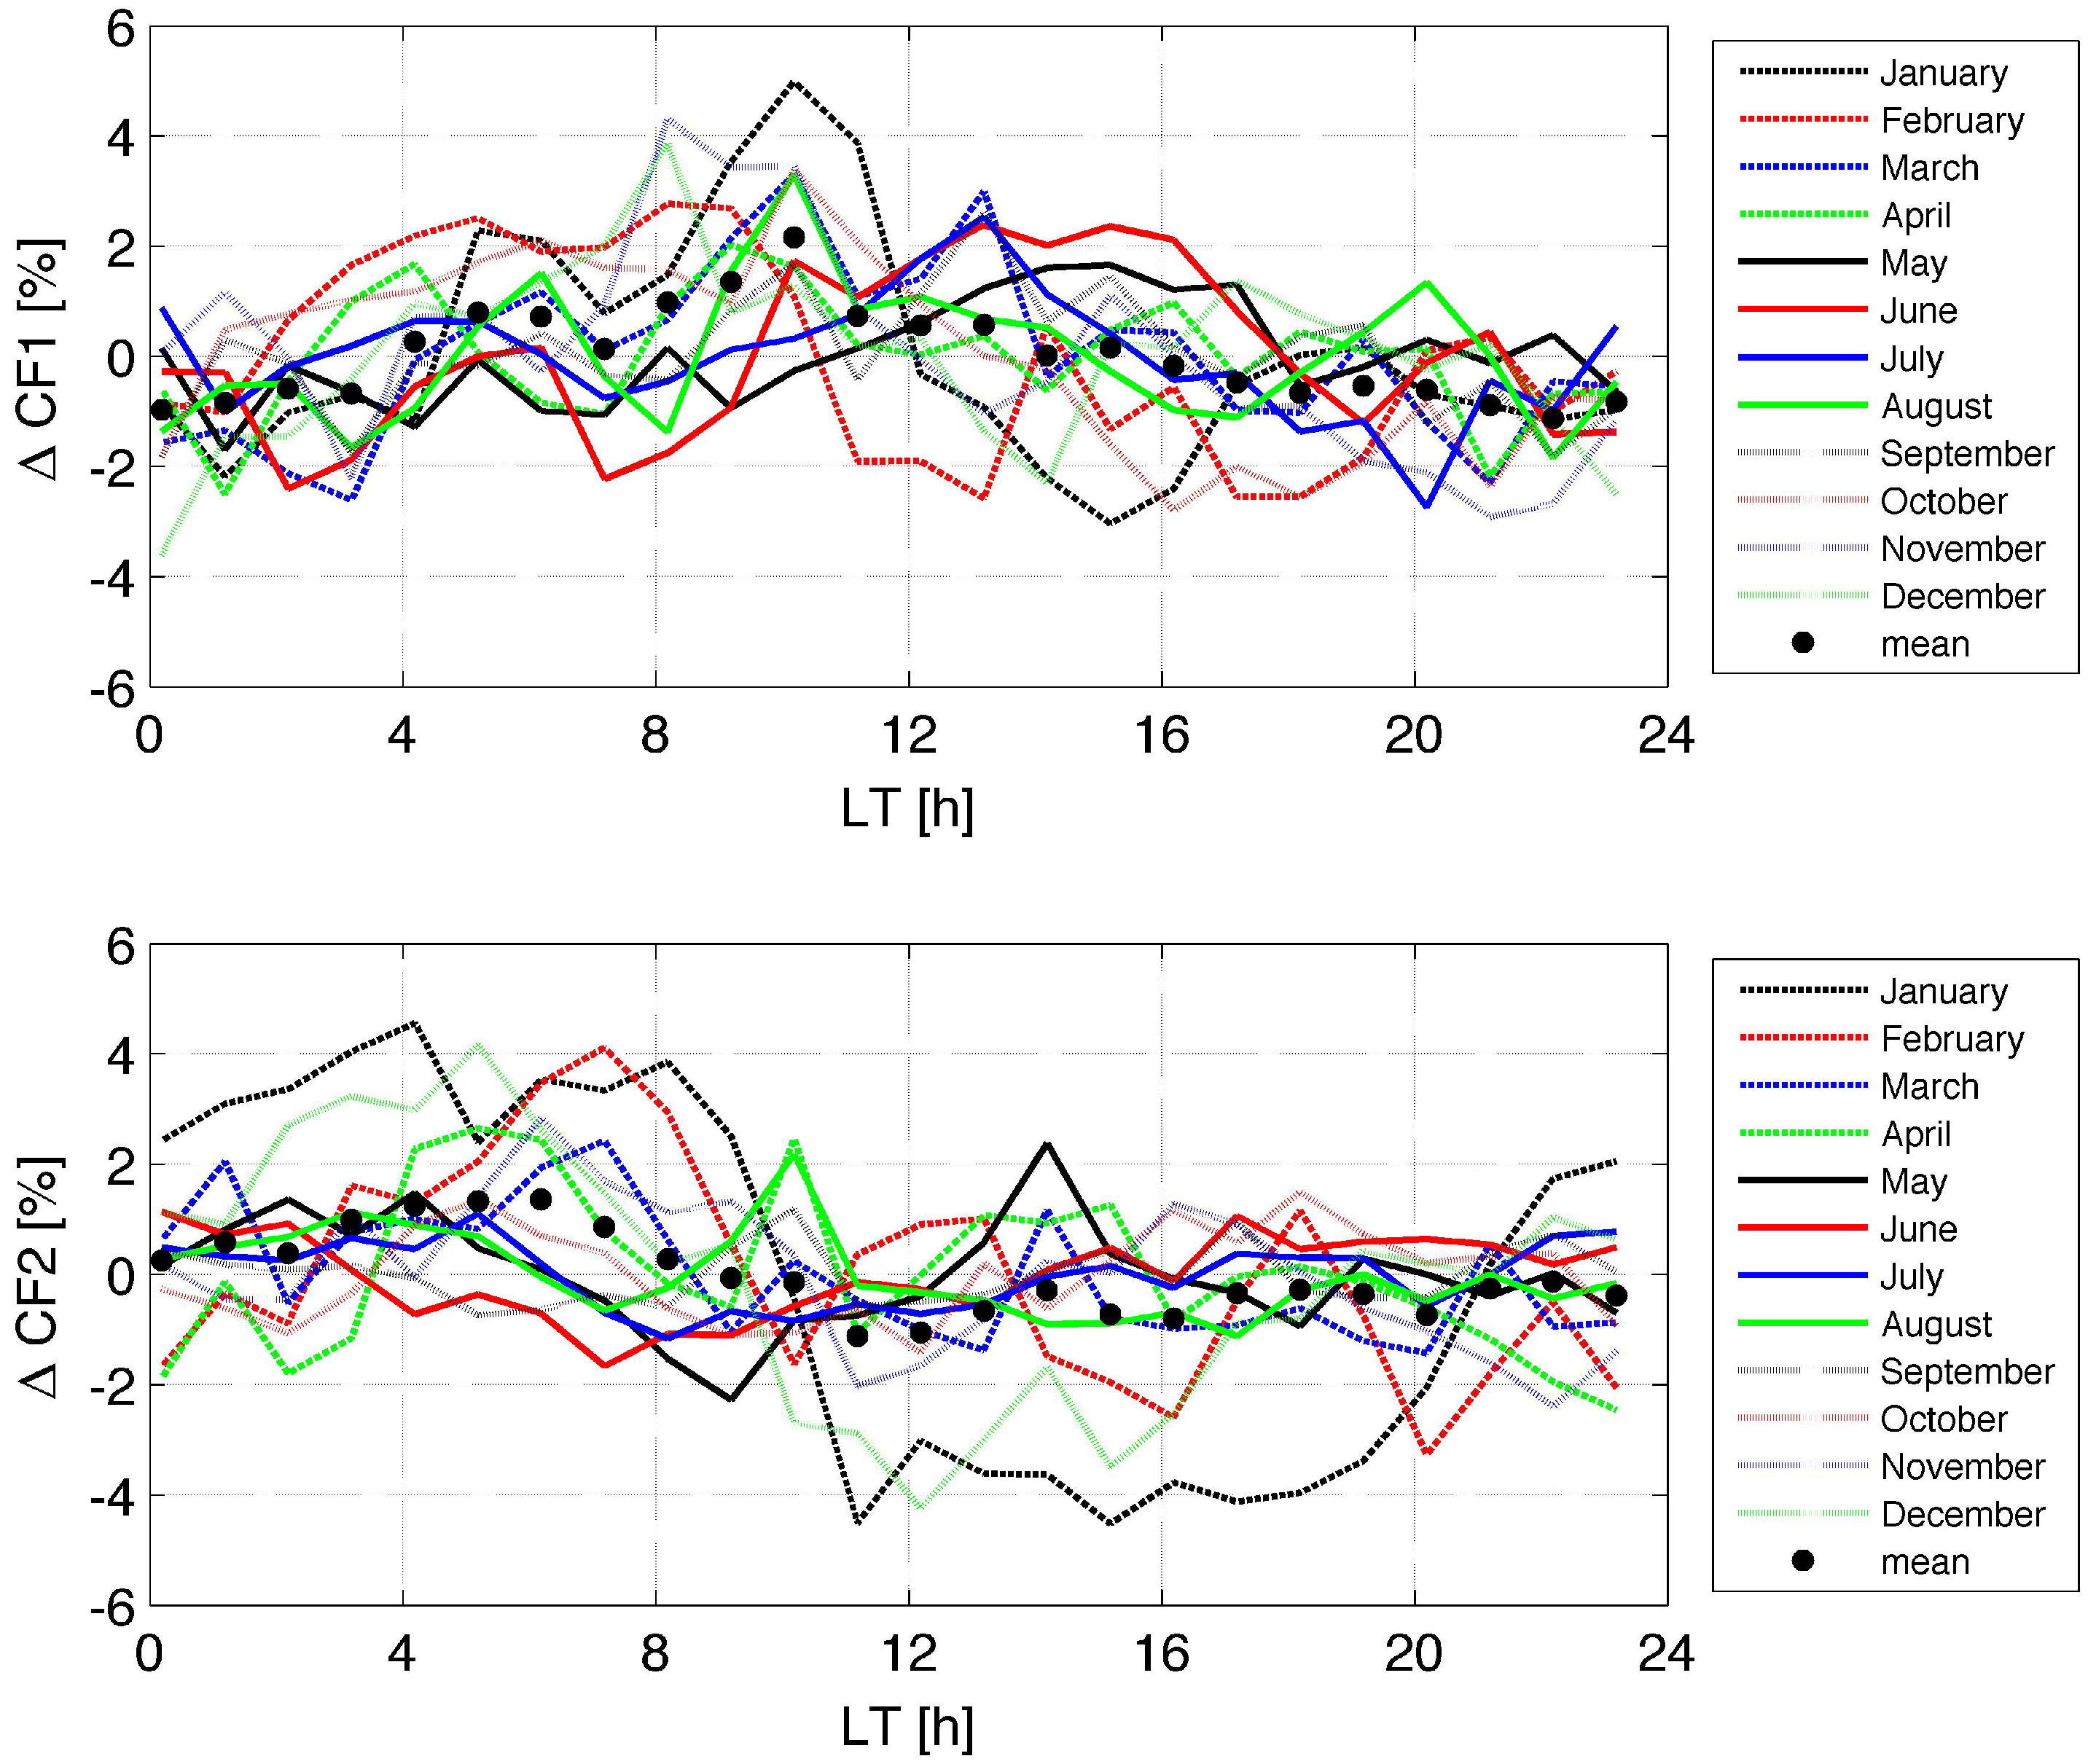
3.5. Seasonal Dependence and Annual Mean of the Diurnal Cycle in CF
3.6. Seasonal Variation and Diurnal Cycle in Rain Fraction
4. Conclusions
Acknowledgments
Author Contributions
Conflicts of Interest
References
- Boucher, O.; Randall, D.; Artaxo, P.; Bretherton, C.; Feingold, G.; Forster, P.; Kerminen, V.M.; Kondo, Y.; Liao, H.; Lohmann, U.; et al. Clouds and Aerosols, Climate Change 2013: The Physical Science Basis. Contribution of Working Group I to the Fifth Assessment Report of the Intergovernmental Panel on Climate Change; Stocker, T.F., Qin, D., Plattner, G.-K., Tignor, M., Allen, S.K., Boschung, J., Nauels, A., Xia, Y., Bex, V., Midgley, P.M., Eds.; Cambridge University Press: Cambridge, UK; New York, NY, USA, 2013; Section 7; pp. 571–658. [Google Scholar]
- Held, I.; Soden, B.J. Water vapor feedback and global warming. Annu. Rev. Energy Environ. 2000, 25, 441–475. [Google Scholar] [CrossRef]
- Jiang, J.H.; Su, H.; Zhai, C.; Perun, V.S.; Del Genio, A.; Nazarenko, L.S.; Donner, L.J.; Horowitz, L.; Seman, C.; Cole, J.; et al. Evaluation of cloud and water vapor simulations in CMIP5 climate models using NASA A-Train satellite observations. J. Geophys. Res. Atmos. 2012, 117. [Google Scholar] [CrossRef]
- Gettelman, A.; Kay, J.E.; Shell, K.M. The Evolution of Climate Sensitivity and Climate Feedbacks in the Community Atmosphere Model. J. Clim. 2012, 25, 1453–1469. [Google Scholar] [CrossRef]
- Biasutti, M.; Yuter, S.E.; Burleyson, C.D.; Sobel, A.H. Very high resolution rainfall patterns measured by TRMM precipitation radar: Seasonal and diurnal cycles. Clim. Dyn. 2012, 39, 239–258. [Google Scholar] [CrossRef]
- Stubenrauch, C.J.; Chédin, A.; Rädel, G.; Scott, N.A.; Serrar, S. Cloud Properties and Their Seasonal and Diurnal Variability from TOVS Path-B. J. Clim. 2006, 19, 5531–5553. [Google Scholar] [CrossRef]
- Wylie, D. Diurnal Cycles of Clouds and How They Affect Polar-Orbiting Satellite Data. J. Clim. 2008, 21, 3989–3996. [Google Scholar] [CrossRef]
- Hong, G.; Heygster, G.; Notholt, J.; Buehler, S.A. Interannual to Diurnal Variations in Tropical and Subtropical Deep Convective Clouds and Convective Overshooting from Seven Years of AMSU-B Measurements. J. Clim. 2008, 21, 4168–4189. [Google Scholar] [CrossRef]
- Labow, G.J.; Herman, J.R.; Huang, L.K.; Lloyd, S.A.; DeLand, M.T.; Qin, W.; Mao, J.; Larko, D.E. Diurnal variation of 340 nm Lambertian equivalent reflectivity due to clouds and aerosols over land and oceans. J. Geophys. Res. Atmos. 2011, 116. [Google Scholar] [CrossRef]
- Dai, A.; Trenberth, K.E. The Diurnal Cycle and Its Depiction in the Community Climate System Model. J. Clim. 2004, 17, 930–951. [Google Scholar] [CrossRef]
- Dirmeyer, P.A.; Cash, B.A.; Kinter, J.L.; Jung, T.; Marx, L.; Satoh, M.; Stan, C.; Tomita, H.; Towers, P.; Wedi, N.; et al. Simulating the diurnal cycle of rainfall in global climate models: Resolution versus parameterization. Clim. Dyn. 2012, 39, 399–418. [Google Scholar] [CrossRef]
- Bergman, J.W.; Salby, M.L. The Role of Cloud Diurnal Variations in the Time-Mean Energy Budget. J. Clim. 1997, 10, 1114–1124. [Google Scholar] [CrossRef]
- Bergman, J.W.; Salby, M.L. Diurnal Variations of Cloud Cover and Their Relationship to Climatological Conditions. J. Clim. 1996, 9, 2802–2820. [Google Scholar] [CrossRef]
- Zhang, Y.; Long, C.N.; Rossow, W.B.; Dutton, E.G. Exploiting diurnal variations to evaluate the ISCCP-FD flux calculations and radiative-flux-analysis-processed surface observations from BSRN, ARM, and SURFRAD. J. Geophys. Res. Atmos. 2010, 115. [Google Scholar] [CrossRef]
- Westwater, E.R.; Crewell, S.; Matzler, C. Frontiers in surface-based microwave and millimeter wavelength radiometry. In Proceedings of the IEEE International Geoscience and Remote Sensing Symposium (IGARSS), Anchorage, AK, USA, 20–24 September 2004; Volume 2, pp. 1268–1272. [Google Scholar]
- Roebeling, R.A.; Deneke, H.M.; Feijt, A.J. Validation of Cloud Liquid Water Path Retrievals from SEVIRI Using One Year of CloudNET Observations. J. Appl. Meteorol. Climatol. 2008, 47, 206–222. [Google Scholar] [CrossRef]
- Snider, J.B.; Hazen, D.A. Surface-based radiometric observations of water vapor and cloud liquid in the temperate zone and in the tropics. Radio Sci. 1998, 33, 421–432. [Google Scholar] [CrossRef]
- Considine, G.; Curry, J.A.; Wielicki, B. Modeling cloud fraction and horizontal variability in marine boundary layer clouds. J. Geophys. Res. Atmos. 1997, 102, 13517–13525. [Google Scholar] [CrossRef]
- Peter, R.; Kämpfer, N. Radiometric Determination of Water-Vapor and Liquid Water and Its Validation with Other Techniques. J. Geophys. Res. Atmos. 1992, 97, 18173–18183. [Google Scholar] [CrossRef]
- Morland, J. TROWARA—Tropospheric Water Vapour Radiometer. Radiometer Review and New Calibration Model; IAP Research Report 2002-15; Institut für Angewandte Physik, Universität Bern: Bern, Switzerland, 2002. [Google Scholar]
- Ingold, T.; Peter, R.; Kämpfer, N. Weighted mean tropospheric temperature and transmittance determination at millimeter-wave frequencies for ground-based applications. Radio Sci. 1998, 33, 905–918. [Google Scholar] [CrossRef]
- Mätzler, C.; Morland, J. Refined Physical Retrieval of Integrated Water Vapor and Cloud Liquid for Microwave Radiometer Data. IEEE Trans. Geosci. Remote Sens. 2009, 47, 1585–1594. [Google Scholar] [CrossRef]
- Brocard, E. Ground-Based Remote Sensing of the Troposphere in the Thermal Infrared. Ph.D. Thesis, Philosophisch-Naturwissenschaftliche Fakultät, Universität Bern, Bern, Switzerland, 2008. [Google Scholar]
- Cossu, F.; Hocke, K.; Mätzler, C. A 10-Year Cloud Fraction Climatology of Liquid Water Clouds over Bern Observed by a Ground-Based Microwave Radiometer. Remote Sens. 2015, 7, 7768–7784. [Google Scholar] [CrossRef]
- Morland, J.; Collaud Coen, M.; Hocke, K.; Jeannet, P.; Mätzler, C. Tropospheric water vapour above Switzerland over the last 12 years. Atmos. Chem. Phys. 2009, 9, 5975–5988. [Google Scholar] [CrossRef]
- Hocke, K.; Kämpfer, N.; Gerber, C.; Mätzler, C. A complete long-term series of integrated water vapour from ground-based microwave radiometers. Int. J. Remote Sens. 2011, 32, 751–765. [Google Scholar] [CrossRef]
- Hocke, K.; Navas Guzmán, F.; Cossu, F.; Mätzler, C. Cloud Fraction of Liquid Water Clouds above Switzerland over the Last 12 Years. Climate 2016, 4. [Google Scholar] [CrossRef]
- Brocard, E.; Schneebeli, M.; Morland, J.; Mätzler, C. Detection of Supercooled Cloud Layers with Microwave and Infrared Radiometry and Additional Tools; IAP Research Report 2006-02-MW; Institut für Angewandte Physik, Universität Bern: Bern, Switzerland, 2006. [Google Scholar]
- Mätzler, C.; Rosenkranz, P.W.; Cermak, J. Microwave absorption of supercooled clouds and implications for the dielectric properties of water. J. Geophys. Res. Atmos. 2010, 115. [Google Scholar] [CrossRef]
- Hirsch, E.; Agassi, E.; Koren, I. Determination of optical and microphysical properties of thin warm clouds using ground based hyper-spectral analysis. Atmos. Meas. Tech. 2012, 5, 851–871. [Google Scholar] [CrossRef]
- Bernet, L.; Navas-Guzmàn, F.; Kämpfer, N. The effect of cloud liquid water on tropospheric temperature retrievals from microwave measurements. Atmos. Meas. Tech. Discuss. 2017, 2017, 1–35. [Google Scholar] [CrossRef]
- Cossu, F. Study of Atmospheric Water over Bern by Means of Ground-Based Observations and Numerical Simulations. Ph.D. Thesis, Philosophisch-Naturwissenschaftliche Fakultät, Universität Bern, Bern, Switzerland, 2015. [Google Scholar]
- Studer, S.; Hocke, K.; Kämpfer, N. Intraseasonal oscillations of stratospheric ozone above Switzerland. J. Atmos. Sol. Terr. Phys. 2012, 74, 189–198. [Google Scholar] [CrossRef]
- Menzel, L.; Lang, H.; Rohmann, M. Mean Annual Actual Evaporation 1973–1992. Plate 4.1 in Hydrological Atlas of Switzerland 1999. Available online: http://www.hydrologischeratlas.ch/en/products/printed-issue/evaporation/plate-4-1 (accessed on 31 August 2017).
- Ortiz de Galisteo, J.P.; Cachorro, V.; Toledano, C.; Torres, B.; Laulainen, N.; Bennouna, Y.; de Frutos, A. Diurnal cycle of precipitable water vapor over Spain. Q. J. R. Meteorol. Soc. 2011, 137, 948–958. [Google Scholar] [CrossRef]
- Dai, A.; Wang, J.; Ware, R.H.; Van Hove, T. Diurnal variation in water vapor over North America and its implications for sampling errors in radiosonde humidity. J. Geophys. Res. Atmos. 2002, 107. [Google Scholar] [CrossRef]
- Wood, R.; Bretherton, C.S.; Hartmann, D.L. Diurnal cycle of liquid water path over the subtropical and tropical oceans. Geophys. Res. Lett. 2002, 29. [Google Scholar] [CrossRef]
- Schlemmer, L.; Hohenegger, C.; Schmidli, J.; Bretherton, C.S.; Schär, C. An Idealized Cloud-Resolving Framework for the Study of Midlatitude Diurnal Convection over Land. J. Atmos. Sci. 2011, 68, 1041–1057. [Google Scholar] [CrossRef]
- Min, M.; Zhang, Z. On the influence of cloud fraction diurnal cycle and sub-grid cloud optical thickness variability on all-sky direct aerosol radiative forcing. J. Quant. Spectrosc. Radiat. Transf. 2014, 142, 25–36. [Google Scholar] [CrossRef]


© 2017 by the authors. Licensee MDPI, Basel, Switzerland. This article is an open access article distributed under the terms and conditions of the Creative Commons Attribution (CC BY) license (http://creativecommons.org/licenses/by/4.0/).
Share and Cite
Hocke, K.; Navas-Guzmán, F.; Moreira, L.; Bernet, L.; Mätzler, C. Diurnal Cycle in Atmospheric Water over Switzerland. Remote Sens. 2017, 9, 909. https://doi.org/10.3390/rs9090909
Hocke K, Navas-Guzmán F, Moreira L, Bernet L, Mätzler C. Diurnal Cycle in Atmospheric Water over Switzerland. Remote Sensing. 2017; 9(9):909. https://doi.org/10.3390/rs9090909
Chicago/Turabian StyleHocke, Klemens, Francisco Navas-Guzmán, Lorena Moreira, Leonie Bernet, and Christian Mätzler. 2017. "Diurnal Cycle in Atmospheric Water over Switzerland" Remote Sensing 9, no. 9: 909. https://doi.org/10.3390/rs9090909
APA StyleHocke, K., Navas-Guzmán, F., Moreira, L., Bernet, L., & Mätzler, C. (2017). Diurnal Cycle in Atmospheric Water over Switzerland. Remote Sensing, 9(9), 909. https://doi.org/10.3390/rs9090909