Article

Evaluation of Sentinel-2A Satellite Imagery for Mapping Cotton Root Rot

1
Beijing Research Center for Information Technology in Agriculture, Beijing Academy of Agriculture and Forestry Sciences, Beijing 100097, China
2
National Engineering Research Center for Information Technology in Agriculture, Beijing Academy of Agriculture and Forestry Sciences, Beijing 100097, China
3
United States Department of Agriculture, Agricultural Research Service, Aerial Application Technology Research Unit, College Station, TX 77845-4966, USA
4
The State Key Laboratory of Remote Sensing Science, Institute of Remote Sensing and Digital Earth, Chinese Academy of Sciences, P.O. Box 9718, Datun Road, Chaoyang, Beijing 100101, China
5
Laboratory of Digital Earth Sciences, Institute of Remote Sensing and Digital Earth, Chinese Academy of Sciences, Beijing 100094, China
*
Author to whom correspondence should be addressed.
Remote Sens. 2017, 9(9), 906; https://doi.org/10.3390/rs9090906
Submission received: 30 June 2017 / Revised: 12 August 2017 / Accepted: 28 August 2017 / Published: 31 August 2017
(This article belongs to the Section Remote Sensing in Agriculture and Vegetation)

Abstract

:
Cotton (Gossypium hirsutum L.) is an economically important crop that is highly susceptible to cotton root rot. Remote sensing technology provides a useful and effective means for detecting and mapping cotton root rot infestations in cotton fields. This research assessed the potential of 10-m Sentinel-2A satellite imagery for cotton root rot detection and compared it with airborne multispectral imagery using unsupervised classification at both field and regional levels. Accuracy assessment showed that the classification maps from the Sentinel-2A imagery had an overall accuracy of 94.1% for field subset images and 91.2% for the whole image, compared with the airborne image classification results. However, some small cotton root rot areas were undetectable and some non-infested areas within large root rot areas were incorrectly classified as infested due to the images’ coarse spatial resolution. Classification maps based on field subset Sentinel-2A images missed 16.6% of the infested areas and the classification map based on the whole Sentinel-2A image for the study area omitted 19.7% of the infested areas. These results demonstrate that freely-available Sentinel-2 imagery can be used as an alternative data source for identifying cotton root rot and creating prescription maps for site-specific management of the disease.

Graphical Abstract

1. Introduction

Phymatotrichum root rot, also known as cotton root rot or Texas root rot, is caused by the soil-borne fungus Phymatotrichopsis omnivora. It is a major cotton pathogen in the southwestern United States (mainly in Texas due to the many hectares of cotton grown there) as well as in northern Mexico, and was first described by Pammel [1,2,3]. The fungus spreads from plant to plant and once the roots are infected, the fungus blocks the vascular elements, inhibiting the movement of water to the aboveground parts of the plant. The leaves of the infected plant first turn yellow or brown and then wilt rapidly, and plant death occurs within a few days. Wilt is usually seen when cotton plants are flowering or sometimes earlier in the season. A large number of plants may wilt simultaneously, but even within an affected area, wilting among plants is not simultaneous, sometimes occurring weeks apart. It is also possible to see non-symptomatic plants surrounded by diseased plants. The fungus kills plants typically in circular areas ranging from less than a square meter to several hectares in size. The disease significantly reduces cotton yield and lowers lint quality [4,5]. Cotton root rot has plagued the cotton industry for more than 100 years [6]. Recently, a commercial formulation of flutriafol (Topguard®, Cheminova Inc., Wayne, NJ, USA) has been found to effectively control cotton root rot [7,8,9]. It is necessary to define the cotton root rot-infested areas within the field, since only portions of the field are affected. Remote sensing technology is a useful and effective means of recording the extent of cotton root rot damage by detecting changes in the plant canopy. Such technology may be the only practical means to effectively map this disease because of the large numbers of infected areas and their irregular shapes within cotton fields [6].
Taubenhaus et al. [10] photographed cotton fields infested by the root rot fungus from an airplane. They used an ordinary handheld camera equipped with panchromatic film and obtained fairly sharp photographs that were used to locate root rot spots of various sizes and shapes within the fields. Nixon et al. [11] used aerial colorinfrared (CIR) photography to document the distribution of cotton root rot damage and to detect the change in root rot areas after chemical treatments. Nixon et al. [12] evaluated multispectral video imagery for the detection of cotton root rot.
Yang et al. [5,6] successfully used airborne imagery to map the extent of cotton root rot infestation near the end of the growing season when the cotton root rot is fully pronounced, and to monitor the progression of the infection within cotton fields during a growing season. In these studies, ISODATA (Iterative Self-Organizing Data Analysis) unsupervised classification applied to multispectral imagery was used to identify root rot-infested areas. More recently, Yang et al. [13] evaluated and compared two unsupervised classification techniques and six supervised classification techniques for mapping and detecting cotton root rot from airborne multispectral imagery. Song et al. [14] applied fuzzy set theory and nonlinear stretching enhancement to airborne multispectral imagery for unsupervised classification of cotton root rot infestations. Yang et al. [15] examined the consistency and variation of cotton root rot infestations within cotton fields over 10-year intervals using airborne multispectral imagery and assessed the feasibility of using historical imagery to create prescription maps for site-specific management of the disease.
More recently, satellite imaging systems such as Landsat 8 and Sentinel-2 have become freely available. Sentinel-2 is the latest-generation Earth observation satellite of the European Space Agency (ESA) for land and coastal applications [16]. It was launched in June 2015 and is part of Europe’s Copernicus program aiming at independent and continued global observation [17]. Sentinel-2 offers an increased spectral and spatial resolution with 13 spectral bands, from blue to SWIR (shortwave infrared), including red-edge bands of 10- to 60-m spatial resolution [18], which have already proved useful for forest stress monitoring [19], land use and land cover mapping [20], and biophysical variable retrieval [21,22,23,24]. Sentinel-2 was also designed for a variety of land monitoring applications [25], such as water detection and crop type and tree species identification [26]. Remote sensing techniques have been used to detect cotton root rot for several decades. However, previous studies have focused on the mapping of cotton root rot with airborne multispectral data [5,6,13,14,15]. Few studies have been reported regarding the use of satellite imagery with a spatial resolution of 10 m or finer for cotton root rot identification. Therefore, more research is necessary to evaluate this new type of satellite imagery for cotton root rot identification and other agricultural applications.
The objectives of this research were to assess the potential of Sentinel-2 imagery and to compare it with airborne imagery for the detection of cotton root rot. This information will be important not only for a better understanding of the progression of the disease over a relatively large area, but also for the formulation of site-specific strategies for effective control of the disease.

2. Materials and Methods
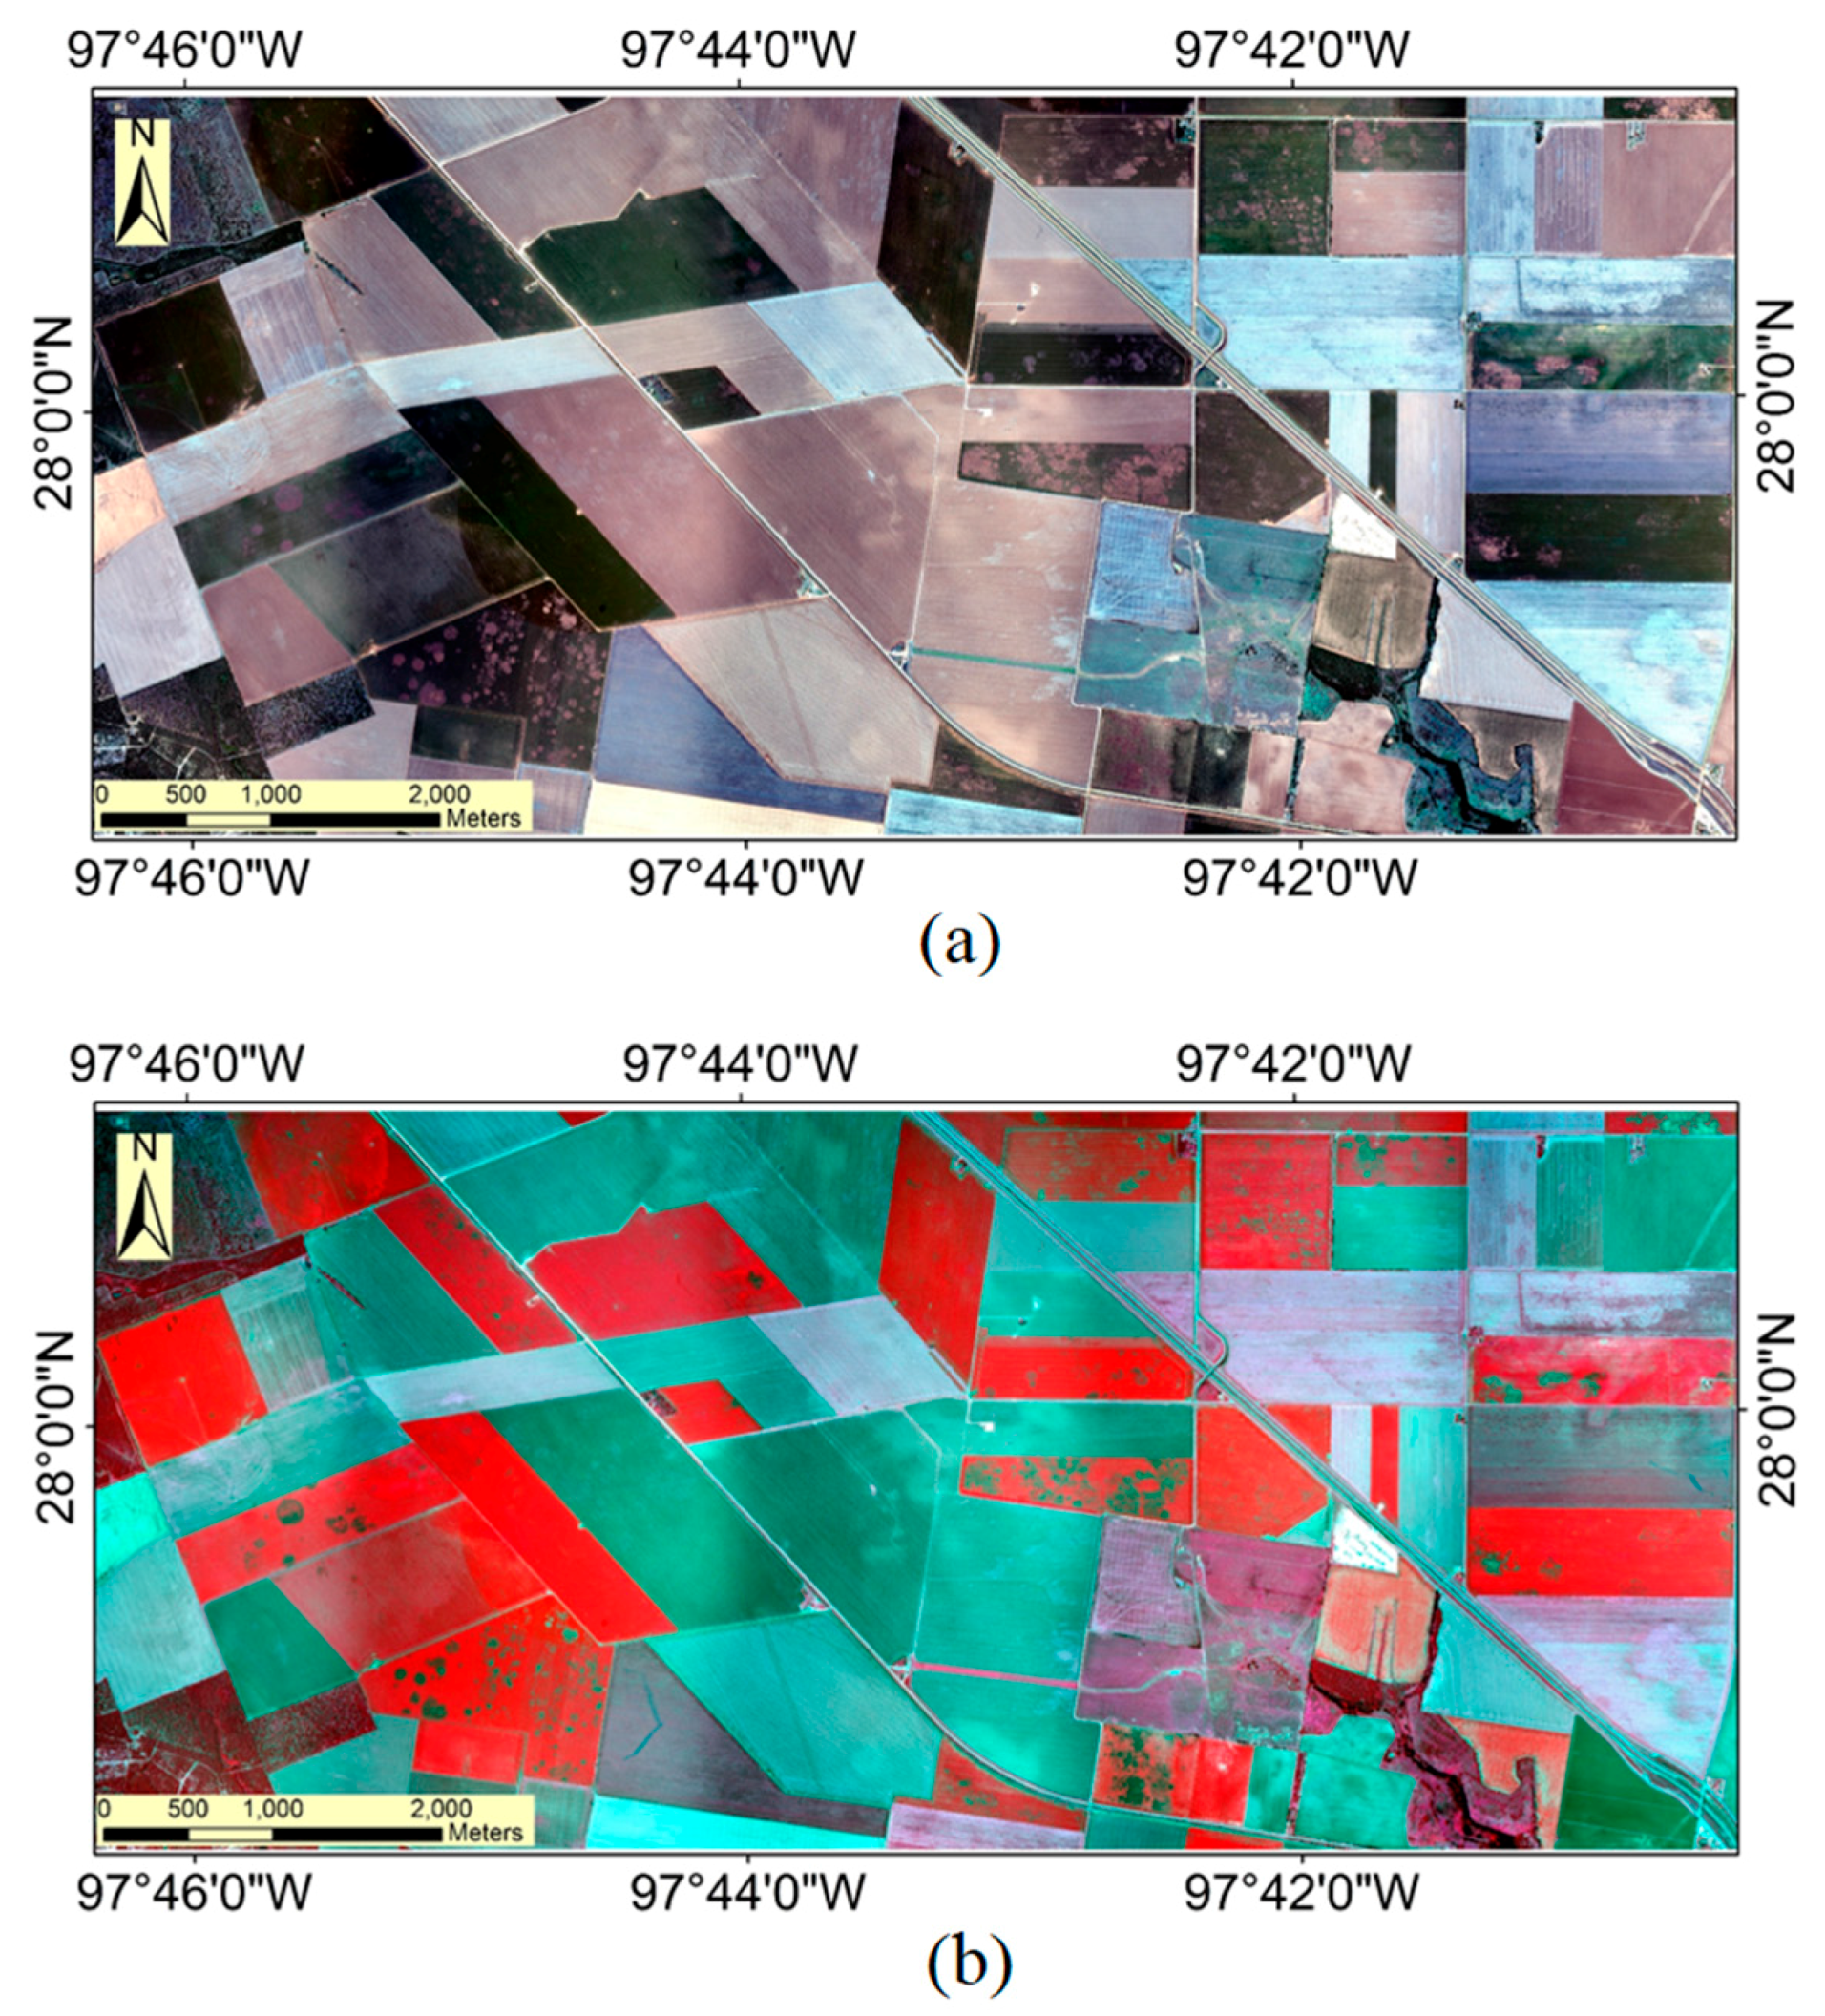
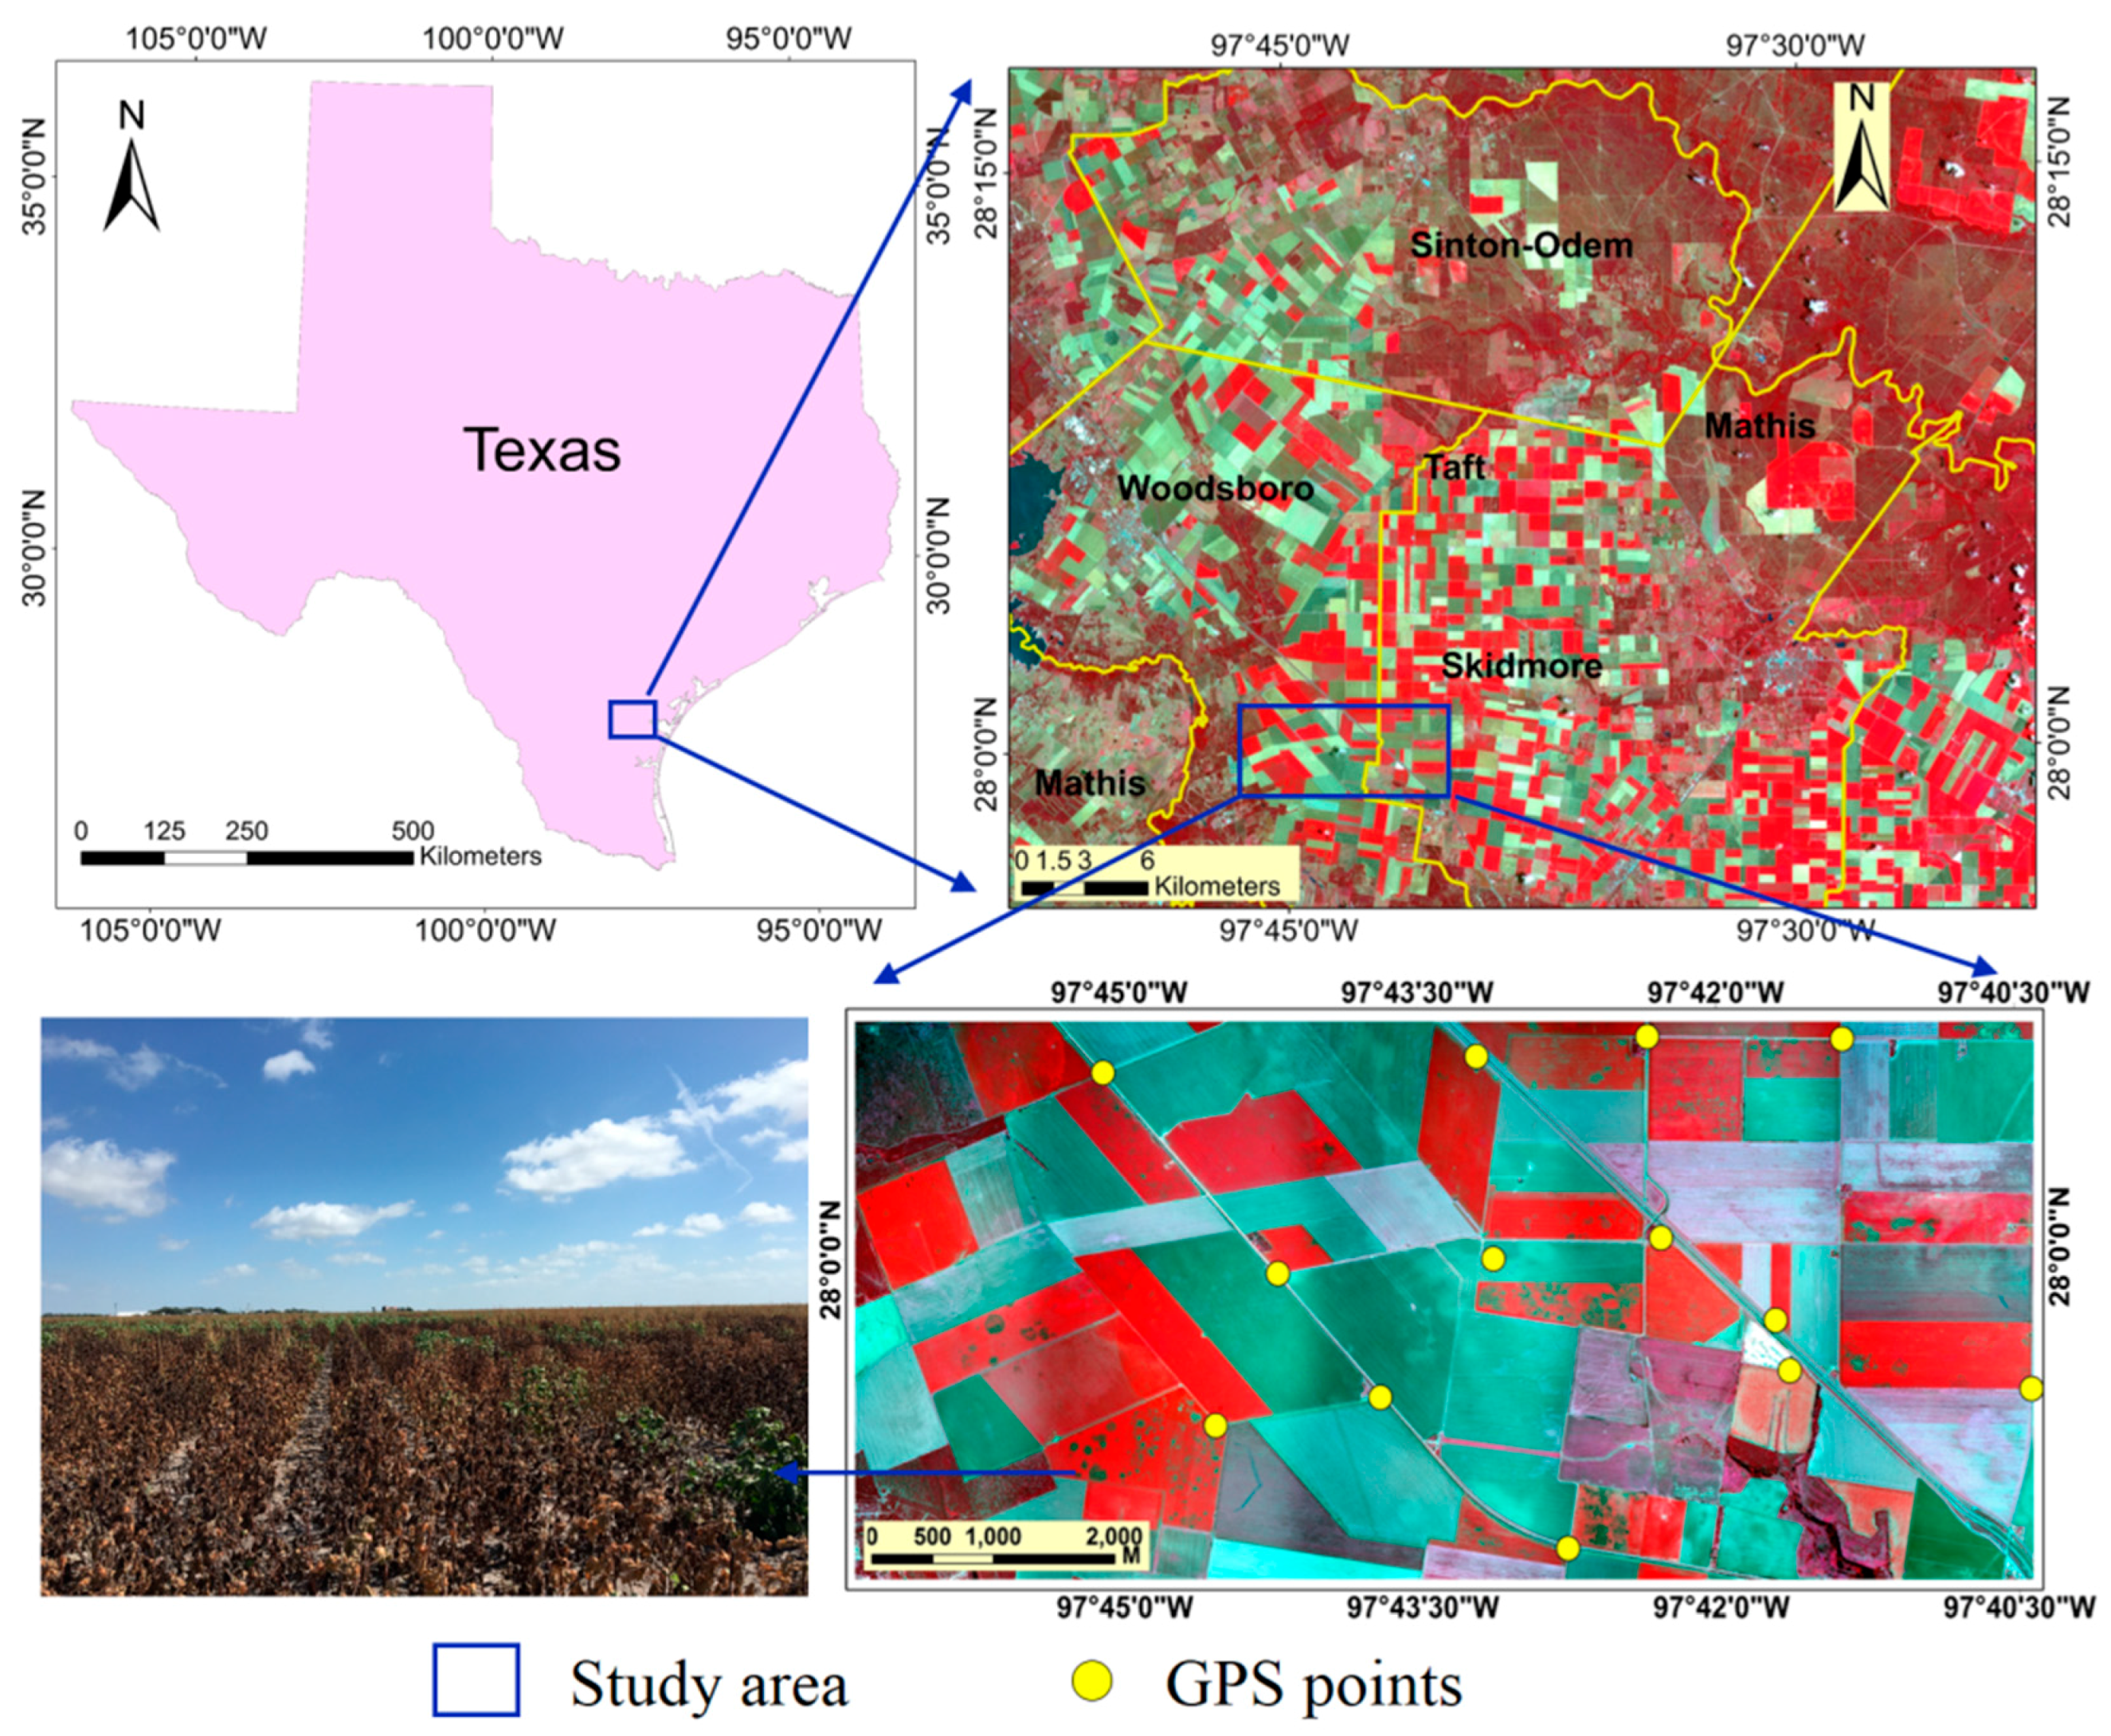
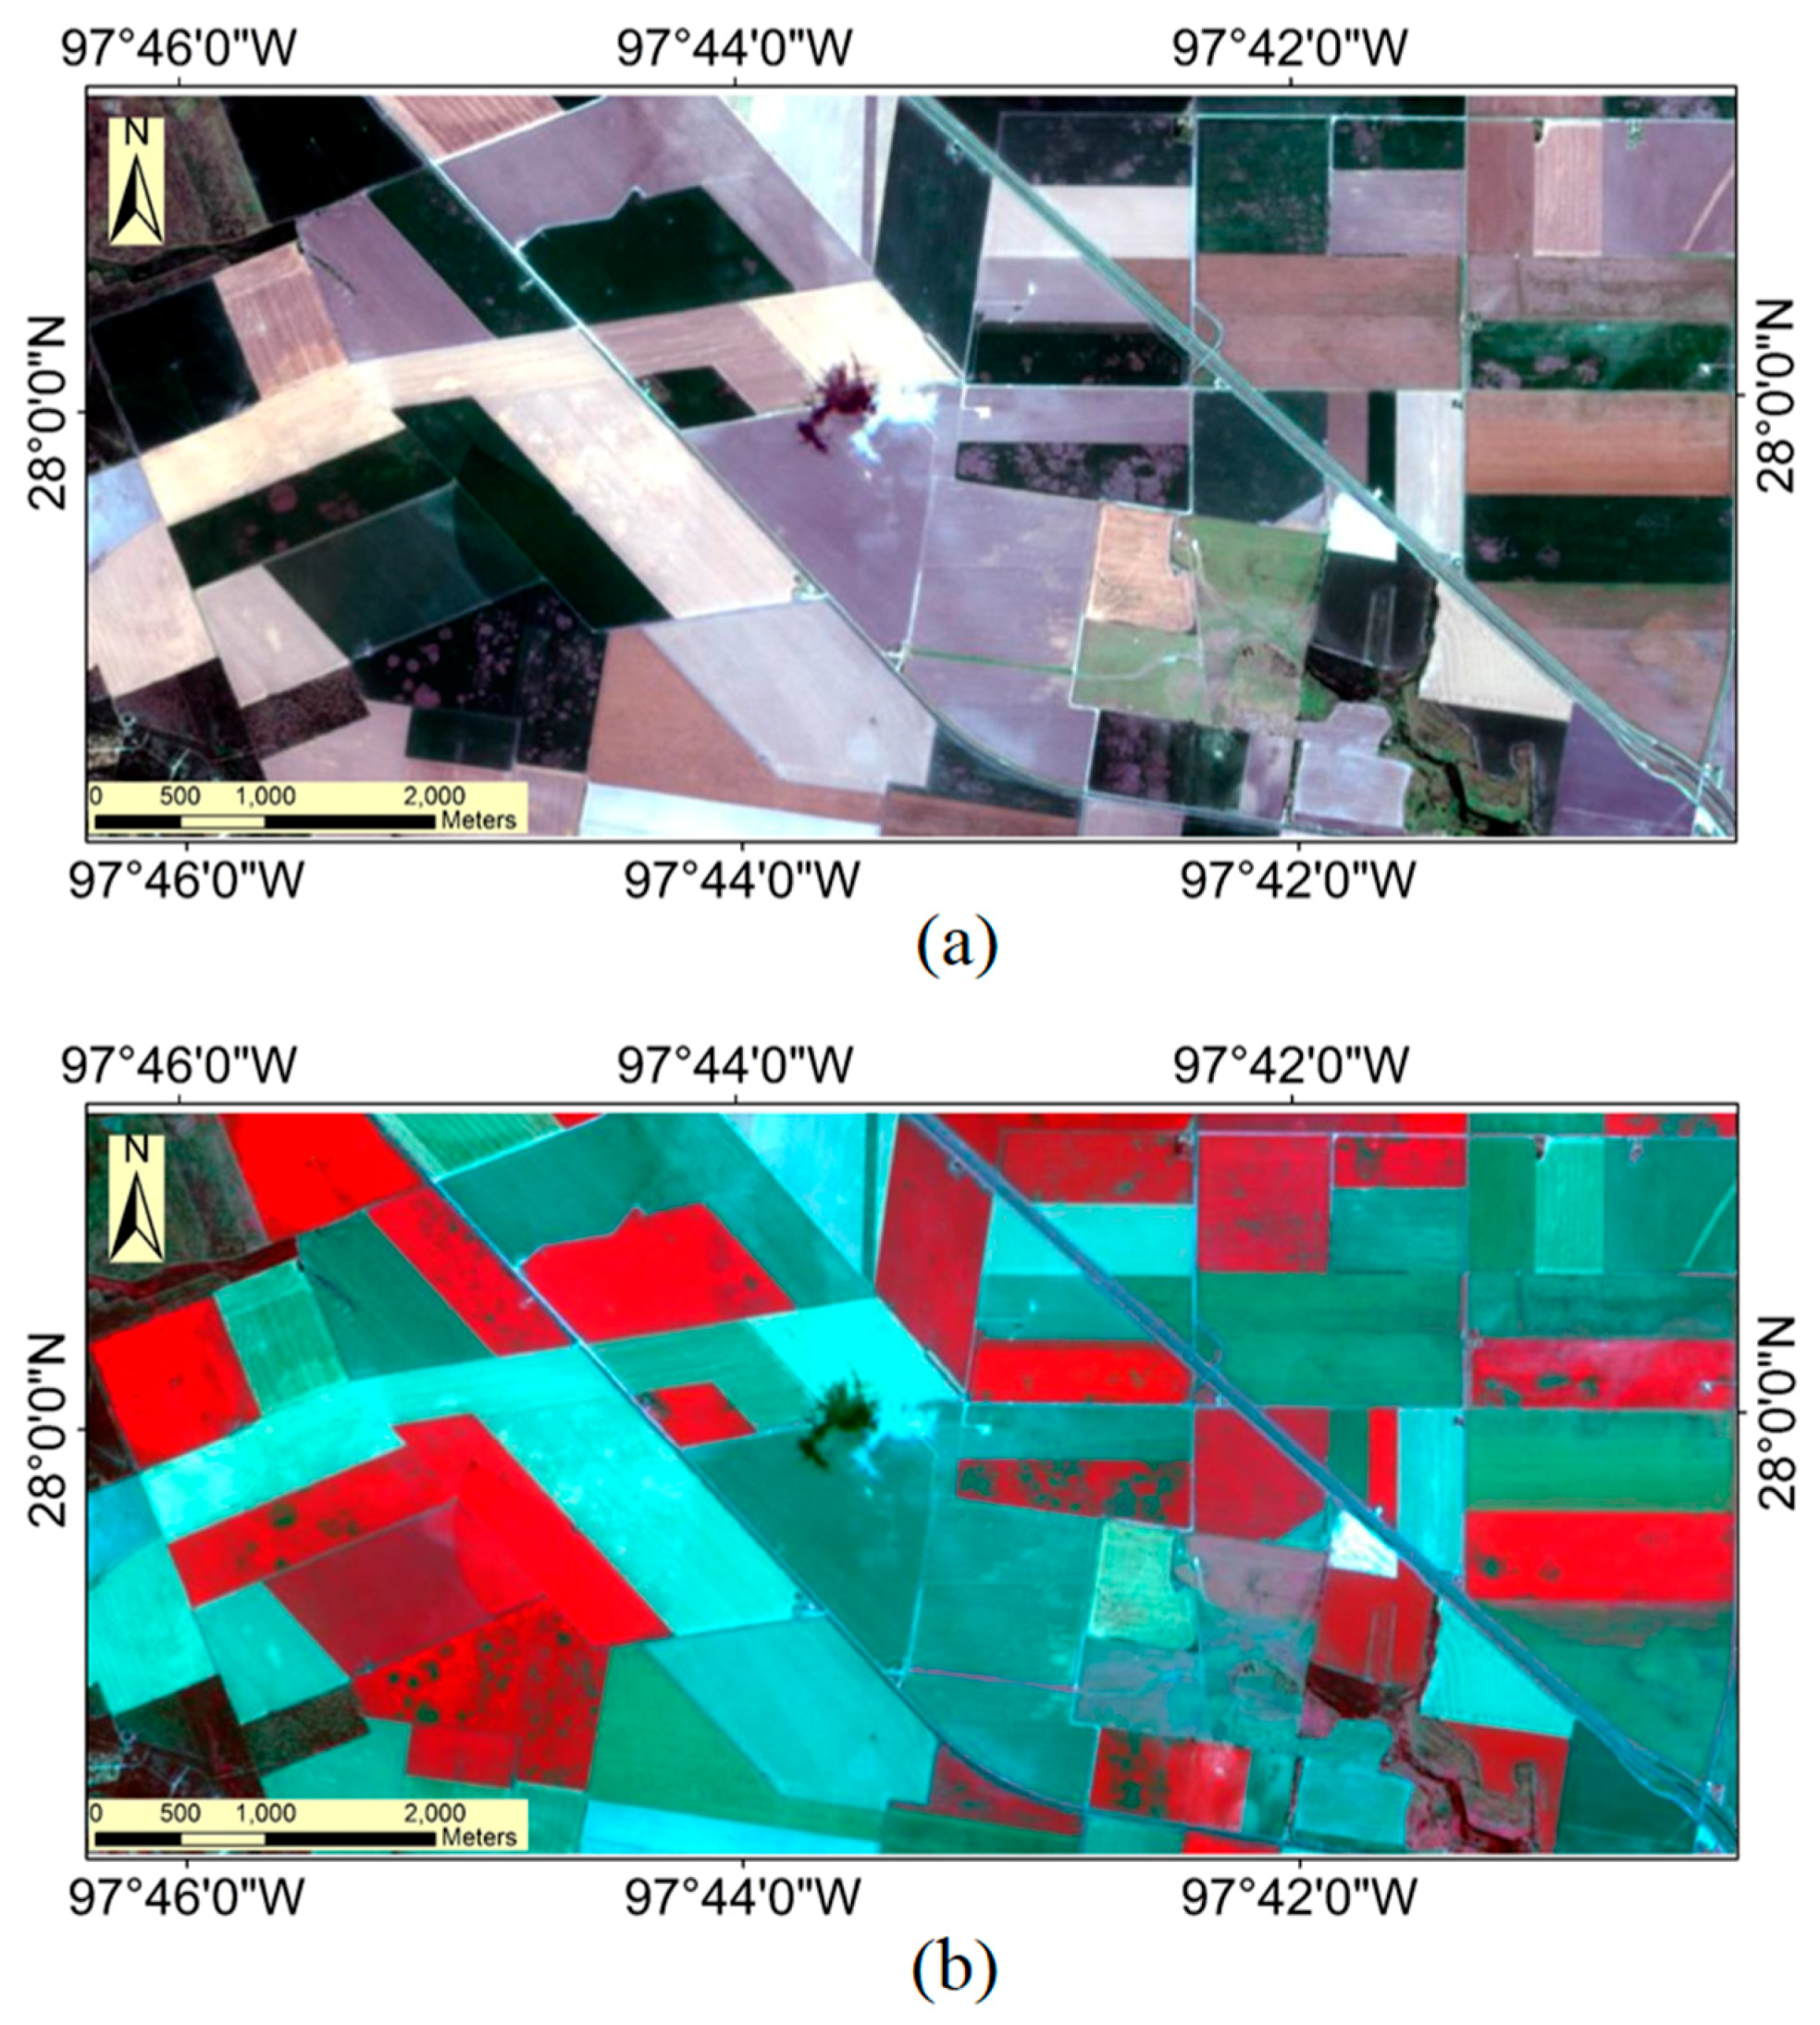
2.1. Study Area

The study area was located in a cropping area near Edroy, Texas, USA (Figure 1). It covered a rectangular area of about 42.30 km2 (4230 ha) with geographic coordinates of (28°00′01″ N, 97°6′19″ W) at the upper left corner and (27°8′43″ N, 97°00′26″ W) at the lower right corner.

2.2. Image Acquisition and Processing

2.2.1. Airborne Multispectral Imagery

A two-camera airborne imaging system developed by scientists at the U.S. Department of Agriculture-Agricultural Research Service’s (USDA-ARS) Aerial Application Technology Research Unit in College Station, Texas, was used to identify infested areas of cotton root rot in this study. The two-camera imaging system consisted primarily of two Nikon D810 digital CMOS cameras with Nikon AF Nikkor 20-mm f/1.8 G lenses (Nikon Inc., Melville, NY, USA). One camera was used to capture red-green-blue (RGB) images, and the other camera was modified to capture near-infrared (NIR) images after the infrared-blocking filter in front of the sensor of the camera was replaced by an 830-nm long-pass filter (LDP LLC, Carlstadt, NJ, USA). Airborne images were taken from the study area at an altitude of 3050 m (10,500 ft) above ground level (AGL) with a ground speed of 225 km/h (140 mph) under sunny conditions on 20 July 2016. The images had a pixel array of 7360 × 4912 and a spatial resolution of 0.81 m at this altitude.
In order to achieve at least 50% overlap along and between the flight lines, images were acquired at 5 s intervals. Both cameras simultaneously and independently captured images during image acquisition. Each image was recorded in both 14-bit RAW format for processing and JPEG format for viewing and checking. The free Capture NX-D 1.2.1 software (Nikon Inc., Tokyo, Japan) provided by the camera manufacturer was used to correct the vignetting and geometric distortion in the images. The corrected images were saved in 8-bit TIFF format to preserve image quality. Then the Pix4DMapper software (Pix4D Inc., Lausanne, Switzerland) was used for automatic image mosaicking. To improve the positional accuracy of the mosaicked image, 24 ground control points (GCPs), as shown in Figure 1, were used when the images were mosaicked in Pix4DMapper software. A Trimble GPS Pathfinder ProXRT receiver (Trimble Navigation Ltd., Sunnyvale, CA, USA), which provided 0.2 m average horizontal position accuracy with the real-time OmniSTAR satellite correction, was used to collect the coordinates from these GCPs. The mosaicked image was georeferenced or rectified to the Universal Transverse Mercator (UTM), World Geodetic System 1984 (WGS-84), Zone 14, coordinate system. Then the image was atmospherically corrected using the Quick Atmospheric Correction tools in ENVI 5.3 (Harris Corporation, Jersey City, NJ, USA) and the normalized difference vegetation index (NDVI) of the image was calculated. Figure 2 shows the RGB and color infrared (CIR) composite of the four-band mosaicked image. The mosaicked 0.81 m airborne image was then resized to 10 m spatial resolution by setting the output pixel size with 10 m through the Resize tool in ENVI 5.3. Then the 10 m airborne image was used as the reference image for geometric correction and evaluation of the Sentinel-2A image.

2.2.2. Sentinel-2A Satellite Imagery

One Sentinel-2A multispectral instrument (MSI) L1C dataset acquired on 11 July 2016 (ID: 2A_OPER_PRD_MSIL1C_PDMC_20160712T012010_R069_V20160711T171110_20160711T171110) was downloaded from the U.S. Geological Survey (USGS) Global Visualization Viewer at http://glovis.usgs.gov/. The 12-bit Sentinel-2A MSI image has 13 spectral bands in the visible, NIR, and SWIR wavelength region with spatial resolutions of 10–60 m. In this study, the four Sentinel-2A bands (i.e., blue, green, red, and NIR) with 10 m spatial resolution were selected to identify the cotton root rot-infested areas (Figure 3).
The Sentinel-2A dataset was resized to the study area using the ESA’s Sentinel-2 toolbox ESA Sentinel Application Platform (SNAP) and then converted to ENVI format. The image was then atmospherically corrected through the Quick Atmospheric Correction tools in ENVI 5.3. The automatic registration module in ENVI 5.3 was used for the image geometrical correction, which referenced the resized 10 m airborne image. More than 200 tie control points were chosen manually and a two-order polynomial geometric model was used. The total root mean square (RMS) error for the registration was 0.30 pixels.

2.3. Image Classification and Analysis

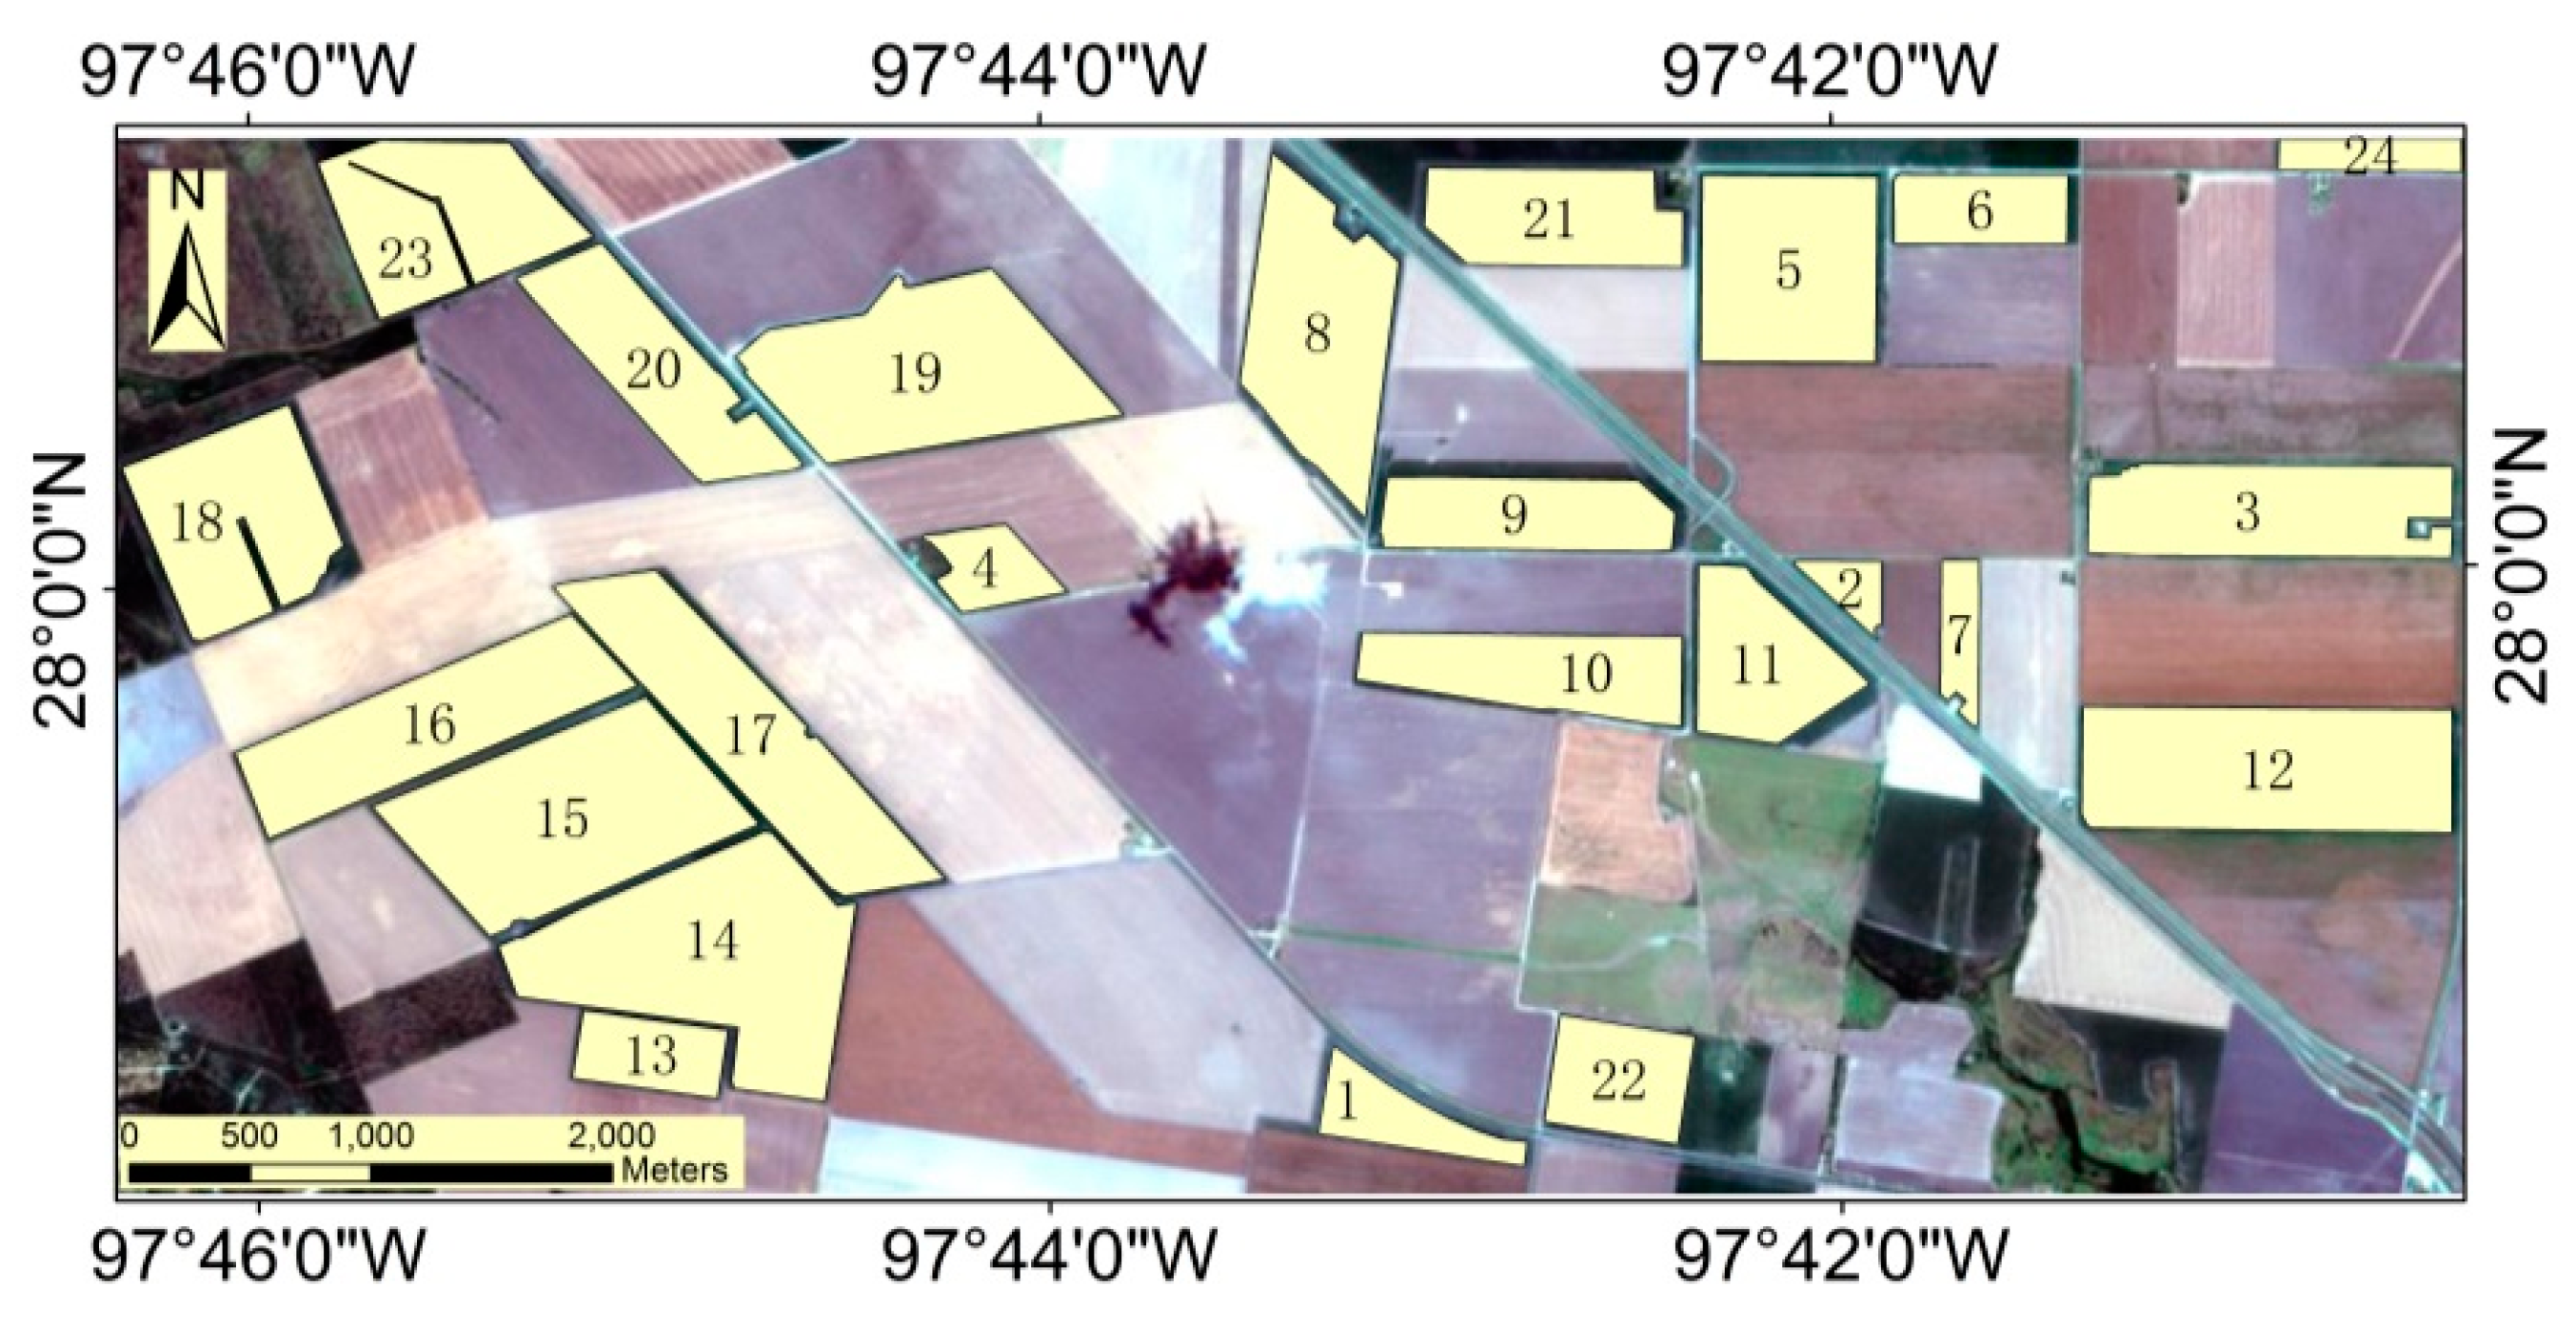
2.3.1. Cotton Field Identification

In order to determine the cotton root rot identification accuracy of the Sentinel-2A imagery, the 0.81 m pixel size airborne multispectral image was used to distinguish the cotton fields through visual interpretation with field verification. There were 24 cotton fields in the study area and the field boundaries were digitized on the computer screen using the Editor tools of ArcGIS10.0 software (Figure 4).

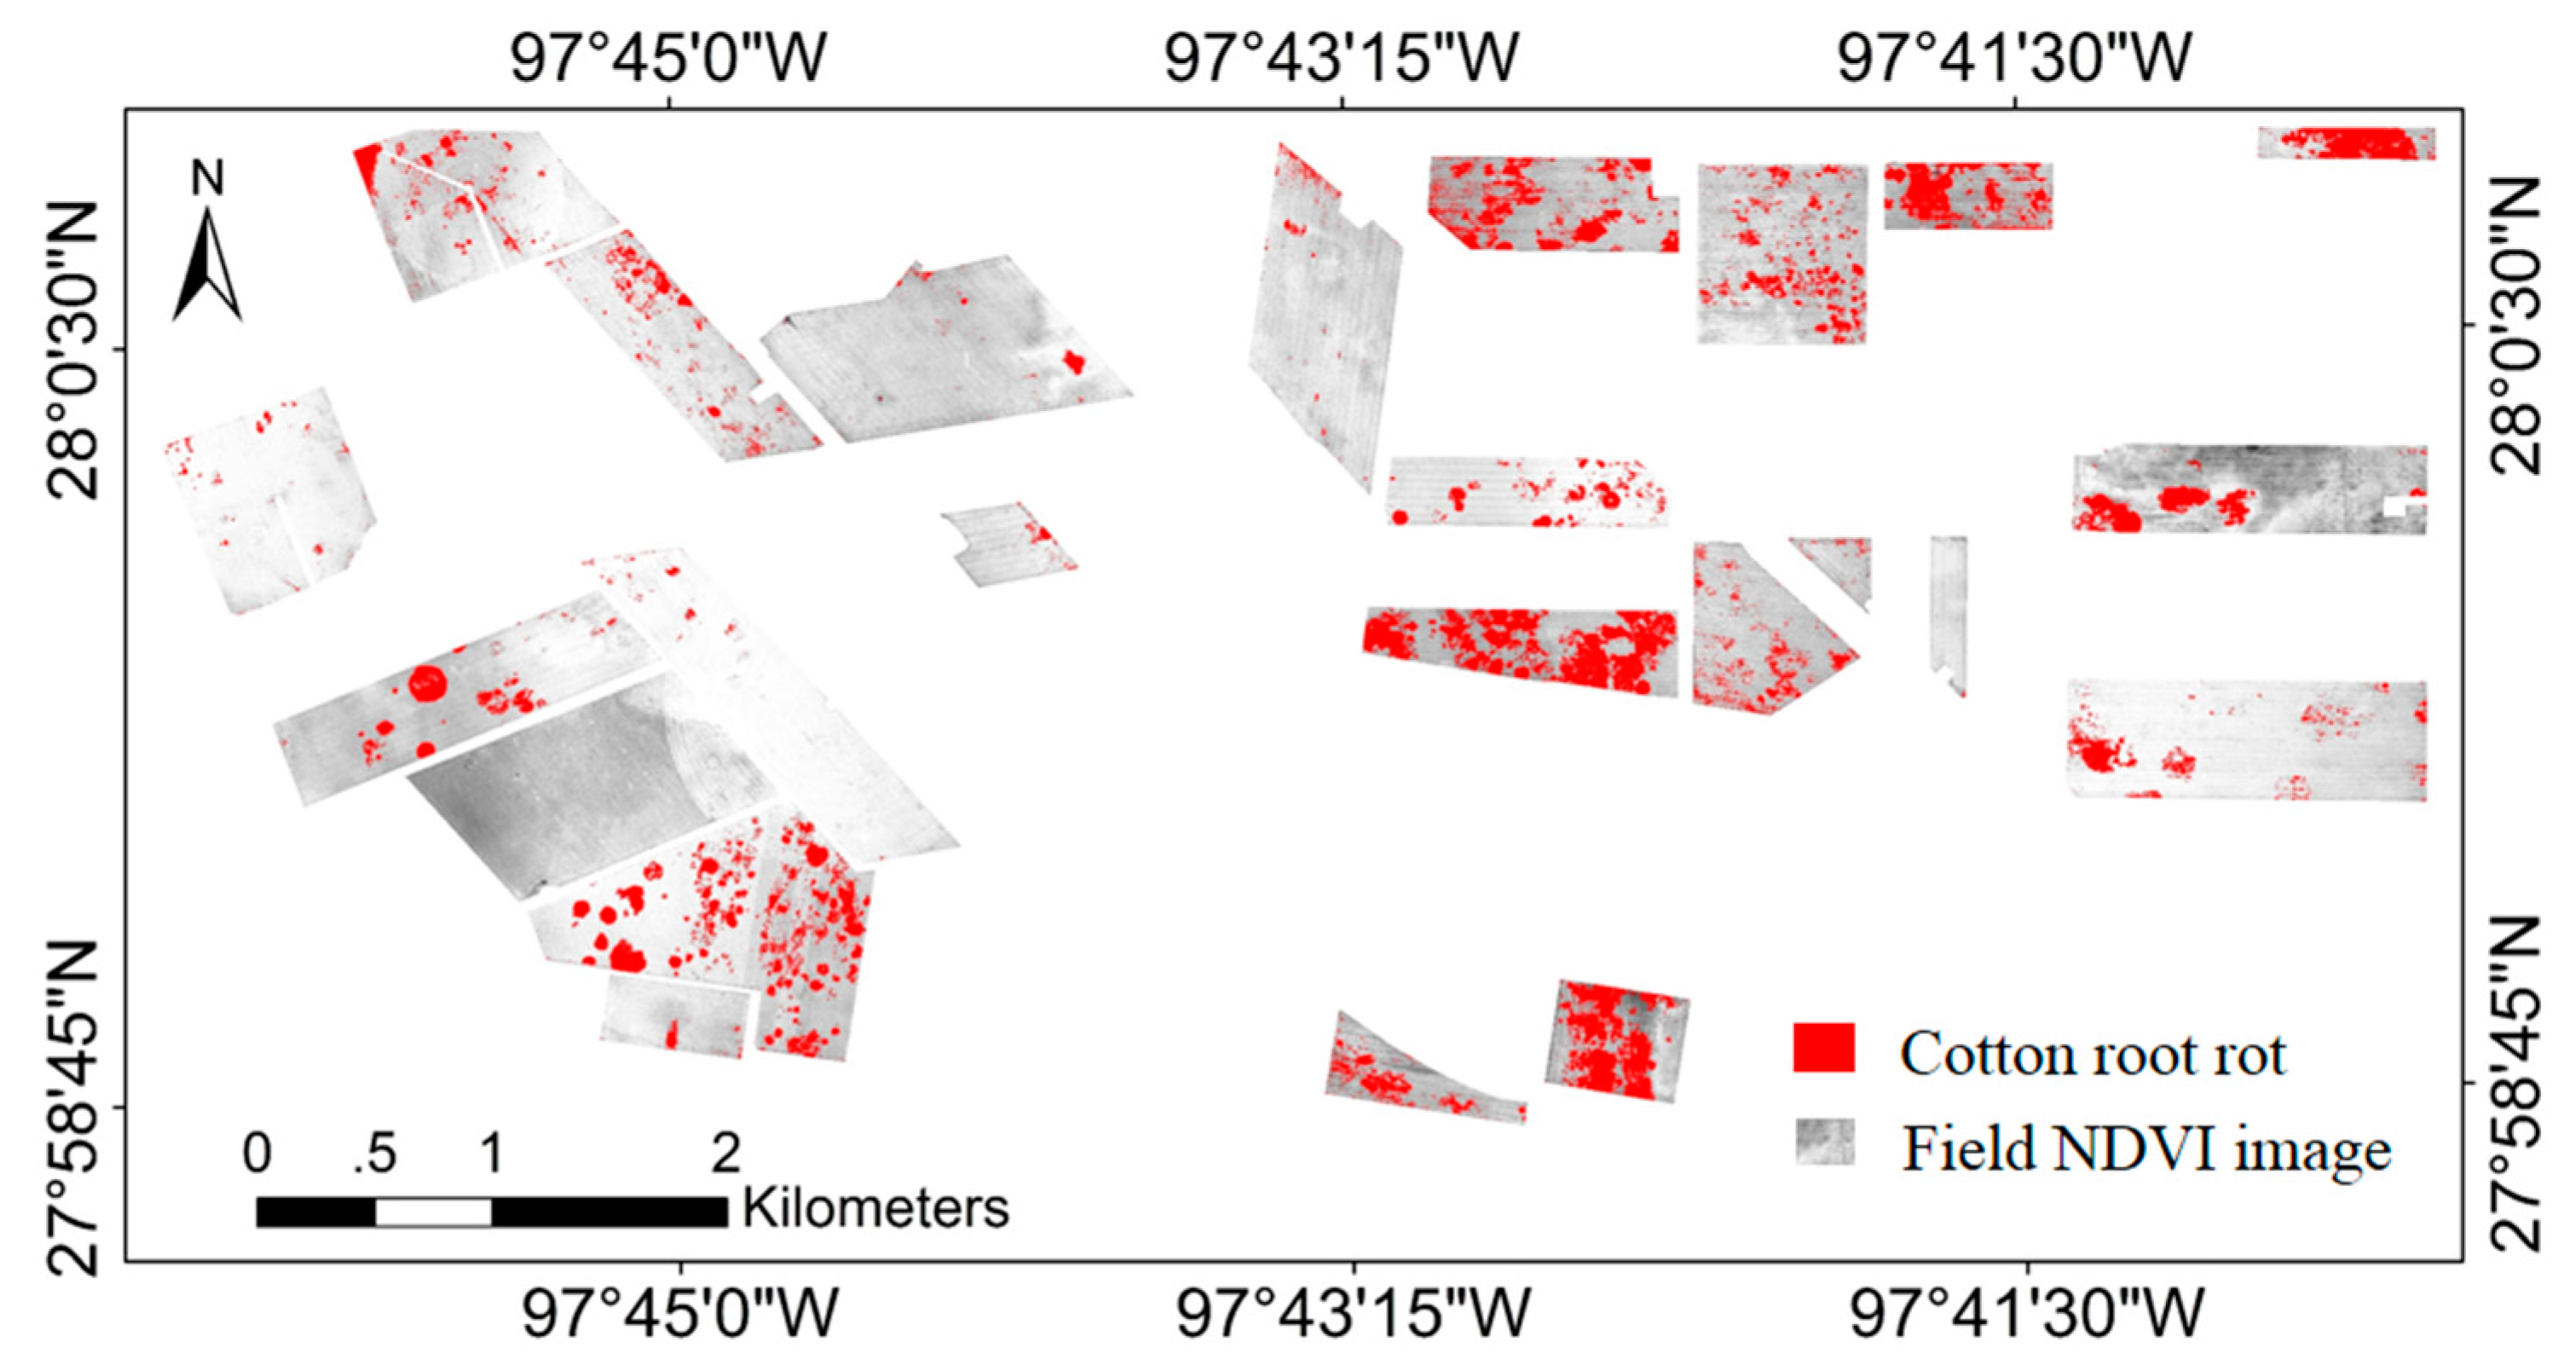
2.3.2. Classification of Cotton Root Rot

The original 0.81 m airborne multispectral images for each field were extracted from the mosaicked image using the field vector boundaries, and each field subset image was then classified into root rot-infested and non-infested zones using ISODATA unsupervised classification (ENVI 5.3, 2016). The unsupervised method uses the minimum spectral distance to group each pixel into a class based on the four spectral bands (i.e., blue, green, red and NIR) and the NDVI image. The process began with arbitrary class means from the image statistics based on the 20–30 classes specified. It repeatedly performed a classification and recalculated new class statistics, which were then used for the next iteration. In all the classifications, the convergence threshold (0.99) was met before the maximum number of iterations (100) was reached. The spectral classes in each classification map were compared with the original imagery and field observations and grouped into root rot-infested and non-infested zones.
For the Sentinel-2A image, the four bands (i.e., blue, green, red, and NIR) and the NDVI image were selected for cotton root rot identification for all the fields. First, the Sentinel-2A images for each field were extracted by the field boundary vector file, and each field subset image was then classified into 10–20 spectral classes using ISODATA unsupervised classification. The cotton root rot areas for all 24 cotton fields were distinguished using the visual interpretation method from the classification maps. Second, the Sentinel-2A image for the whole study area, including all 24 fields, was classified into 10 spectral classes using ISODATA unsupervised classification and the classification map was regrouped into root rot-infested and non-infested zones.

2.3.3. Accuracy Assessment

The original 0.81 m airborne field subset image was used to detect the cotton root rot infested area for each field. The cotton root rot classification results for all cotton fields were combined to a cotton root rot reference map for the study area. In order to estimate the classification accuracy of the Sentinel-2A imagery, the 0.81 m cotton root rot classification map was also resized to 10 m spatial resolution using the ENVI Resize tool in this study.
Classification accuracy statistics, including overall accuracy, producer’s accuracy, user’s accuracy, and kappa coefficients, were calculated based on the error matrices. Kappa analysis was also performed to test if each classification was significantly better than a random classification and if any two classifications were significantly different. The test statistic for evaluating the significance of a single classification was a standardized Z-value calculated from the overall kappa value and kappa variance for the classification [27].

3. Results

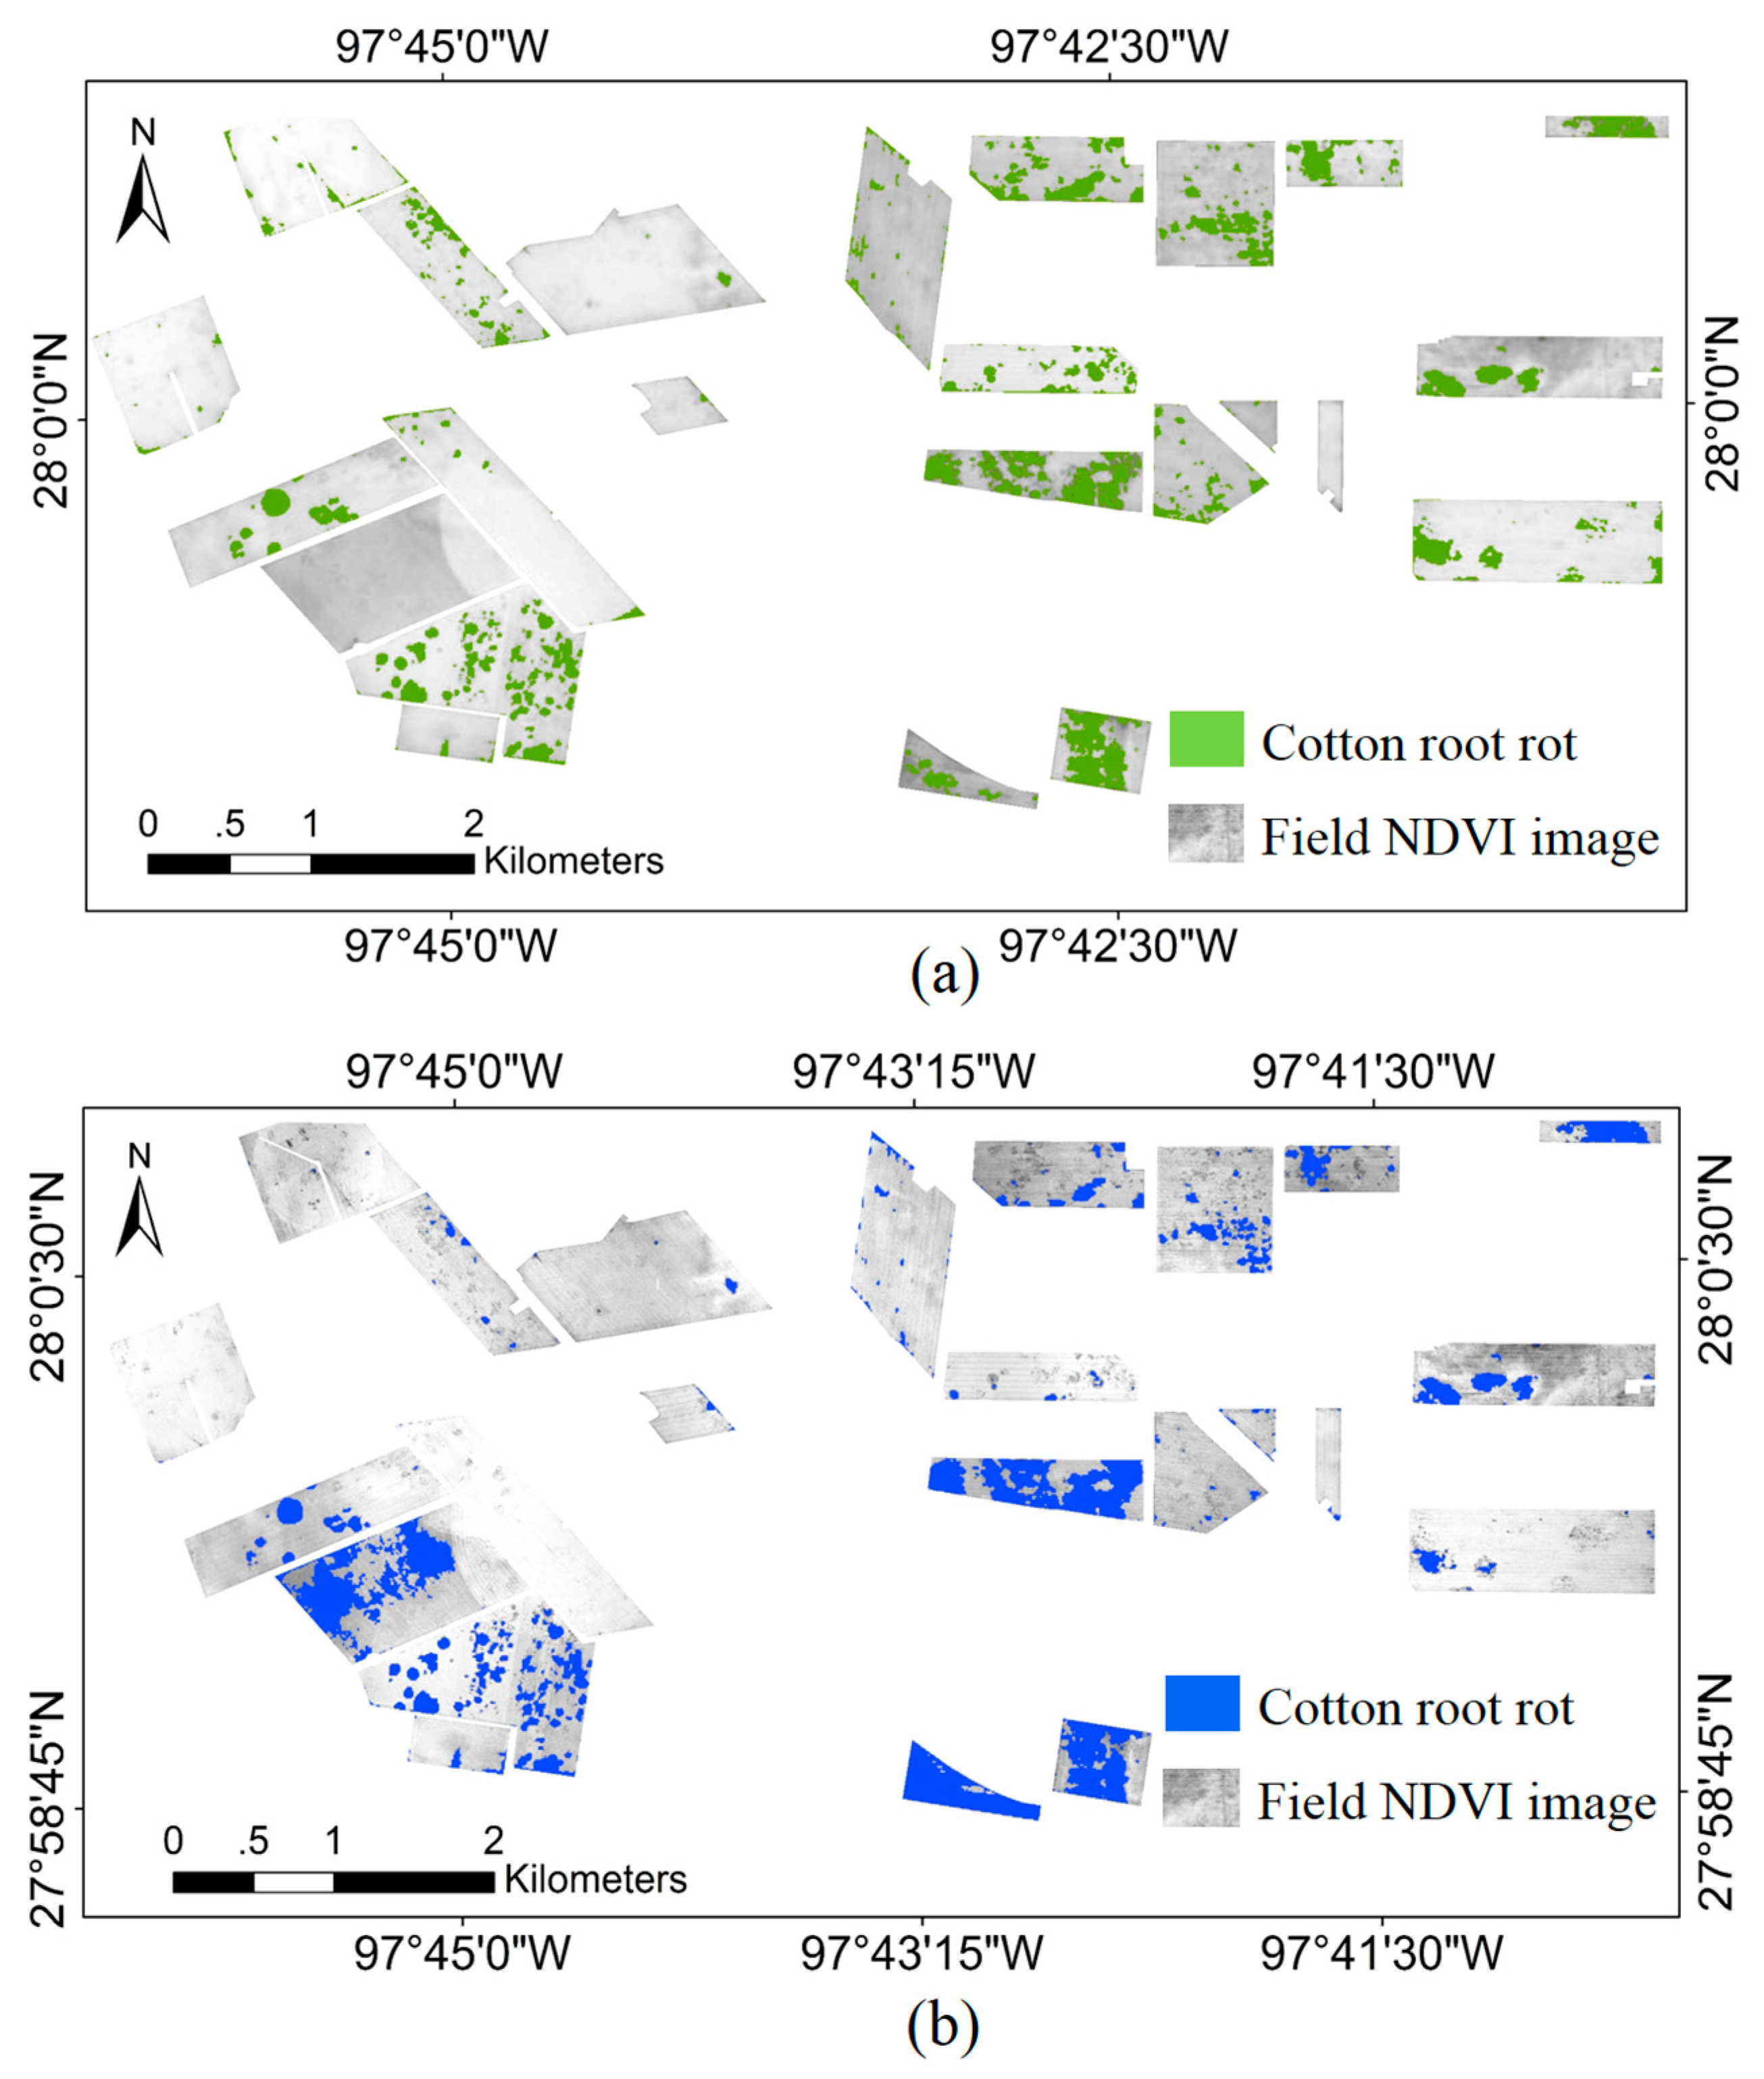
3.1. Airborne Multispectral Image Classification

Root rot-infested areas can be accurately differentiated from non-infested areas if there are no other major stressors present that produce similar plant symptoms to those of root rot [5,28]. Field observations confirmed that cotton root rot was the dominant stressor and that there was a minimal amount of interference from other biotic and abiotic factors in these cotton fields. Therefore, the two-zone classification maps using the unsupervised classification and regrouping procedures were accurate and reliable. Nevertheless, care was taken to ensure that infested areas were correctly identified by visually comparing each classification map with its original NDVI and true color images in this study. Figure 5 shows the combined cotton root rot classification map detected by the airborne subset images for all the 24 cotton fields. The red color within each field represents root rot-infested areas, while the background gray color depicts non-infested areas. The percentage of the root rot-infested areas for all the fields in Figure 5 was 10.97%.
Table 1 lists the field area and the root rot-infested area for all fields in Figure 5. The total infested area for the 24 fields was 111.24 ha with an average infestation percentage of 10.81% for the whole study area. It can be seen from Table 1 that Fields 7 and 15 were not infested with cotton root rot. The percentage of root rot-infected areas for the other fields ranged from 0.79% for Field 17 to 56.46% for Field 24.
Table 1 also shows the resampled 10 m classification map statistic results for the 24 cotton fields. The differences for field area and cotton root rot-infested area between the 0.81 m and 10 m classification maps were small. Correlation analysis showed that the correlation coefficients between the two types of maps were 99.99% for field area and 99.97% for root rot-infested areas. Therefore, it was appropriate to use the resampled 10 m airborne classification maps as reference for the evaluation of the Seninel-2A classification maps.

3.2. Sentinel-2A Image Classification

Figure 6 shows the classification maps generated from the Sentinel-2A image. Figure 6a presents the cotton root rot infested areas identified by the field subset Sentinel-2A images for the 24 fields. The total infested area estimated was 131.27 ha and the average infestation percentage was 12.75%. No root rot was found in Fields 7 and 15. The percentage of root rot-infested areas for the other fields ranged from 0.68% for Field 19 to 50.22% for Field 22.
Figure 6b presents the two-zone classification map generated from the whole study area Sentinel-2A image. The total cotton root rot-infested area in Figure 6b was 164.06 ha and the average infestation percentage was 15.94% for all 24 fields. Table 2 lists the field area, the root rot-infested area for each field in Figure 6a,b. It can be seen from Figure 6 and Table 2 that some small infested areas detected by the airborne imagery were sieved in the Sentinel-2A imagery. In contrast, some small non-infested areas distributed in large cotton root rot areas were clumped into the root rot area in the Sentinel-2A image.
Figure 7 illustrates the differences in cotton root rot infested area percentage for the 24 fields based on the field subset airborne images, the field subset Sentinel-2A images and the whole Sentinel-2A image.
Although there were some obvious differences in the percentage values for some of the fields between lines a and b in Figure 7, such as Fields 6, 10, and 22, the two lines had a similar trend for all the fields. However, the percentage values for Fields 1 and 15 in line c were dramatically higher than the corresponding values on lines a and b, indicating a significant classification error for these two fields.

3.3. Classification Accuracy Assessment

Table 3 presents an accuracy assessment error matrix for the classification map that combined the field subset classification maps based on the Sentinel-2A imagery (Figure 6a). The error matrix was generated by comparing the classified categories with the aggregate airborne image classification map. The overall accuracy (i.e., the probability of an image pixel being correctly identified) of the classification map was 94.06%. The producer’s accuracy (a measure of omission error), which indicates the probability of actual areas being correctly classified, was 83.23% for the root rot category and 96.65% for the non-infested category. In other words, 83.23% of the root rot areas were correctly identified as root rot, while 96.65% of the non-infested areas were correctly identified as non-infested in the classification map. This omission error was due to the small inclusions of non-infested areas within large root rot areas. The user’s accuracy (a measure of commission error), which is indicative of the probability that a category classified on the map actually represents that category on the ground, was 73.59% for the root rot areas and 97.51% for the non-infested areas, which means that 26.41% of the root rot areas on the classification map were actually non-infested areas.
Table 4 shows an accuracy assessment error matrix for the classification map generated from the Sentinel-2A four band image and its NDVI image for the whole study area (Figure 6b). The overall classification accuracy was 91.19%. The producer’s accuracy was 73.55% for the root rot category and 93.51% for the non-infested category. The user’s accuracy was 59.90% for the root rot areas and 96.41% for the non-infested areas.

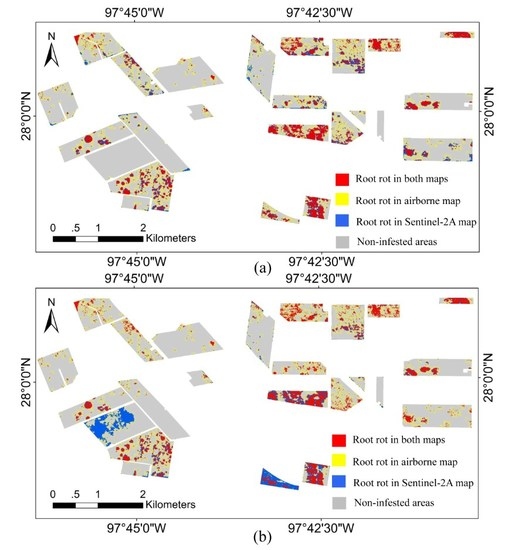
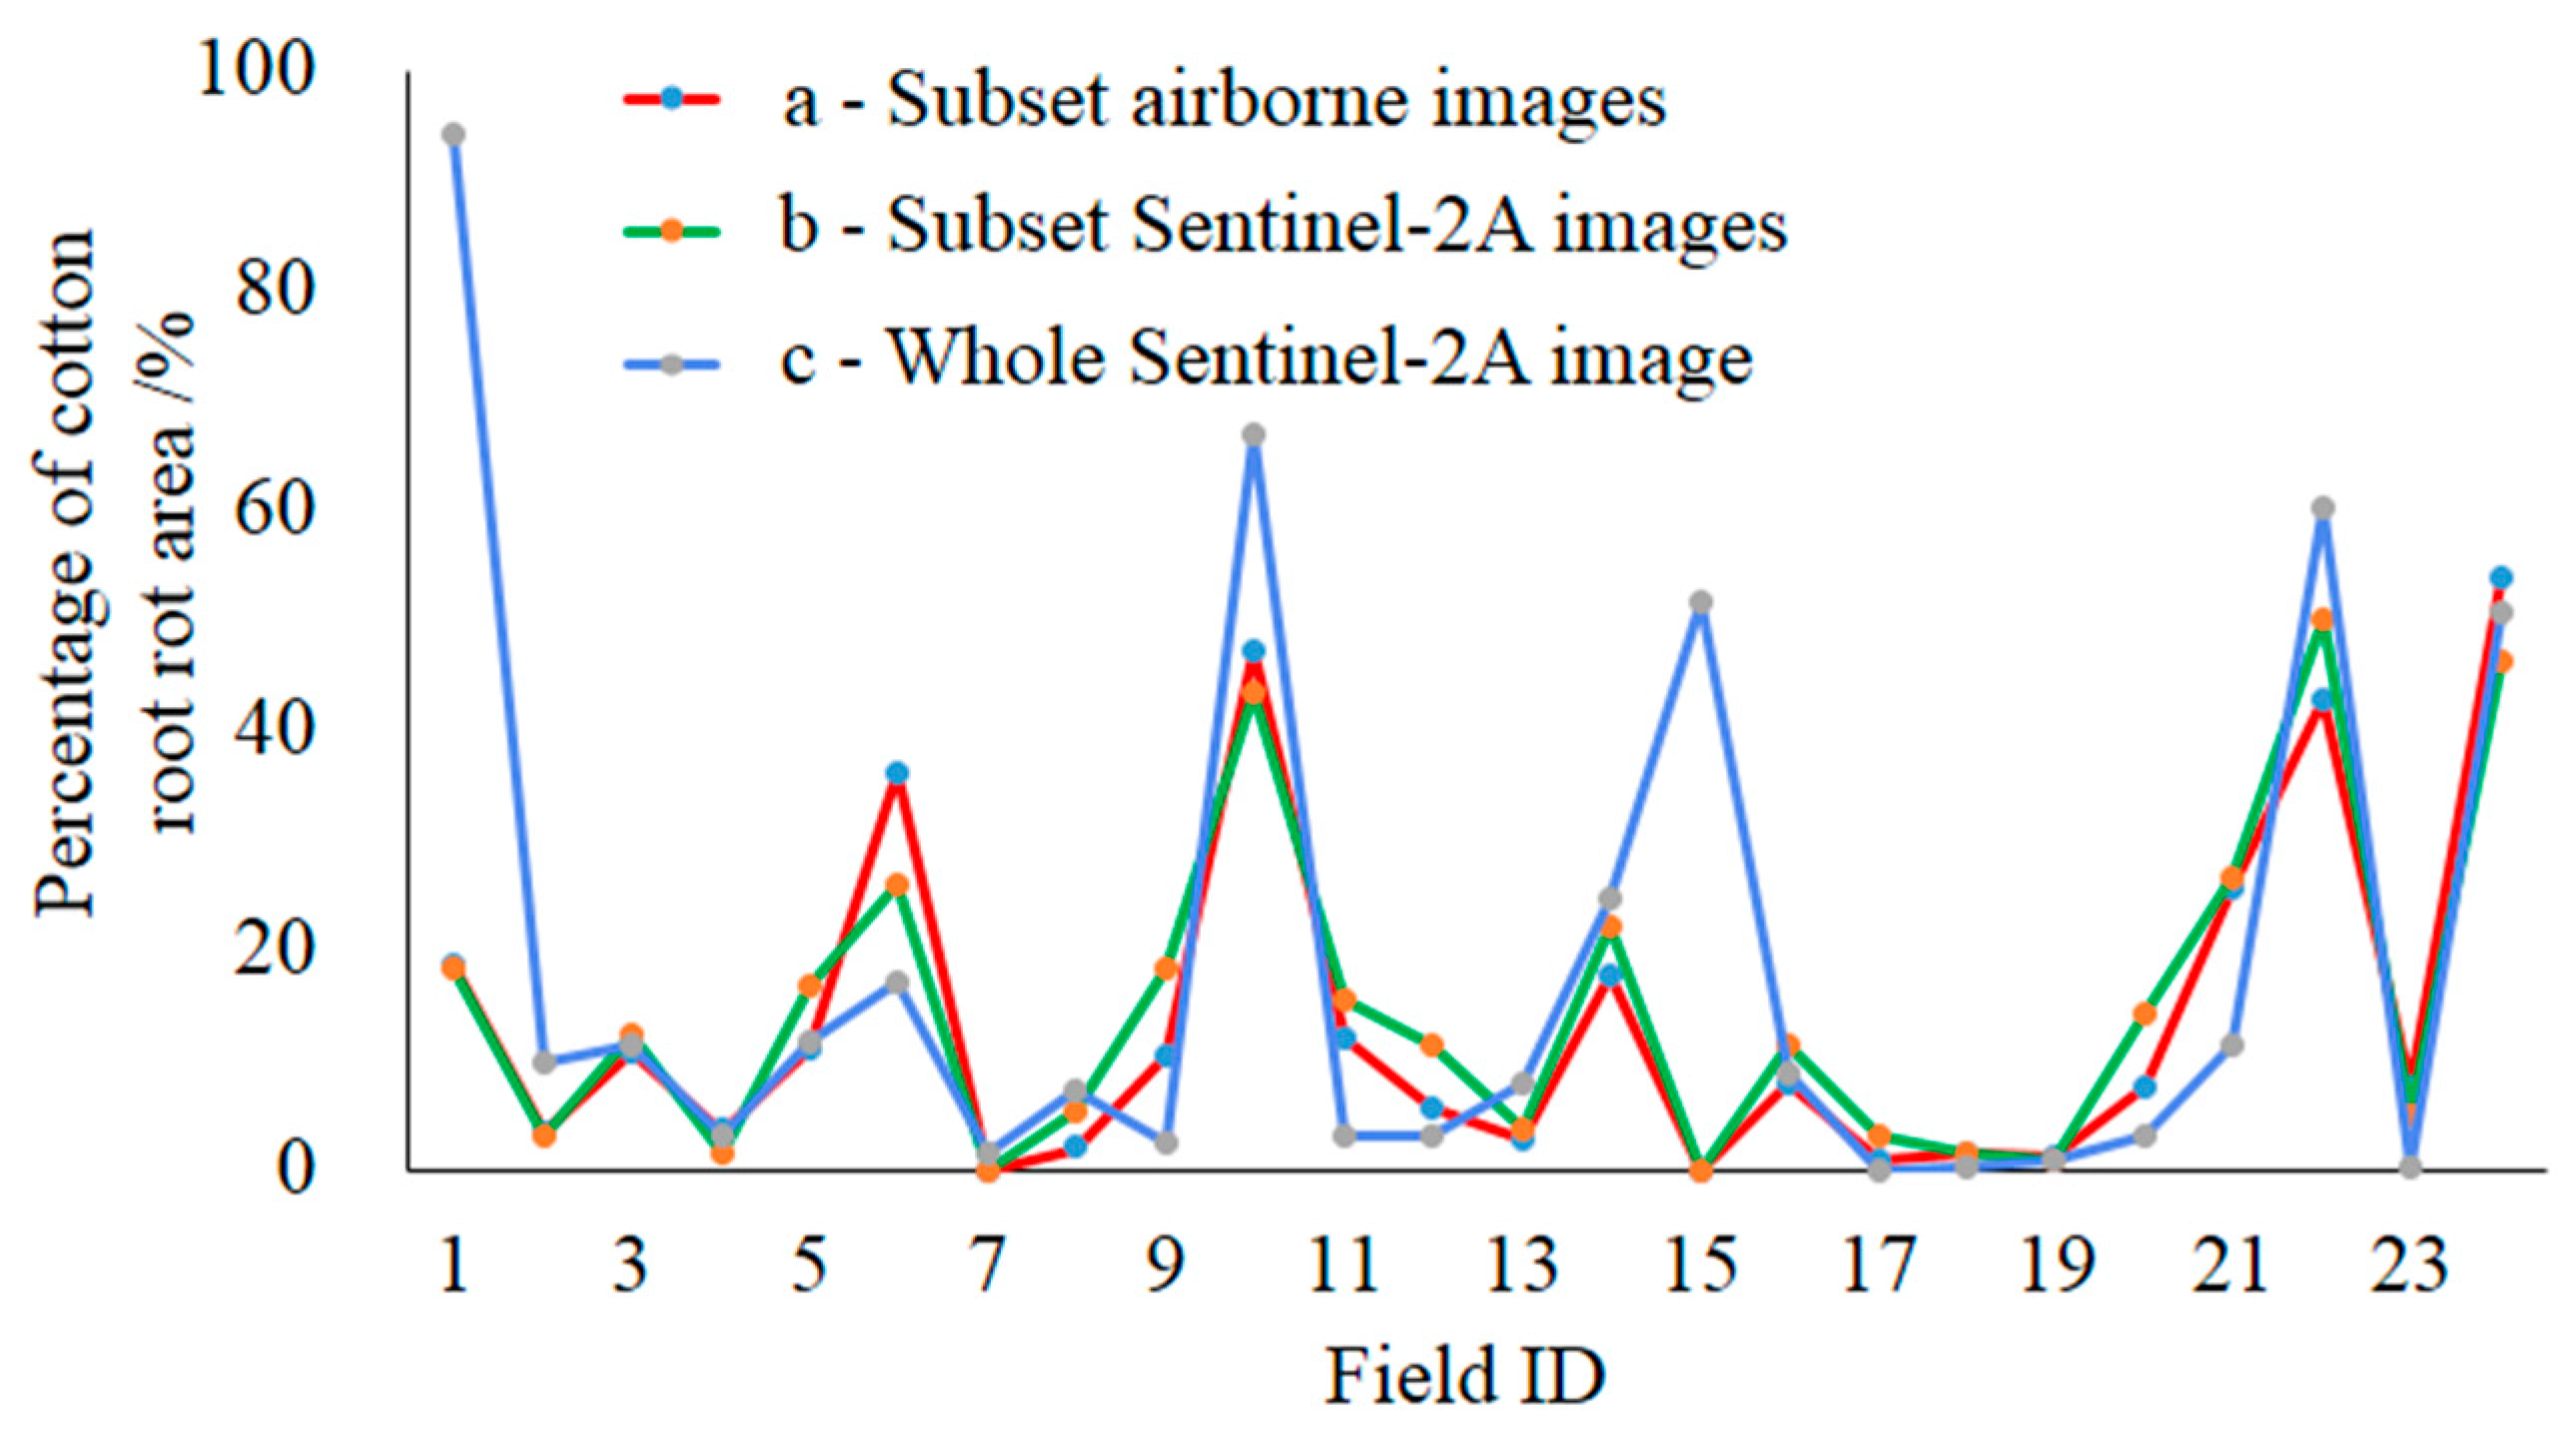
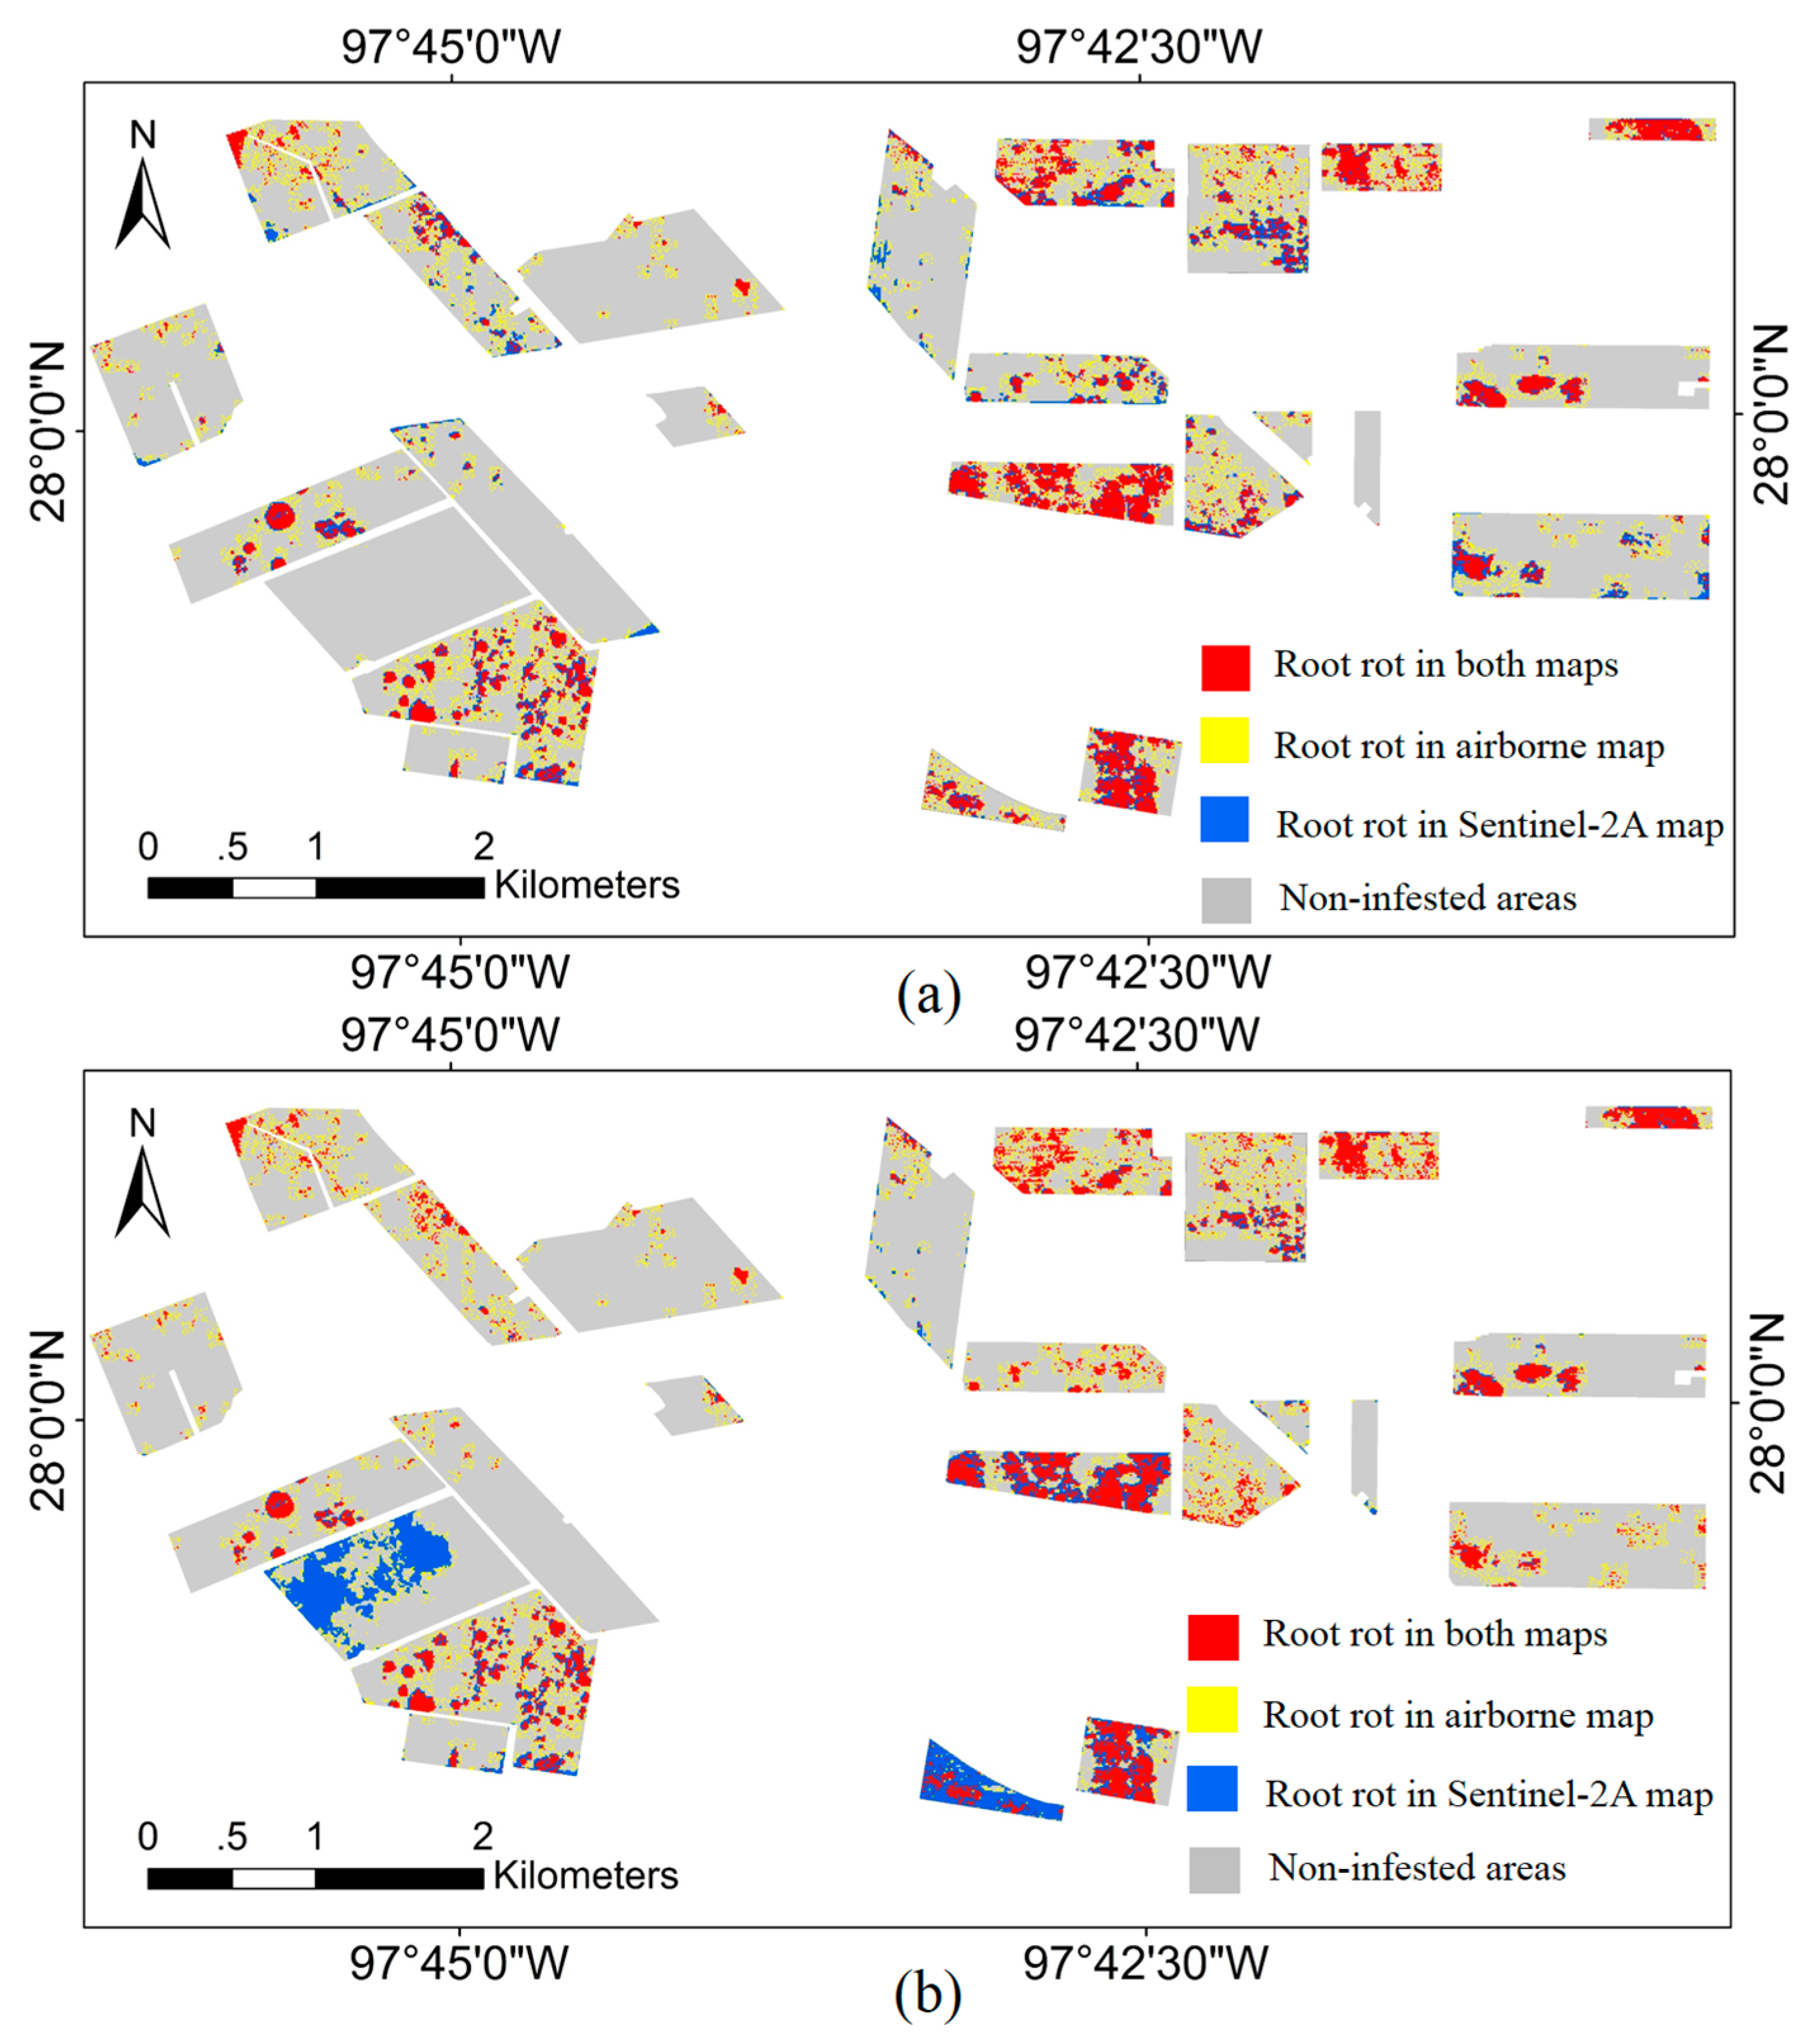
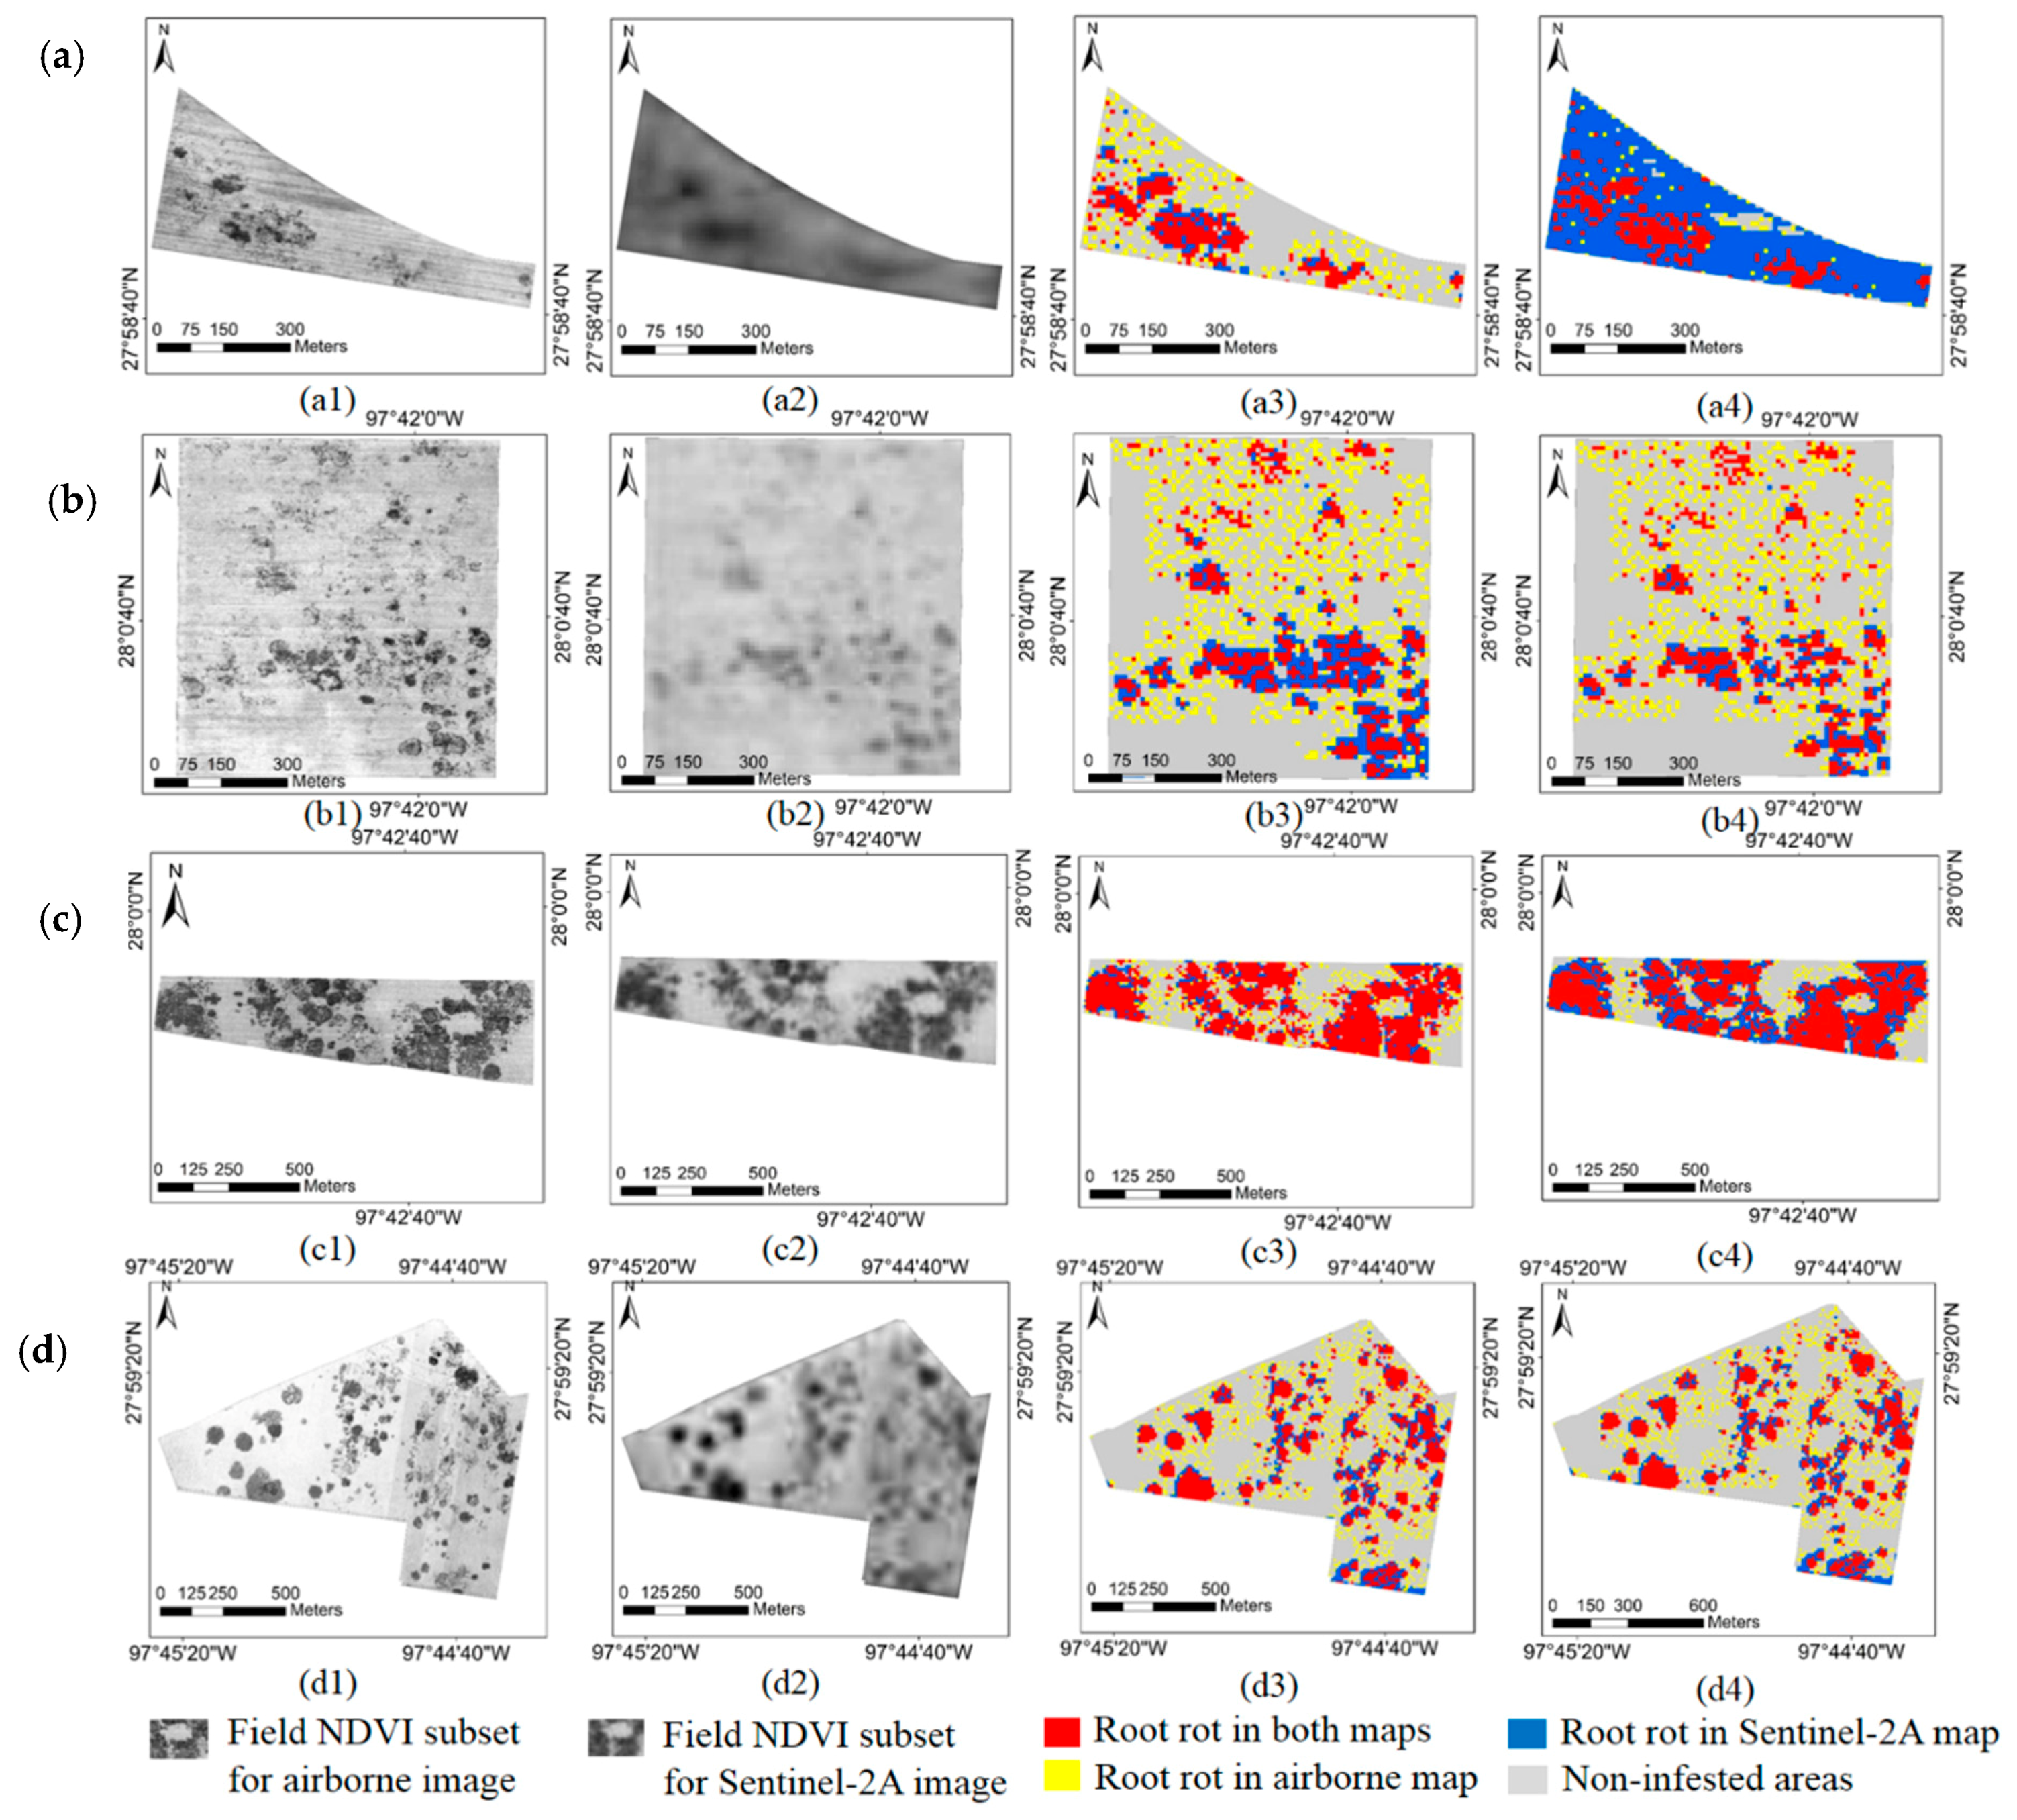
3.4. Overlapped Root Rot Area between Airborne Image and Sentinel-2A Image

This research assessed the potential of Sentinel-2A imagery for detecting cotton root rot-infested areas and compared its performance with finer resolution airborne images. Comparison of classification maps generated from images with different spatial resolutions may reveal the omission and commission errors caused by the spatial resolution. Figure 8a shows the overlaid classification map generated by airborne imagery and field subset Sentinel-2A imagery. While Figure 8b is the overlaid map generated by the airborne imagery and the whole study area Sentinel-2A imagery. The red zone in Figure 8 shows the cotton root rot infested areas detected by both the airborne and Sentinel-2A images, indicating the correctly classified areas in the Sentinel-2A image. The yellow zone in Figure 8 is the cotton root rot infested areas only detected by the airborne image, which indicate the areas omitted by the Sentinel-2A image. The blue zone depicts the cotton root rot infested areas detected by the Sentinel-2A image but not detected by the airborne image, which indicate the commission area for the Sentinel-2A image. Table 5 shows the area statistics for the cotton root rot-infested areas for the red, yellow and blue zones in the overlaid classification maps generated by the airborne image and field subset Sentinel-2A images as well as the airborne image and whole study area Sentinel-2A image.
From Table 5 and Figure 8a, the total cotton root rot infested area in the airborne and field subset Sentinel image classification maps was 163.17 ha (the sum of the areas for the red, yellow and blue zones). The common infested area in both maps (red zone) was 84.72 ha (51.92% of the entire infested area). There were 449 infested fragments in the red zone, and the average area for these fragments was 1698 m2, while the minimum and maximum infected areas were 100 and 102,100 m2, respectively. The area that was infested just in the airborne image (yellow zone) was 27.10 ha (16.60% of the entire infested area). The average area for the 1268 infested fragments in the yellow zone was 214 m2, while the minimum and the maximum infested areas were 100 and 10,300 m2, respectively. The infested area identified only by the Sentinel image (blue zone) was 51.35 ha (31.47% of the entire infested area). The average infested area for the 1028 blue fragments was 500 m2, while the minimum and maximum infected areas were 100 and 15,900 m2, respectively.
From Table 5 and Figure 8b, the total cotton root rot infested area for all the airborne and field subset image classification maps was 184.31 ha. The common area in both maps (red zone) was 75.58 ha (41.01% of the entire infested area). The average area for the red zone was 2243 m2 and the minimum and maximum infected areas in both maps were 100 and 105,400 m2, respectively. The cotton root rot infested area identified only by the airborne imagery was 36.23 ha (19.66% of the entire infested area), whereas the infested area classified only by the Sentinel-2A imagery was 72.50 ha (39.34% of the entire infested area).
Figure 9 shows the overlaid cotton root rot classification maps for the airborne image and the Sentinel-2A image for Fields 1, 5, 10 and 14. For the overlaid maps (Figure 8a and column 3 of Figure 9), it can be seen that the cotton root rot classification error for the Sentinel-2A imagery was mainly caused by the omission of small, infested areas and by the inclusion of small non-infested areas. For the overlaid maps from the airborne image and the whole study area Sentinel-2A image (Figure 8b and column 4 of Figure 9, the cotton root rot classification error for the Sentinel-2A imagery in the regional scale was mainly caused by the differences in cotton growth and field management practices for different fields.

4. Discussion

The spatial resolution of remote sensing images and the size of landscape elements are the two key factors for remote sensing detection. Many studies have been carried out to evaluate the minimum spatial resolution required to detect small features [29,30,31,32]. For example, SPOT-5 imagery at 10 m was found to be suitable to map small ponds in Senegal [33]. SPOT-5 resolution allowed the monitoring of reed ecosystems in southern France and, in turn, provided potential distribution maps of species that are relevant to ecosystem functioning. Townsend et al. [34] found that Landsat data resolution is adequate for characterizing landscape patterns, although higher resolution data or multiple sensors may be necessary for specific applications. Radoux et al. [35] analyzed pre-operational Sentinel-2 images to rigorously evaluate their potential for detecting sub-decametric landscape features of environmental interest. Their results confirm that Sentinel-2 data combine the spectral resolution of Landsat-8 with the spatial resolution of SPOT-5.
This study revealed that small cotton root rot infestation fragments close to 100 m2 can barely be detected by the Sentinel-2A sensor. Of the cotton root rot-infested area, 16.60% was omitted by classification with the field subset Sentinel-2A image, and 19.66% cotton root rot-infested area was omitted by classification with the Sentinel image for the whole study area. Generally, spatial resolution involves the interaction between the ground sample distance and the point spread function, which models the blurring effect due to all elements of the imaging system [35]. The spatial quality of an optical remote sensing instrument involves more aspects of the imaging system than just the pixel resolution [36]. Schowengerdt [37] provides extensive definitions and examples of aspects of spatial resolution that represent the cumulative optical properties of the sensing system. In addition, atmospheric effects, such as molecular and aerosol scattering and absorption by gases, and the adjacency effect are caused by complicated multiple scattering in the atmosphere/land-surface system. The pixel values of high-resolution imagery over a heterogeneous landscape are affected by their neighboring pixels. As a result, dark pixels look brighter and bright pixels look darker [38]. The practical implication to remotely sensed data is that imagery typically looks hazy and lacks contrast, thus resulting in more classification commission errors for cotton root rot-infested areas with the Sentinel-2A image. Compared with the field NDVI images in the first and second columns of Figure 9 the boundaries of the cotton root rot-infested areas in the Sentinel-2A image were blurrier than those of the airborne image. As a result, the classification map had more infested areas for the Sentinel-2A image. Compared with the airborne image, the Sentinel-2A imagery identified 31.47% more root rot by the field subset classification and 37.26% more by the whole study area classification.
This study also indicates that the performance for the Sentinel-2 field subset image classification was better than that of the Sentinel-2A regional image classification for cotton root rot detection. For some fields, such as Fields 1 and 15 in Figure 8a, the classification commission error increased dramatically when they were classified at the regional scale (Figure 8b). Therefore, it is necessary to determine the regional field conditions, such as irrigation and other management practices, for different fields before classification.
Remote sensing techniques have been used to detect cotton root rot for a very long time. Most previous studies focused on the mapping of cotton root rot with airborne multispectral data [5,6,13,14,15]. This research assessed the potential of Sentinel-2A imagery for the detection of cotton root rot infestation and compared its performance with airborne images. In order to determine the cotton root rot identification accuracy of the Sentinel-2A imagery, the 0.81 m pixel size airborne multispectral image was used to distinguish the cotton fields from other fields through visual interpretation with field verification, and then the field boundary was digitized through ArcGIS software. This procedure is necessary in areas where no field boundaries are available. Kharat et al. [39] used multispectral time series images of Landsat-8 to identify cotton crops for the Aurangabad region (MH) in India through the pixel based Unsupervised K-Means classification technique. Ustuner et al. [40] found that three different vegetation indices of RapidEye imagery could be used for crop (corn and cotton) classification with satisfactory results. Wu et al. [41] proposed and evaluated a novel method for the identification of crop types (mainly corn, cotton, and sorghum) through extracting the crop height from digital surface models (DSM) derived from aerial images. Sentinel-2A images have potential for the identification of the cotton fields in large regions for its high spectral resolution and high revisit rate.
In this study, the subset Sentinel-2A image for each cotton field was used to identify the cotton root rot in the study area. Meanwhile, the whole regional Sentinel-2A image for the study area was also used to detect the cotton root rot for the study area. Although the subset approach is not suitable for large areas because it is time-consuming, it can improve the classification accuracy compared with the regional approach. For a grower, the subset approach may be more appropriate because he or she only has a limited number of cotton fields.
Since the airborne images only had four bands, for proper comparison, only the four 10 m bands (blue, green, red, and NIR) of the Sentinel-2A image were used to identify the cotton root rot-infected areas in this study. Although the additional bands of the Sentinel-2A image may have the potential for root rot detection, but their coarse spatial resolution (20 m–60 m) may be less efficient. More research can be conducted on this in the future. In addition, the multispectral airborne image was acquired on 20 July 2016, while the Sentinel-2A image was acquired on 11 July 2016. The nine-day interval between the two images should have caused some differences in the image classification results. More classification methods should be evaluated for cotton root rot identification with Sentinel imagery in the future.

5. Conclusions

This research assessed the potential of Sentinel-2A imagery and compared it with airborne imagery for cotton root rot detection. The ISODATA unsupervised classification method was used to assess the ability of Sentinel-2A to detect cotton root rot at both field and regional levels. Two classification categories were used with the Sentinel-2A data. Cotton root rot-infested areas were detected for each cotton field, first through field subset image classification and then through the whole study area classification. The original 0.81-m pixel size airborne multispectral images for each field were also classified into root rot-infested and non-infested zones and were then aggregated to 10 m spatial resolution for comparison with the Sentinel-2A imagery.
Accuracy assessment showed that the classification maps from the Sentinel-2A imagery had high overall accuracy, but some small cotton root rot areas were undetectable and some small areas of non-infested areas within large root rot areas were incorrectly classified as infested due to its coarse spatial resolution. The classification accuracy of the field subset Sentinel-2 images was higher than that of regional Sentinel-2A imagery for cotton root rot detection. The results from this study demonstrate that Sentinel-2 images can be used for cotton root rot identification if the imagery is taken during the optimum root rot discrimination period for a given region.
This study is one of the first to evaluate Sentinel-2 satellite imagery for cotton root rot identification. Considering Sentinel-2 imagery is freely available and has a 10-day revisiting period (5 days with Sentinel-2B), it is more effective to use Sentinel-2 imagery for cotton root rot in a large region. Although imagery taken shortly before harvest is more useful for creating prescription maps for cotton root rot management, the high revisit frequency of Sentinel-2 enables time-series monitoring of the progression of the disease over the growing season. More research is needed in the future to evaluate Sentinel-2 imagery and to compare it with other types of remote sensing data for mapping cotton root rot.

Acknowledgments

This project was conducted as part of a visiting scholar research program, and the first author was financially supported by the High-Resolution Earth Observation Project of China (30-Y20A29-9003-15/17), the National Key Technologies of Research and Development Program (2016YFD0300603-5), and the China Scholarship Council Project (201509110050). The authors wish to thank Fred Gomez and Lee Denham of USDA-ARS in College Station, Texas for collecting the airborne images and ground data for this study. Thanks are also extended to the European Space Agency for the Sentnel-2A data.

Author Contributions

Xiaoyu Song and Chenghai Yang conceived and designed the experiments. Xiaoyu Song processed and analyzed the images, and drafted the manuscript. Chenghai Yang guided the experimental design, participated in data collection, advised on data analysis, and revised the manuscript. Mingqua Wu, Guijun Yang, W. Clint Hoffmann, Chunjiang Zhao and Wenjiang Huang were involved in the process of the experiment, ground data collection, or manuscript revision. All authors read and approved the final version.

Conflicts of Interest

The authors declare no conflict of interest.

References

  1. Percy, R.G. Potential range of Phymatotrichum omnivorum as determined by edaphic factors. Plant Dis. 1983, 67, 981–983. [Google Scholar] [CrossRef]
  2. Pammel, L.H. Root rot of cotton or “Cotton blight”. Texas Agric. Exp. Stn. Ann. Bull. 1888, 4, 50–65. [Google Scholar]
  3. Cribben, C.D.; Thomasson, J.A.; Ge, Y.; Morgan, C.L.S.; Yang, C.; Isakeit, T.; Nichols, R.L. Site-specific relationships between cotton root rot and soil properties. J. Cotton Sci. 2016, 20, 67–75. [Google Scholar]
  4. Ezekiel, W.N.; Taubenhaus, J.J. Cotton crop losses from Phymatotrichum root rot. J. Agric. Res. 1934, 49, 843–858. [Google Scholar]
  5. Yang, C.; Fernandez, C.J.; Everitt, J.H. Mapping Phymatotrichum root rot of cotton using airborne three-band digital imagery. Trans. ASAE 2005, 48, 1619–1626. [Google Scholar] [CrossRef]
  6. Yang, C.; Odvody, G.N.; Fernandez, C.J.; Landivar, J.A.; Minzenmayer, R.R.; Nichols, R.L.; Thomasson, J.A. Monitoring cotton root rot progression within a growing season using airborne multispectral imagery. J. Cotton Sci. 2014, 18, 85–93. [Google Scholar]
  7. Isakeit, T.; Minzenmayer, R.R.; Sansone, C.G. Flutriafol control of cotton root rot caused by Phymatotrichopsis omnivore. In Proceedings of the Beltwide Cotton Conference, San Antonio, TX, USA, 5–8 January 2009; The National Cotton Council: Memphis, TN, USA; pp. 130–133. [Google Scholar]
  8. Isakeit, T.; Minzenmayer, R.R.; Abrameit, A.; Moore, G.; Scasta, J.D. Control of Phymatotrichopsis root rot of cotton with flutriafol. In Proceedings of the Beltwide Cotton Conference, New Orleans, LA, USA, 4–7 January 2010; The National Cotton Council: Memphis, TN, USA; pp. 200–203. [Google Scholar]
  9. Isakeit, T.; Minzenmayer, R.R.; Drake, D.R.; Morgan, G.D.; Mott, D.A.; Fromme, D.D.; Multer, W.L.; Jungman, M.; Abrameit, A. Fungicide management of cotton root rot (Phymatotrichopsis omnivora): 2011 results. In Proceedings of the Beltwide Cotton Conference, Orlando, FL, USA, 3–6 January 2012; The National Cotton Council: Memphis, TN, USA; pp. 235–238. [Google Scholar]
  10. Taubenhaus, J.J.; Ezekiel, W.N.; Neblette, C.B. Airplane photography in the study of cotton root rot. Phytopathology 1929, 19, 1025–1029. [Google Scholar]
  11. Nixon, P.R.; Lyda, S.D.; Heilman, M.D.; Bowen, R.L. Incidence and Control of Cotton Root Rot Observed with Color Infrared Photography; Texas A&M Agricultural Experiment Station: College Station, TX, USA, 1975. [Google Scholar]
  12. Nixon, P.R.; Escobar, D.E.; Bowen, R.L. A multispectral false-color video imaging system for remote sensing applications. In Proceedings of the 11th Biennial Workshop on Color Aerial Photography and Videography in the Plant Sciences and Related Fields, Weslaco, TX, USA, 27 April–1 May 1987; pp. 295–305. [Google Scholar]
  13. Yang, C.; Odvody, G.N.; Fernandez, C.J.; Landivar, J.A.; Minzenmayer, R.R.; Nichols, R.L. Evaluating unsupervised and supervised image classification methods for mapping cotton root rot. Precis. Agric. 2015, 16, 201–215. [Google Scholar] [CrossRef]
  14. Song, H.B.; Yang, C.; Zhang, J.; He, D.J.; Thomasson, J.A. Combining fuzzy set theory and nonlinear stretching enhancement for unsupervised classification of cotton root rot. J. Appl. Remote Sens. 2015, 9, 096013. [Google Scholar] [CrossRef]
  15. Yang, C.; Odvody, G.N.; Thomasson, J.A.; Isakeit, T.; Nichols, R.L. Change detection of cotton root rot infection over 10-year intervals using airborne multispectral imagery. Comput. Electron. Agric. 2016, 123, 154–162. [Google Scholar] [CrossRef]
  16. Drusch, M.; Del Bello, U.; Carlier, S.; Colin, O.; Fernandez, V.; Gascon, F.; Hoersch, B.; Isola, C.; Laberinti, P.; Martimort, P.; et al. Sentinel-2: ESA’s optical high-resolution mission for GMES operational services. Remote Sens. Environ. 2012, 120, 25–36. [Google Scholar] [CrossRef]
  17. Immitzer, M.; Vuolo, F.; Atzberger, C. First experience with Sentinel-2 data for crop and tree species classifications in Central Europe. Remote Sens. 2016, 8, 166. [Google Scholar] [CrossRef]
  18. Vuolo, F.; Żółtak, M.; Pipitone, C.; Zappa, L.; Wenng, H.; Immitzer, M.; Weiss, M.; Baret, F.; Atzberger, C. Data service platform for Sentinel-2 surface reflectance and value-added products: System use and examples. Remote Sens. 2016, 8, 938. [Google Scholar] [CrossRef]
  19. Eitel, J.U.; Vierling, L.A.; Litvak, M.E.; Long, D.S.; Schulthess, U.; Ager, A.A.; Krofcheck, D.J.; Stoscheck, L. Broadband red-edge information from satellites improves early stress detection in a New Mexico conifer woodland. Remote Sens. Environ. 2011, 115, 3640–3646. [Google Scholar] [CrossRef]
  20. Schuster, C.; Förster, M.; Kleinschmit, B. Testing the red edge channel for improving land-use classifications based on high-resolution multi-spectral satellite data. Int. J. Remote Sens. 2012, 33, 5583–5599. [Google Scholar] [CrossRef]
  21. Verrelst, J.; Muñoz, J.; Alonso, L.; Delegido, J.; Rivera, J.P.; Camps-Valls, G.; Moreno, J. Machine learning regression algorithms for biophysical parameter retrieval: Opportunities for Sentinel-2 and-3. Remote Sens. Environ. 2012, 118, 127–139. [Google Scholar] [CrossRef]
  22. Delegido, J.; Verrelst, J.; Alonso, L.; Moreno, J. Evaluation of Sentinel-2 red-edge bands for empirical estimation of green LAI and chlorophyll content. Sensors 2011, 11, 7063–7081. [Google Scholar] [CrossRef] [PubMed]
  23. Clevers, J.G.; Gitelson, A.A. Remote estimation of crop and grass chlorophyll and nitrogen content using red-edge bands on Sentinel-2 and -3. Int. J. Appl. Earth Obs. Geoinf. 2013, 23, 344–351. [Google Scholar] [CrossRef]
  24. Sibanda, M.; Mutanga, O.; Rouget, M. Examining the potential of Sentinel-2 MSI spectral resolution in quantifying above ground biomass across different fertilizer treatments. ISPRS J. Photogramm. Remote Sens. 2015, 110, 55–65. [Google Scholar] [CrossRef]
  25. Malenovsky, Z.; Rott, H.; Cihlar, J.; Schaepman, M.E.; Garcia-Santos, G.; Fernandes, R.; Berger, M. Sentinels for science: Potential of Sentinel-1, -2, and -3 missions for scientific observations of ocean, cryosphere, and land. Remote Sens. Environ. 2012, 120, 91–101. [Google Scholar] [CrossRef]
  26. Du, Y.; Zhang, Y.; Ling, F.; Wang, Q.; Li, W.; Li, X. Water bodies’ mapping from Sentinel-2 imagery with modified normalized difference water index at 10-m spatial resolution produced by sharpening the SWIR band. Remote Sens. 2016, 8, 354. [Google Scholar] [CrossRef] [Green Version]
  27. Congalton, R.G.; Green, K. Assessing the Accuracy of Remotely Sensed Data: Principles and Practices; Lewis Publishers: Boca Raton, FL, USA, 2008. [Google Scholar]
  28. Yang, C.; Fernandez, C.J.; Everitt, J.H. Comparison of airborne multispectral and hyperspectral imagery for mapping cotton root rot. Biosyst. Eng. 2010, 107, 131–139. [Google Scholar] [CrossRef]
  29. Lechner, A.M.; Stein, A.; Jones, S.D.; Ferwerda, J.G. Remote sensing of small and linear features: Quantifying the effects of patch size and length, grid position and detectability on land cover mapping. Remote Sens. Environ. 2009, 113, 2194–2204. [Google Scholar] [CrossRef]
  30. Congalton, R.G.; Birch, K.; Jones, R.; Schriever, J. Evaluating remotely sensed techniques for mapping riparian vegetation. Comput. Electron. Agric. 2002, 37, 113–126. [Google Scholar] [CrossRef]
  31. Lausch, A.; Herzog, F. Applicability of landscape metrics for the monitoring of landscape change: Issues of scale, resolution and interpretability. Ecol. Indic. 2002, 2, 3–15. [Google Scholar] [CrossRef]
  32. Jensen, J.R.; Cowen, D.C. Remote sensing of urban/suburban infrastructure and socio-economic attributes. Photogramm. Eng. Remote Sens. 1999, 65, 611–622. [Google Scholar]
  33. Lacaux, J.; Tourre, Y.; Vignolles, C.; Ndione, J.; Lafaye, M. Classification of ponds from high-spatial resolution remote sensing: Application to Rift Valley Fever epidemics in Senegal. Remote Sens. Environ. 2007, 106, 66–74. [Google Scholar] [CrossRef]
  34. Townsend, P.A.; Lookingbill, T.R.; Kingdon, C.C.; Gardner, R.H. Spatial pattern analysis for monitoring protected areas. Remote Sens. Environ. 2009, 113, 1410–1420. [Google Scholar] [CrossRef]
  35. Radoux, J.; Chomé, G.; Jacques, D.C.; Waldner, F.; Bellemans, N.; Matton, N.; Lamarche, C.; Raphaël, A.; Defourny, P. Sentinel-2’s potential for sub-pixel landscape feature detection. Remote Sens. 2016, 8, 488. [Google Scholar] [CrossRef]
  36. Joseph, G. How well do we understand Earth observation electro-optical sensor parameters? ISPRS J. Photogramm. Remote Sens. 2000, 55, 9–12. [Google Scholar] [CrossRef]
  37. Schowengerdt, A.R. Remote Sensing: Models and Methods for Image Processing; Elsevier Inc.: Amsterdam, The Netherlands, 2007; pp. 300–304. [Google Scholar]
  38. Liang, S.L.; Fang, H.L.; Chen, M.Z. Atmospheric Correction of Landsat ETM+ Land Surface Imagery—Part I: Methods. IEEE Trans. Geosci. Remote Sens. 2001, 39, 2490–2498. [Google Scholar] [CrossRef]
  39. Kharat, S.A.; Musande, V.B. Cotton crop discrimination using landsat-8 data. IJCSIT. Int. J. Comput. Sci. Inf. Technol. 2015, 6, 4381–4384. [Google Scholar]
  40. Ustunera, M.; Sanli, F.B.; Abdikan, S.; Esetlili, M.T.; Kurucu, Y. Crop type classification using vegetation indices of RAPIDEYE imagery. ISPRS Int. Arch. Photogramm. Remote Sens. Spat. Inf. Sci. 2014, XL-7, 195–198. [Google Scholar] [CrossRef]
  41. Wu, M.; Yang, C.; Song, X.; Hoffmann, W.C.; Huang, W.; Niu, Z.; Wang, C.; Li, W. Evaluation of orthomosics and digital surface models derived from aerial imagery for crop type mapping. Remote Sens. 2017, 9, 239. [Google Scholar] [CrossRef]
Figure 1. Location of the study area.
Remotesensing 09 00906 g001
Figure 2. Mosaicked airborne images for the study area. (a) True color image; (b) color infrared (CIR) composite image.
Remotesensing 09 00906 g002
Figure 3. Sentinel-2A multispectral instrument (MSI) image for the study area. (a) True color image; (b) color infrared (CIR) composite image.
Remotesensing 09 00906 g003
Figure 4. Twenty-four cotton fields in the study area.
Remotesensing 09 00906 g004
Figure 5. Classification maps based on field subset 0.81 m airborne images for 24 cotton fields. The red color within each field represents the root rot areas, while the gray color depicts non-infested areas.
Remotesensing 09 00906 g005
Figure 6. Classification maps generated from Sentinel-2A image. (a) Map generated from field subset Sentinel-2A images; (b) map generated from whole sentinel-2A image for the study area.
Remotesensing 09 00906 g006
Figure 7. Comparison of cotton root rot area for 24 cotton fields in different classification maps: (a) map generated by field subset airborne images; (b) map generated by field subset Sentinel-2A images; (c) map generated by whole study area Sentinel-2A image.
Remotesensing 09 00906 g007
Figure 8. Overlaid cotton root rot classification maps: (a) generated from airborne image and field subset Sentinel-2A images; (b) generated from airborne image and whole study area Sentinel-2A image.
Remotesensing 09 00906 g008
Figure 9. Field subsets for overlaid cotton root rot classification map between the airborne image and the Sentinel-2A image. (a) Field 1, (b) Field 5, (c) Field 10, and (d) Field 14; (1) Field normalized difference vegetation index (NDVI) subset for airborne image; (2) field normalized difference vegetation index (NDVI) subset for Sentinel-2A image; (3) overlaid classification map for airborne image and field subset Sentinel-2A image; (4) overlaid classification map for airborne image and whole study area Sentinel-2A image.
Remotesensing 09 00906 g009
Table 1. Comparison of cotton root rot-infested areas for 24 cotton fields between the 0.81 m airborne image classification maps and resized 10 m classification map.
Field IDField Area (ha)Cotton Root Rot-Infested Area (ha)Field IDField Area (ha)Cotton Root Rot-Infested Area (ha)
0.81 m10 m0.81 m10 m0.81 m10 m0.81 m10 m
116.6716.393.173.061317.0717.010.460.47
26.125.980.250.21488.7689.2815.915.82
354.6354.785.755.81581.7882.3600
412.7212.530.420.441659.6760.144.674.69
555.5155.836.276.061765.0564.780.510.51
620.320.387.67.371853.6453.680.810.78
79.449.7700.021976.3776.360.910.96
858.9958.791.091.132042.7443.093.323.25
934.1933.733.573.542138.9839.049.910.01
1038.4938.4718.118.132225.225.0110.610.7
1133.9433.823.954.082351.1751.163.973.82
1277.1176.714.414.34249.8810.195.585.48
Table 2. Estimates of cotton root rot-infested areas based on the classification map generated by field subset Sentinel-2A images for 24 cotton fields.
Field IDField Area (ha)Cotton Root Rot-Infected Area (ha)Field IDField Area (ha)Cotton Root Rot-Infected Area (ha)
Subset ImagesWhole ImageSubset ImagesWhole Image
116.392.9815.731317.010.641.31
25.980.180.591489.2819.8422
354.786.796.181582.36042.22
412.530.20.41660.146.75.15
555.839.246.371764.781.950
620.385.263.461853.680.860.09
79.7700.151976.360.520.52
858.793.124.242043.096.031.24
933.736.150.82139.0410.384.38
1038.4716.6925.772225.0112.5615.19
1133.825.180.982351.162.530.07
1276.718.742.222410.194.725
Table 3. Error matrix for classification map generated by field subset Sentinel-2A images for 24 cotton fields.
Classification CategoryActual Category User’s Accuracy
Infested (pixels)Non-Infested (pixels)Total (pixels)
Infested (pixels)9920356113,48173.59%
Non-infested (pixels)199978,23580,23497.51%
Total (pixels)11,91981,79693,715
Producer’s accuracy83.23%96.65%
Overall accuracy = 94.06%. Kappa = 0.9632.
Table 4. Error matrix for classification map generated by the whole study area Sentinel-2A image.
Classified CategoryActual categoryUser’s Accuracy
Infested (pixels)Non-Infested (pixels)Total (pixels)
Infested (pixels)8810589914,70959.90%
Non-infested (pixels)316885,05188,21996.41%
Total (pixels)11,97890,950102,928
Producer’s accuracy73.55%93.51%
Overall accuracy = 91.19%. Kappa = 0.9439.
Table 5. Area statistics for the red, yellow and blue zones in the overlaid classification map generated by airborne and field subset Sentinel-2A image as well as airborne image and whole study area Sentinel-2A image.
ZoneNumber of Fragments Minimum Area (m2)Maximum Area (m2)Average Area (m2)Total Area (ha)
Subset ImagesWhole ImageSubset ImagesWhole ImageSubset ImagesWhole ImageSubset ImagesWhole Image
Red499337100102,100105,4001698224384.7275.58
Yellow1268116010010,30015,10021431227.1036.23
Blue102866410015,900259,700500109251.3572.5

