4.1. Data Sets
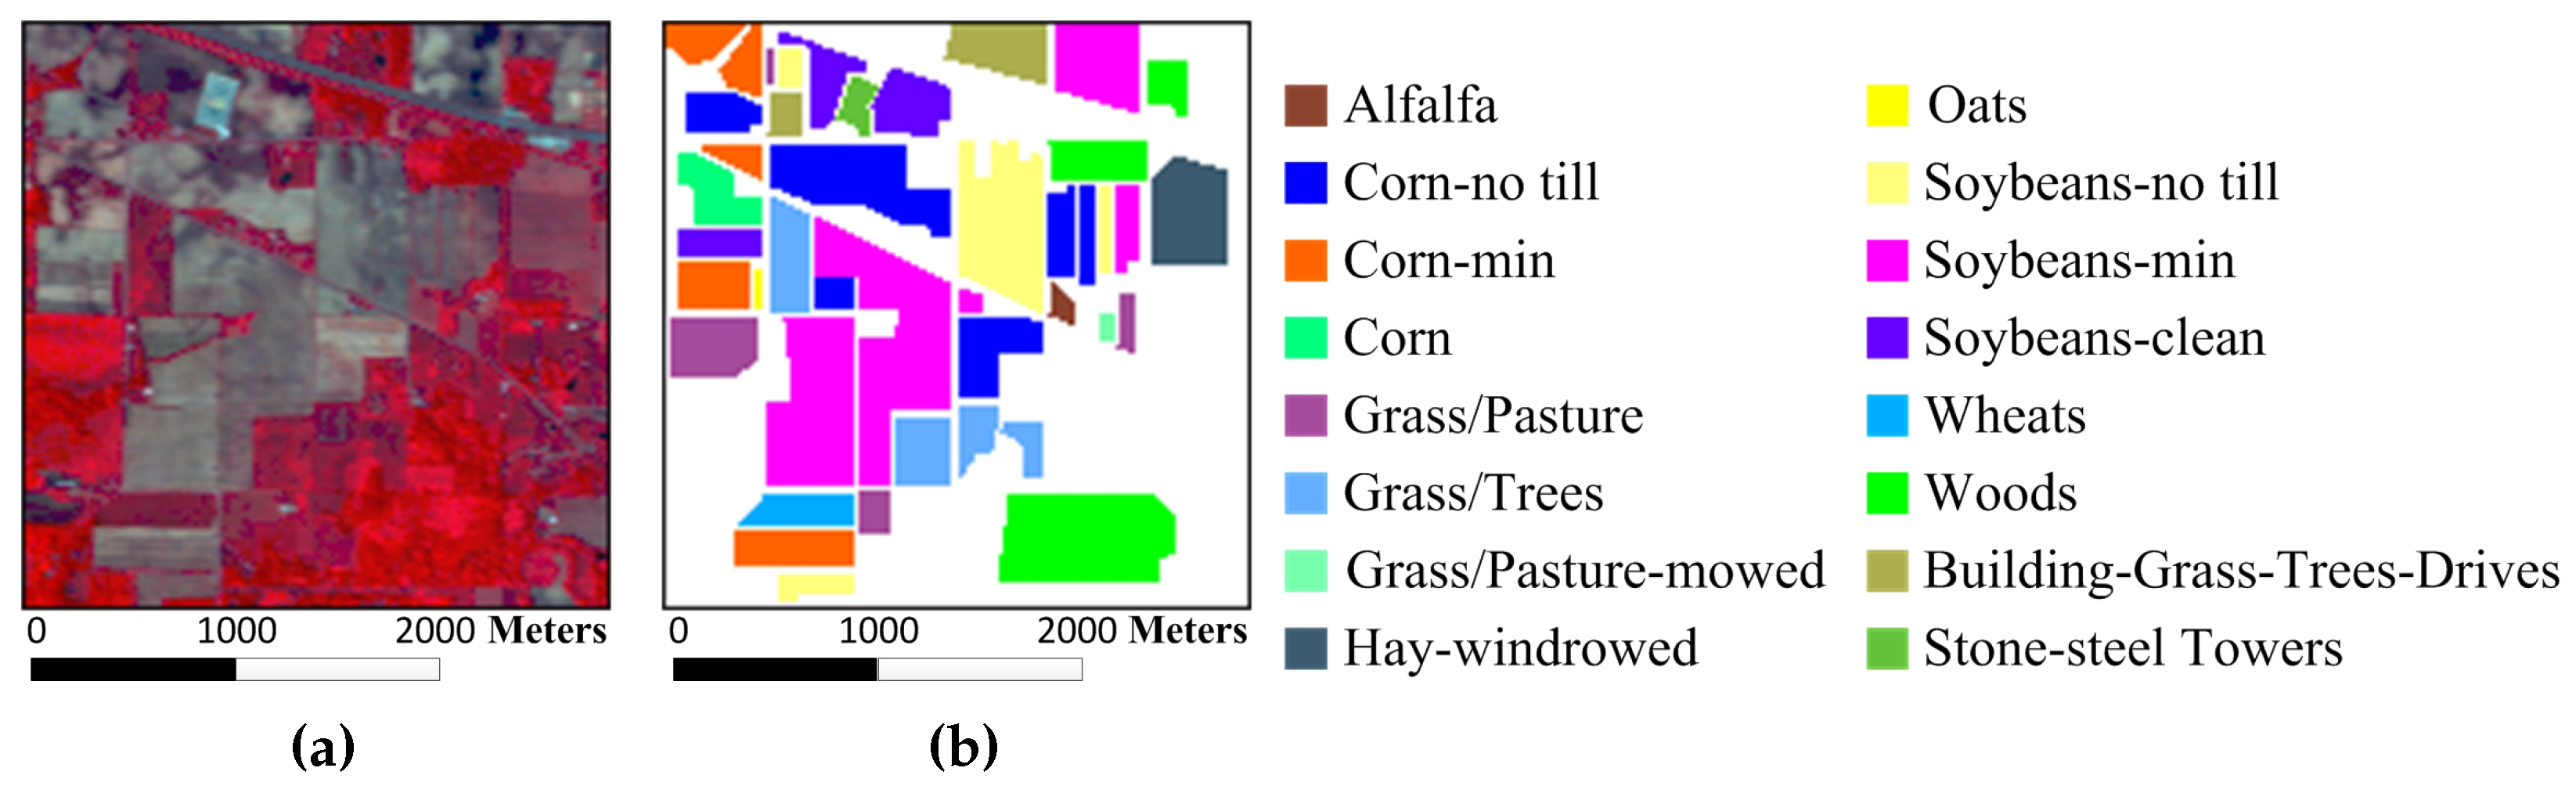
To verify the effectiveness of the proposed MURASR method and superiority of the union region, experiments are conducted on the following three hyperspectral data sets: the Airborne Visible/Infrared Imaging Spectrometer (AVIRIS) Indian Pines data, the AVIRIS Salinas data, and the Reflective Optics System Imaging Spectrometer (ROSIS-03) University of Pavia data. The AVIRIS Indian Pines image has 220 data channels with the size of 145 × 145 across the spectral range from 0.2 to 2.4
m. It was captured over the agricultural Indian Pine test site in northwestern Indiana with a spatial resolution of 20 m per pixel. Before classification, 20 water absorption bands (No. 104–108, 150–163 and 220) were discarded [
41].
Figure 3a,b show the color composite of the Indian Pines image and the corresponding reference data with 16 reference classes from different types of crops.
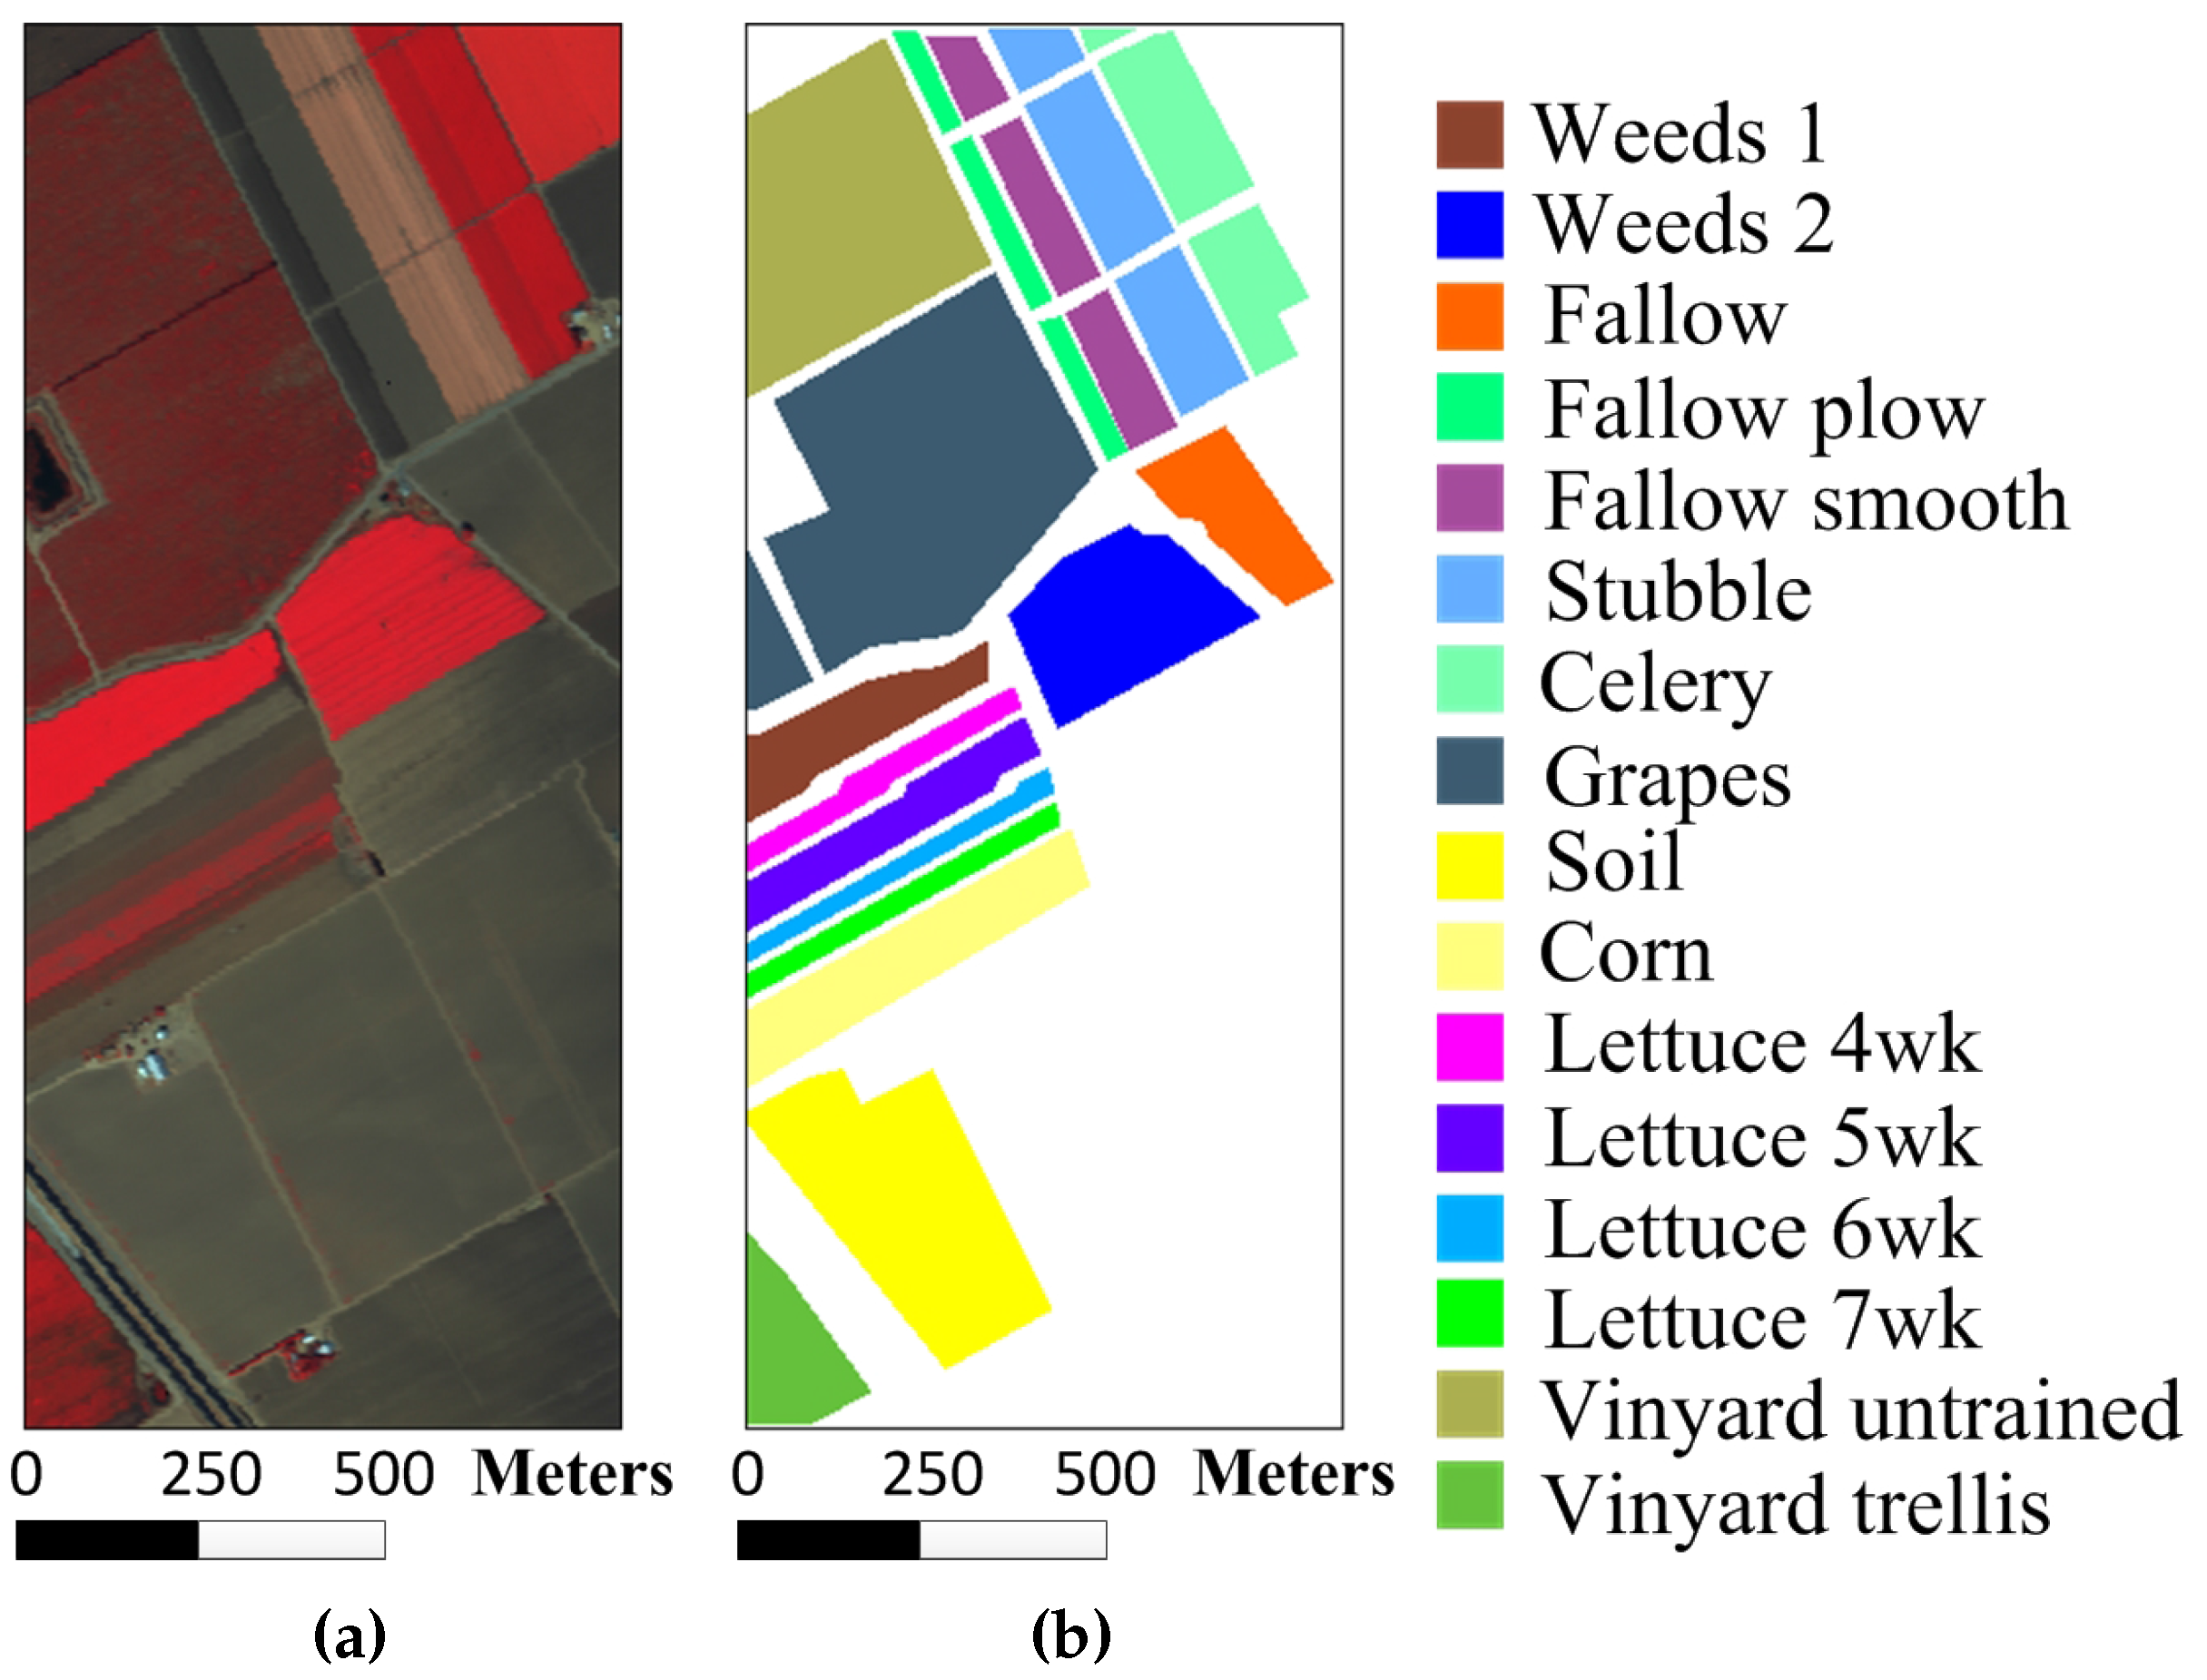
The Salinas image was also acquired by the AVIRIS sensor over Salinas Valley, California. The image is of size 512 × 217 × 224 with a spatial resolution of 3.7 m per pixel. Similar to the Indian Pines image, 20 water absorption spectral bands (No. 108–112, 154–167 and 224) were removed and 16 different reference classes are considered for this image.
Figure 4a,b show the color composite of the Salinas image and the corresponding reference data.
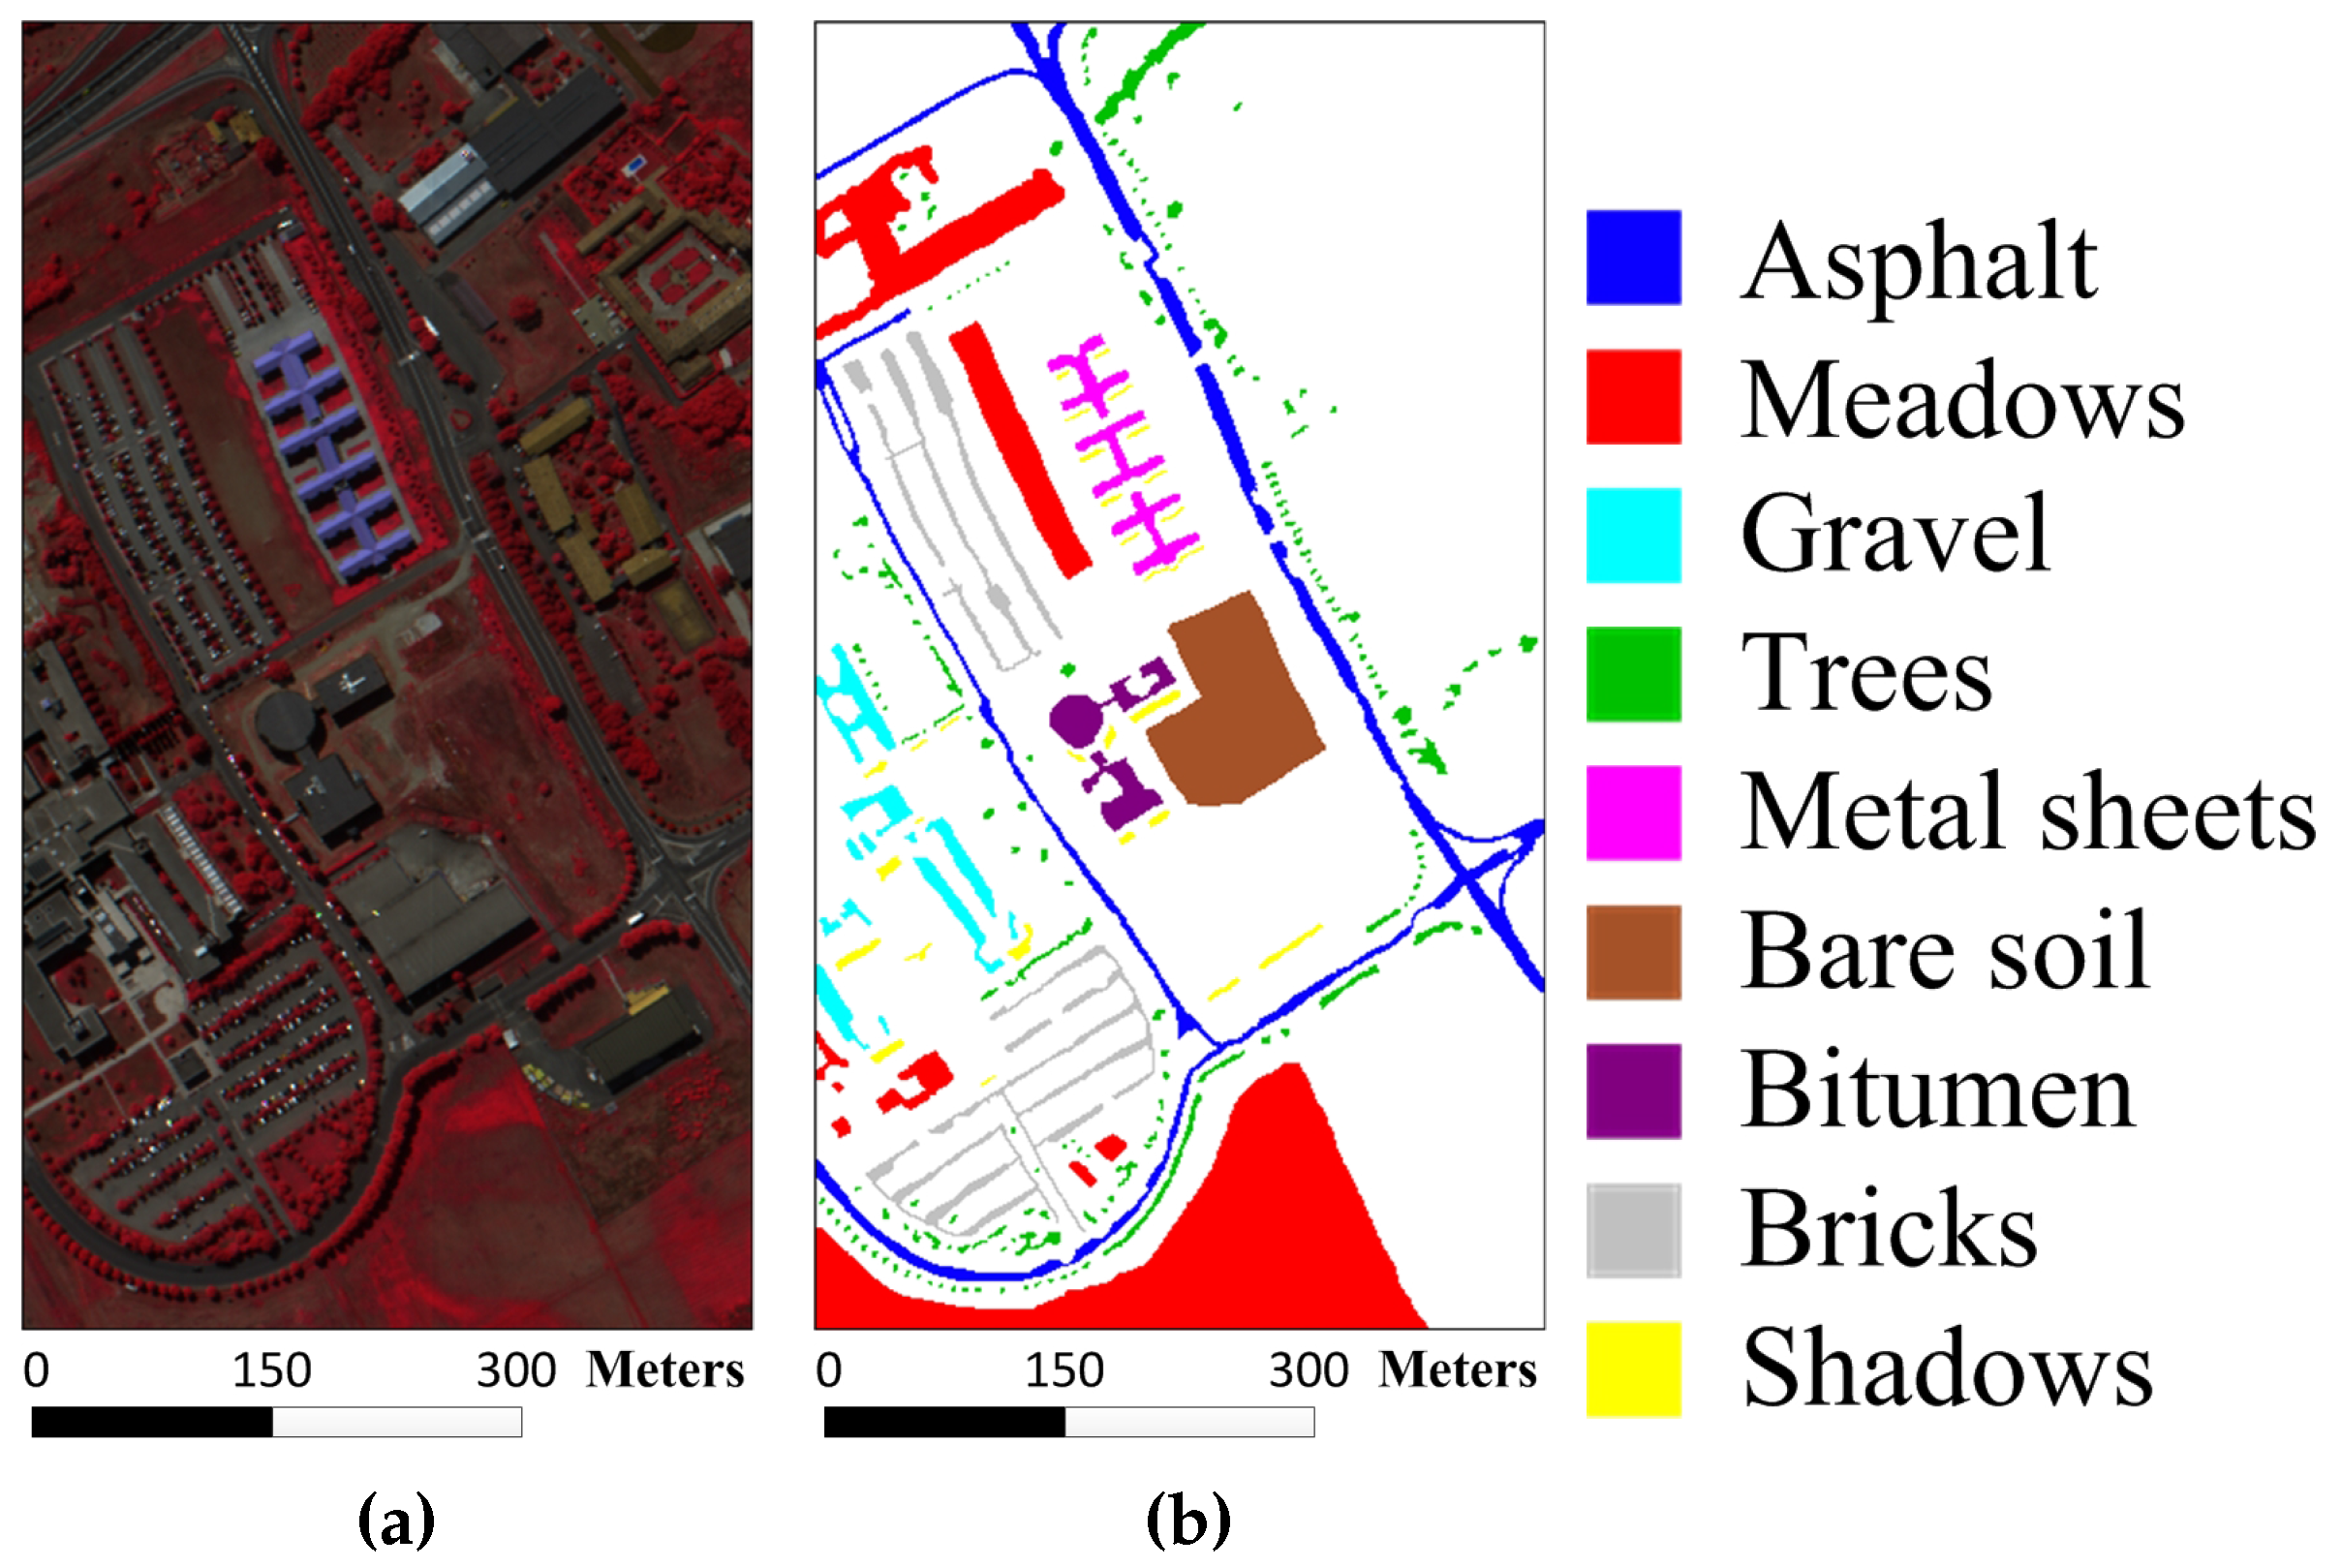
The University of Pavia image, which captures an urban area surrounding the University of Pavia, Italy, was recorded by the ROSIS-03 sensor. The image is of size 610 × 340 × 115 with a spatial resolution of 1.3 m per pixel and a spectral coverage ranging from 0.43 to 0.86
m. The 12 very noisy channels were discarded before the experiments, and nine information classes are considered for this image.
Figure 5a,b show the color composite of the University of Pavia image and the corresponding reference data.
4.2. Comparison of Experiment Results
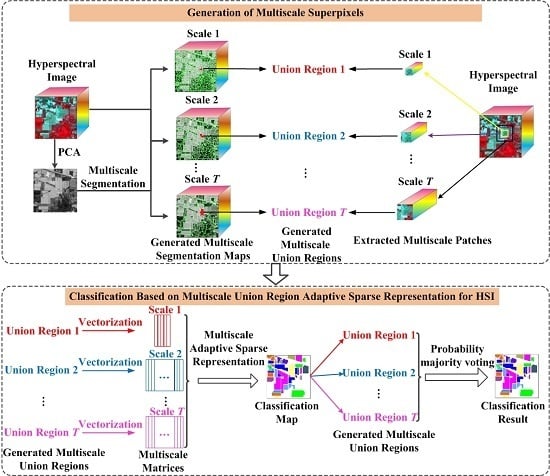
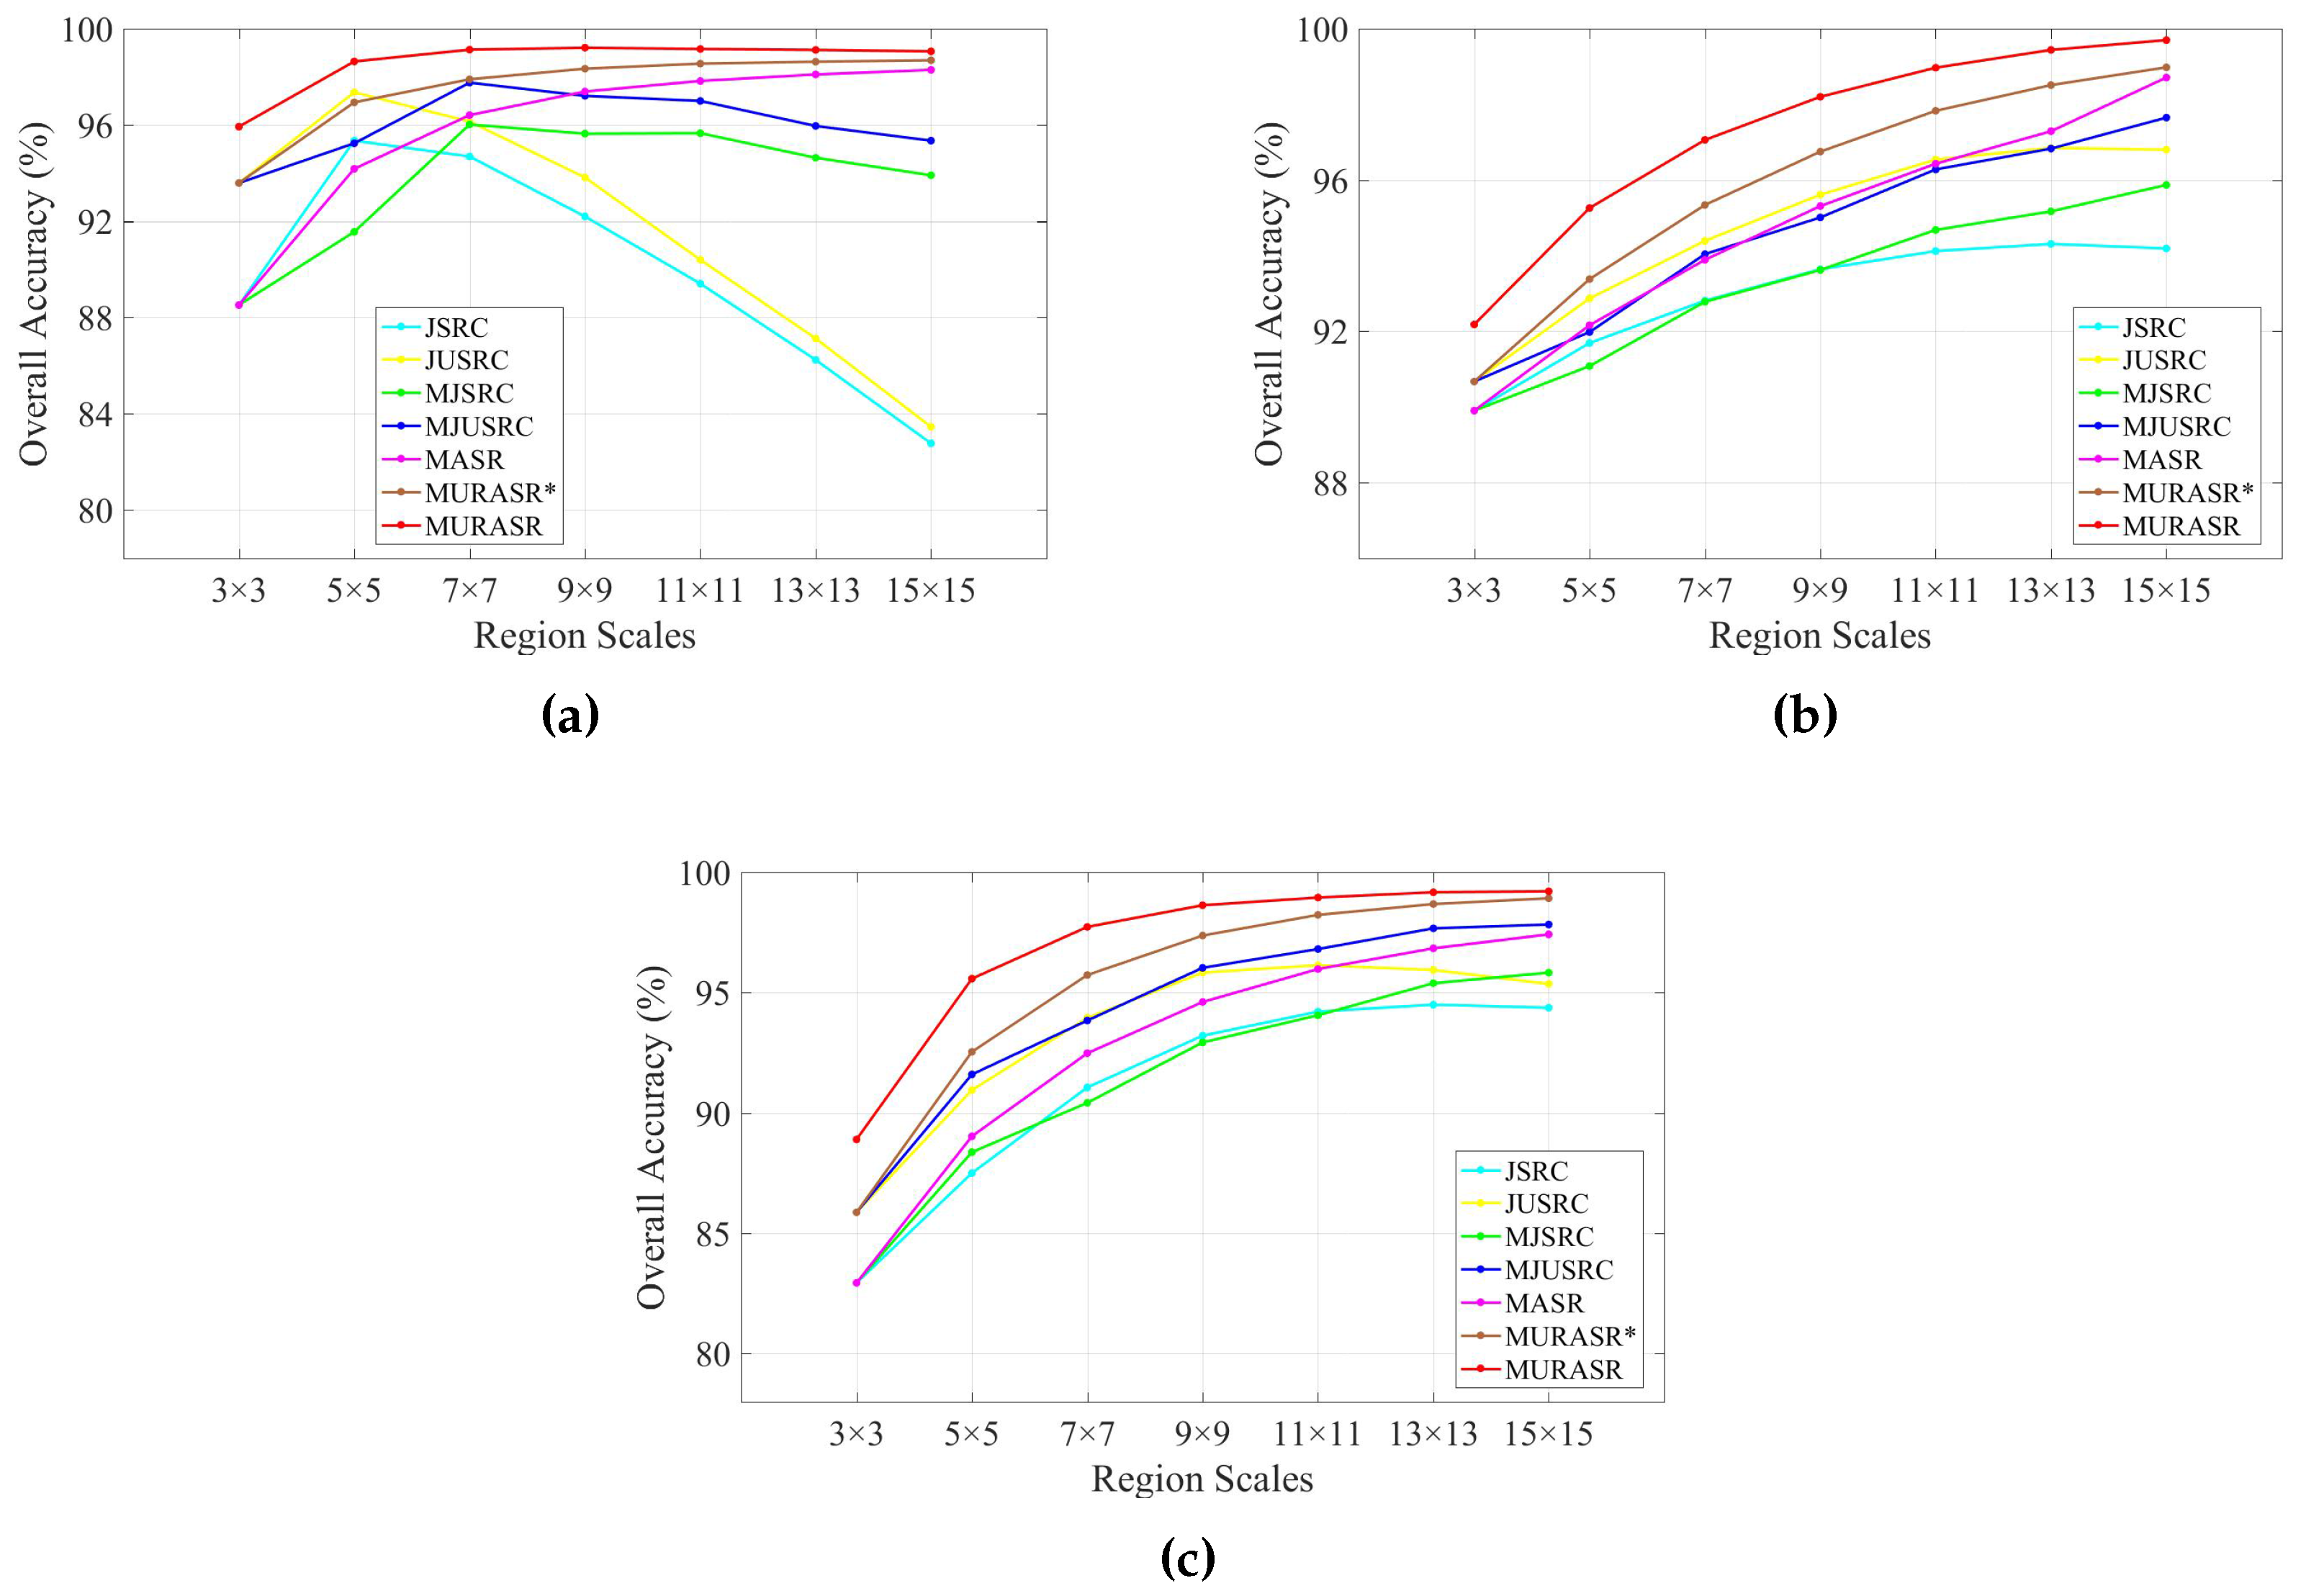
In the experiments, all related algorithms are based on sparse representation. Except for published algorithms SRC, JSRC and MASR, JUSRC (Joint Union Sparse Representation Classification), MJSRC (Multiscale Joint Sparse Representation Classification), MJUSRC (Multiscale Joint Union Sparse Representation Classification), MURASR* and MURASR were conducted in the experiments. To verify the priority of union region further, the patch used in JSRC was replaced by JUSRC with the union region. For demonstrating the superiority of multiscale adaptive strategy, we extended the JSRC and JUSRC with a simple multiscale scheme that applied the majority voting to the results of all scales for the final decision-making. The extended algorithms are called MJSRC and MJUSRC. What’s more, the MURASR* is the MURASR without probability majority voting process. The comparison between MURASR* and MURASR can show the difference of whether the probability majority voting method was used or not. The parameters for the SRC, JSRC, and JUSRC algorithms were tuned to reach the best results in these experiments. For all multiscale algorithms, seven different scales were simultaneously adopted, and the selected region scales were as follows: 3 × 3, 5 × 5, 7 × 7, 9 × 9, 11 × 11, 13 × 13, and 15 × 15. Then superpixels numbers for segmentation were calculated with Equation (
6) and listed in
Table 1. Other parameters in MJSRC, MJUSRC, MASR, MURASR*, and MURASR were the same as [
28]. To evaluate the performance of classifiers, three objective metrics (overall accuracy (OA), average accuracy (AA) and kappa coefficient) are adopted. In addition, the McNemar’s test is applied to analyse the experiment results. The McNemar’s test is based on the standardized normal test statistic, as described in [
42]:
where
represents the samples correctly classified by method 1 but incorrectly classified by method 2. If
, the accuracy between two methods can be considered statistically significant. The sign of the
indicates which method is better. If
, the method 1 is more accurate than method 2.
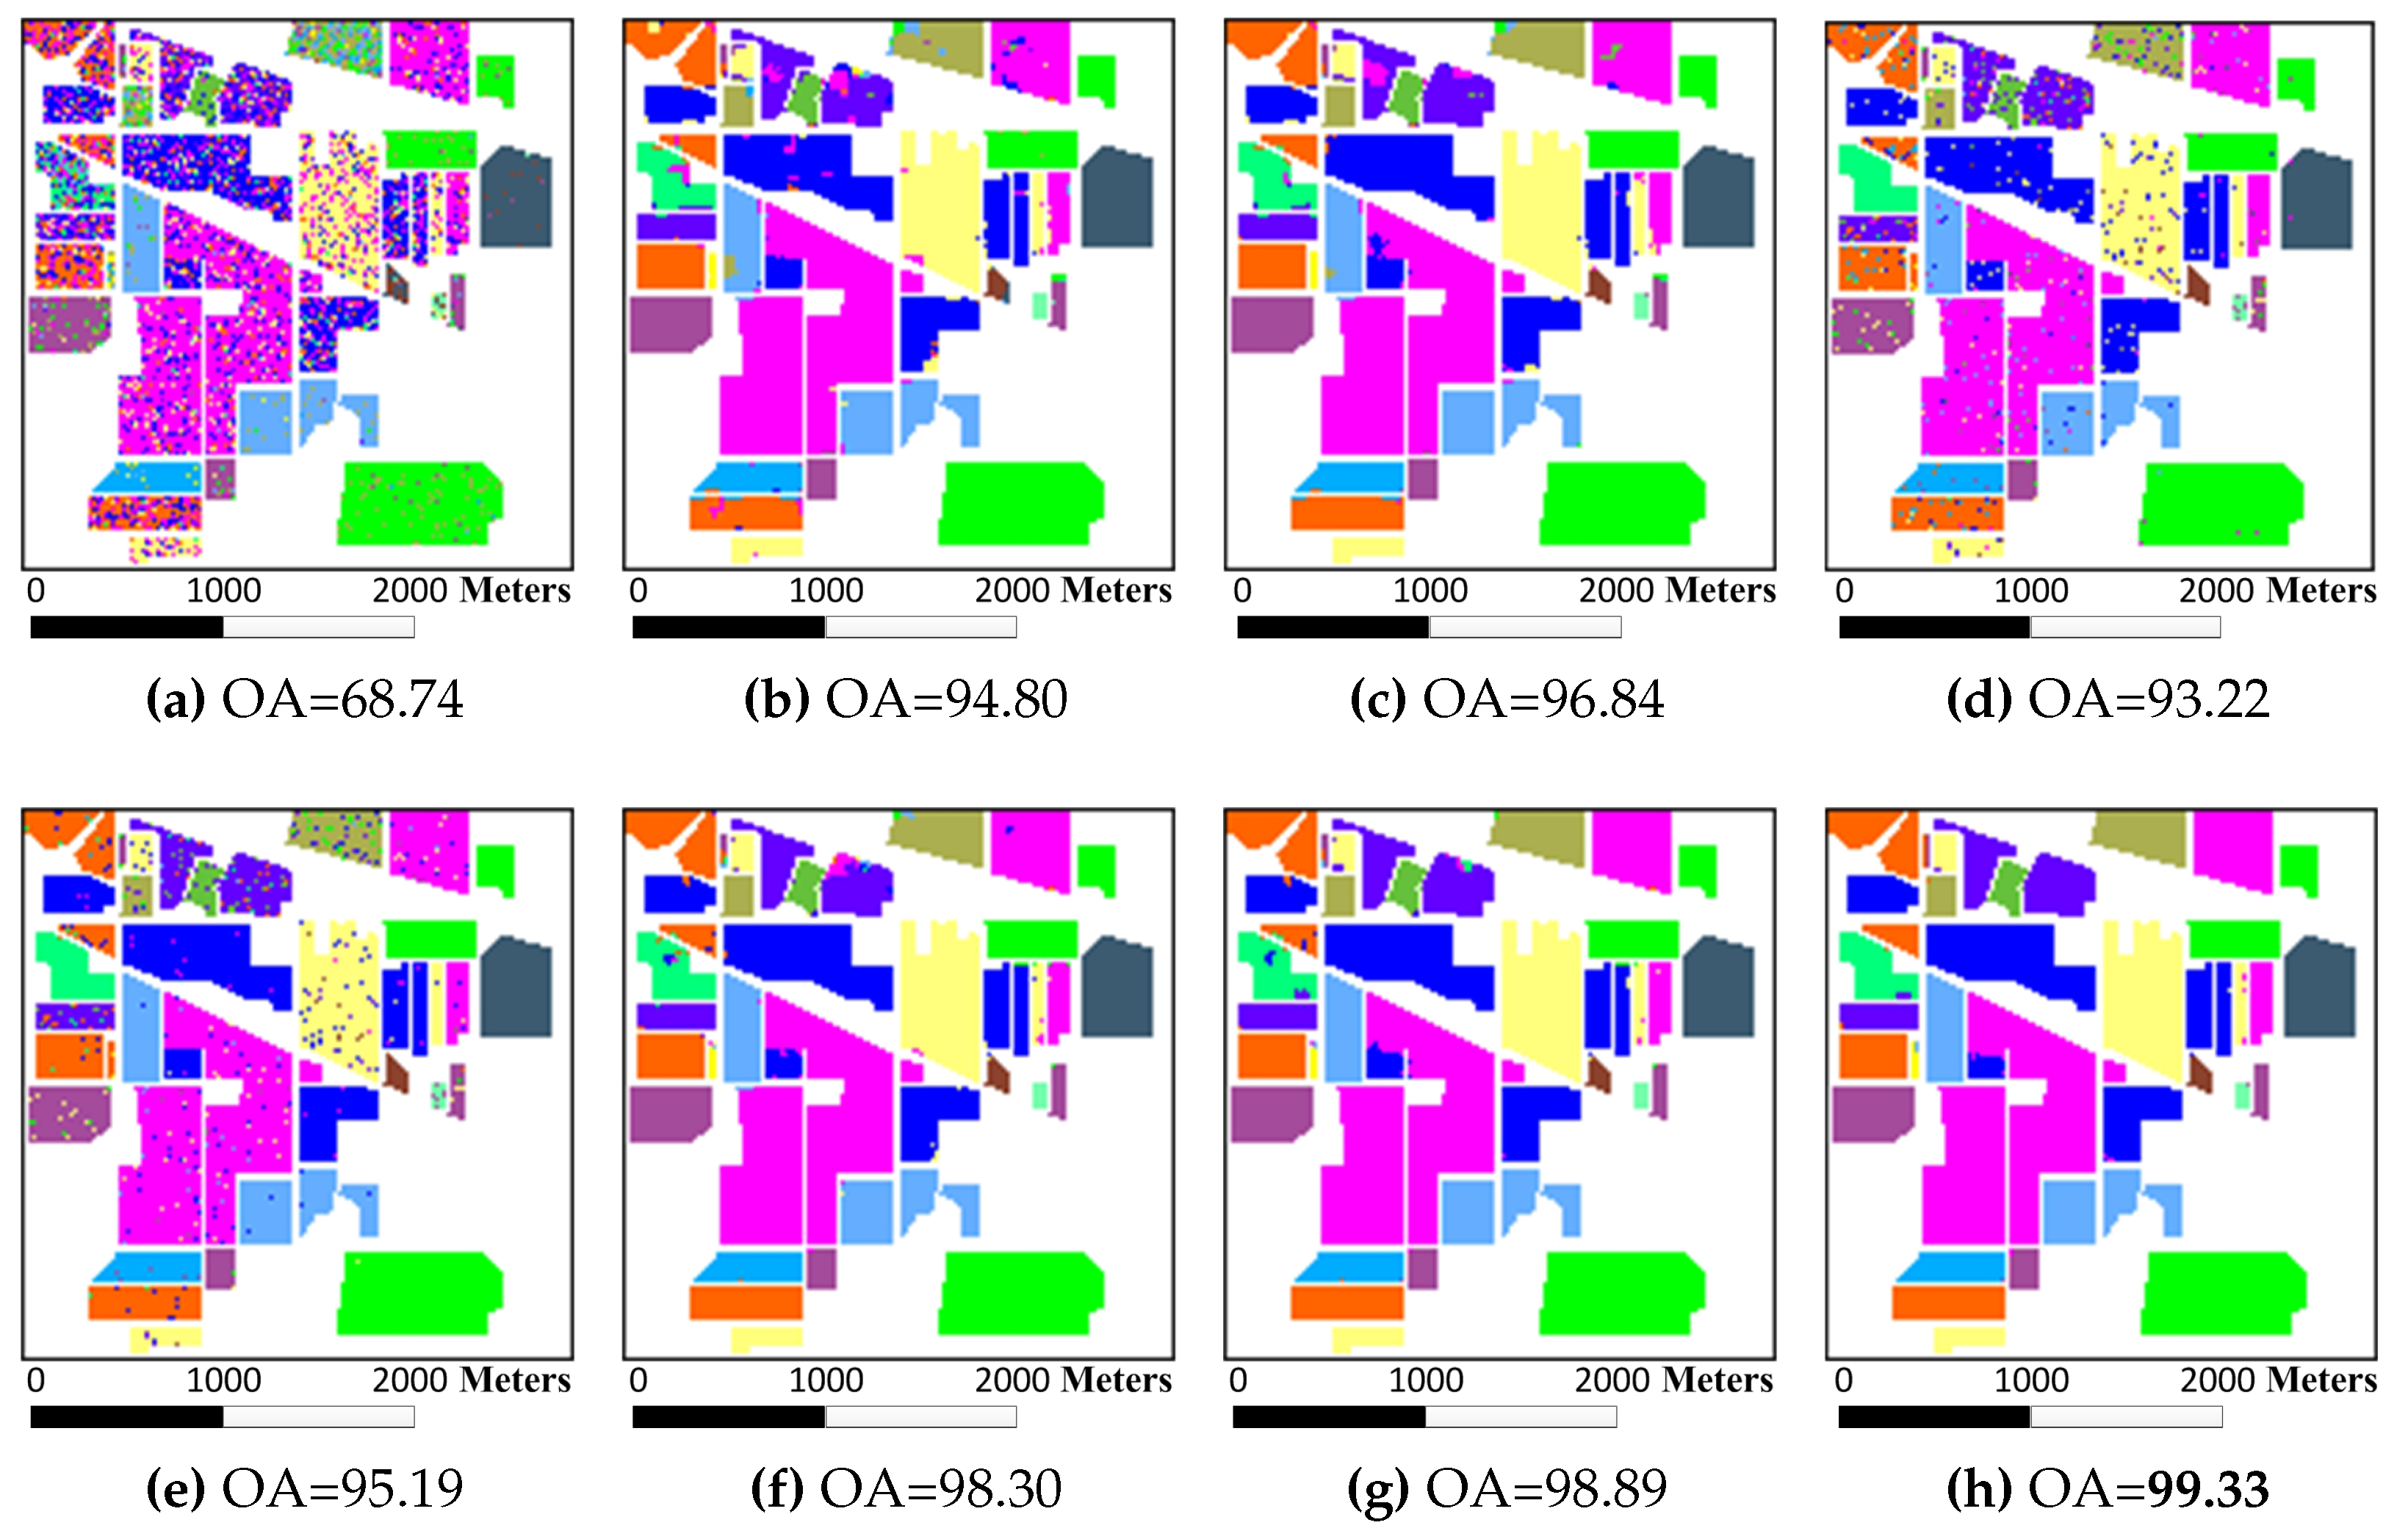
The Indian Pines data set was classified firstly. 10% of the labeled pixels were randomly sampled for training from each class, while the rest 90% were used to test the classifiers (see
Table 2). The classification maps generated by different classifiers on the Indian Pines image are shown in
Figure 6. The details of the classification results averaged by ten runs with randomly sampled training samples are tabulated in
Table 3. The results of the McNemar’s tests between classifiers are listed in
Table 4. It is easy to find that JUSRC, MJUSRC and MURASR* perform better than JSRC, MJSRC and MASR, which demonstrates the priority of union region over patch region. In addition, the multiscale majority voting based MJSRC and MJUSRC perform worse than the multiscale adaptive strategy based MASR and MURASR* for this image. Compared with MJSRC and MJUSRC, accuracy improvements of MASR and MURASR* are more than
. MURASR gets a better result than MURASR* in accuracy and classification map. As can be observed from the classification maps of MURASR* and MURASR, many misclassifications in MURASR* can be eliminated efficiently by probability majority voting method. What’s more, MURASR performs best among all algorithms in terms of OA and AA, and the results of the McNemar’s test are statistically significant and coherent with the obtained overall accuracies.
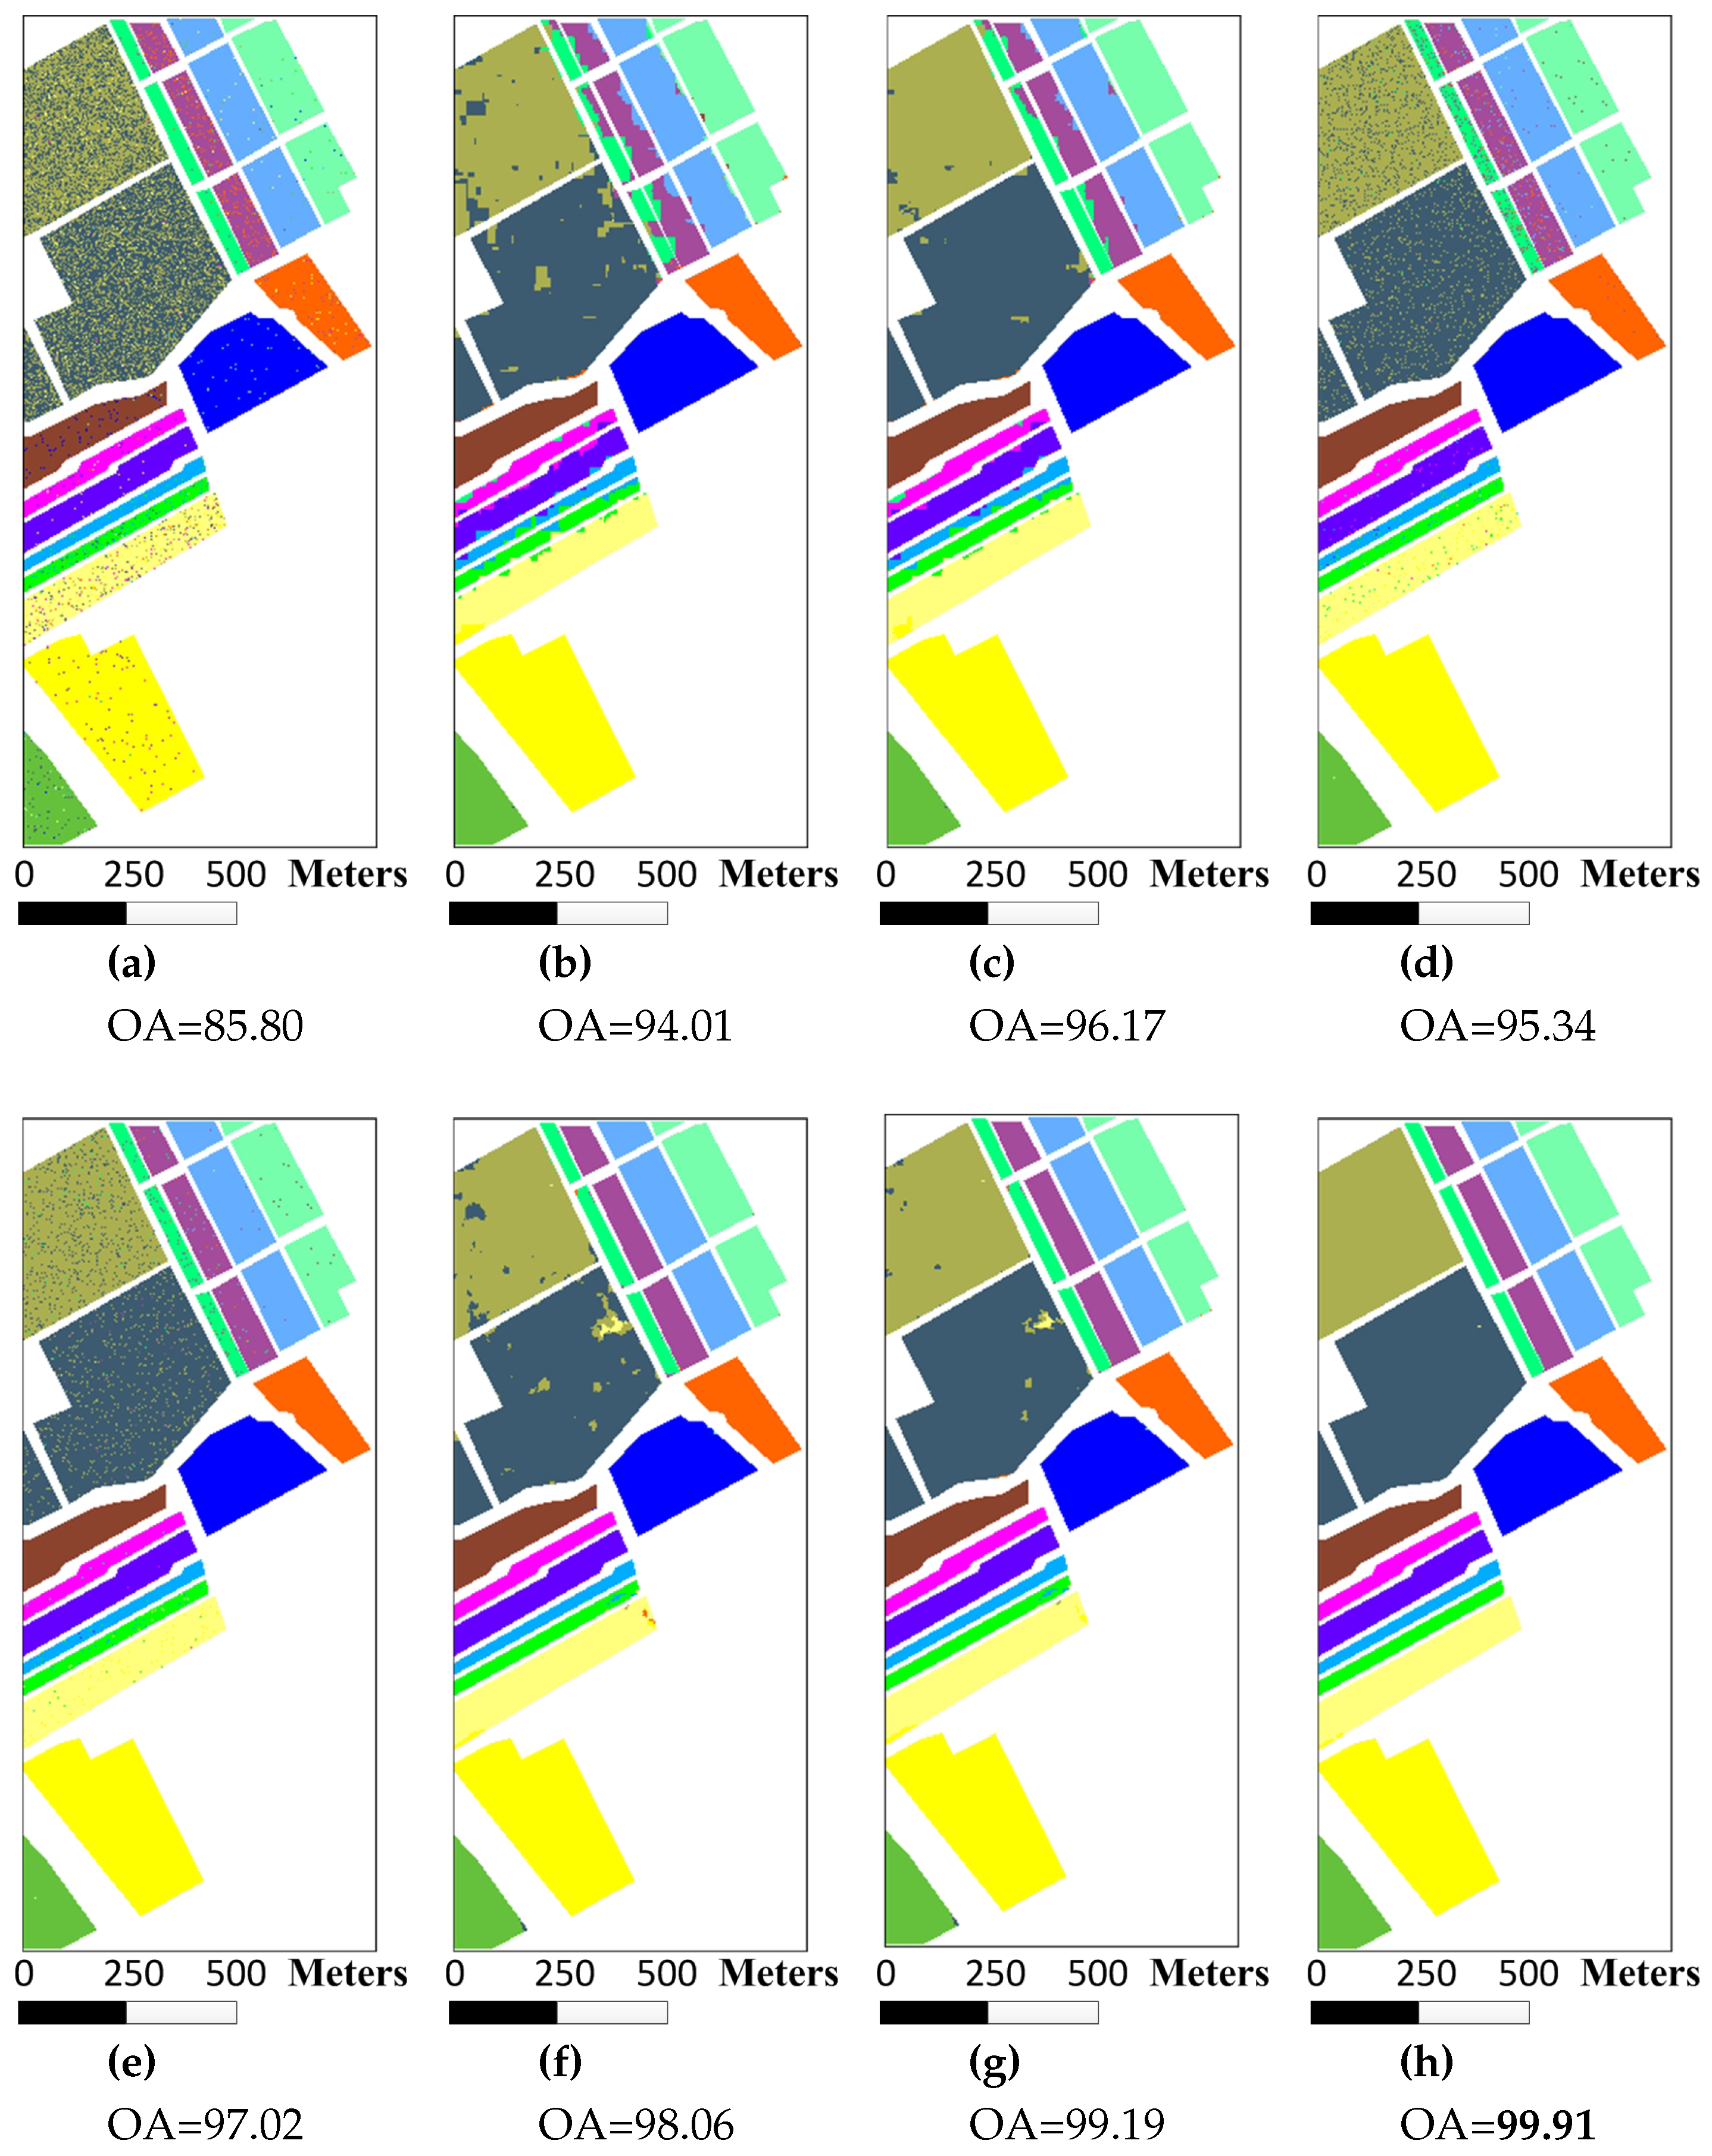
The second experiment was performed on the Salinas data set. To compare the classification with MASR, only 1% of the labeled pixels for each class were randomly selected for training. Then the remaining 99% labeled data were classified with the classifiers to demonstrate the superiority of the proposed MURASR (see
Table 5). The classification maps for various classifiers are illustrated in
Figure 7 and the average quantitative results of ten runs are tabulated in
Table 6. Moreover, the results of the McNemar’s tests are shown in
Table 7. As can be observed, union region based algorithms JUSRC, MJUSRC and MURASR* still get more accurate results than patch region based JSRC, MJSRC and MASR in terms of OA, AA and Kappa coefficients. The classification maps of MJSRC and MJUSRC have more pepper salt noise pixels than MASR and MURASR*. Comparing classification maps of MURASR* and MURASR, we can find that most misclassifications generated by MURASR* can be corrected by probability majority voting method. In addition, the average accuracy of MURASR is
which is very high for classification. Moreover, it should be noted that the McNemar’s tests between classifiers are also statistically significant and coherent with the obtained overall accuracies.
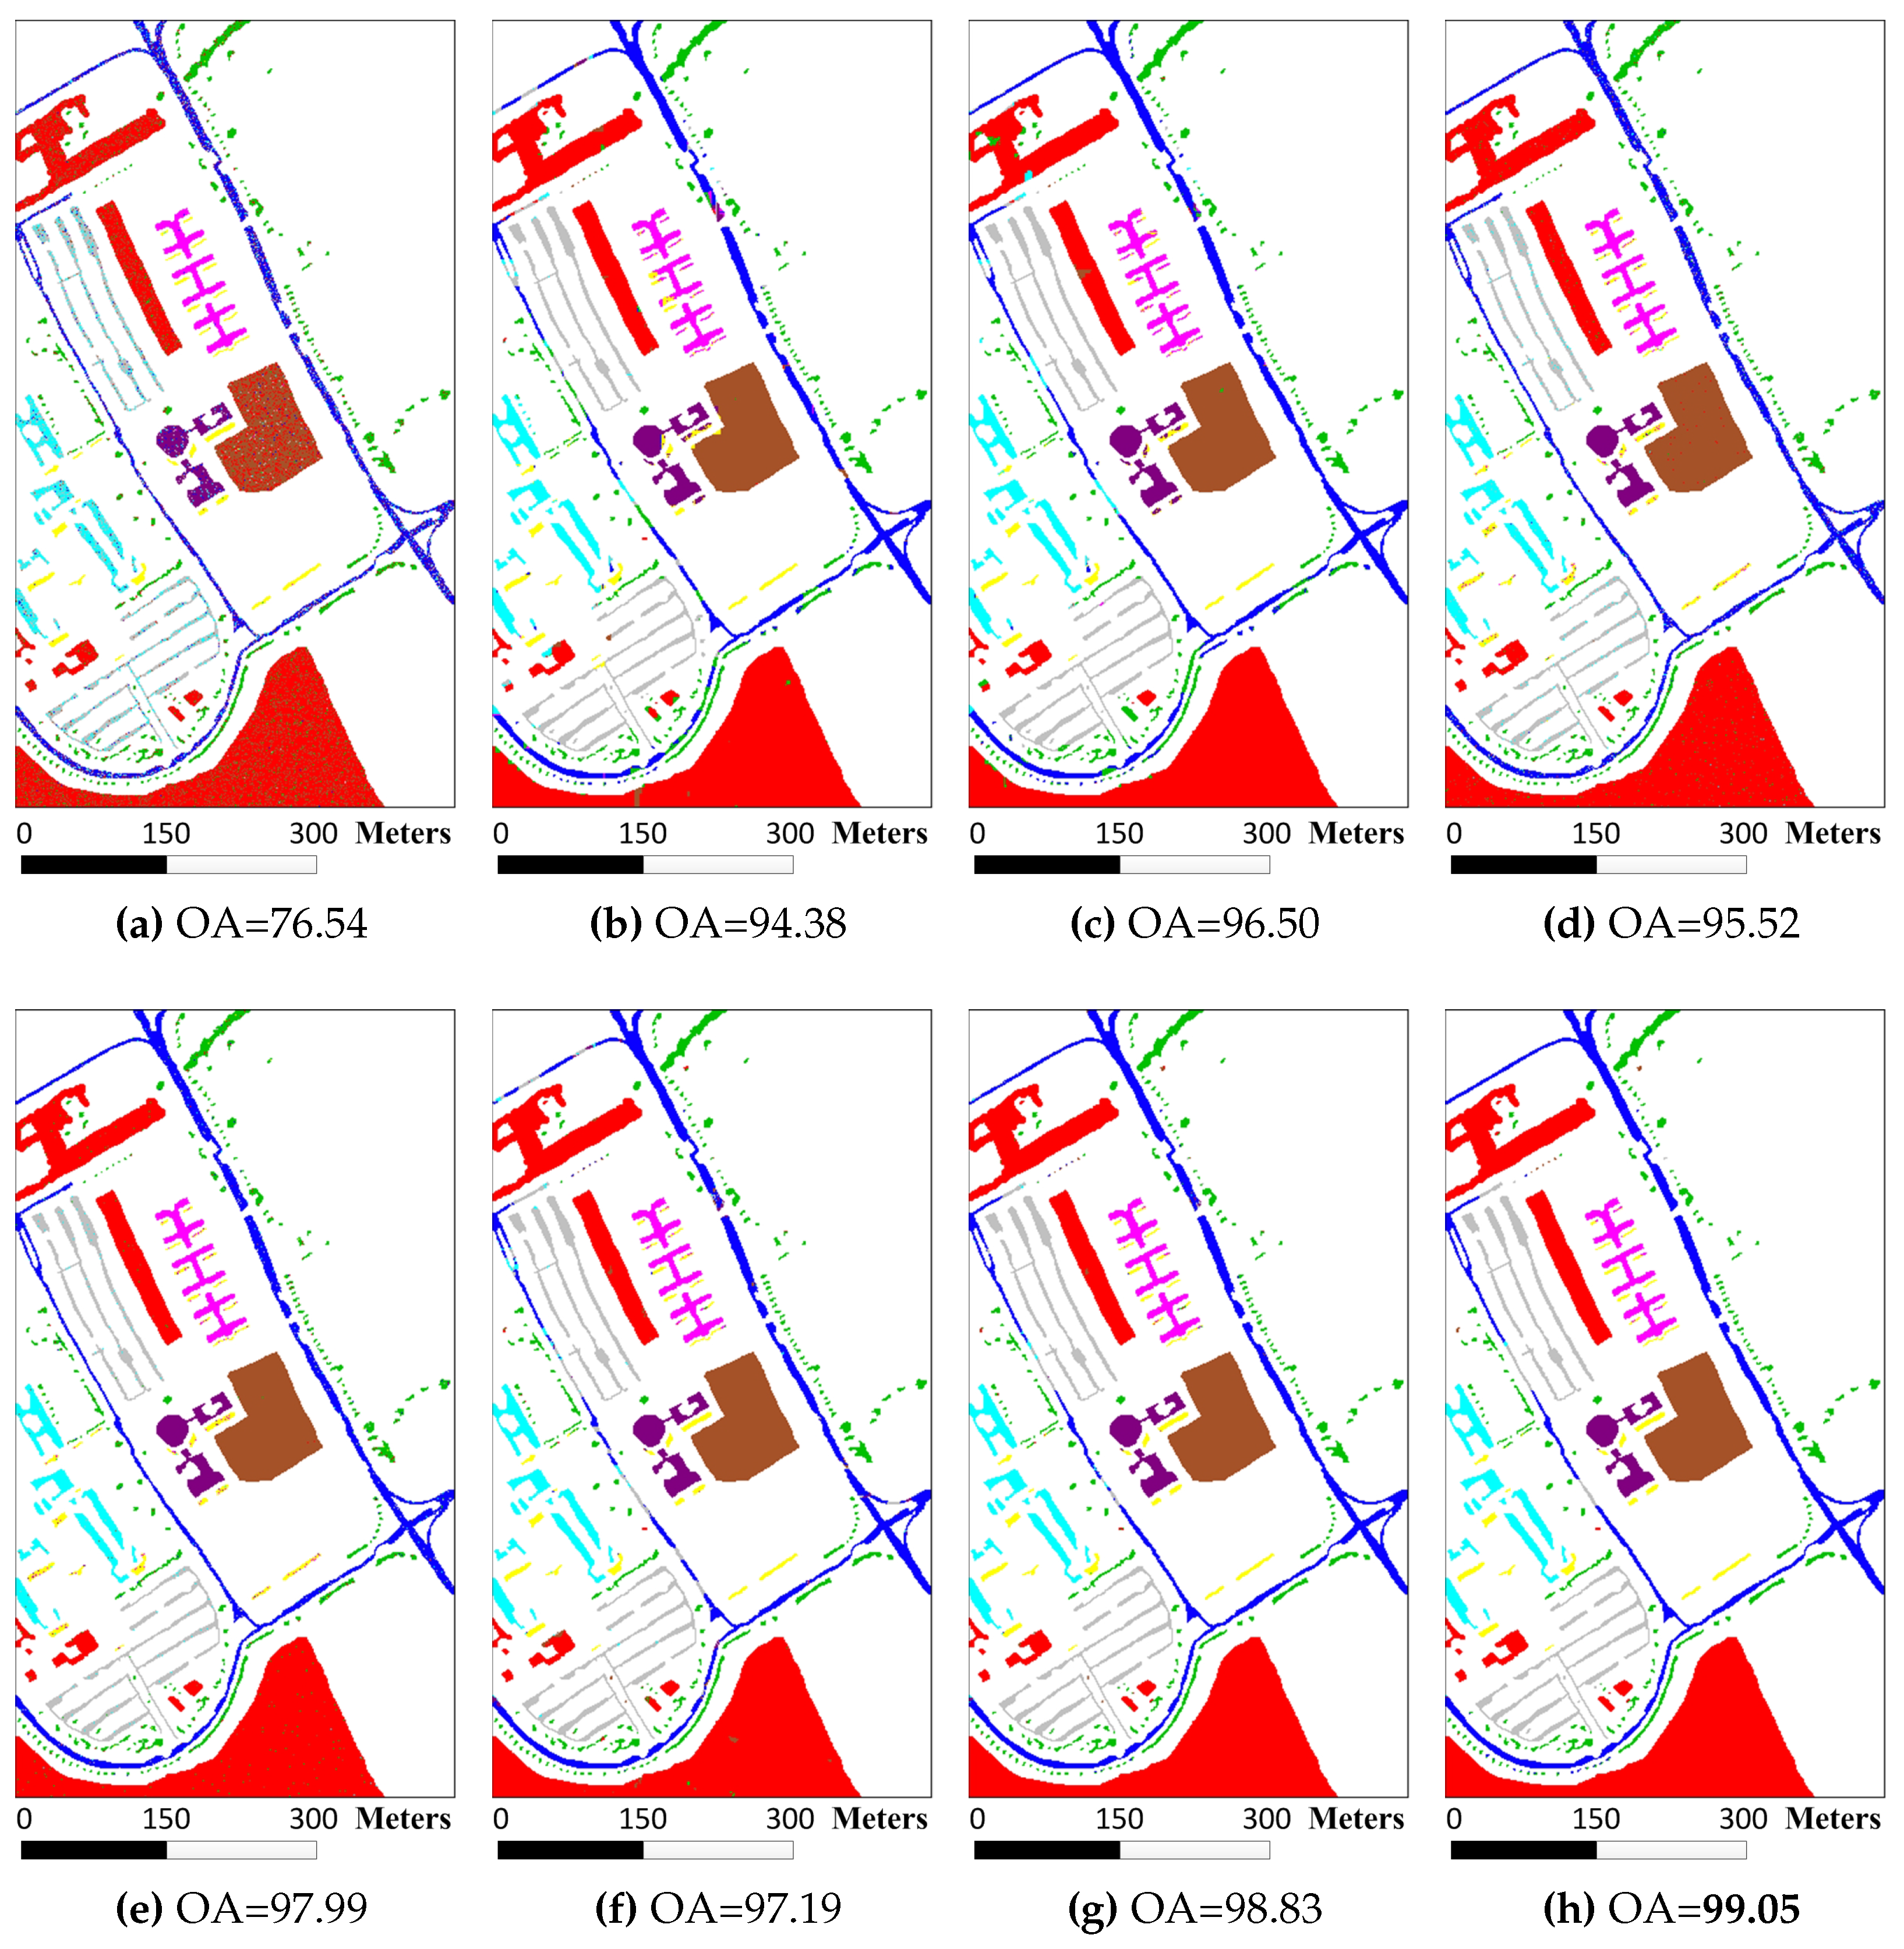
The final experiment was conducted on the University of Pavia image. The shapes of surface objects in this image are more complex than previous two images. For each reference class, 200 train samples were randomly selected from the labeled data and the remaining pixels were used for testing the performance of various classifiers (see
Table 8). The classification maps are demonstrated in
Figure 8 and the detail data averaged by ten runs in term of OA, AA, and Kappa coefficients is listed in
Table 9. The McNemar’s tests between classifiers also were conducted on this image and the results are tabulated in
Table 10. Same as previously mentioned two images, union region based classifiers also performed better than patch region based classifiers. Multiscale adaptive strategy still works better than multiscale majority voting strategy in this image. The accuracy improvement gained by probability majority voting is less than previous two images because the University of Pavia image has less large homogenous regions. And from
Table 9, we can find that MASR only has more accurate result than MURASR with one class and MURASR performs best among all classifiers with 7 classes, which proves the priority of MURASR further. The results of the McNemar’s tests also provide enough support for the analysis.
Compared with many presented algorithms, MASR is a time-consuming algorithm. In this paper, the proposed MURASR is designed based on the multiscale adaptive representation in MASR. Also, the generation of union regions will consume some time. Moreover, the union region has more pixels than patch region. Therefore, the MURASR is also a time-consuming algorithm and the time cost of MURASR is about twice as much as MASR. But the proposed MURASR was coded in MATLAB (R2016a, Mathworks, Portola Valley, CA, USA) and was not optimized for speed. The MURASR can be significantly sped up by changing the compiling code from MATLAB to C and adopting a general-purpose graphics processing unit (GPU).


