1. Introduction
Fine-grained urban land use information (urban land use types at a spatially disaggregated level) is of great significance to urban planning, economic analysis, hazard and pollution analysis, and environmental conservation [
1,
2,
3,
4]. There has been increasing demand for fine-scale urban land use maps in the past several decades [
5]. On the other hand, the timely acquisition of up-to-date land use information is of equal importance, because the urban environment has been changing at a greater pace, especially in rapidly developing regions [
2]. Traditionally, the update of land use maps has mainly relied on experienced analysts interpreting remote sensing images, topographic maps, and building maps with the assistance of field survey and statistical data [
6,
7]. While this is labor- and time-consuming, desirable and consistent land use information cannot be guaranteed due to the various judgements and technical proficiency levels of analysts [
4,
7,
8]. In sum, as a great challenge to urban land administration and planning, the derivation of fine-grained, accurate, and timely urban land use information is needed to keep up with the pace of urban development, and to better assist municipal administrations with their routine land use mapping assignments.
Remotely sensed images have become a major data source to map urban land use. Because of the pixelated nature of remotely sensed images, urban land use classification was conventionally conducted on a per pixel basis. However, the per-pixel classification is usually associated with the “salt and pepper” effect, and can only handle spectral, texture, and contexture attributes well. Furthermore, a pixel is not socially and functionally meaningful in the context of urban land use classification. As opposed to per-pixel classification, per-field classification determines the land use of each predetermined field instead of a pixel. A field, in the context of urban land use classification, is a geographically meaningful region with relatively homogeneous socioeconomic functions. Per-field urban land use classification can overcome the limitations of per-pixel classification, and can incorporate field-only new attributes in the classification, such as the size, shape, and statistics of the field. Many studies have demonstrated improved classification results using per-field classification [
9,
10]. There are also classification approaches that integrate per-pixel and per-field methods; however, they have only been applied to land cover classification instead of urban land use classification [
11,
12,
13].
In the era of big data, the advantages of per-field classification are even more outstanding. While high spatial resolution remotely sensed images provide abundant and detailed information on the spectral, textural, contextual, and spatial configuration of urban land cover [
14,
15], multiple sources of social sensing data (e.g., social media, mobile phone, digital maps, and GPS trajectories) make it possible to examine the socioeconomic and demographic characteristics of urban land [
16,
17,
18,
19]. It is more meaningful for a field, a thematically and functionally defined land use region, than for a pixel to have socioeconomic and demographic attributes derived from social sensing data. The combination of the two data sources takes into consideration both the physical and socioeconomic attributes of a field, and thus is expected to hold great potential for providing better insights into urban landscape patterns and for mapping urban land use more accurately [
20]. However, most urban land use studies relies solely on either remote sensing data [
2,
21] or social sensing data [
22,
23,
24,
25], but seldom on both [
20]. Consequently, the importance of attributes derived from both data sources for use in classifying different urban land use types is rarely addressed in the literature.
The fields used in per-field urban land use classification have been gradually evolving from a traditional aggregated level (e.g., census tract or traffic analysis zone) to a more disaggregated level (e.g., census block or land parcel) [
5], so that more detailed land use information can be derived. Smaller and more disaggregated fields are especially necessary for urban land use mapping in China, as the representative land parcel size is much smaller in China than in many other countries, such as Japan, Sweden, Canada, and the United States [
26]. A highly-automated approach is needed to generate socially homogeneous and more disaggregated fields for use in the routine update of urban land use information and large-scale urban land use mapping.
In light of the issues, challenges, and knowledge gaps revealed above, two objectives were set for this paper: (1) to develop a highly automated methodological framework integrating remote sensing and social sensing data, and (2) to evaluate the importance of individual attributes, attribute categories, and both data sources in fine-grained urban land use classification.
In this paper, a methodological framework was designed to automatically map fine-grained urban land use in urban Haidian District, Beijing, China, in 2016, using both high-resolution remote sensing data and multi-source social sensing data. Urban land use parcels (fields) were generated automatically from OpenStreetMap road networks. The Gaofen-2 remotely sensed imagery was used to calculate the spectral and texture attributes and landscape metrics for each parcel. Points Of Interest (POI) data acquired from Baidu Maps (
http://map.baidu.com) and geotagged Weibo posts (
http://www.weibo.com) were used to provide the socioeconomic and demographic attributes of each parcel. The classification was conducted using the random forests algorithm. The importance of parcel attributes, attribute categories, and both data sources was assessed for the whole classification and for the classification of individual land use types. Finally, the applicability and limitations of the proposed approach were discussed, with the expectation to shed light on how to further improve the classification results.
2. Methods
This section describes the study area of urban Haidian District, Beijing, China, and the data sources of GaoFen-2 remotely sensed images and social sensing data. The methodological framework to map fine-grained urban land use (
Figure 1) was also introduced, including the generation of urban land use parcels, the calculation of their attributes, per-field urban land use classification, and attribute importance analysis.
2.1. Study Area
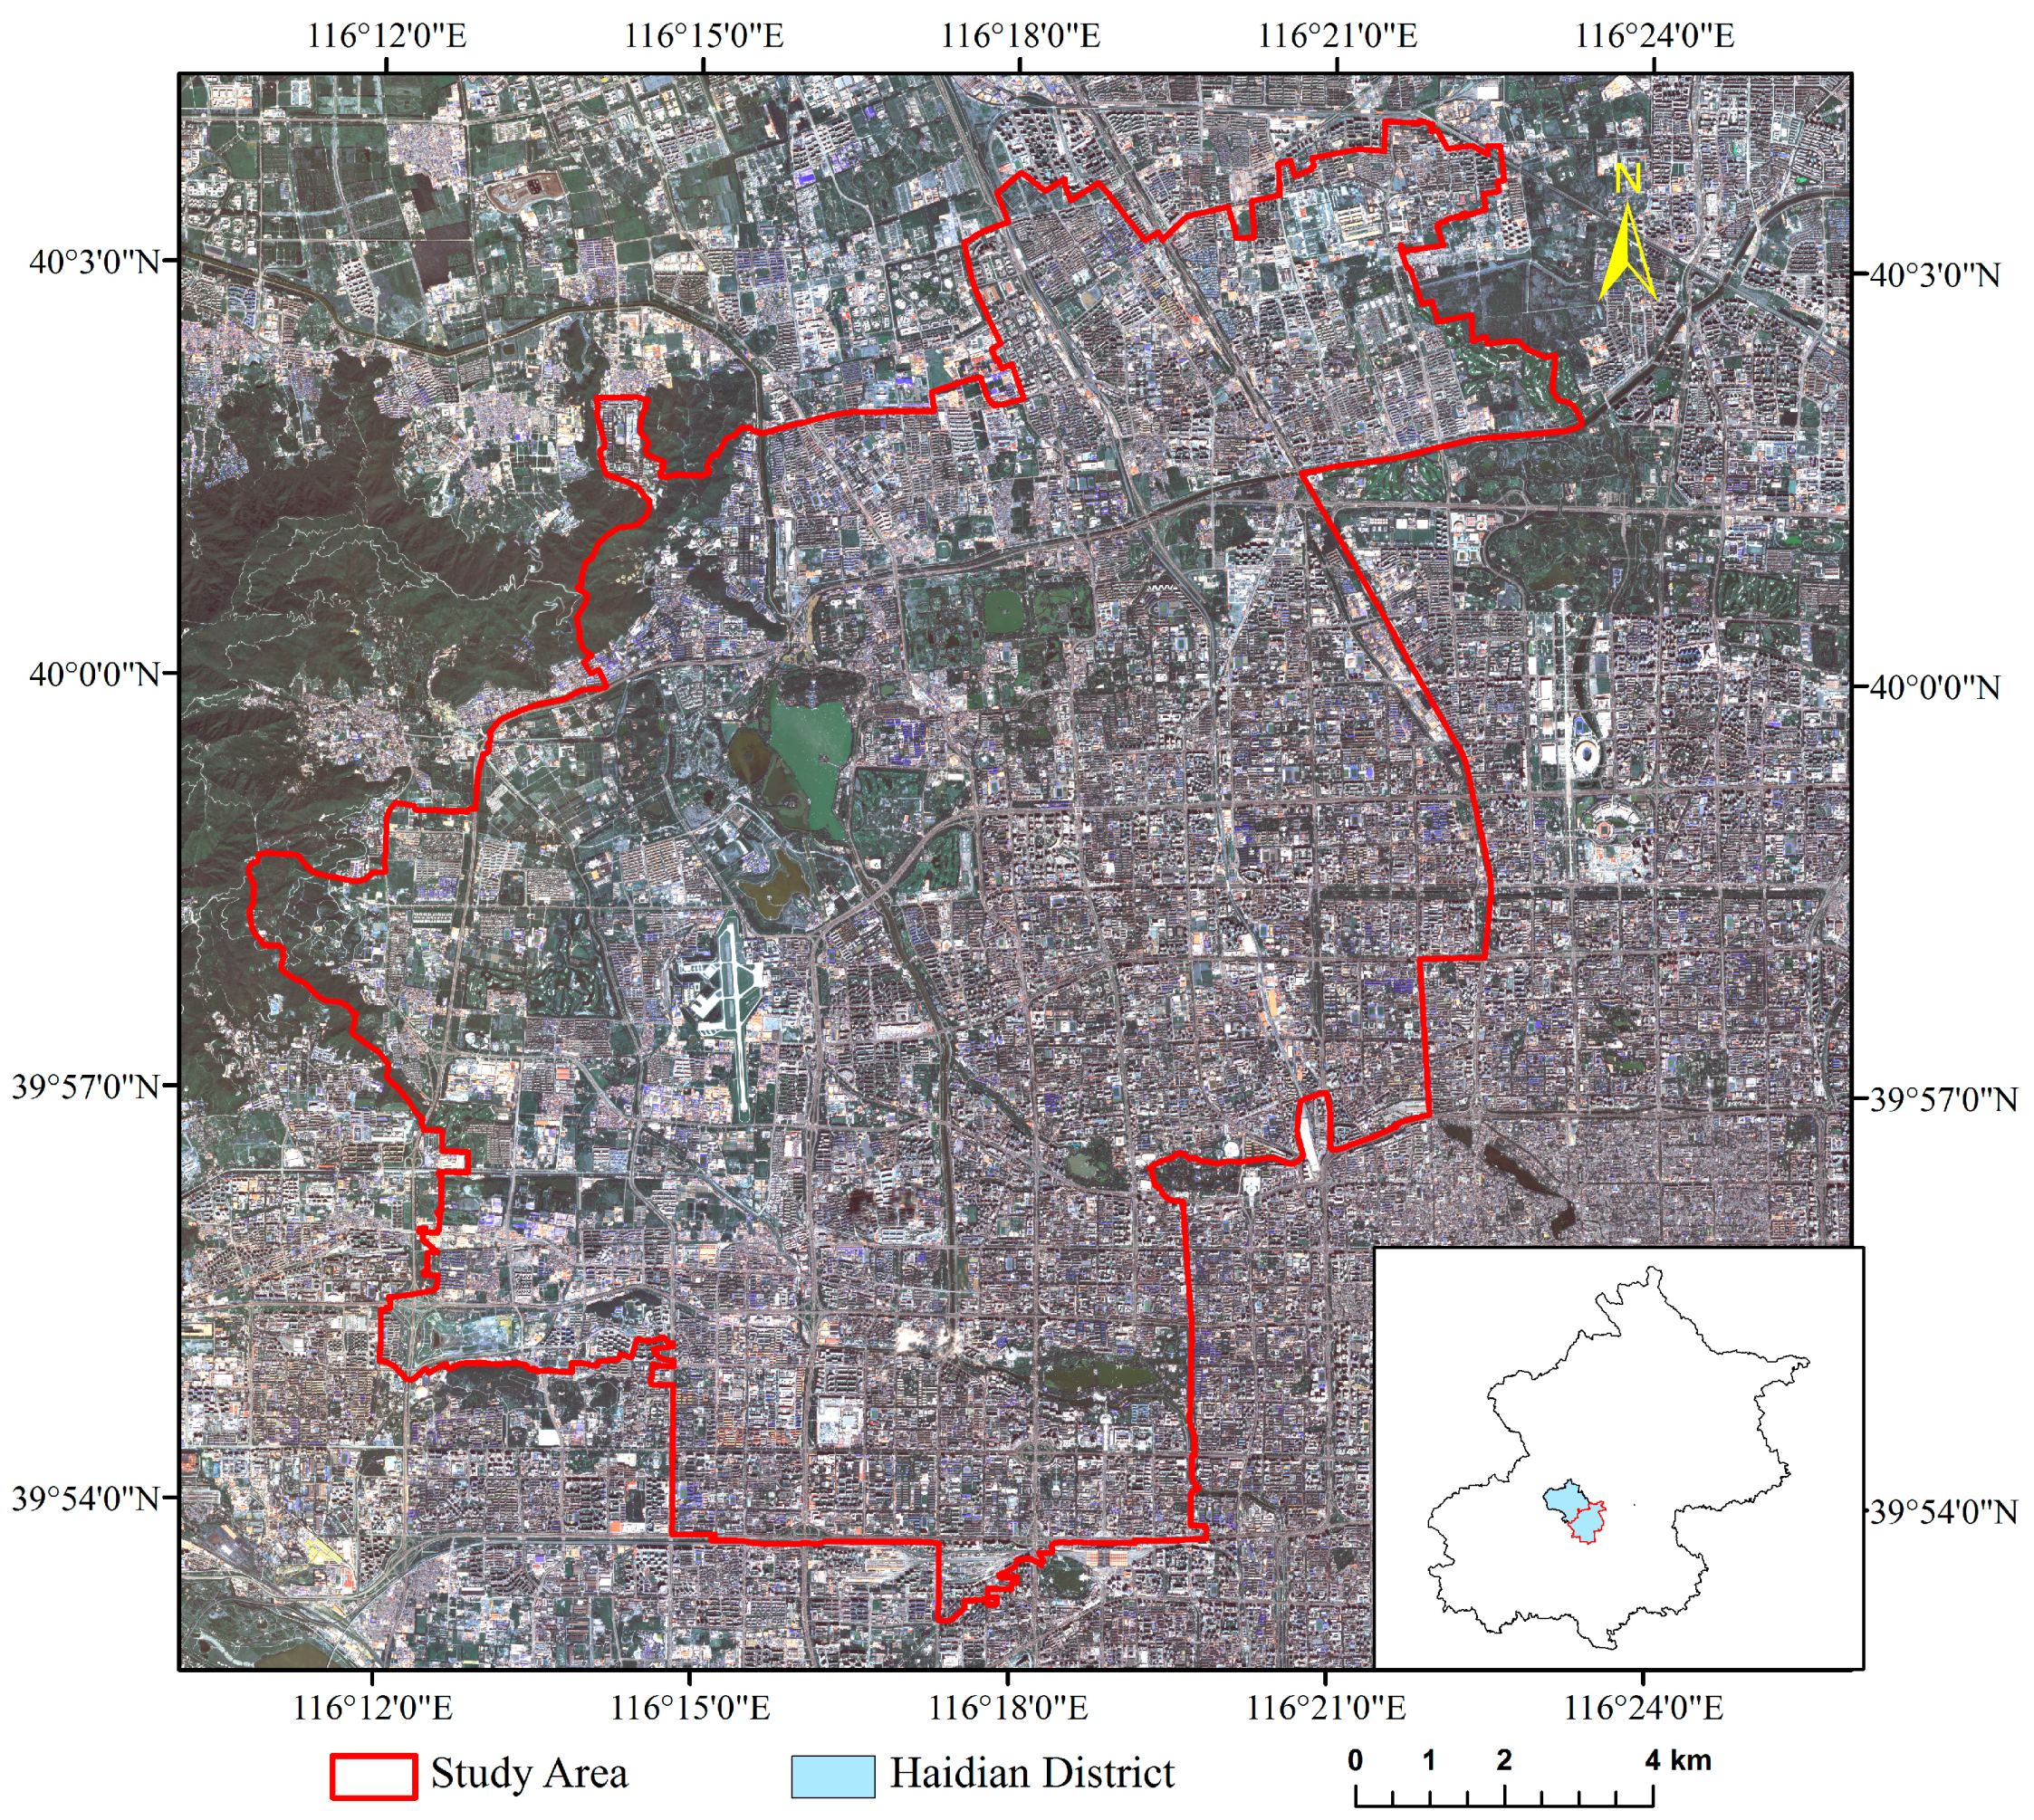
The urban Haidian District in Beijing, China, was chosen as the study area (
Figure 2). Haidian District lies in the northwestern part of the urban core area of Beijing, China, and is the second largest district in urban Beijing. It has 29 subdistricts, with 3 of them containing mostly rural and urban–rural transitional areas. The road networks are sparse in the rural areas, leading to a much reduced performance of segmented urban land use parcels than in the urban core area [
27]. Therefore, three rural subdistricts (Shangzhuang, Xibeiwang, and Sujiatuo) were excluded and the rest of the urban Haidian District was used as the study area for automatic mapping of fine-grained urban land use. The study area covers an area of about 195 km
2. It is home not only to most universities in Beijing, but also to many high-tech companies, famous attractions, and different types of residential areas, creating a complicated urban landscape. It is expected that the method applicable to the study area can also achieve desirable classification results in other areas.
2.2. Data Sources and Preprocessing
2.2.1. GaoFen-2 Remotely Sensed Imagery
GaoFen-2 (GF-2) is a high-resolution remote sensing satellite that was launched on 19 August 2014. The GF-2 satellite has two Panchromatic/MultiSpectral (PMS) sensors on board (PMS-1 and PMS-2 with the same band designations). The band designation of GF-2 PMS is very close to that of Landsat ETM+, with a swath of 45 km (
Table 1). The spatial resolutions of the multispectral and panchromatic bands are 4 m and 1 m, respectively.
A GF-2 multispectral image acquired on 17 February 2016 was used to derive the spectral/texture attributes and landscape metrics. The radiometric calibration was applied on the GF-2 image to convert digital numbers to Top-Of-Atmosphere (TOA) reflectance using parameters provided by the China Centre for Resources Satellite Data and Application (
http://www.cresda.com/CN/index.shtml). An atmospheric correction was conducted to convert the TOA reflectance to surface reflectance using the Fast Line-of-sight Atmospheric Analysis of Spectral Hypertube (FLAASH) module of the Environment for Visualizing Images software (ENVI, Version 5.1). The image was then orthorectified using the Rational Polynomial Coefficients (RPC) orthorectification module of ENVI 5.1.
The preprocessed GF-2 image was classified into impervious surface, vegetation, water, and barren soil using an object-based classification method implemented by eCognition 8.7 (Trimble GmbH, Raunheim, Germany). The GF-2 land cover classification provides the basis for the derivation of landscape metrics. A total number of 50 100 m × 100 m sample regions was randomly selected, and the land cover types of the pixels within these sample regions were identified by visual interpretation in order to assess the accuracy of the land cover classification. The overall accuracy of the GF-2 land cover classification reaches 84.1%.
2.2.2. Social Sensing Data
Two types of social sensing data were used in this paper, including the Baidu POI data and geotagged Weibo data. The Baidu POI data were acquired in 2016 via the Application Programming Interface (API) provided by Baidu Maps (
http://map.baidu.com/), one of the most popular web mapping services in China. A total number of 84,150 records of Baidu POIs was obtained within the study area, belonging to the 17 classes of automotive, business, education, entertainment, financial, food, government, healthcare, landmarks, lodging, media/arts, personal care, residence, retail, services, sports, and transportation (
Figure S1). Baidu POIs of these 17 classes were reclassified into the 4 classes of open space, institutional, residential, and business in correspondence with the urban land use classification system used in this paper (introduced later in
Section 2.4). Weibo (or Sina Weibo) is the largest microblogging social media platform in China. It is known as Chinese Twitter. Python scripts were used to randomly crawl 504,816 geotagged Weibo posts, with their locations within the study area and post times in 2016. These Weibo posts were partitioned into 16 three-hourly time bins based on their post times, from 0:00–3:00 to 21:00–24:00 on weekdays and weekends. The spatiotemporal pattern of Weibo posts can represent the daily activities of residents, and has been demonstrated to be effective in discriminating urban land use types [
20,
28].
2.2.3. OpenStreetMap Road Network
OpenStreetMap (OSM) is one of the most popular collaborative mapping projects. As the pioneer Volunteer Geographic Information (VGI) project that attracts the most public contribution, OSM has collected abundant data, and the total road length and coverage of OSM are even superior to those of some proprietary maps in some countries or regions [
29,
30]. The high positional accuracy of OSM in urban areas has also been confirmed [
31]. The free accessibility and reliability make OSM a promising data source of generating urban land use parcels for automatic urban land use mapping.
2.3. Generation of Urban Land Use Parcels
The fields have to be generated before the per-field urban land use classification can be conducted. There are several commonly used methods to delineate a fine-scale field boundary. The first one is to use existing fields, such as census blocks or land parcels [
2,
7,
32]. While these existing fields are usually detailed and reliable, they are usually inaccessible (and often confidential) in China [
8]. Furthermore, they cannot meet the requirements of the routine update of urban land use maps, because only the land use type can be updated, instead of field boundary change and land parcel integration or separation. Traditional visual interpretation and manual digitization is another way to obtain the fields [
14], yet is time- and labor-consuming, and may lead to inconsistent field boundaries [
7,
8]. Image segmentation techniques produce fields with similar spectral and textural characteristics [
33] instead of the ones with homogeneous social functions, which are more meaningful in the context of urban land use classification. In this paper, the OSM road network was used to segment the study area into disaggregated fields: urban land use parcels with homogeneous socioeconomic functions. It has been demonstrated that fields automatically segmented by road networks can yield satisfactory per-field classification results [
8,
20,
27].
A method proposed by Liu and Long [
8] was adopted in this paper to generate the urban land use parcels. Because OSM roads rely on crowdsourced contribution, their completeness is heterogeneous across space [
34]. Therefore, the OSM roads were firstly preprocessed (
Figure S2) to derive more meaningful parcels: first, the road segments were extended for as long as 100 m to deal with the issues of a topologically disconnected road network; and second, dangling road segments were removed because they cannot be connected to nearby road segments. According to the principal tags and their relative importance (
http://wiki.openstreetmap.org/wiki/Key:highway), the OSM roads were classified into three levels, from the most important (Level 1) to the least important (Level 3). Based on the investigation of road widths in the study area and the standards of the Ministry of Housing and Urban-Rural Development of China, buffers with widths of 40 m, 20 m, and 10 m were generated respectively for Level 1, Level 2, and Level 3 roads to create road space. The parcels were then derived by removing the road space from the study area. The segmented parcels with an area below 5000 m
2 were removed, so that less meaningful parcels (e.g., parcels surrounded by overpasses or roundabouts and parcels too small to have socioeconomic functions) were excluded from the following classification and analysis. A total number of 865 parcels were generated accordingly in the study area.
2.4. Classification System
This paper uses a classification system adapted from the Chinese land use classification criterion (GB/T21010-2007). This criterion divides the built up land into eight Level 1 classes, including residential, institutional/public service, business, industrial, warehousing, transportation, public facilities, and open space. The eight classes were merged into four to form the classification system used in this paper, because there are no or only few parcels of the classes of industrial, warehousing, transportation, and public facilities within the study area [
7]. The four classes were not further divided into subclasses because of the limited number of samples in the study area. While ensuring enough sample in each class for the development of a valid classification model, the four-class system, as compared with one with a larger number of classes, also facilitates the attribute importance analysis for the classification of individual classes (the second objective of this paper).
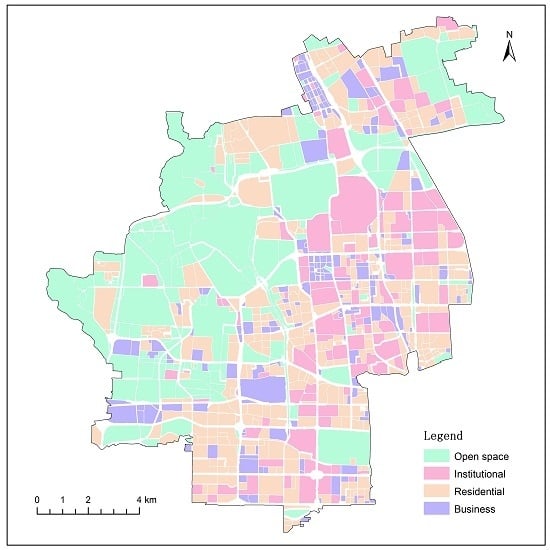
The class of open space includes parks, greenbelts, squares, water, agriculture, and vacant lands; the institutional class includes educational, medical land, public services, and administrative offices; the residential class includes urban residential areas (houses and apartments) and rural settlements; and the business class includes office buildings, retail stores, hotels, recreational facilities, financial services, and manufacturing/mining facilities.
2.5. Parcel Attributes
A total number of 60 parcel attributes were used in mapping fine-grained urban land use in the study area, including 8 spectral and texture attributes, 24 landscape metrics, 12 Baidu POI attributes, and 16 three-hourly Weibo post densities. Spectral/texture attributes include the mean, standard deviation, kurtosis, and skewness, as well as four Gray-Level Co-Occurrence Matrix (GLCM) texture measures of the near-infrared reflectance. The landscape metrics were derived from the land cover classification map, describing the landscape composition, configuration, and aggregation of each parcel. The mean and standard deviation of Baidu POI densities were derived from the kernel density maps. The distribution pattern of Baidu POIs within each parcel was also calculated using a nearest neighbor analysis. The kernel density maps of the three-hourly aggregated Weibo posts were generated, and 16 attributes of mean kernel density were derived for each parcel.
2.5.1. Spectral and Texture Attributes
The spectral and texture attributes of the near-infrared (NIR) band were calculated for each parcel, because the NIR band contains the most important information that differentiates vegetation and built up regions [
14]. The spectral attributes used in this paper include the mean, standard deviation, kurtosis, and skewness of all pixel-wise near-infrared reflectance values in each parcel. The texture attributes were calculated using Gray-Level Co-occurrence Matrix (GLCM). GLCM uses the adjacency relationships between the gray levels of pixels to characterize the texture of an image [
35]. This paper used the window of 7
7 pixels to calculate the GLCM texture attributes, because this window size was demonstrated to be suitable for urban land use classification using remotely sensed images with spatial resolutions of 2.5–10 m [
36]. The shift was set to five pixels (20 m), which represents the average distance between urban land cover objects [
37]. The texture measures of homogeneity, dissimilarity, entropy, and second moment were calculated using the aforementioned parameter settings, because these four texture measures have been identified as effective in distinguishing urban land use types [
36].
2.5.2. Landscape Metrics
Parcel-wise landscape metrics have been found to be among the most important in differentiating urban land uses [
14]. In this paper, 24 landscape metrics were calculated on the basis of the GF-2 land cover classification (
Table 2).
The landscape metrics were patch-based algorithms quantifying the spatial pattern and configuration of different land cover types. A patch is a homogeneous region composed of pixels of the same land cover type [
14,
39]. Because many landscape metrics are highly or even perfectly correlated, a correlation analysis was conducted to select a suite of metrics that were not significantly correlated with each other and can represent as many aspects of a landscape pattern as possible. In light of these principles, a total number of 24 landscape metrics were selected, including 9 at the landscape level and 15 at the class (single land cover type) level (
Table 2). McGarigal [
38] is referred to for detailed explanation and the calculation algorithms of these landscape metrics.
2.5.3. Density and Spatial Pattern of Baidu POIs
The nonparametric Kernel Density Estimation (KDE) with a search radius (bandwidth) of 100 m was applied to four classes of Baidu POIs to generate four layers of kernel density. KDE helps to overcome the issues associated with possible spatial errors of POI locations or parcel boundaries. The mean and standard deviation of kernel density of the four classes were calculated for all land use parcels. Furthermore, an average nearest neighbor analysis was applied to the four classes of Baidu POIs in order to classify the point pattern distribution of each parcel into a few points, dispersed, random, and clustered.
2.5.4. Density of Geotagged Weibo Posts
Because only a limited amount of geotagged Weibo posts were collected, and there are possibly spatial errors associated with these Weibo posts [
40], a kernel density estimation with a search radius of 100 m was also applied to each three-hourly bin of Weibo posts to generate 16 corresponding density maps (two kernel density maps for the time bins of 9:00–12:00 and 21:00–24:00 on weekdays are shown in
Figure S3 as examples). The mean kernel density of Weibo posts during the 16 time bins was derived for all parcels for use in the land use classification.
2.6. Urban Land Use Classification Using Random Forests
2.6.1. Sampling Design for Training, Validation, and Testing
The actual land use types of the 865 road-segmented parcels were identified by experienced analysts based on high-resolution remote sensing images, online digital maps, street views, and a field survey. Since it is inevitable for parcels to contain multiple land use types, the land use types of these mixed parcels were determined as the majority land use type.
The parcels were split evenly between training and testing samples in each of the four land use classes, creating a training sample with 432 parcels and a testing sample with 433 parcels. The training sample was used for model development and for tuning model parameters through repeated 10-fold cross validation. The optimized model was then applied to the testing sample for an accuracy assessment.
2.6.2. Random Forests Model
The random forests model is a bagging ensemble learning algorithm well-established in the literature of land use/cover classification [
41,
42,
43]. Random forests models build numerous decision trees, and each tree is built using a random subset of independent variables and a random sample of the training dataset. The output is the class voted by most trees. The prediction accuracy of random forests models is evaluated by the Out-Of-Bag (OOB) accuracy, which is the classification accuracy of the left-out samples averaged over all trees [
41,
44]. Random forests models can be applied on large datasets with a high efficiency, and can handle the “curse of dimensionality” very well. As a tree-based ensemble classifier, a random forests algorithm can achieve higher classification accuracy than single decision tree classifiers, such as C4.5 and Classification And Regression Tree (CART) [
45]. It also outperforms some currently popular algorithms, such as Support Vector Machines (SVM), in many cases without the need to optimize a large number of parameters [
46,
47,
48]. Bagging and boosting are two widely used ensemble methods. Although boosting methods have been reported to be more accurate, they are sensitive to outliers and are much easier to overfit without abundant training samples, because they give more weight to previously misclassified samples during iteration [
45,
49]. Therefore, the random forests model, as a bagging-based classifier, was chosen over the boosting ones, such as AdaBoost and JointBoost.
The optimization of random forests models requires two finely-tuned parameters: mtry and ntree. The parameter mtry is the number of variables randomly chosen to split nodes, and ntree is the number of trees in the forest. In this paper, mtry is set to range from 1 to 35 with an interval of 2, and ntree from 500 to 6000 with an interval of 500. The parameters mtry and ntree were optimized using 50-repeated 10-fold stratified cross validation. In a 10-fold stratified cross validation approach, the training sample was randomly partitioned into 10 equal-sized subsamples with approximately the same proportion of each of the land use classes. In each of the 10 iterations, one subsample was held out in turn for validation, while the other 9 were held out for model training. Because of the randomness associated with the partition and random forests models, 10-fold stratified cross validation was repeated using different partitions 50 times for each combination of mtry and ntree. A mean validation accuracy was derived by averaging the 500 (50 × 10) validation accuracies, and the combination leading to the highest mean validation accuracy was deemed the best parameter. The optimized random forests model was then built using these values of mtry and ntree, and applied to the testing sample for an accuracy assessment.
2.6.3. Attribute Importance Analysis
One advantage of the random forests model that makes it superior over many other classification algorithms is that it can generate an estimate of the relative importance of independent variables. This paper uses the metric of mean decrease in accuracy to quantify the importance of parcel attributes, as it is more reliable than the mean decrease in the Gini index [
44]. The importance of parcel attributes was evaluated for the whole land use classification and for the classification of single classes. Five types of random forests models were built to fulfill this purpose, with the dependent variables being respectively the four-level urban land use class and binary variables discriminating a particular class and other classes. The attribute importance evaluation was conducted by generating the importance rankings of parcel attributes and identifying sets of important attributes using the “Variable Selection Using Random Forests for interpretation” (VSURF) approach proposed by Genuer et al. [
50].
Aside from the importance of individual parcel attributes, the importance of different categories of attributes was also evaluated. In this paper, four categories of parcel attributes were used for urban land use classification, including spectral/texture, landscape metrics, Baidu POI, and Weibo attributes. Random forests models were built using single categories and different combinations of categories, resulting in four models using one category, six models using two categories, and four models using three categories. Each model was run 50 times to attenuate the uncertainties associated with random forests models, so that more stable mean overall producer’s and user’s accuracies can be derived from the confusion matrices for the testing dataset. These accuracies were compared with the ones acquired using all attributes to evaluate the importance of different categories of parcel attributes in the whole classification and in the classification of individual classes.
3. Results
3.1. Classification Results
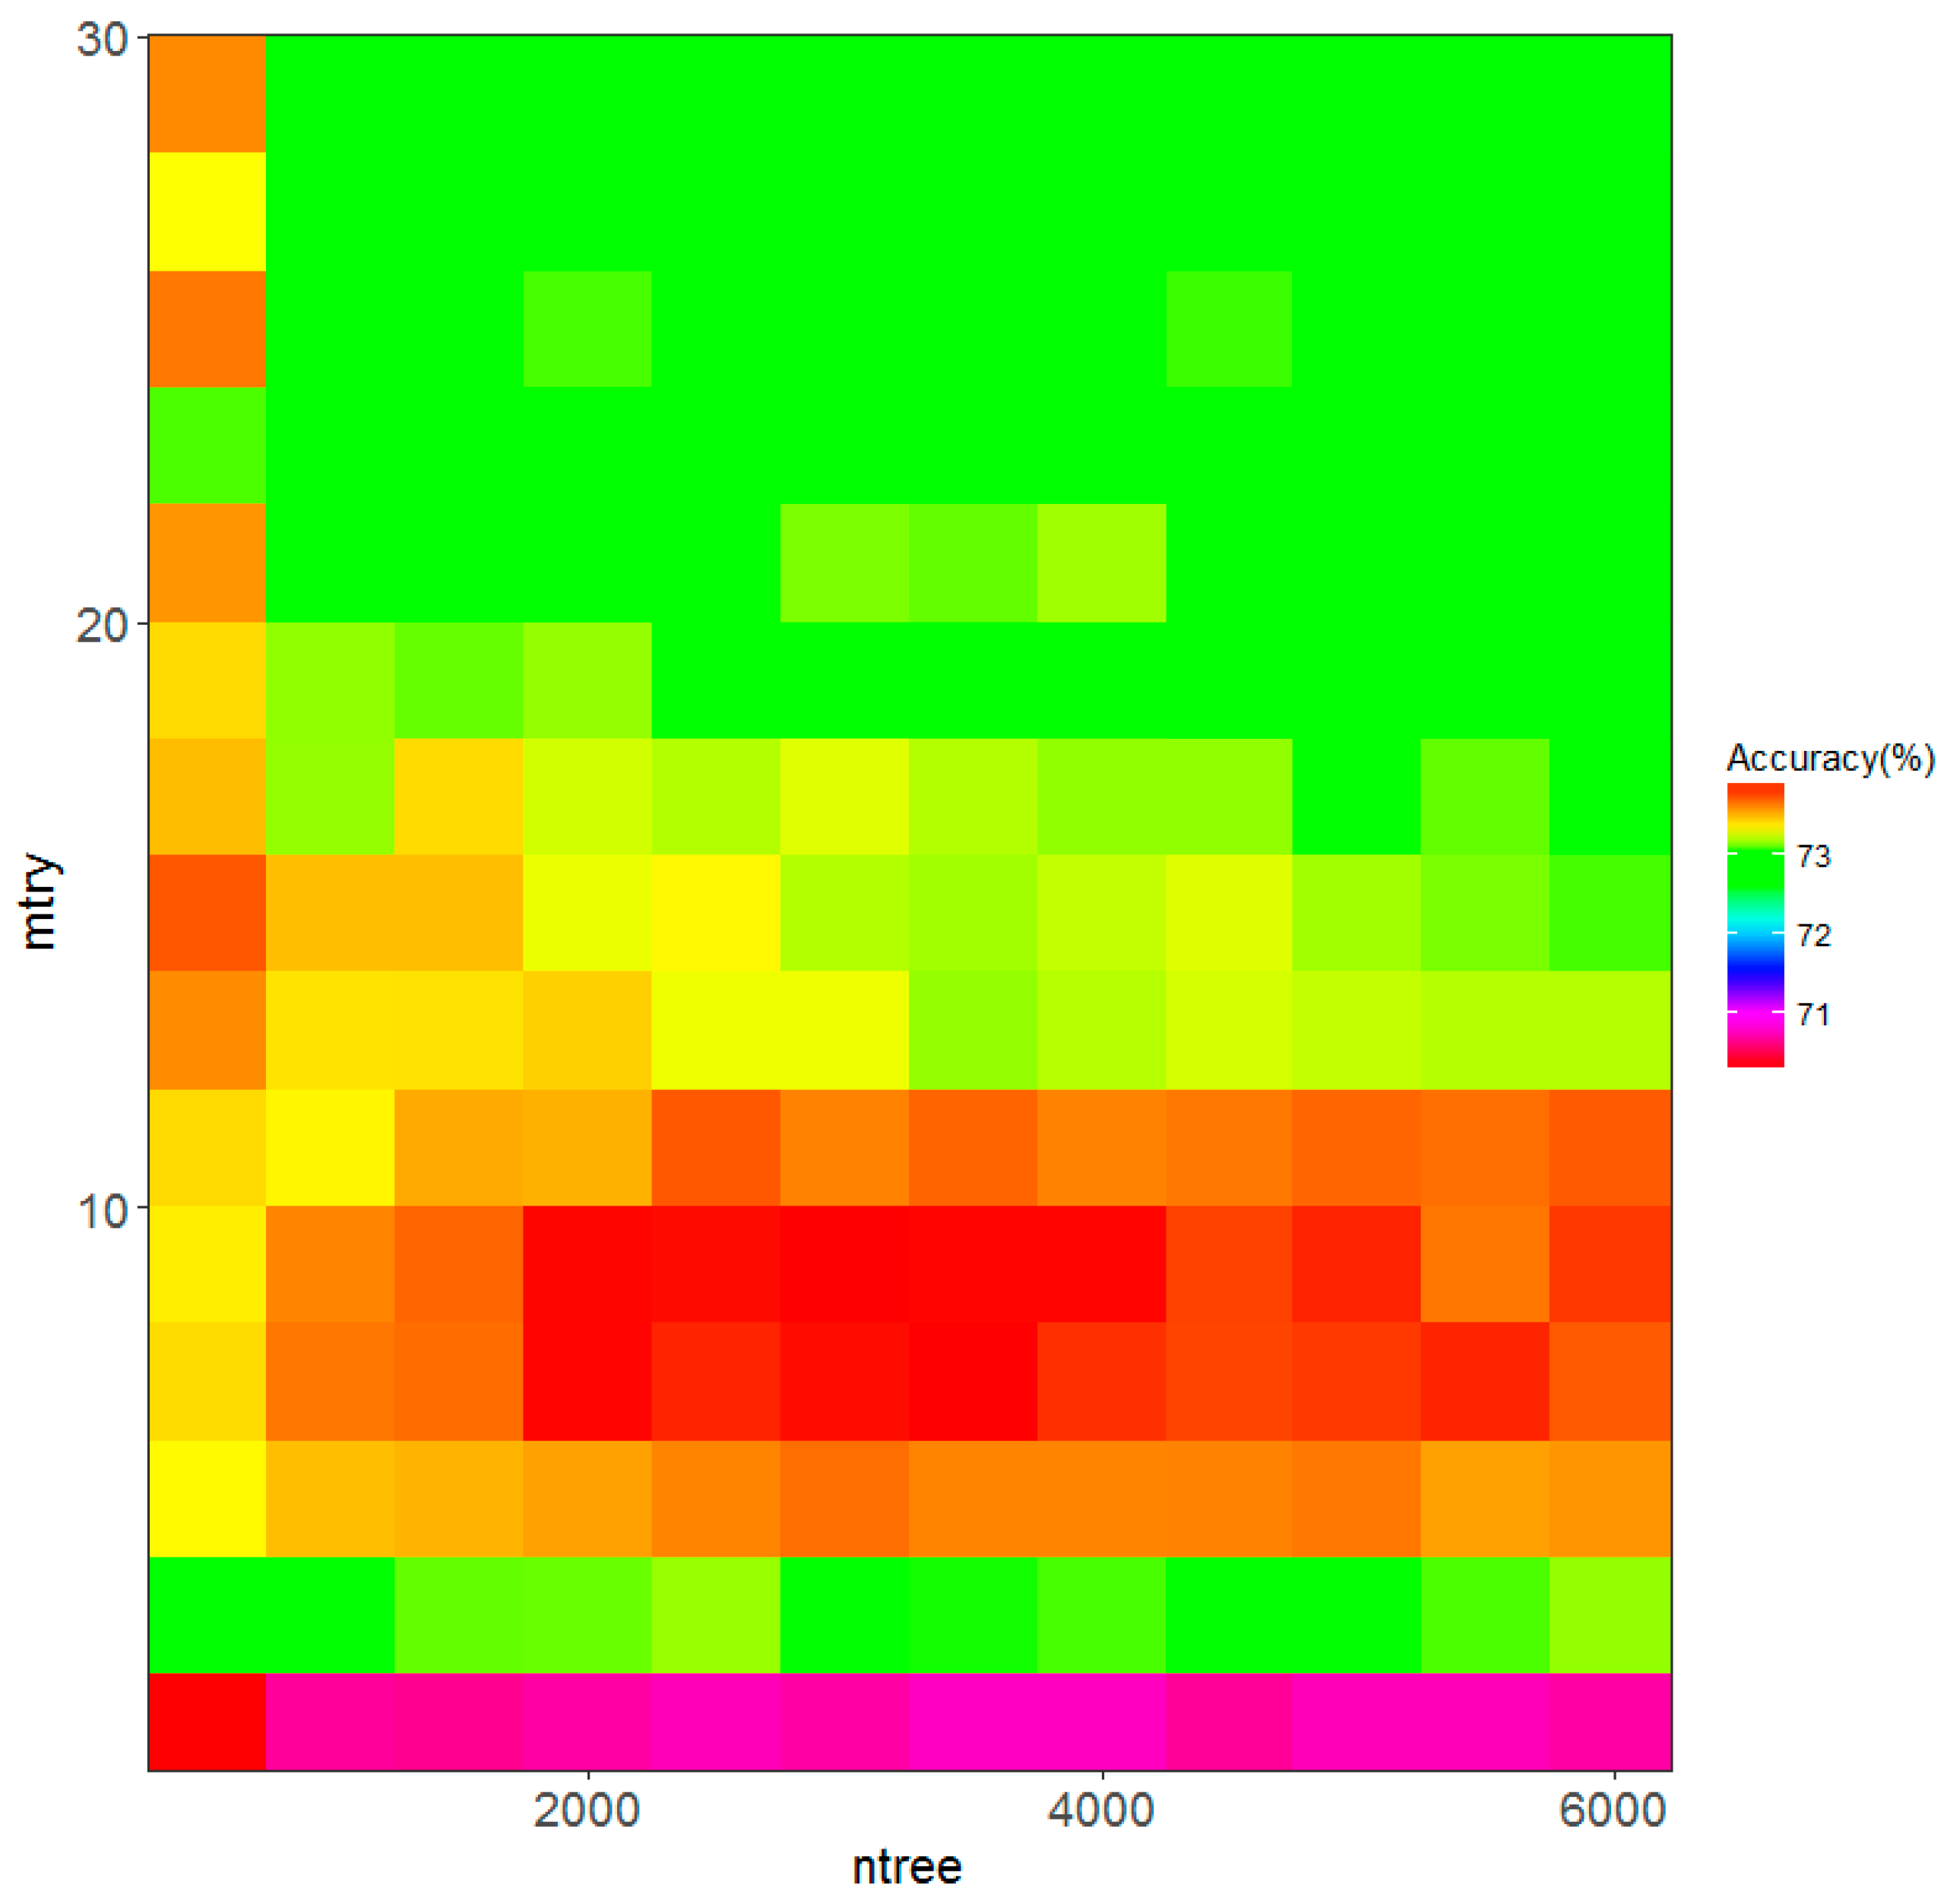
The mean validation accuracy of the random forests models with different combinations of mtry and ntree ranges from approximately 70% to 74%. As indicated by
Figure 3, initially the accuracy increases with a larger ntree, yet tends to stabilize beyond 2000 trees. There exists an optimal range of mtry, and higher accuracies can be achieved when mtry is between 5 and 11. The highest mean validation accuracy appears at mtry = 9 and ntree = 3000. Therefore, this combination of mtry and ntree was used to conduct the urban land use classification within the study area.
The random forests model was built using the training dataset with 432 parcels. The testing dataset with 433 parcels was used to assess the accuracy of the random forests model in mapping fine-grained urban land use in the study area. The OOB accuracy and testing accuracy reaches 72.92% and 77.83%, respectively. It can be noted that the testing accuracy is much higher than the OOB accuracy. This is probably because of the relatively small training dataset [
51]. The confusion matrix for the testing dataset is shown in
Table 3.
Out of the four land use types, open space and residential can be classified relatively well, with both the user’s and producer’s accuracy above 81%. On the other hand, the parcel attributes and classification approaches used in this paper have difficulties in accurately classifying institutional parcels. Some per-field urban land use classification studies have also reported that it is most difficult for institutional parcels to be separated from other urban land use parcels [
2,
7]. The confusion matrix showed that the institutional parcels can be easily confused with residential and business parcels. This is probably because each land use type contains many subtypes, and this heterogeneous nature easily leads to the confusion. For example, some government complexes or universities (institutional parcels) have very similar spectral/texture attributes and landscape metrics with business parks or office parks (business parcels).
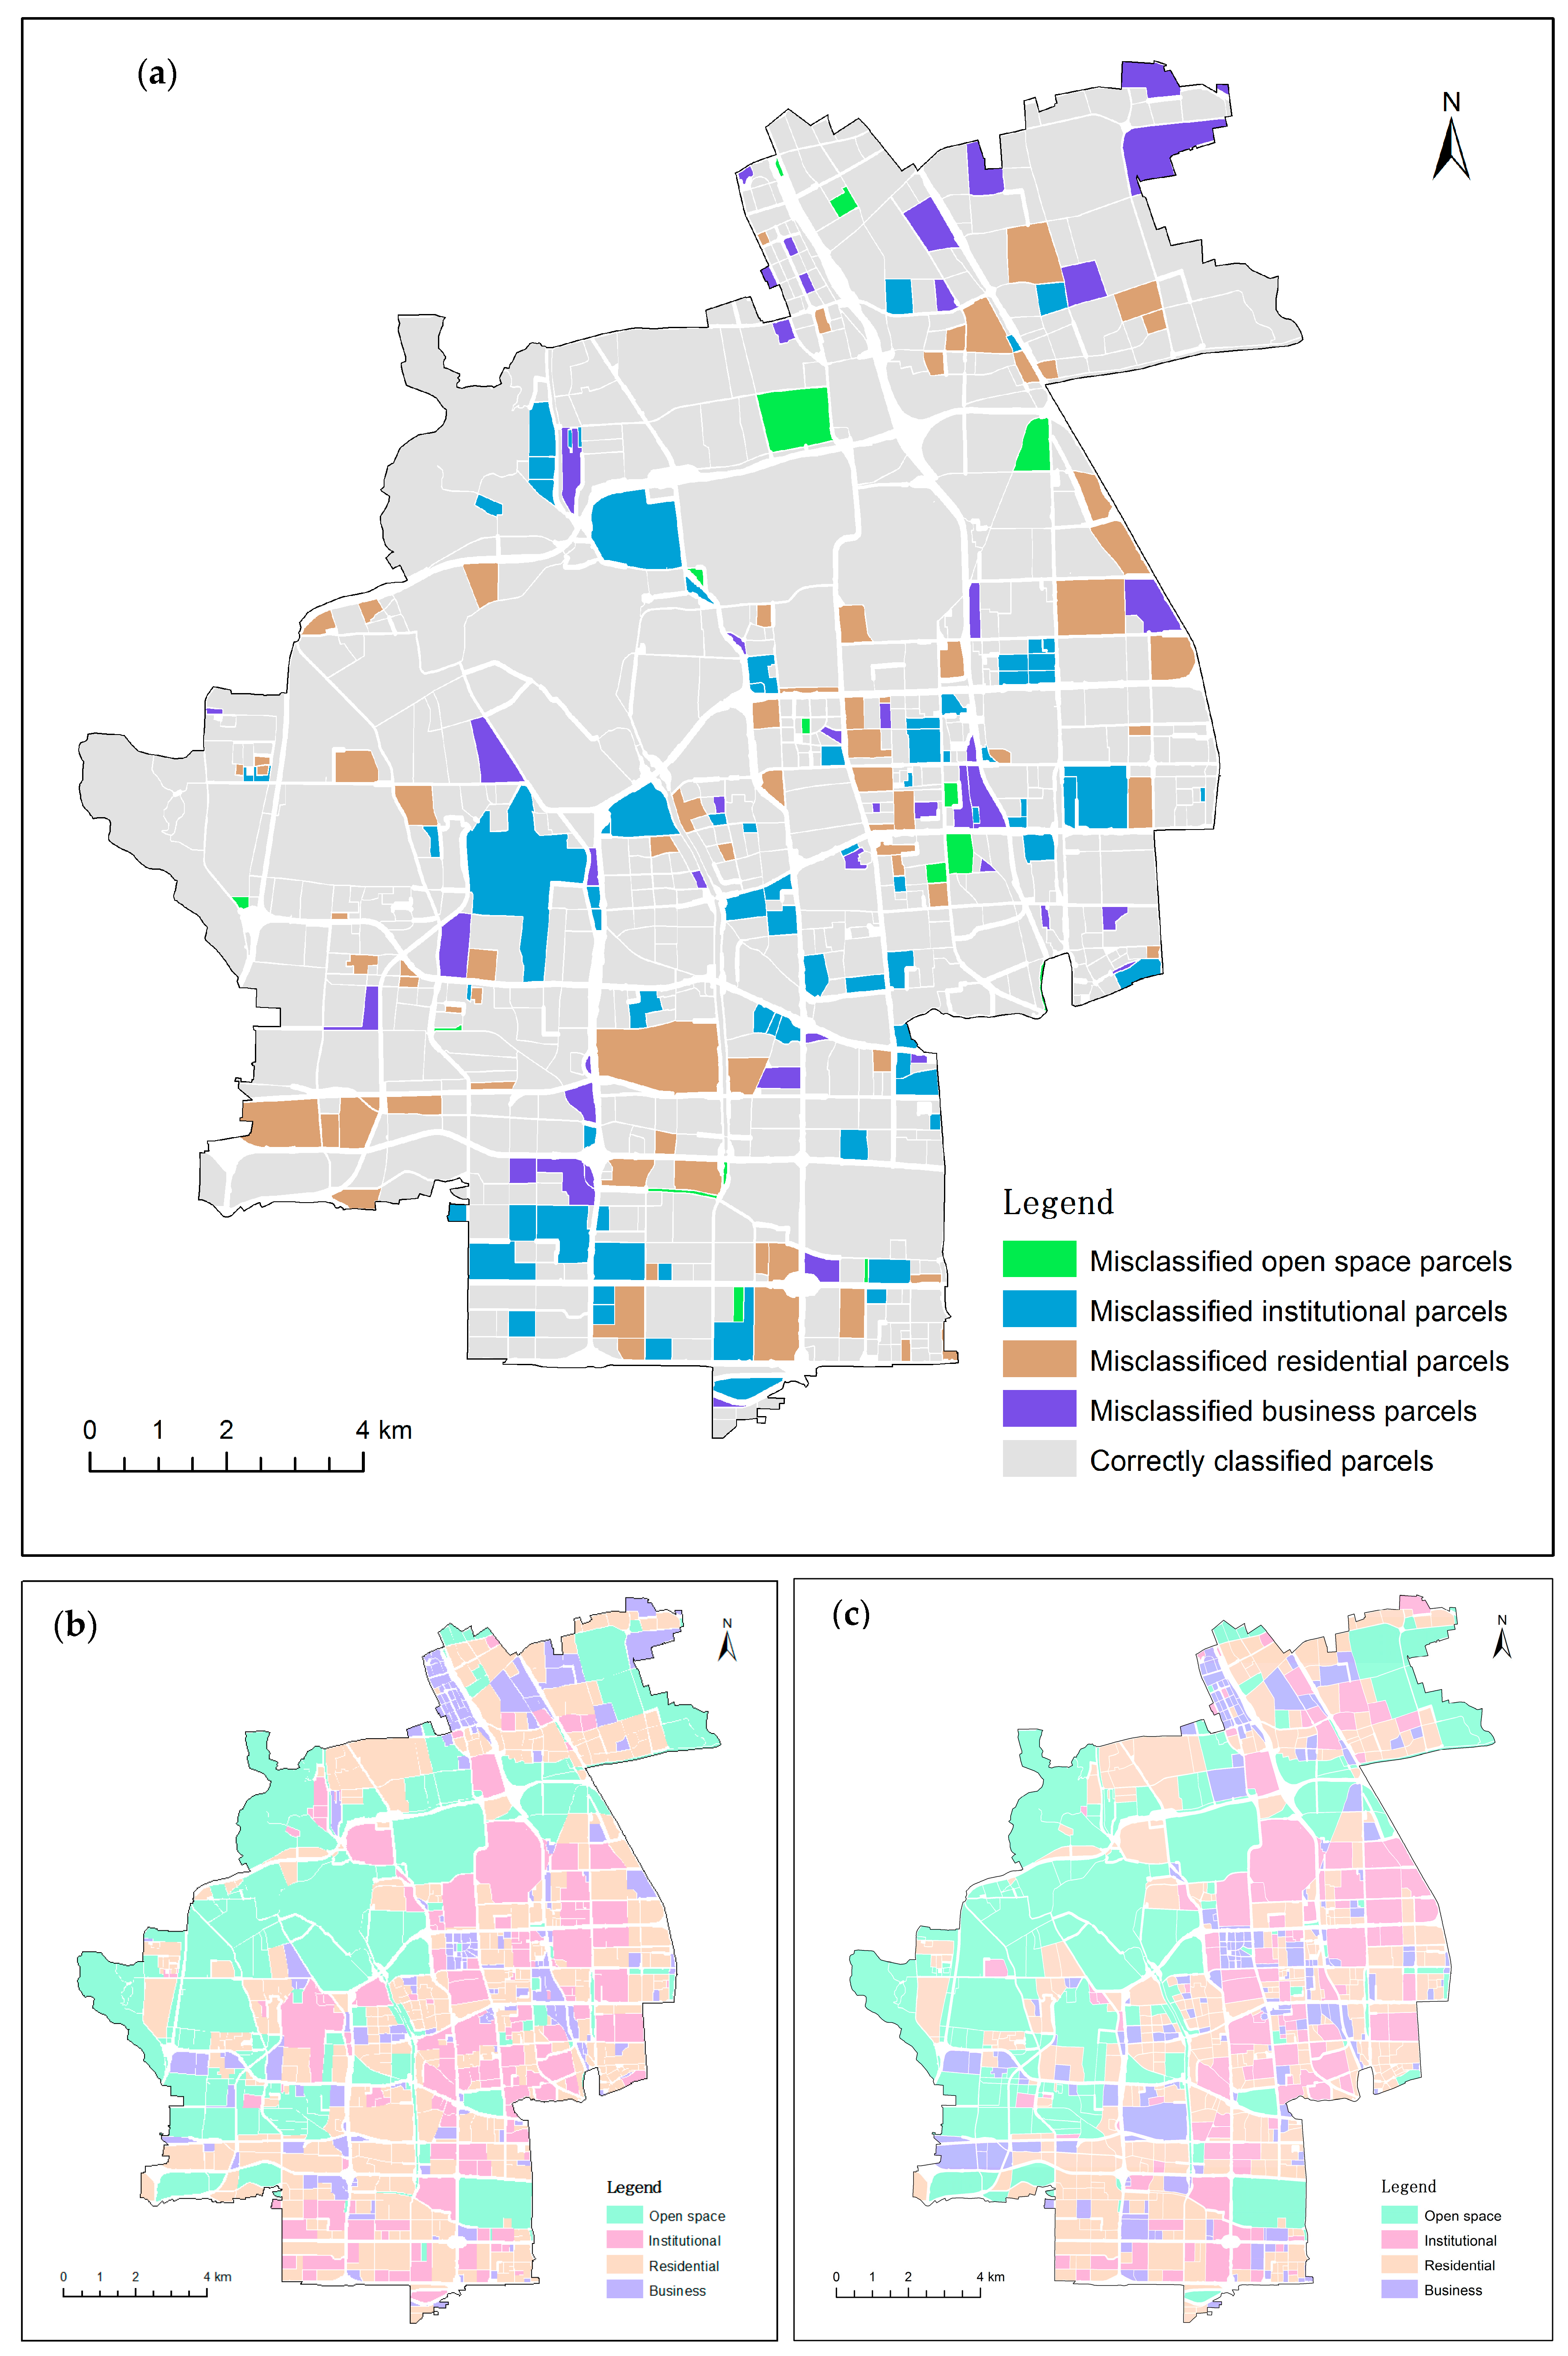
Figure 4 displays the misclassified parcels as well as the actual and predicted land use in the study area. The residential and institutional parcels were interweaved and mostly clustered in the southeastern part of the study area. Another residential concentration is located in the northeastern part. A large connected area of open space is located in the west and between the two residential concentration areas. Business parcels were sporadically distributed across the study area. As shown in
Figure 4a, the misclassified open space parcels were generally much smaller, with a mean parcel area of 0.11 km
2, as compared to 0.36 km
2 for all open space parcels. On the contrary, misclassified business parcels were mostly larger ones, with a mean area of 0.13 km
2 as opposed to 0.08 km
2 for all business parcels. This indicates that it is more difficult for smaller open space parcels and larger business parcels to be accurately classified. Despite the opposite tendencies, the reasons are possibly the same: mixed parcels (parcels with mixed functions). Smaller open space parcels are generally located in more developed areas with dense road networks, and are most likely the combination of small green space and buildings (
Figure S4a). Similarly, it is more likely for larger business parcels to contain other land use types (
Figure S4b). The influence of mixed parcels on the classification accuracy is discussed further in the Discussion section.
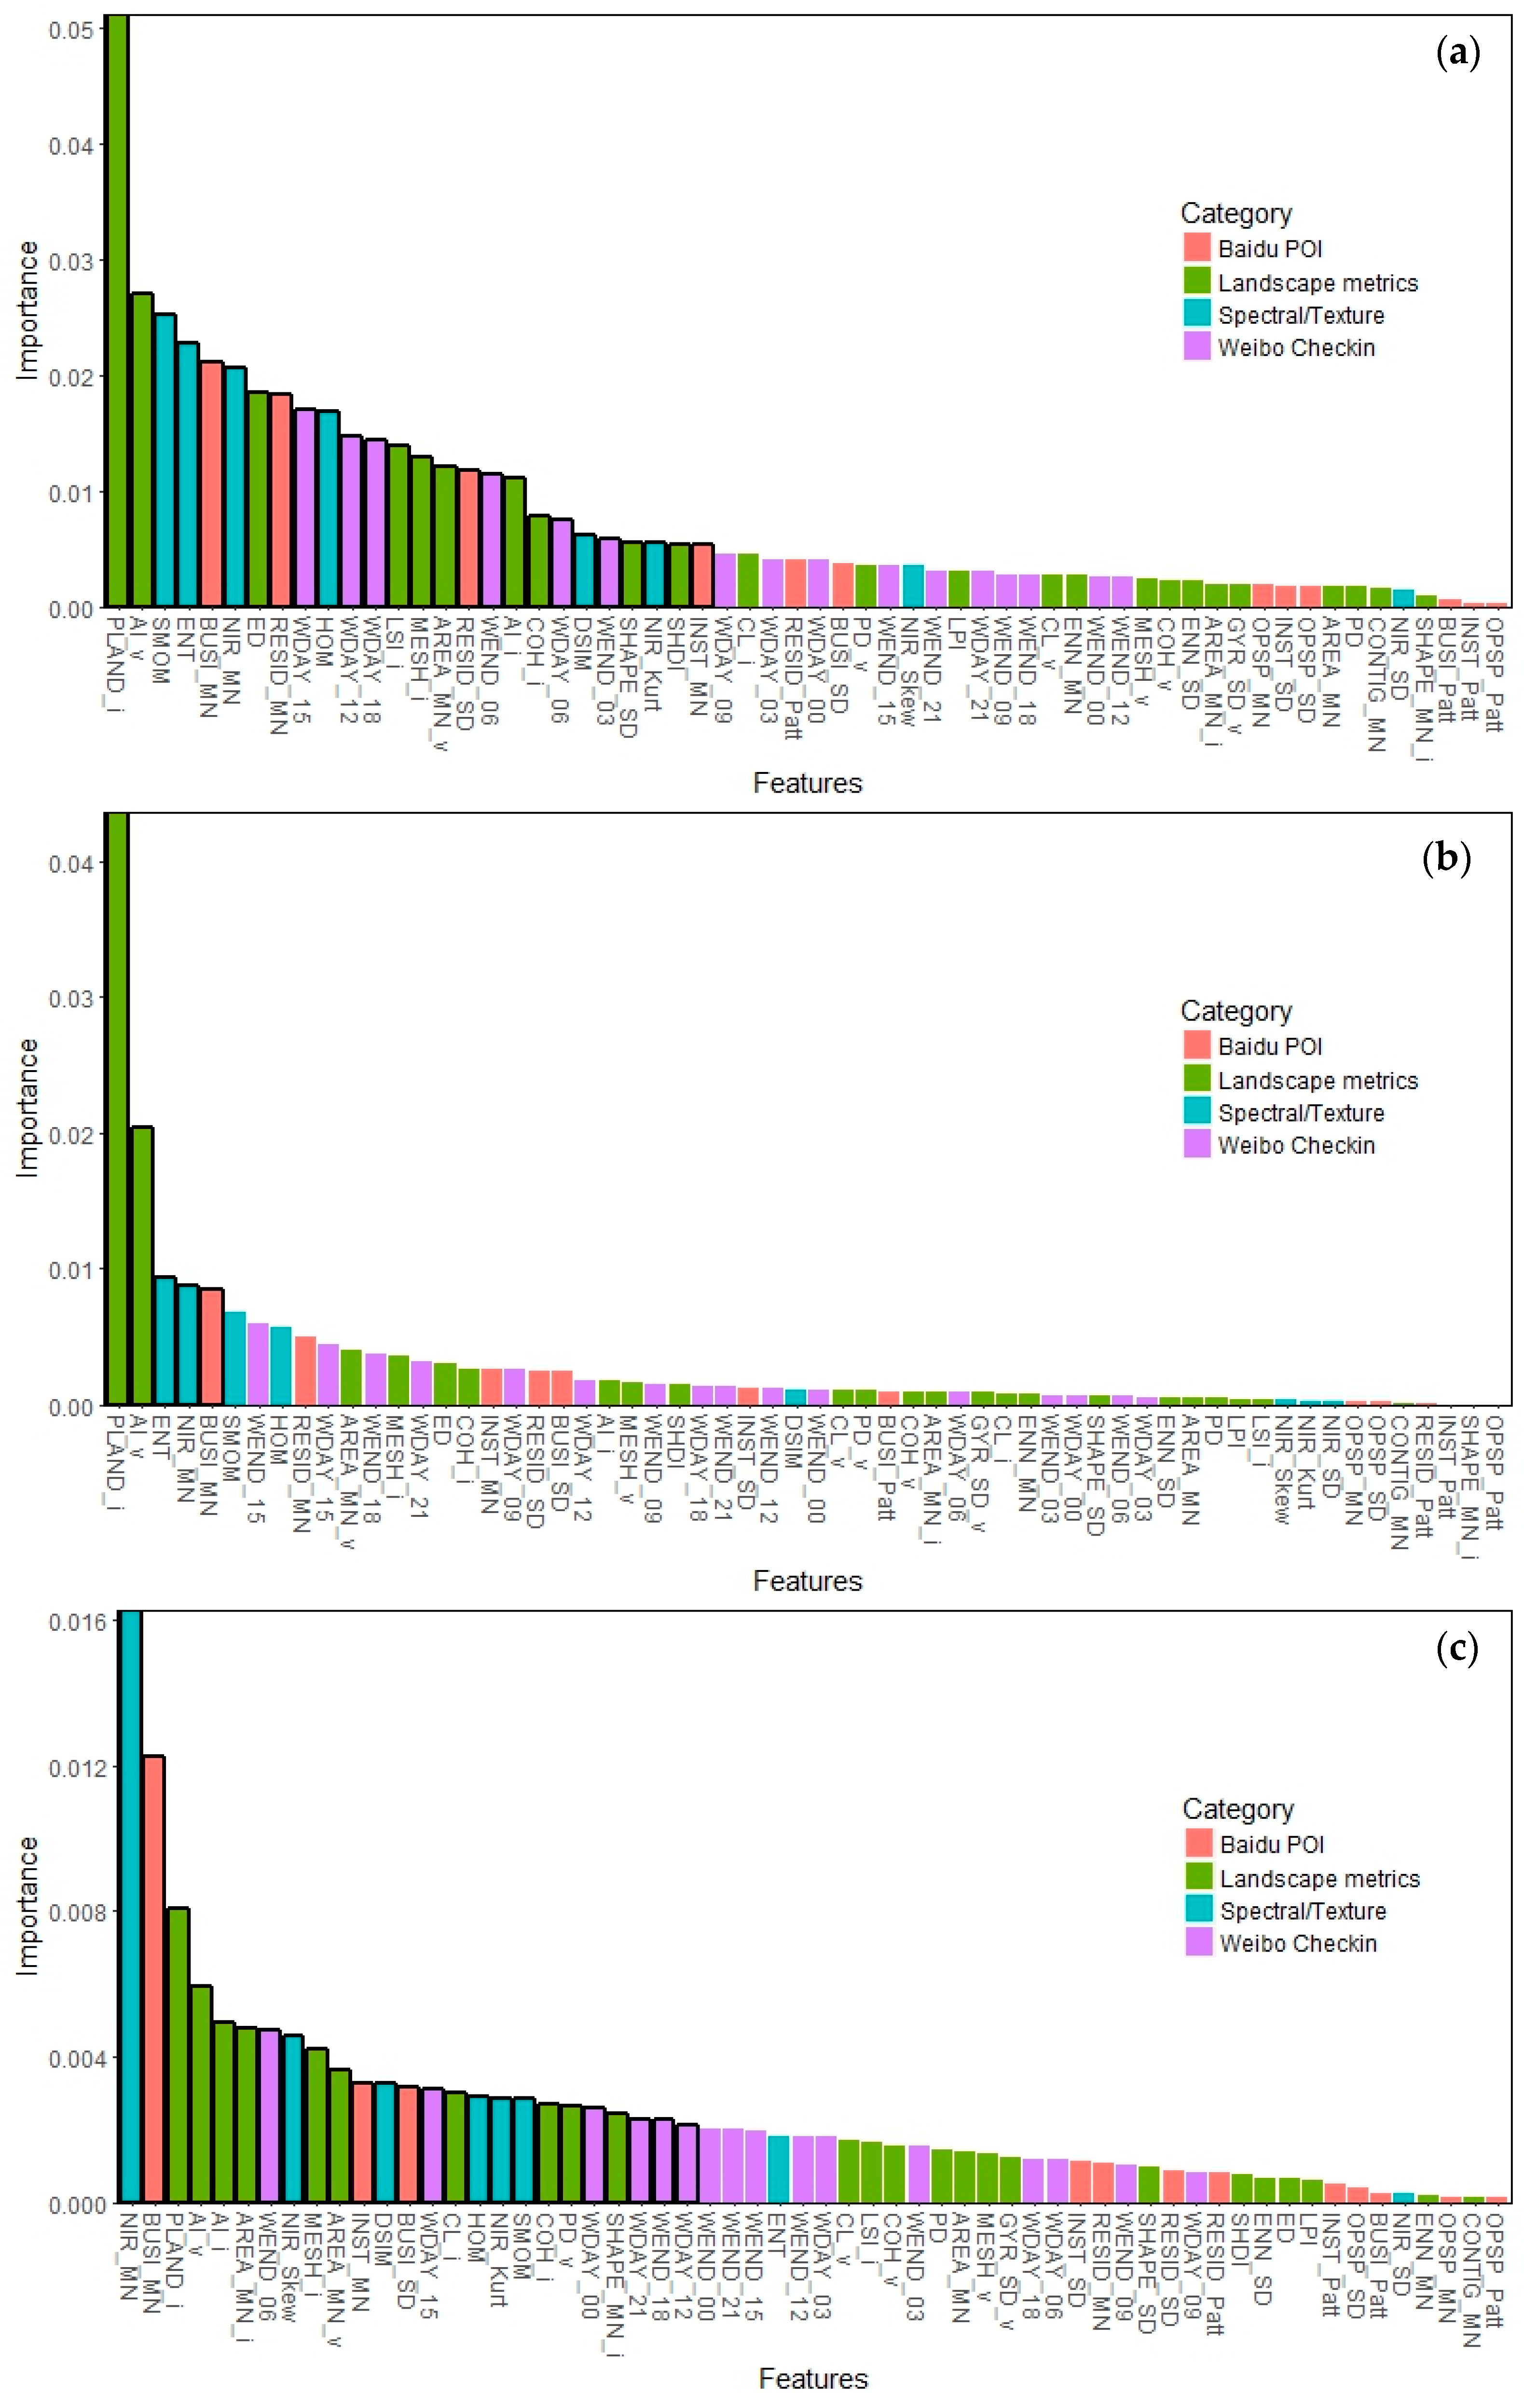
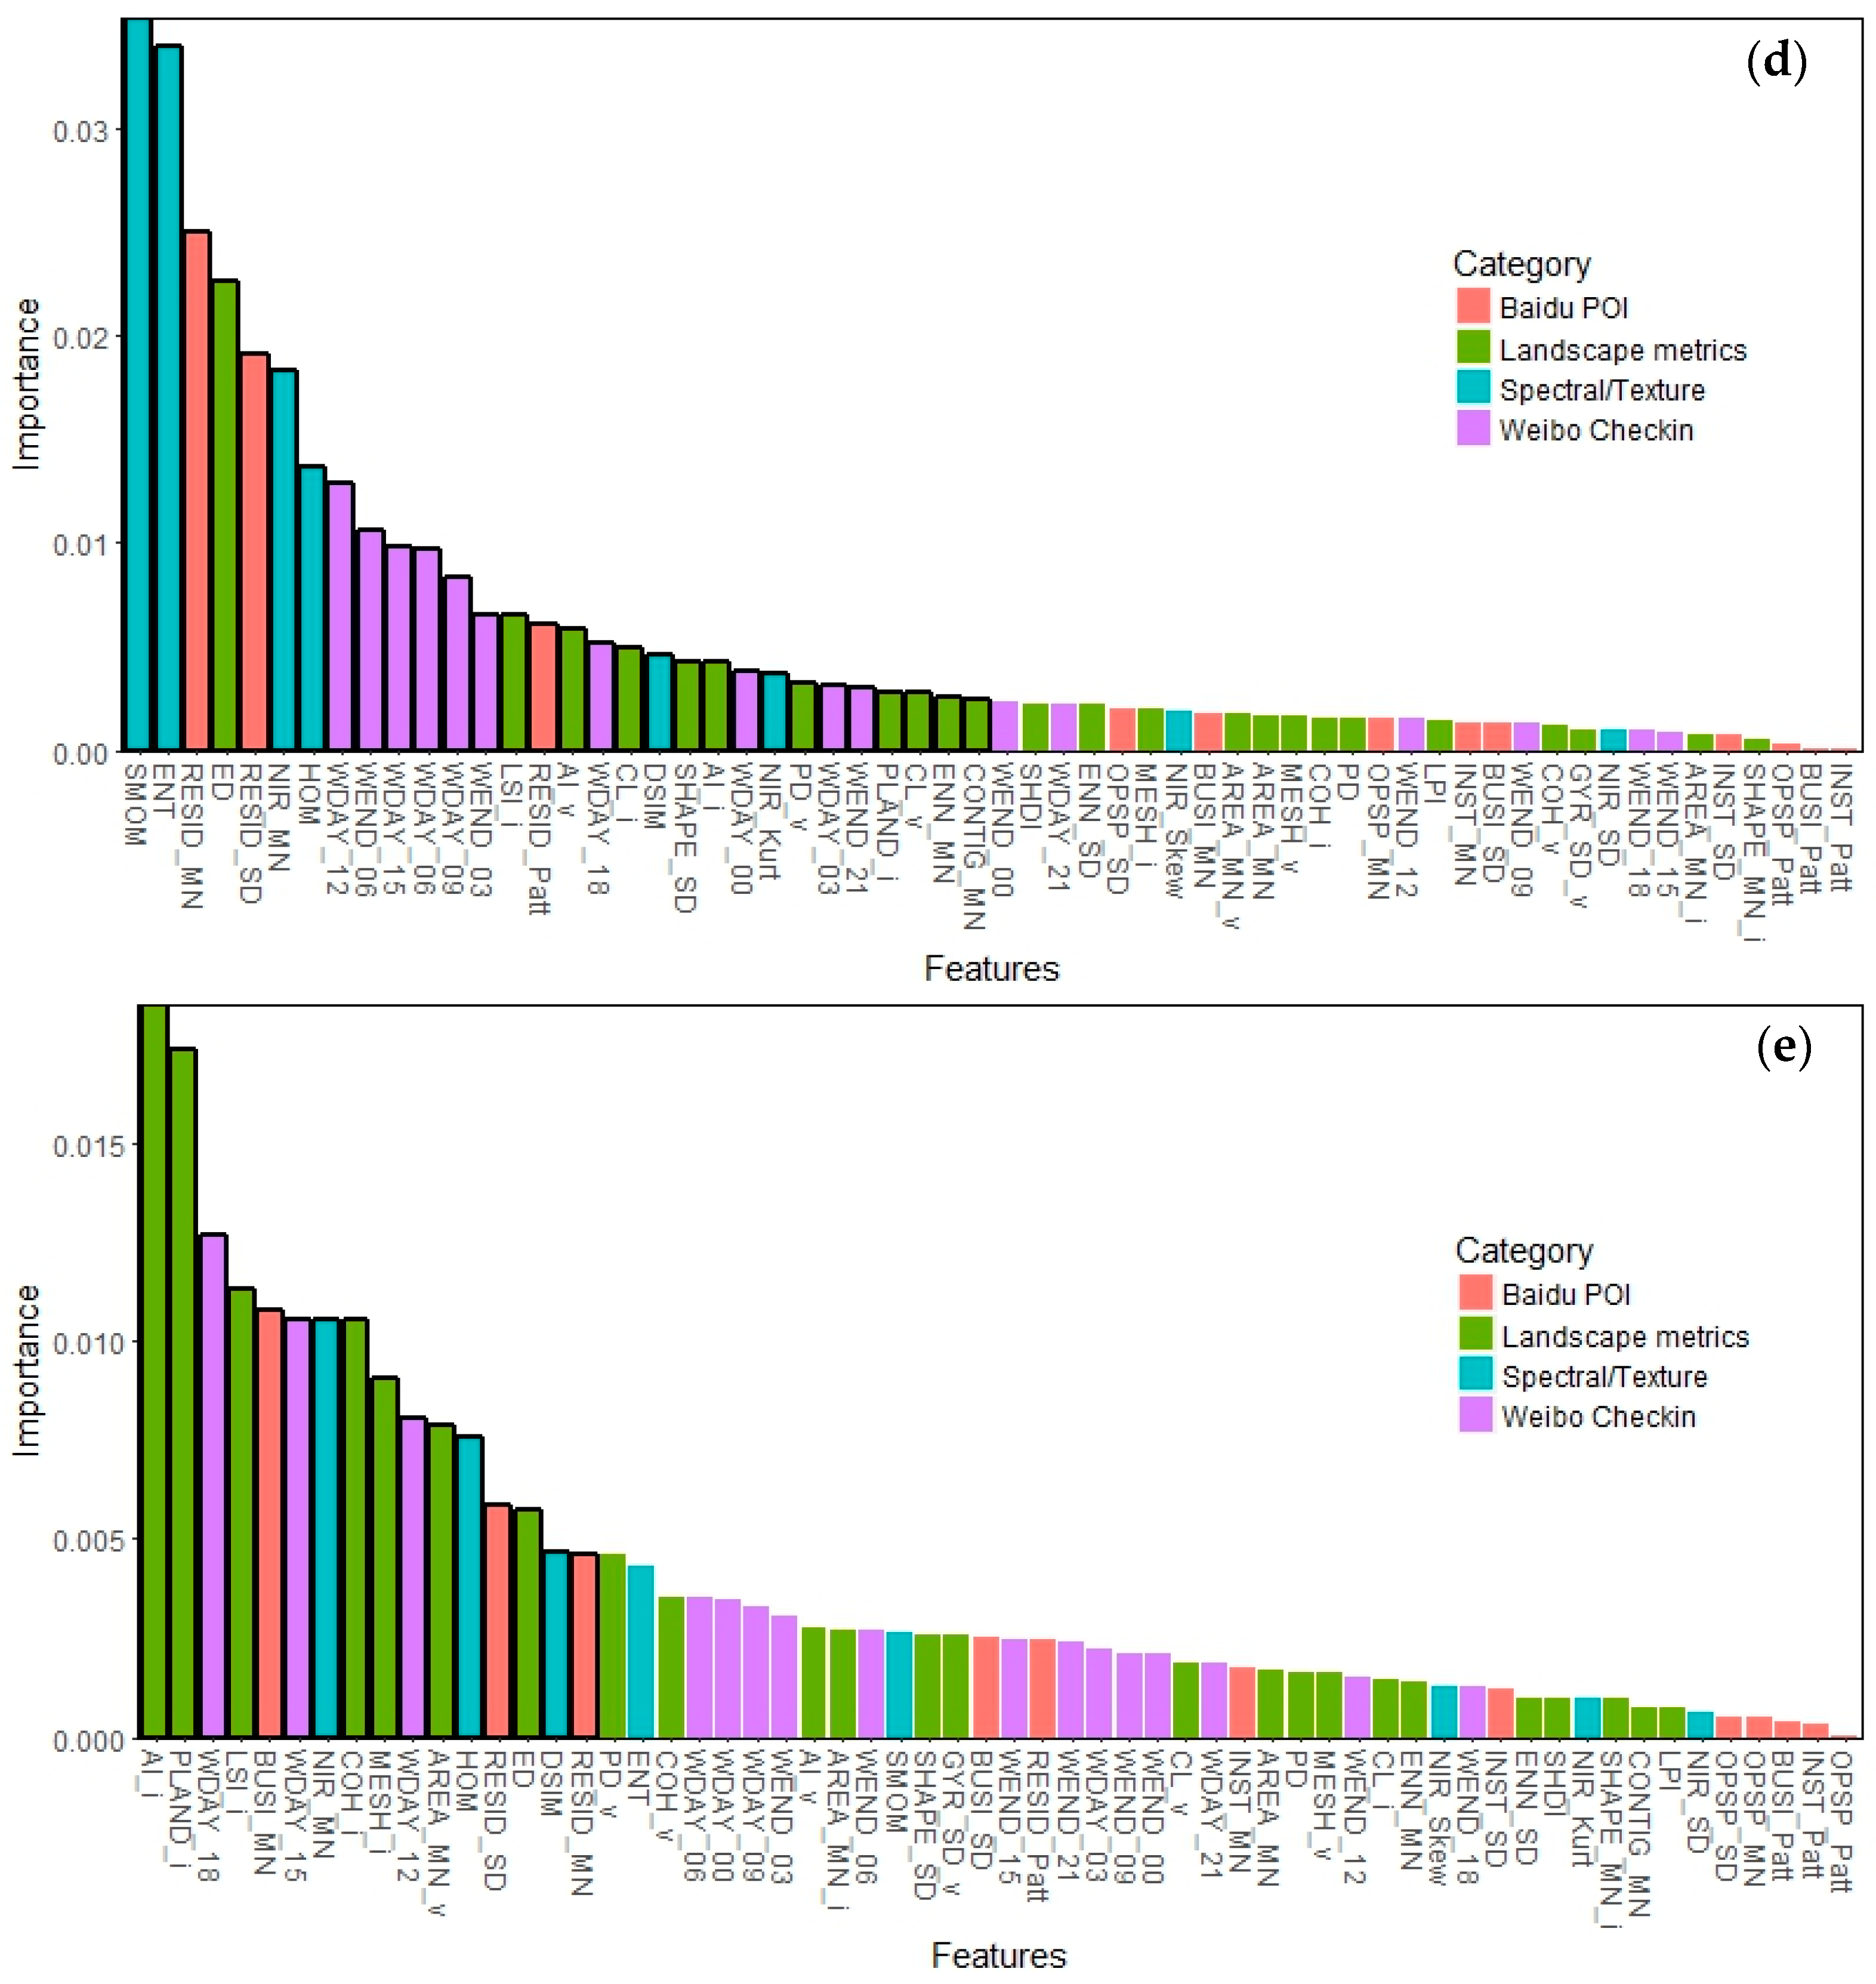
3.2. Rankings of Attribute Importance and Sets of Important Attributes
Figure 5 shows the ordered attribute importance for the whole classification and for the classification of the four individual land use classes. There are a total number of 26 attributes identified as important for urban land use classification by the VSURF approach (
Figure 5a), including 10 landscape metrics, 6 spectral/texture attributes, 3 Baidu POI attributes, and 6 Weibo attributes. The landscape metrics and spectral/texture attributes are much more important than the other two categories of attributes in terms of both the number and rankings of important attributes.
The number of important attributes is the fewest for the classification of open space parcels, including only two landscape metrics, two spectral/texture attributes, and one Baidu POI attribute (
Figure 5b). High accuracies can be achieved using only a limited number of attributes, suggesting that open space parcels are relatively easy to identify. The most important two attributes for the classification of open space parcels are consistent with those for the whole classification, being PLAND_i, and AI_v.
A total number of 25 attributes were identified as important for the classification of institutional parcels. The mean reflectance of the near infrared band is the most important, followed by the mean business POI density and a series of landscape metrics. The most important Weibo attribute is the Weibo post density between 06.00 and 09.00 on weekends, with a ranking of 7. Intriguingly enough, the classification of intuitional parcels relies more on business POIs than on institutional POIs. This can be attributed to the unbalanced distribution of the number of POIs among different categories. The number of institutional POIs is much lower than that of business POIs, and many institutional parcels are associated with only a limited number of institutional POIs. This attenuates the ability of institutional POIs to discriminate between institutional and non-institutional parcels.
The classification of residential parcels relies mainly on spectral/texture attributes, with six out of eight spectral/texture attributes regarded as important. Weibo attributes stand out in the classification of residential parcels, with 10 out of all 16 regarded as important. Notably and interestingly, the more important Weibo attributes (with rankings from 8 to 13) cover two continuous periods of 03:00 to 09:00 on weekends and 06:00 to 18:00 on weekdays, i.e., early morning on weekends and daytime on weekdays, indicating that these time periods are important in distinguishing residential parcels from other parcels. Landscape metrics are less important for identifying residential parcels than other parcels. As expected, the three POI attributes identified as important are the three residential POI attributes, demonstrating the importance of residential POI attributes in classifying residential parcels.
Business parcels have 16 important attributes. Landscape metrics are the most important with the top two attributes and 7 out of 16 important attributes being landscape metrics. Five out of the seven important landscape metrics are class-level ones computed for impervious surface patches, indicating that the landscape pattern of an impervious surface is important for identifying business parcels. Spectral/texture attributes are not as important in the classification of business parcels. Weibo attributes reach the highest ranking of 3 among all land use types. The three Weibo attributes included in the set of important attributes cover a time period of 12:00 to 21:00 on weekdays, indicating the spatiotemporal pattern of Weibo user activities during weekday afternoons and evenings is important in separating business parcels from other ones.
3.3. Importance of Attribute Categories
Table 4 shows the overall producer’s and user’s accuracies of classifications using different combinations of attribute categories. The last row in
Table 4 shows the testing accuracies of the random forests models using all four categories of attributes (full model) consistently with
Table 3. To facilitate the comparisons, the rows above present the deviation of the accuracies of one-, two-, and three-attribute-category models (subset models) from the corresponding accuracies derived using all attributes. Generally, the addition of new attribute categories increases the overall accuracy: the overall accuracy deviations of the one-, two-, and three-attribute-category models are −11% to −19%, −6% to −9%, and −4% to −5%, respectively. This indicates that each of the four attribute categories is useful in the per-field urban land use classification.
The deviations of producer’s and user’s accuracies for the individual land use classes as influenced by different category combinations vary more widely than those of the overall accuracy. This indicates that the divergent influence of different categories is more pronounced on the classification of individual classes. Landscape metrics are of ultimate importance to the classification of open space parcels, as the inclusion of them can dramatically increase both the producer’s and user’s accuracies. Spectral/texture attributes are important for the classification of institutional and residential parcels, while they are the least important for business parcels.
While using only remote sensing data and only social sensing data can achieve comparable overall accuracies (with the accuracy deviations being −8% and −9% for combinations 5 and 10), the importance of remote sensing and social sensing data in classifying different urban land use types varies as can be deduced from
Table 4. Remote sensing data are noticeably more important than social sensing data for open space parcels, and are slightly less important for institutional data, as they lead to a slightly lower user’s accuracy. Remote sensing data is more important in reducing the false positives for residential parcels and false negatives for business classes, while the effects of social sensing data behave in the opposite way.
4. Discussion
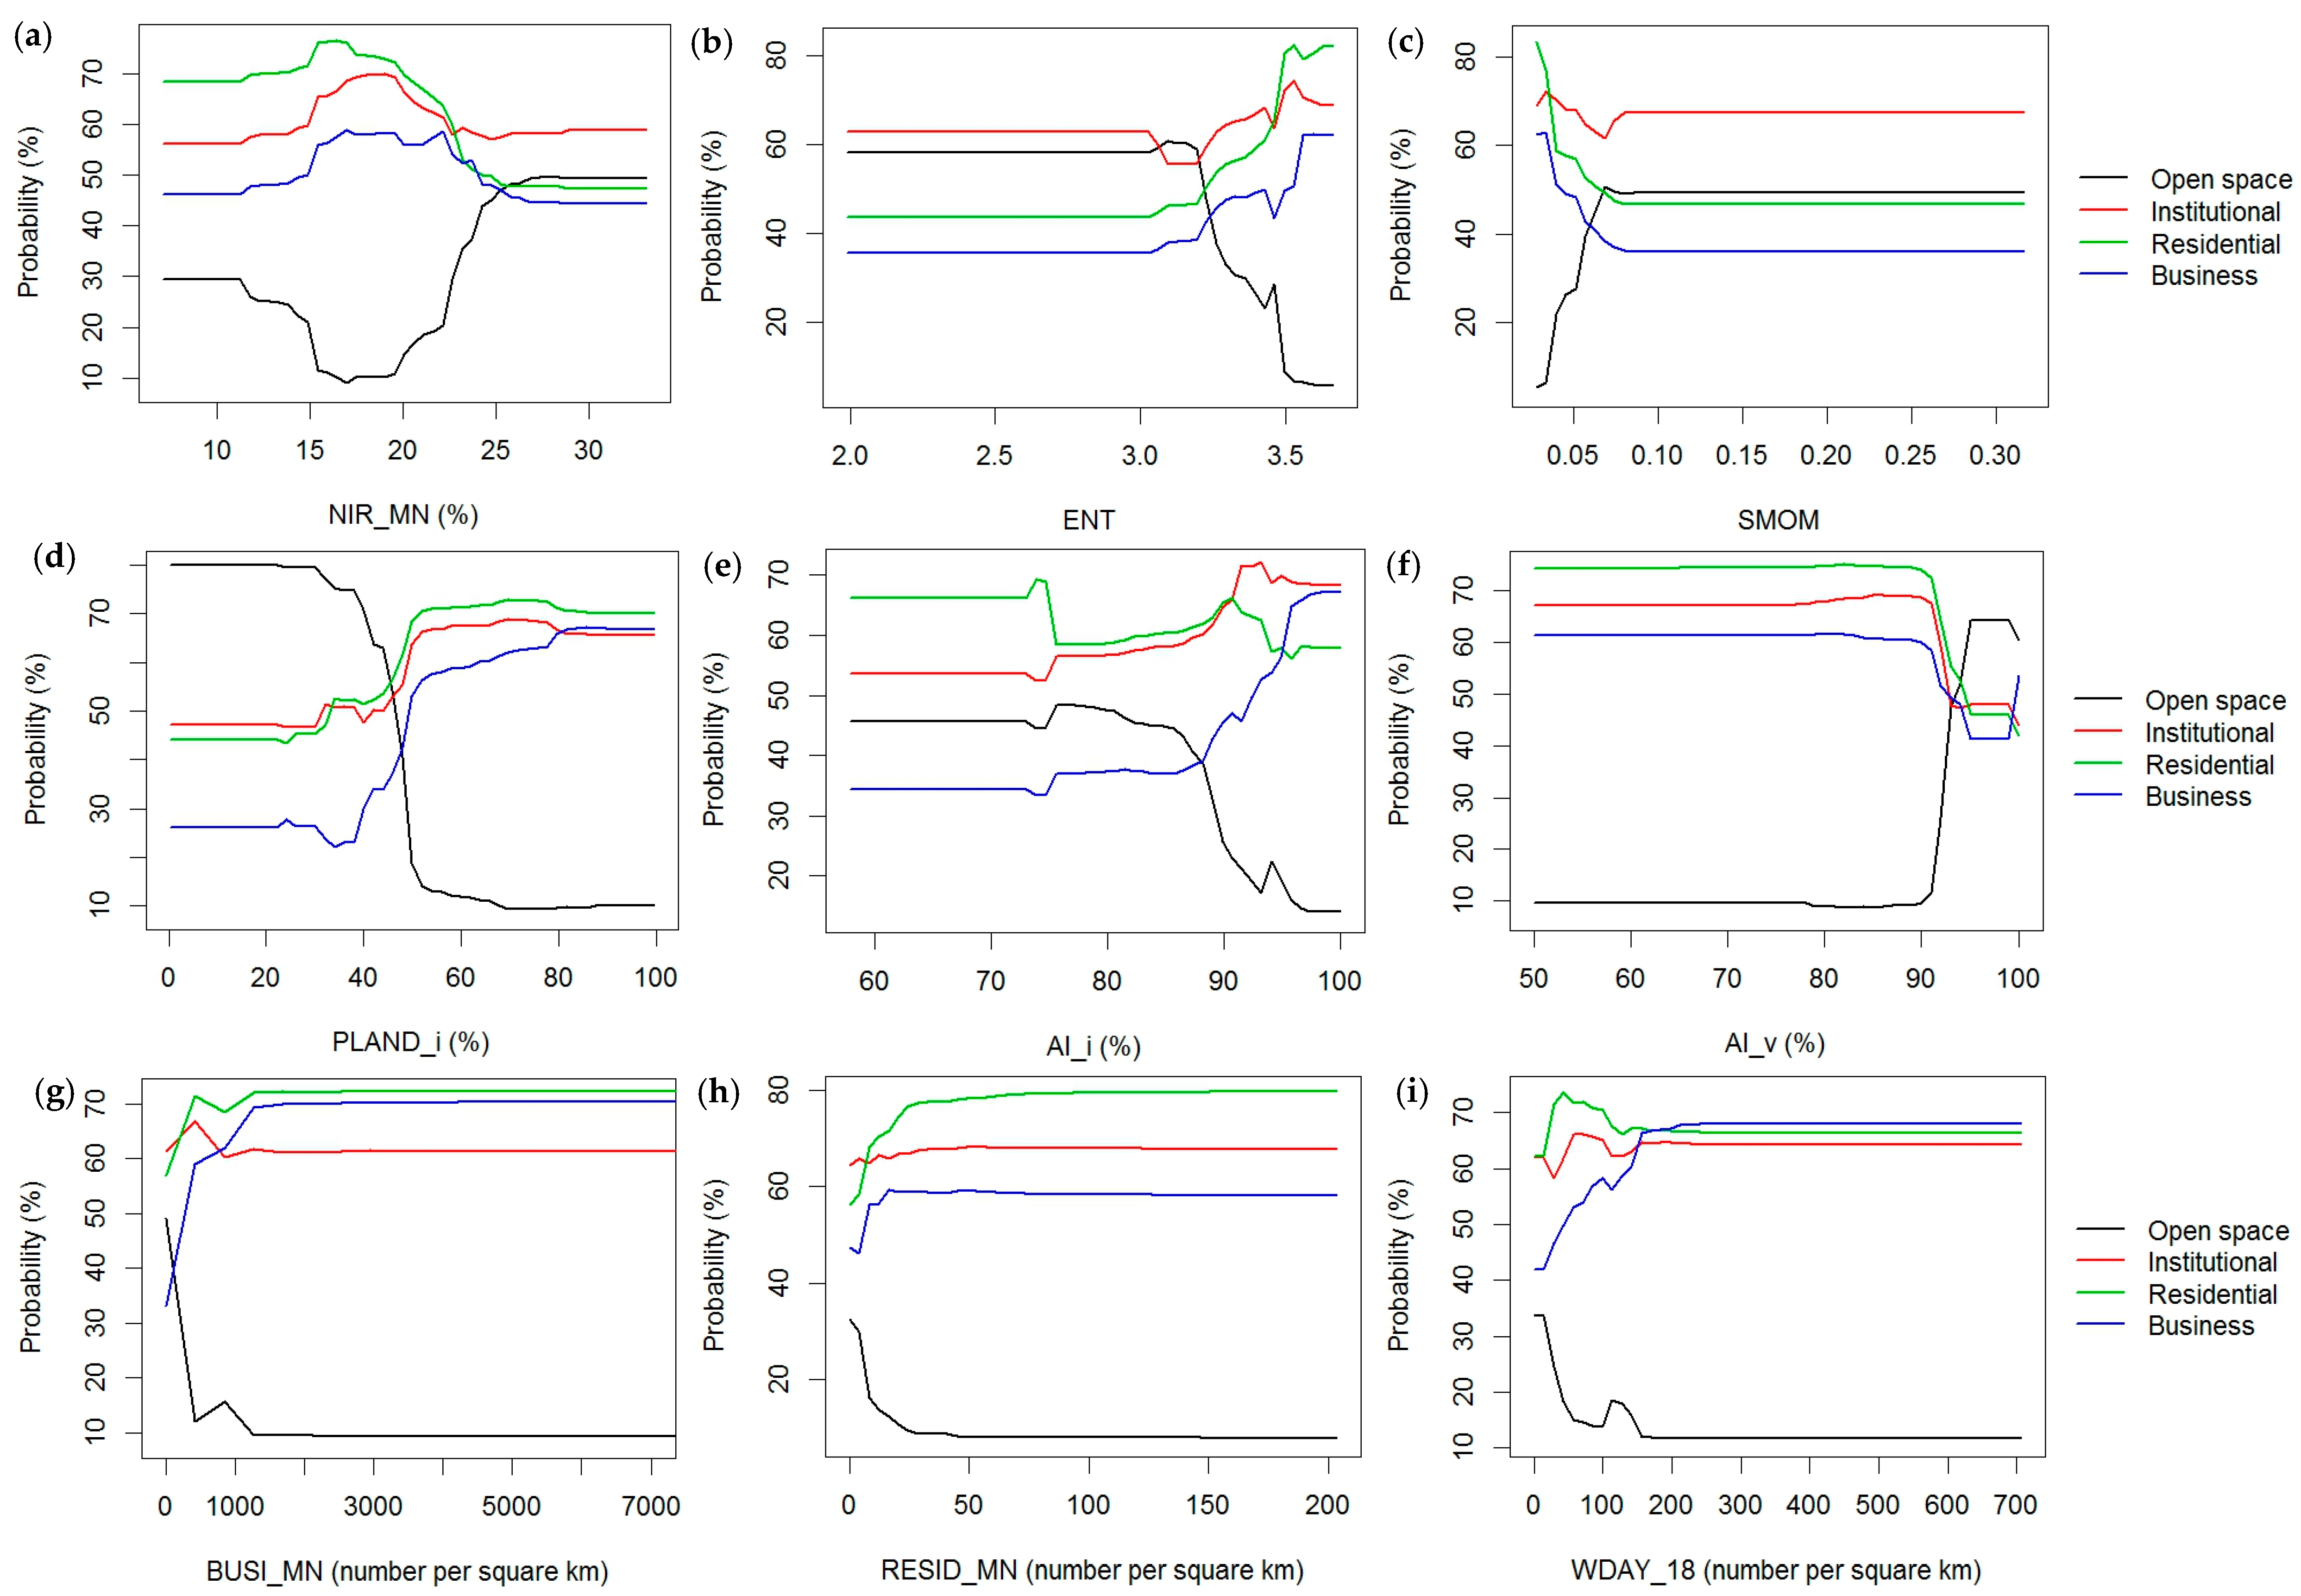
4.1. Marginal Effects of Important Parcel Attributes
As analyzed in
Section 3.2 and
Section 3.3, the improved classification of different land use types is dependent on different parcel attributes belonging to different categories. In this section, a partial dependence plot was used to further analyze the probability of a parcel being classified as a particular land use type as influenced by different parcel attributes [
47,
52].
Figure 6 illustrates the partial dependence plots of the three most important attributes for the classification of the four individual classes.
As suggested by both
Figure 5 and
Table 4, the landscape metrics are the most important for the classification of open space parcels. Specifically, PLAND_i and AI_v, as two landscape metrics, are the two most important attributes. When the percentage of impervious surface of a parcel is below 30%, there is about an 80% probability for this parcel to be classified as open space. On the other side, when PLAND_i is above 50%, it is much less likely for this parcel to be classified as open space. It is also favorable for a parcel to be classified as open space if the vegetation patches within it are highly aggregated. The third important attribute, entropy, makes sure that a parcel with high entropy values (>3.5) can be concluded as non-open space with great certainty. A careful examination of the partial dependent plots reveals that there always exists an optimal range for all nine attributes that can separate open space and other parcels very well (i.e., the range with highly different probabilities between open space and other parcels), which explains the much higher accuracy associated with open space parcels.
The probability range for institutional parcels is among the smallest, indicating that the variations of attributes used in this paper cannot discriminate institutional parcels very well. For example, the probability of a parcel being classified as institutional ranges from about 60% to 70% at different values of second moment, while the range is from less than 10% to about 50% for open space parcels. Spectral/texture attributes appear to be the most important category, while NIR_MN, as one of the spectral/texture attributes, is the most important single attribute. The probability of a parcel being classified as institutional is the highest (about 70%) when the near infrared reflectance is between about 15% and 20%. However, the probability is almost equally high for the parcel to be classified as residential within this range of the near infrared reflectance. Explicitly, this range has a high probability and a low separability for the institutional class. Though Baidu POI appears to be a less important category, the mean kernel density of business POIs ranks second. However, the second important attribute cannot identify business parcels very well, as the probability only ranges from about 60% to 67%. The partial dependence curve of the third important attribute, PLAND_i, for institutional parcels is almost identical to that for residential ones, indicating that PLAND_i has limited separability between institutional and residential parcels. The small probability range and low separability of the parcel attributes caused the low accuracies associated with the institutional parcels.
Spectral/texture and Baidu POI attributes are more important for residential parcels. Two texture attributes and one Baidu POI attribute constitute the three most important attributes. It is most likely for a parcel to be classified as residential at very low values of second moment and very high values of entropy, with probabilities of more than 80%. Naturally, a parcel with higher residential POI densities is more likely to be classified as residential.
The top three most important attributes for business parcels include two landscape metrics and one Weibo attribute. The partial dependence curves of AI_i and PLAND_i indicate that business parcels are expected to be associated with a high proportion of impervious surface area and highly aggregated impervious surface patches. It is more likely for a parcel with a higher population density between 18:00 and 21:00 during weekdays to be classified as a business parcel. The plots for all three of the most important attributes share a similar pattern. That is, the probability for business parcels is much lower at small values of these attributes as compared with those for institutional and residential parcels. This indicates that it is more likely for a parcel to be identified as non-business in these situations.
4.2. Issues Associated with Road-Segmented Parcels
There are inherent drawbacks with parcels generated using a road network. The quality of the final segmented parcels is highly dependent on the quality and intensity of the road network. In sum, both over-segmentation and under-segmentation can cause various issues impeding parcels from being correctly classified.
Parcels segmented by roads may be associated with the partial function issue. This was caused by a complete parcel being segmented into several individual subparcels with only partial functions. This is usually associated with the over-segmentation or the function separation phenomenon itself in reality. For example, a university may be segmented into several parcels by roads (an example of Peking University shown in
Figure S4c. One parcel may be composed mainly of student, staff, and faculty housing, and another composed of teaching and administration facilities. That is, each parcel only has partial function of the university. While the actual land use type of these parcels is identified as institutional because they all belong to a university, they can be wrongly classified as other types because they may have similar attributes with business or residential parcels.
An opposite issue to over-segmentation is under-segmentation. This may be caused by the data quality of the road network, i.e., sparse road networks (
Figure S4d). Under-segmentation is also associated with the fact that parcels are not necessarily separated by road networks in reality, but rather walls, fences, trees, or even nothing. This is an even harder situation to handle than sparse road networks, because these non-road boundaries are seldom associated with Geographical Information System (GIS) data, and can be hardly identified using remotely sensed images. Under-segmentation makes mixed parcels (parcels with mixed functions) an inevitable issue in automatic per-field urban land use classification. Mixed parcels may not exhibit the attributes of their majority function, but rather the attributes of another function. Because the actual land use type is identified as the majority type, the mixed parcels are expected to be a major issue influencing classification accuracy. The next section focuses on evaluating the influence of mixed parcels on classification accuracy.
4.3. Influence of Mixed Parcels on Classification Accuracy
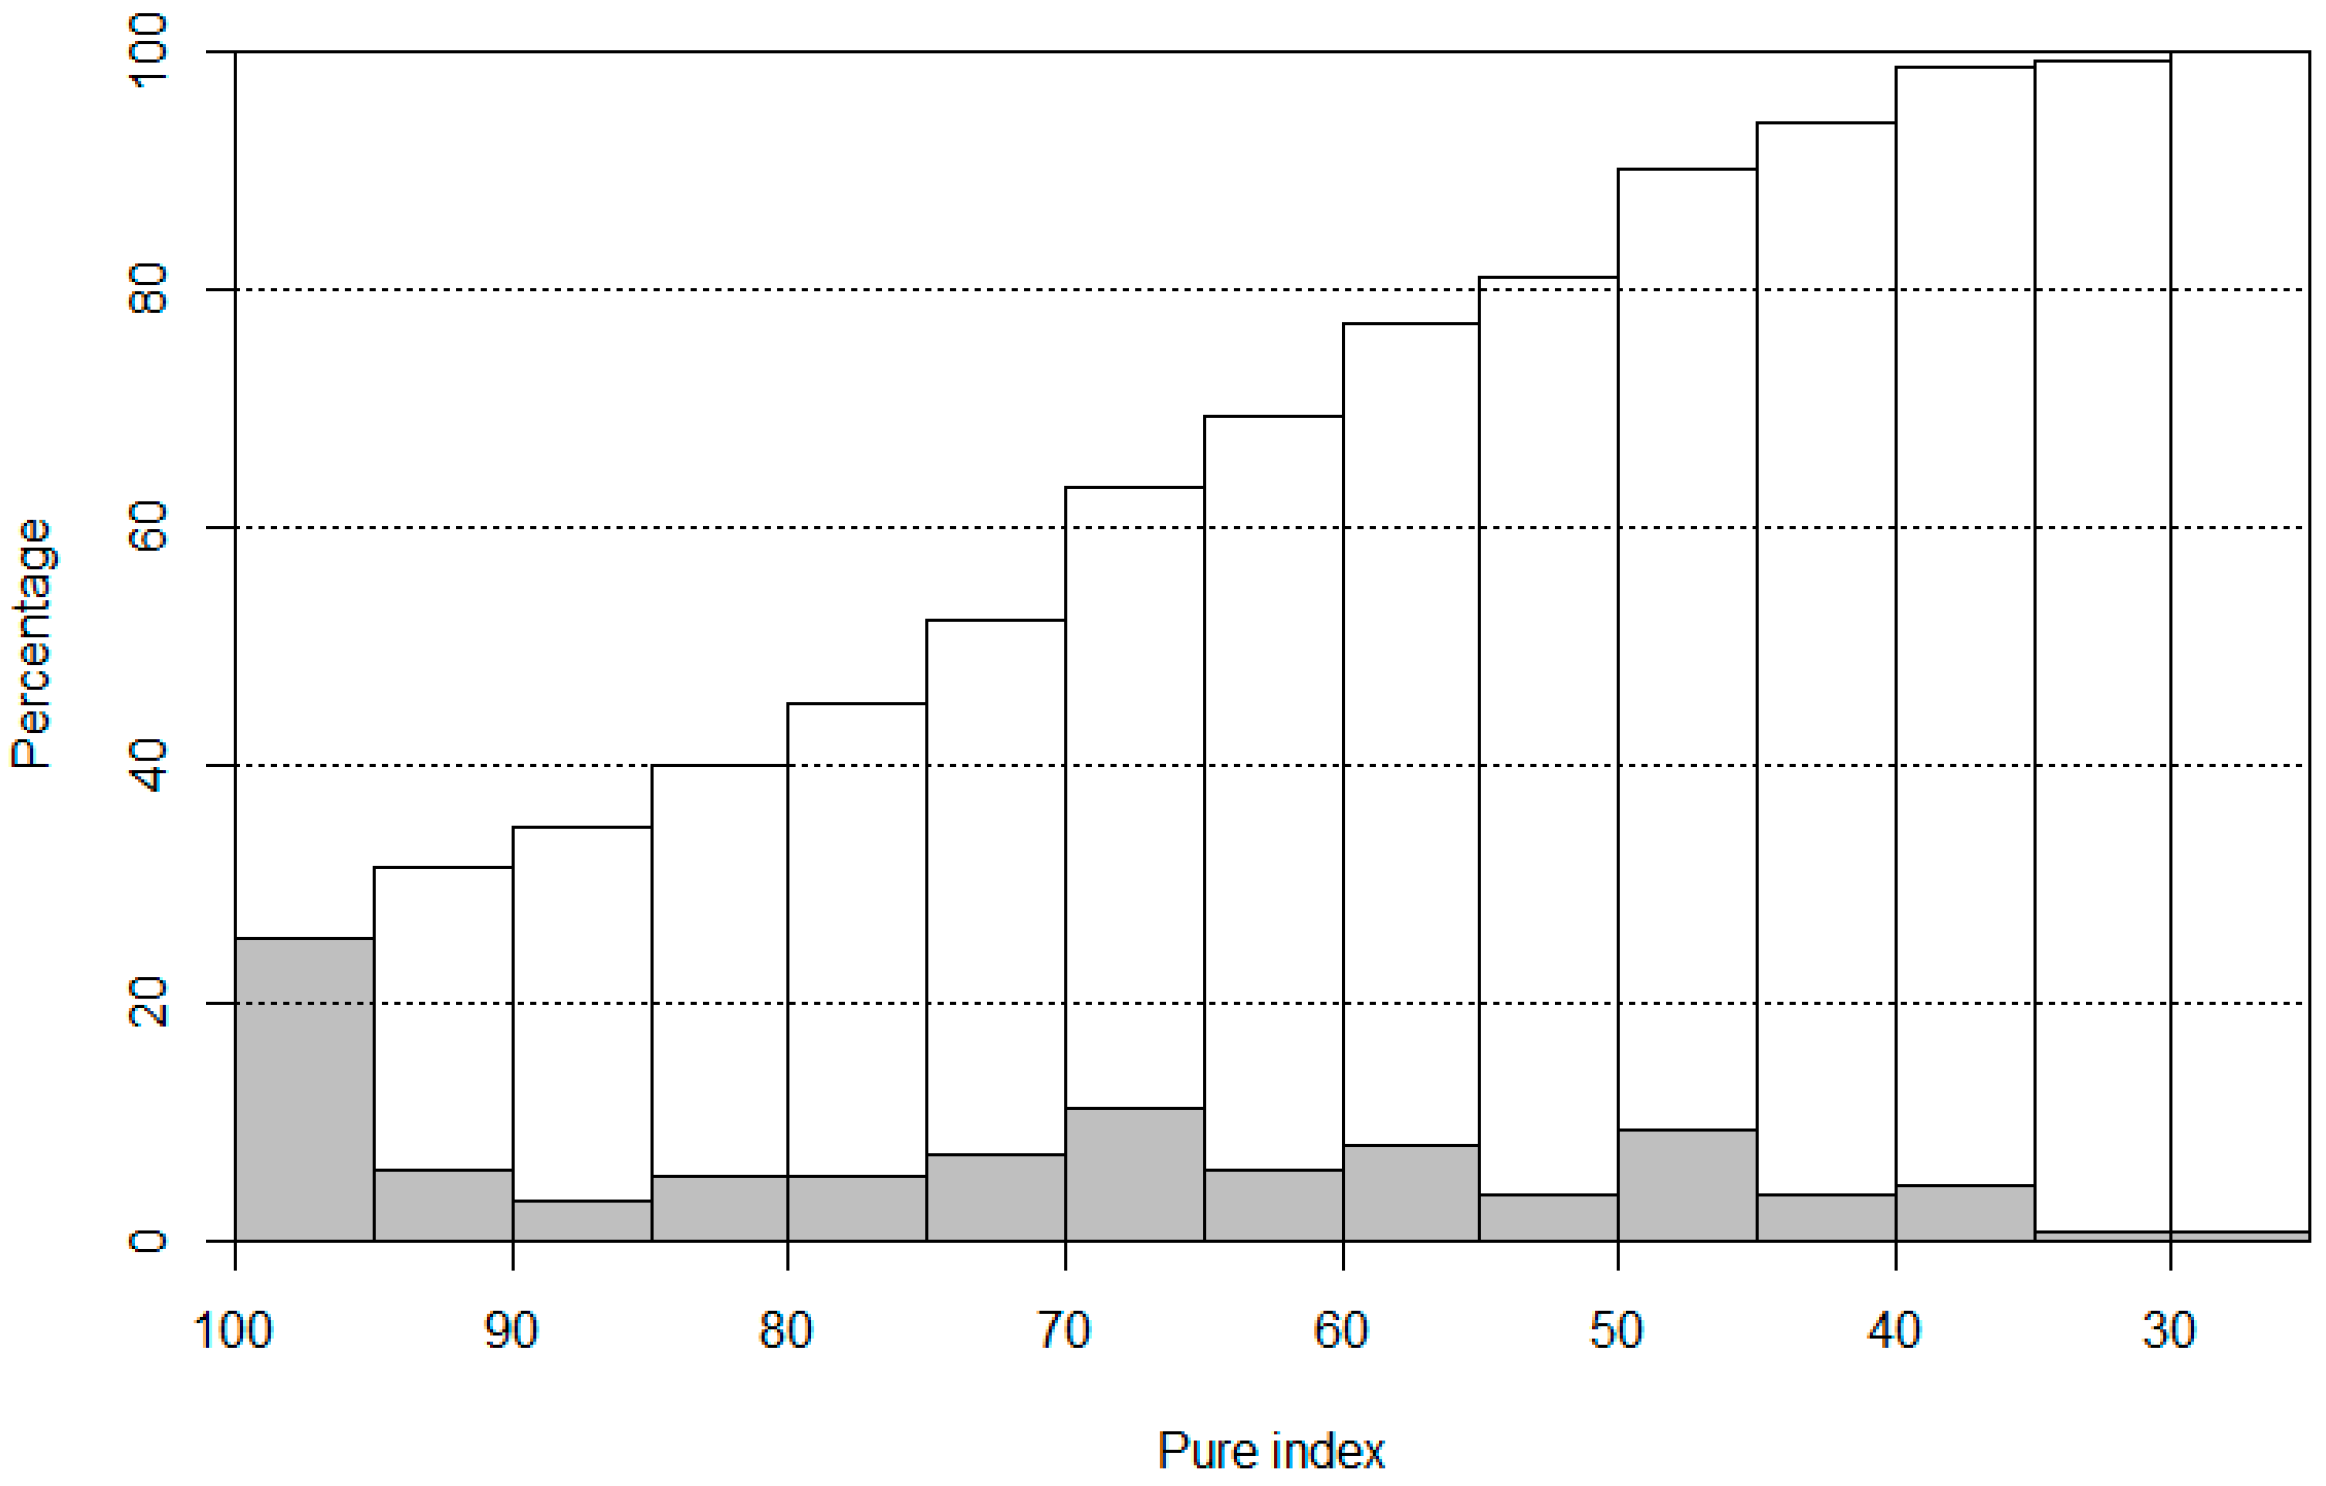
In order to evaluate the influence of mixed parcels on classification accuracy, road-segmented parcels were compared with land use regions manually delineated by experienced analysts. The manually delineated regions have more homogeneous urban functions, and therefore were regarded as pure so that a metric can be designed to quantify the mixture degree of each road-segmented parcel. The proportion taken up by the largest land use region within each road-segmented parcel was used to indicate the degree of mixture, and is referred to as pure index hereinafter. A parcel with a larger pure index is purer and less mixed.
As shown in
Figure 7, there are about 30% highly pure parcels with a pure index over 95%. Parcels with pure index values over 75%, i.e., moderately pure parcels, make up over half of the total parcels. These suggests that the OSM road network did an adequate job in deriving pure land use parcels.
The pure index of 75% was used as the threshold between the pure and mixed parcels, leading to roughly half pure and half mixed parcels. This guaranteed that there are enough samples for both categories of pure and mixed parcels so that reliable results can be derived. The confusion matrices (
Table 5) were derived from the classification results (
Figure 4b,c) for both the mixed and pure parcels to quantitatively access the influence of mixed parcels on the classification accuracy.
As can be seen from
Table 5, the overall accuracy of mixed parcels is much lower than that of pure parcels, indicating that the mixed functions within parcels caused by under-segmentation is one of the major factors influencing classification accuracy. Both the producer’s and user’s accuracies of business parcels and the user’s accuracy of institutional parcels were dramatically increased, by approximately 24%, for pure parcels. This implies that lower mixture degrees of parcels can significantly decrease the possibility of other parcels being classified as institutional or business parcels and the possibility of business parcels being classified as other parcels.
4.4. Limitations and Possible Improvements
Based on the actual land use in the study area and the objectives of this paper, a four-class system was designed. However, the possible heterogeneity between subclasses within the same class and the possible similarity between subclasses in different classes may pose potential difficulties in achieving a higher classification accuracy. Better classification performance may be expected from the adoption of a larger number of more easily separable classes given that more land use classes are present and abundant samples are available.
Only one out of the four bands of the GF-2 image was used to calculate the spectral/texture attributes of each parcel, since multicollinearity can cause biased and unreliable variable importance estimation. When a higher classification accuracy is the sole objective, more spectral/texture attributes and remote sensing-derived indices can be calculated from high-resolution satellites with more bands (e.g., WorldView-2/3) to support better classification performance.
The methodological framework proposed in this paper for fine-grained urban land use classification is relatively good at classifying open space and residential parcels, and poor at classifying institutional parcels. The difficulties associated with the classification of institutional parcels have also been reported in some other per-field urban land use classification studies [
2,
7]. The difficulties may be due to the heterogeneous nature of institutional parcels; therefore, one way to improve the classification accuracy is to map subclasses and then merge. Another possible way, as discussed in
Section 4.3, is to decrease the mixture degree of parcels, which can dramatically increase the user’s accuracies of institutional parcels.
Although social sensing data has been widely used to map urban land use, they are known to suffer from positional inaccuracy bias. In the case of Weibo, the location information recorded in the geotagged Weibo posts in the form of latitude and longitude is selected by users from a list of nearby POI names. The influence of positional inaccuracy was further alleviated by the use of urban land use parcels as the basic classification unit, and by the adoption of kernel density estimation and temporal aggregation. Despite of the positional inaccuracy bias, the social sensing data are currently the only reliable data sources to represent temporally and spatially fine-grained population distribution, and including them is more beneficial than excluding them, as demonstrated by the results of this paper. However, the issues associated with them should be borne in mind when they are used.
5. Conclusions
This paper used four types of attributes derived from both high-resolution remotely sensed images and social sensing data to automatically map fine-grained urban land use using a per-field classification approach in the study area within Haidian District, Beijing, China. The overall testing accuracy of the classification reached 77.83%, demonstrating that the combination of remote sensing and social sensing data is capable of accurately detecting fine-grained urban land use pattern. Specifically, open space and residential parcels can be classified with high accuracy. Accuracy for business parcels is slightly lower, yet can be potentially improved if purer parcels can be acquired. The accuracies for institutional parcels is the lowest, possibly due to their heterogeneous nature.
The importance of all attributes for the whole land use classification and for the classification of each individual class was evaluated using the VSURF approach and via the accuracy comparison between the full model and subset models. The results showed that using only remote sensing data and only social sensing data can achieve equally high accuracy in the per-field classification, but their effectiveness in classifying individual classes differs. Landscape metrics is the most important of all attribute categories for the classification of open space parcels. Spectral/texture attributes are more important in distinguishing institutional and residential parcels from other parcels. The classification of business parcels relies more on landscape metrics and social sensing data, and less on spectral/texture attributes.
The approach to automatically map fine-grained urban land use can be applied to other regions with reliable OSM road networks and easily accessible social sensing data, and can fulfill the increasing demands for the up-to-date fine-grained urban land use information. The classification approach in this paper is among the first attempts to combine high-resolution remote sensing images and multi-source social sensing data. A comprehensive set of traditionally used and newly proposed parcel attributes were calculated from both data sources, so that physical, spatial configuration, socioeconomic, and demographic attributes can be taken into consideration all together during classification. The attribute importance analysis and partial dependence plots shed light on the key factors for classifying each individual class more accurately, and on which new attributes are needed to further improve the classification accuracy. The accuracy can also be potentially improved upon the acquisition of purer urban land use parcels, which is expected to be much easier in the future with the development of OSM or other VGI maps.


