
Mapping Typical Urban LULC from Landsat Imagery without Training Samples or Self-Defined Parameters


Abstract
:
1. Introduction
1.1. Urbanization in Developing Countries
1.2. Remote-Sensing for Analyzing LULC Change
2. Study Site and Data
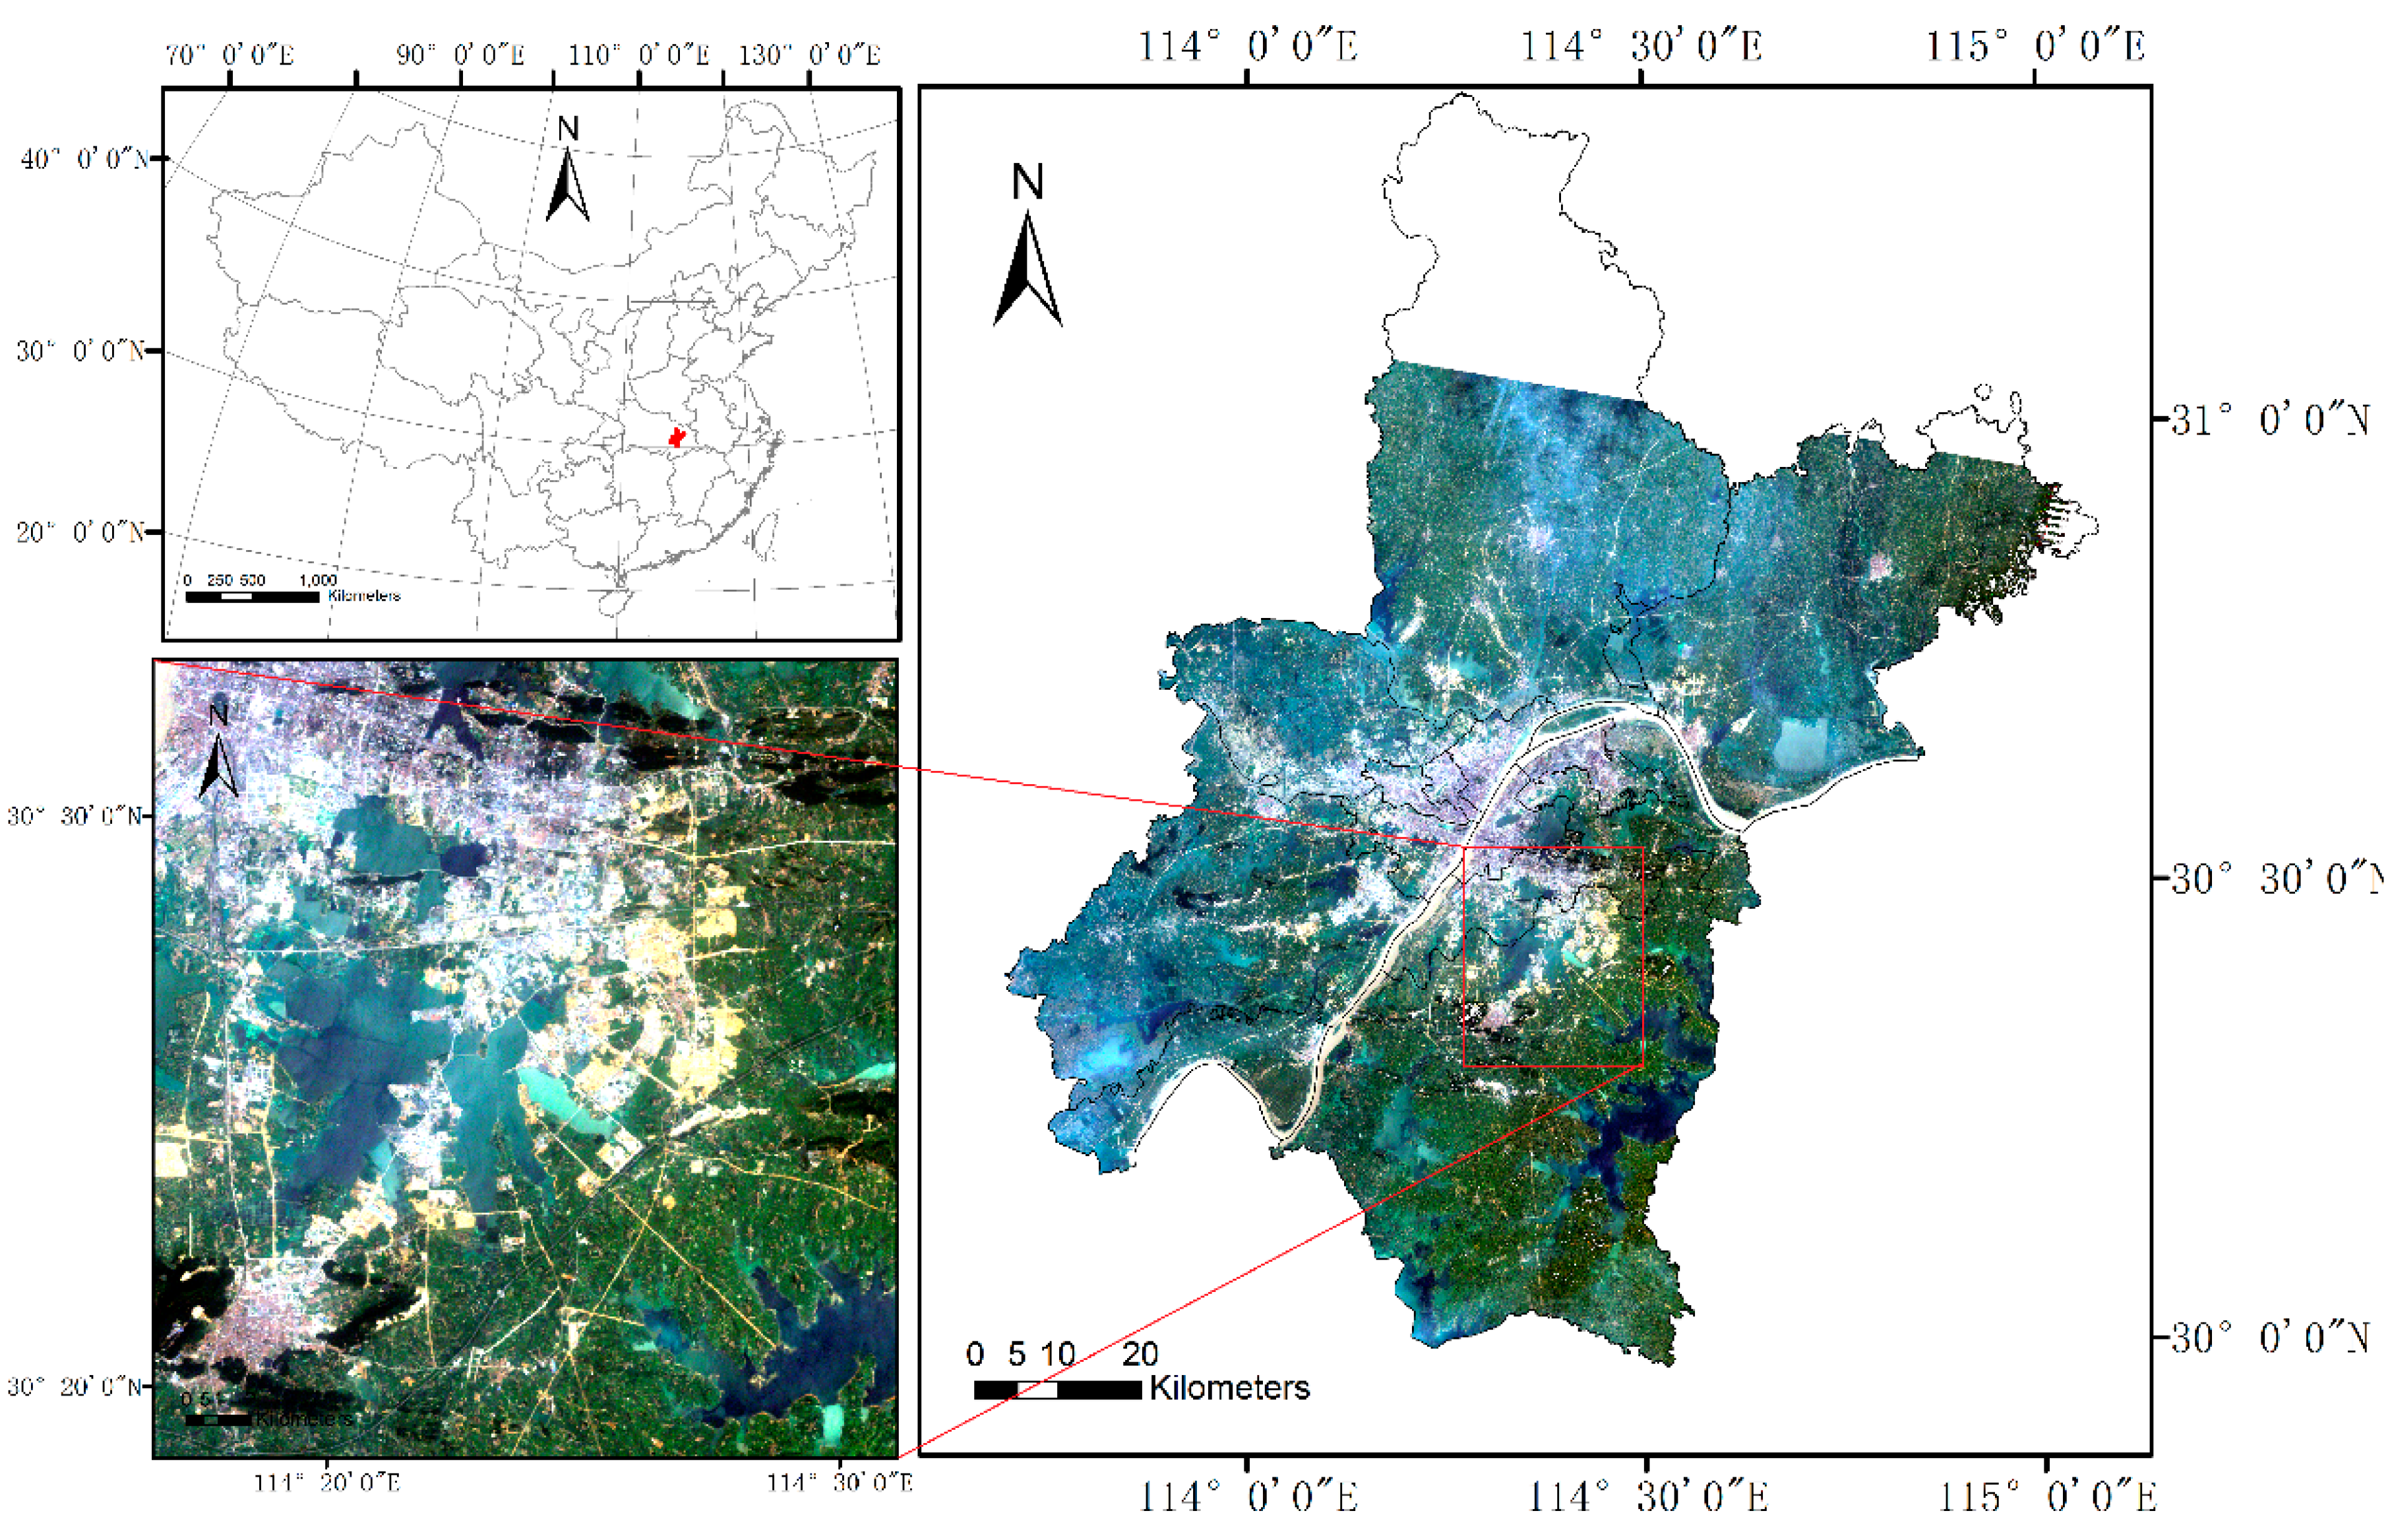
2.1. Study Site
2.2. Data
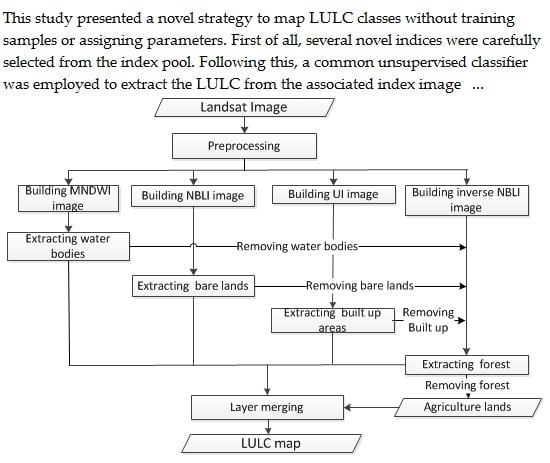
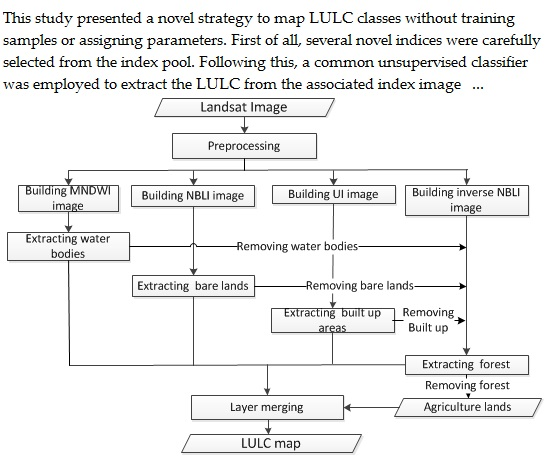
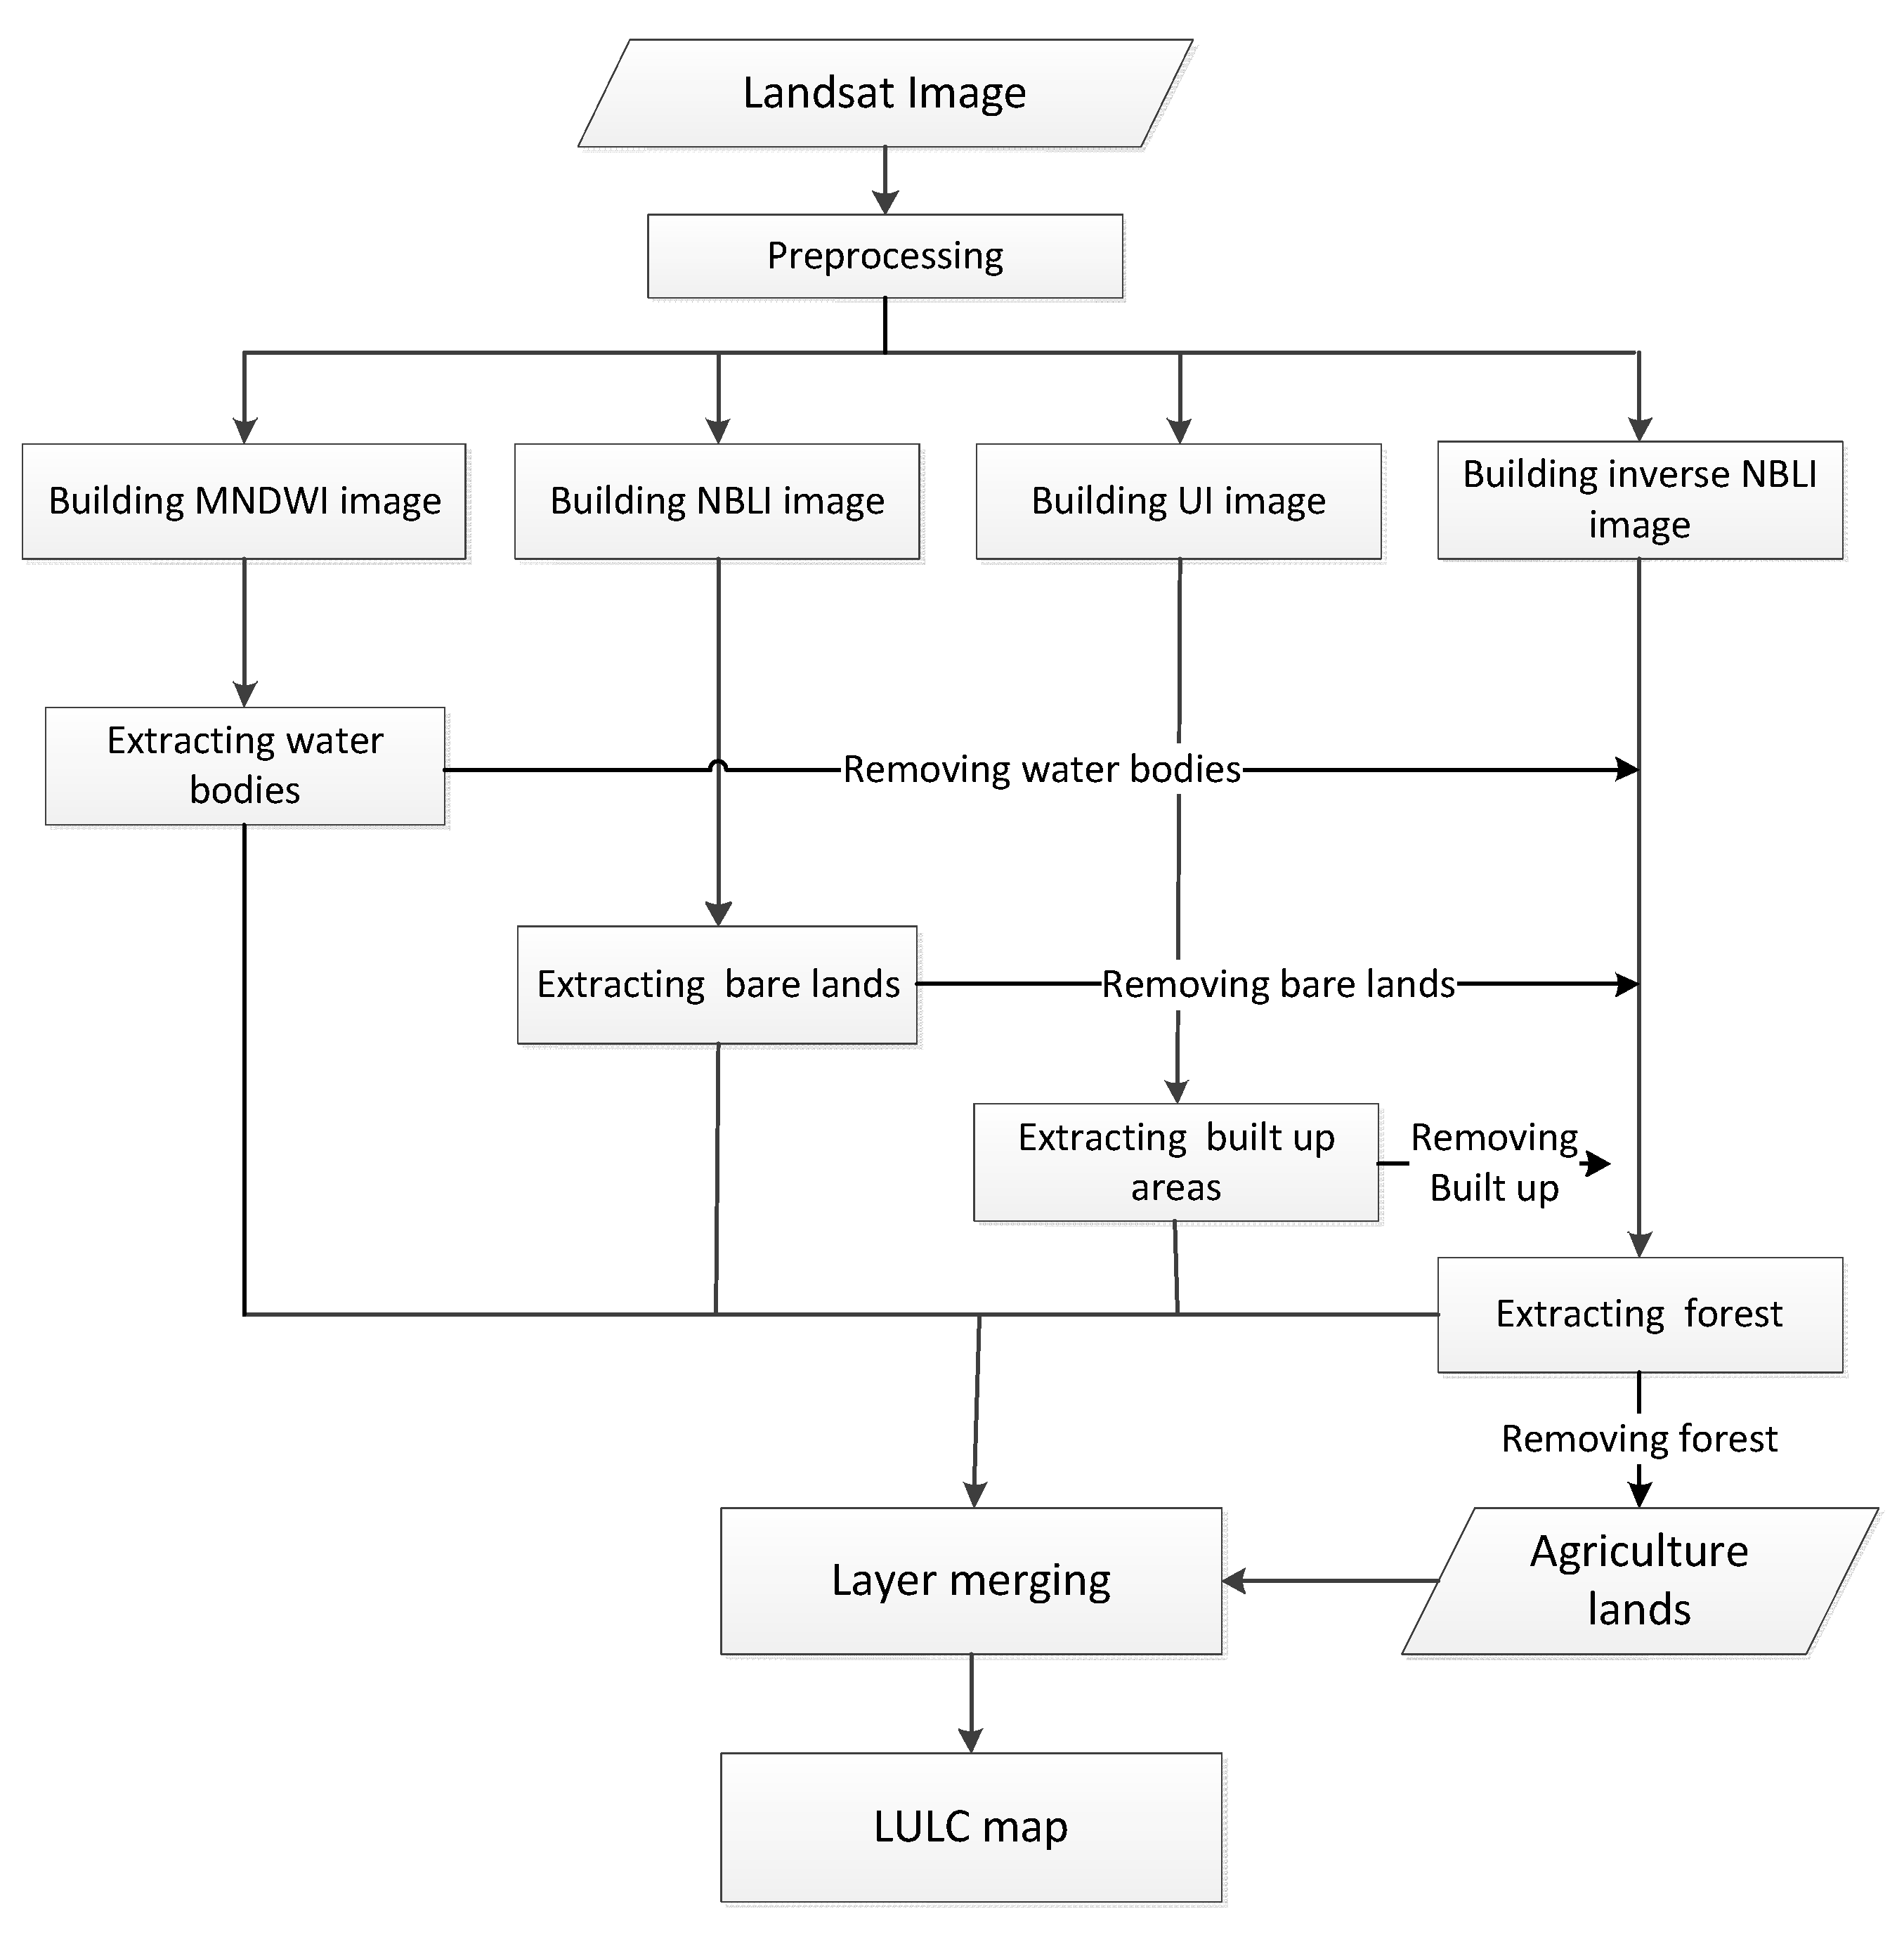
3. Methods
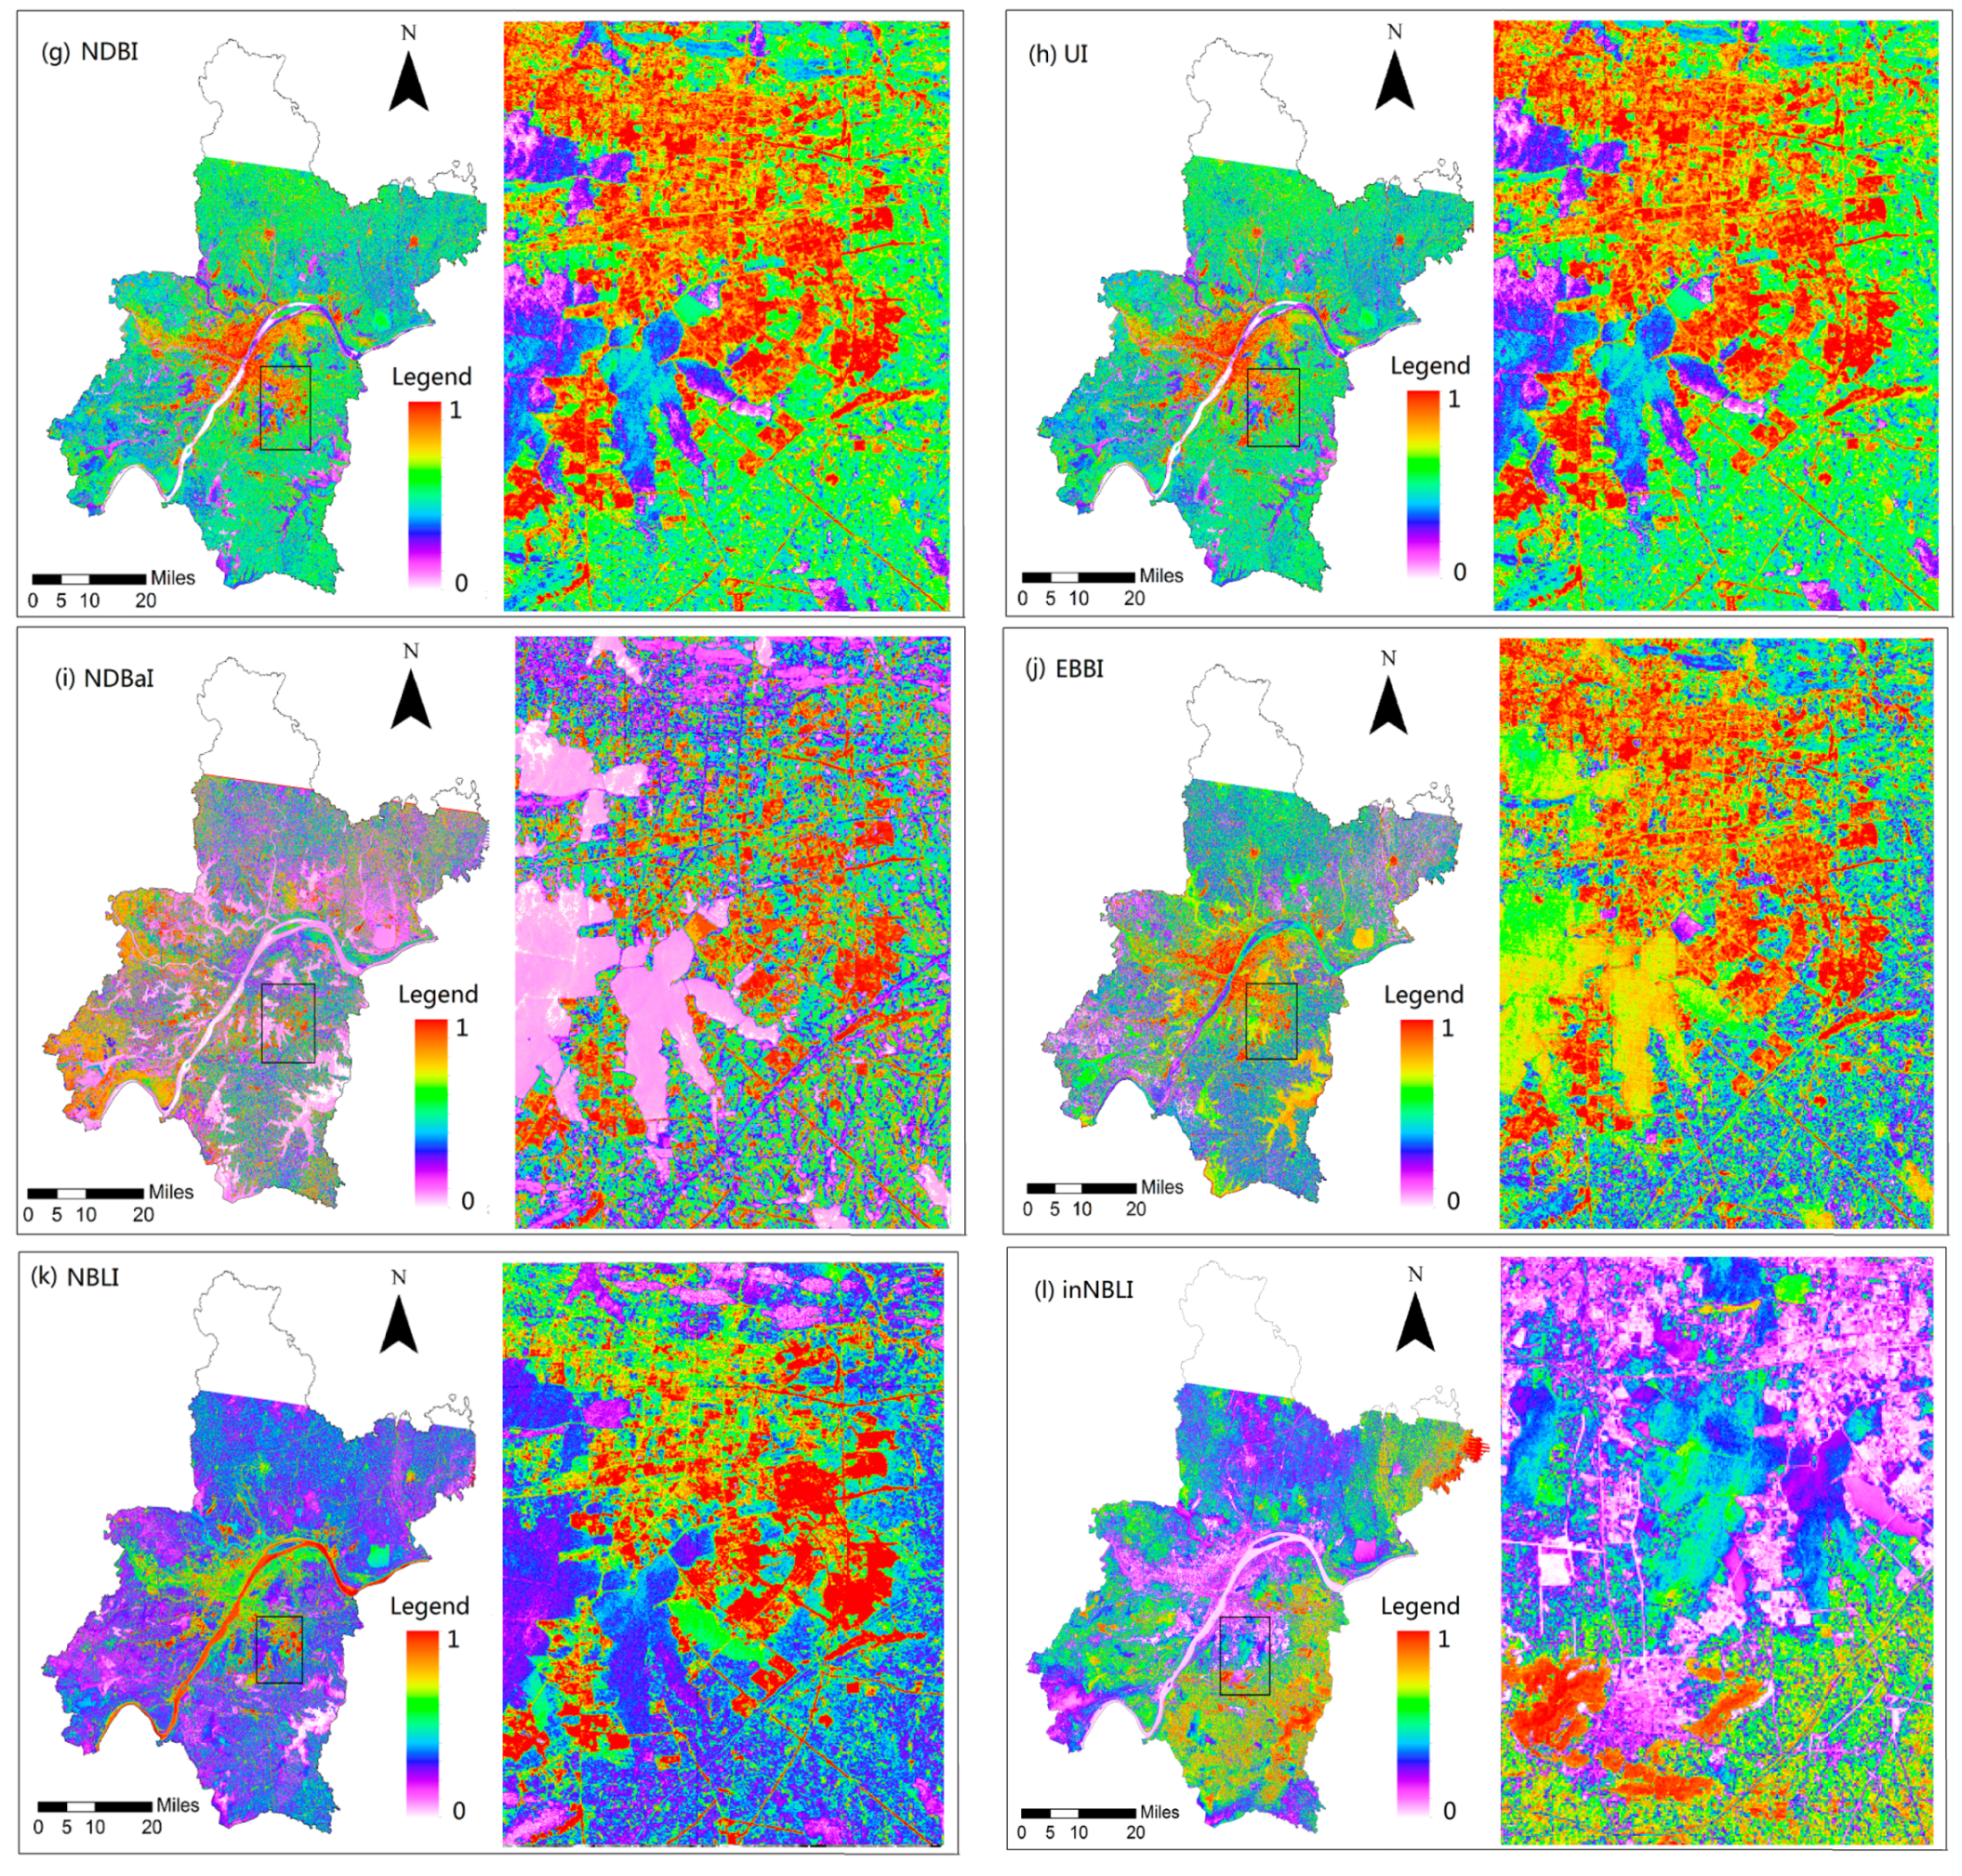
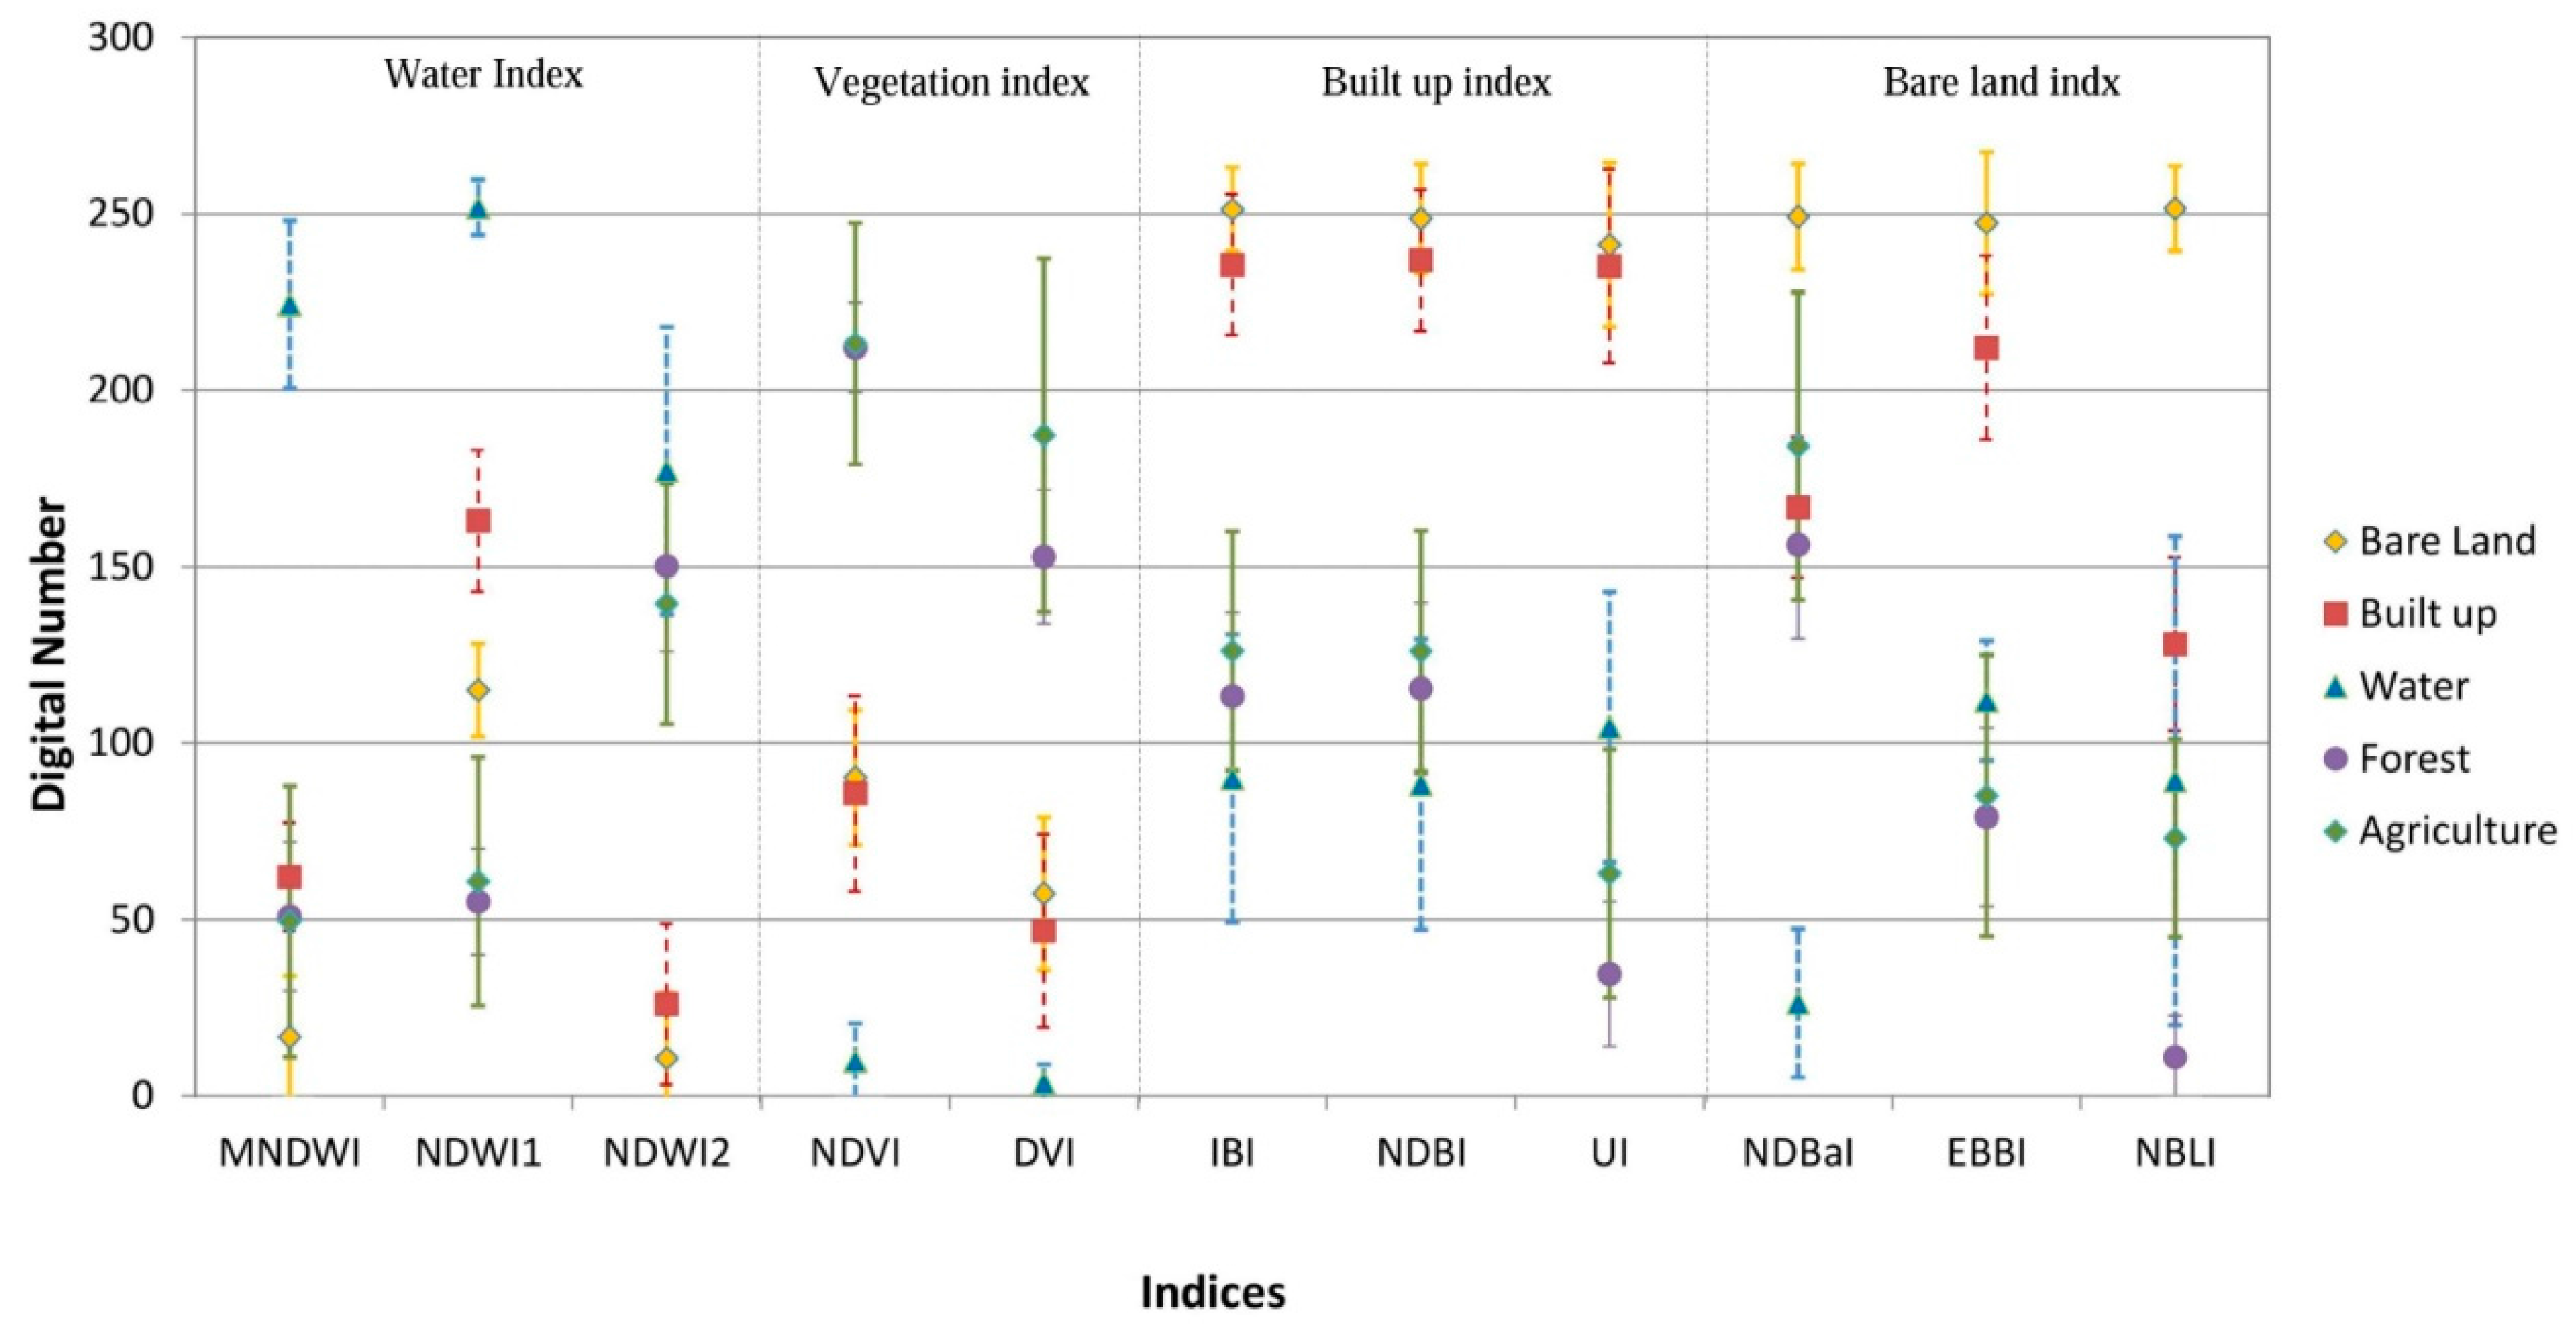
3.1. Indices Related to Typical LULC
3.2. Comparative Analysis
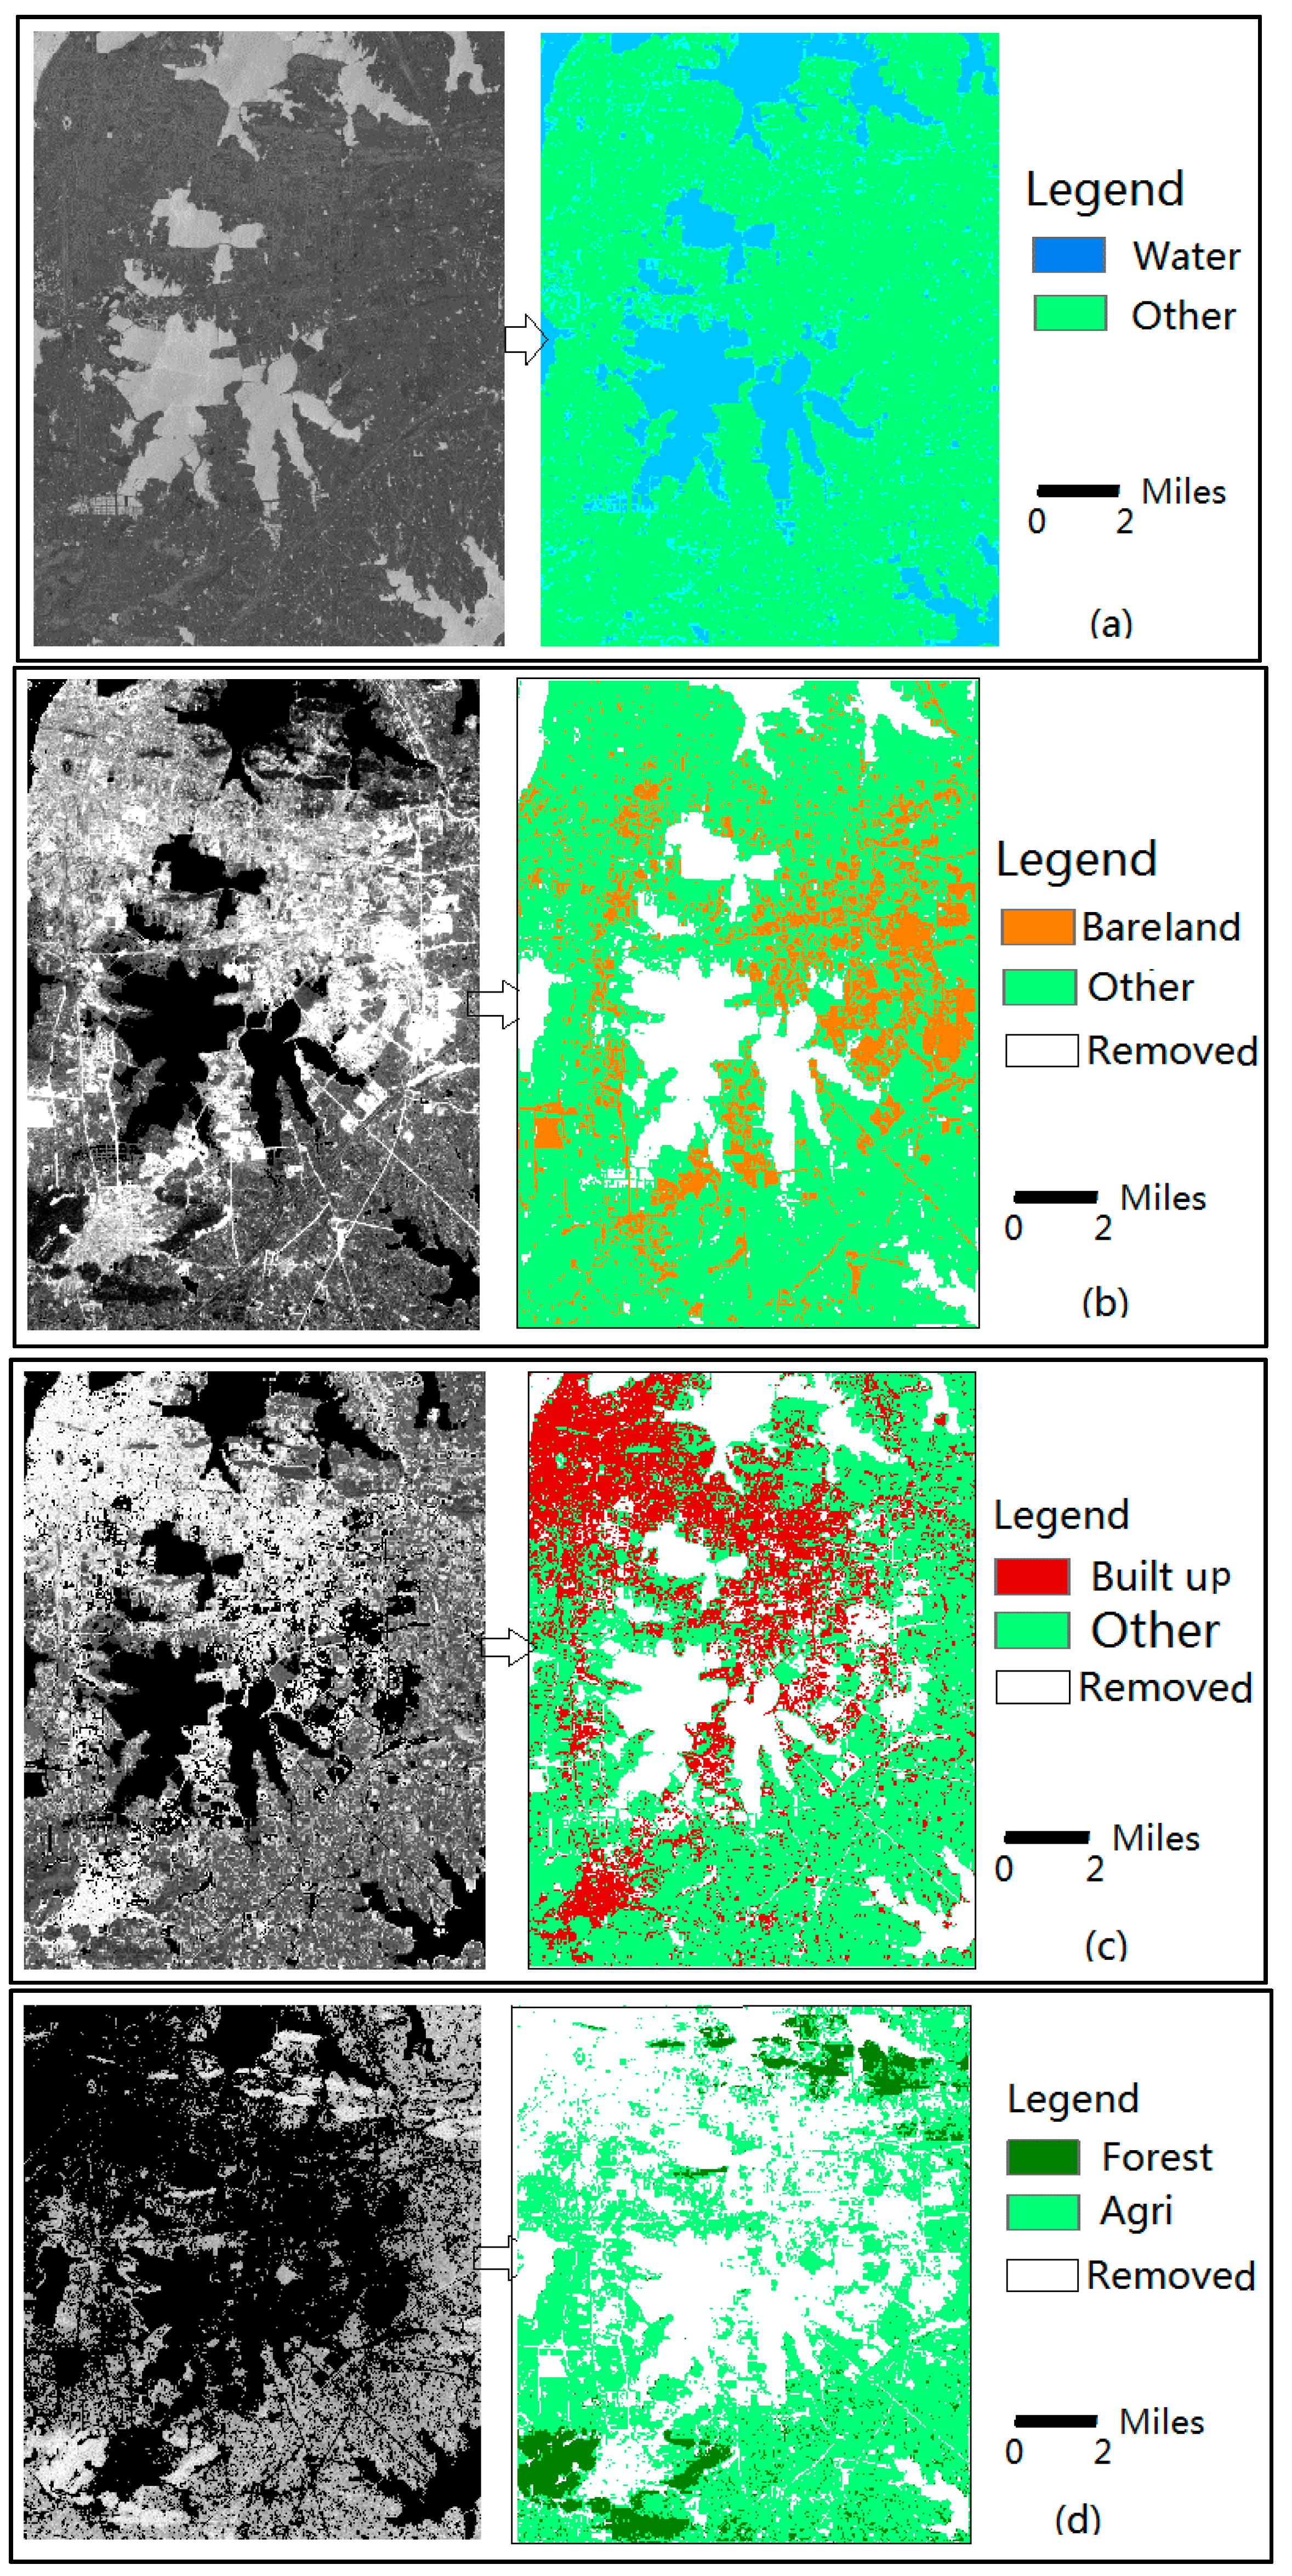
3.3. Unsupervised Classification with Selected Indices
3.4. Supervised Classification with Samples Selected Automatically
4. Results
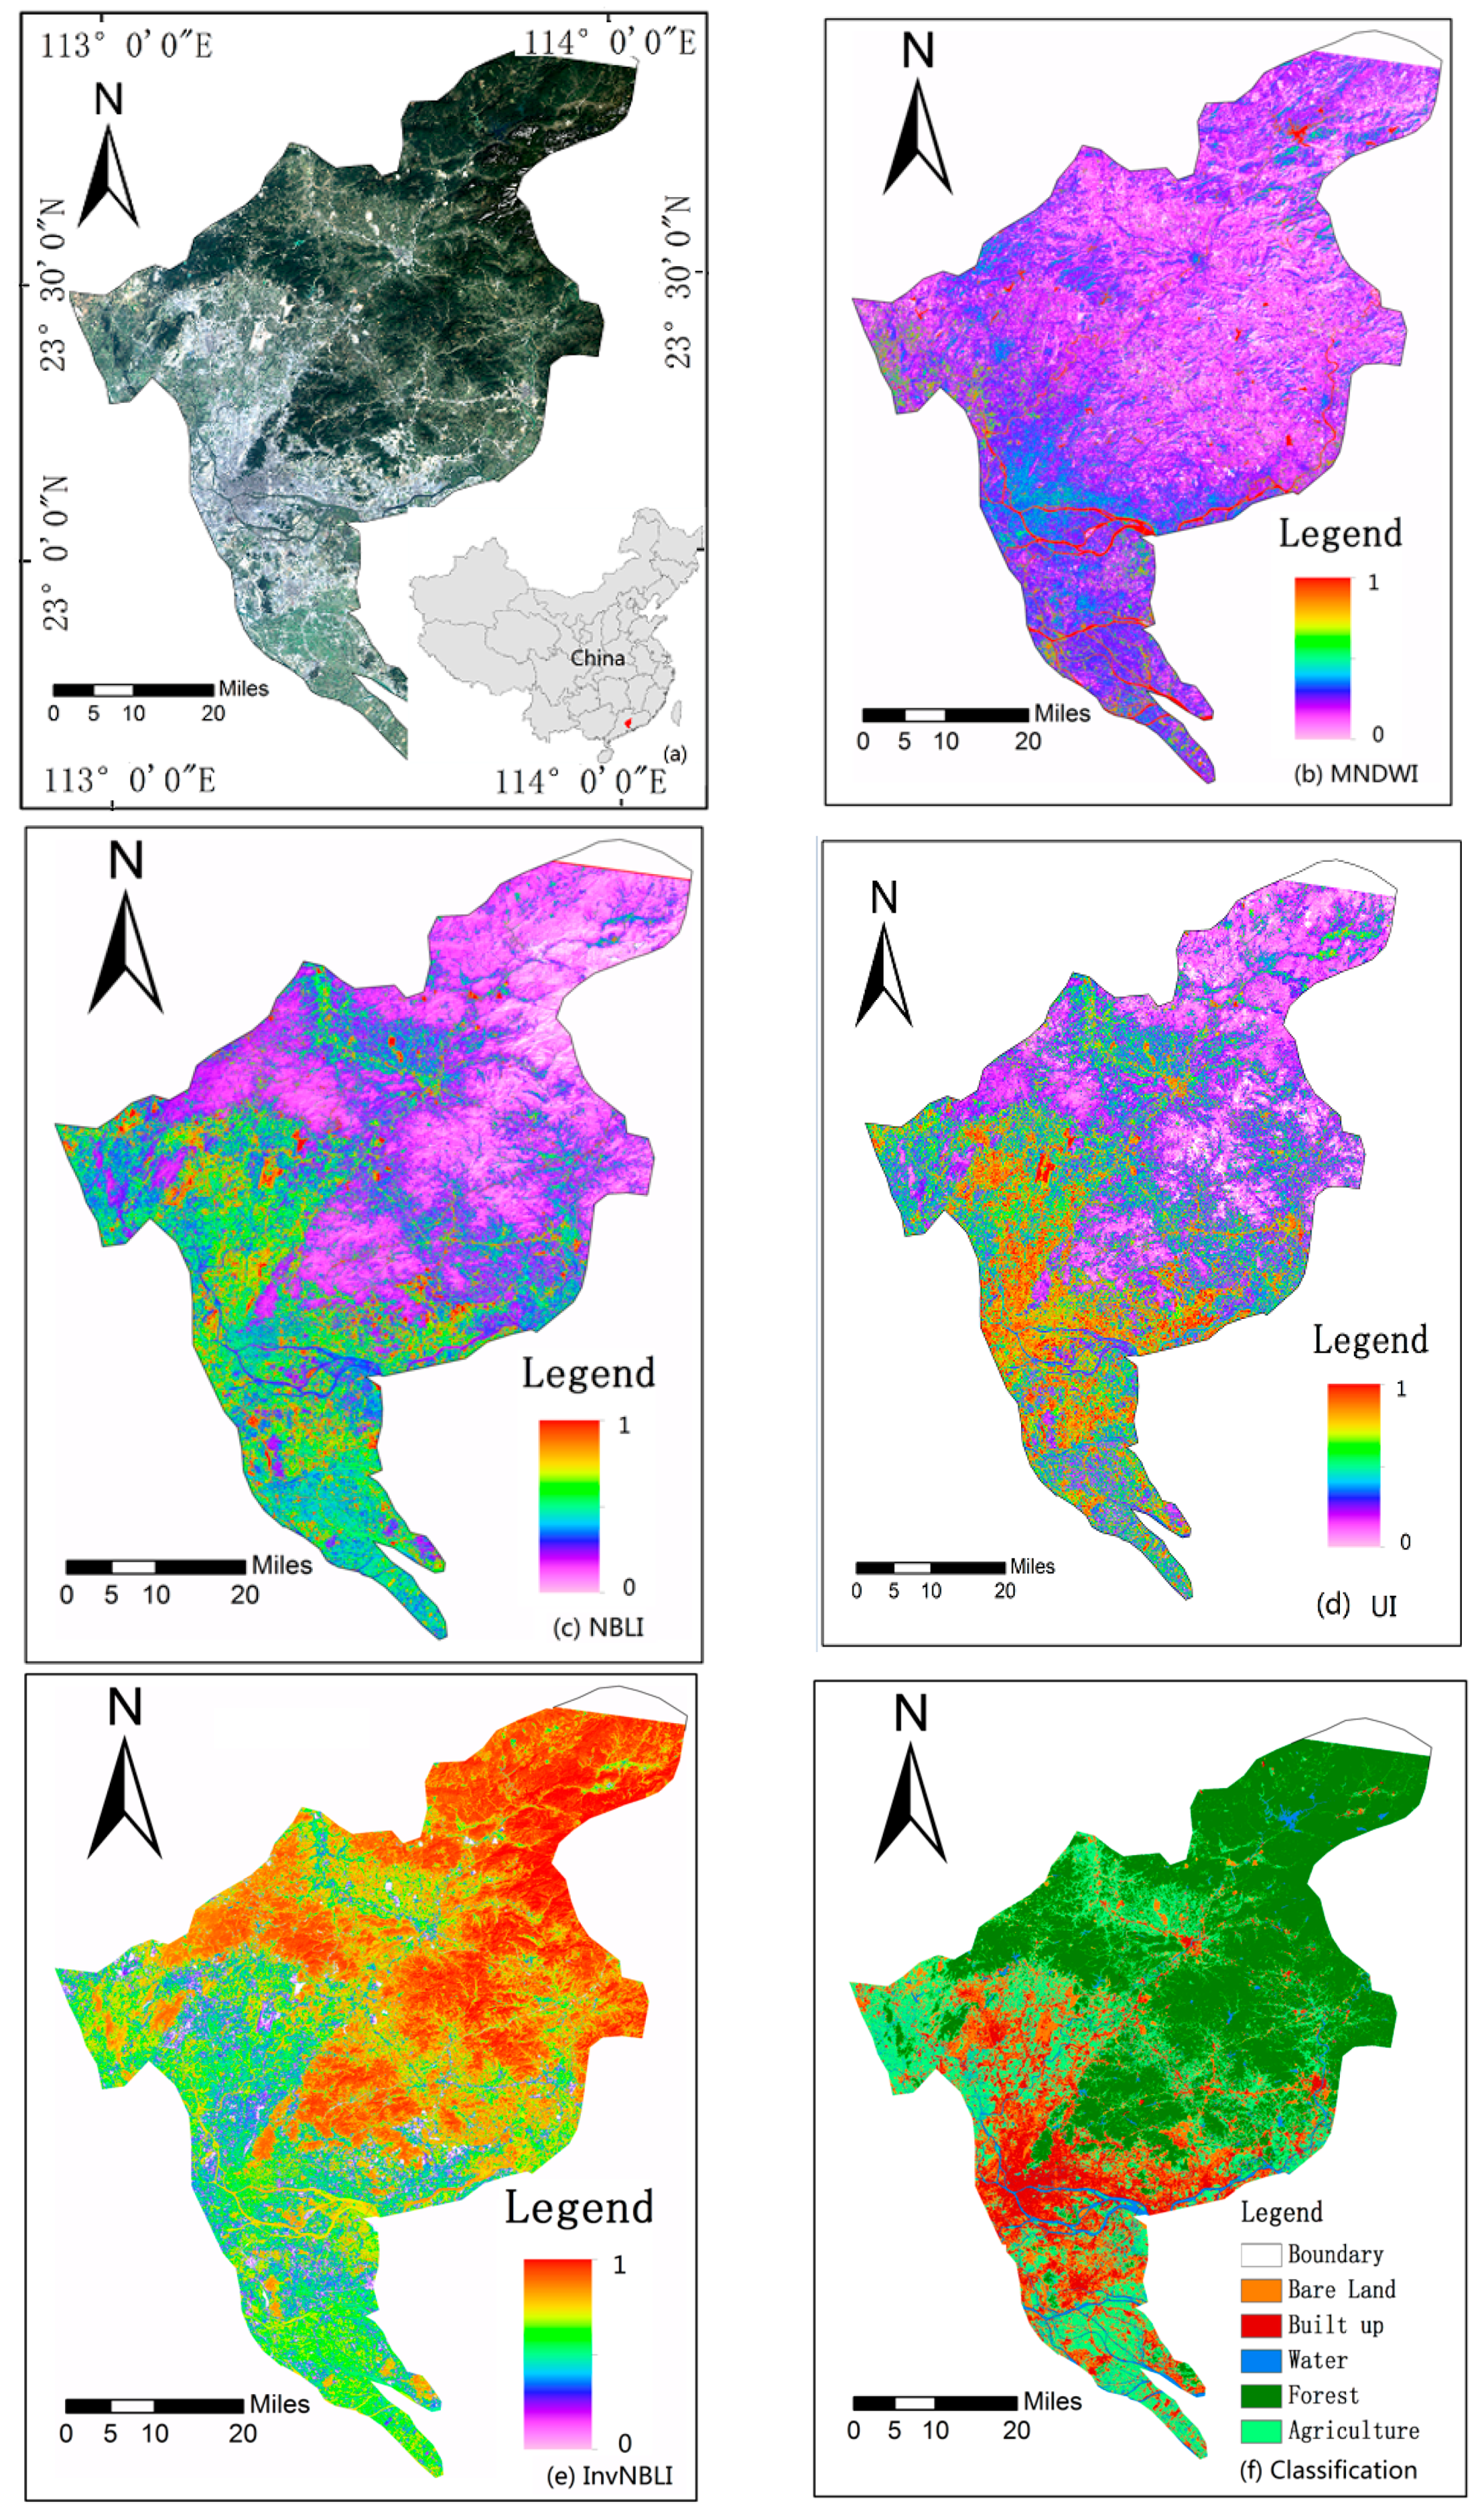
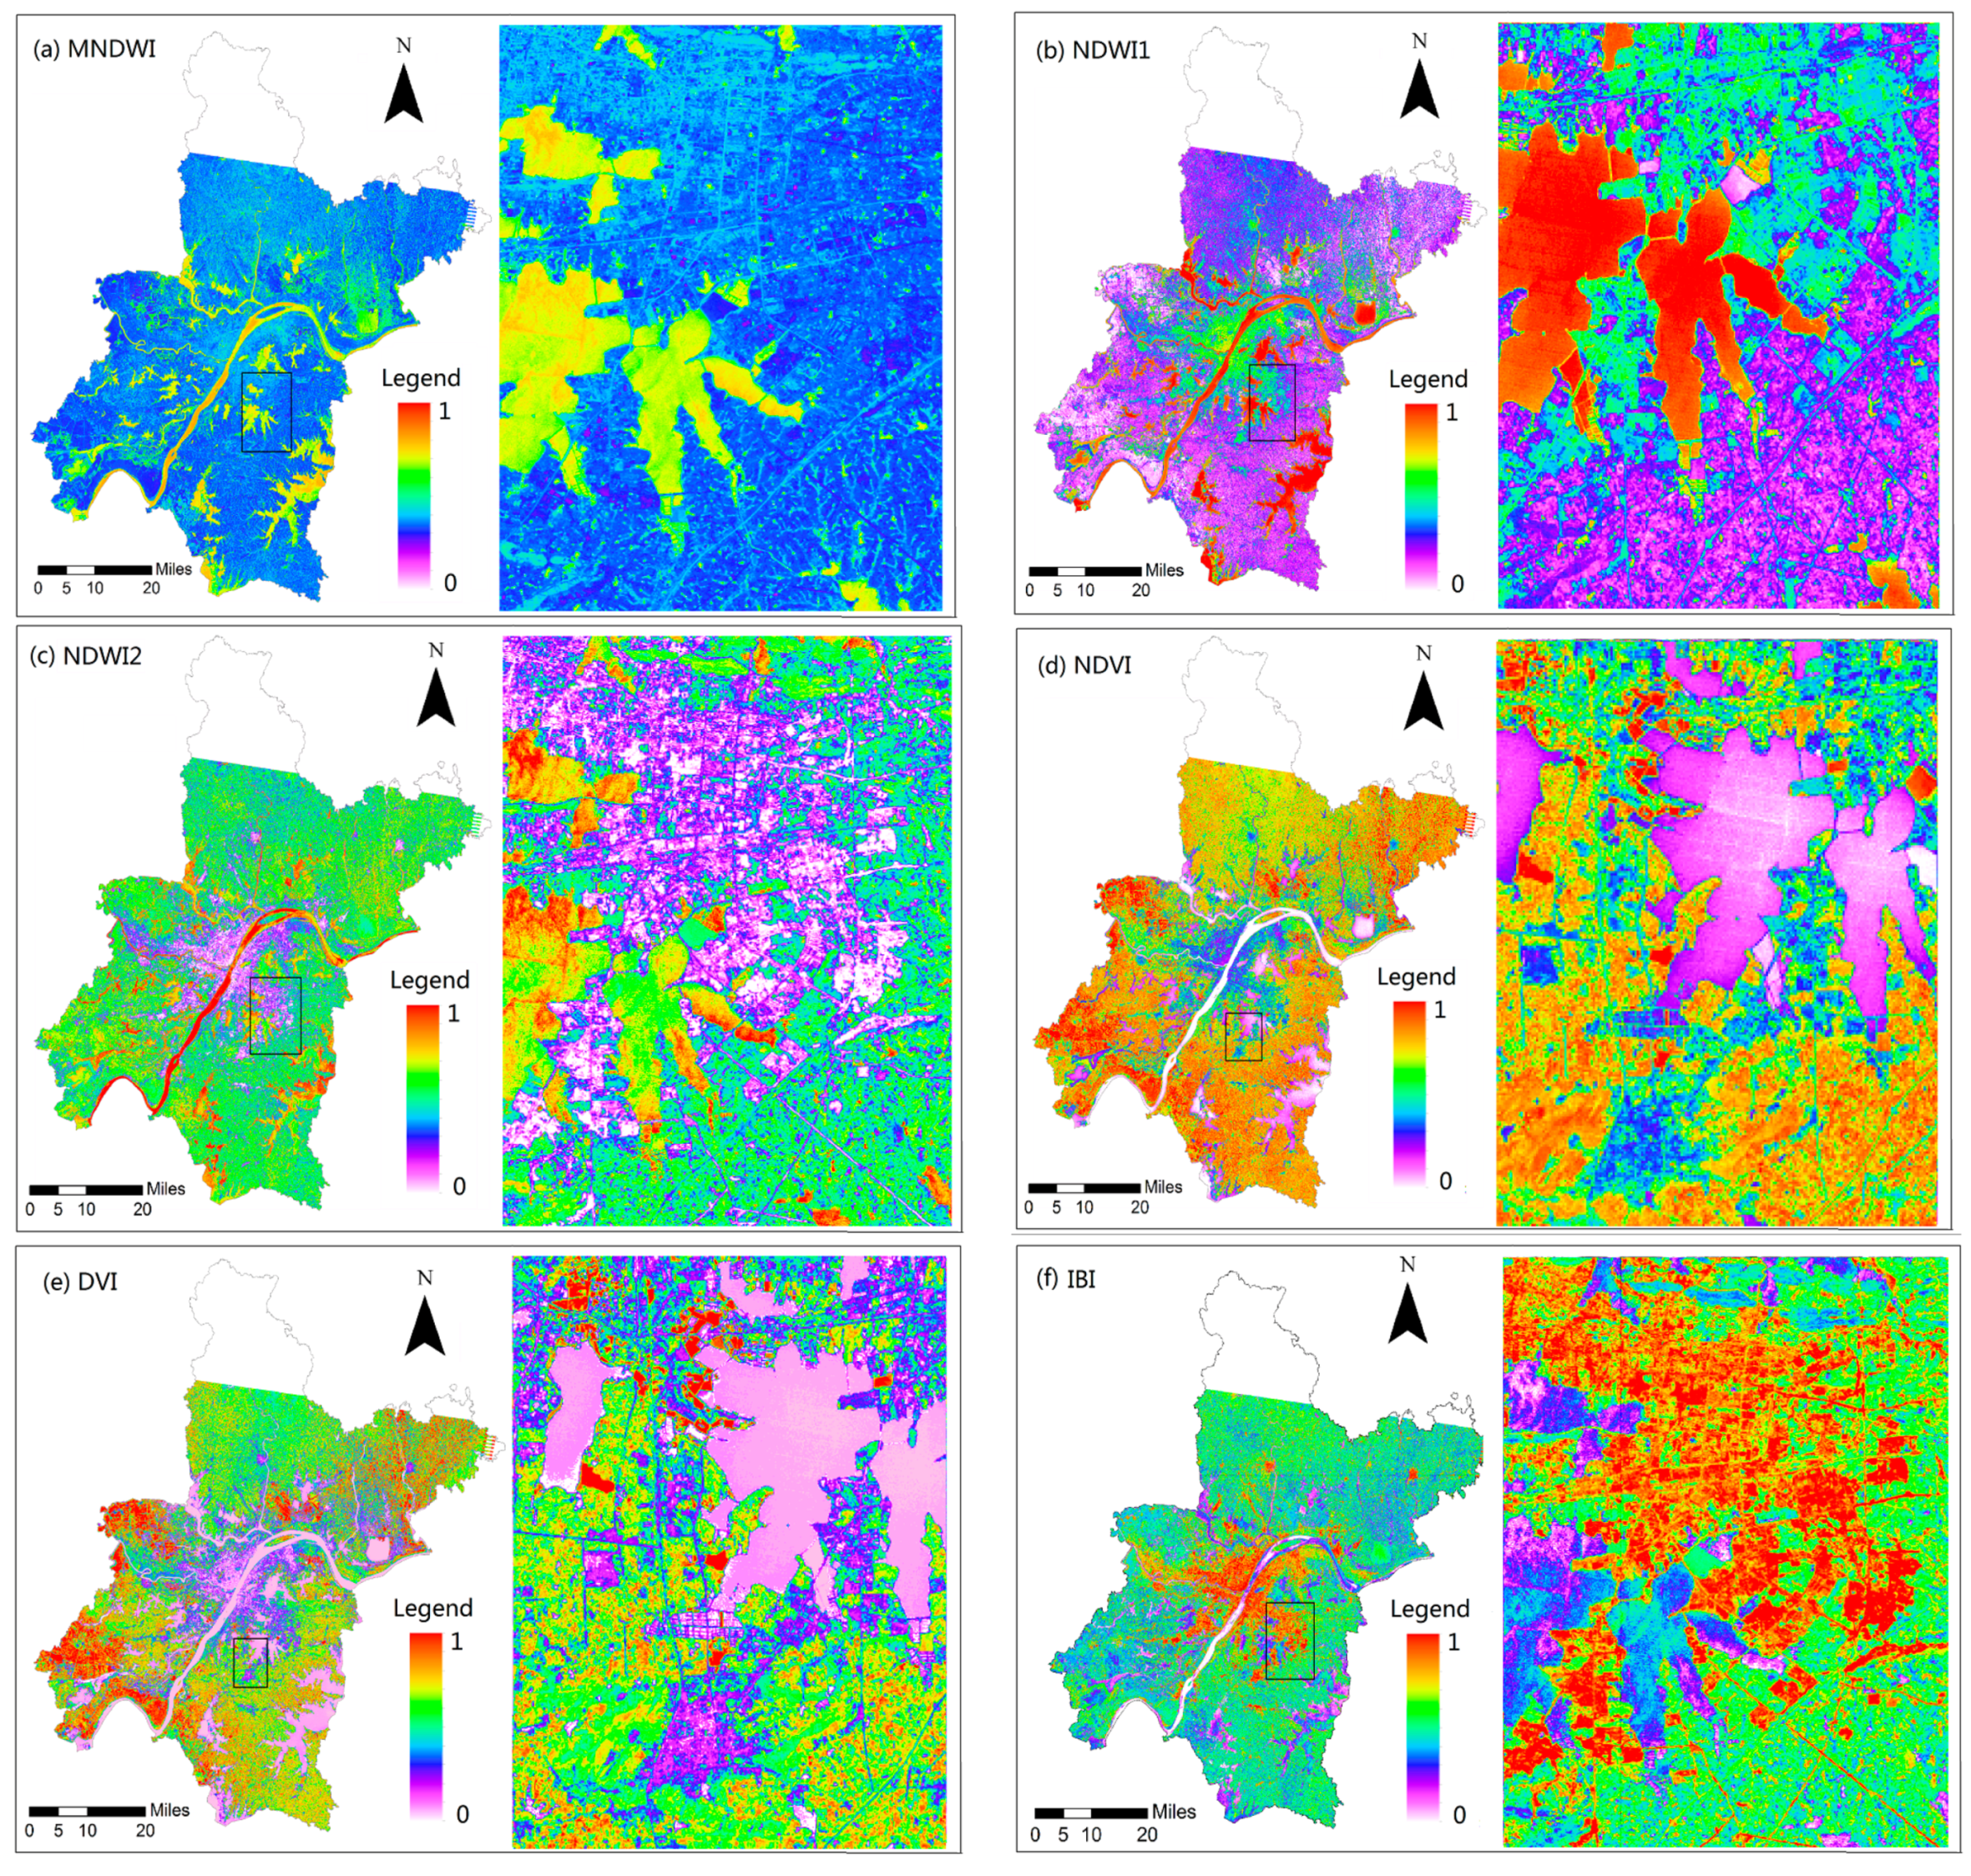
4.1. Index Images
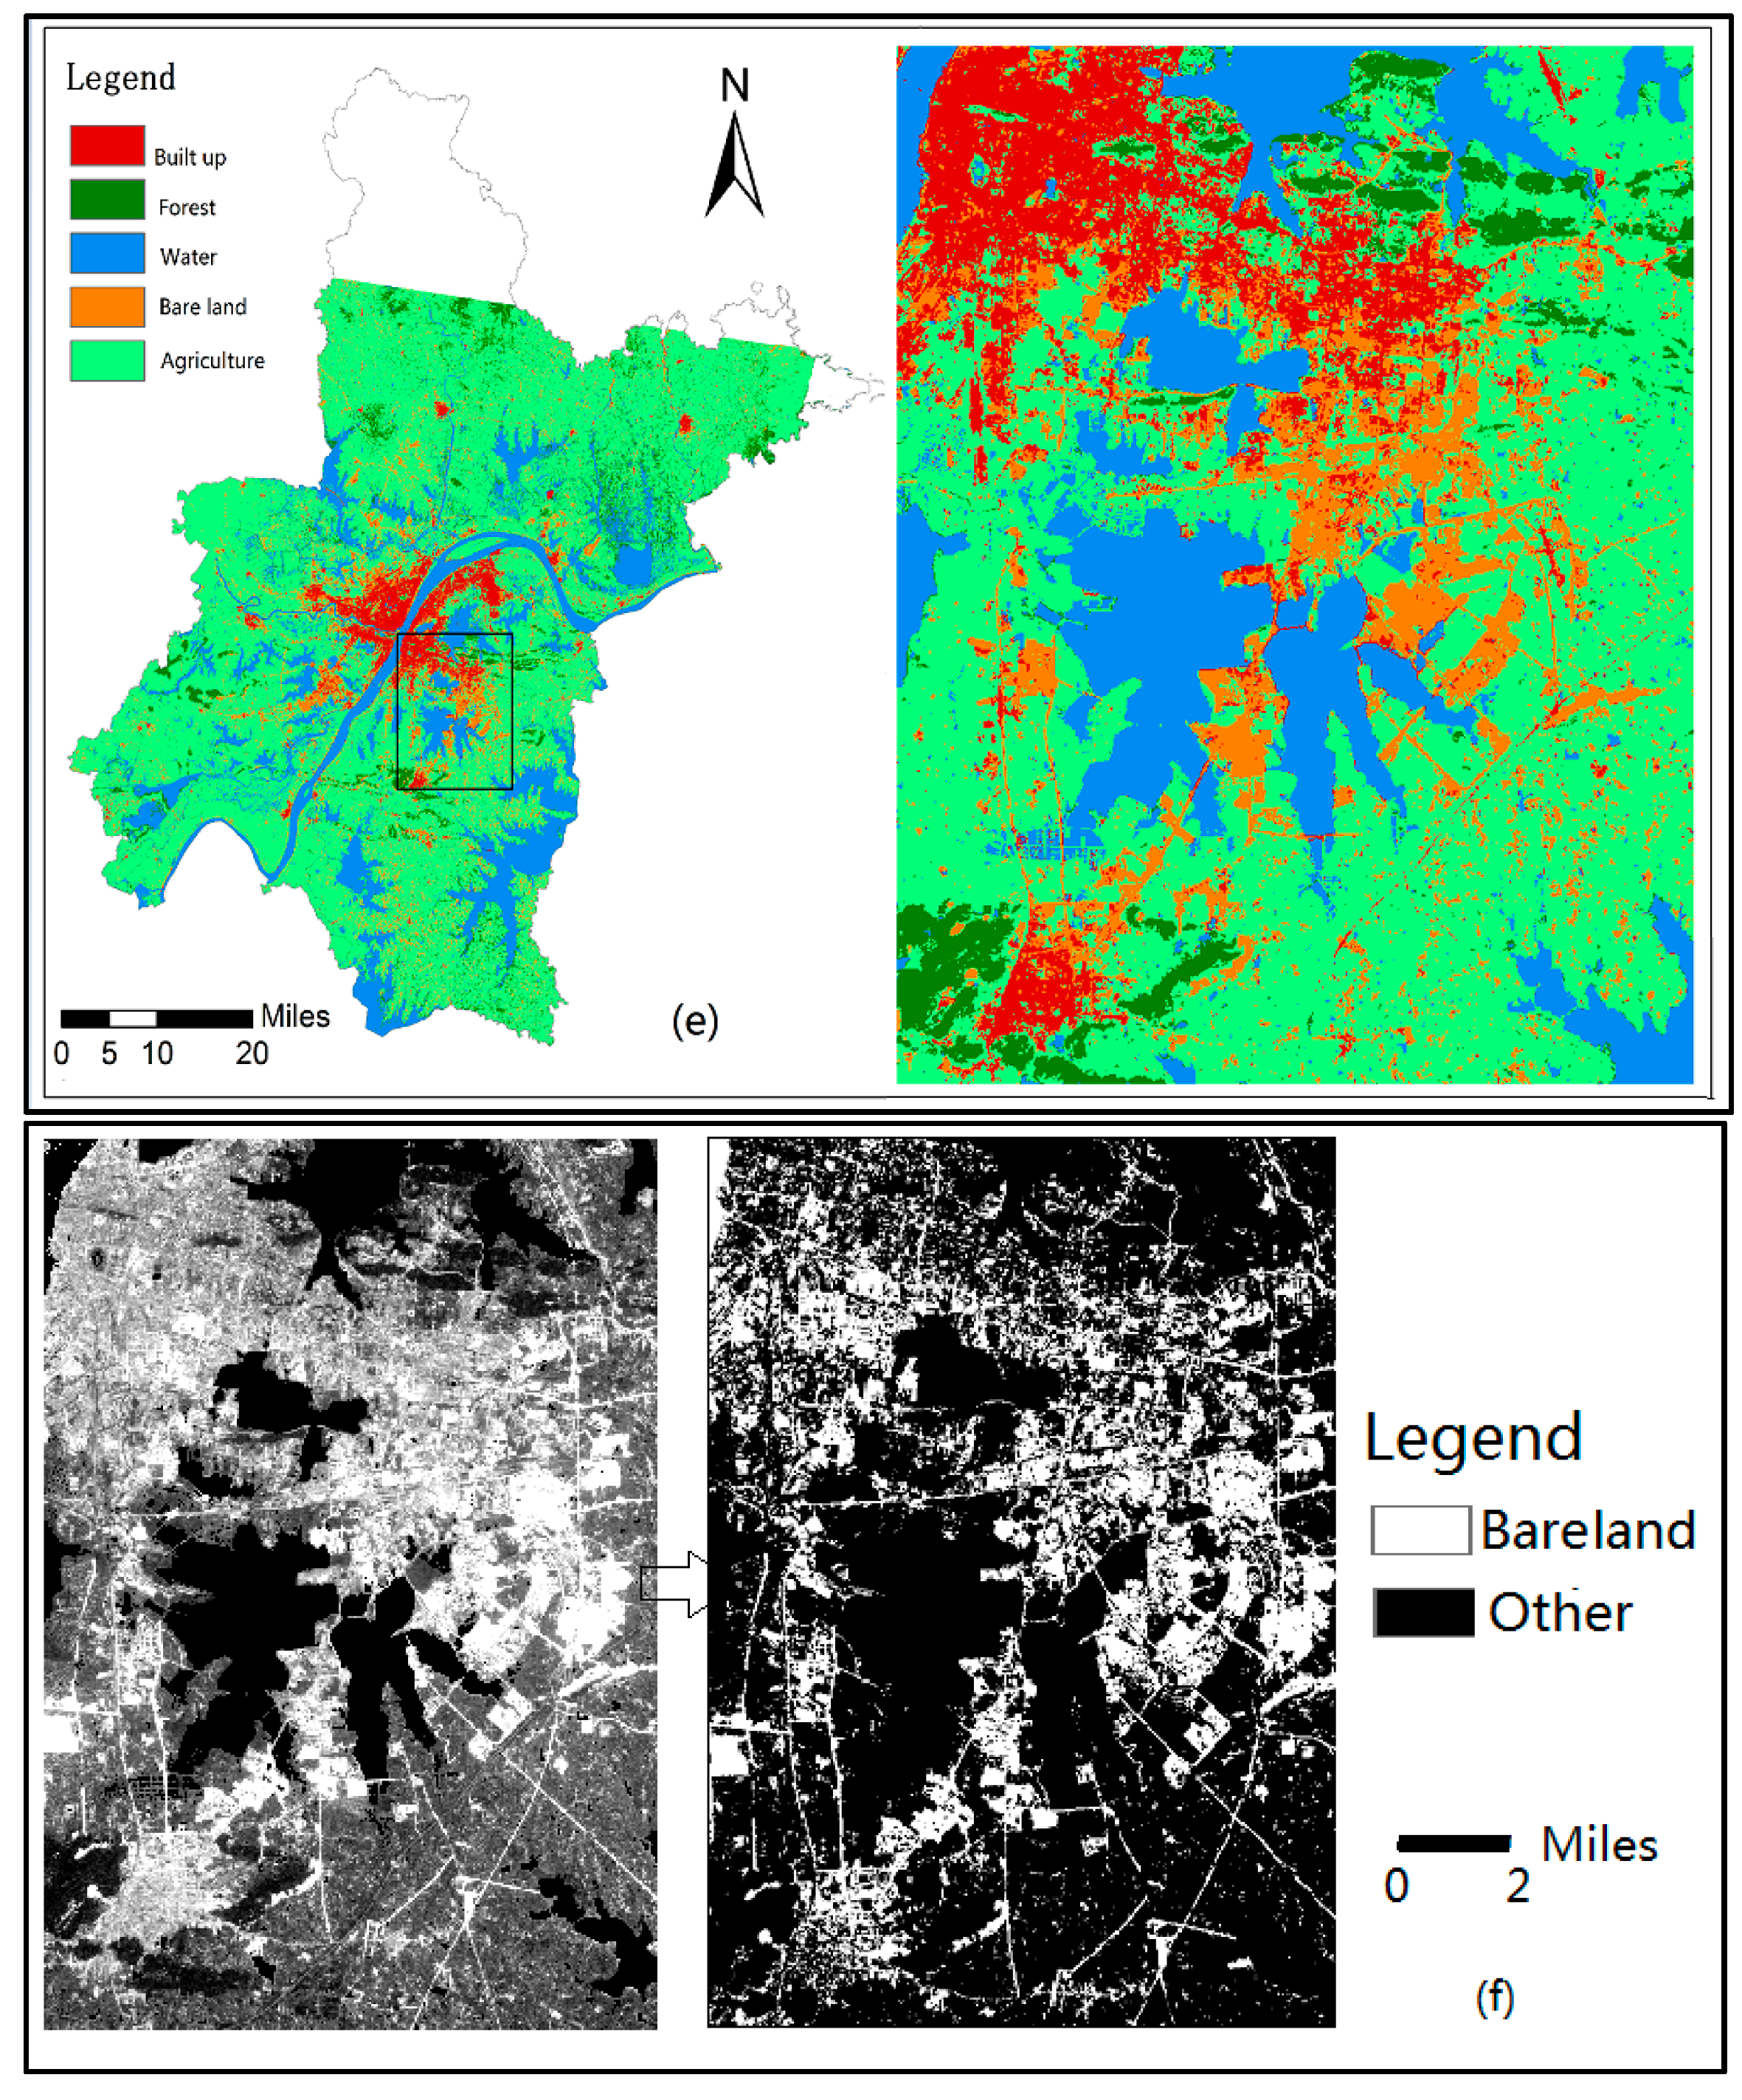
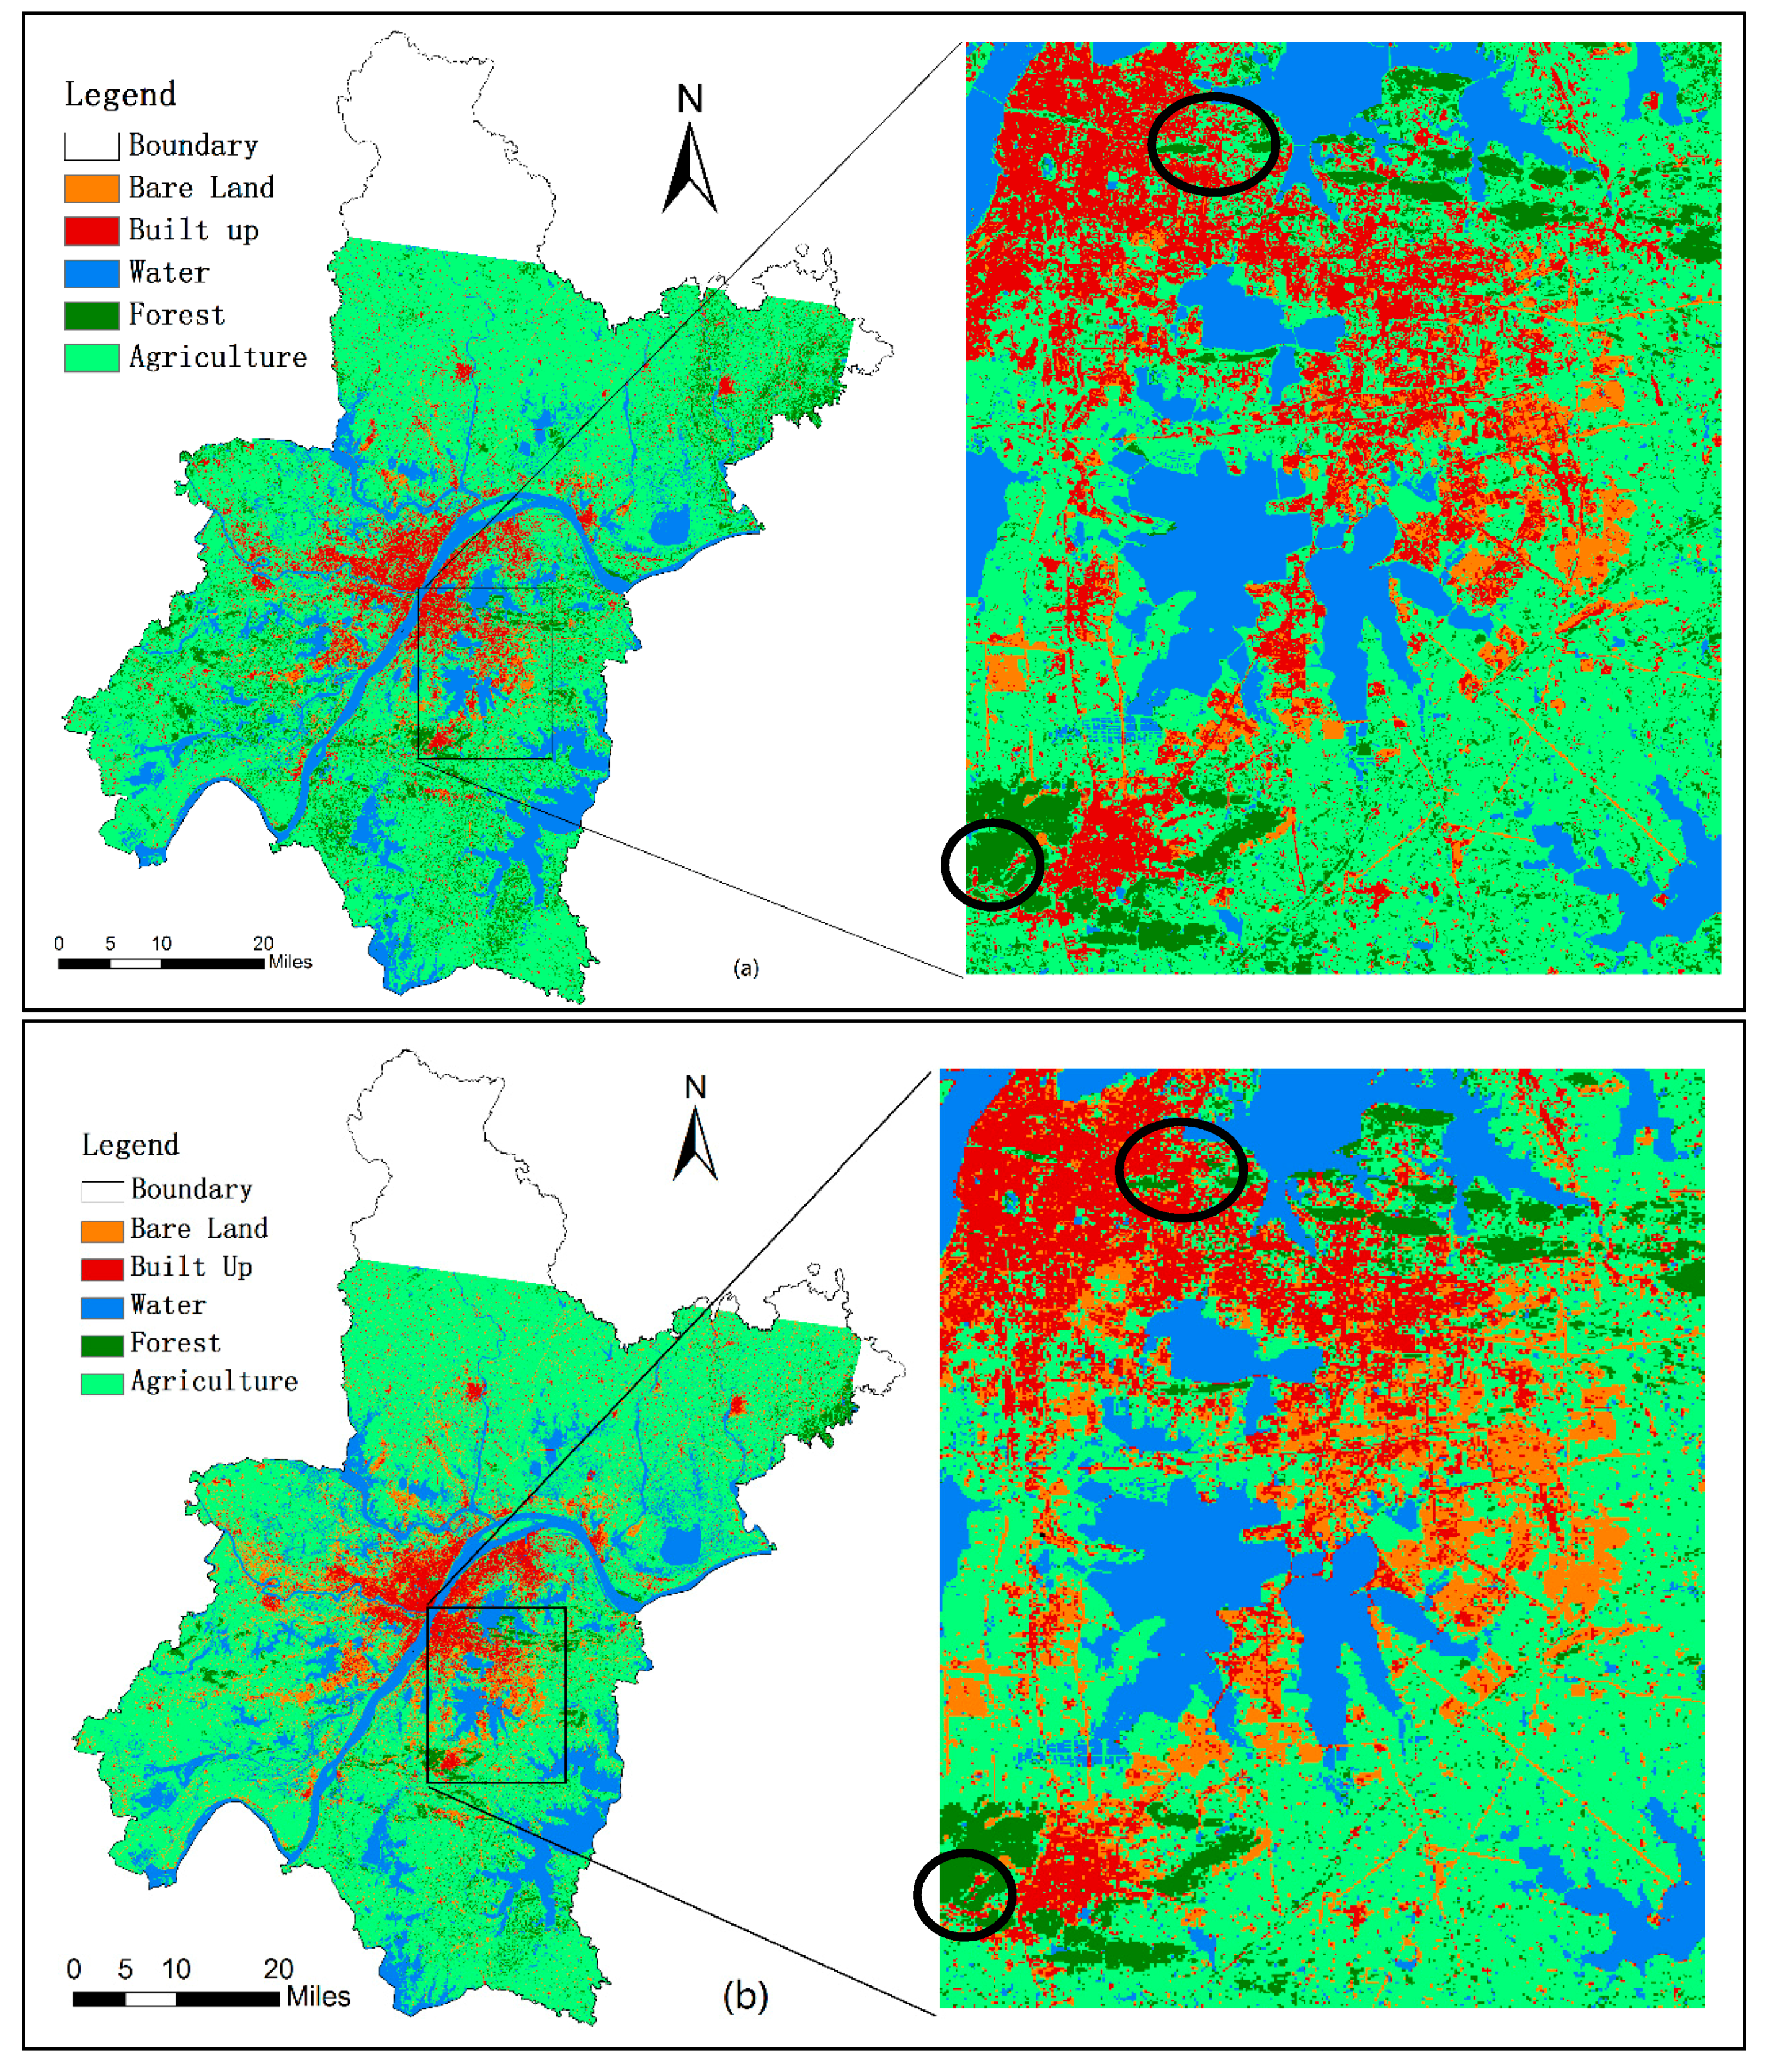
4.2. Unsupervised Classification
4.3. Supervised Classification
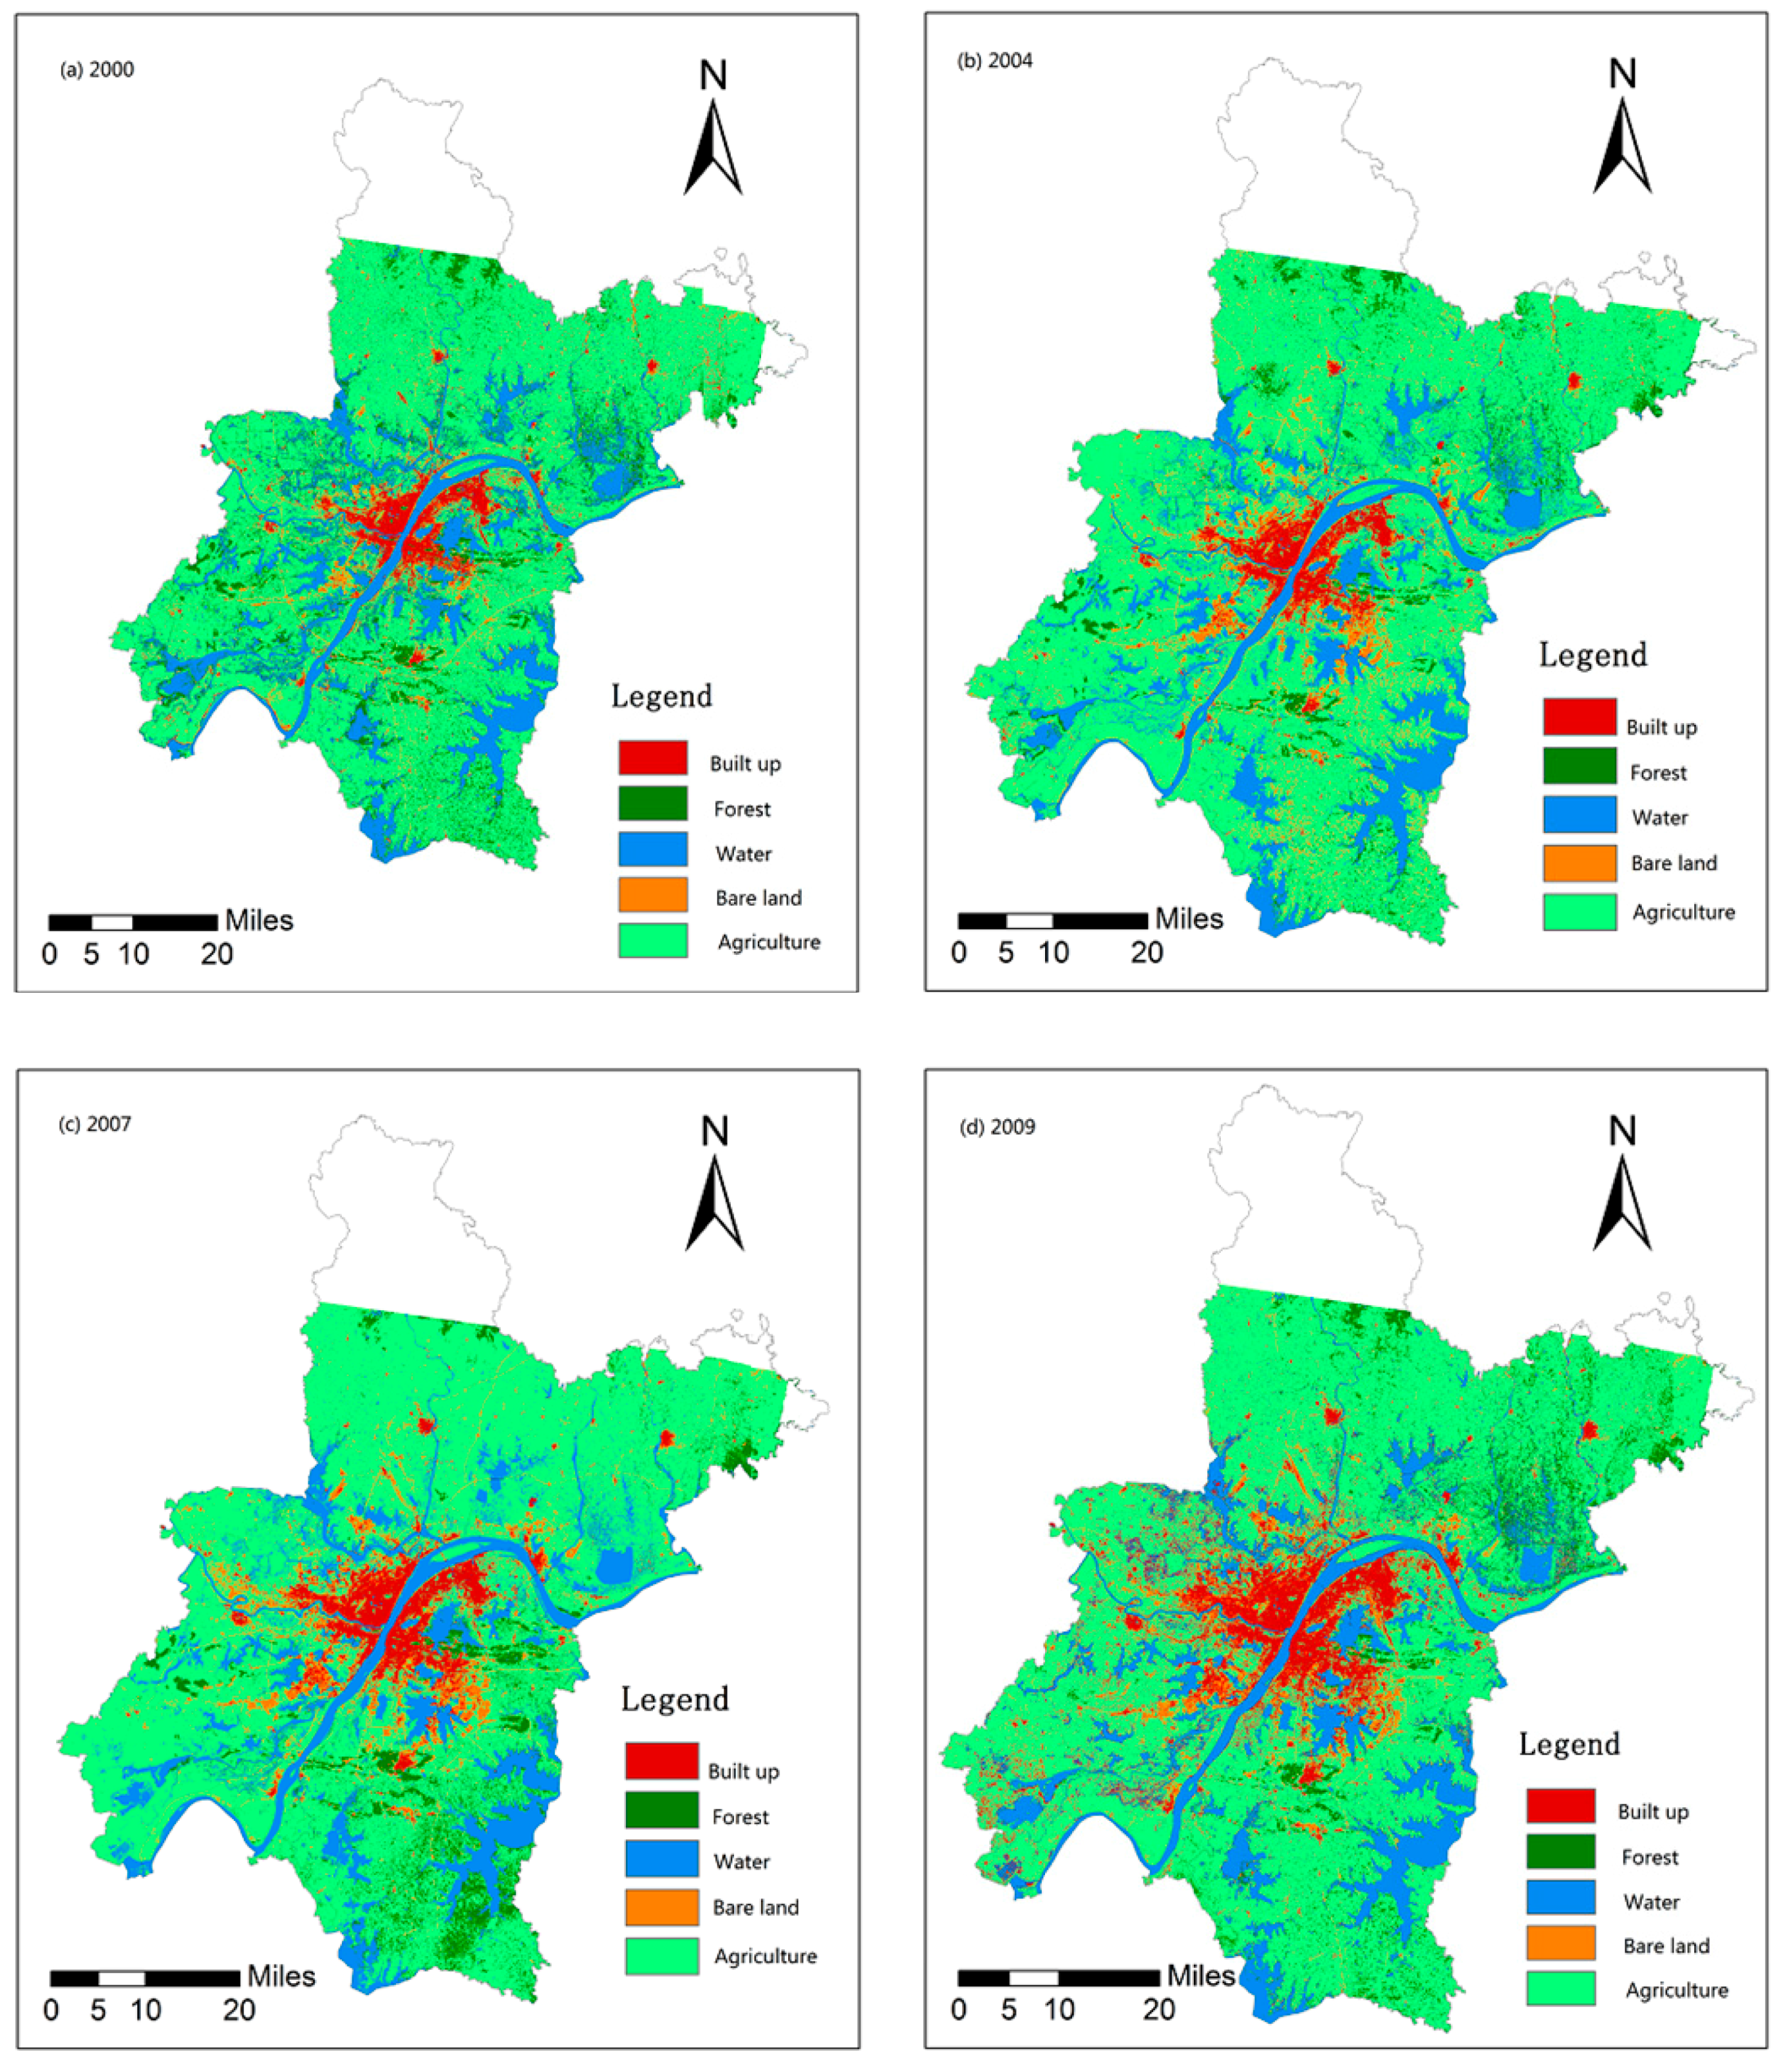
4.4. Time Series Image Analysis
4.5. Another Example
5. Discussion
5.1. Characteristics of the Automatic Method
5.2. Analyses on Urbanization of Wuhan
6. Conclusions
Acknowledgments
Author Contributions
Conflicts of Interest
References
- Dewan, A.M.; Yamaguchi, Y. Land use and land cover change in Greater Dhaka, Bangladesh: Using remote sensing to promote sustainable urbanization. Appl. Geogr. 2009, 29, 390–401. [Google Scholar] [CrossRef]
- Kontgis, C.; Schneider, A.; Fox, J.; Saksena, S.; Spencer, H.J. Castrence, M. Monitoring peri-urbanization in the greater Ho Chi Minh City metropolitan area. Appl. Geogr. 2014, 53, 377–388. [Google Scholar] [CrossRef]
- Dewan, A.M.; Kabir, M.H.; Nahar, K.; Rahman, M.Z. Urbanisation and environmental degradation in Dhaka Metropolitan Area of Bangladesh. Int. J. Environ. Sustain. Dev. 2012, 11, 118–147. [Google Scholar] [CrossRef]
- Byomkesh, T.; Nakagoshi, N.; Dewan, A.M. Urbanization and green space dynamics in Greater Dhaka, Bangladesh. Landsc. Ecol. Eng. 2012, 8, 45–58. [Google Scholar] [CrossRef]
- Dewan, A.M.; Yamaguchi, Y.; Rahman, M. Dynamics of land use/cover changes and the analysis of landscape fragmentation in Dhaka Metropolitan, Bangladesh. GeoJournal 2012, 77, 315–330. [Google Scholar] [CrossRef]
- Trotter, L.; Dewan, A.; Robinson, T. Effects of rapid urbanisation on the urban thermal environment between 1990 and 2011 in Dhaka Megacity, Bangladesh. AIMS Environ. Sci. 2017, 4, 145–167. [Google Scholar] [CrossRef]
- Mohan, M.; Kandya, A. Impact of urbanization and land-use/land-cover change on diurnal temperature range: A case study of tropical urban airshed of India using remote sensing data. Sci. Total Environ. 2015, 506, 453–465. [Google Scholar] [CrossRef] [PubMed]
- Hai, M.P.; Yamaguchi, Y. Urban growth and change analysis using remote sensing and spatial metrics from 1975 to 2003 for Hanoi, Vietnam. Int. J. Remote Sens. 2011, 32, 1901–1915. [Google Scholar]
- Chen, X. Using remote sensing and GIS to analyse land cover change and its impacts on regional sustainable development. Int. J. Remote Sens. 2002, 23, 107–124. [Google Scholar]
- Corner, R.J.; Dewan, A.M.; Chakma, S. Monitoring and Prediction of Land-Use and Land-Cover (LULC) Change. In Dhaka Megacity-Geospatial Perspectives on Urbanisation, Environment and Health; Dewan, A., Corner, R., Eds.; Springer: New York, NY, USA, 2013; pp. 75–98. [Google Scholar]
- Xiao, L.; Yang, X.; Cai, H.; Zhang, D. Cultivated Land Changes and Agricultural Potential Productivity in Mainland China. Sustainability 2015, 7, 11893–11908. [Google Scholar] [CrossRef]
- Ma, Y.; Wu, H.P.; Wang, L.Z.; Huang, B.M.; Ranjan, R.; Zomaya, A.; Jie, W. Remote sensing big data computing: Challenges and opportunities. Future Gener. Comp. Syst. 2015, 51, 47–60. [Google Scholar] [CrossRef]
- Adjorlolo, C.; Mutanga, O.; Cho, M.A.; Ismail, R. Challenges and opportunities in the use of remote sensing for C3 and C4 grass species discrimination and mapping. Afr. J. Range Forage Sci. 2012, 5490, 563–573. [Google Scholar]
- Aghakouchak, A.; Farahmand, A.; Melton, F.S.; Teixeira, J.; Anderson, M.C.; Wardlow, B.D.; Hain, C.R. Remote sensing of drought: Progress, challenges and opportunities. Rev. Geophys. 2015, 53, 452–480. [Google Scholar] [CrossRef]
- Carreiras, J.M.B.; Jones, J.; Lucas, R.M.; Gabrie, C. Land Use and Land Cover Change Dynamics across the Brazilian Amazon: Insights from Extensive Time-Series Analysis of Remote Sensing Data. PLoS ONE 2014, 9, e104144. [Google Scholar] [CrossRef] [PubMed]
- Salazara, A.; Baldib, G.; Hirotac, M.; Syktusa, J.; McAlpin, C. Land use and land cover change impacts on the regional climate of non-Amazonian South America: A review. Glob. Planet. Chang. 2015, 128, 103–119. [Google Scholar] [CrossRef]
- Paul, S.; Ghosh, S.; Oglesby, R.; Pathak, A.; Chandrasekharan, A.; Ramsankaran, R.A.A.J. Weakening of Indian Summer Monsoon Rainfall due to Changes in Land Use Land Cover. Sci. Rep. 2016, 6, 32177. [Google Scholar] [CrossRef] [PubMed]
- Bey, A.; Díaz, A.S.; Maniatis, D.; Marchi, G.; Mollicone, D.; Ricci, S.; Bastin, J.-F.; Moore, R.; Federici, S.; Rezende, M.; et al. Collect Earth: Land Use and Land Cover Assessment through Augmented Visual Interpretation. Remote Sens. 2016, 8, 807. [Google Scholar] [CrossRef]
- Zhong, L.; Hawkins, T.; Biging, G.; Gong, P. A phenology-based approach to map crop types in the San Joaquin Valley, California. Int. J. Remote Sens. 2011, 32, 7777–7804. [Google Scholar] [CrossRef]
- Rodriguez-Galiano, V.F.; Chica-Olmo, M.; Abarca-Hernandez, F.; Atkinson, P.M.; Jeganathan, C. Random Forest classification of Mediterranean land cover usingmulti-seasonal imagery and multi-seasonal texture. Remote Sens. Environ. 2012, 121, 93–107. [Google Scholar] [CrossRef]
- Serra, P.; More, G.; Pons, X. Thematic accuracy consequences in cadastre land-cover enrichment from a pixel and from a polygon perspective. Photogramm. Eng. Remote Sens. 2009, 75, 1441–1449. [Google Scholar] [CrossRef]
- Shao, Y.; Lunetta, R.S.; Ediriwickrema, J.; Liames, J. Mapping cropland and major crop types across the great lakes basin using MODIS-NDVI data. Photogramm. Eng. Remote Sens. 2010, 76, 73–84. [Google Scholar] [CrossRef]
- Pena-Barragan, J.M.; Ngugi, M.K.; Plant, R.E.; Six, J. Object-based crop identification using multiple vegetation indices, textural features and crop phenology. Remote Sens. Environ. 2011, 115, 1301–1316. [Google Scholar] [CrossRef]
- Thenkabail, P.S.; Biradar, C.M.; Noojipady, P.; Dheeravath, V.; Li, Y.; Velpuri, M.; Gunna, O.R.P.; Gangalakunta, H.; Turral, X.; Cai, J.; et al. Global irrigated area map (GIAM), derived from remote sensing, for the end of the last millennium. Int. J. Remote Sens. 2009, 30, 3679–3733. [Google Scholar] [CrossRef]
- Baraldi, A. Satellite Image Automatic Mapper™ (SIAM™)—A Turnkey software executable for automatic near real-time multi-sensor multi-resolution spectral rule-based preliminary classification of spaceborne multi-spectral images. Recent Pat. Space Technol. 2011, 1, 81–106. [Google Scholar] [CrossRef]
- Hestir, E.L.; Greenberg, J.A.; Ustin, S.L. Classification trees for aquatic vegetation community prediction from imaging spectroscopy. IEEE J. Sel. Top. Appl. Earth Obs. Remote Sens. 2012, 5, 1572–1584. [Google Scholar] [CrossRef]
- Zhong, L.; Gong, P.; Biging, G.S. Efficient corn and soybean mapping with temporal extendability: A multi-year experiment using Landsat imagery. Remote Sens. Environ. 2014, 140, 1–13. [Google Scholar] [CrossRef]
- Xu, H.Q. Modification of Normalized Difference Water Index (NDWI) to Enhance Open Water Features in Remotely Sensed Imagery. Int. J. Remote Sens. 2006, 27, 3025–3033. [Google Scholar] [CrossRef]
- Xu, H.Q. Analysis of impervious surface and its impact on urban heat environment using the Normalized Difference Impervious Surface Index (NDISI). Photogramm. Eng. Remote Sens. 2010, 76, 557–565. [Google Scholar] [CrossRef]
- Tucker, C.J. Red and photographic infrared linear combinations for monitoring vegetation. Remote Sens. Environ. 1979, 8, 127–150. [Google Scholar] [CrossRef]
- Nouri, H.; Beecham, S.; Anderson, S.; Nagler, P. High Spatial Resolution WorldView-2 Imagery for Mapping NDVI and Its Relationship to Temporal Urban Landscape Evapotranspiration Factors. Remote Sens. 2014, 6, 580–602. [Google Scholar] [CrossRef]
- Jiang, Z.; Huete, A.R.; Didan, K.; Miura, T. Development of a two-band Enhanced Vegetation Index without a blue band. Remote Sens. Environ. 2008, 112, 3833–3845. [Google Scholar] [CrossRef]
- Zhong, C.; Wang, C.Z.; Wu, C.S. MODIS-based Crop Mapping in the U.S. Midwest with Spatially Constrained Phenology Mixture Analysis. Remote Sens. 2015, 7, 512–529. [Google Scholar] [CrossRef]
- Gao, B.C. NDWI—A normalized difference water index for remote sensing of vegetation liquid water from space. Remote Sens. Environ. 1996, 58, 257–266. [Google Scholar] [CrossRef]
- Mcfeeters, S.K. The use of normalized difference water index (NDWI) in the delineation of open water features. Int. J. Remote Sens. 1996, 17, 1425–1432. [Google Scholar] [CrossRef]
- Zha, Y.; Gao, J.; Ni, S. Use of normalized difference built-up index in automatically mapping urban areas from TM imagery. Int. J. Remote Sens. 2003, 24, 583–594. [Google Scholar] [CrossRef]
- Zhao, H.M.; Chen, X.L. Use of Normalized Difference Bareness Index in Quickly Mapping Bare Areas from TM/ETM+. In Proceedings of the 2005 IEEE International Geoscience and Remote Sensing Symposium, Seoul, Korea, 29 July 2005; Volume 3, pp. 1666–1668. [Google Scholar]
- As-syakur, A.R.; Adnyana, I.W.; Arthana, I.W.; Nuarsa, I.W. Enhanced Built-Up and Bareness Index (EBBI) for Mapping Built-Up and Bare Land in an Urban Area. Remote Sens. 2012, 4, 2957–2970. [Google Scholar] [CrossRef]
- Gu, Y.; Hunt, E.; Wardlow, B.; Basara, J.B.; Brown, J.F.; Verdin, J.P. Evaluation of MODIS NDVI and NDWI for vegetation drought monitoring using Oklahoma Mesonet soil moisture data. Geophys. Res. Lett. 2008, 35, L22401. [Google Scholar] [CrossRef]
- Foreign News: On to Chicago. Time. 13 June 1938. Available online: http://content.time.com/time/magazine/article/0,9171,848985,00.html (accessed on 20 November 2015).
- Chicago Is All over the Place. Available online: http://articles.chicagotribune.com/2012-05-13/news/ct-talk-nato-chicago-0513-20120513_1_violent-crime-chicago-connection-south-america-s-chicago (accessed on 20 November 2015).
- Statistic Report of Economy and Social Development of Wuhan in 2014. Available online: http://www.whtj.gov.cn/downlist.aspx?id=2012111010461248&tn=2012111010454262 (accessed on 20 November 2015). (In Chinese)
- Statistic Report of Economy and Social Development of Wuhan in 2015. Available online: http://www.whtj.gov.cn/downlist.aspx?id=2012111010461248&tn=2012111010454262 (accessed on 20 November 2015). (In Chinese)
- The Main Source of PM2.5 in Wuhan Is the Dust of Construction Field. Available online: http://news.cnhubei.com/xw/wuhan/201412/t3115166.shtml (accessed on 20 November 2015). (In Chinese).
- Richardson, A.J.; Everitt, J.H. Using spectral vegetation indices to estimate rangeland productivity. Geocarto Int. 1992, 1, 63–69. [Google Scholar] [CrossRef]
- Kawamura, M.; Jayamana, S.; Tsujiko, Y. Relation between social and environmental conditions in Colombo Sri Lanka and the urban index estimated by satellite remote sensing data. Int. Arch. Photogramm. Remote Sens. 1996, 31, 321–326. [Google Scholar]
- Xu, H.Q. A new index for delineating built-up land features in satellite imagery. Int. J. Remote Sens. 2008, 29, 4269–4276. [Google Scholar] [CrossRef]
- Li, H.; Wang, C.Z.; Zhong, C.; Su, A.J.; Xiong, C.R.; Wang, J.E.; Liu, J.Q. Mapping Urban Bare Land Automatically from Landsat Imagery with a Simple Index. Remote Sens. 2017, 9, 249. [Google Scholar] [CrossRef]
- Huete, A.R. A soil-adjusted vegetation index (SAVI). Remote Sens. Environ. 1988, 25, 295–309. [Google Scholar] [CrossRef]
- Cabral, P. Délimitation d’aires urbaines à partir d’une image Landsat ETM+: Comparaison de méthodes de classification. Can. J. Remote Sens. 2007, 33, 422–430. [Google Scholar] [CrossRef]
- Lu, S.S.; Guan, X.L.; He, C.; Zhang, J.L. Spatio-Temporal Patterns and Policy Implications of Urban Land Expansion in Metropolitan Areas: A Case Study of Wuhan Urban Agglomeration, Central China. Sustainability 2014, 6, 4723–4748. [Google Scholar] [CrossRef]
- Li, L.Y.; Xu, T.B.; Chen, Y. Improved Urban Flooding Mapping from Remote Sensing Images Using Generalized Regression Neural Network-Based Super-Resolution Algorithm. Remote Sens. 2016, 8, 625. [Google Scholar] [CrossRef]
- Xie, Q.; Zhou, Z. Impact of urbanization on urban heat island effect based on TM imagery in Wuhan, China. Environ. Eng. Manag. J. 2015, 14, 647–655. [Google Scholar]
- Wu, H.; Sun, Y.; Shi, W.; Chen, X.; Fu, D. Examining the Satellite-Detected Urban Land Use Spatial Patterns Using Multidimensional Fractal Dimension Indices. Remote Sens. 2013, 5, 5152–5172. [Google Scholar] [CrossRef]
- Yang, Y.T.; Wang, Y.; Wu, K.; Yu, X. Classification of Complex Urban Fringe Land Cover Using Evidential Reasoning Based on Fuzzy Rough Set: A Case Study of Wuhan City. Remote Sens. 2016, 8, 304. [Google Scholar] [CrossRef]
- Gao, Q.; Liu, Y.T.; Mao, H.Y. Environmental influence of Wuhan urban agglomeration development and strategies of environmental protection. J. Environ. Sci. 2006, 18, 616–623. [Google Scholar]
- Wuhan Environmental Protection Bureau. Report of Wuhan Environment in 2013. Available online: http://www.whepb.gov.cn/hbHjzkgb/11941.jhtml (accessed on 10 June 2017). (In Chinese)


| Captured Date | Sensor | Bands | Spatial Resolution (m) | Cloud Amount (%) |
|---|---|---|---|---|
| 27 July 2000 | TM | 7 | 30 | 5.0 |
| 24 September 2004 | TM | 7 | 30 | 0.00 |
| 31 July 2007 | TM | 7 | 30 | 0.01 |
| 6 September 2009 | TM | 7 | 30 | 0.06 |
| 8 June 2011 | TM | 7 | 30 | 0.00 |
| 16 August 2013 | OLI & TIRS | 11 | 30 | 13.88 |
| Type | Index | Formula | Reference |
|---|---|---|---|
| Vegetation index | [45] | ||
| [30] | |||
| Water index | [35] | ||
| [34] | |||
| [28] | |||
| built-up Index | [36] | ||
| [46] | |||
| [47] | |||
| Bare land index | [37] | ||
| [38] | |||
| [48] |
| Classification | Ground Truth | Accuracy | ||||||
|---|---|---|---|---|---|---|---|---|
| Agriculture | Bare Land | Built-Up | Forest | Water | Total | Prod. Acc. (%) | User Acc. (%) | |
| Agriculture | 179 | 0 | 4 | 70 | 4 | 257 | 89.5 | 69.65 |
| Bare land | 0 | 187 | 0 | 0 | 0 | 187 | 92.57 | 100.00 |
| built-up | 10 | 15 | 196 | 0 | 0 | 221 | 98.00 | 88.69 |
| forest | 5 | 0 | 0 | 136 | 0 | 141 | 66.02 | 96.45 |
| water | 6 | 0 | 0 | 0 | 220 | 226 | 98.21 | 97.35 |
| Total | 200 | 202 | 200 | 206 | 224 | 1032 | ||
| Overall accuracy = 918/1032 = 88.95% | ||||||||
| Kappa Coefficient = 0.8619 | ||||||||
| Classification | Ground Truth | Accuracy | ||||||
|---|---|---|---|---|---|---|---|---|
| Bare Land | Built-Up | Forest | Agriculture | Water | Total | Prod. Acc. (%) | User Acc. (%) | |
| Bare land | 152 | 0 | 0 | 0 | 0 | 152 | 75.25 | 100.00 |
| built-up | 44 | 179 | 0 | 6 | 0 | 229 | 89.50 | 78.17 |
| forest | 0 | 0 | 194 | 19 | 0 | 213 | 94.17 | 91.08 |
| Agriculture | 6 | 21 | 11 | 169 | 3 | 210 | 84.50 | 80.48 |
| water | 0 | 0 | 1 | 6 | 221 | 228 | 98.66 | 96.93 |
| Total | 202 | 200 | 206 | 200 | 224 | 1032 | ||
| Overall accuracy = 915/1032 = 88.66% | ||||||||
| Kappa Coefficient = 0.8582 | ||||||||
| Classification | Ground Truth | Accuracy | ||||||
|---|---|---|---|---|---|---|---|---|
| Agriculture | Bare Land | Built-Up | Forest | Water | Total | Prod. Acc. (%) | User Acc. (%) | |
| Agriculture | 179 | 1 | 6 | 0 | 0 | 186 | 89.50 | 87.75 |
| Bare land | 2 | 187 | 0 | 18 | 0 | 207 | 92.57 | 98.94 |
| built-up | 10 | 13 | 194 | 0 | 0 | 217 | 97.00 | 89.40 |
| forest | 0 | 0 | 0 | 187 | 0 | 187 | 90.78 | 100.00 |
| water | 9 | 1 | 0 | 1 | 224 | 235 | 100.00 | 95.32 |
| Total | 200 | 202 | 200 | 206 | 224 | 1032 | ||
| Overall accuracy = 971/1032 = 94.09% | ||||||||
| Kappa Coefficient = 0.9261 | ||||||||
| From Class | To Class | 2000–2004 | 2004–2007 | 2007–2009 | 2009–2011 | 2011–2013 |
|---|---|---|---|---|---|---|
| Water bodies | built-up | 2.92 | 4.3 | 4.04 | 3.73 | 2.58 |
| Bare land | 3.60 | 2.11 | 5.26 | 2.79 | 3.06 | |
| agricultural land | built-up | 31.85 | 29.56 | 36.27 | 28.97 | 31.10 |
| Bare land | 100.7 | 107.65 | 84.20 | 106.39 | 92.11 | |
| Forest | built-up | 1.54 | 3.46 | 4.86 | 1.80 | 0.86 |
| Bare land | 9.27 | 8.93 | 2.37 | 1.76 | 2.66 | |
| Bare land | built-up | 35.21 | 82.80 | 77.50 | 93.53 | 75.91 |
© 2017 by the authors. Licensee MDPI, Basel, Switzerland. This article is an open access article distributed under the terms and conditions of the Creative Commons Attribution (CC BY) license (http://creativecommons.org/licenses/by/4.0/).
Share and Cite
Li, H.; Wang, C.; Zhong, C.; Zhang, Z.; Liu, Q. Mapping Typical Urban LULC from Landsat Imagery without Training Samples or Self-Defined Parameters. Remote Sens. 2017, 9, 700. https://doi.org/10.3390/rs9070700
Li H, Wang C, Zhong C, Zhang Z, Liu Q. Mapping Typical Urban LULC from Landsat Imagery without Training Samples or Self-Defined Parameters. Remote Sensing. 2017; 9(7):700. https://doi.org/10.3390/rs9070700
Chicago/Turabian StyleLi, Hui, Cuizhen Wang, Cheng Zhong, Zhi Zhang, and Qingbin Liu. 2017. "Mapping Typical Urban LULC from Landsat Imagery without Training Samples or Self-Defined Parameters" Remote Sensing 9, no. 7: 700. https://doi.org/10.3390/rs9070700
APA StyleLi, H., Wang, C., Zhong, C., Zhang, Z., & Liu, Q. (2017). Mapping Typical Urban LULC from Landsat Imagery without Training Samples or Self-Defined Parameters. Remote Sensing, 9(7), 700. https://doi.org/10.3390/rs9070700