Aerosol Property Retrieval Algorithm over Northeast Asia from TANSO-CAI Measurements Onboard GOSAT

 ,
,  ,
,
Abstract
:
1. Introduction
2. Aerosol Models and LUT over Northeast Asia
2.1. Aerosol Models
2.2. Construction of LUT
2.3. Reflectance Correction with Radiometric Degradation Radiances
2.4. Description of Data Mask
2.4.1. Mask of Swath Edge
2.4.2. Mask of Cloud
2.4.3. Mask of Turbid Water
2.4.4. Mask of Sun Glint over Ocean
2.5. TANSO-CAI Retrieval Grid Boxes
2.6. Surface Reflectance Retrieval
2.7. Reflectance Difference Test to Select Aerosol Type from LUTs
3. Results of TANSO-CAI Aerosol Products
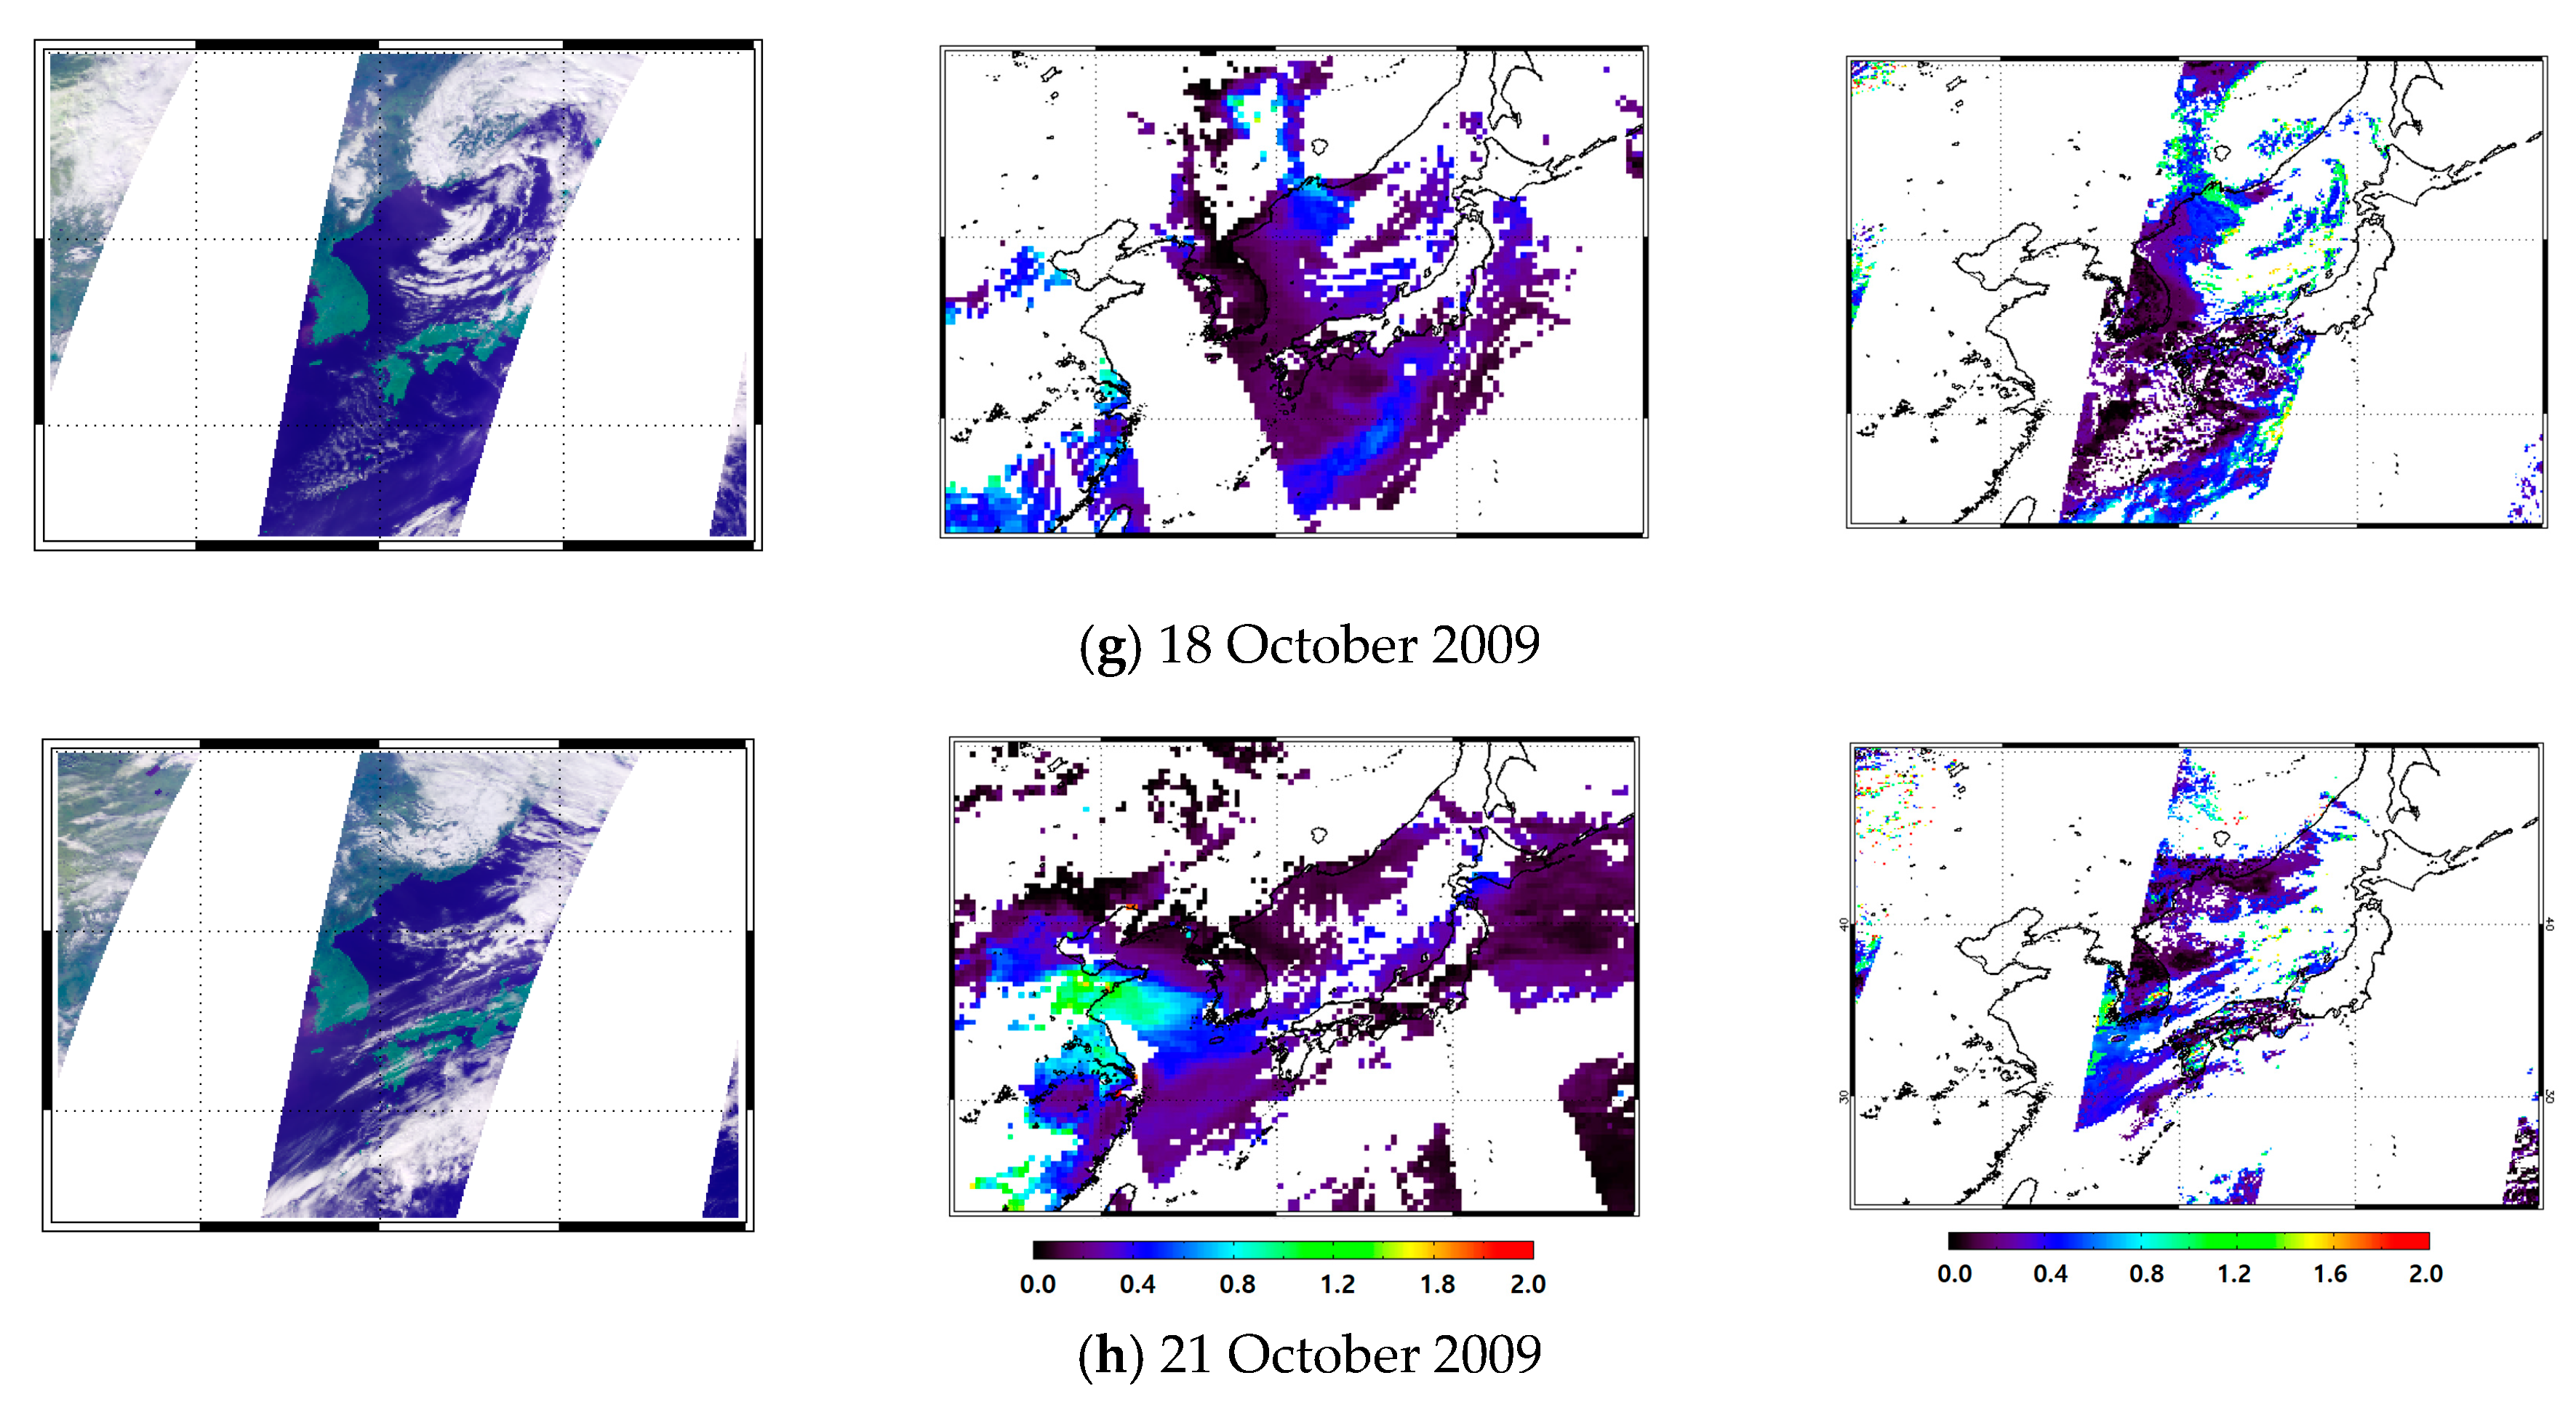
3.1. Results from the Algorithm
3.2. Comparison of Aerosol Products
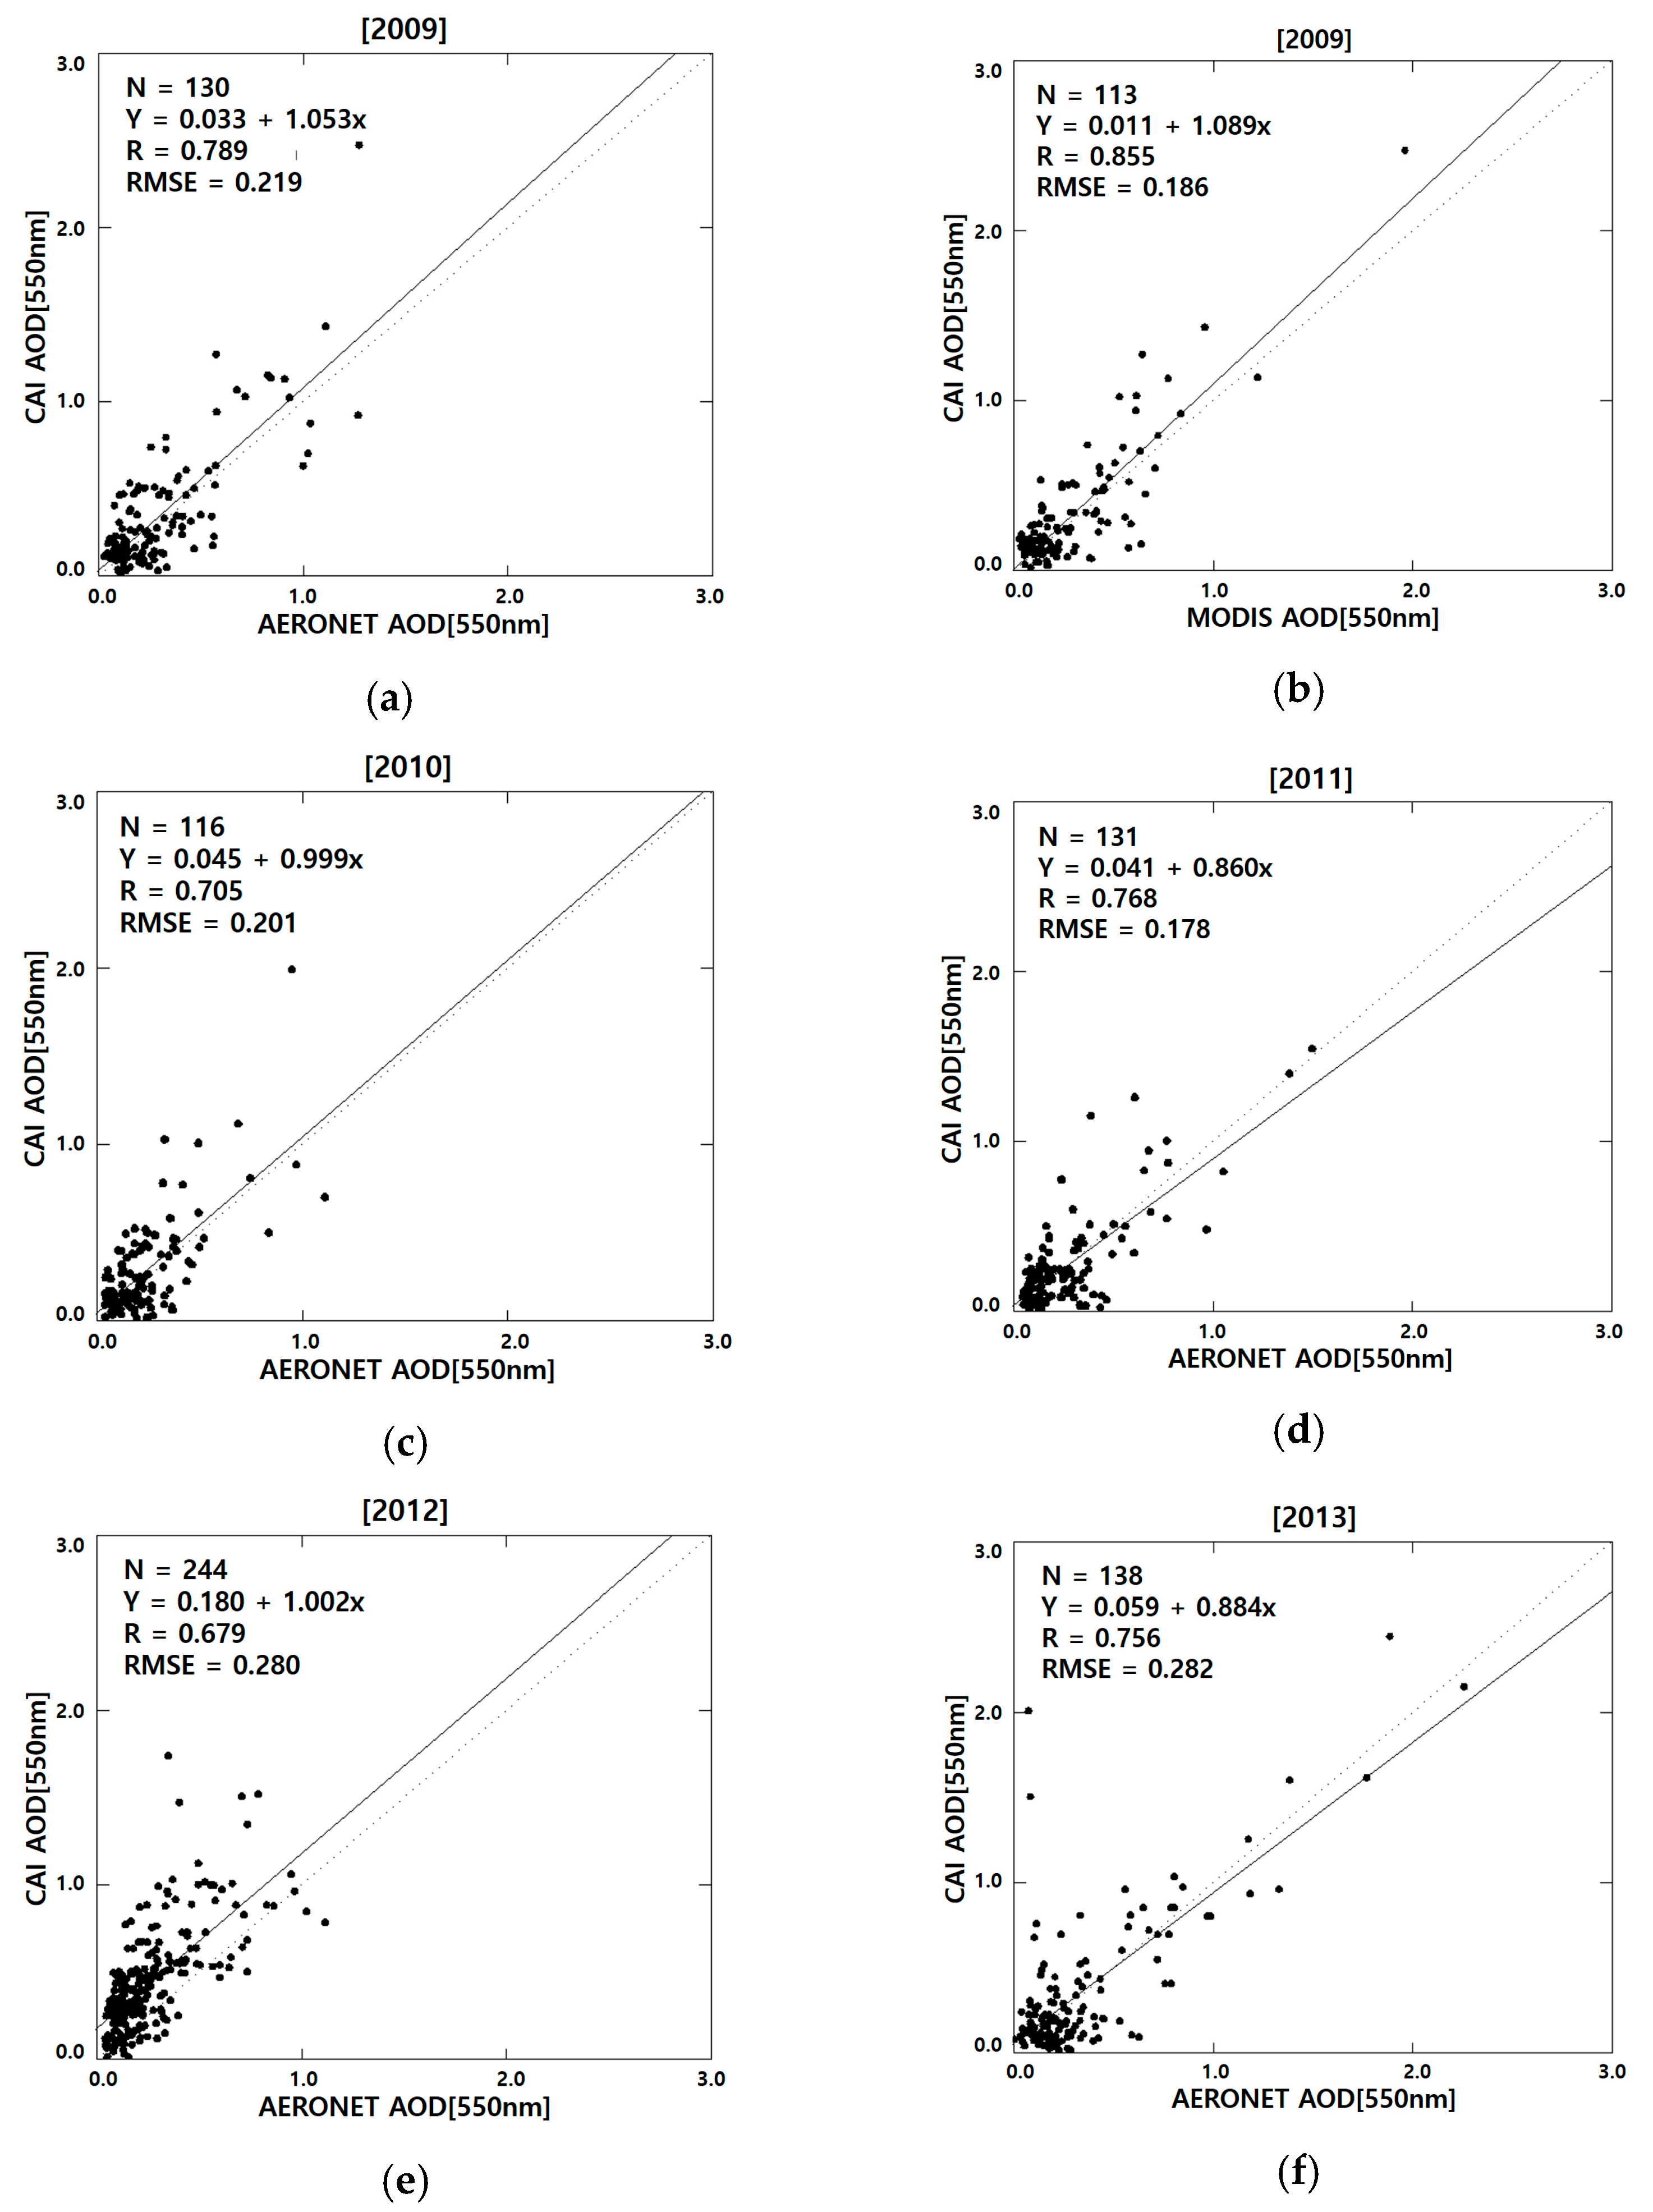
3.2.1. Validation of Retrieved AOD with AERONET
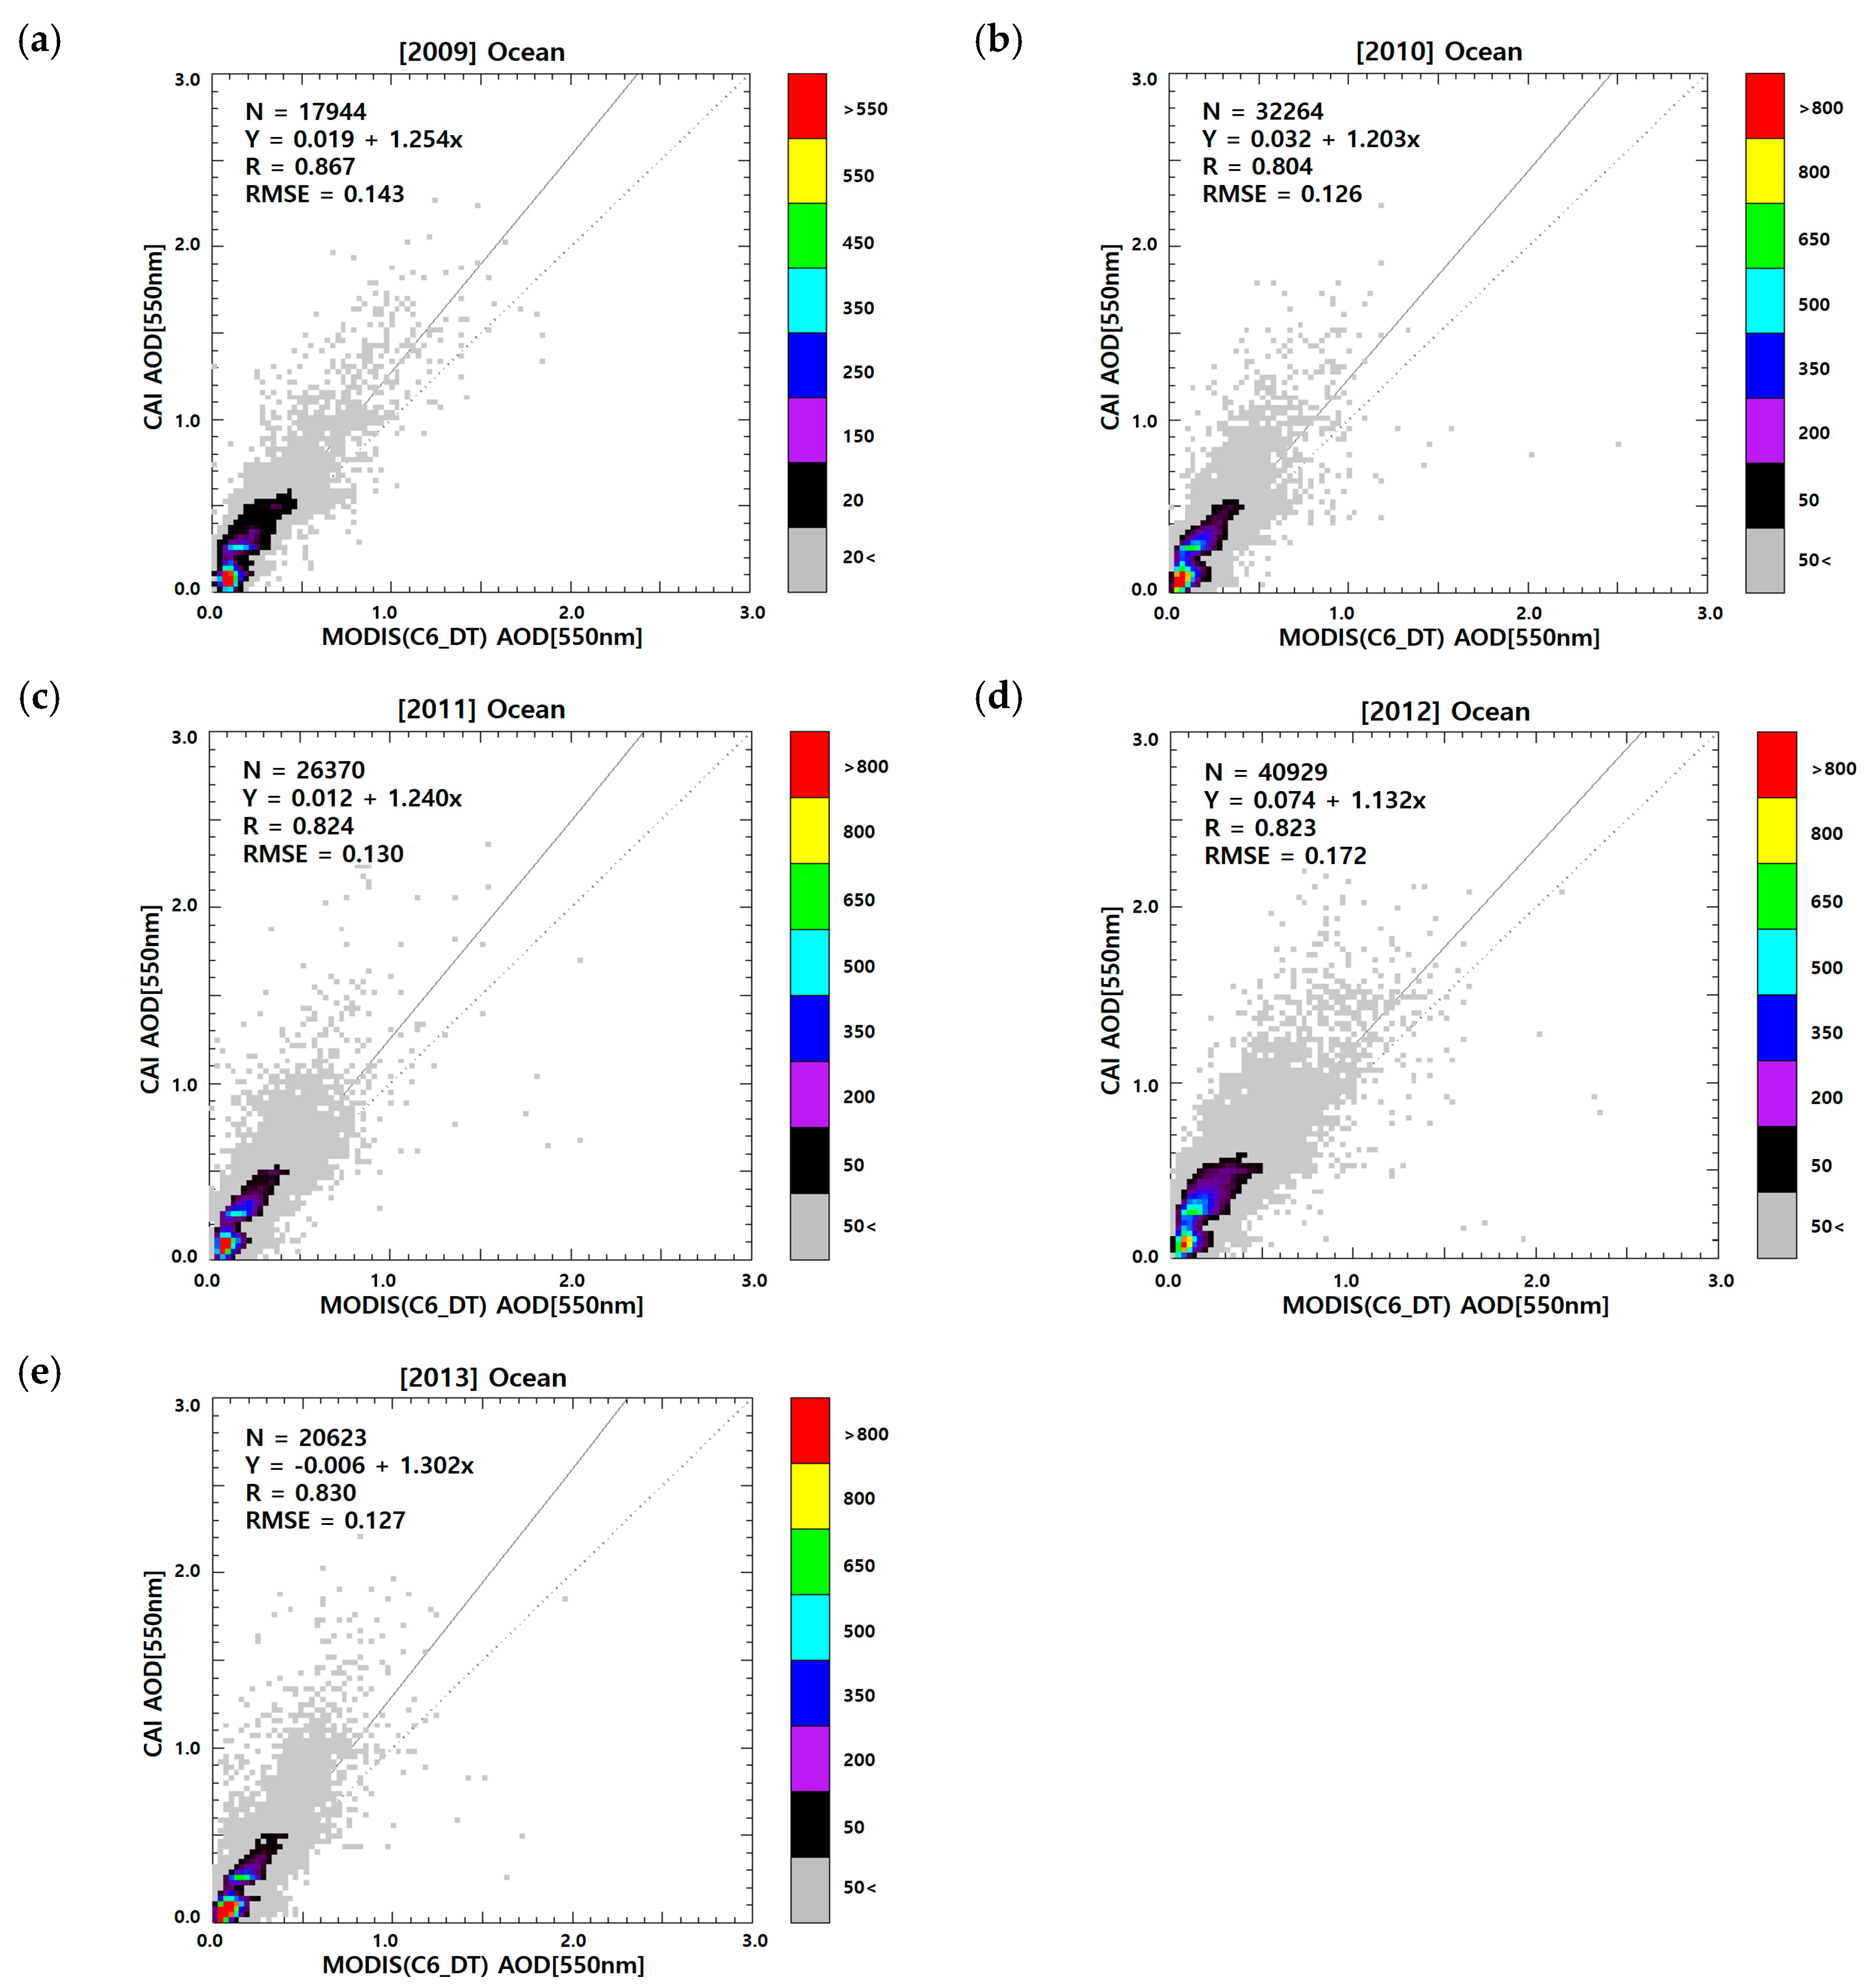
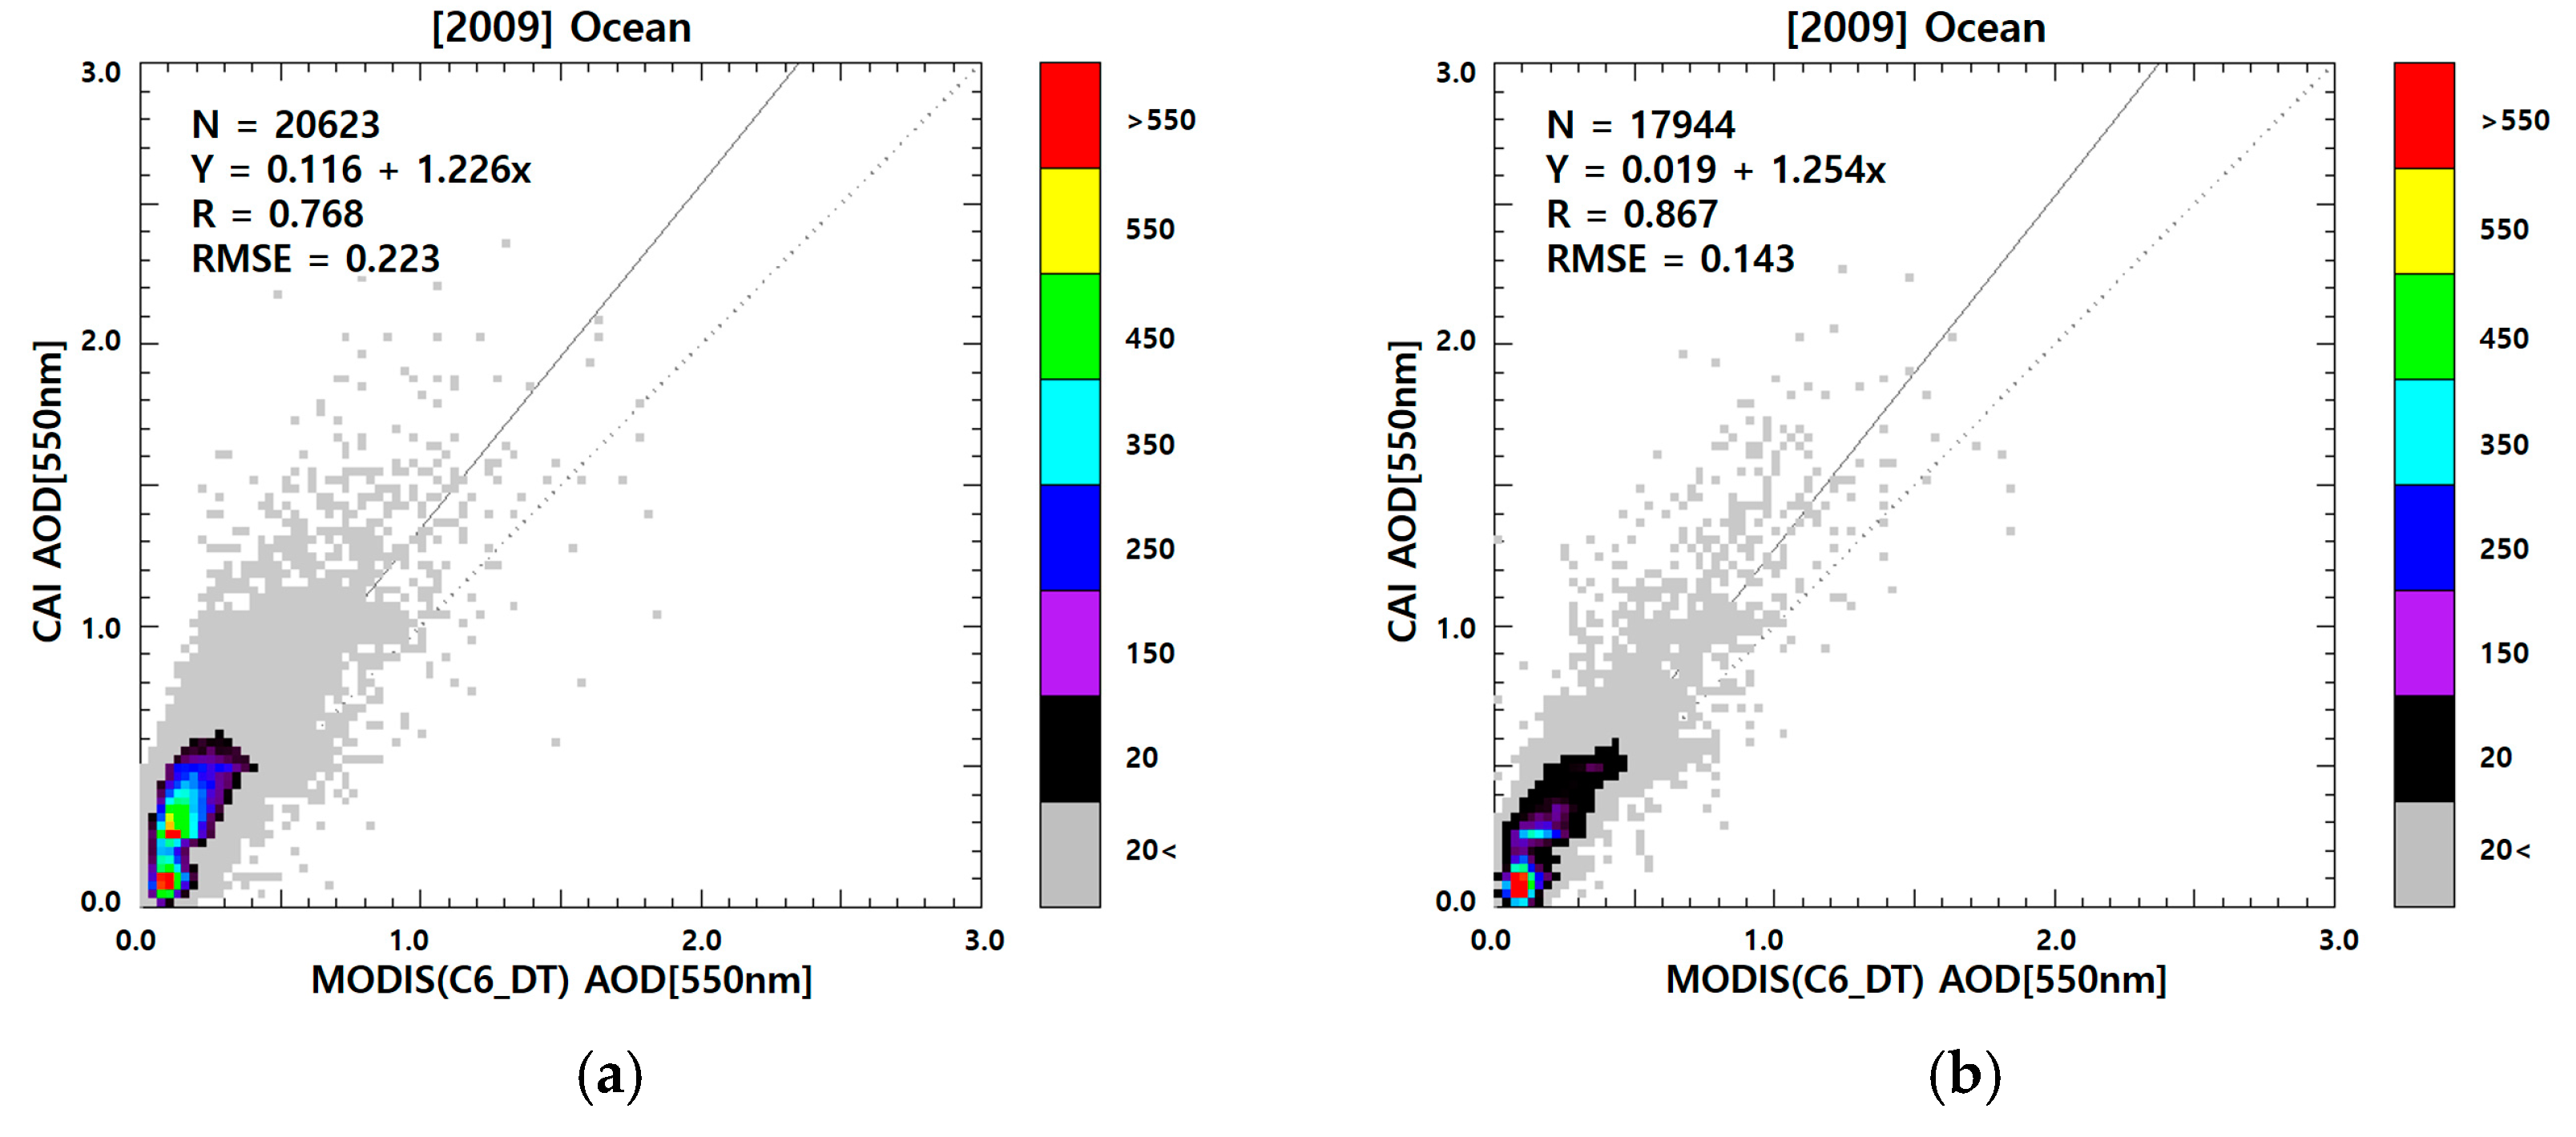
3.2.2. Validation of Retrieved AOD with MODIS over Ocean
4. Summary and Conclusions
Acknowledgments
Author Contributions
Conflicts of Interest
References
- IPCC. Climate Change 2013: The Physical Science Basis. Contribution of Working Group I to the Fifth Assessment Report of the Intergovernmental Panel on Climate Change; Cambridge University Press: Cambridge, UK; New York, NY, USA, 2013; p. 1535. [Google Scholar]
- Lee, J.; Kim, J.; Song, C.H.; Ryu, J.-H.; Ahn, Y.-H.; Song, C. Algorithm for retrieval of aerosol optical properties over the ocean from the geostationary ocean color imager. Remote Sens. Environ. 2010, 114, 1077–1088. [Google Scholar] [CrossRef]
- Higurashi, A.; Nakajima, T. Detection of aerosol types over the East China Sea near Japan from four-channel satellite data. Geophys. Res. Lett. 2002, 29, 1836. [Google Scholar] [CrossRef]
- Kim, J.; Lee, J.; Lee, H.C.; Higurashi, A.; Takemura, T.; Song, C.H. Consistency of the aerosol type classification from satellite remote sensing during the atmospheric brown cloud—East Asia regional experiment campaign. J. Geophys. Res. Atmos. 2007, 112, D22S33. [Google Scholar] [CrossRef]
- Levy, R.C.; Remer, L.A.; Tanré, D.; Kaufman, Y.J.; Ichoku, C.; Holben, B.N.; Livingston, J.M.; Russell, P.B.; Maring, H. Evaluation of the moderate-resolution imaging spectroradiometer (MODIS) retrievals of dust aerosol over the ocean during pride. J. Geophys. Res. Atmos. 2003, 108, 8594. [Google Scholar] [CrossRef]
- Remer, L.A.; Kaufman, Y.; Tanré, D.; Mattoo, S.; Chu, D.; Martins, J.V.; Li, R.-R.; Ichoku, C.; Levy, R.; Kleidman, R. The MODIS aerosol algorithm, products, and validation. J. Atmos. Sci. 2005, 62, 947–973. [Google Scholar] [CrossRef]
- Govaerts, Y.; Wagner, S.; Lattanzio, A.; Watts, P. Joint retrieval of surface reflectance and aerosol optical depth from MSG/SEVIRI observations with an optimal estimation approach: 1. Theory. J. Geophys. Res. Atmos. 2010, 115, D02203. [Google Scholar] [CrossRef]
- Wagner, S.; Govaerts, Y.; Lattanzio, A. Joint retrieval of surface reflectance and aerosol optical depth from MSG/SEVIRI observations with an optimal estimation approach: 2. Implementation and evaluation. J. Geophys. Res. Atmos. 2010, 115, D02204. [Google Scholar] [CrossRef]
- Jeong, U.; Kim, J.; Ahn, C.; Torres, O.; Liu, X.; Bhartia, P.K.; Spurr, R.J.; Haffner, D.; Chance, K.; Holben, B.N. An optimal-estimation-based aerosol retrieval algorithm using omi near-UV observations. Atmos. Chem. Phys. 2016, 16, 177–193. [Google Scholar] [CrossRef]
- Kuze, A.; Suto, H.; Nakajima, M.; Hamazaki, T. Thermal and near infrared sensor for carbon observation fourier-transform spectrometer on the greenhouse gases observing satellite for greenhouse gases monitoring. Appl. Opt. 2009, 48, 6716–6733. [Google Scholar] [CrossRef] [PubMed]
- Yokota, T.; Yoshida, Y.; Eguchi, N.; Ota, Y.; Tanaka, T.; Watanabe, H.; Maksyutov, S. Global concentrations of CO2 and CH4 retrieved from GOSAT: First preliminary results. Sola 2009, 5, 160–163. [Google Scholar] [CrossRef]
- Ishida, H.; Nakjima, T.Y.; Yokota, T.; Kikuchi, N.; Watanabe, H. Investigation of GOSAT TANSO-CAI cloud screening ability through an intersatellite comparison. J. Appl. Meteorol. Climatol. 2011, 50, 1571–1586. [Google Scholar] [CrossRef]
- Frankenberg, C.; Pollock, R.; Lee, R.; Rosenberg, R.; Blavier, J.-F.; Crisp, D.; O’Dell, C.; Osterman, G.; Roehl, C.; Wennberg, P. The Orbiting Carbon Observatory (OCO-2): Spectrometer performance evaluation using pre-launch direct sun measurements. Atmos. Meas. Tech. 2015, 8, 301–313. [Google Scholar] [CrossRef]
- Bösch, H.; Brown, L.; Castano, R.; Christi, M.; Connor, B.; Crisp, D.; Eldering, A.; Fisher, B.; Frankenberg, C.; Gunson, M. Orbiting Carbon Observatory (OCO)-2 level 2 Full Physics Retrieval Algorithm Theoretical Basis Document; NASA JPL: Pasadena, CA, USA, 2015. [Google Scholar]
- Kaufman, Y.; Tanré, D.; Remer, L.A.; Vermote, E.; Chu, A.; Holben, B. Operational remote sensing of tropospheric aerosol over land from EOS moderate resolution imaging spectroradiometer. J. Geophys. Res. Atmos. 1997, 102, 17051–17067. [Google Scholar] [CrossRef]
- Sayer, A.; Hsu, N.; Bettenhausen, C.; Jeong, M.J. Validation and uncertainty estimates for MODIS Collection 6 “Deep Blue” aerosol data. J. Geophys. Res. Atmos. 2013, 118, 7864–7872. [Google Scholar] [CrossRef]
- Fukuda, S.; Nakajima, T.; Takenaka, H.; Higurashi, A.; Kikuchi, N.; Nakajima, T.Y.; Ishida, H. New approaches to removing cloud shadows and evaluating the 380 nm surface reflectance for improved aerosol optical thickness retrievals from the GOSAT/TANSO-cloud and aerosol imager. J. Geophys. Res. Atmos. 2013, 118, 13520–13531. [Google Scholar] [CrossRef]
- Shi, C.; Nakajima, T.; Hashimoto, M. Simultaneous retrieval of aerosol optical thickness and chlorophyll concentration from multiwavelength measurement over East China Sea. J. Geophys. Res. Atmos. 2016, 121, 14084–14101. [Google Scholar] [CrossRef]
- Hashimoto, M.; Nakajima, T.; Morimoto, S.; Takenaka, H. Development of a generalized algorithm of satellite remote sensing using multi-wavelength and multi-pixel information (MWP method) for aerosol properties by satellite-borne imager. In Proceedings of the AGU Fall Meeting, San Francisco, CA, USA, 15–19 December 2014. [Google Scholar]
- Yoshida, Y.; Ota, Y.; Eguchi, N.; Kikuchi, N.; Nobuta, K.; Tran, H.; Morino, I.; Yokota, T. Retrieval algorithm for CO2 and CH4 column abundances from short-wavelength infrared spectral observations by the greenhouse gases observing satellite. Atmos. Meas. Tech. 2011, 4, 717–734. [Google Scholar] [CrossRef]
- Yoshida, Y.; Kikuchi, N.; Morino, I.; Uchino, O.; Oshchepkov, S.; Bril, A.; Saeki, T.; Schutgens, N.; Toon, G.; Wunch, D. Improvement of the retrieval algorithm for GOSAT swir XCO2 and XCH4 and their validation using tccon data. Atmos. Meas. Tech. 2013, 6, 1533–1547. [Google Scholar] [CrossRef]
- Kina, T.; Shiomi, K.; Kawakami, S.; Mitomi, Y.; Yoshida, M.; Higuchi, R.; Sekio, N.; Kataoka, F. Results of calibration for GOSAT TANSO. Sahara 2010, 1, 91–93. [Google Scholar]
- Kuze, A.; Suto, H.; Shiomi, K. Update on GOSAT TANSO-FTS performance, operations, and data products after more than 6 years in space. Atmos. Meas. Tech. 2016, 9, 2445–2461. [Google Scholar] [CrossRef]
- Kim, W.; Kim, J.; Jung, Y.; Boesch, H.; Lee, H.; Lee, S.; Goo, T.-Y.; Jeong, U.; Kim, M.; Cho, C.-H. Retrieving XCO2 from GOSAT FTS over East Asia using simultaneous aerosol information from CAI. Remote Sens. 2016, 8, 994. [Google Scholar] [CrossRef]
- Jung, Y.; Kim, J.; Kim, W.; Boesch, H.; Lee, H.; Cho, C.; Goo, T.-Y. Impact of aerosol property on the accuracy of a CO2 retrieval algorithm from satellite remote sensing. Remote Sens. 2016, 8, 322. [Google Scholar] [CrossRef]
- Dubovik, O.; Holben, B.; Eck, T.F.; Smirnov, A.; Kaufman, Y.J.; King, M.D.; Tanré, D.; Slutsker, I. Variability of absorption and optical properties of key aerosol types observed in worldwide locations. J. Atmos. Sci. 2002, 59, 590–608. [Google Scholar] [CrossRef]
- Lee, J.; Kim, J.; Yang, P.; Hsu, N. Improvement of aerosol optical depth retrieval from MODIS spectral reflectance over the global ocean using new aerosol models archived from AERONET inversion data and tri-axial ellipsoidal dust database. Atmos. Chem. Phys. 2012, 12, 7087–7102. [Google Scholar] [CrossRef]
- Higurashi, A.; Nakajima, T. Development of a two-channel aerosol retrieval algorithm on a global scale using NOAA AVHRR. J. Atmos. Sci. 1999, 56, 924–941. [Google Scholar] [CrossRef]
- Levy, R.C.; Remer, L.A.; Mattoo, S.; Vermote, E.F.; Kaufman, Y.J. Second-generation operational algorithm: Retrieval of aerosol properties over land from inversion of moderate resolution imaging spectroradiometer spectral reflectance. J. Geophys. Res. Atmos. 2007, 112, D13211. [Google Scholar] [CrossRef]
- Nakajima, T.; Tanaka, M. Algorithms for radiative intensity calculations in moderately thick atmospheres using a truncation approximation. J. Quant. Spectrosc. Radiat. Transf. 1988, 40, 51–69. [Google Scholar] [CrossRef]
- Choi, M.; Kim, J.; Lee, J.; Kim, M.; Park, Y.-J.; Jeong, U.; Kim, W.; Hong, H.; Holben, B.; Eck, T.F. GOCI yonsei aerosol retrieval (YAER) algorithm and validation during the DRAGON-NE Asia 2012 campaign. Atmos. Meas. Tech. 2016, 9, 1377–1398. [Google Scholar] [CrossRef]
- Nakajima, T.; Tanaka, M. Matrix formulations for the transfer of solar radiation in a plane-parallel scattering atmosphere. J. Quant. Spectrosc. Radiat. Transf. 1986, 35, 13–21. [Google Scholar] [CrossRef]
- Kuze, A.; Suto, H.; Shiomi, K.; Urabe, T.; Nakajima, M.; Yoshida, J.; Kawashima, T.; Yamamoto, Y.; Kataoka, F. Level 1 algorithms for TANSO on GOSAT: Processing and on-orbit calibrations. Atmos. Meas. Tech. Discuss. 2012, 5, 2959–3018. [Google Scholar] [CrossRef]
- Kuze, A.; Taylor, T.E.; Kataoka, F.; Bruegge, C.J.; Crisp, D.; Harada, M.; Helmlinger, M.; Inoue, M.; Kawakami, S.; Kikuchi, N. Long-term vicarious calibration of GOSAT short-wave sensors: Techniques for error reduction and new estimates of radiometric degradation factors. IEEE Trans. Geosci. Remote Sens. 2014, 52, 3991–4004. [Google Scholar] [CrossRef]
- Someya, Y.; Imasu, R.; Saitoh, N.; Ota, Y.; Shiomi, K. A development of cloud top height retrieval using thermal infrared spectra observed with GOSAT and comparison with CALIPSO data. Atmos. Meas. Tech. 2016, 9, 1981–1992. [Google Scholar] [CrossRef]
- GOSAT User Interface Gateway. Available online: https://data2.gosat.nies.go.jp/index_en.html (accessed on 19 April 2017).
- GOSAT/TANSO Calibration and Validation Plan and Overview of Processing Algorithms. Available online: www.gosat.nies.go.jp/newpdf/11RApdf_en/5_GOSAT_2RA_B_en.pdf (accessed on 19 April 2017).
- Martins, J.V.; Tanré, D.; Remer, L.; Kaufman, Y.; Mattoo, S.; Levy, R. Modis cloud screening for remote sensing of aerosols over oceans using spatial variability. Geophys. Res. Lett. 2002, 29, MOD4-1–MOD4-4. [Google Scholar] [CrossRef]
- Pettorelli, N.; Vik, J.O.; Mysterud, A.; Gaillard, J.-M.; Tucker, C.J.; Stenseth, N.C. Using the satellite-derived ndvi to assess ecological responses to environmental change. Trends Ecol. Evol. 2005, 20, 503–510. [Google Scholar] [CrossRef] [PubMed]
- Anyamba, A.; Tucker, C. Analysis of sahelian vegetation dynamics using NOAA-AVHRR NDVI data from 1981–2003. J. Arid Environ. 2005, 63, 596–614. [Google Scholar] [CrossRef]
- Baldi, G.; Nosetto, M.D.; Aragón, R.; Aversa, F.; Paruelo, J.M.; Jobbágy, E.G. Long-term satellite NDVI data sets: Evaluating their ability to detect ecosystem functional changes in South America. Sensors 2008, 8, 5397–5425. [Google Scholar] [CrossRef] [PubMed]
- Wang, Y.; Wang, J.; Levy, R.C.; Xu, X.; Reid, J.S. MODIS retrieval of aerosol optical depth over turbid coastal water. Remote Sens. 2017, 9, 595. [Google Scholar] [CrossRef]
- Remer, L.; Mattoo, S.; Levy, R.; Munchak, L. MODIS 3 km aerosol product: Algorithm and global perspective. Atmos. Meas. Tech. 2013, 6, 1829. [Google Scholar] [CrossRef]
- Remer, L.; Mattoo, S.; Levy, R.; Heidinger, A.; Pierce, R.; Chin, M. Retrieving aerosol in a cloudy environment: Aerosol product availability as a function of spatial resolution. Atmos. Meas. Tech. 2012, 5, 1823. [Google Scholar] [CrossRef]
- Kuze, A.J.; (Earth Observation Research Center, Japan Aerospace Exploration Agency, Tsukuba, Japan). Personal communication, 2015.
- Wang, J.; Xu, X.; Spurr, R.; Wang, Y.; Drury, E. Improved algorithm for MODIS satellite retrievals of aerosol optical thickness over land in dusty atmosphere: Implications for air quality monitoring in China. Remote Sens. Environ. 2010, 114, 2575–2583. [Google Scholar] [CrossRef]
- De Graaf, M.; Stammes, P.; Torres, O.; Koelemeijer, R. Absorbing aerosol index: Sensitivity analysis, application to GOME and comparison with TOMS. J. Geophys. Res. Atmos. 2005, 110, D01201. [Google Scholar] [CrossRef]
- Torres, O.; Bhartia, P.; Herman, J.; Sinyuk, A.; Ginoux, P.; Holben, B. A long-term record of aerosol optical depth from TOMS observations and comparison to aeronet measurements. J. Atmos. Sci. 2002, 59, 398–413. [Google Scholar] [CrossRef]
- Torres, O.; Bhartia, P.; Herman, J.; Ahmad, Z.; Gleason, J. Derivation of aerosol properties from satellite measurements of backscattered ultraviolet radiation: Theoretical basis. J. Geophys. Res. Atmos. 1998, 103, 17099–17110. [Google Scholar] [CrossRef]
- Herman, J.; Bhartia, P.; Torres, O.; Hsu, C.; Seftor, C.; Celarier, E. Global distribution of UV-absorbing aerosols from nimbus 7/TOMS data. J. Geophys. Res. Atmos. 1997, 102, 16911–16922. [Google Scholar] [CrossRef]
- Hsu, N.C.; Herman, J.R.; Gleason, J.; Torres, O.; Seftor, C. Satellite detection of smoke aerosols over a snow/ice surface by TOMS. Geophys. Res. Lett. 1999, 26, 1165–1168. [Google Scholar] [CrossRef]
- Go, S.; Kim, M.; Kim, J.; Park, S.S.; Jeong, U.; Choi, M. Detection of absorbing aerosol using single near-UV radiance measurements from a cloud and aerosol imager. Remote Sens. 2017, 9, 378. [Google Scholar] [CrossRef]
- Lee, J.; Kim, J.; Lee, Y.G. Simultaneous retrieval of aerosol properties and clear-sky direct radiative effect over the global ocean from MODIS. Atmos. Environ. 2014, 92, 309–317. [Google Scholar] [CrossRef]
- Yu, H.; Kaufman, Y.; Chin, M.; Feingold, G.; Remer, L.; Anderson, T.; Balkanski, Y.; Bellouin, N.; Boucher, O.; Christopher, S. A review of measurement-based assessments of the aerosol direct radiative effect and forcing. Atmos. Chem. Phys. 2006, 6, 613–666. [Google Scholar] [CrossRef]
- Remer, L.A.; Kaufman, Y.J. Aerosol direct radiative effect at the top of the atmosphere over cloud free ocean derived from four years of MODIS data. Atmos. Chem. Phys. 2006, 6, 237–253. [Google Scholar] [CrossRef]
- Levy, R.C.; Remer, L.A.; Kleidman, R.G.; Mattoo, S.; Ichoku, C.; Kahn, R.; Eck, T. Global evaluation of the collection 5 MODIS dark-target aerosol products over land. Atmos. Chem. Phys. 2010, 10, 10399–10420. [Google Scholar] [CrossRef]
- Holben, B.; Eck, T.; Slutsker, I.; Tanre, D.; Buis, J.; Setzer, A.; Vermote, E.; Reagan, J.; Kaufman, Y.; Nakajima, T. Aeronet—A federated instrument network and data archive for aerosol characterization. Remote Sens. Environ. 1998, 66, 1–16. [Google Scholar] [CrossRef]
- Hsu, N.; Jeong, M.J.; Bettenhausen, C.; Sayer, A.; Hansell, R.; Seftor, C.; Huang, J.; Tsay, S.C. Enhanced deep blue aerosol retrieval algorithm: The second generation. J. Geophys. Res. Atmos. 2013, 118, 9296–9315. [Google Scholar] [CrossRef]
- Seo, S.; Kim, J.; Lee, H.; Jeong, U.; Kim, W.; Holben, B.; Kim, S.-W.; Song, C.; Lim, J. Estimation of PM10 concentrations over seoul using multiple empirical models with AERONET and MODIS data collected during the DRAGON-Asia campaign. Atmos. Chem. Phys. 2015, 15, 319–334. [Google Scholar] [CrossRef]
- FIELD CAMPAIGN—Distributed Regional Aerosol Gridded Observation Networks–Asia 2012. Available online: https://aeronet.gsfc.nasa.gov/new_web/DRAGON-Asia_2012_Japan_South_Korea.html (accessed on 19 April 2017).
- Holben, B.N.; Kim, J.; Sano, I.; Mukai, S.; Eck, T.F.; Giles, D.M.; Schafer, J.S.; Sinyuk, A.; Slutsker, I.; Smirnov, A.; et al. An overview of meso-scale aerosol processes, comparison and validation studies from DRAGON networks. Atmos. Chem. Phys. Discuss. 2017. in review. [Google Scholar] [CrossRef]
- Aeronet Sites Information: Aeronet. Available online: https://aeronet.gsfc.nasa.gov/ (accessed on 19 April 2017).
- Kamei, A.; Sawada, Y.; Oishi, Y.; Yokota, Y.; Murakami, K.; Matsunaga, T. Assessment of gosat cai aerosol products using aqua modis data. In Proceedings of the 57th RSSJ, Ebetsu, Japan, 21–22 November 2014. [Google Scholar]


| Band 1 | Band 2 | Band 3 | Band 4 | |
|---|---|---|---|---|
| Spectral coverage (μm) | 0.370–0.390 (0.380) | 0.664–0.684 (0.674) | 0.860–0.880 (0.870) | 1.56–1.65 (1.60) |
| Swath (km) | 1000 | 1000 | 1000 | 750 |
| Spatial resolution at nadir (km) | 0.5 | 0.5 | 0.5 | 1.5 |
| Aerosol Model (SSA, FMF) | VPR (c2/c1) | RI_Real @ 0.55 μm | RI_Imaginary @ 0.55 μm |
|---|---|---|---|
| AA1 (≤0.95, >0.6) | 0.5 | 1.440 | 0.018 |
| AA2 (≤0.95, >0.6) | 0.9 | 1.440 | 0.018 |
| AA3 (≤0.95, <0.4) | 2.0 | 1.550 | 0.0028 |
| AA4 (≤0.95, <0.4) | 4.0 | 1.550 | 0.0028 |
| AA5 (≤0.95, <0.4) | 10.0 | 1.550 | 0.0028 |
| AA6 (≤0.95, <0.4) | 30.0 | 1.550 | 0.0028 |
| NA1 (>0.95, >0.6) | 0.3 | 1.423 | 0.0043 |
| NA2 (>0.95, >0.6) | 0.5 | 1.423 | 0.0043 |
| NA3 (0.4 ≤ FMF ≤ 0.6) | 2.0 | 1.445 | 0.0053 |
| NA4 (0.4 ≤ FMF ≤ 0.6) | 4.0 | 1.445 | 0.0053 |
| NA5 (0.4 ≤ FMF ≤ 0.6) | 10.0 | 1.445 | 0.0053 |
| NA6 (0.4 ≤ FMF ≤ 0.6) | 30.0 | 1.445 | 0.0053 |
| Year/Julian Day | Band 1 | Band 2 | Band 3 | Band 4 | ||||
|---|---|---|---|---|---|---|---|---|
| a | b | a | b | a | b | a | b | |
| 2009/092–273 | 1.163 | 0.0 | 0.956 | −1.305 | 1.006 | −0.232 | 1.117 | −0.432 |
| 2009/274–365 | 1.180 | 0.0 | 0.978 | −0.334 | 1.034 | −0.331 | 1.078 | 1.251 |
| 2010/001–090 | 1.201 | 0.0 | 0.967 | 1.203 | 1.021 | 0.930 | 1.111 | −0.056 |
| 2010/091–365 | 1.201 | 0.0 | 1.061 | 0.0 | 1.063 | 0.0 | 1.172 | 0.0 |
| 2011/001–365 | 1.202 | 0.0 | 1.018 | 0.0 | 1.021 | 0.0 | 1.118 | 0.0 |
| 2012/001–366 | 1.228 | 0.0 | 1.063 | 0.0 | 1.045 | 0.0 | 1.130 | 0.0 |
| 2013/001–365 | 1.150 | 0.0 | 0.996 | 0.0 | 1.000 | 0.0 | 1.170 | 0.0 |
| Mask | Threshold Test | Lower Limit | Upper Limit | Surface Type |
|---|---|---|---|---|
| Reflectance smoothing edges | Satellite zenith angle | 0 | 42.5° | Ocean/Land |
| Cloud | R1 | 0 | 0.35 | Ocean/Land |
| R2, R3, R4 | 0 | 0.30 | Ocean/Land | |
| Standard Deviation at R1, R2, R3, R4 | 0 | 0.0025 | Ocean/Land | |
| Surface reflectance @ band 4 | 0 | 0.25 | Ocean/Land | |
| NDVI & R(2)/R(3) | NDVI > −0.25 & R(2)/R(3) ≤ 1.5 | Ocean (option) | ||
| Turbid water | Surface reflectance @ band 2 | 0 | 0.101 | Ocean |
| Glint angle | Glint angle | 0 | 23.0° | Ocean |
| Year | No. | AERONET Sites [112°–150°E, 24°–50°N] |
|---|---|---|
| 2009 | 9 | Beijing [116.381, 39.977], Gosan_SNU [126.162, 33.292], Gwangju_GIST [126.843, 35.228], Osaka [135.591, 34.651], Shirahama [135.357, 33.693], Taihu [120.215, 31.421], Ussuriysk [132.163, 43.7], XiangHe [116.962, 39.754], Xinglong [117.578, 40.396] |
| 2010 | 11 | Baengnyeong [124.63, 7.966], Beijing [116.381, 39.977], Gwangju_GIST [126.843, 35.228], Noto [137.137, 37.334], NUIST [118.717, 32.206], Osaka [135.591, 34.651], Shirahama [135.357, 33.693], Taihu [120.215, 31.421], Ussuriysk [132.163, 43.7], XiangHe [116.962, 39.754], Xinglong [117.578, 40.396] |
| 2011 | 11 | Baengnyeong [124.63, 7.966], Beijing [116.381, 39.977], Chiba_University [140.104, 35.625], Gosan_SNU [126.162, 33.292], Gwangju_GIST [126.843, 35.228], Osaka [135.591, 34.651], Taihu [120.215, 31.421], Ussuriysk [132.163, 43.7], XiangHe [116.962, 39.754], Xinglong [117.578, 40.396] |
| 2012 | 48 | Baengnyeong [124.63, 7.966], Beijing [116.381, 39.977], Chiba_University [140.104, 35.625], DRAGON_Anmyeon [126.33, 36.539], DRAGON_Bokjeong [127.131, 37.457], DRAGON_Fukue [128.682/32.752], DRAGON_Fukue_2 [128.817/32.672], DRAGON_Fukuoka [130.475,33.524], DRAGON_GangneungWNU [128.867, 37.771], DRAGON_Guwol [126.724, 37.45], DRAGON_Gwangju_GIST, [126.843, 35.228] DRAGON_Hankuk_UFS [127.266, 37.339], DRAGON_Kobe [135.291, 34.72], DRAGON_Konju_NU [127.14, 36.471], DRAGON_Konkuk_Univ [127.08, 37.542], DRAGON_Korea_Univ [127.025, 37.585], DRAGON_Kunsan_NU [126.683, 35.941], DRAGON_Kyoto [135.781, 35.026], DRAGON_Kyungil_Univ [128.824, 36.072], DRAGON_Mokpo_NU [126.437, 34.913], DRAGON_Mt_Rokko [135.23, 34.757], DRAGON_Nara [135.828, 34.688], DRAGON_NIER [126.64, 37.569], DRAGON_Nishiharima [134.336, 35.026], DRAGON_Osaka-North [135.51, 34.774], DRAGON_Osaka-South [135.504, 34.544], DRAGON_Pusan_NU [129.083, 35.235], DRAGON_Sinjeong [126.859, 37.523], DRAGON_Soha [126.885, 37.452], DRAGON_Tsukuba [140.12, 36.051], Fukue [128.682, 32.752], Gangneung_WNU [128.867, 37.77], Gosan_SNU [126.162, 33.292], Hankuk_UFS [127.266, 37.339], Kobe [135.291, 34.72], Nara [135.828, 34.688], Noto [137.137, 37.334], Osaka [135.591, 34.651], Osaka-North [135.51, 34.774], Pusan_NU [129.083, 35.235], Seoul_SNU [126.951, 37.458], Shirahama [135.357, 33.693], Taihu [120.215, 31.421], Ussuriysk [132.163, 43.7], XiangHe [116.962, 39.754], Xinglong [117.578, 40.396], Yonsei_University [126.935, 37.564] |
| 2013 | 11 | Baengnyeong, Beijing [116.381, 39.977], Gangneung_WNU [128.867, 37.77], Gosan_SNU [126.162, 33.292], Hankuk_UFS [127.266, 37.339], Noto [137.137, 37.334], Osaka [135.591, 34.651], Seoul_SNU [126.951, 37.458], Ussuriysk [132.163, 43.7], Yonsei_University [126.935, 37.564] |
| Sensor | Result | 2009 | 2010 | 2011 | 2012 | 2013 |
|---|---|---|---|---|---|---|
| AERONET | N | 113 | 116 | 131 | 244 | 138 |
| R | 0.855 | 0.705 | 0.768 | 0.679 | 0.756 | |
| Slope | 1.089 | 0.999 | 0.860 | 1.002 | 0.884 | |
| y-offset | 0.011 | 0.045 | 0.041 | 0.180 | 0.059 | |
| RMSE | 0.186 | 0.201 | 0.178 | 0.280 | 0.282 | |
| Aqua/MODIS (Ocean) | N | 17944 | 32264 | 26370 | 40929 | 20623 |
| R | 0.867 | 0.804 | 0.824 | 0.823 | 0.830 | |
| Slope | 1.254 | 1.203 | 1.240 | 1.132 | 1.302 | |
| y-offset | 0.019 | 0.032 | 0.012 | 0.074 | -0.006 | |
| RMSE | 0.143 | 0.126 | 0.130 | 0.172 | 0.127 |
© 2017 by the authors. Licensee MDPI, Basel, Switzerland. This article is an open access article distributed under the terms and conditions of the Creative Commons Attribution (CC BY) license (http://creativecommons.org/licenses/by/4.0/).
Share and Cite
Lee, S.; Kim, M.; Choi, M.; Go, S.; Kim, J.; Kim, J.-H.; Lim, H.-K.; Jeong, U.; Goo, T.-Y.; Kuze, A.; et al. Aerosol Property Retrieval Algorithm over Northeast Asia from TANSO-CAI Measurements Onboard GOSAT. Remote Sens. 2017, 9, 687. https://doi.org/10.3390/rs9070687
Lee S, Kim M, Choi M, Go S, Kim J, Kim J-H, Lim H-K, Jeong U, Goo T-Y, Kuze A, et al. Aerosol Property Retrieval Algorithm over Northeast Asia from TANSO-CAI Measurements Onboard GOSAT. Remote Sensing. 2017; 9(7):687. https://doi.org/10.3390/rs9070687
Chicago/Turabian StyleLee, Sanghee, Mijin Kim, Myungje Choi, Sujung Go, Jhoon Kim, Jung-Hyun Kim, Hyun-Kwang Lim, Ukkyo Jeong, Tae-Young Goo, Akihiko Kuze, and et al. 2017. "Aerosol Property Retrieval Algorithm over Northeast Asia from TANSO-CAI Measurements Onboard GOSAT" Remote Sensing 9, no. 7: 687. https://doi.org/10.3390/rs9070687
APA StyleLee, S., Kim, M., Choi, M., Go, S., Kim, J., Kim, J.-H., Lim, H.-K., Jeong, U., Goo, T.-Y., Kuze, A., Shiomi, K., & Tatsuya, Y. (2017). Aerosol Property Retrieval Algorithm over Northeast Asia from TANSO-CAI Measurements Onboard GOSAT. Remote Sensing, 9(7), 687. https://doi.org/10.3390/rs9070687