1. Introduction
Land cover is essential to environmental change studies, land resource management, sustainable development, and many other societal benefits [
1], and its classification is an indispensable component of land cover production for mapping various land cover information [
2]. Traditional classification methods require a huge amount of remotely sensed images as it provides a representation of the Earth’s surface. It is proposed by identifying land cover on the basis of spectral similarity as well as expert knowledge [
3]. However, this process is very complicated, time-consuming and labour intensive [
4,
5] because remotely sensed images are required to be interpreted by experts. Furthermore, it becomes more difficult when classification needs to be done over a large area. Improving the efficiency of land cover classification becomes a significant part in the area of land cover production.
Land cover maps of the earth represent both man-made and natural characteristics of the earth’s surface. Recent advances in information technologies make it possible to produce large quantities of crowdsourced geographic information (CGI), which is generated by human activity. Efforts have been made to use CGI to reveal land cover information. Previous studies combined remotely sensed images with CGI to classify land cover [
6,
7]. Although better progress has been achieved, they are limited to the acquirements of remotely sensed images. In addition, several researchers have explored the usability of geo-tagged photos and utilised them to land cover classification [
8,
9]. Geo-tagged photos have lower costs because of their cost-free nature but still need to be interpreted with extensive labour. The volume of geo-tagged textual information available in CGI makes it much easier to access land cover information [
4,
10,
11,
12,
13]. Researchers have employed texts in OpenStreetMap (OSM), tags in geo-tagged photos and other CGI textual information, which were extracted and classified corresponding to land cover nomenclatures, for land cover classification [
10,
11]. However, CGI spatial distribution and textual information can be various given the explosive growth of CGI generation.
In fact, existing studies ignore the uneven spatial distribution [
12] in which low density of CGI is not convincible for land cover classification. For instance, in business centres, CGI is usually fully occupied with high density in regular patterns, and thus the occupied areas can be extracted based on CGI distributions. However, CGI in forest parks is often sparsely distributed with relatively low density in irregular patterns. It may lead to less reliability if the whole forest park is extracted as land cover regions for classification. Therefore, how to effectively extract land cover regions with more reliability for land cover classification among CGI becomes the first issue to handle. Furthermore, there are challenges in classifying various unorganised CGI texts in each extracted land cover region. An example is that a forest park should be classified as forest, but it may still contain CGI texts such as “public toilets” that indicate artificial surfaces. In order to classify land cover correctly, land cover topics should be calculated among various types CGI textual information.
With the above considerations, there is strong potential to integrate CGI uneven distributions and a variety of textual information in order to gain better insights into land cover classification. Among a large quantity of CGI, POIs (Points of Interest) are suitable for identifying land cover types, as they usually contain information about nearby social and natural environments. In addition, POI latitude–longitude information refers to the land cover locations. However, there is no research simply employing POIs for land cover classification considering their uneven spatial distributions and variety of textual information. Therefore, we propose a novel framework using spatial clustering and topic model to classify land cover. Spatial clustering is applied to aggregate POIs with high density while topic model is used to calculate land cover topics in various POI texts. In the rest of the paper, this framework is utilised in Shandong Province in China and a random sampling is applied to assess land cover classification accuracy.
2. Related Works
2.1. Land Cover Classification with Crowdsourced Geographic Data
CGI has emerged rapidly due to the development of information technology [
14]. It contains rich information about spatio-temporal data and textual messages, which provide an opportunity to understand environmental and social conditions [
15]. Several researchers have applied many CGI resources including geo-tagged photos [
8,
9,
16], check-in data [
17], POIs [
6,
18], OSM [
10,
11] and other CGI. CGI has been used in a variety of applications, such as environmental detection [
19], disaster management [
20], urban land use identification [
21], and land cover validation [
4,
22]. Since CGI is generated by different level of volunteers, data quality varies across space [
12].
Currently, a large number of researchers are focusing on applying CGI for land cover classification. For example, Sitthi et al. extracted colour, shape and other information from photos in Flickr to produce a land cover map using a Naïve Bayes classifier [
9]. See et al. represent a method to build a hybrid land cover map with Geo-Wiki on which CGI was interpreted by volunteers [
8]. The above studies require interpreting plenty of photos manually, which is still time-consuming [
4]. Zhi et al. identified urban functional regions using social media check-in data [
17]. However, check-in data is mostly generated in urban areas, making it difficult to classify land cover in non-urban areas. Liu et al. used taxi trajectory data to classify different communities in Shanghai [
23]. Although trajectories reveal the human patterns in different regions, this kind of data is not open to the public and is hard to obtain. Johnson et al. utilized OSM and satellite imagery for land cover mapping [
7] as well as Hu et al. classified land cover parcels using POI density and NDVI/NDBI (Normalized Difference Vegetation Index/Normalized Difference Built-up Index) in Landsat imagery [
6]. However, both of these proposed approaches are limited to the acquirements of remotely sensed images.
Previous studies have explored the usability of textual information in the applications of land cover classification. For instance, Leung et al. extracted tags from photos in Flickr to classify land cover as developed and undeveloped regions [
16]. Estima et al. classified OSM polygon data with the nomenclature of CORINE (Coordination of Information on the Environment) Land Cover [
10]. However, there are no previous studies that have applied CGI textual information considering their spatial distributions.
2.2. Clustering Methods in Crowdsourced Geographic Data
Clustering methods can be used to aggregate data with the same or similar attributions. Many studies utilised clustering methods including K-means [
24], spectral cluster [
25], and DBSCAN (Density-based Spatial Clustering of Applications with Noise) [
26] for data aggregation.
K-means is based on the distances between input data. Applying this algorithm should consider cluster number, which is an important factor for the cluster quality. However, the cluster number cannot be determined when classifying land cover, especially in large-scale areas.
Spectral cluster, which also requires cluster number, is better in dealing with large dimensional datasets. For our study, only location information is considered to aggregate based on their spatial distributions. Moreover, data that distributes sparsely is also clustered by spectral cluster instead of moving out. These sparsely distributed data are not convincible to be used for land cover classification. Therefore, a spectral cluster algorithm is not suitable in this study.
DBSCAN is another cluster algorithm based on data density. It can move out sparsely distributed data and group data in any shapes, which can be used in land cover classification. The DBSCAN algorithm requires a minimum point number in one cluster and the search radius a data point can affect. The former parameter can be set to move out sparsely distributed data while the latter parameter determines how far a data point can influence. Therefore, this study applies DBSCAN to aggregate CGI and extract land cover regions.
2.3. Semantic Mining for Land Cover Classification
The emergence of massive textual information makes it possible for researchers to extract and analyse useful evidence with semantic mining. Semantic mining approaches have been used in many areas including environmental detection [
19], climate changes [
27], tourist attraction analysing [
28] and other fields. There are also attempts to mine semantic information in land cover classification and other related areas. Hu et al. extracted tags from Flickr photos and proposed a TF-IDF (Term Frequency–inverse Document Frequency) algorithm with textual information from tags, in order to explore urban areas of interest [
29]. Specifically, TF-IDF is a method to evaluate how important a word is in the textual information. Jiang et al. proposed a POI classification method with POI types for urban land use classification [
18]. This method requires many labelled input data, which is also labour intensive and time consuming.
Previous studies utilise an LDA (Latent Dirichlet Allocation) [
30] topic model for automatic semantic mining, which calculates hidden topics under textual information without labelling input data. Gao et al. detected north and south California with different topics using multi sources of CGI calculated by LDA [
31]. Benjamin et al. proposed a geographic region estimation approach using unstructured textual information and LDA algorithm [
32]. Ju et al. identified places with vague names with topic modelling to differentiate places based on other entitled names [
33]. To discover land cover messages from CGI textual information, this study applies the LDA topic model to calculate topic distributions in each region.
3. Datasets and Research Framework
3.1. Study Area and Datasets
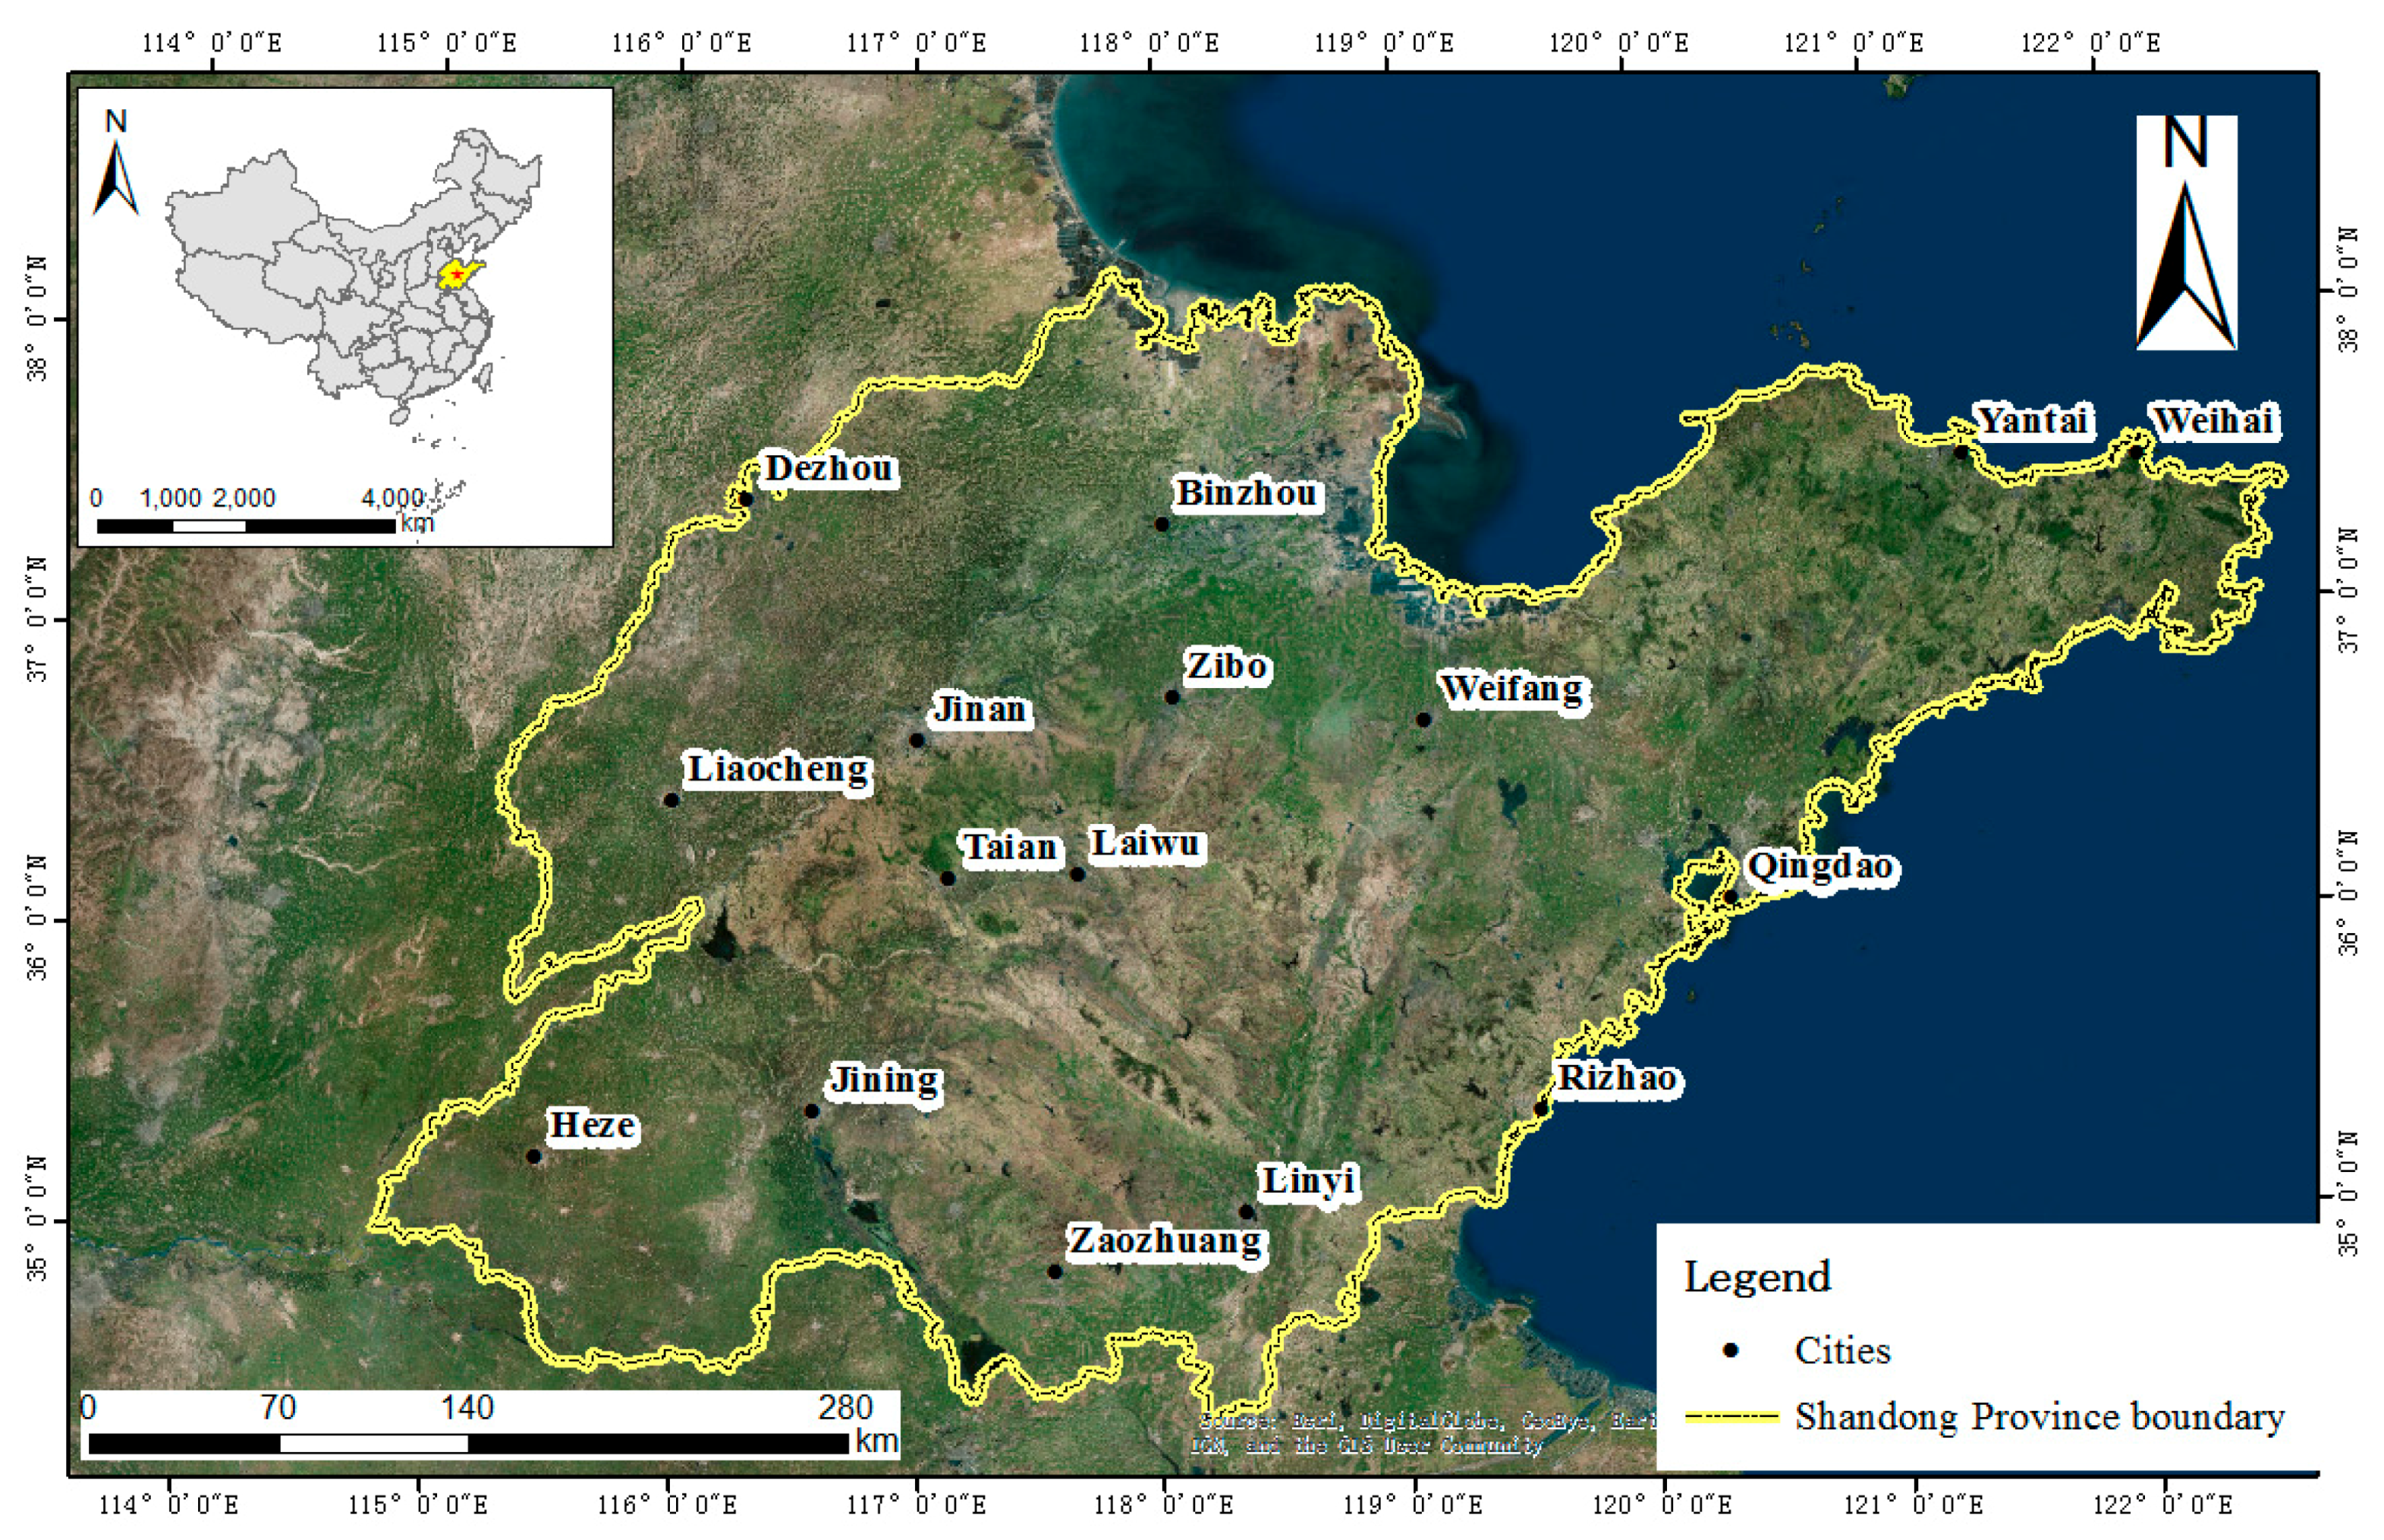
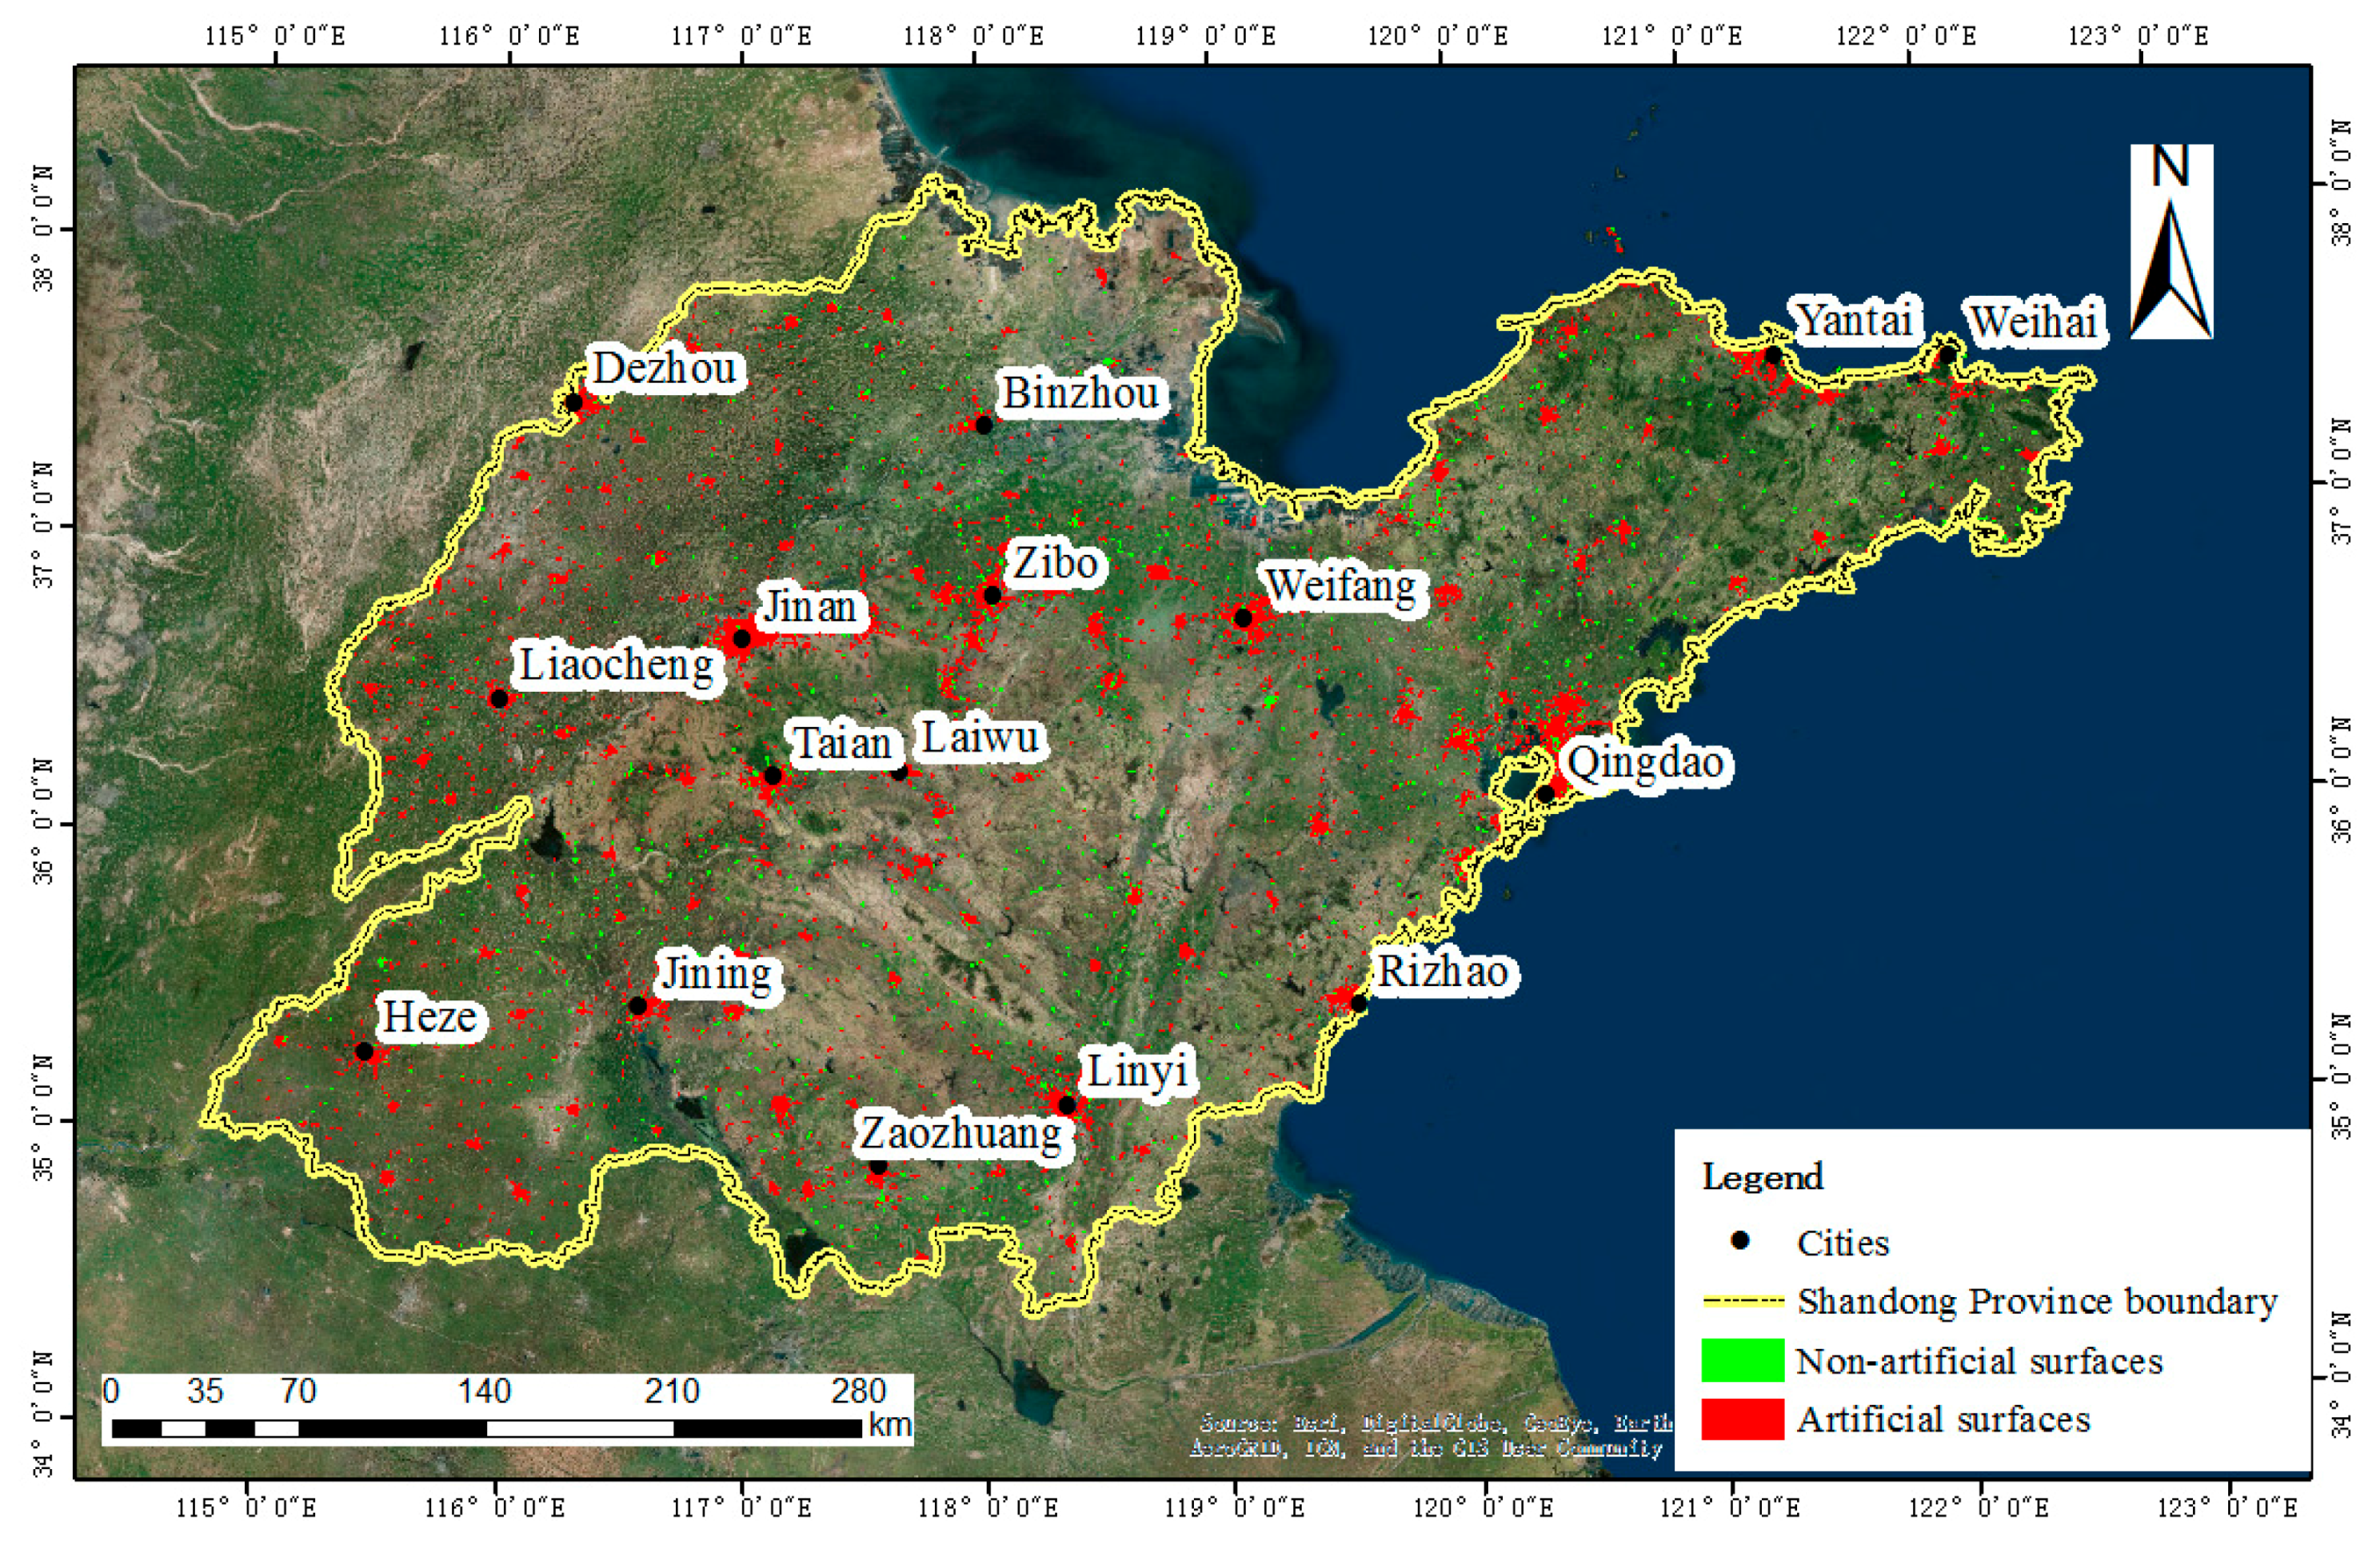
The study area in this paper is Shandong Province, located in the east of China, containing a total area of 158,000 km
2 (shown in
Figure 1). Due to its large proportion and a variety of landscapes including cultivated land, forest, grassland, wetland, water bodies and artificial surfaces, challenges are presented in classifying land cover effectively. Remotely sensed images, the traditional resource in land cover classification, require a huge amount of labour and time, especially in the large area of Shandong province. This is because expert knowledge is needed in the process of interpreting remotely sensed images, making it difficult to improve classification efficiency. CGI textual information, however, is easy to access and can be classified effectively as well.
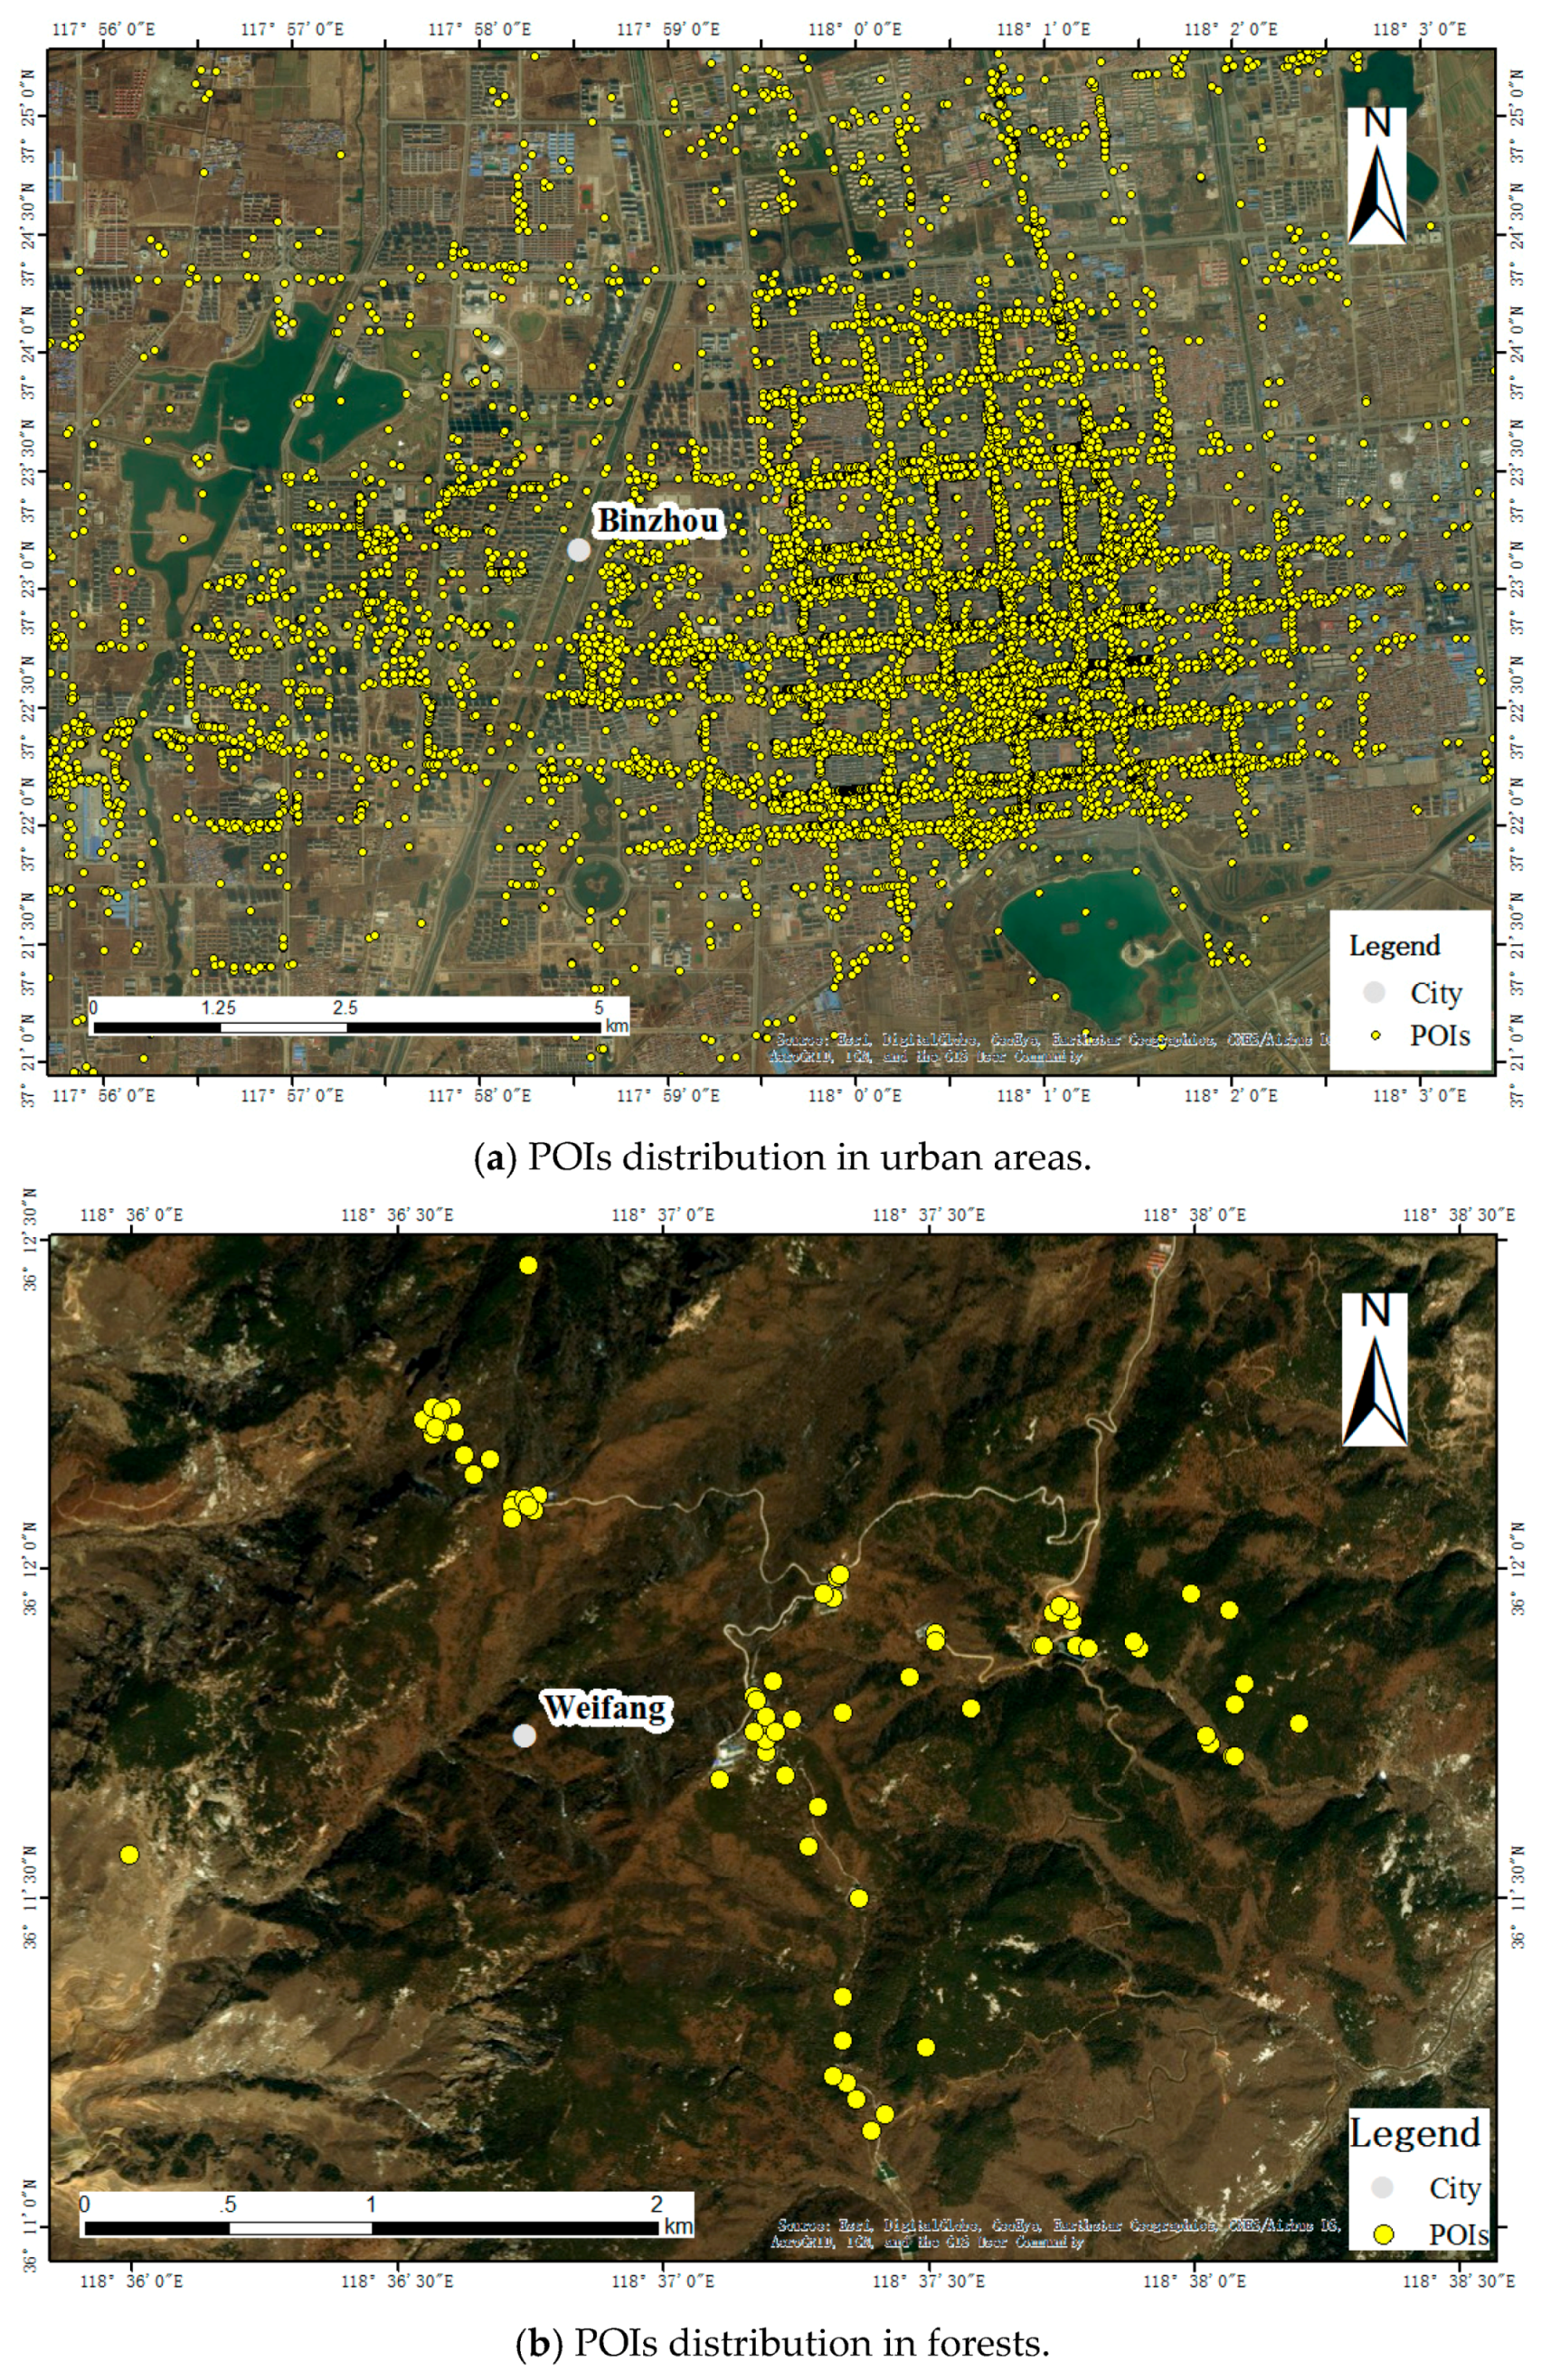
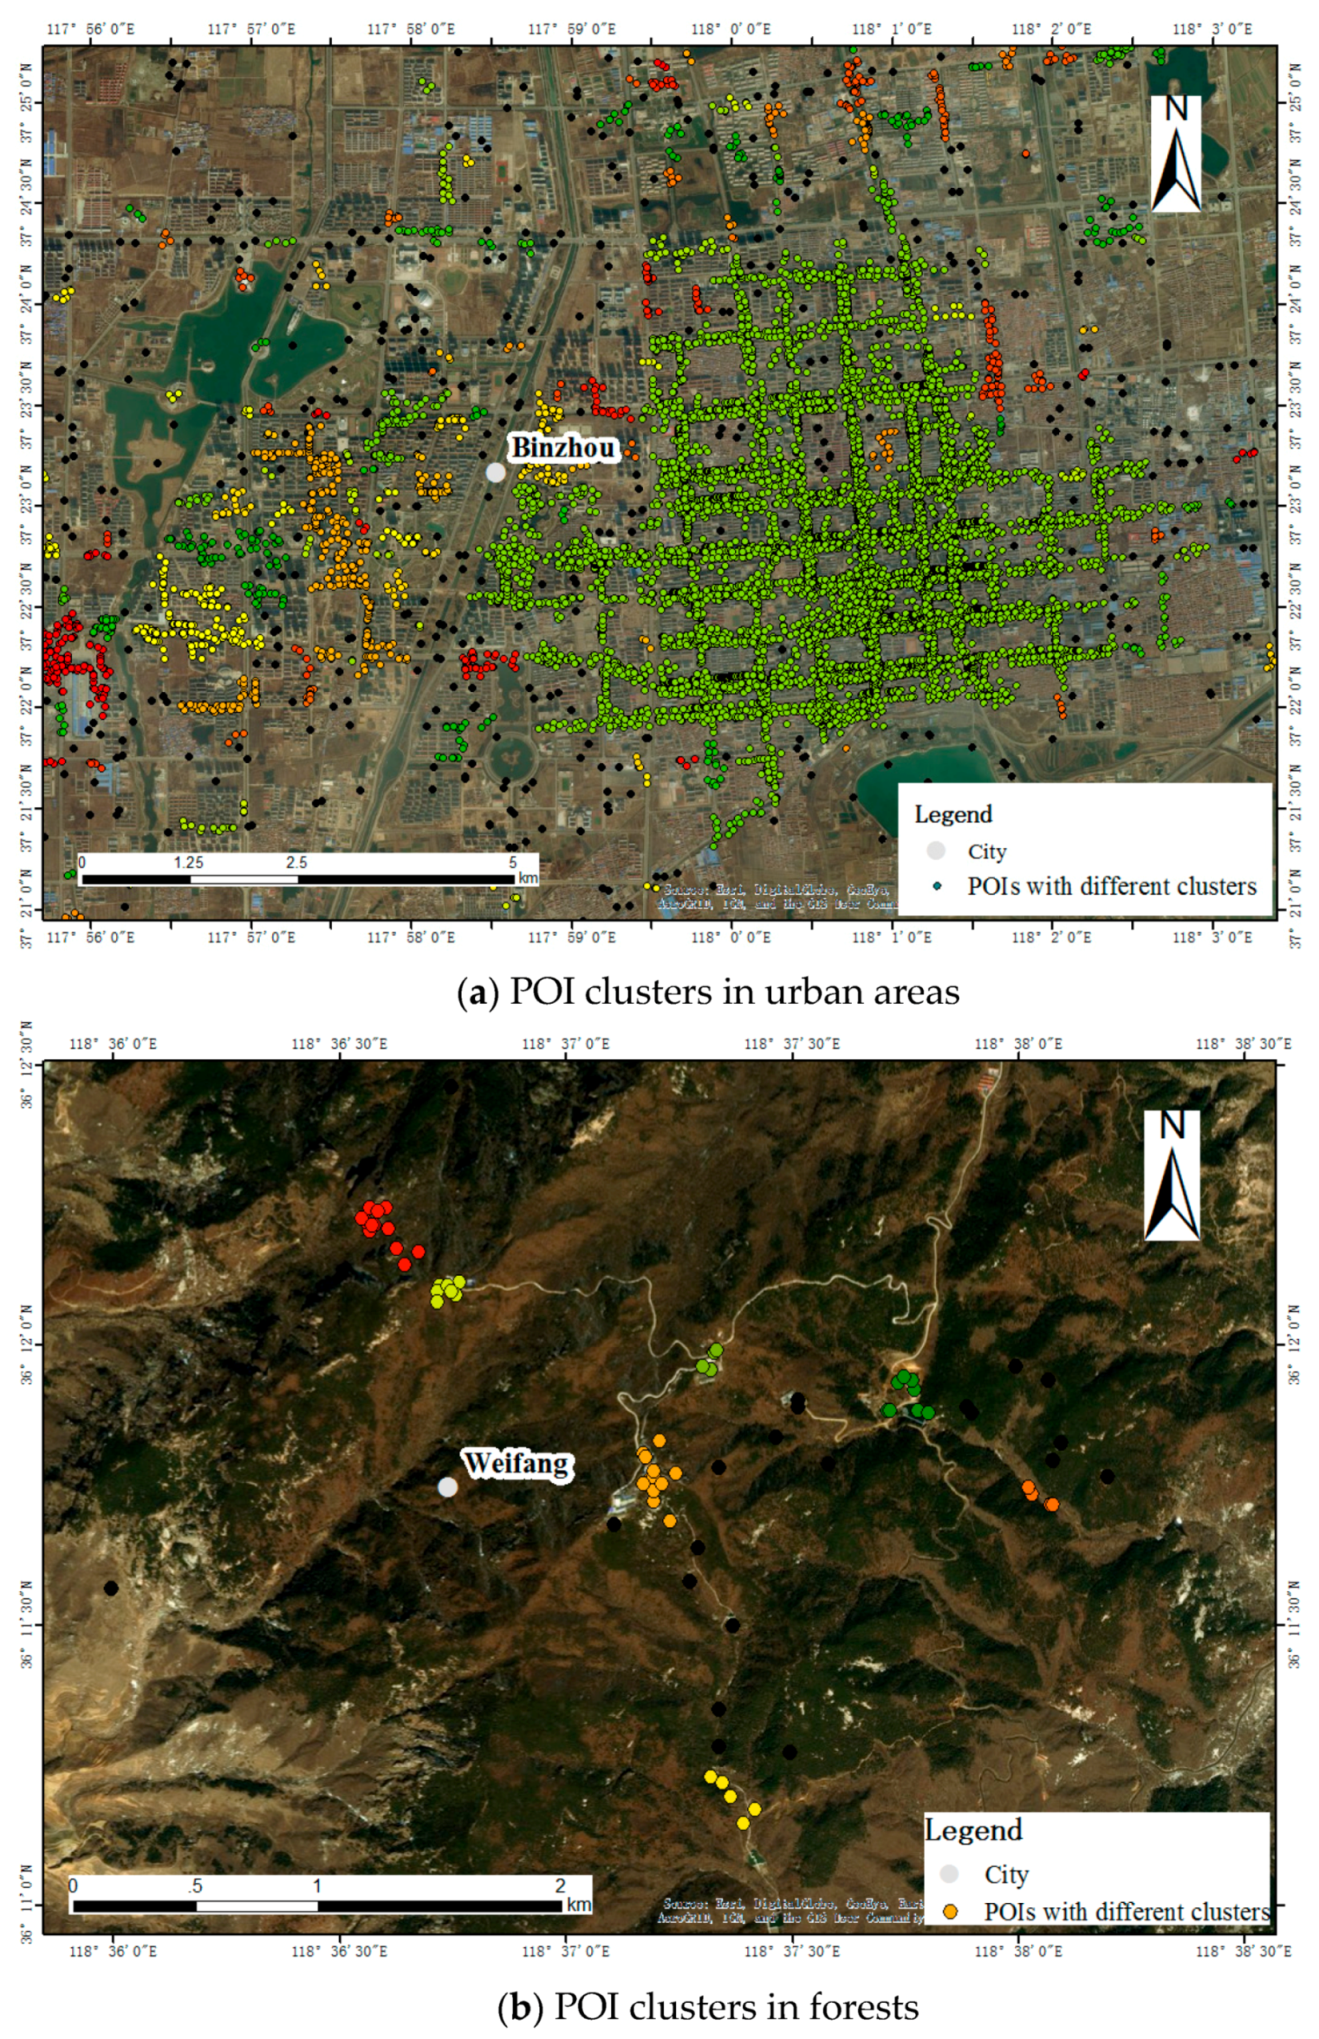
We use POIs with their categories as CGI and textual information. It is worth noting that much CGI such as geo-tagged photos and check-in data also contain land cover related information and thus can be applied with a proposed method in this study. Specifically, POIs are from Weibo and Baidu Map, with the former a popular social network and the latter a navigational map in China. Two resources are obtained through the Weibo API and Baidu Map API, respectively, which are open to the public. Part of the distribution of POIs is in
Figure 2.
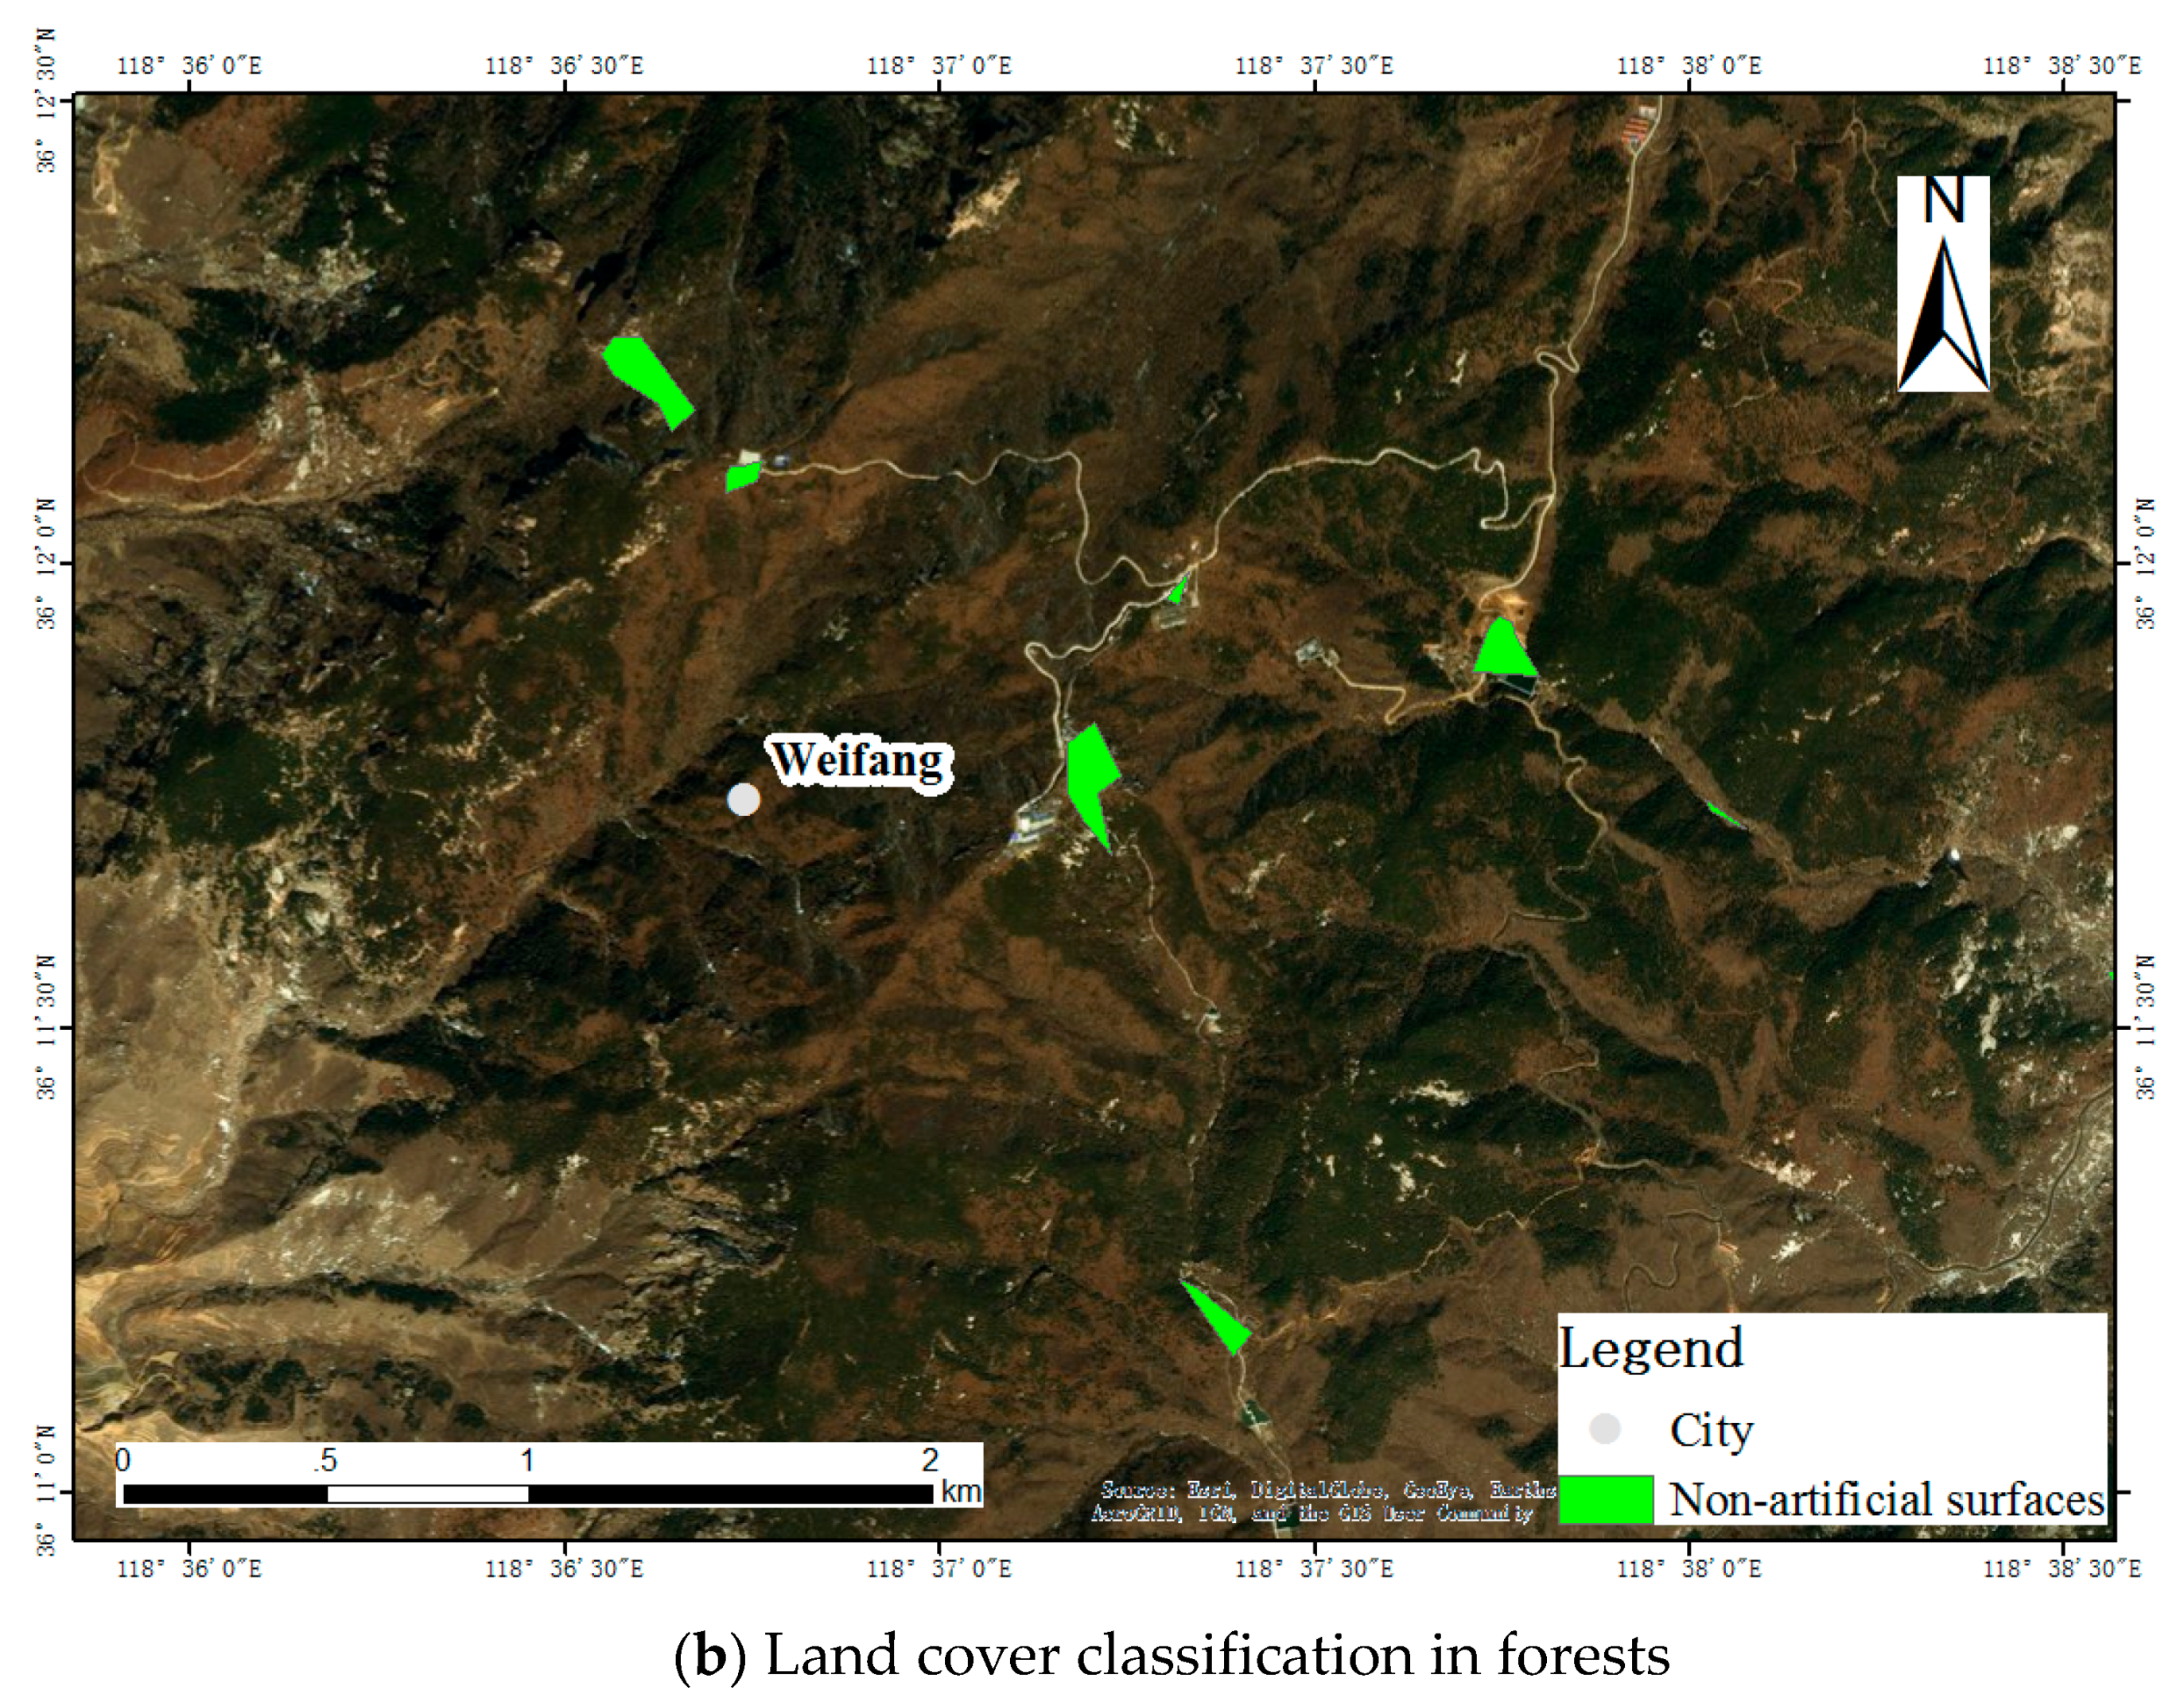
Figure 2a shows a regular pattern of POI distributions, which outline the region of the city in urban areas. Land cover regions can be extracted based on these POIs to fit this urban area. In contrast, POIs in
Figure 2b are distributed in the forest with irregular patterns. It remains difficult to extract land cover regions in the wide forest area and identify land cover types among various types of POI textual information. In addition, noting that most of POIs are located in build-up areas indicating artificial surfaces, only a small proportion of POIs are located in grassland, forest and other land cover types. Therefore, this paper aims to classify land cover with artificial surfaces and non-artificial surfaces using POI textual information.
3.2. Research Framework
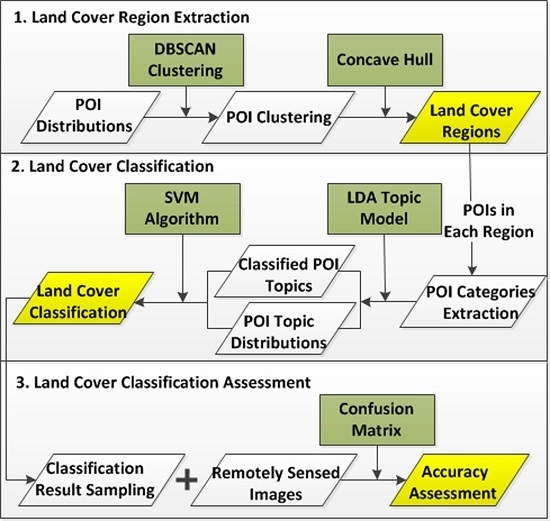
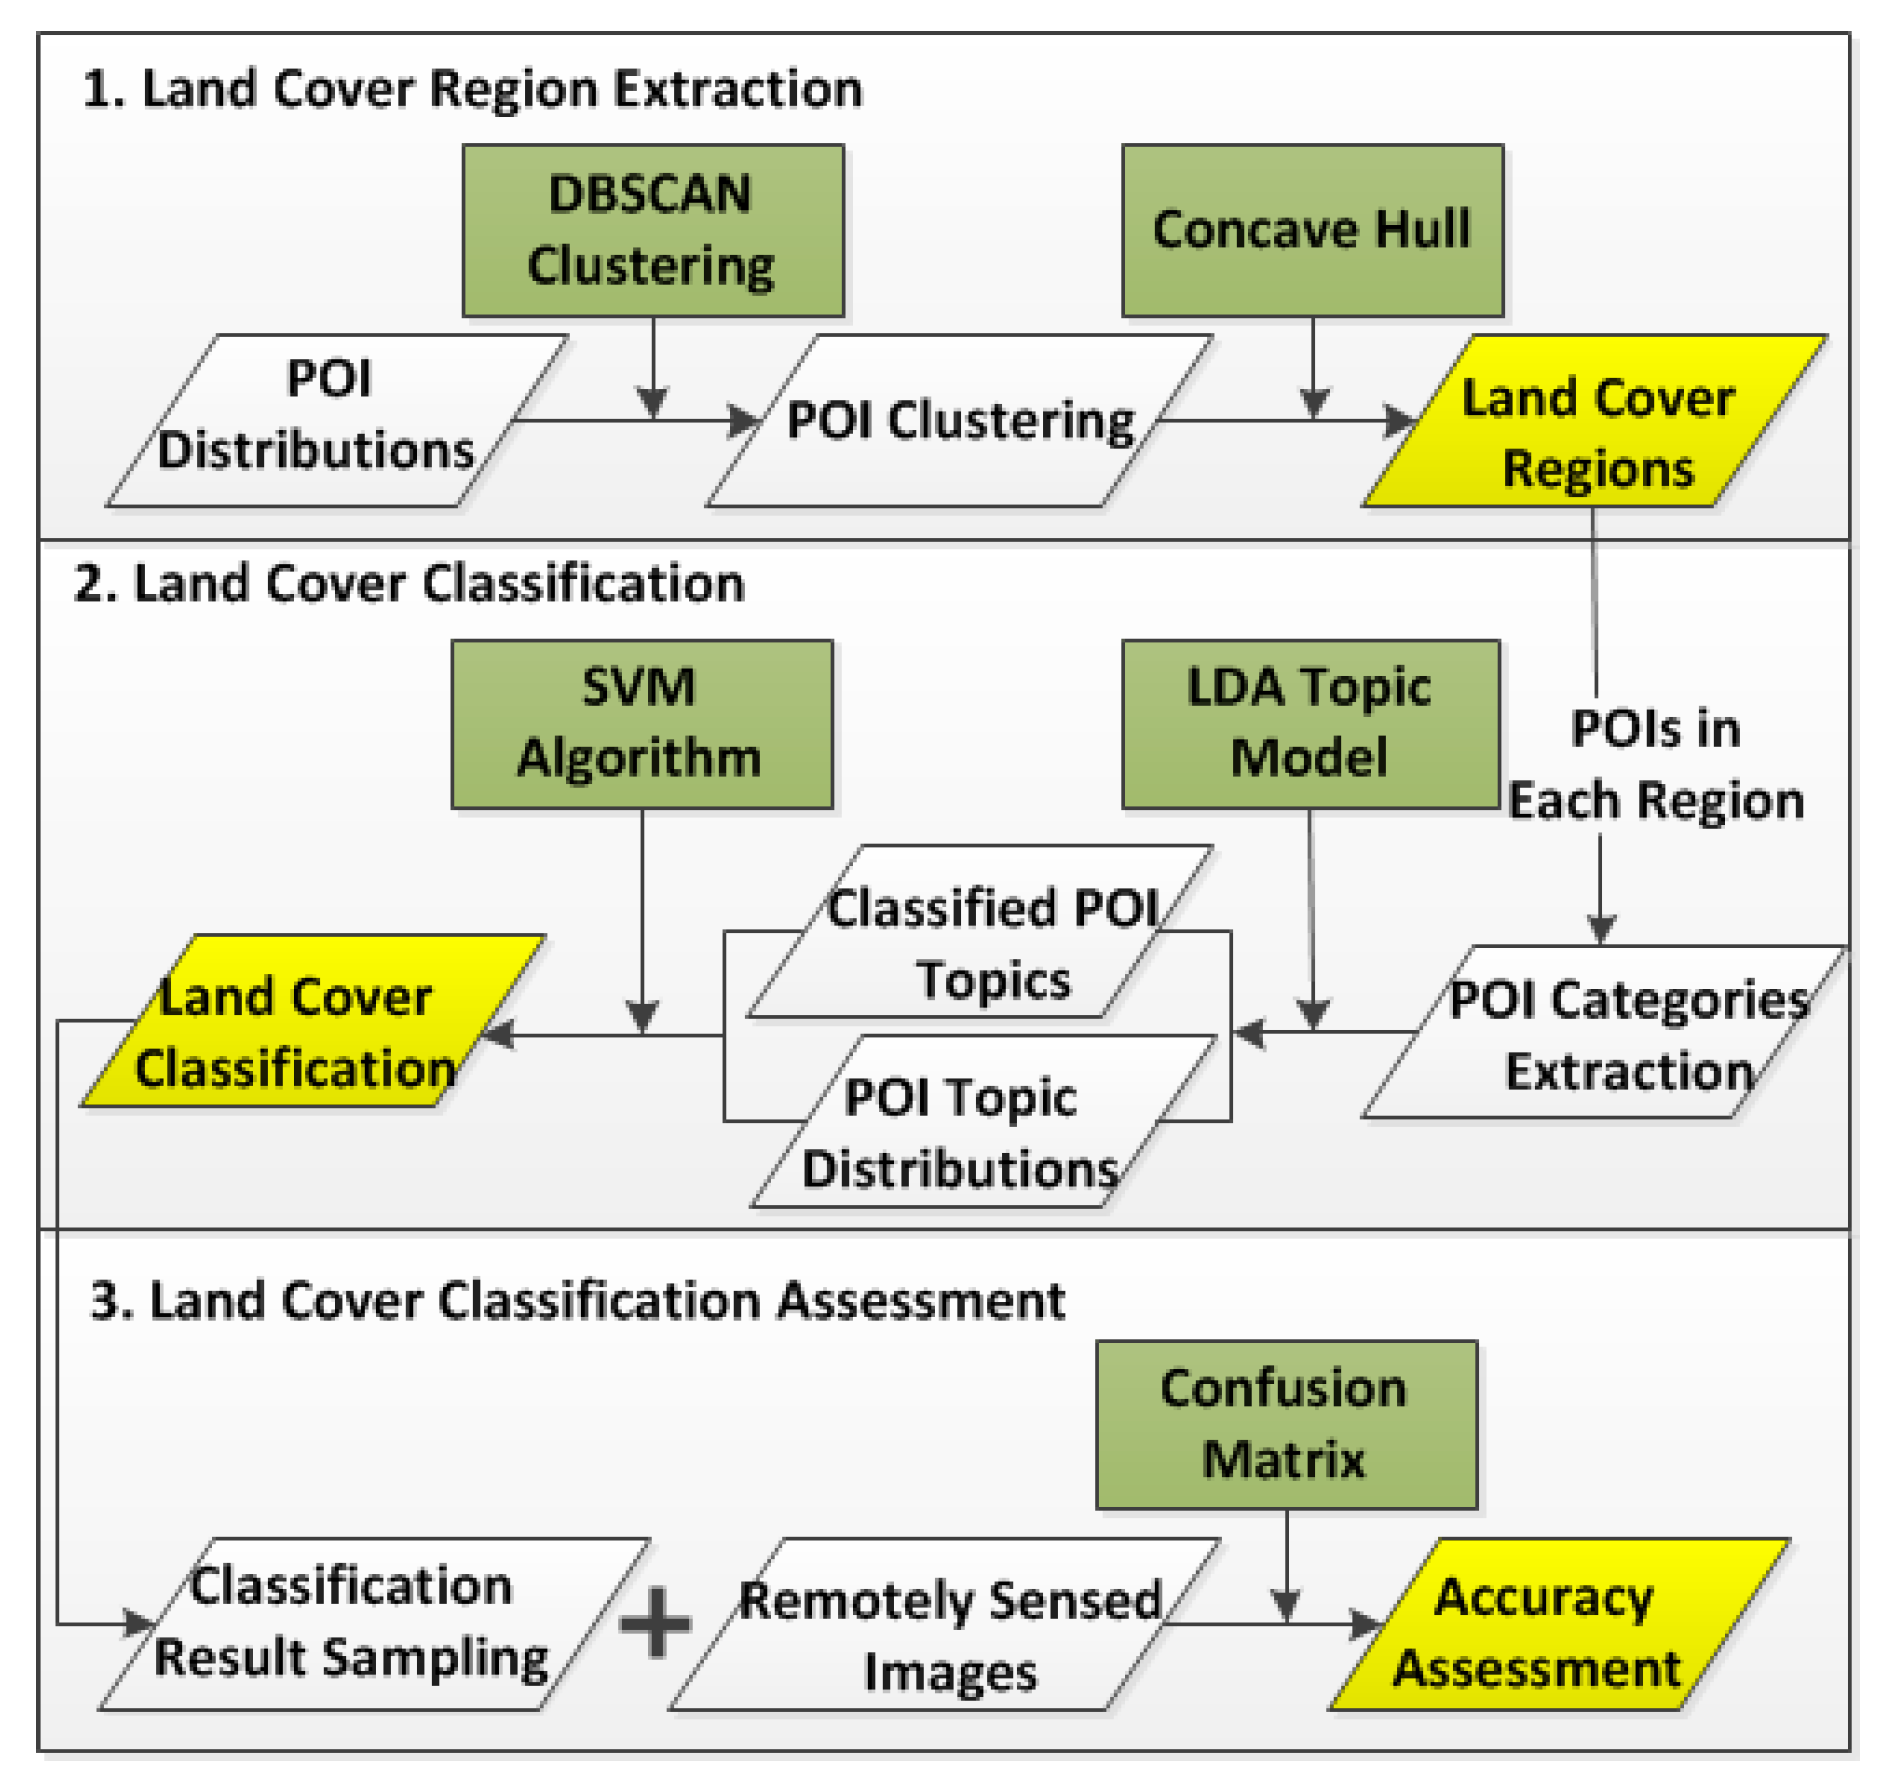
The main goal of this paper is to employ CGI textual information for land cover classification considering CGI spatial distributions, and propose a classification framework using spatial clustering and topic model. We utilise POIs as experimental data, and the overview of research framework is represented in
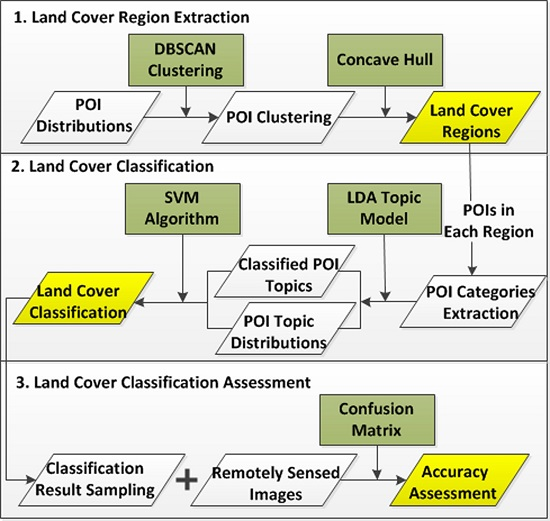
Figure 3 involving three major stages. The first stage is land cover region extraction. This stage aims to extract regions based on POI distributions for land cover classification. It is proposed by applying DBSCAN to cluster POIs and utilising concave hull to extract regions considering POI distributions. To be specific, DBSCAN is a clustering algorithm that aims to cluster points with the consideration of their spatial density. The second stage is land cover classification. With POIs located in each region, POI textual information is used from the extracted land cover regions, followed by calculating POI topics using an LDA topic model. Land cover classification can be proposed based on the distribution of POI topics with an SVM (Support Vector Machine) algorithm. In the final stage, we propose a classification accuracy assessment by confusion matrix using a random sampling and remotely sensed images.
4. Methodology
4.1. Land Cover Region Extraction with POI Spatial Clusters
This study extracts regions for land cover classification based on the distributions of POIs. Land cover region extraction is considered as a problem of extracting POIs with high spatial density. The emphasis of this definition is that a region should be represented by a relatively large number of POIs, in which each POI only refers to a small area near it. Those sparsely distributed POIs with low density should be moved out because they are not representative enough to extract a region. The next step is to extract regions with clustered high-density POIs. Based on the analysis, this study employs POIs to extract land cover regions by utilising DBSCAN for POI clustering and concave hull for region extraction.
4.1.1. Identifying POI Clusters Using DBSCAN
To extract POI clusters with high spatial density, DBSCAN is applied with POI distributions. DBSCAN is a density-based cluster method that is configured by two parameters Eps and Minpts. Eps refers to the search radius of each POI and Minpts is the minimum number of points in one cluster. Both of these two parameters can define POI density of clusters. To apply DBSCAN, proper value needs to be selected for two parameters Eps and Minpts.
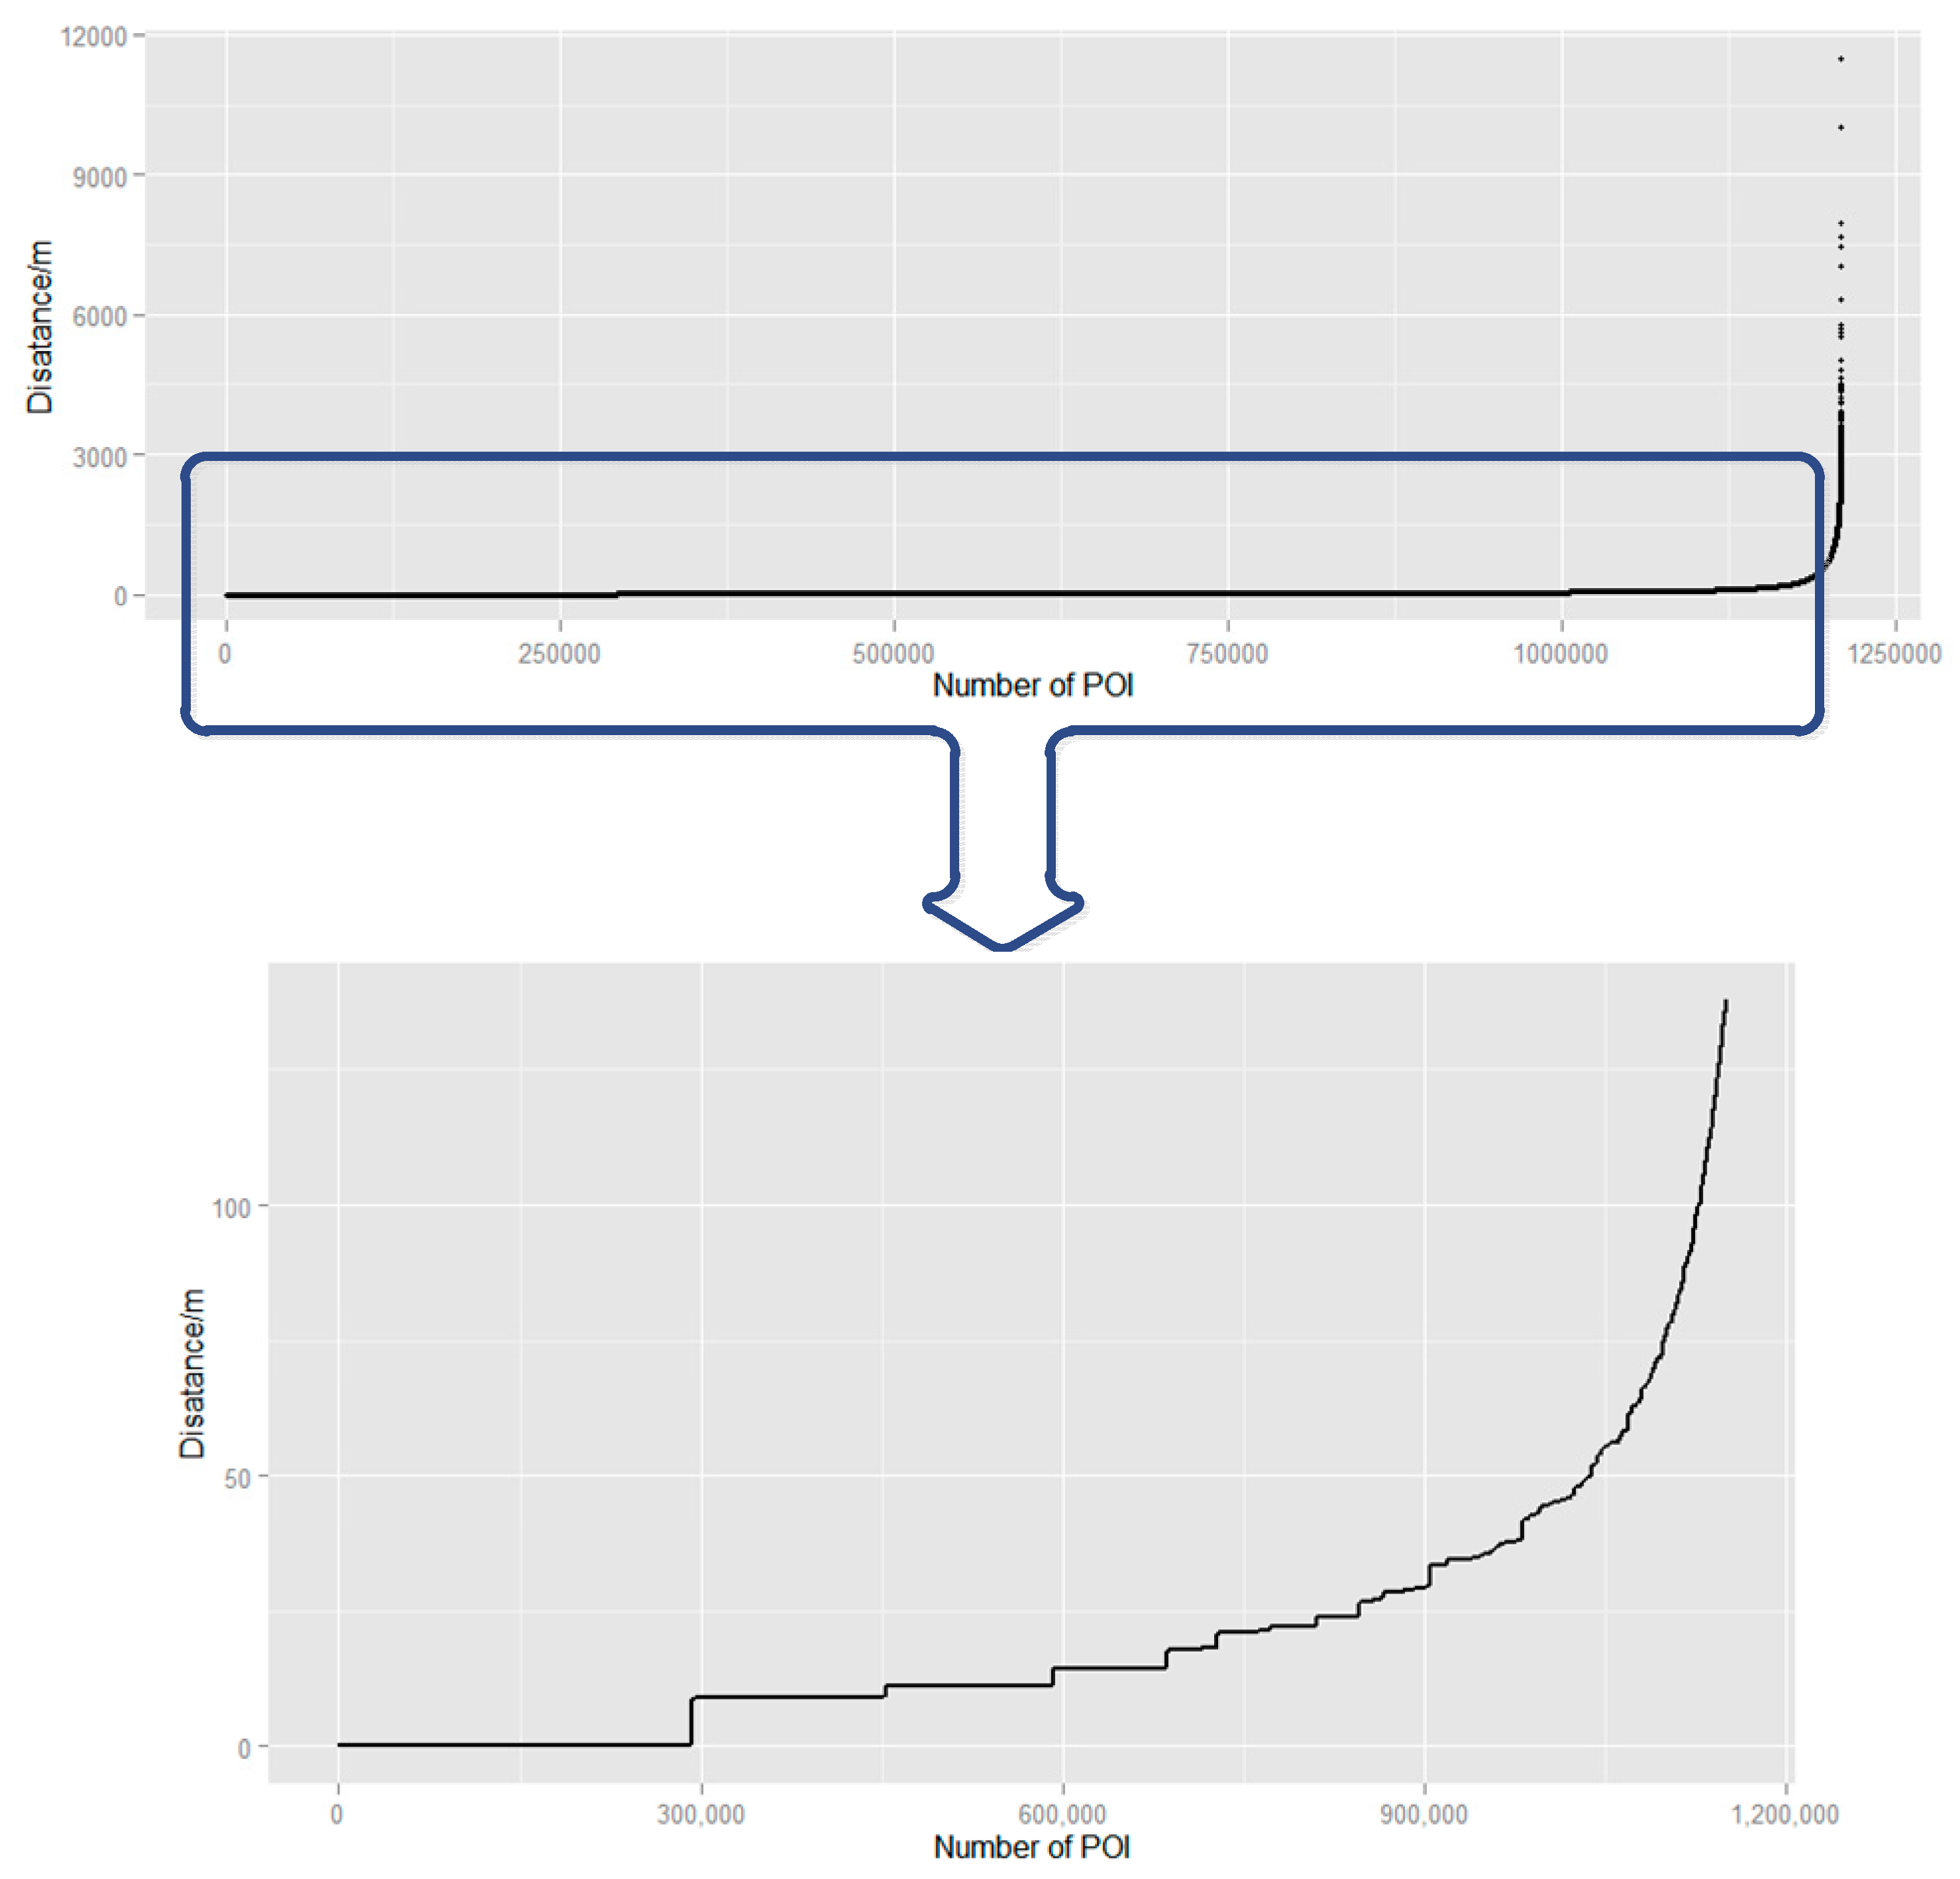
Eps represents the radius that POIs can affect. To assigned proper parameter
Eps, the distances between each POI and its nearest POI are calculated and sorted from smallest to largest (
Figure 4). In general, POIs in urban areas show a higher density than POIs in non-urban areas because of differences of socioeconomic environment, leading to various distances between POIs in different regions. Selection of proper value of parameter
Eps should be based on the overall distances of POI distributions. As shown in
Figure 4, part of the POI distance distributions are zoomed in to figure out detailed information. POI distances rise dramatically when it comes to approximately the 1,100,000th POI with a distance value of 100 m; thus, the parameter
Eps is set as 100 m for the majority of POIs are located within 100 m and are more likely to show a relatively high density of distribution.
Parameter
Minpts defines the minimum number of POIs of one cluster in the land cover regions.
Minpts with relatively low value creates more clusters with more sparsely distributed POIs. In contrast,
Minpts with higher value generates fewer clusters by moving out all sparsely distributed POIs. In order to evaluate the minimum number of POIs in one cluster, we analyse the patterns of POI distributions by simulating POI affected areas. Buffer analysis is performed in each POI to simulate POI affected areas. POI affected radius is selected based on parameter
Eps. We set parameter
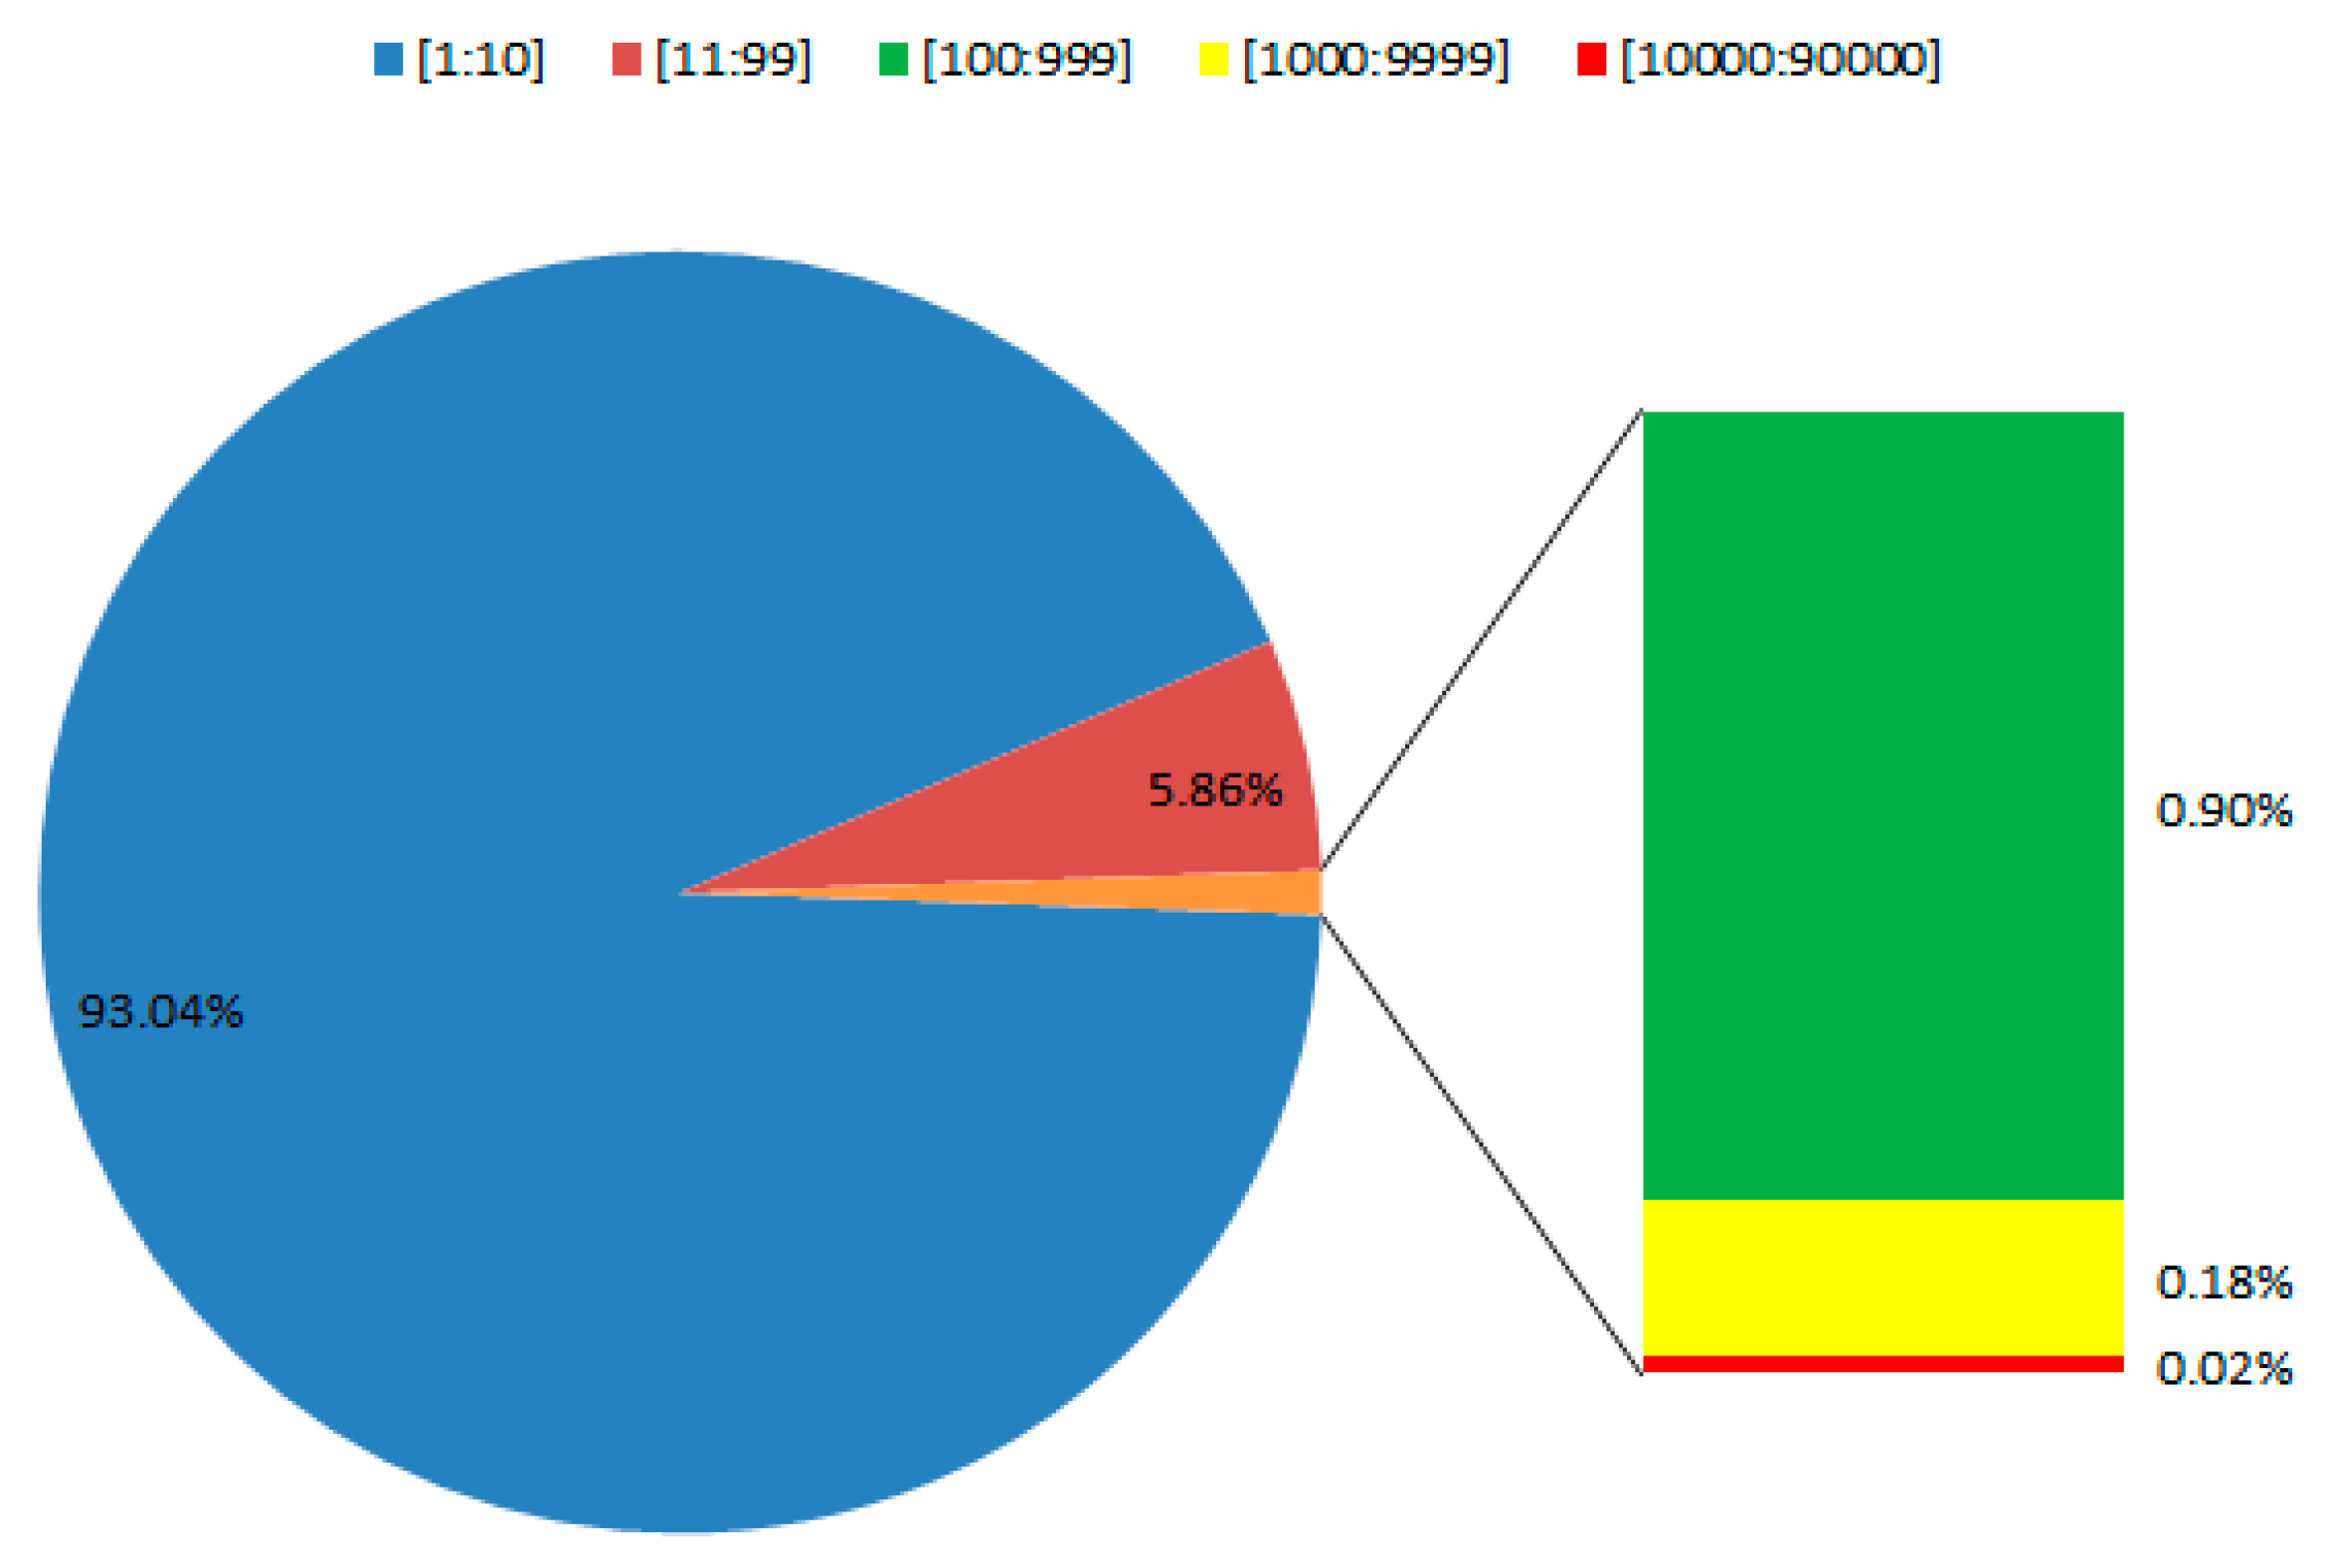
Eps as 100 meters according to the above analysis. The overlaid POI affected areas are then merged into one POI affected area. We simulate the POI affected areas in our study areas and calculate the POI numbers with each POI affected area. The proportion of POI affected areas containing a different number of POIs is shown in
Figure 5. Most POI affected areas contain within 10 POIs, occupying 93.04% of the total number of areas. Furthermore, 5.86% of POI affected areas include more than 10 but less than 100 POIs. Around 0.90% in total areas distributes more than 100 but less than 1000 POIs. Areas containing more than 1000 but less than 10,000 POIs are 0.18% of total areas. Only 0.02% of POI affected areas include more than 10,000 POIs. Therefore, the minimum number of POIs in one cluster
Minpts should be chosen between 1 to 10 POIs.
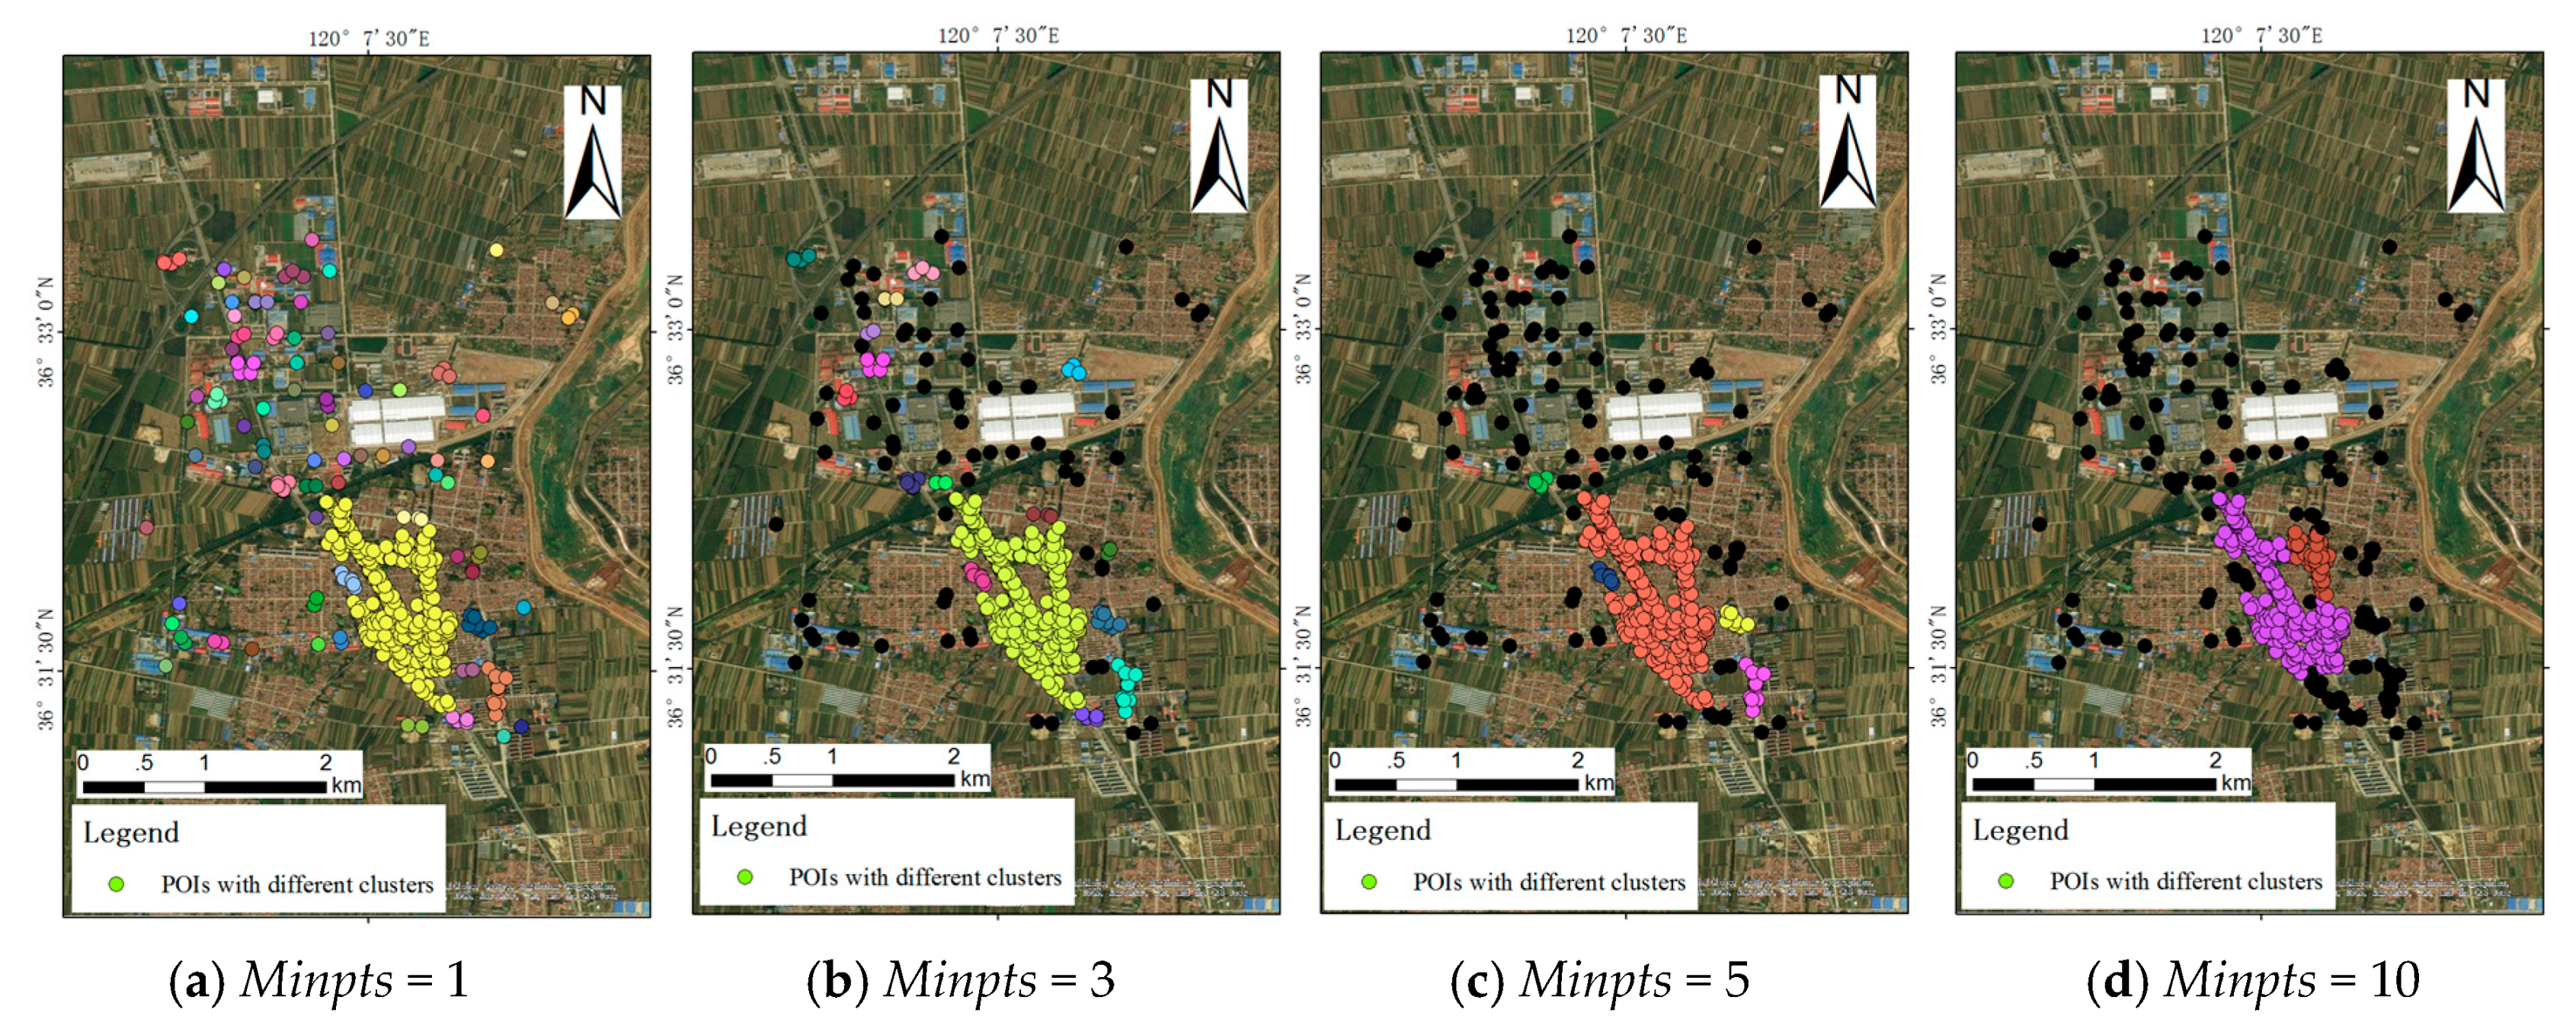
To illustrate POI clusters with different parameter
Minpts, POIs in part of the study area, which are randomly selected from the whole area, are extracted and we choose
Minpts as 1, 3, 5 and 10, respectively, for DBSCAN clustering. The result is shown in
Figure 6. POIs are grouped with the same colour. In addition, POIs that are black in colour, which are defined as noise, are moved out. With
Minpts assigned as 1 (
Figure 6a), all POIs are grouped into different clusters within surrounding sparsely distributed POIs. With parameter
Minpts increasing, there are POIs defined as noise and moved out from clusters.
Figure 6b indicates that several POIs with relatively far distances are removed when
Minpts is set as 3.
Figure 6c display POI distributions with
Minpts as 5. POIs, which can be identified as small clusters are moved out. Even some POIs with high density are identified as noise with parameter
Minpts as 10 (
Figure 6d). Therefore, assigning parameter
Minpts as 3 is reasonable to extract land cover regions.
4.1.2. Extracting Land Cover Regions from Clusters Using Concave Hull
While POIs are clustered with DBSCAN, the next step is to extract regions using those clustered POIs for further land cover classification. Although POI affected areas we discussed above can somehow reflect part of land cover regions, land cover region boundaries are hard to build based on POI distributions. Therefore, we apply concave hull [
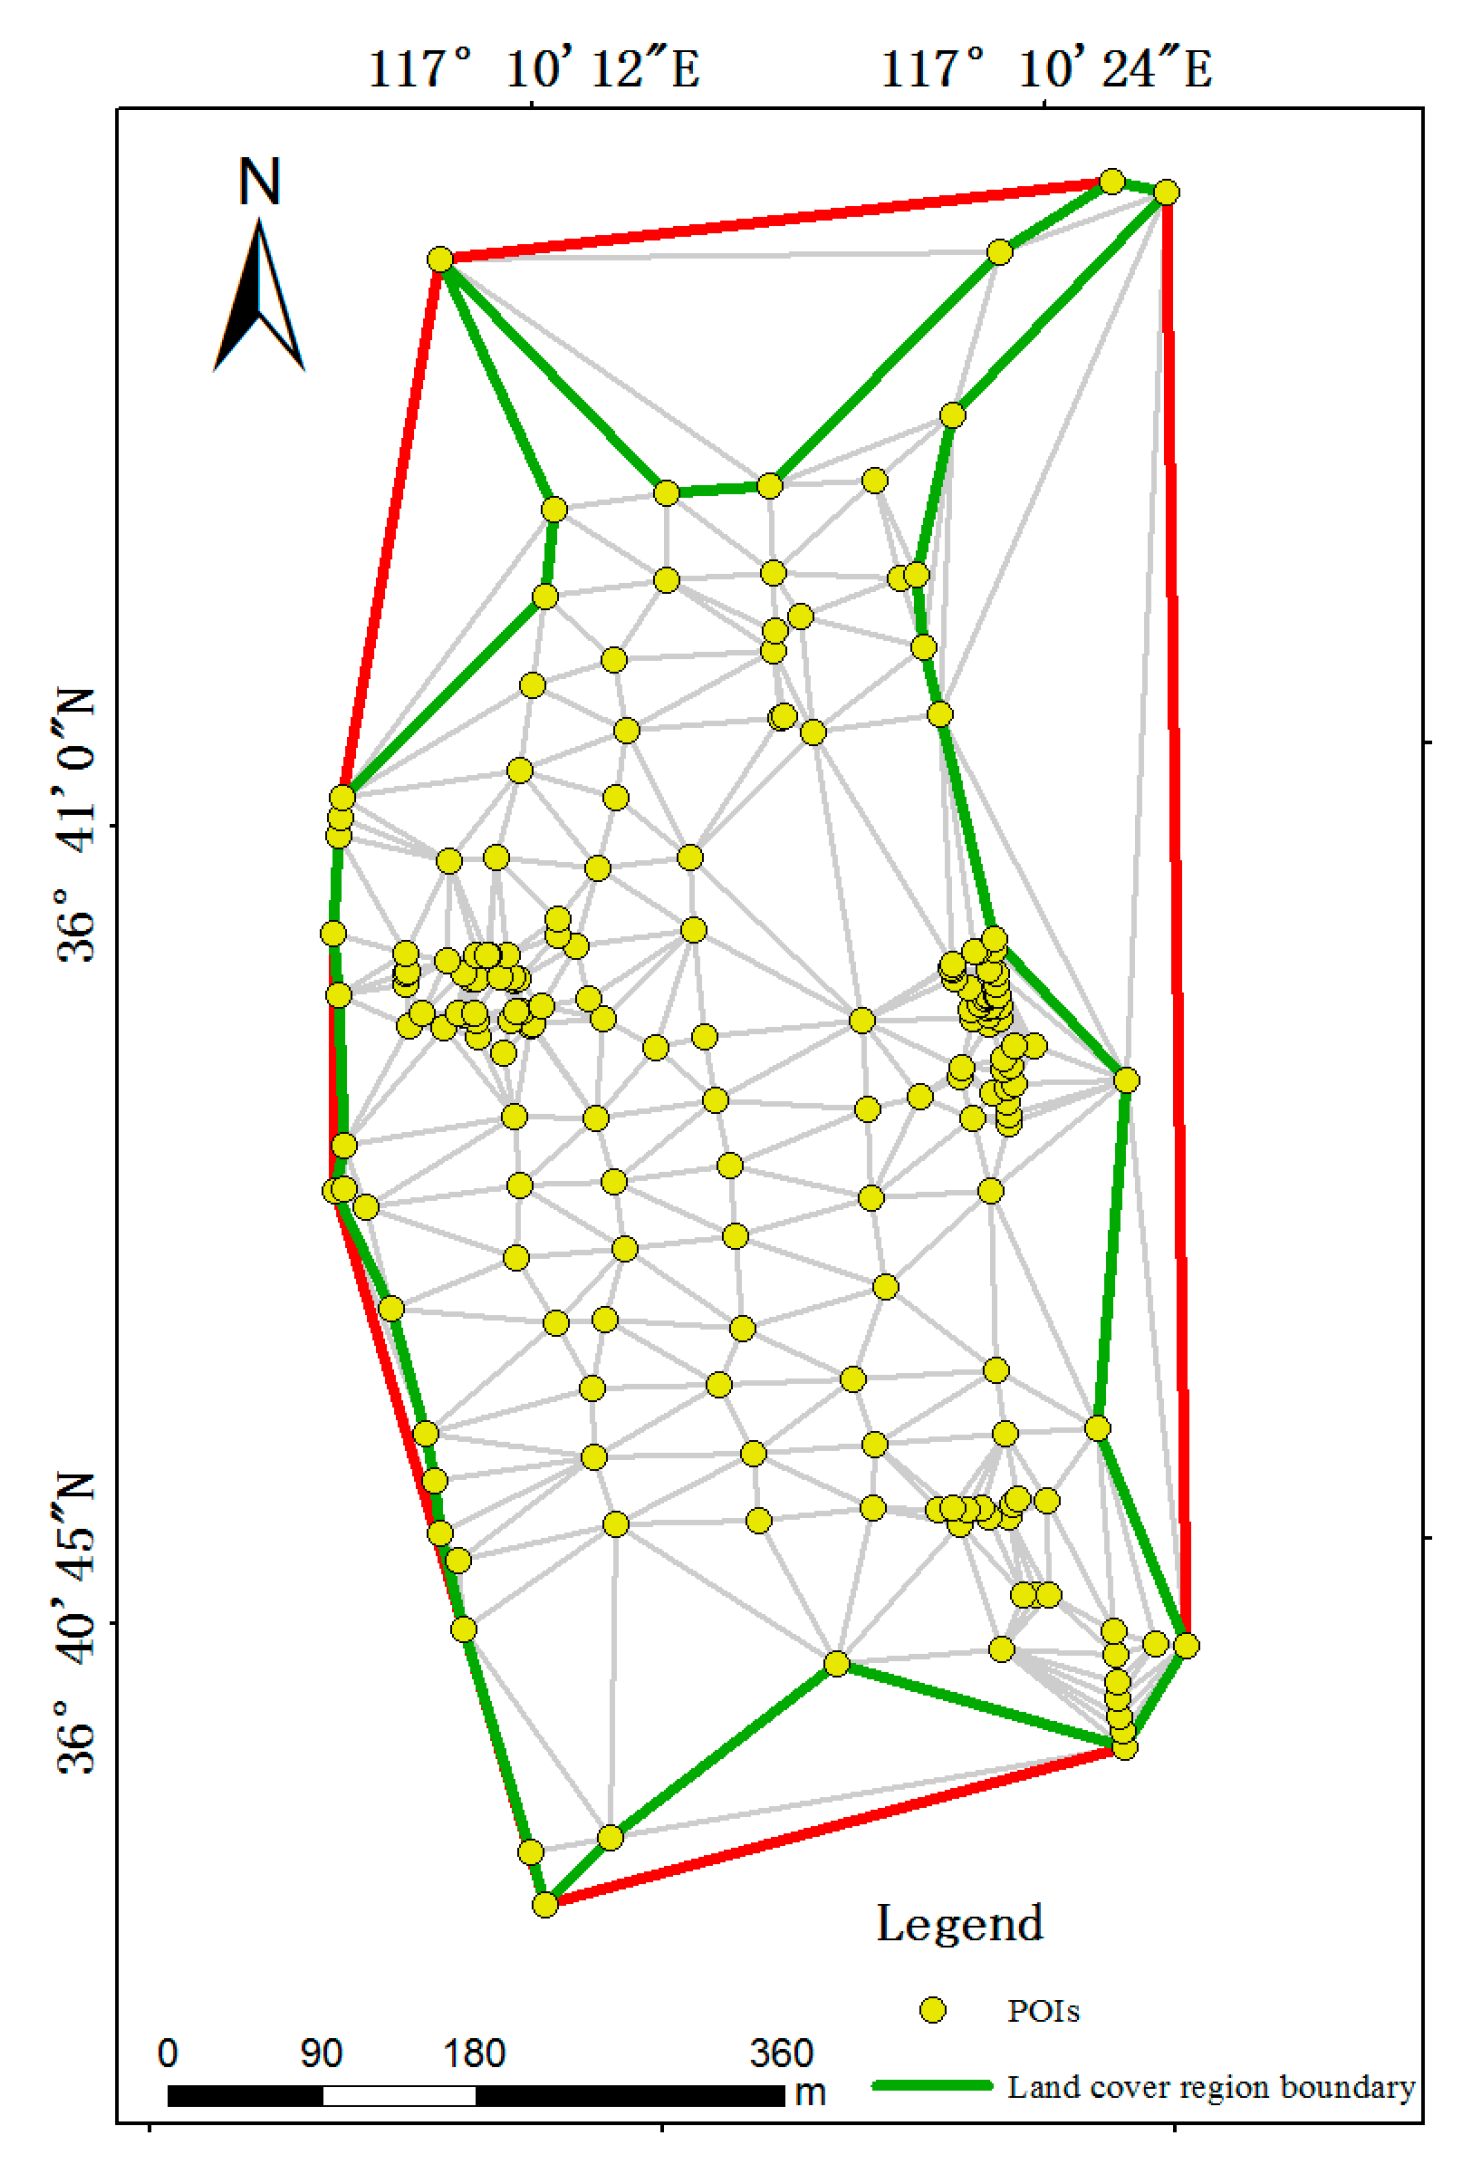
34], a method to find the minimum polygon boundary based on a set of points, to extract land cover regions. The approach of concave hull to extract regions is shown in
Figure 7. An area is randomly selected to demonstrate the construction of a land cover region. Each POI cluster is applied to create Triangulated Irregular Network (TIN), and proposing concave hull is for determining the edge of land cover region based on input parameter
α, which indicates the radius of circumscribed circles for each triangle. Without parameter
α, the region is extracted according to the red line in
Figure 7. When a value of
α is assigned, triangles in
Figure 7 whose radius of circumscribed circles are larger than
α are not considered as the edges of extracted regions (green lines in
Figure 7).
Based on the above analysis, parameter
α in concave hull should be chosen with a proper value to avoid extracting many empty areas without POI distributions. To apply a proper value of
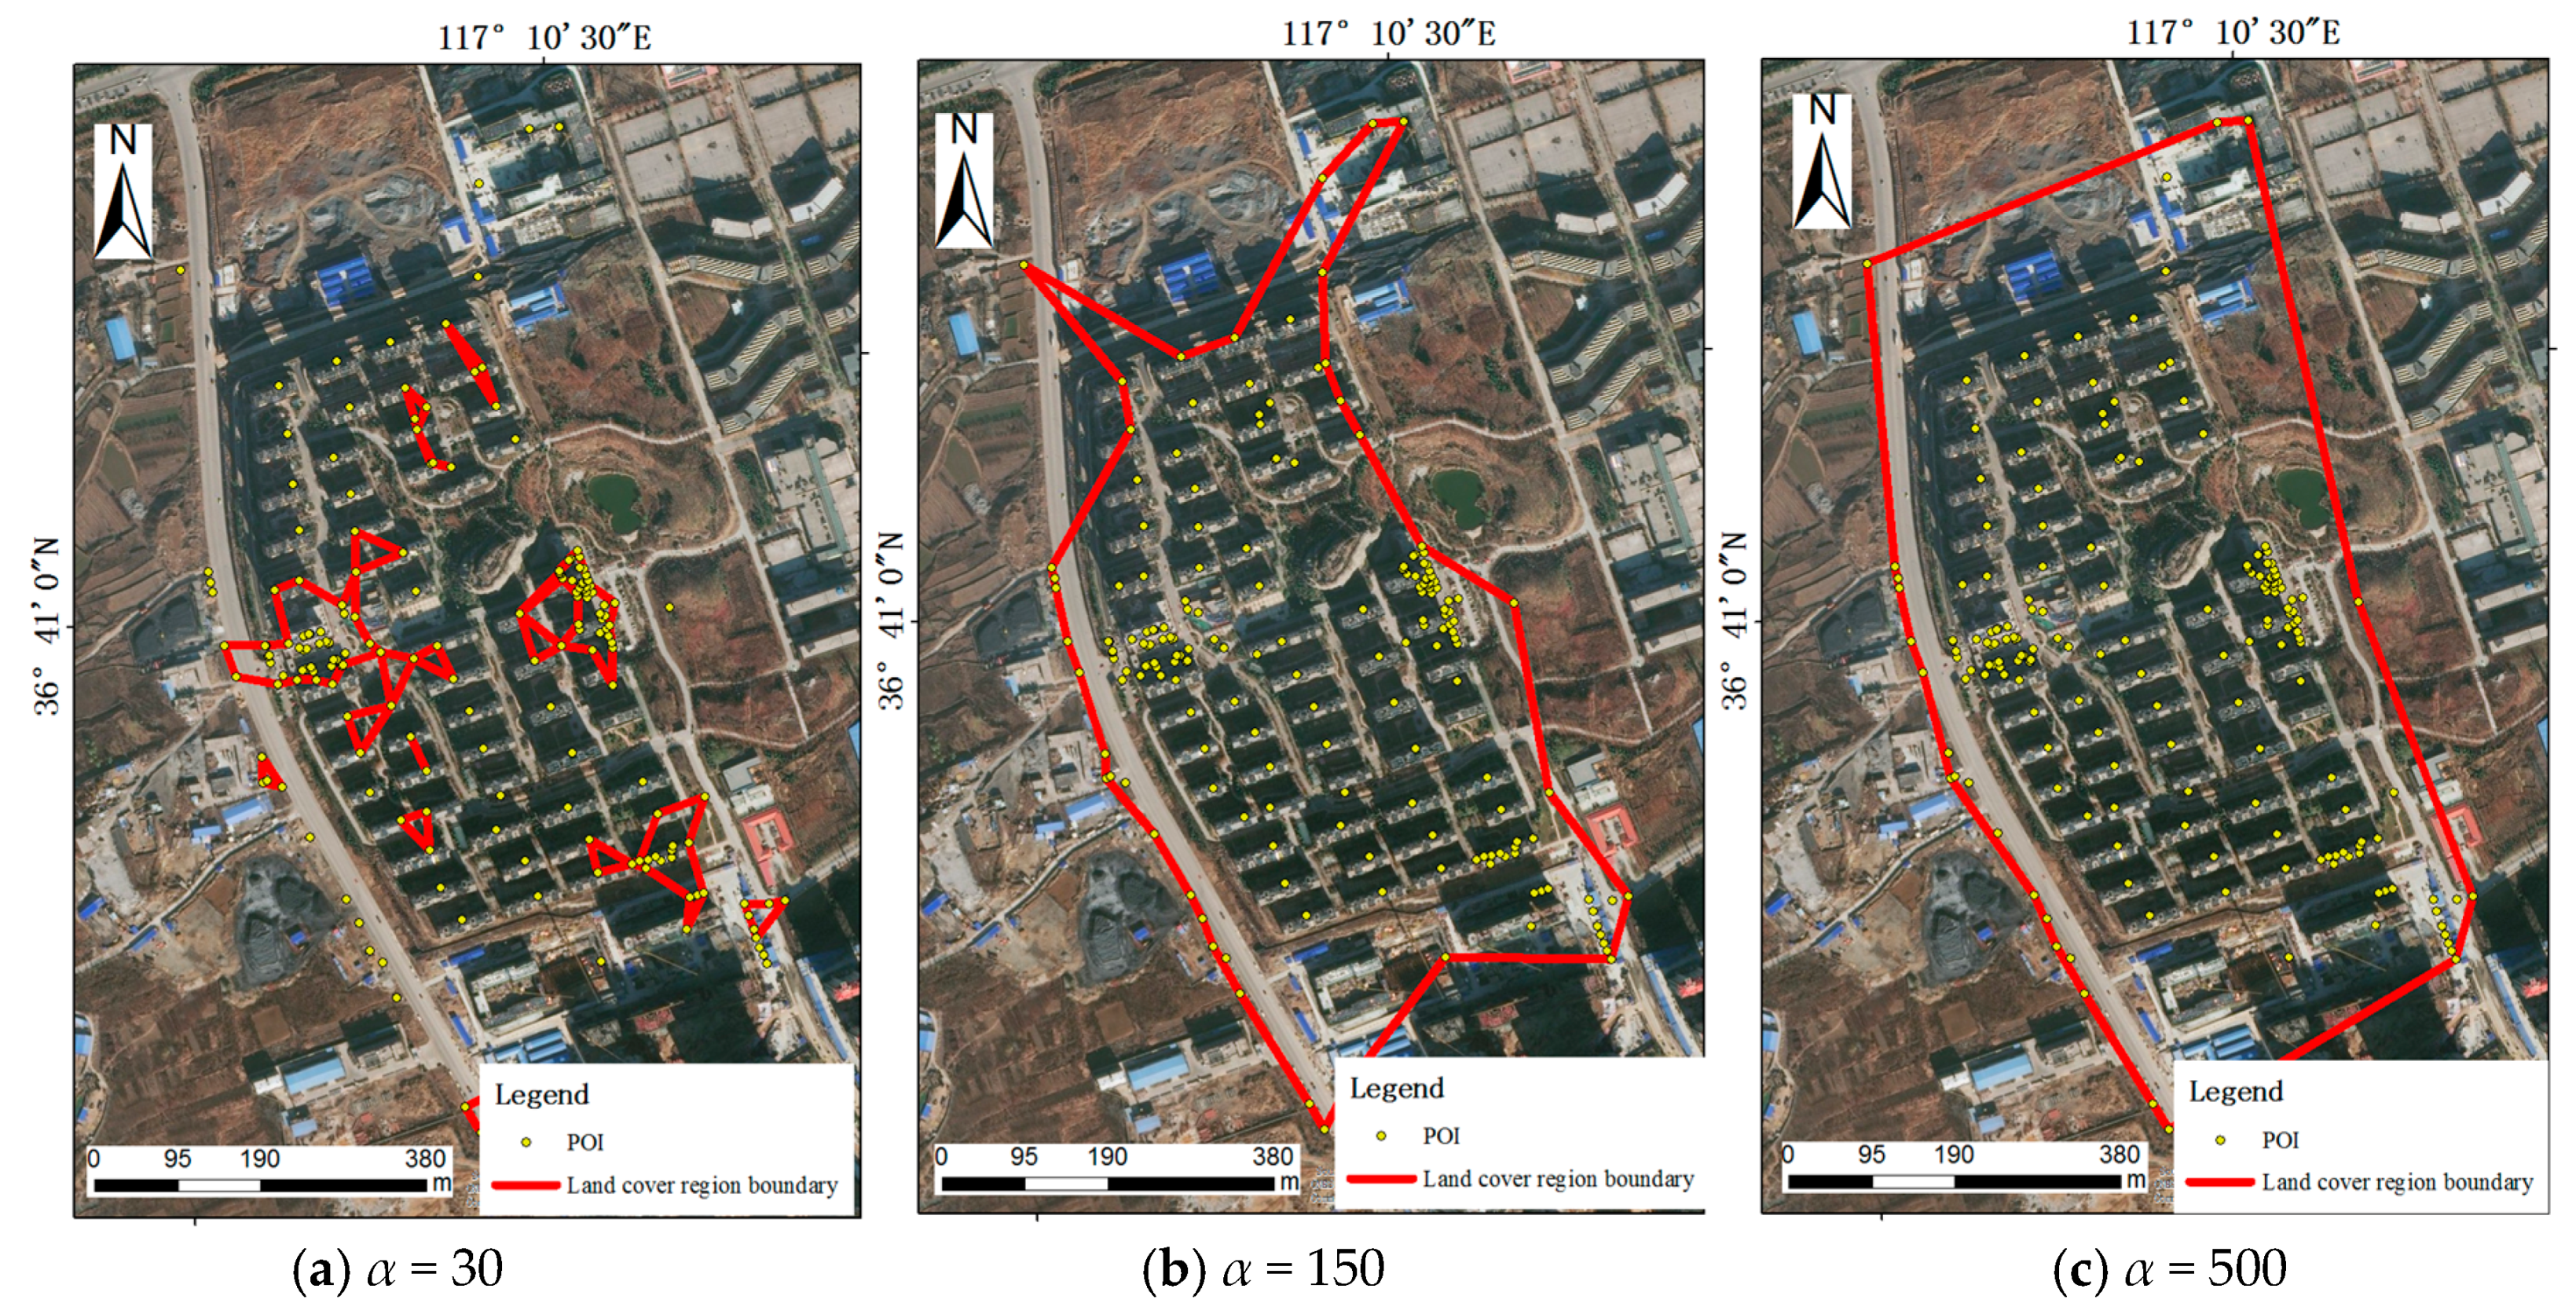
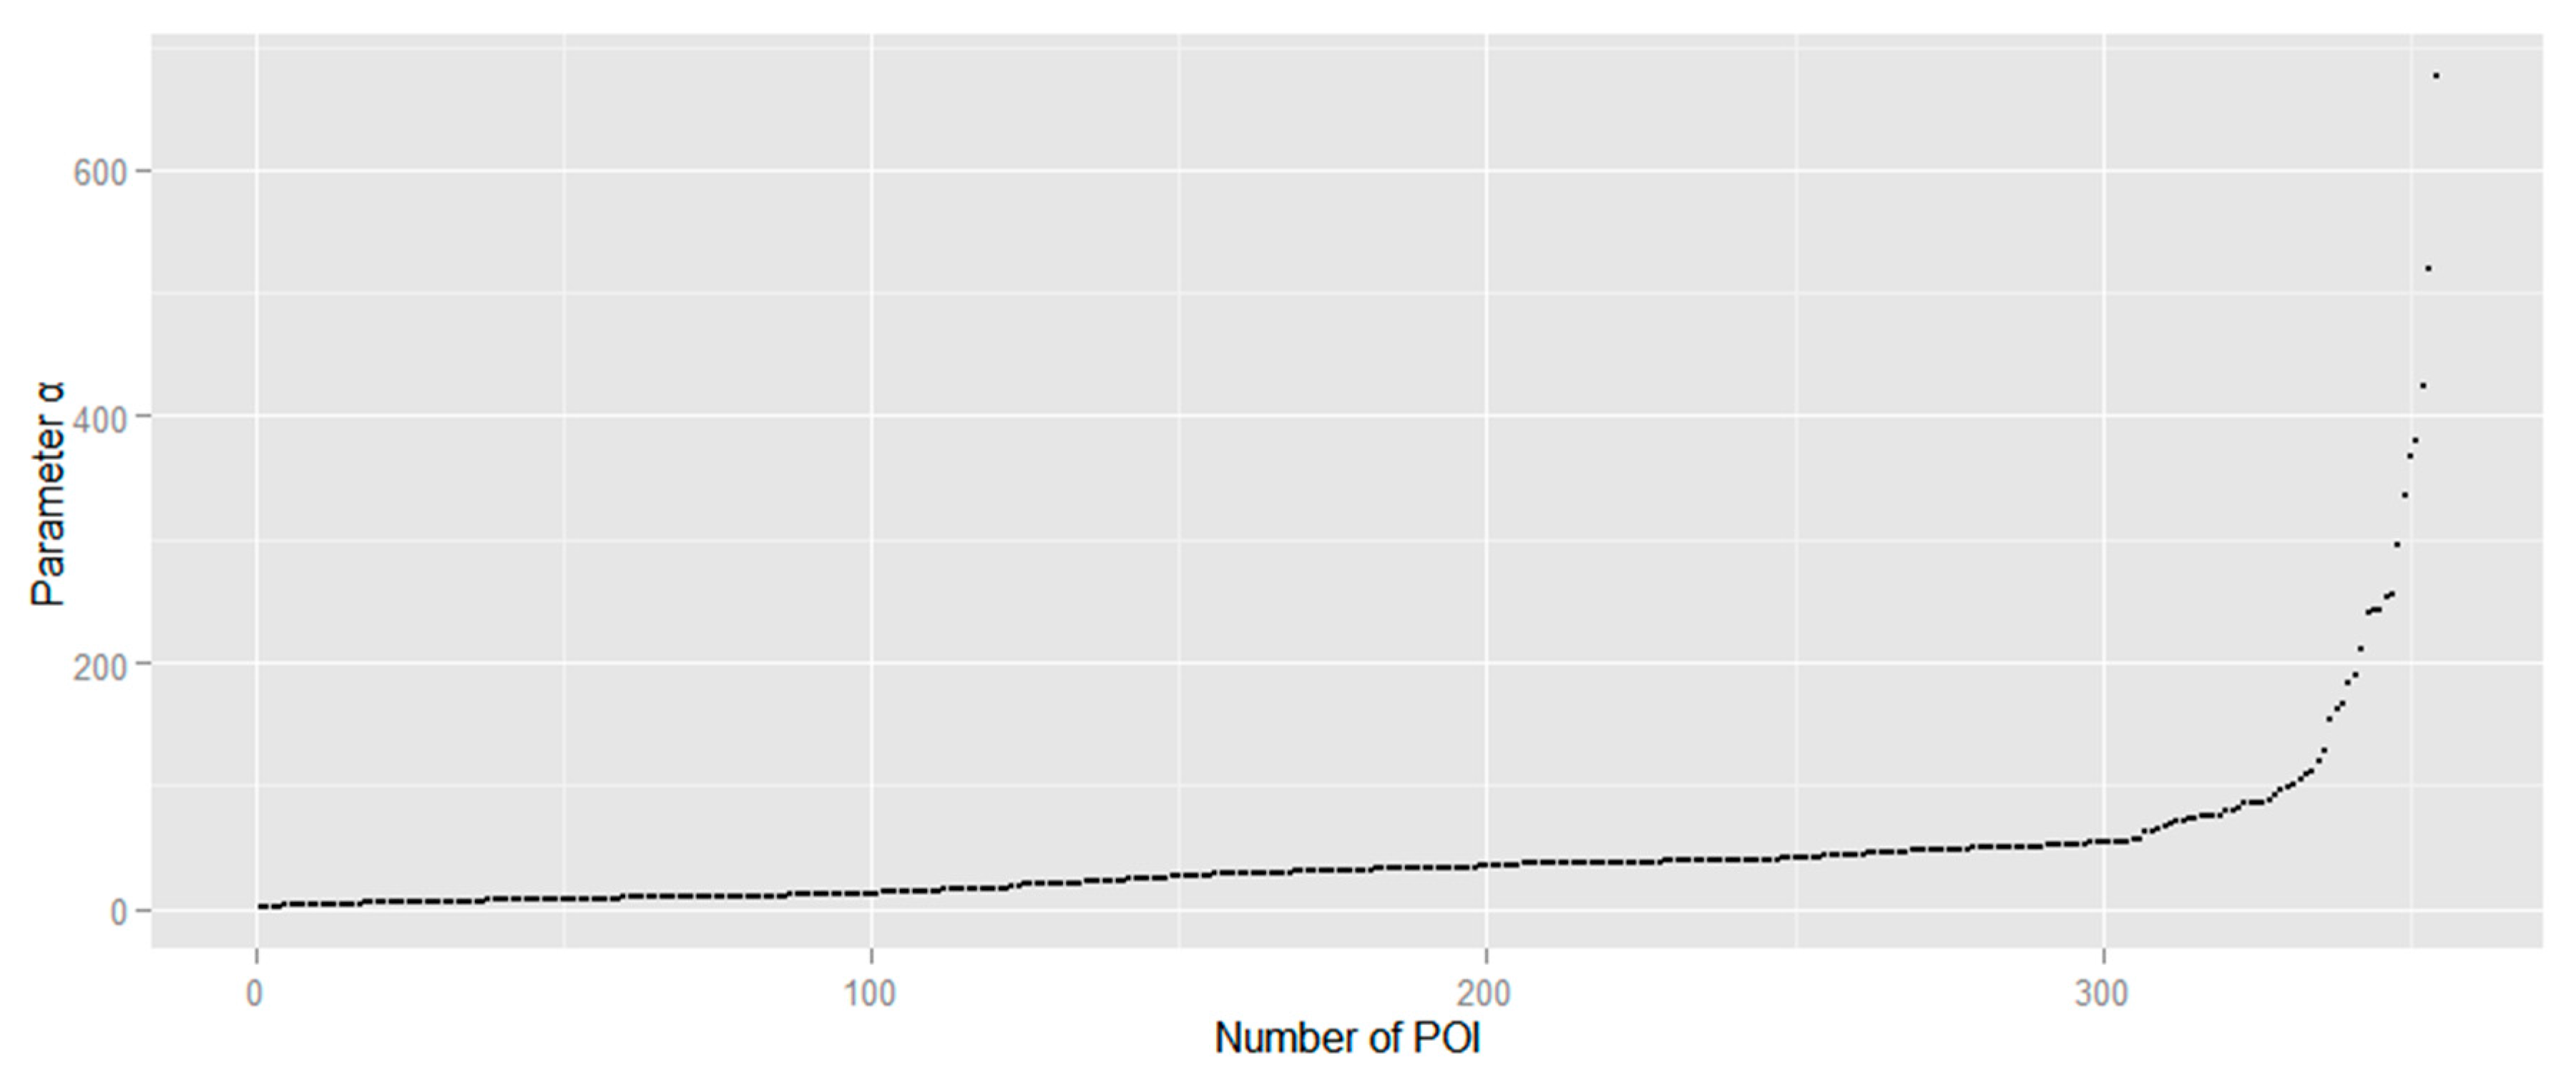
α, each cluster of POIs should be applied to calculate the radius of circumscribed circles for each created triangle that is sorted from smallest to largest. We randomly select a POI cluster in the study area, for example, which is shown in
Figure 8. Parameter
α increases significantly when the value is larger than approximately 150 m (
Figure 9). The proper value of
α in this cluster should be 150 m approximately based on the value distribution of parameter
α. To evaluate the selection of parameter
α for the above cluster, we assign parameter
α as 30, 150 and 500, respectively, to extract land cover regions (
Figure 8). With remotely sensed image as reference data, extracted land cover region in
Figure 8a,c are apparently unfitted with the actual land cover. In contrast,
Figure 8b indicates that the extracted region with parameter
α as 150 is well fitted based on the calculating result in
Figure 9.
4.2. Land Cover Classification with Topic Model
While land cover regions have been extracted based on POI density, the land cover type of each region still remains unclassified. This section aims at classifying extracted regions as different land cover types using categories of POIs located in each region. The LDA topic model is applied to calculate effective land cover topics among various POI categories. The advantage of this approach is that even if some POIs are mislabelled with the wrong type, as long as most POIs have the correct categories, these mislabelled types can be ignored to ensure data quality to some extent. After that, the SVM algorithm is applied to classify land cover regions as different types based on land cover topics.
4.2.1. Calculating POI Topics from Land Cover Regions Using Topic Models
With extracted land cover regions based on POI distributions, categories of POIs from each region are extracted to calculate topics with topic distributions related to land cover types using the LDA topic model. The LDA topic model defines documents as input data. A document contains several topics that involve different words. The outputs of LDA are the distribution of topics in each document and the distribution of words in each topic. Assuming that POI categories in one region are considered as words in one document, two outputs, the calculated topics (category distributions) and topic distributions, can be indicators of land cover classification. One of the output topic distributions
Θ is shown in Equation (1):
where
represents the number
n of POI topic
Z in document
d.
K indicates the total number of POI topics. In addition,
α represents the parameter in the LDA model.
Two variables, which influence output distributions of POI categories and topics, are parameter
α and topic number
K. In our study, we employ the selection of value of
α proposed by Griffiths et al [
20]. To determine the proper topic number
K, which is defined based on various categories of POIs, the perplexity algorithm is involved to evaluate the classified topics with specific topic number
K. It refers to the uncertainty that a document belongs to one topic. With lower value of
perplexity, topic number
K is more proper to the LDA topic model. The perplexity algorithm is defined as Equation (2):
where
refers to the probability that POI category
W is within the document
d.
represents number of POI categories in document
d.
M indicates the total number of documents. A range of
is utilised to propose the LDA topic model, respectively, using perplexity (
Table 1). We set
K as 30 considering the relatively low value of perplexity. Although
K = 100 brings lower perplexity, it is not necessary to calculate a large quantity of land cover topics in the middle of classification processing. As a result, over 200 POI categories are grouped into 30 land cover topics.
4.2.2. Classifying Land Cover from POI Topics
After proposing the LDA topic model, classified POI topics with distributions can be related to land cover types in each extracted region. With topic distribution
Θ calculated by Equation (1) as input data, we utilise the SVM algorithm to perform land cover classification. The matrix of topic distribution
Θ is defined as follows:
where
P indicates the probability of one topic belonging to a document.
The most significant factors that have great impact on classification accuracy in the SVM algorithm are kernel function, parameter gamma and cost. As each topic distribution is considered an attribute employed in the SVM algorithm, we apply sigmoid as kernel function to classify these relatively large quantities of topics. In order to choose the optimised values of gamma and cost, this study considers a grid search algorithm, which utilises cross validation with a range of values of gamma and cost. In the end, the final gamma and cost with lowest error are applied for land cover classification.
5. Results
5.1. Extracted Land Cover Regions with POI Clusters
While proper values of
Minpts and
Eps in
4.2.1 have been settled, POI clusters are calculated based on the DBSCAN algorithm. The results in parts of the study area are shown in
Figure 10. POIs with the same colour are grouped into one cluster while black POIs with are considered noise data and moved out. In
Figure 10a, most POIs in the city are clustered, with only POIs out of search radius being excluded. Green POIs belong to the greatest cluster, which nearly occupies all of the urban areas. In
Figure 10b, sparsely distributed POIs are identified as noise data while several POIs are grouped into different clusters. These high density POIs are used for extracting land over regions.
Since the POIs have been clustered and sparsely distributed POIs have been moved out, we employ concave hull with proper parameter
α to extract land cover regions. A total number of 26,185 land cover regions are extracted within the area of Shandong.
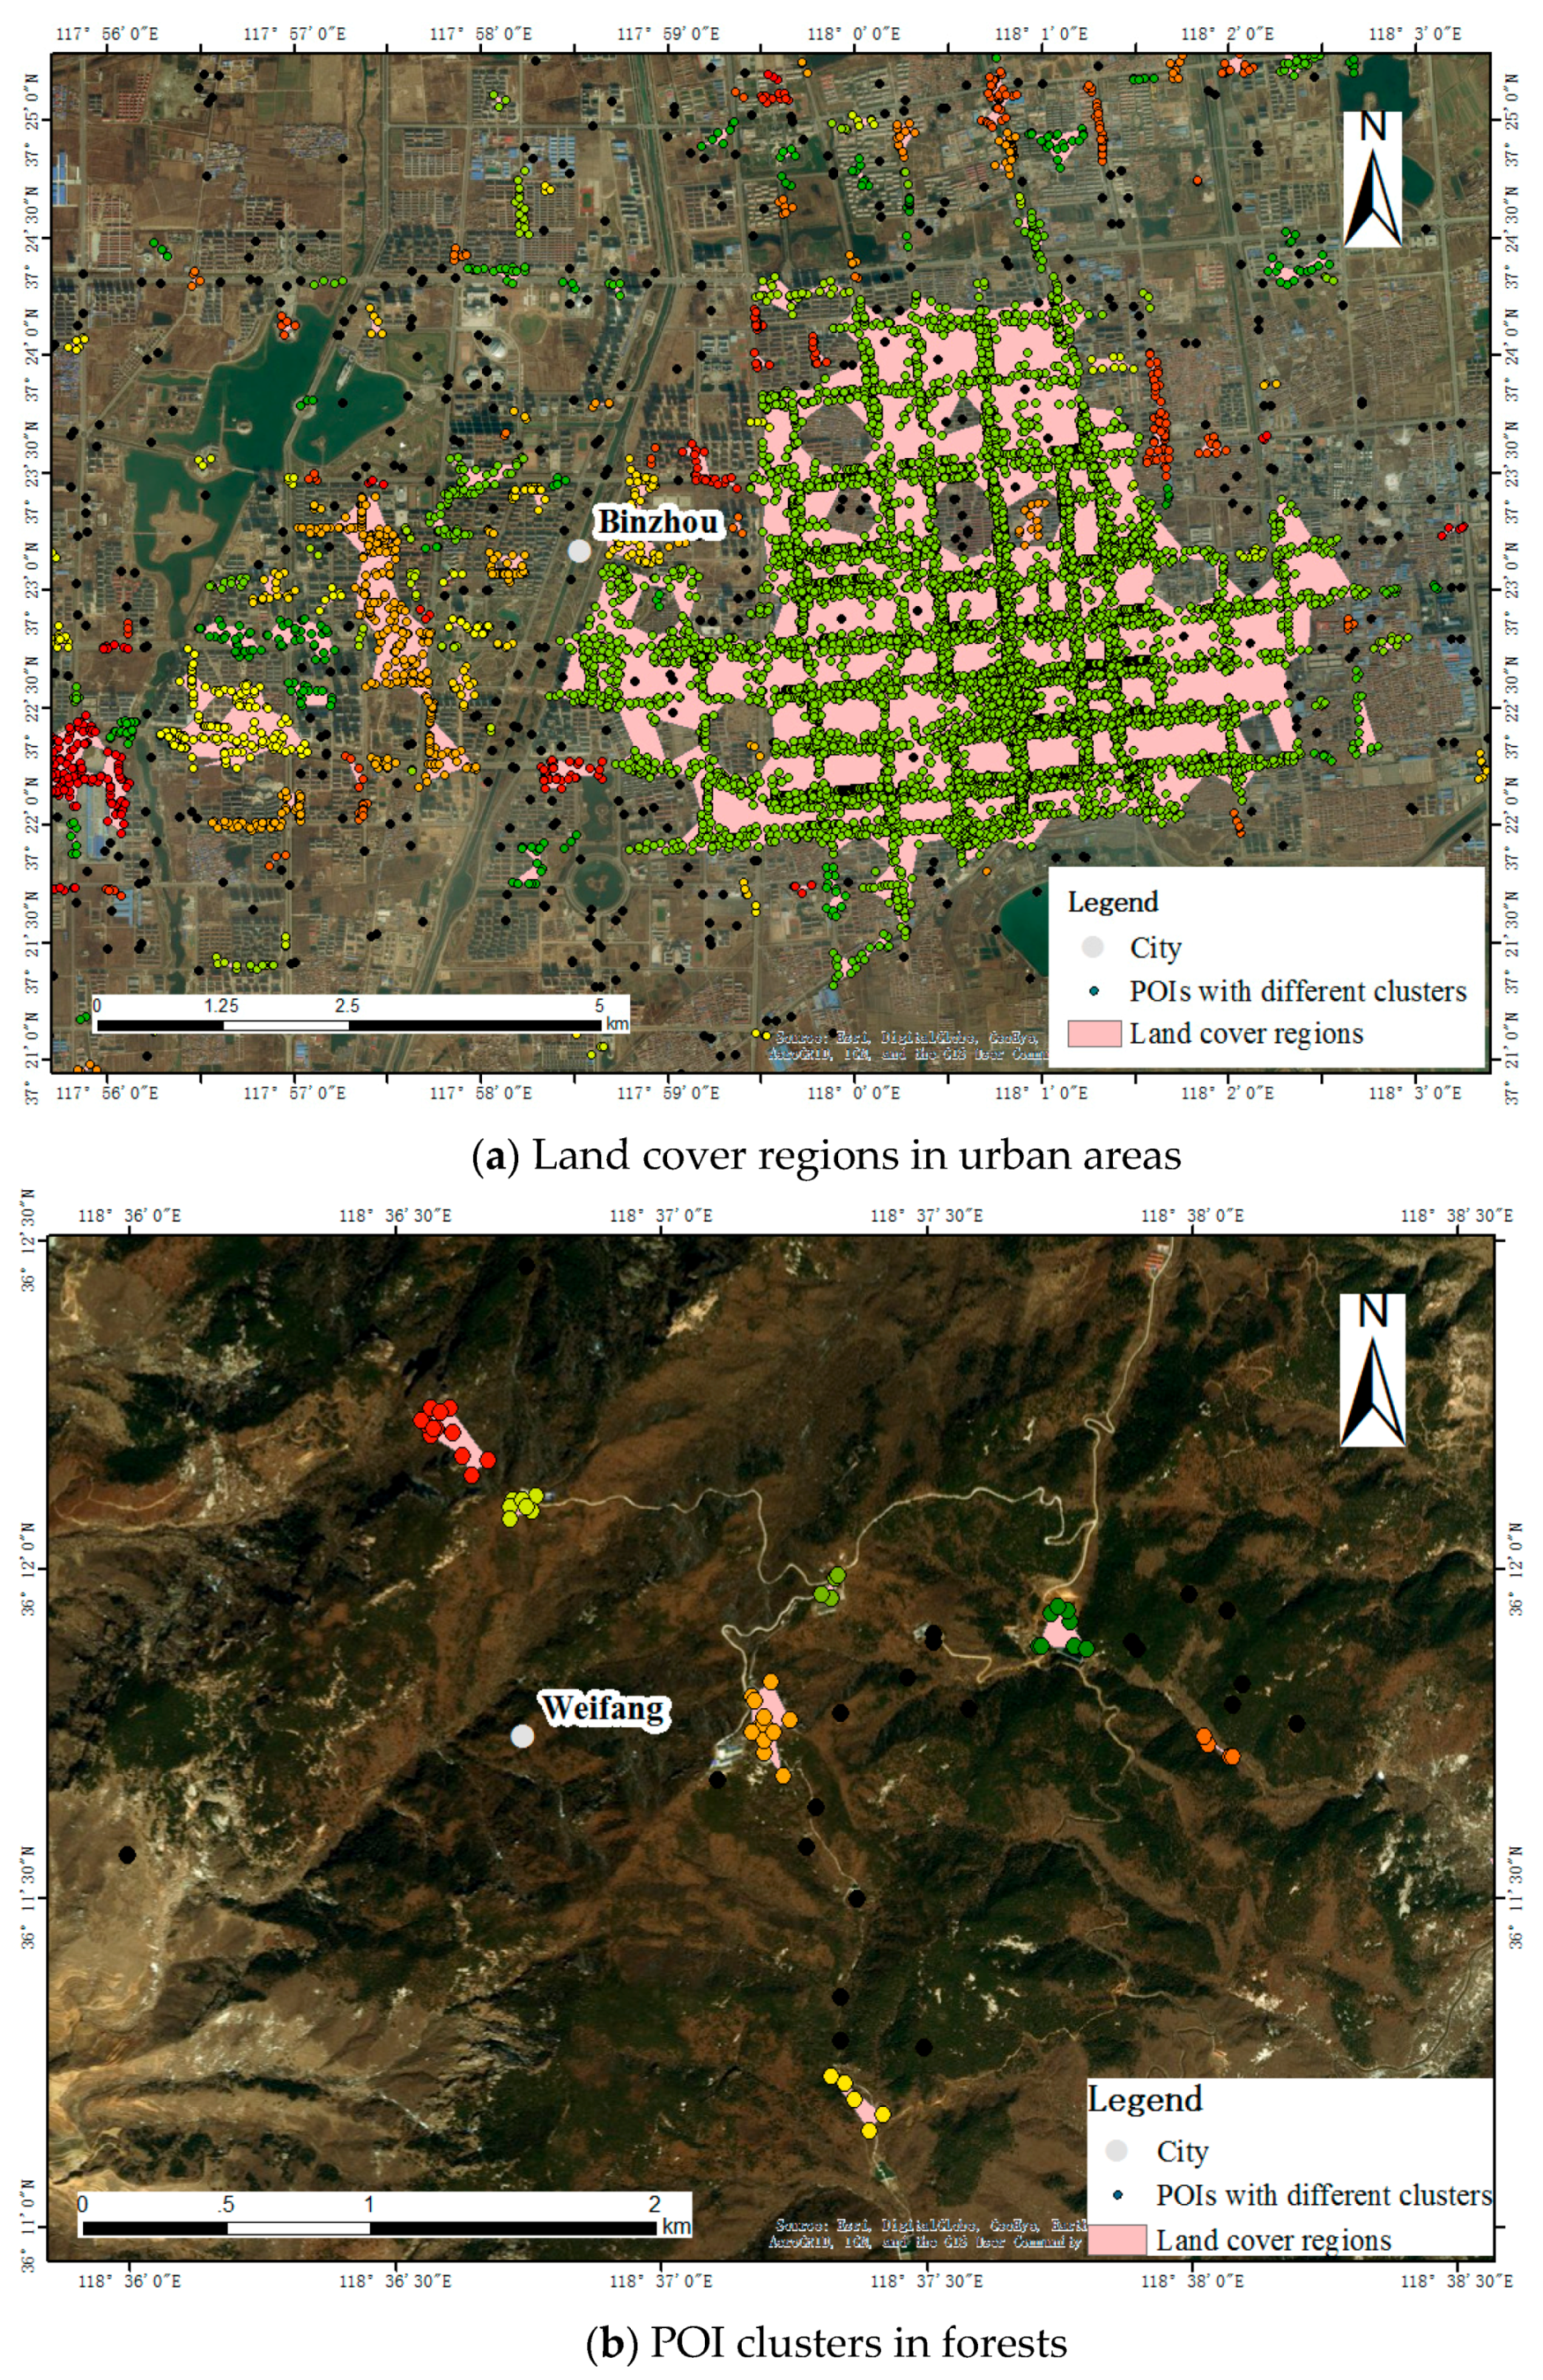
Figure 11 shows two regions extracted based on POI cluster, which are displayed in
Figure 2. The regions extracted in
Figure 11a cover the urban area. Although some areas are not occupied with POIs, they are still identified as land cover regions for classification because of surrounding distributions of POIs. On the other hand,
Figure 11b indicates that only grouped POIs are utilised to extract small land cover regions. Even though the remotely sensed image in
Figure 11b shows a large area of forest, the lack of reliable POIs makes these areas remain unclassified.
5.2. Land Cover Classification with POI Topics
Since topic number K has been settled in
Section 4.2.1, POI topics with distributions are calculated by proposing a LDA topic model. Several land cover topics with high weights of distributions in land cover regions in
Figure 10 are shown in
Table 2. Topic 6 shows POI categories that are related to city entertainment, and topic 13 indicates the topic corresponding to food. Both topics can refer to artificial surfaces, as they are human activity related. These two topics occupy a large proportion in land cover regions in
Figure 11a. On the other hand, topic 23 represents outdoor traveling related categories, which can give a clue to non-artificial surfaces. This topic is dominant in the areas in
Figure 11b.
To classify extracted regions with topic distributions, the SVM algorithm is applied to build a land cover classifier identifying different land cover types. In order to train a land cover classifier, 906 random samples labelling land cover types are selected with 500 of them as training data and the rest as testing data. The classification accuracy of land cover is shown as
Table 3. Classification accuracies with training data and testing data are 80.00% and 80.79%, respectively. Seventy of the 500 total training data are misclassified as artificial surfaces, while this kind of misclassification data in testing data is 58. Thirty samples of training data are misclassified as non-artificial surfaces and only 20 samples are misclassified as non-artificial surfaces in testing data.
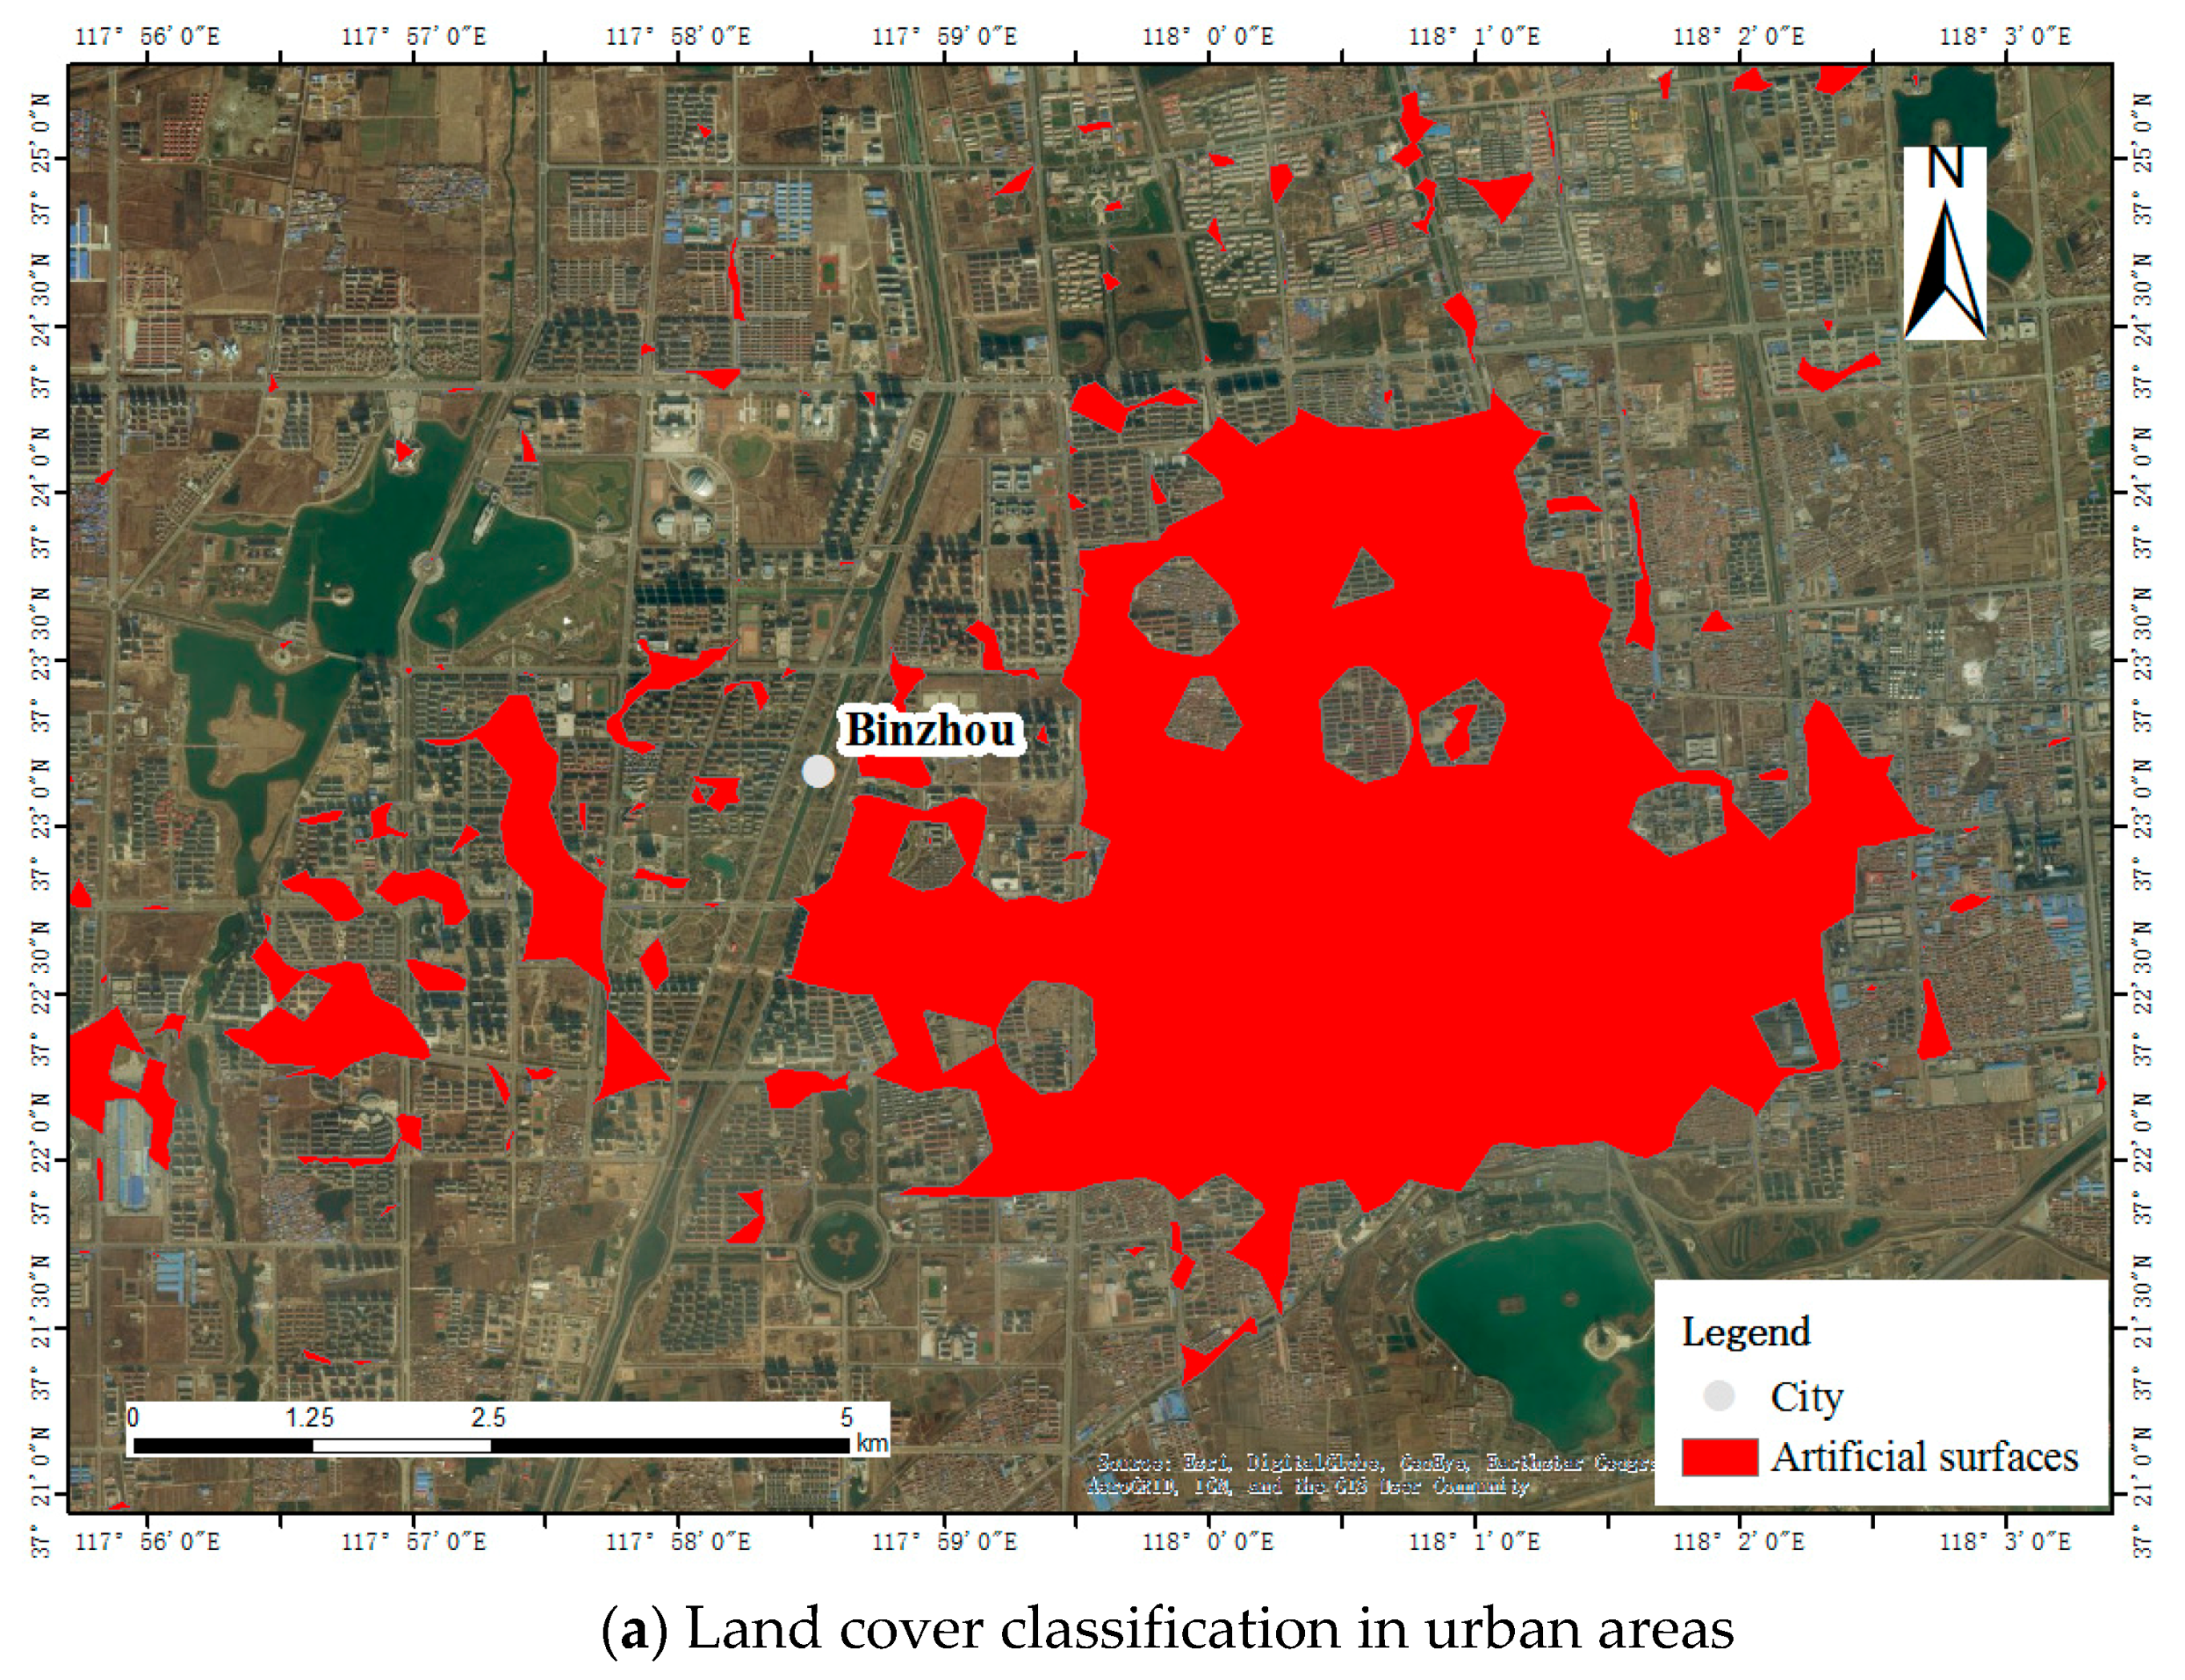
After building a land cover classifier, all extracted regions are applied in the classifier to classify land cover types. Classification results of areas in
Figure 11 are shown in
Figure 12. With a high proportion of topics, which indicate build-up areas, the regions in
Figure 12a are therefore classified as artificial surfaces. Regions in
Figure 12b are classified as non-artificial surfaces because of land cover topics related to outdoor traveling.
5.3. Land Cover Classification Accuracy Assessments
Land cover classification in Shandong is shown in
Figure 13. Regions in red represent artificial surfaces while regions in green belong to non-artificial surfaces. Artificial surfaces occupy most of the areas because POIs mainly indicate human activities. While POIs are utilised to classify land cover types, an accuracy assessment should be done to evaluate land cover classification. Random sampling with 500 samples is proposed three times in the classified areas and is interpreted by volunteers using remotely sensed images. The accuracy assessment is shown in
Table 4. Producer’s accuracy of artificial surfaces is around 85%, and the user’s accuracy of this land cover type is even higher, with an accuracy of approximately 91%. On the other hand, producer’s accuracy and user’s accuracy of non-artificial surfaces are much lower, with all of them below 30%. The unsatisfying accuracy of non-artificial surfaces is due to the low proportion of non-artificial regions in the areas, as POIs mainly reflect areas related to human activities. The overall accuracy is 80.81%, 79.60% and 79.84%, respectively. It indicates that the classification accuracy is approximately 80%, which is similar to the classification results of land cover classifier in
Table 3.
6. Discussion
In this study, we applied CGI textual information for land cover classification using spatial clustering and a topic model. As CGI is usually located in uneven spatial distributions [
12], the use of spatial clustering is beneficial to detect CGI with high density and extracting land cover regions with more reliability. For further classifying land cover regions with a variety of CGI textual information, we utilised a topic model in order to calculate effective land cover topics of each land cover region. If we use spatial clustering only, the categories of POIs, which we considered as CGI textual information in this study, are more than 200 rather than 30 land cover topics. Thus, the classification of textual information in the extracted regions can be more time consuming and labour intensive. In contrast, applying the topic model in POIs without spatial clustering can lead to indistinct land cover region boundaries of each land cover type. Therefore, the combination of both spatial clustering and topic model produces more accurate land cover classification results and improves land cover classification efficiency.
Based on the approach proposed above, this paper utilised POIs as experimental data for land cover classification. Although POI textual information shows advantages of land cover classification in this study, they are usually corresponding to human activities, and most of the POIs are located in artificial surfaces, leading to lack of data in other land cover types. In fact, a large amount of textual information exists not only in POIs, but also in geo-tagged photos [
13,
16], social media check-in data [
15], OSM [
10,
11] and land cover related websites [
4]. The textual information that CGI contain can somehow reflect land cover types according to the environmental descriptions in the texts. Therefore, they can be utilised using our proposed method to complement the shortcoming of POIs and produce a more complete land cover classification result.
By utilising CGI with a variety of spatial and temporal information, land cover classification with different spatial and temporal scales can be generated based on the proposed method in this paper. For the spatial scale, as CGI contains detailed location information, it is possible to generate land cover maps with fine scales. On the other hand, the wide distribution of CGI throughout the world provides opportunities to produce land cover products on a global scale. The clustering method proposed in this paper can be modified with different parameter Eps and Minpts, in order to generate land cover regions with different spatial scales. In terms of temporal scale, the posted time attached to CGI can be considered as the time that land cover belongs to a specific category. For example, using CGI that was collected in the period of 2016, a land cover map with categories in 2016 can be generated based on our proposed method. In addition, it is possible to apply the generated up-to-date land cover maps to land cover changes detection, and we will focus on it in future work.
It should be noted that the proposed method can not only be applied in land cover classification, but it is also suitable for identifying different land uses. However, land cover and land use contain different nomenclatures, in which land use displays more detailed categories related to human activities. For example, according to the nomenclature in land use, “shopping malls” and “public toilets” belong to commercial and public, respectively. However, both commercial and public use are classified as artificial surfaces in land cover. The proposed spatial clustering can be modified to capture a finer scale of CGI distribution in land use, such as different distribution patterns of commercial and private units. In addition, topics calculated by topic model can be classified into more detailed categories in land use. As shown in
Table 2, in land cover nomenclature, topic 6 and topic 13 are classified as artificial surfaces while topic 23 belongs to non-artificial surfaces. In terms of land use, however, topic 6, topic 13 and topic 23 are identified as commercial, leisure and travelling, respectively.
Although the proposed approach generated a land cover classification result with a relatively satisfying accuracy, some limitations of this approach should be considered. First, CGI quality was not fully evaluated in this study. Despite the fact that topic model can filter some mislabelled CGI to some extent, the overall quality should be validated before being applied to land cover classification. Second, our approach only dealt with CGI in high density using spatial clustering, and ignored the sparsely distributed CGI, considering them as noise data to ensure classification accuracy. Third, in terms of land cover classification accuracy, both producer’s and user’s accuracies of non-artificial surfaces are much lower than those of artificial surfaces, with approximately only 25% and 15%, respectively. It may due to the lack of data in non-artificial surfaces, and a lot of CGI on non-artificial surfaces may also contain artificial related information. Increasing data quantity can somehow avoid this problem and improve classification accuracy on non-artificial surfaces. In the end, although land cover map with different time series can be quickly generated using CGI produced in different time, only areas where CGI is available can be generated and classified into a few land cover types. Future work will focus on overcoming the shortcoming from lack of CGI by combining both CGI and remotely sensed images. In fact, CGI can be considered as ancillary data in the process of conventional land cover classification.
7. Conclusions
The novel contribution of this work is classifying land cover using CGI to complement the shortcoming of remote sensing. CGI, containing a large amount of textual information and latitude-longitude information, has great potential to be used for land cover classification. As a case study, we used POIs from Weibo and Baidu Map as a source of CGI data for land cover classification in the area of Shandong province. The main challenge with using CGI textual information was that they were usually located with uneven spatial distributions and contained various unorganised CGI texts. Therefore, spatial clustering using DBSCAN was applied to group POIs with high density followed by extracting land cover regions based on grouped POIs using a concave hull algorithm, and land cover topics with distributions were calculated using an LDA topic model. We applied a SVM classifier using land cover topic distributions to classify land cover. Land cover classification was assessed with remotely sensed images using random sampling. The overall accuracy using the proposed method was approximately 80%, indicating that CGI textual information has great potential to be applied in land cover classification.
Although the achieved assessment accuracy supports our above hypothesis, challenges remained in this study, which should be settled in future work. First, CGI quality evaluation should be proposed with reliable reference data followed by data cleaning and filtering. Second, combining POIs with other sources of CGI, such as Wikipedia, may help classify CGI effectively in low densities that were considered noise data, especially on non-artificial surfaces with lower classification accuracy. Moreover, with sufficient CGI data sources, more land cover classification types may be identified, such as grassland and water bodies. Third, this study used SVM to perform land cover classification with a classification accuracy of 80.00% and 80.79% in training data and testing data, respectively. Future work will consider other approaches, such as neural networks, to improve land cover classification accuracy.


