
Evaluating Urban Land Carrying Capacity Based on the Ecological Sensitivity Analysis: A Case Study in Hangzhou, China


Abstract
:
1. Introduction
2. Study Area and Data
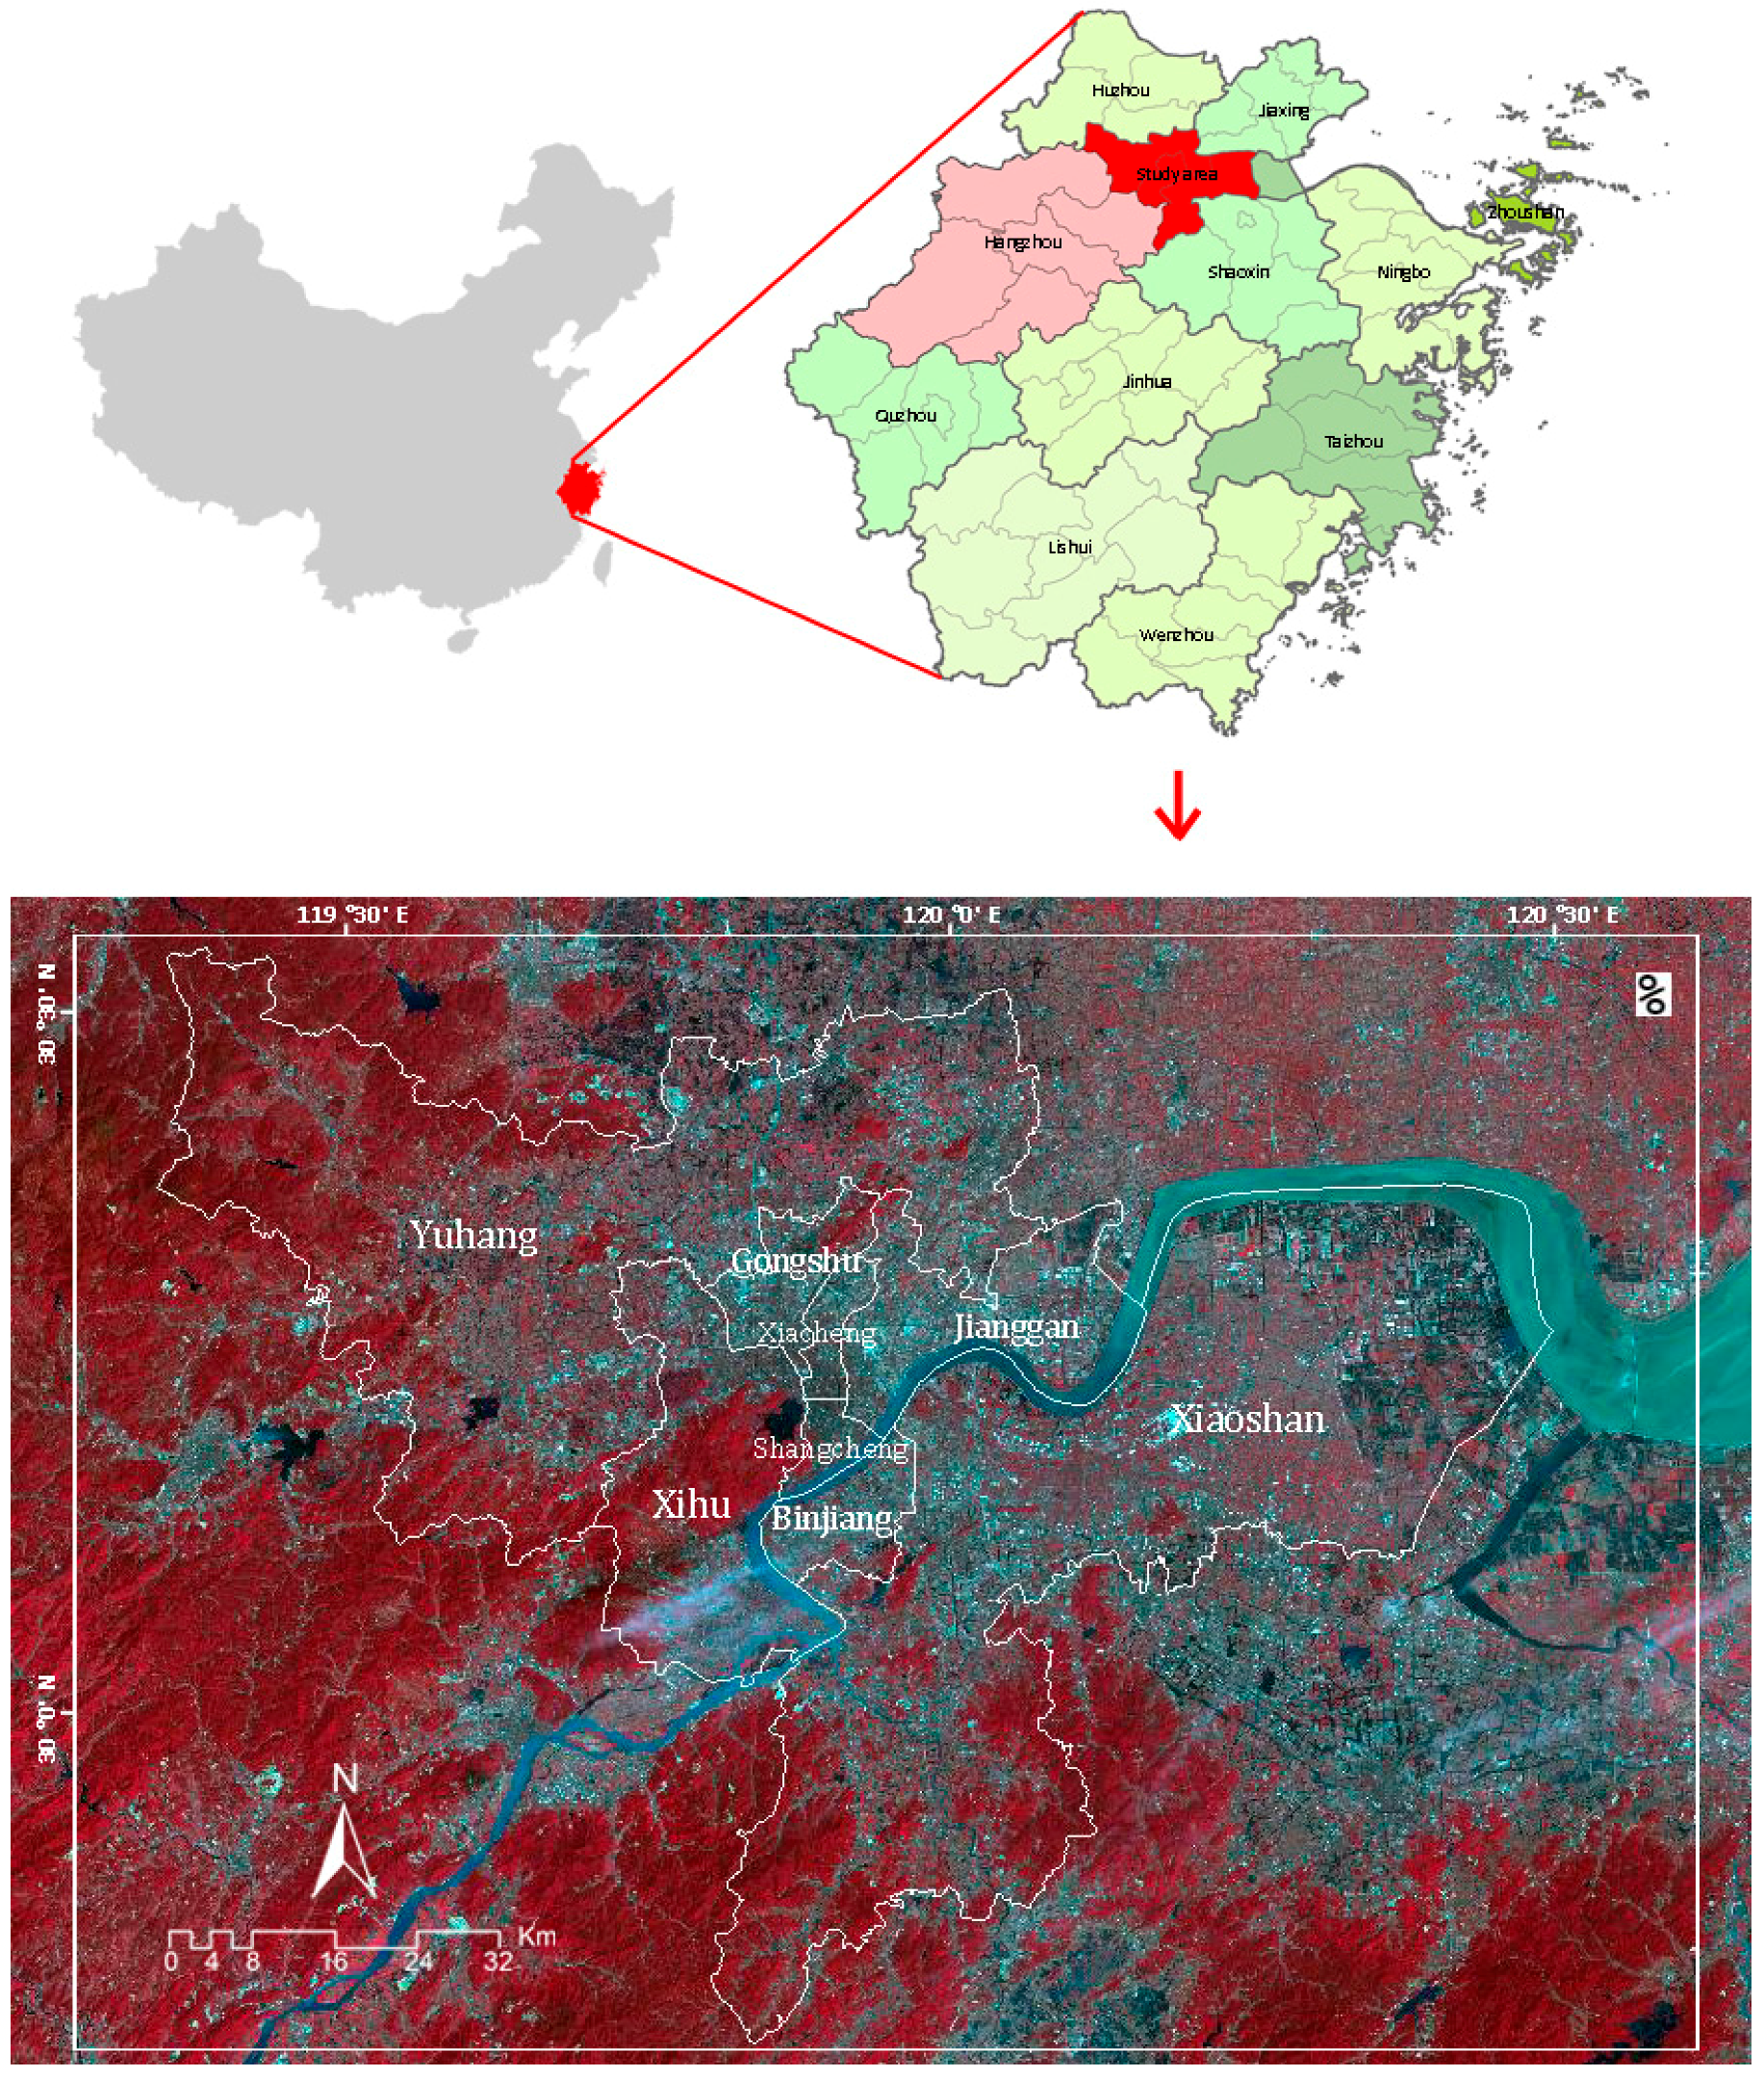
2.1. Study Area
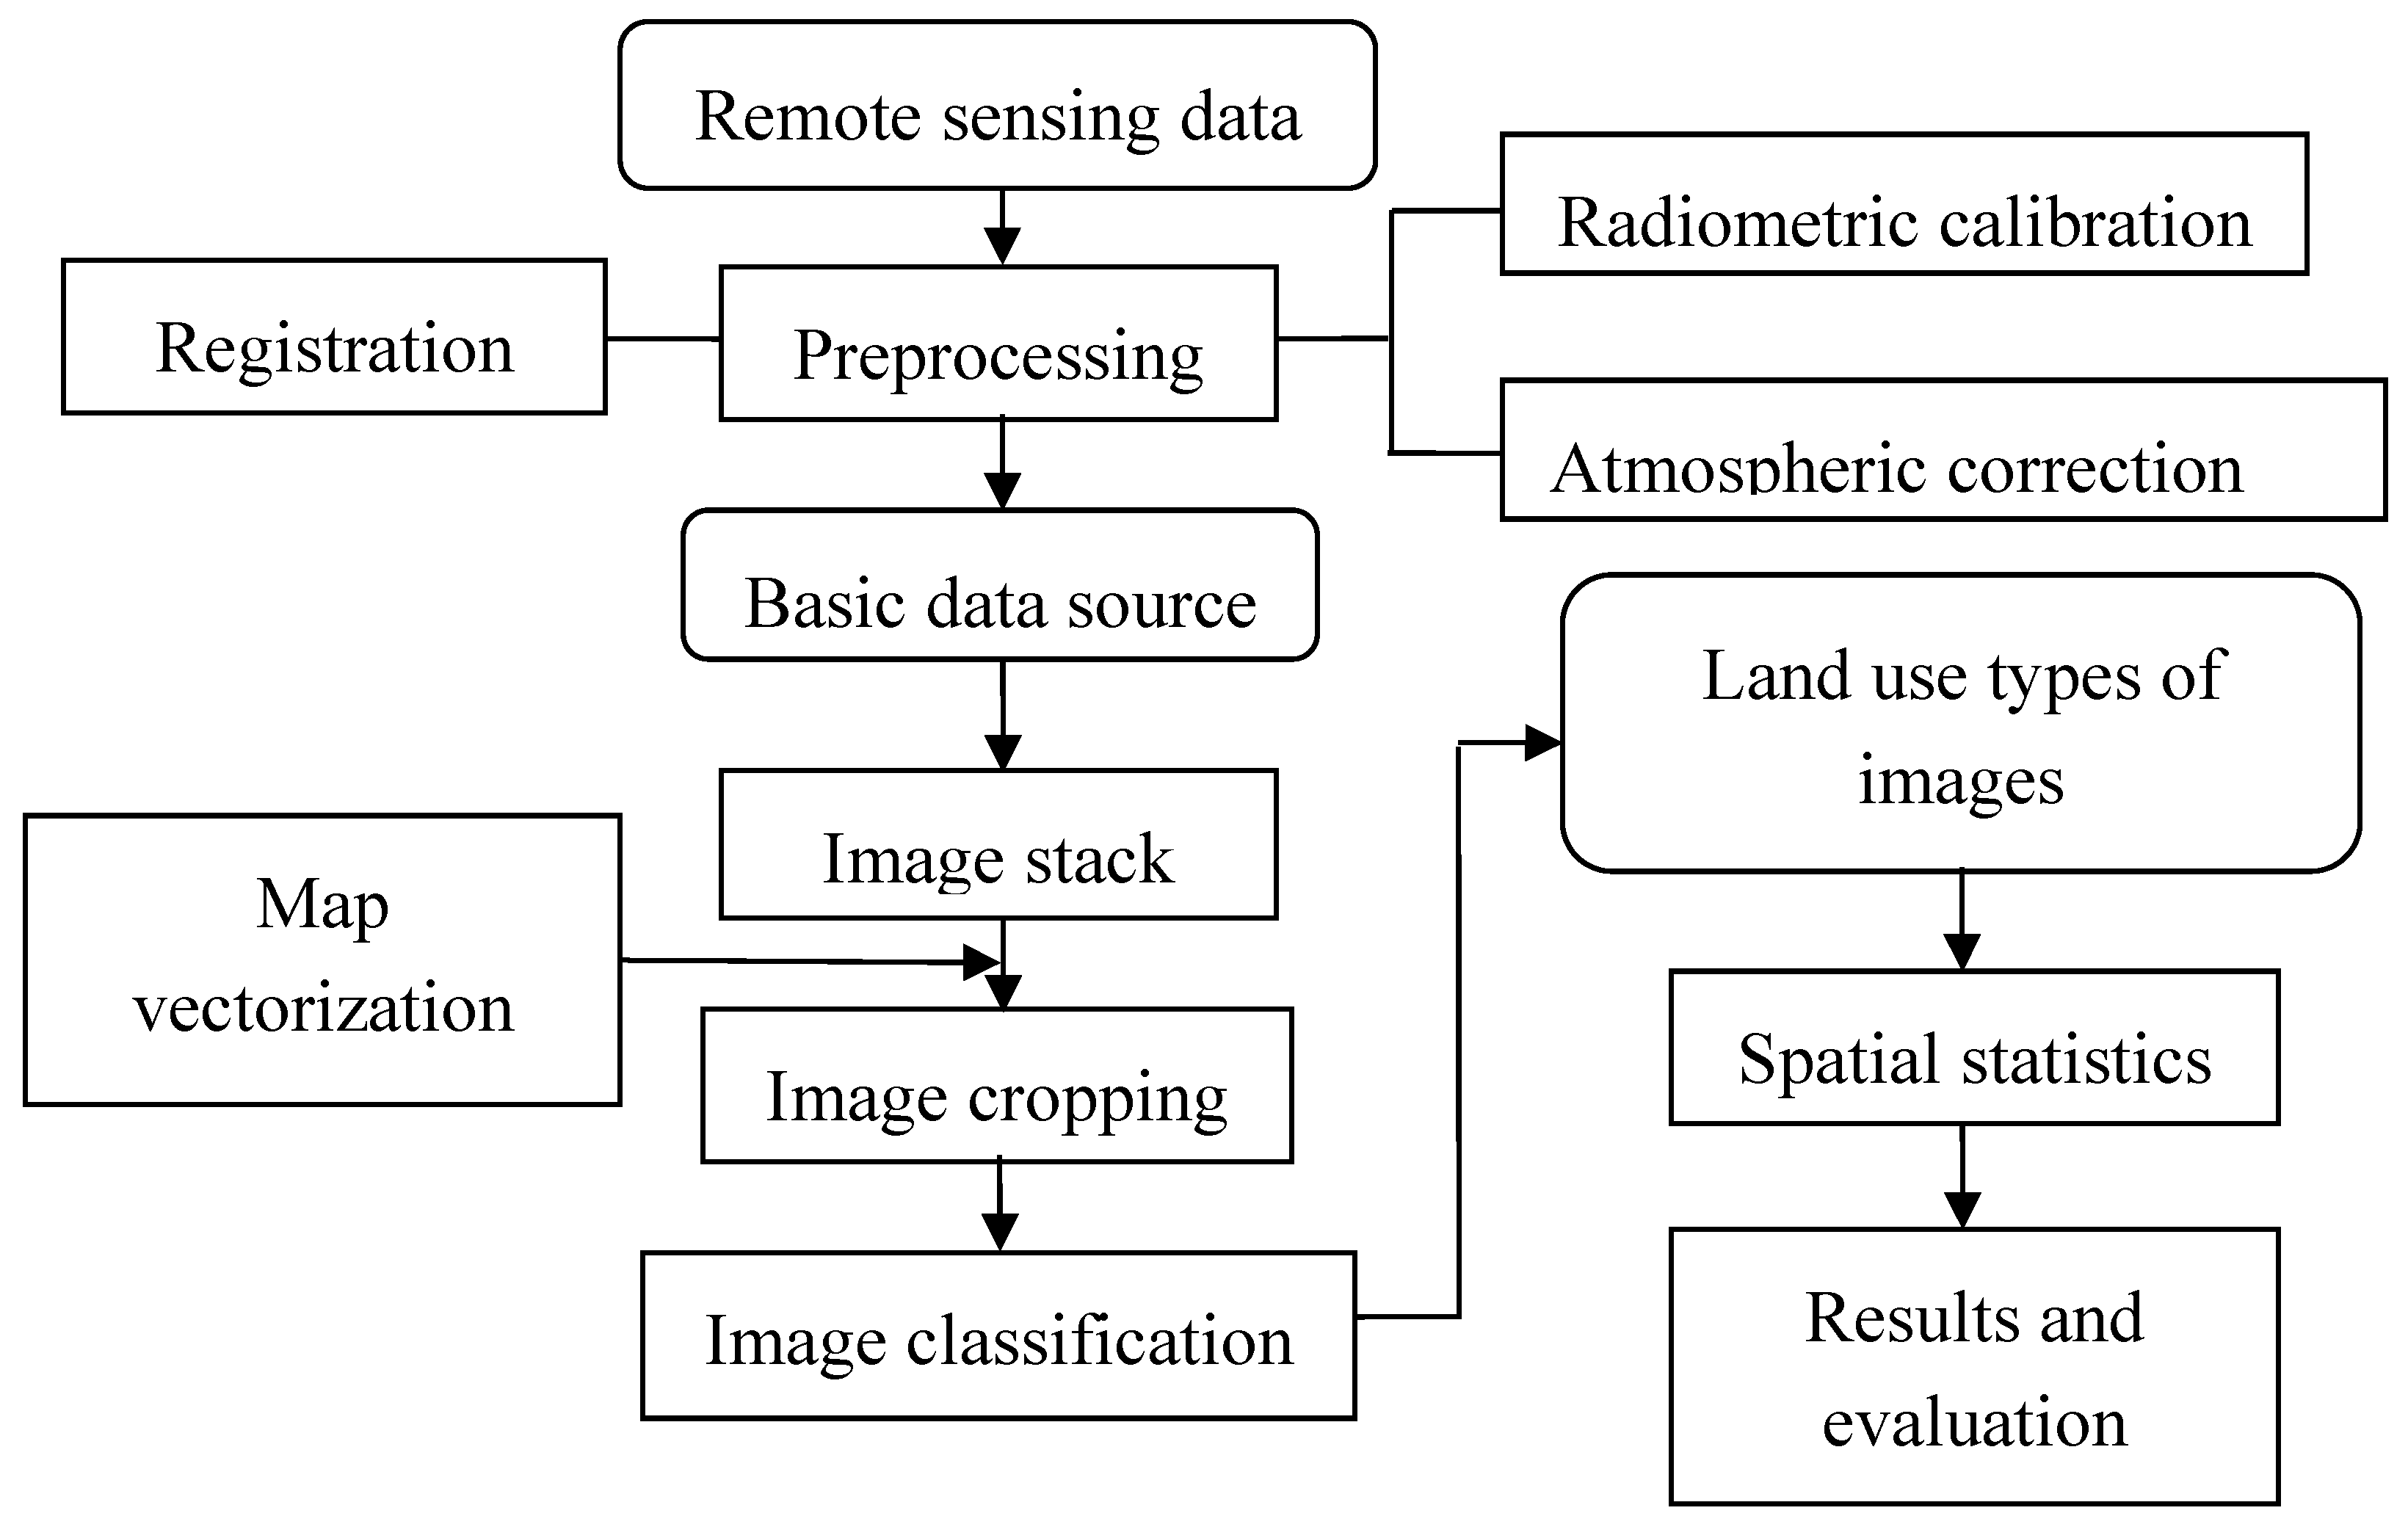
2.2. Data Collection
- (1)
- Map Data: A Hangzhou administrative boundary map (1:25,000) of the eight districts (see Figure 1) collected from the Hangzhou planning bureau website (http://www.hzplanning.gov.cn/) has been used for image geometric correction and other map layers of vectorization and digitization.
- (2)
- Digital Elevation Model (DEM) and Slope (°) Data: The Digital Elevation Model (DEM) image and slope image (with the resolution of 30 m) of the study area were collected from the geospatial data cloud (http://www.gscloud.cn/). The DEM data is used to analyze the topographic conditions in the study [18].
- (3)
- Remote Sensing Data: A cloud free Landsat ETM+ image data acquired on 14 April 2013 was obtained from United States Geological Survey (http://glovis.usgs.gov/) with path number 119 and row number 039.
- (4)
- Statistical Data: the social and economic data, such as the population and the area of the eight districts, were collected from the 2014 statistical yearbook via the web portal of the bureau of statistics (http://www.hangzhou.gov.cn/col/col805741/index.html).
3. Methodology
3.1. Evaluation Index
3.2. Evaluation Methods
3.2.1. Topographic Condition
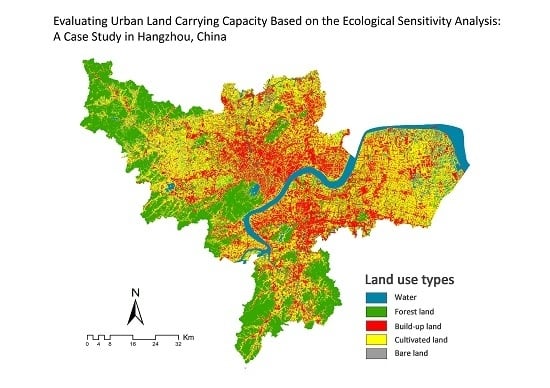
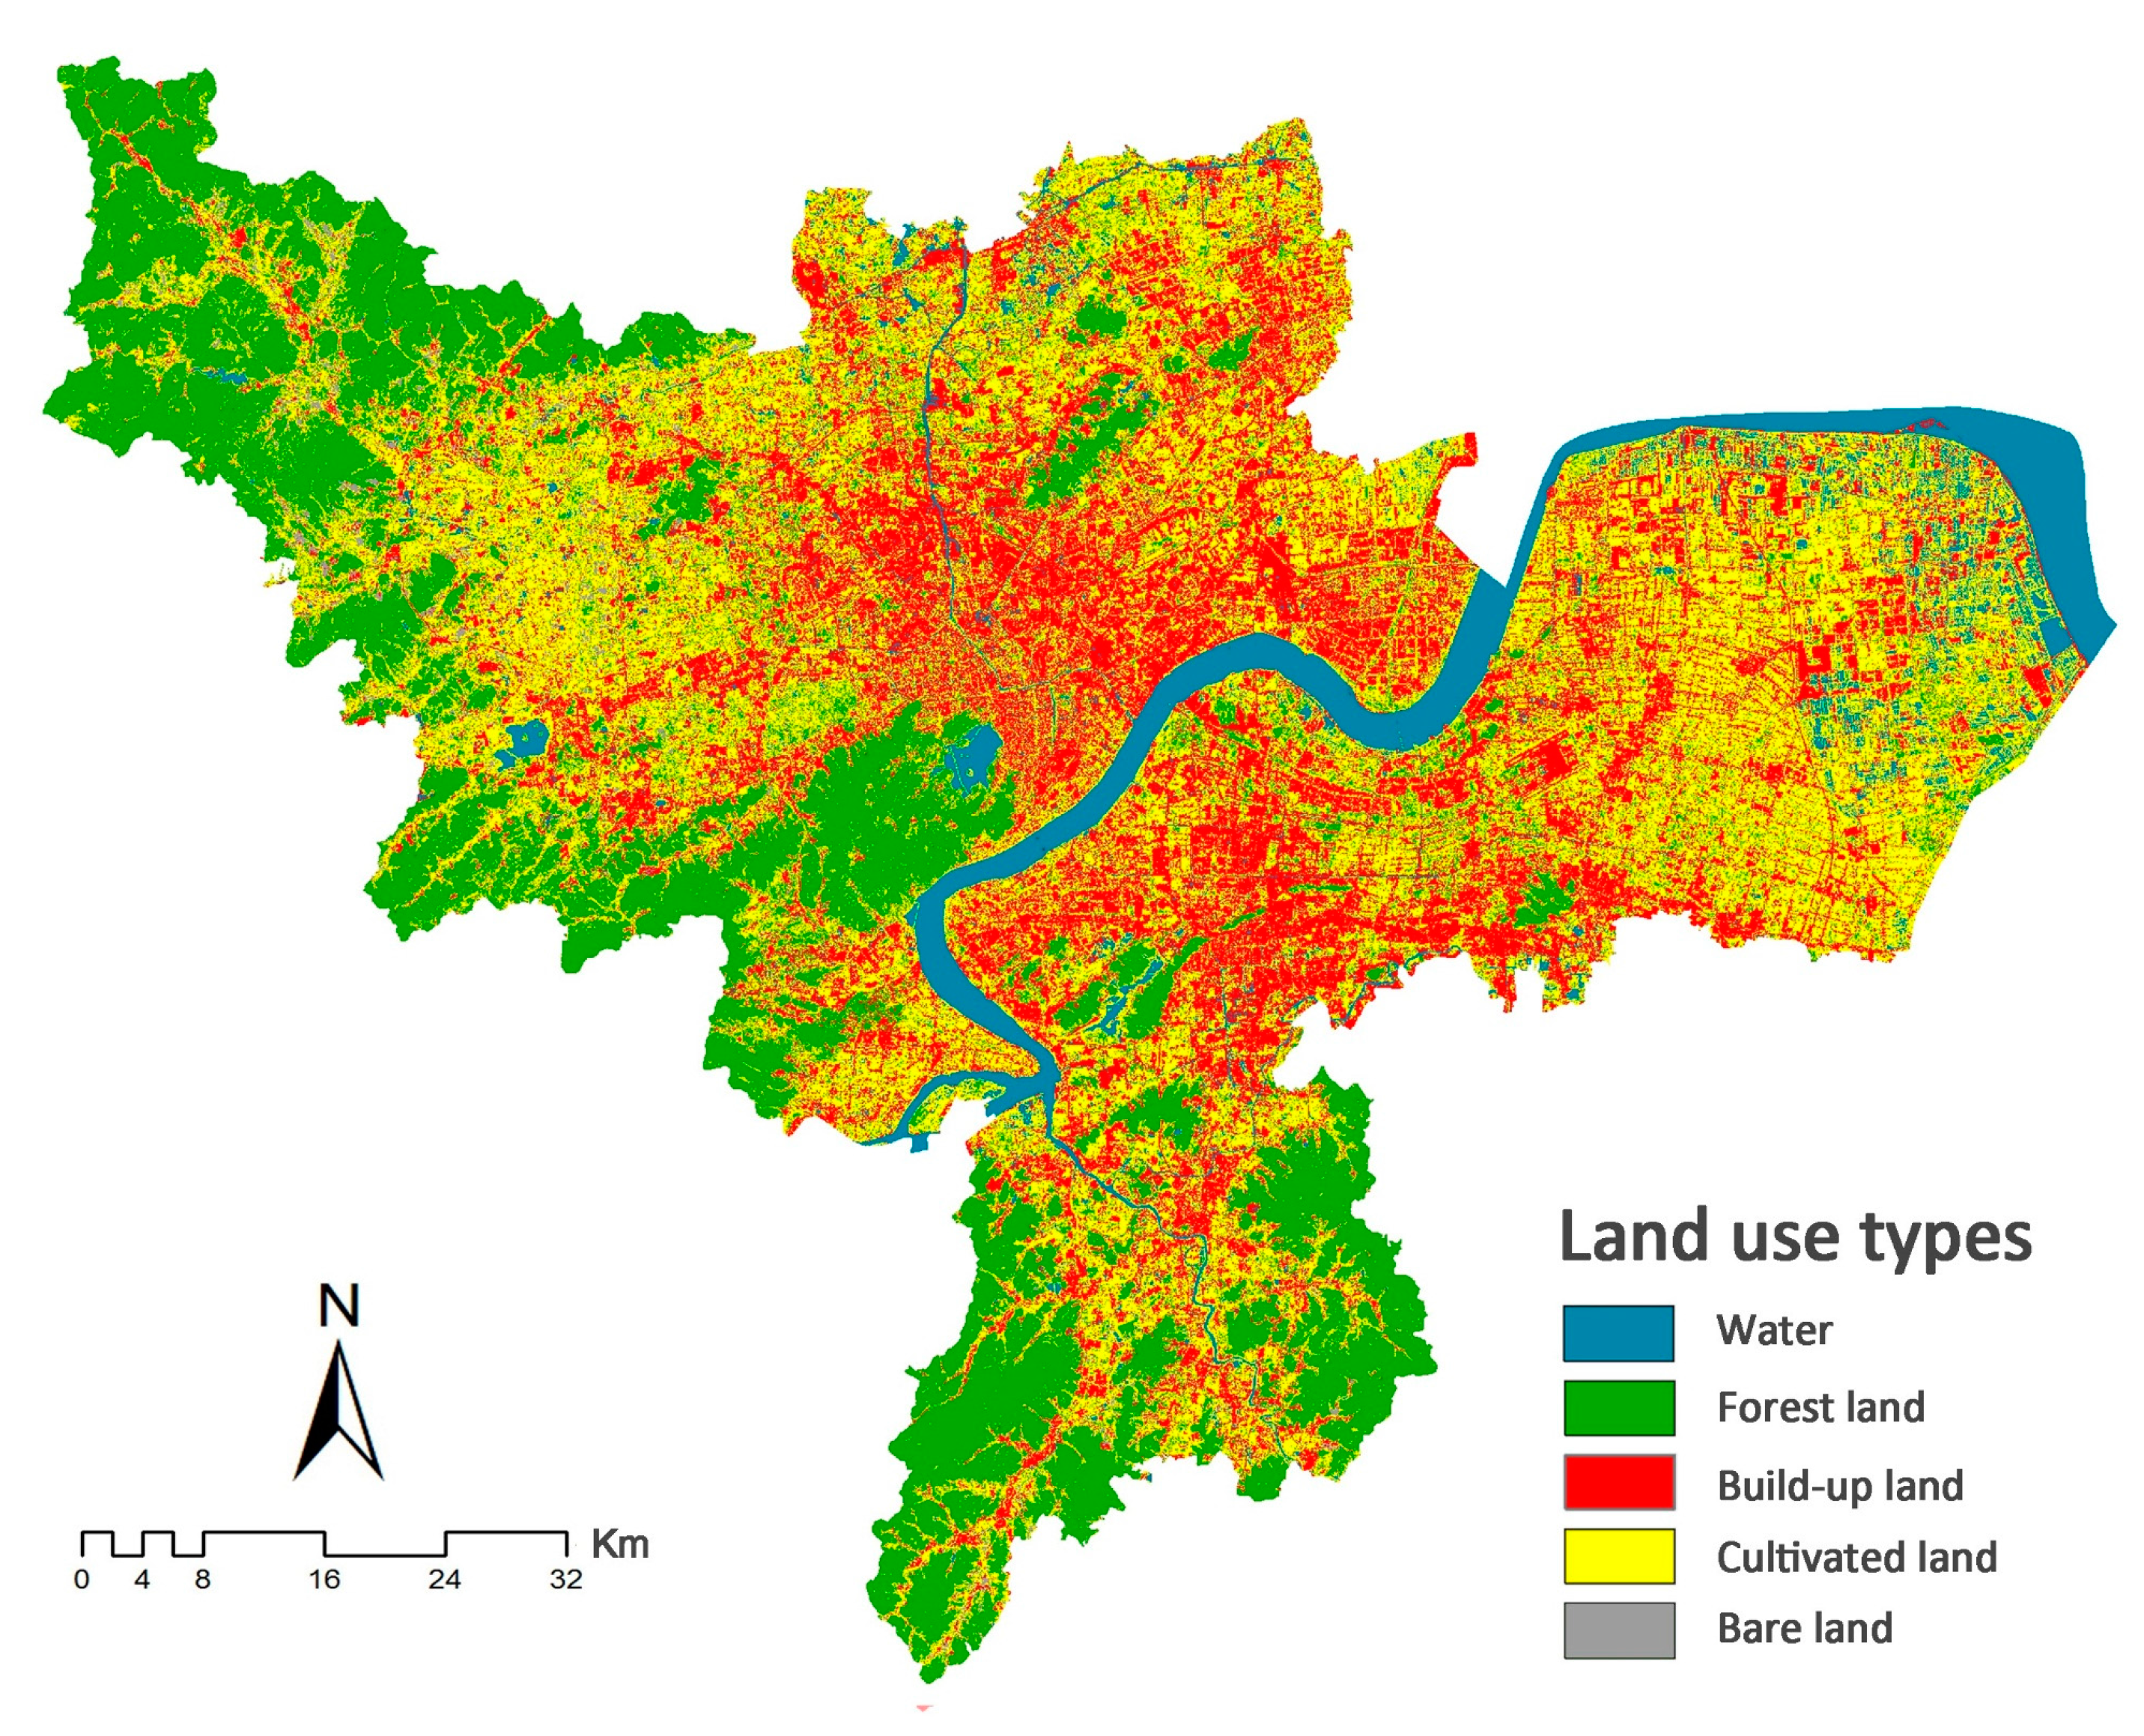
3.2.2. Land Use Types
3.2.3. Regional Development Intensity
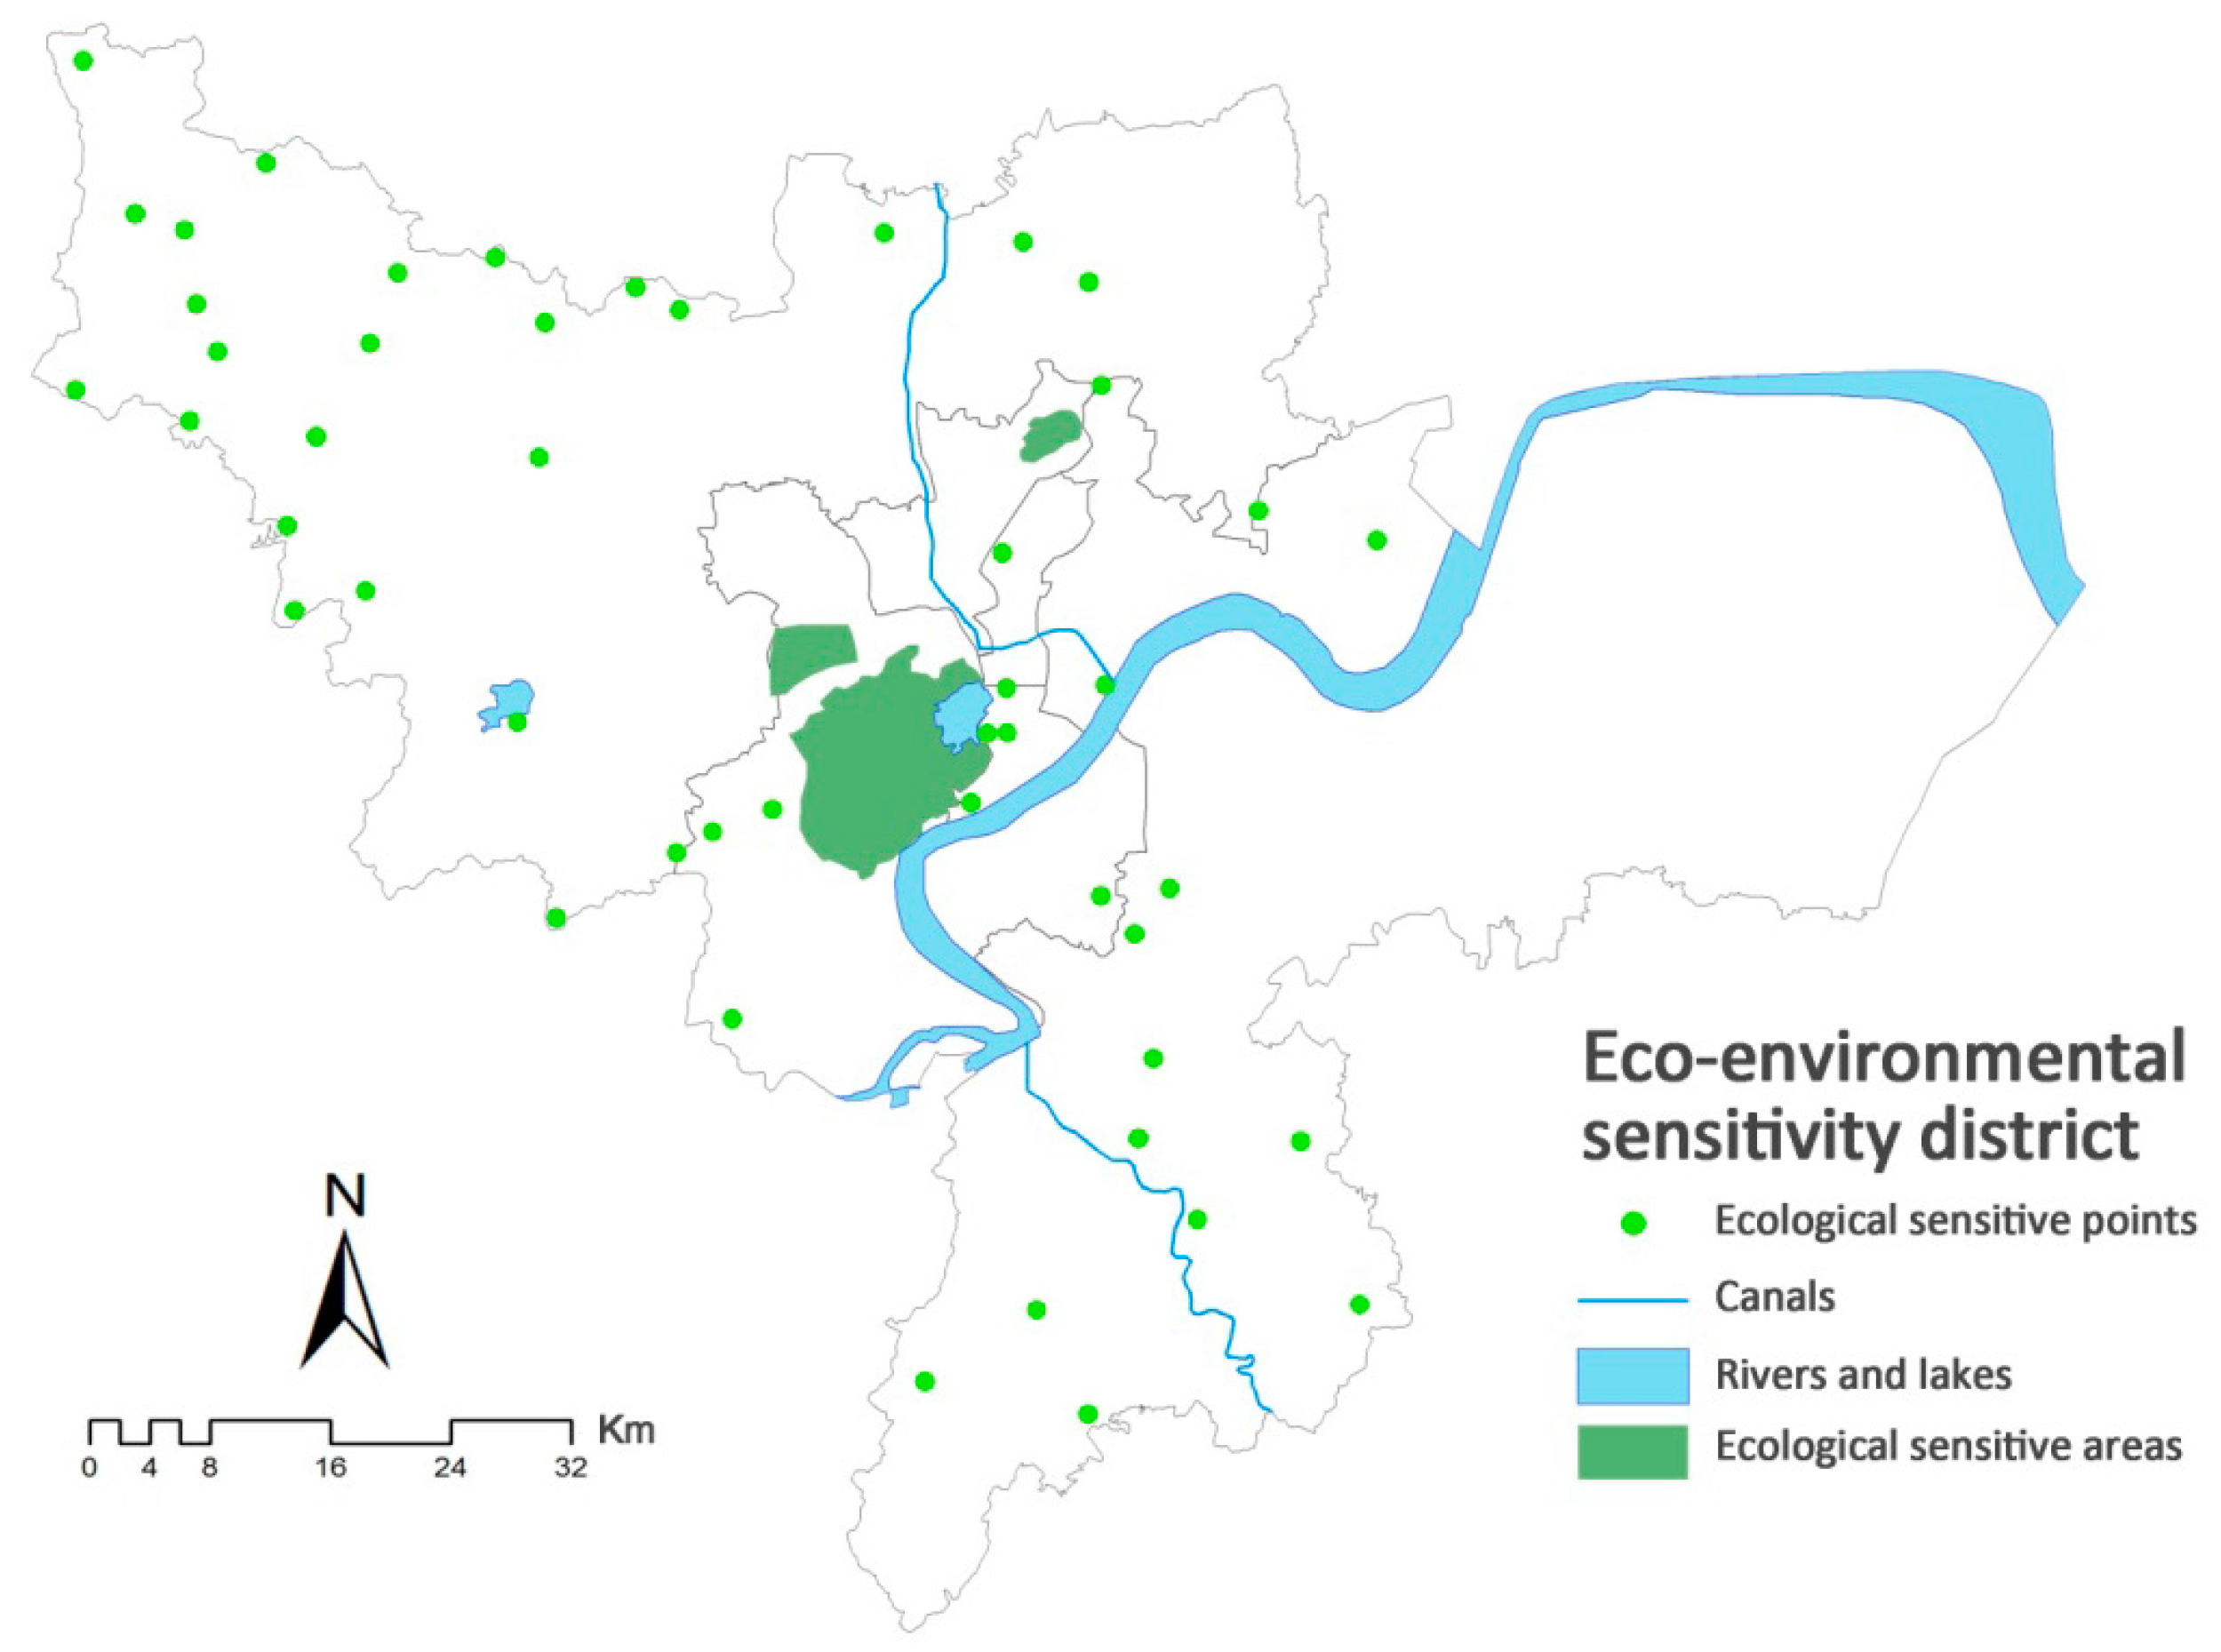
3.2.4. Eco-Environmental Sensitivity
3.2.5. Comprehensive Evaluation Using Ecological Sensitivity Analysis
3.3. ULCC Calculation
4. Results and Discussion
4.1. Evaluation Using Single Factors
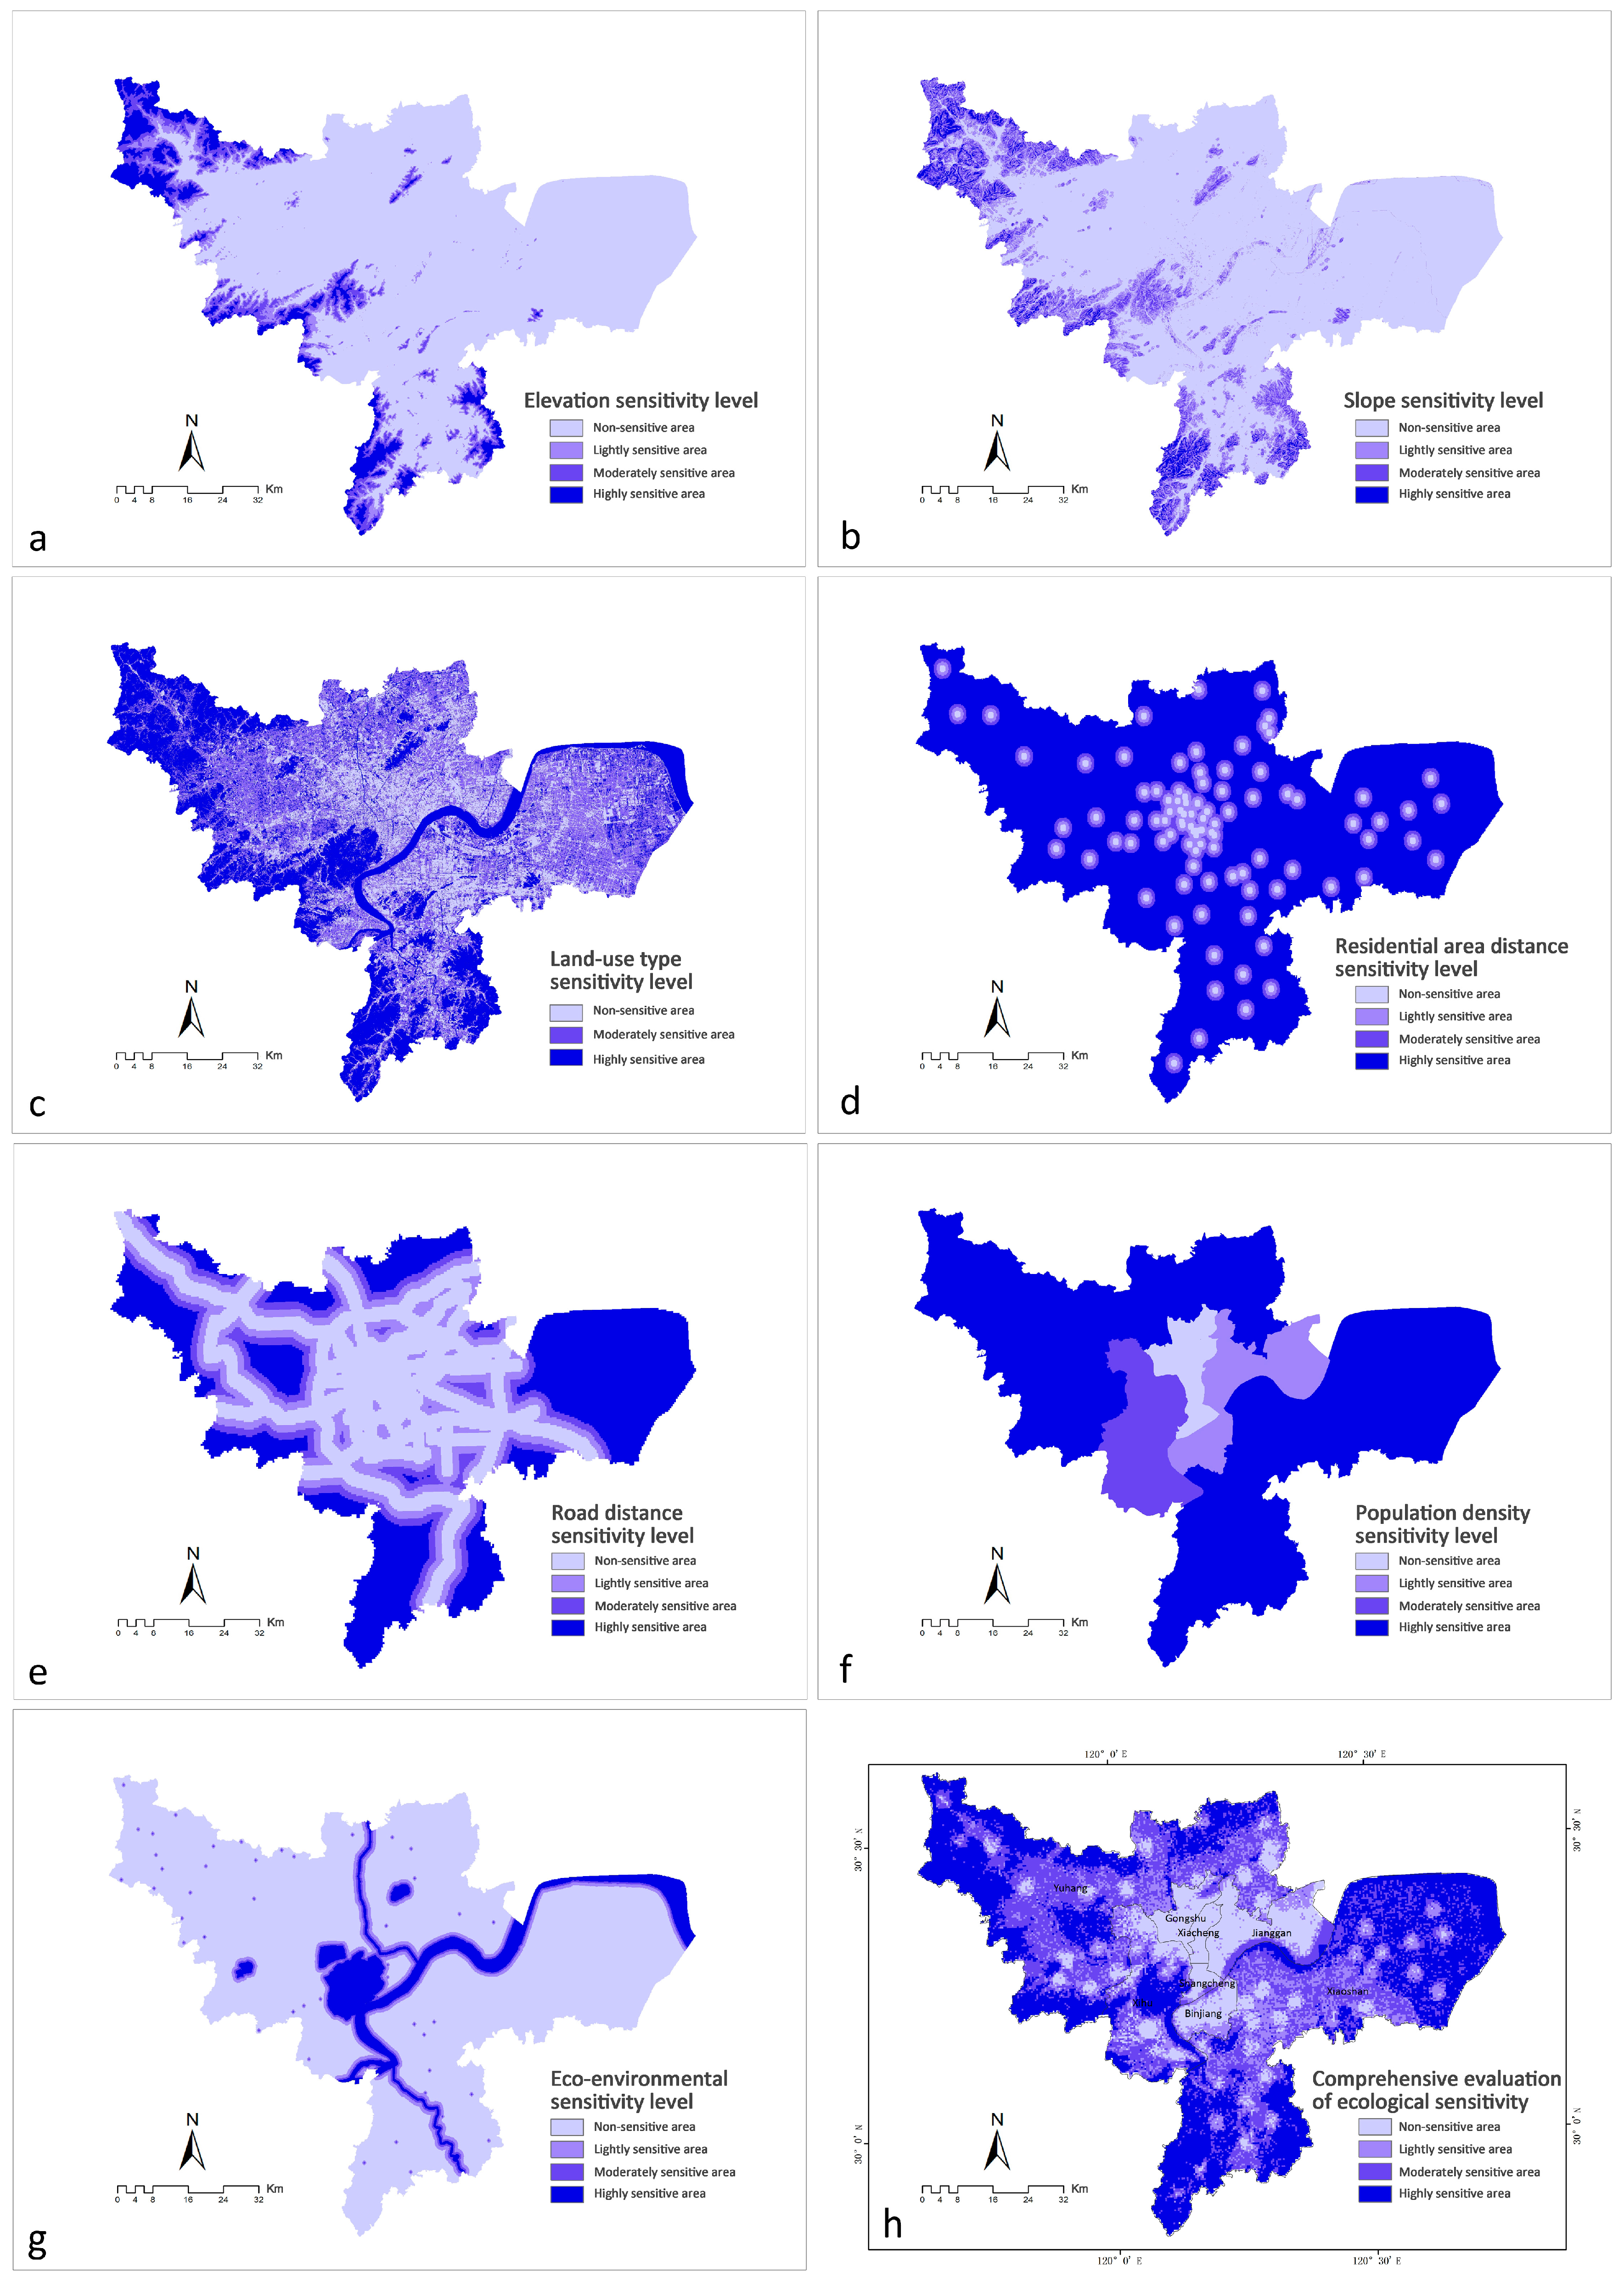
4.1.1. Topographic Analysis
4.1.2. Land Use
- (1)
- The highly sensitive areas are distributed in forest areas, water areas, and their surroundings, which are located at the West Lake Scenic Area, the western part of Tianmu Mountain, the Qiantang River basin, the northern half part of the National Forest Park, and the southern low hills.
- (2)
- The moderately sensitive areas are mainly concentrated in the parts of mountainous areas that were developed as cultivated land and forest area, small towns in the eastern part of Xiaoshan, and the area of the Yuhang district close to the mountain.
- (3)
- The non-sensitive areas are located in the old urban center of Hangzhou, the Xiasha center, the Linping center, and the Binjiang district at the south bank of the Qiantang riverside. Due to the impact of human activities in these regions, most native natural landscapes have been replaced by artificial landscapes. An extremely high level of urbanization with a stabilized ecological environment has resulted in a low degree of the ecological sensitivity.
4.1.3. Regional Development Intensity
4.1.4. Eco-Environmental Sensitivity
4.2. Comprehensive Evaluation of Ecological Sensitivity
4.3. Urban Land Carrying Capacity Analysis
4.4. Discussion
5. Conclusions
Acknowledgments
Author Contributions
Conflicts of Interest
References
- Yue, W.Z.; Yao, H.N.; Zheng, J.E. Research on land population supporting capacity based on ecological sensitivity—Taking Hang zhou city as an example. Nat. Res. Econ. China 2013, 15, 52–56. [Google Scholar]
- Liu, X.L.; Fang, C.L. Research przogress and prospects of urban agglomeration resource environmental bearing capacity. Prog. Geogr. 2008, 27, 35–42. [Google Scholar]
- Mei, W.J.; Zhou, W.L.; Cai, L.T. Regional land population carrying capacity research—Taking Zhoucheng city as an example. J. Southwest Agric. Univ. 2010, 8, 5–8. [Google Scholar]
- Lu, M.; Kong, Y.F. The ecological sensitivity evaluation research progress. J. Shandong Constr. Univ. 2014, 4, 347–352. [Google Scholar]
- Shi, L.Y.; Chen, B.M. Production Capacity of Land Resources and Population Bearing Capacity Study in China; China Renmin University Press: Beijing, China, 1991. [Google Scholar]
- Feng, Z.M. Land bearing capacity research of past, present and future. China Land Sci. 1994, 8, 1–9. [Google Scholar]
- Sarma, A.K.; Mahanta, C.; Bhattacharya, R.; Dutta, S.; Kartha, S.; Kumar, B.; Sreeja, P. Urban Carrying Capacity: Concept and Calculation; Centre of Excellence: Assam, India, 2012. [Google Scholar]
- Vogt, W. Road to Survival; Sloan, W., Ed.; William Sloane Associates, Inc.: New York, NY, USA, 1984. [Google Scholar]
- Alan, W. The African Husbandman; Oliver and Boyd: Edinburgh, UK, 1965. [Google Scholar]
- Young, C.C. Defining the range: The development of carrying capacity in management practice. J. Hist. Biol. 1998, 31, 61–83. [Google Scholar] [CrossRef]
- Malthus, T.R. Essay on the Principle of Population; Johnson, J., Ed.; St. Paul’s Church-Yard Press: London, UK, 1798. [Google Scholar]
- Meadows, D.H.; Randers, J.; Meadows, D. The Limits to Growth; Universe Books Press: New York, NY, USA, 1972. [Google Scholar]
- Slesser, M.; King, J. Resource accounting: An application to development planning. World Dev. 1988, 16, 293–303. [Google Scholar] [CrossRef]
- Rees, W.E. Ecological footprint. Concept Encycl. Biodivers. 2001, 2, 229–244. [Google Scholar] [CrossRef]
- Gao, Y.J. Based on urban land bearing capacity of ecological sensitivity evaluation. Plan. Study 2013, 37, 39–42. [Google Scholar]
- Qian, Y.; Tang, L.; Qiu, Q.; Xu, T.; Liao, J. A comparative analysis on assessment of land carrying capacity with ecological footprint analysis and index system method. PLoS ONE 2015, 10, e0130315. [Google Scholar] [CrossRef] [PubMed]
- Liu, Y.; Yue, W.; Fan, P. Spatial determinants of urban land conversion in large Chinese cities: A case of Hangzhou. Environ. Plan. B 2011, 38, 706–725. [Google Scholar] [CrossRef]
- Kim, H.; Willers, J.L.; Kim, S. Digital elevation modeling via curvature interpolation for LiDAR data. Electron. J. Differ. Equ. 2016, 23, 47–57. [Google Scholar]
- Fu, S.F.; Zhang, P.; Jiang, J.L. Based on the development zone planning eia evaluation of bearing capacity of land resources. Chin. J. Appl. Ecol. 2012, 4, 459–467. [Google Scholar]
- Xia, C.Y.; Yan, J.M. Indicator system of implementation evaluation for land use planning. China Land Sci. 2006, 20, 19–23. [Google Scholar]
- Guo, Z.W. Comprehensive Evaluation on Land Resources Carrying Capacity for Beijing City. Urban Stud. 2008, 15, 24–30. [Google Scholar]
- State Administration for Quality Supervision and Inspection and Quarantine Standardization Administration of China. Land Use Status Classification (GBT 21010-2007); China Standards Press: Beijing, China, 2007.
- Donnay, J.P.; Barnsley, M.J.; Longley, P.A. (Eds.) Remote Sensing and Urban Analysis; Taylor & Francis: London, UK, 2001. [Google Scholar]
- Li, D.; Xu, S.; Han, D.B. The land use status quo analysis based on GIS and RS. J. Heilongjiang Inst. Eng. 2012, 28, 23–33. [Google Scholar]
- O’Sullivan, D.; Unwin, D.J. Geographic Information Analysis and Spatial Data, 2nd ed.; John Wiley: Hoboken, NJ, USA, 2010. [Google Scholar]
- Gao, X.Y.; Ge, Y.S. Study on Carrying Capacity of Land Resources Based on Ecological Sensitivity—A Case Study of Quanzhou City, Fujian Province. Guangdong Agric. Sci. 2007, 8, 123–126. [Google Scholar]
- Li, Y.P.; Yang, H. Social dynamic population bearing capacity prediction—Taking Lancangjiang region in Yunnan province as an example. Chin. J. Popul. Sci. 2002, 7, 43–50. [Google Scholar]
- Cai, L.; Mu, G.Z. The index construction research of different population bearing capacity standard. J. Humanit. 2008, 1, 179–185. [Google Scholar]
- Zhang, Y.J.; Zhang, Z.F.; Qi, X.Y. Several problems about population bearing capacity. Ecol. Econ. 2008, 4, 388–390. [Google Scholar]
- Qiang, Z.; Qi, Y.B.; Bai, X.M. Big city cultivated land resources population carrying capacity study—Taking Beijing city as an example. Res. Dev. Mark. 2007, 5, 147–148. [Google Scholar]
- Liu, Q.P.; Lin, Z.S.; Feng, N.H. Population bearing capacity of land resources dynamics simulation and application. J. Nanjing Norm. Univ. 2005, 8, 114–118. [Google Scholar]
- Cottee, J.; Lopez-Aviles, A.; Behzadian, K.; Bradley, D.; Butler, D.; Downing, C.; Farmani, R.; Ingram, J.; Leach, M.; Pike, A.; et al. The local nexus network: Exploring the future of localised food systems and associated energy and water supply. In Sustainable Design and Manufacturing 2016 (Smart Innovation Systems and Technologies Special Volume); Setchi, R., Howlett, R.J., Liu, Y., Theobald, P., Eds.; Springer International Publishing AG: Cham, Switzerland, 2016; pp. 613–624. [Google Scholar]
- Le-bail, A.; Dessev, T.; Jury, V.; Zuniga, R.; Park, T.; Pitroff, M. Energy demand for selected bread making processes: conventional versus part baked frozen technologies. J. Food Eng. 2010, 96, 510–519. [Google Scholar] [CrossRef]


| Climate Data for Hangzhou (1981–2010 Normals, Extremes 1951–Present) | ||||
|---|---|---|---|---|
| Category | Daily Mean (°C) | Average Precipitation (mm) | Average Relative Humidity (%) | Mean Monthly Sunshine (h) |
| Data | 16.95 | 1438.0 | 75.8 | 1709.4 |
| Primary Evaluation Factors | The Secondary Evaluation Factors | Ecological Sensitivity Level | Attribute Hierarchical | Scale Interval | Score |
|---|---|---|---|---|---|
| Topographic condition | Elevation (m) | Highly sensitive | ≥200 | 0.75–1 | 4 |
| Moderately sensitive | 100–200 | 0.5–0.75 | 3 | ||
| Lightly sensitive | 50–100 | 0.25–0.5 | 2 | ||
| Non-sensitive | <50 | 0–0.25 | 1 | ||
| Slope (°) | Highly sensitive | ≥25 | 0.75–1 | 4 | |
| Moderately sensitive | 15–25 | 0.5–0.75 | 3 | ||
| Lightly sensitive | 5–15 | 0.25–0.5 | 2 | ||
| Non-sensitive | <5 | 0–0.25 | 1 | ||
| Land use type | Land use type | Highly sensitive | Forest land, water area, bare land | 0.67–1 | 3 |
| Moderately sensitive | Cultivated land | 0.33–0.67 | 2 | ||
| Non-sensitive | Build-up land | 0–0.33 | 1 | ||
| Regional development intensity | The distance from residential area (km) | Highly sensitive | ≥1.5 | 0.75–1 | 4 |
| Moderately sensitive | 1–1.5 | 0.5–0.75 | 3 | ||
| Lightly sensitive | 0.5–1 | 0.25–0.5 | 2 | ||
| Non-sensitive | <0.5 | 0–0.25 | 1 | ||
| The distance from primary traffic road (km) | Highly sensitive | ≥3 | 0.75–1 | 4 | |
| Moderately sensitive | 2–3 | 0.5–0.75 | 3 | ||
| Lightly sensitive | 1–2 | 0.25–0.5 | 2 | ||
| Non-sensitive | <1 | 0–0.25 | 1 | ||
| Population density (person/km2) | Highly sensitive | <2000 | 0.75–1 | 4 | |
| Moderately sensitive | 2000–4000 | 0.5–0.75 | 3 | ||
| Lightly sensitive | 4000–6000 | 0.25–0.5 | 2 | ||
| Non-sensitive | ≥6000 | 0–0.25 | 1 | ||
| Eco-environmental sensitivity | The distance from eco-environmental sensitive area (km) | Highly sensitive | <0.2 | 0.75–1 | 4 |
| Moderately sensitive | 0.2–0.5 | 0.5–0.75 | 3 | ||
| Lightly sensitive | 0.5–1 | 0.25–0.5 | 2 | ||
| Non-sensitive | ≥1 | 0–0.25 | 1 |
| Weight | |
|---|---|
| Elevation | 0.09 |
| Slope | 0.09 |
| Land use type | 0.14 |
| Residential area | 0.24 |
| Main roads | 0.10 |
| Population density | 0.23 |
| Eco-environment | 0.11 |
| Non-Sensitive Area | Lightly Sensitive Area | Moderately Sensitive Area | Highly Sensitive Area | |
|---|---|---|---|---|
| Each partition proportion | 14.23% | 17.14% | 30.04% | 38.59% |
| Area of each ecological sensitivity (km2) | 436.71 | 525.86 | 921.62 | 1183.82 |
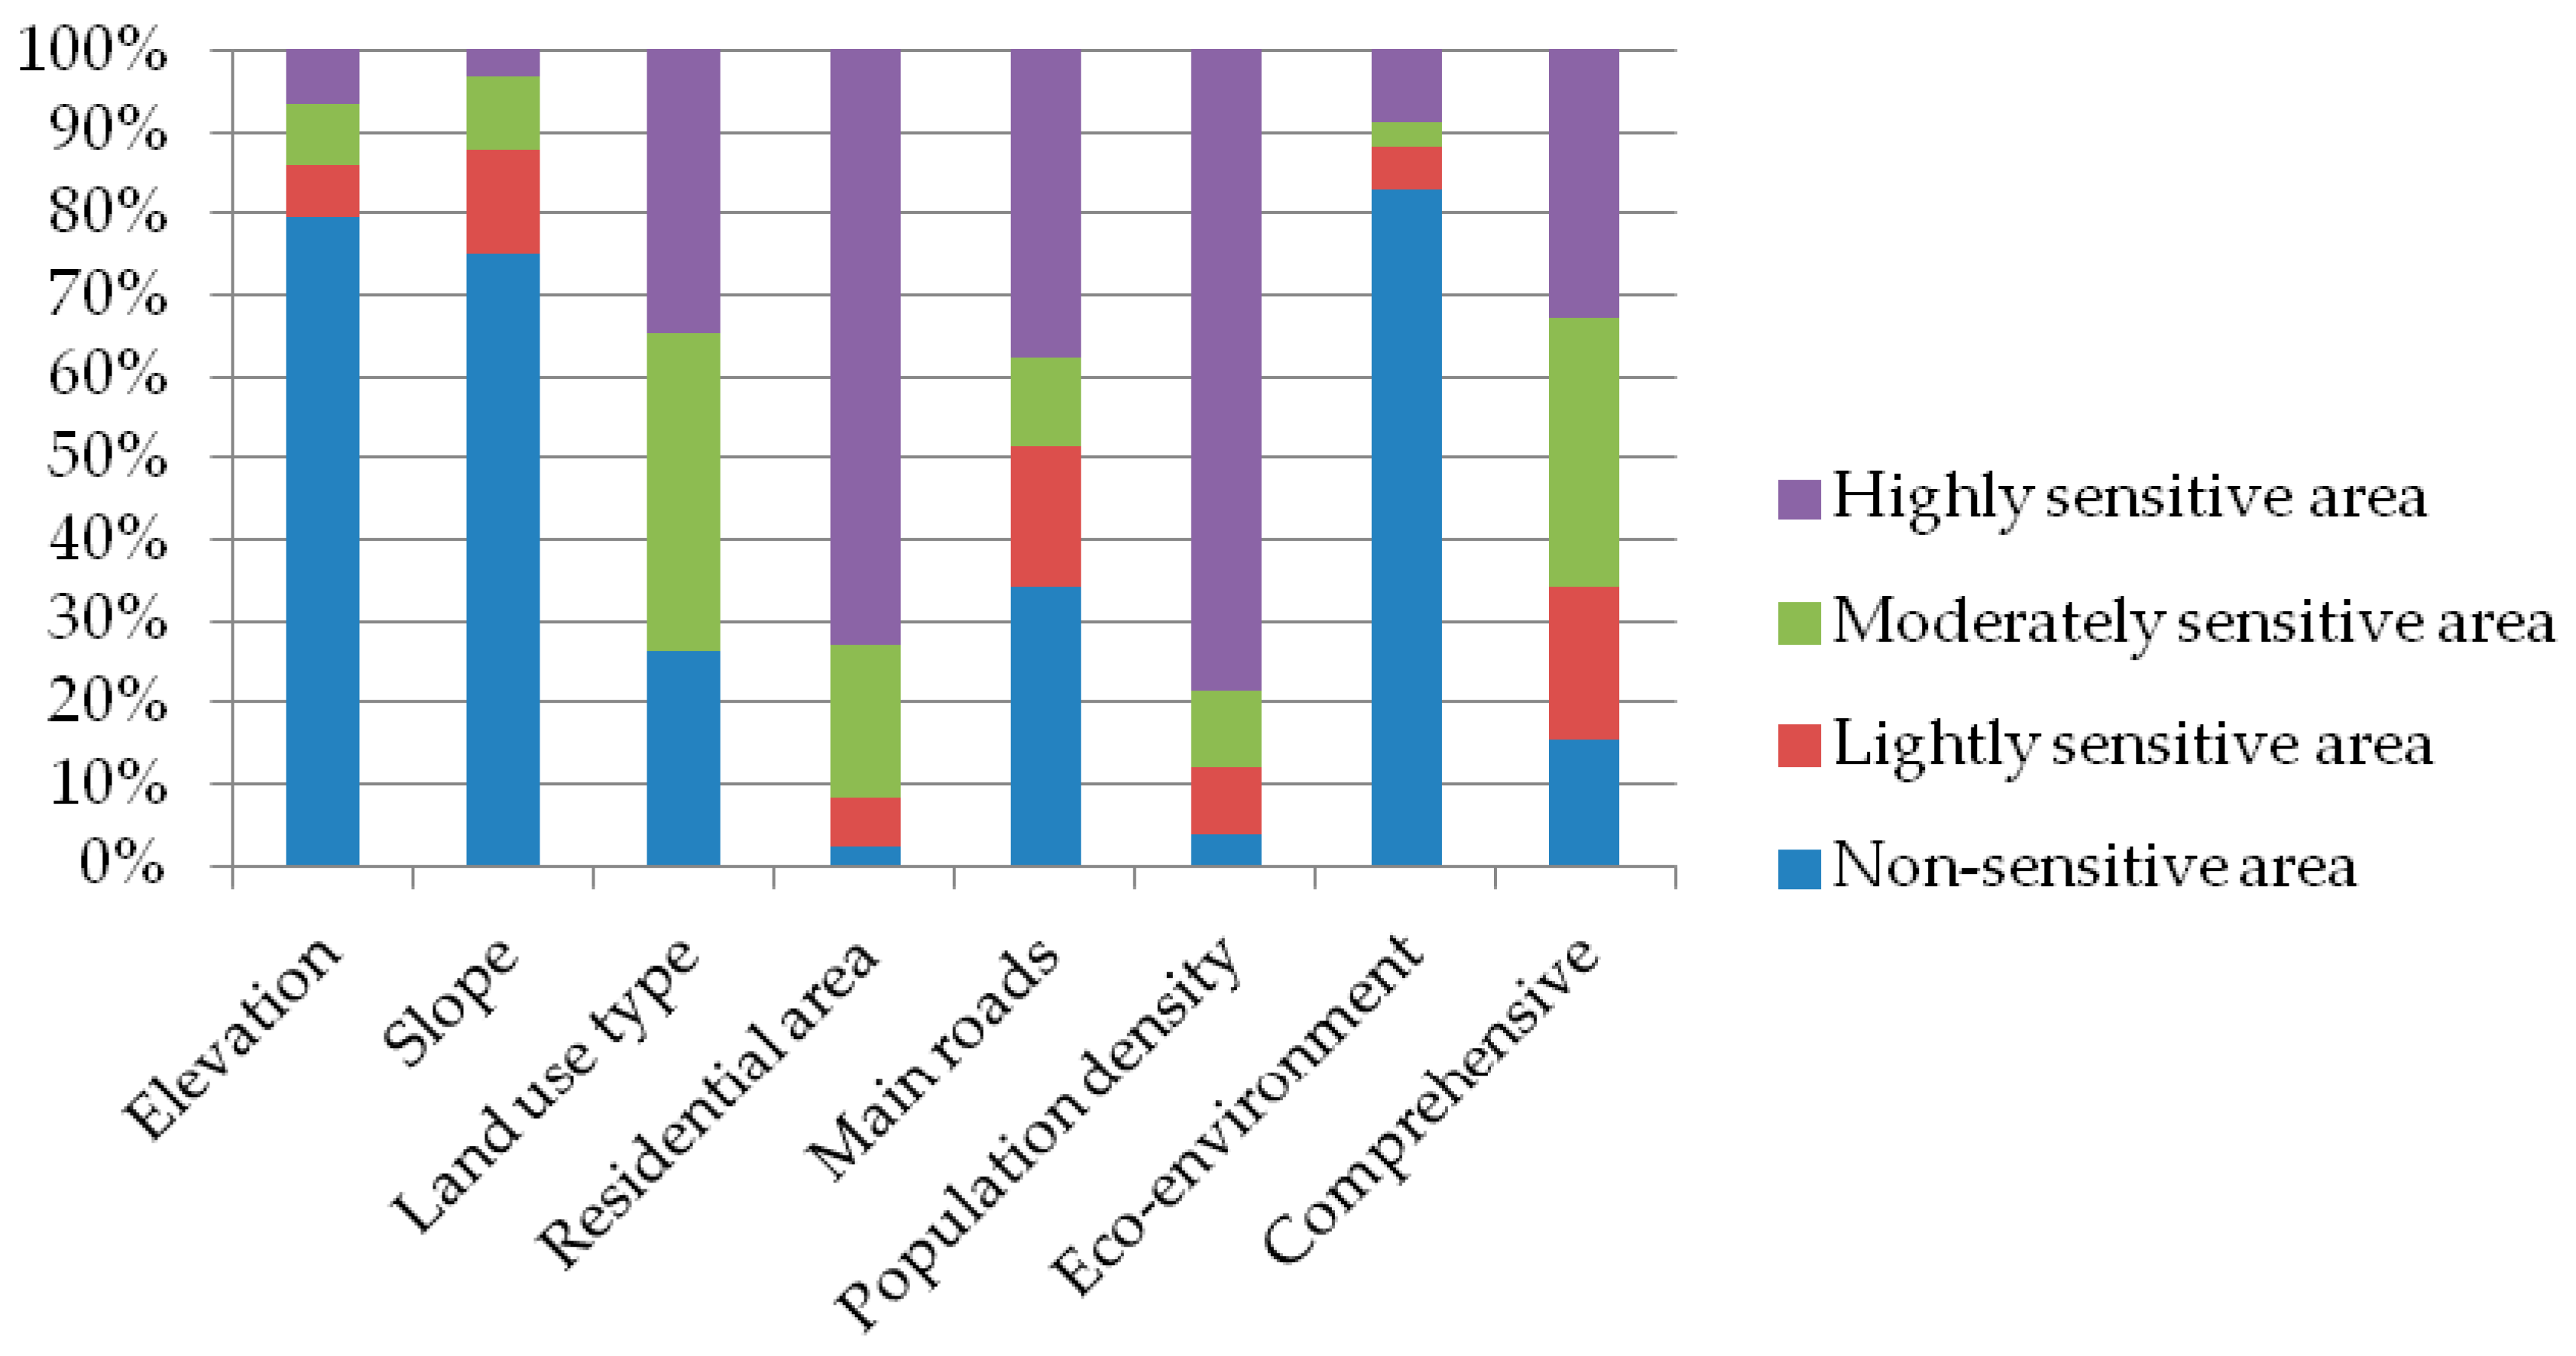
| Non-Sensitive Area | Lightly-Sensitive Area | Moderately-Sensitive Area | Highly-Sensitive Area | |
|---|---|---|---|---|
| Elevation | 79.46% | 6.36% | 7.46% | 6.71% |
| Slope | 74.95% | 12.82% | 9.08% | 3.15% |
| Land use type | 26.28% | / | 38.85% | 34.87% |
| Residential area | 2.20% | 6.23% | 18.49% | 73.08% |
| Main roads | 34.30% | 17.26% | 10.83% | 37.60% |
| Population density | 3.88% | 8.23% | 9.50% | 78.38% |
| Eco-environment | 83.04% | 5.05% | 3.10% | 8.81% |
| Standard Classification | Population Carrying Capacity | Current Population | |
|---|---|---|---|
| International Standard | 140 m2 per capita | 9.51 millon | 4.50 millon |
| America Standard | 160 m2 per capita | 8.32 millon | |
| Muscovitic Standard | 100 m2 per capita | 13.32 millon | |
| 105 m2 per capita | 12.68 millon | ||
| Domestic Standard | 120 m2 per capita | 11.10 millon | |
© 2017 by the authors. Licensee MDPI, Basel, Switzerland. This article is an open access article distributed under the terms and conditions of the Creative Commons Attribution (CC BY) license (http://creativecommons.org/licenses/by/4.0/).
Share and Cite
Tsou, J.; Gao, Y.; Zhang, Y.; Genyun, S.; Ren, J.; Li, Y. Evaluating Urban Land Carrying Capacity Based on the Ecological Sensitivity Analysis: A Case Study in Hangzhou, China. Remote Sens. 2017, 9, 529. https://doi.org/10.3390/rs9060529
Tsou J, Gao Y, Zhang Y, Genyun S, Ren J, Li Y. Evaluating Urban Land Carrying Capacity Based on the Ecological Sensitivity Analysis: A Case Study in Hangzhou, China. Remote Sensing. 2017; 9(6):529. https://doi.org/10.3390/rs9060529
Chicago/Turabian StyleTsou, Jinyeu, Yanfei Gao, Yuanzhi Zhang, Sun Genyun, Jinchang Ren, and Yu Li. 2017. "Evaluating Urban Land Carrying Capacity Based on the Ecological Sensitivity Analysis: A Case Study in Hangzhou, China" Remote Sensing 9, no. 6: 529. https://doi.org/10.3390/rs9060529
APA StyleTsou, J., Gao, Y., Zhang, Y., Genyun, S., Ren, J., & Li, Y. (2017). Evaluating Urban Land Carrying Capacity Based on the Ecological Sensitivity Analysis: A Case Study in Hangzhou, China. Remote Sensing, 9(6), 529. https://doi.org/10.3390/rs9060529