Recent Deceleration of the Ice Elevation Change of Ecology Glacier (King George Island, Antarctica)


 and
and 
Abstract
:
1. Introduction
2. Materials and Methods
2.1. 1979 DEM—Aerial Photographs
2.2. 2001 DEM and Archival Maps
2.3. 2012 Pléiades DEM
2.4. 2016 Terrestrial Laser Scanning DEM
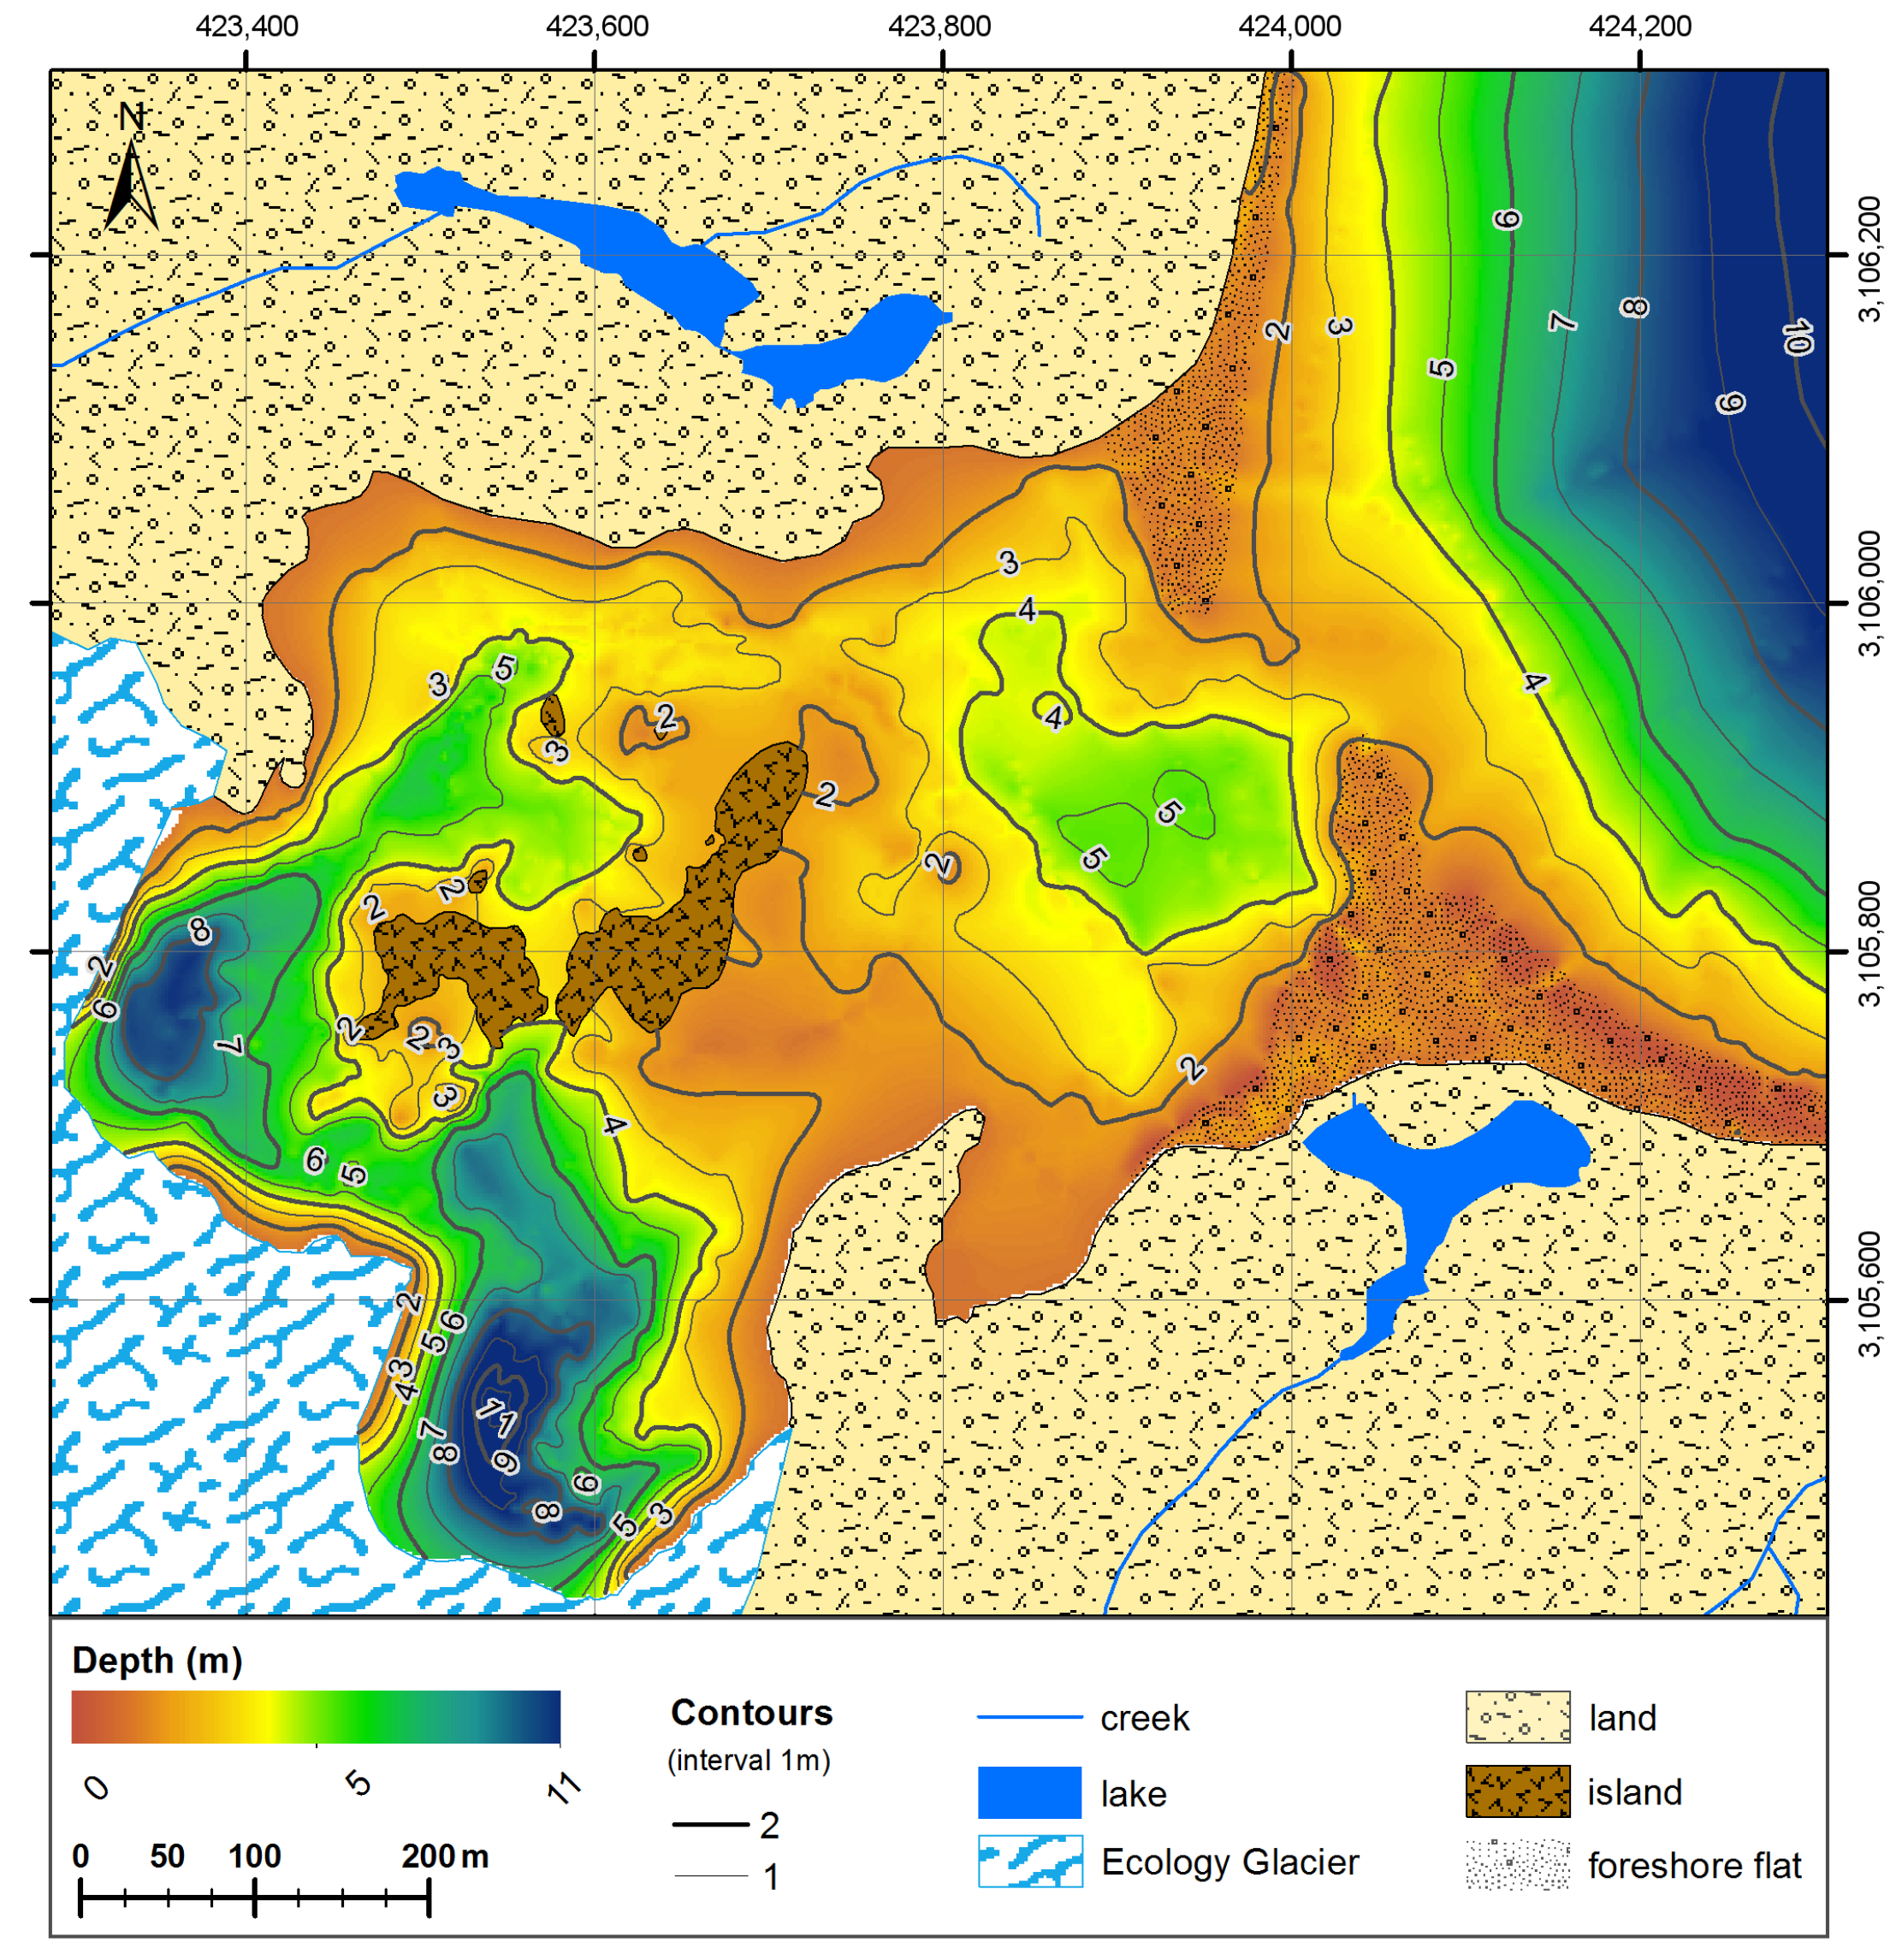
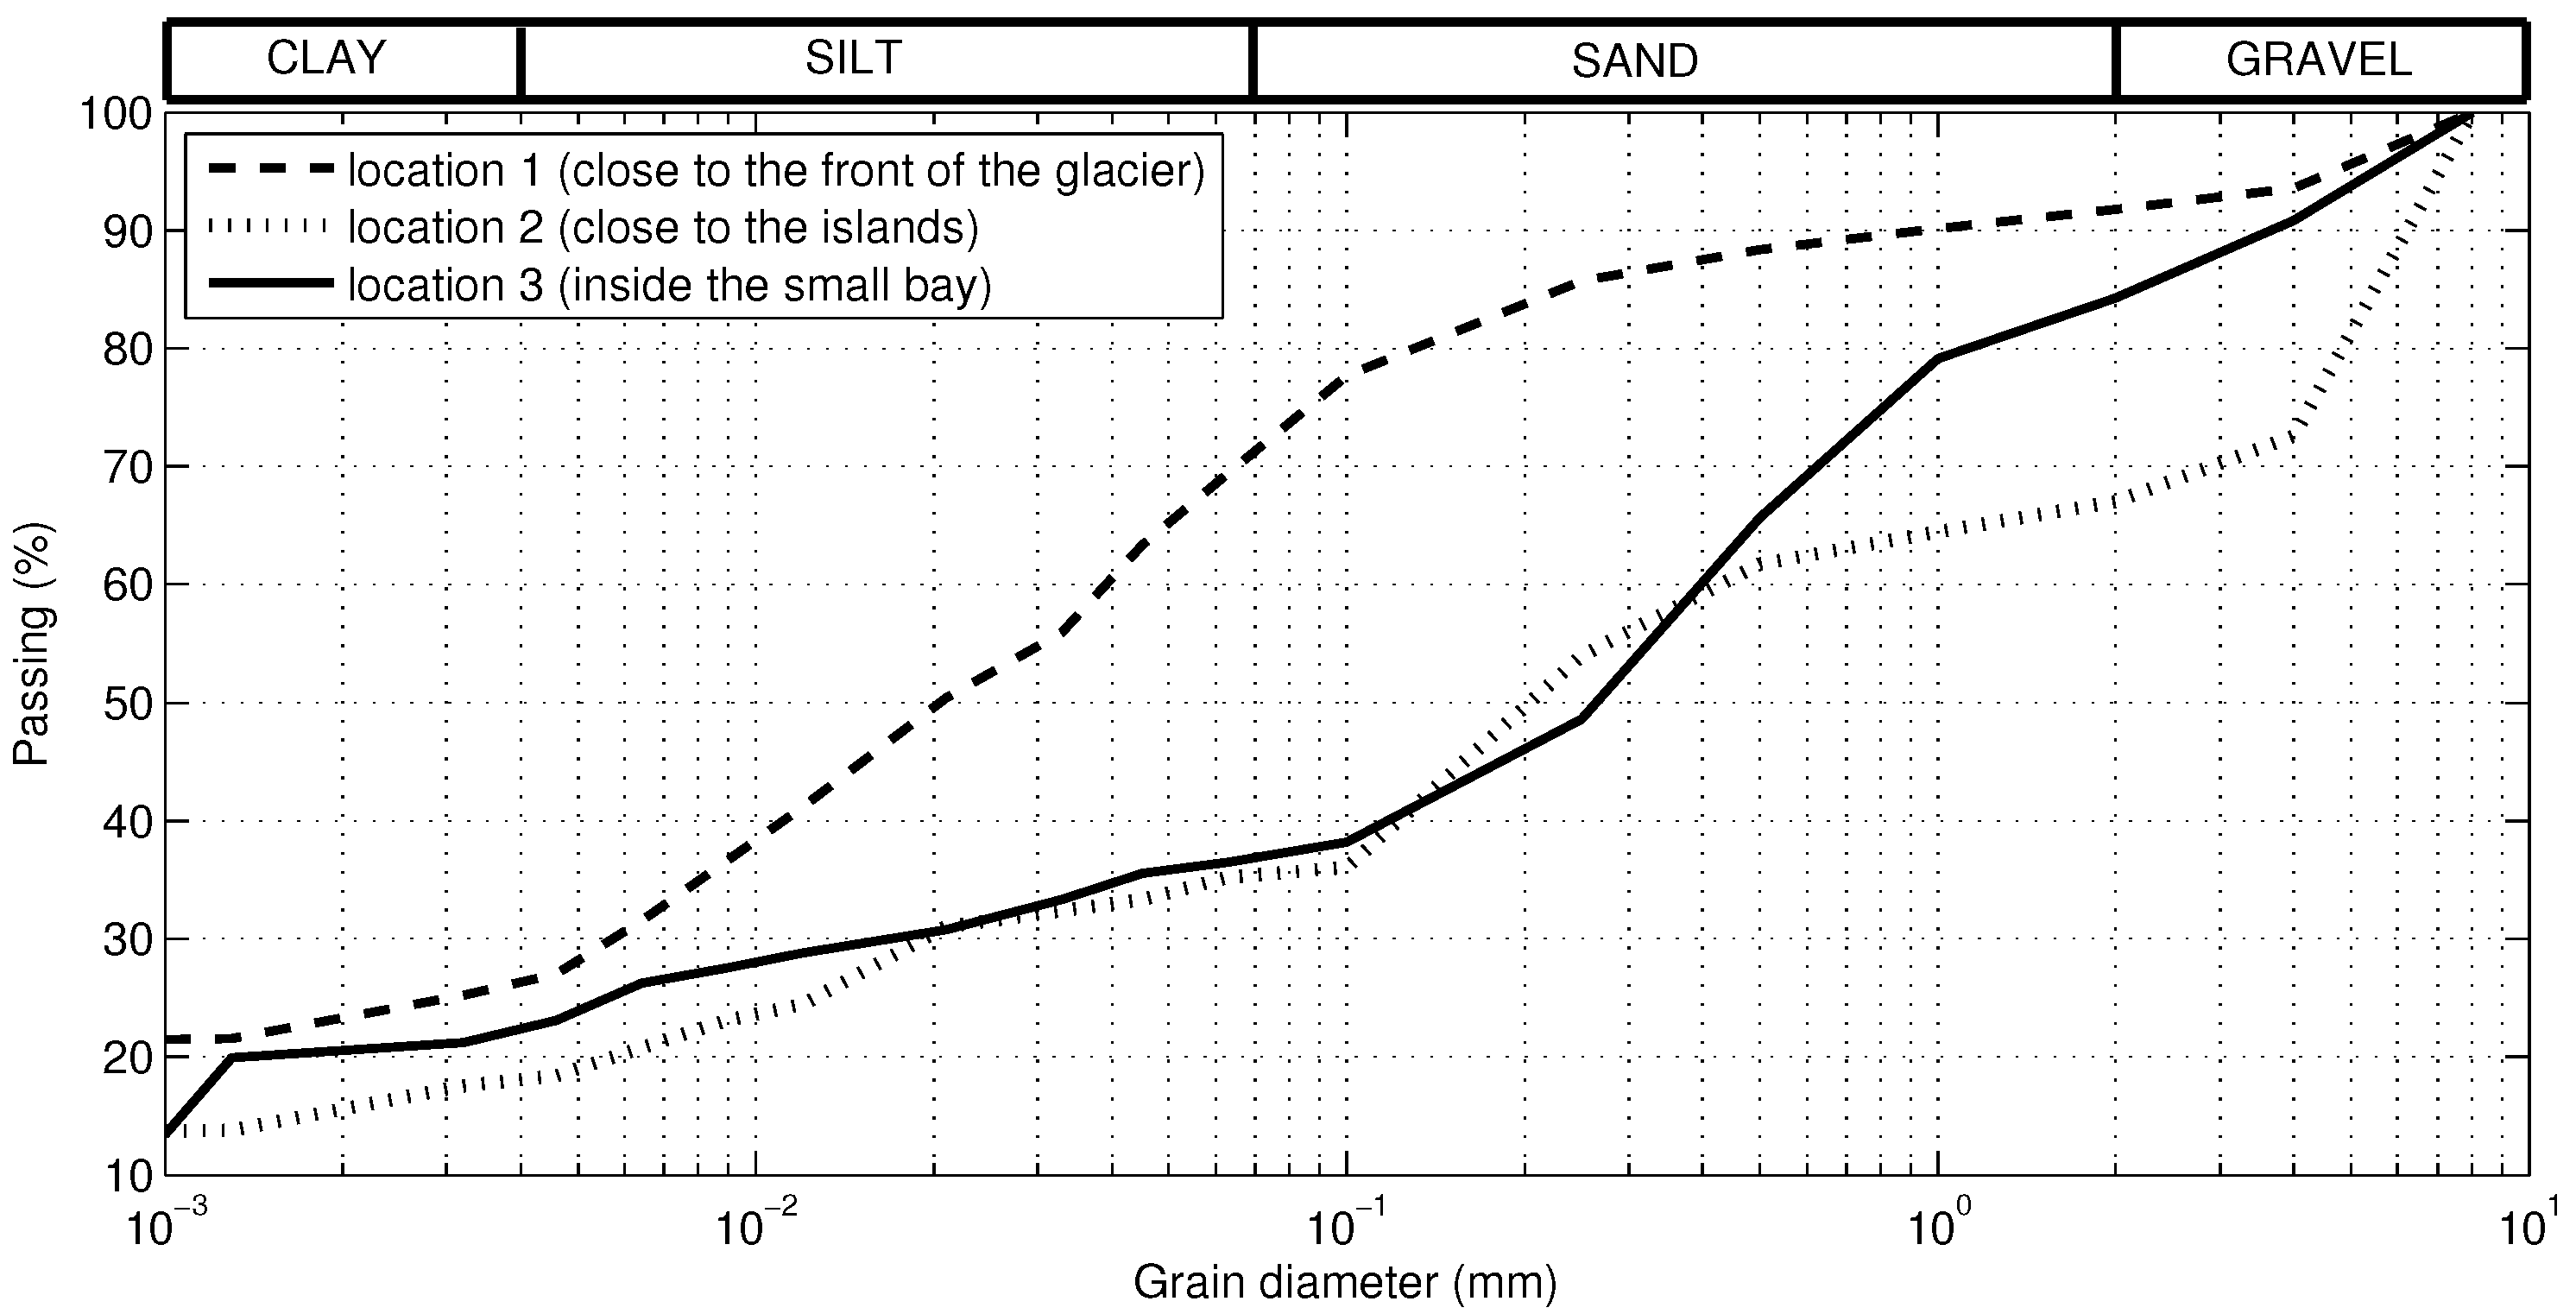
2.5. Proglacial Lagoon Echosounding and Sediment Sampling
2.6. DEM Differencing and Ice Elevation Changes
3. Results
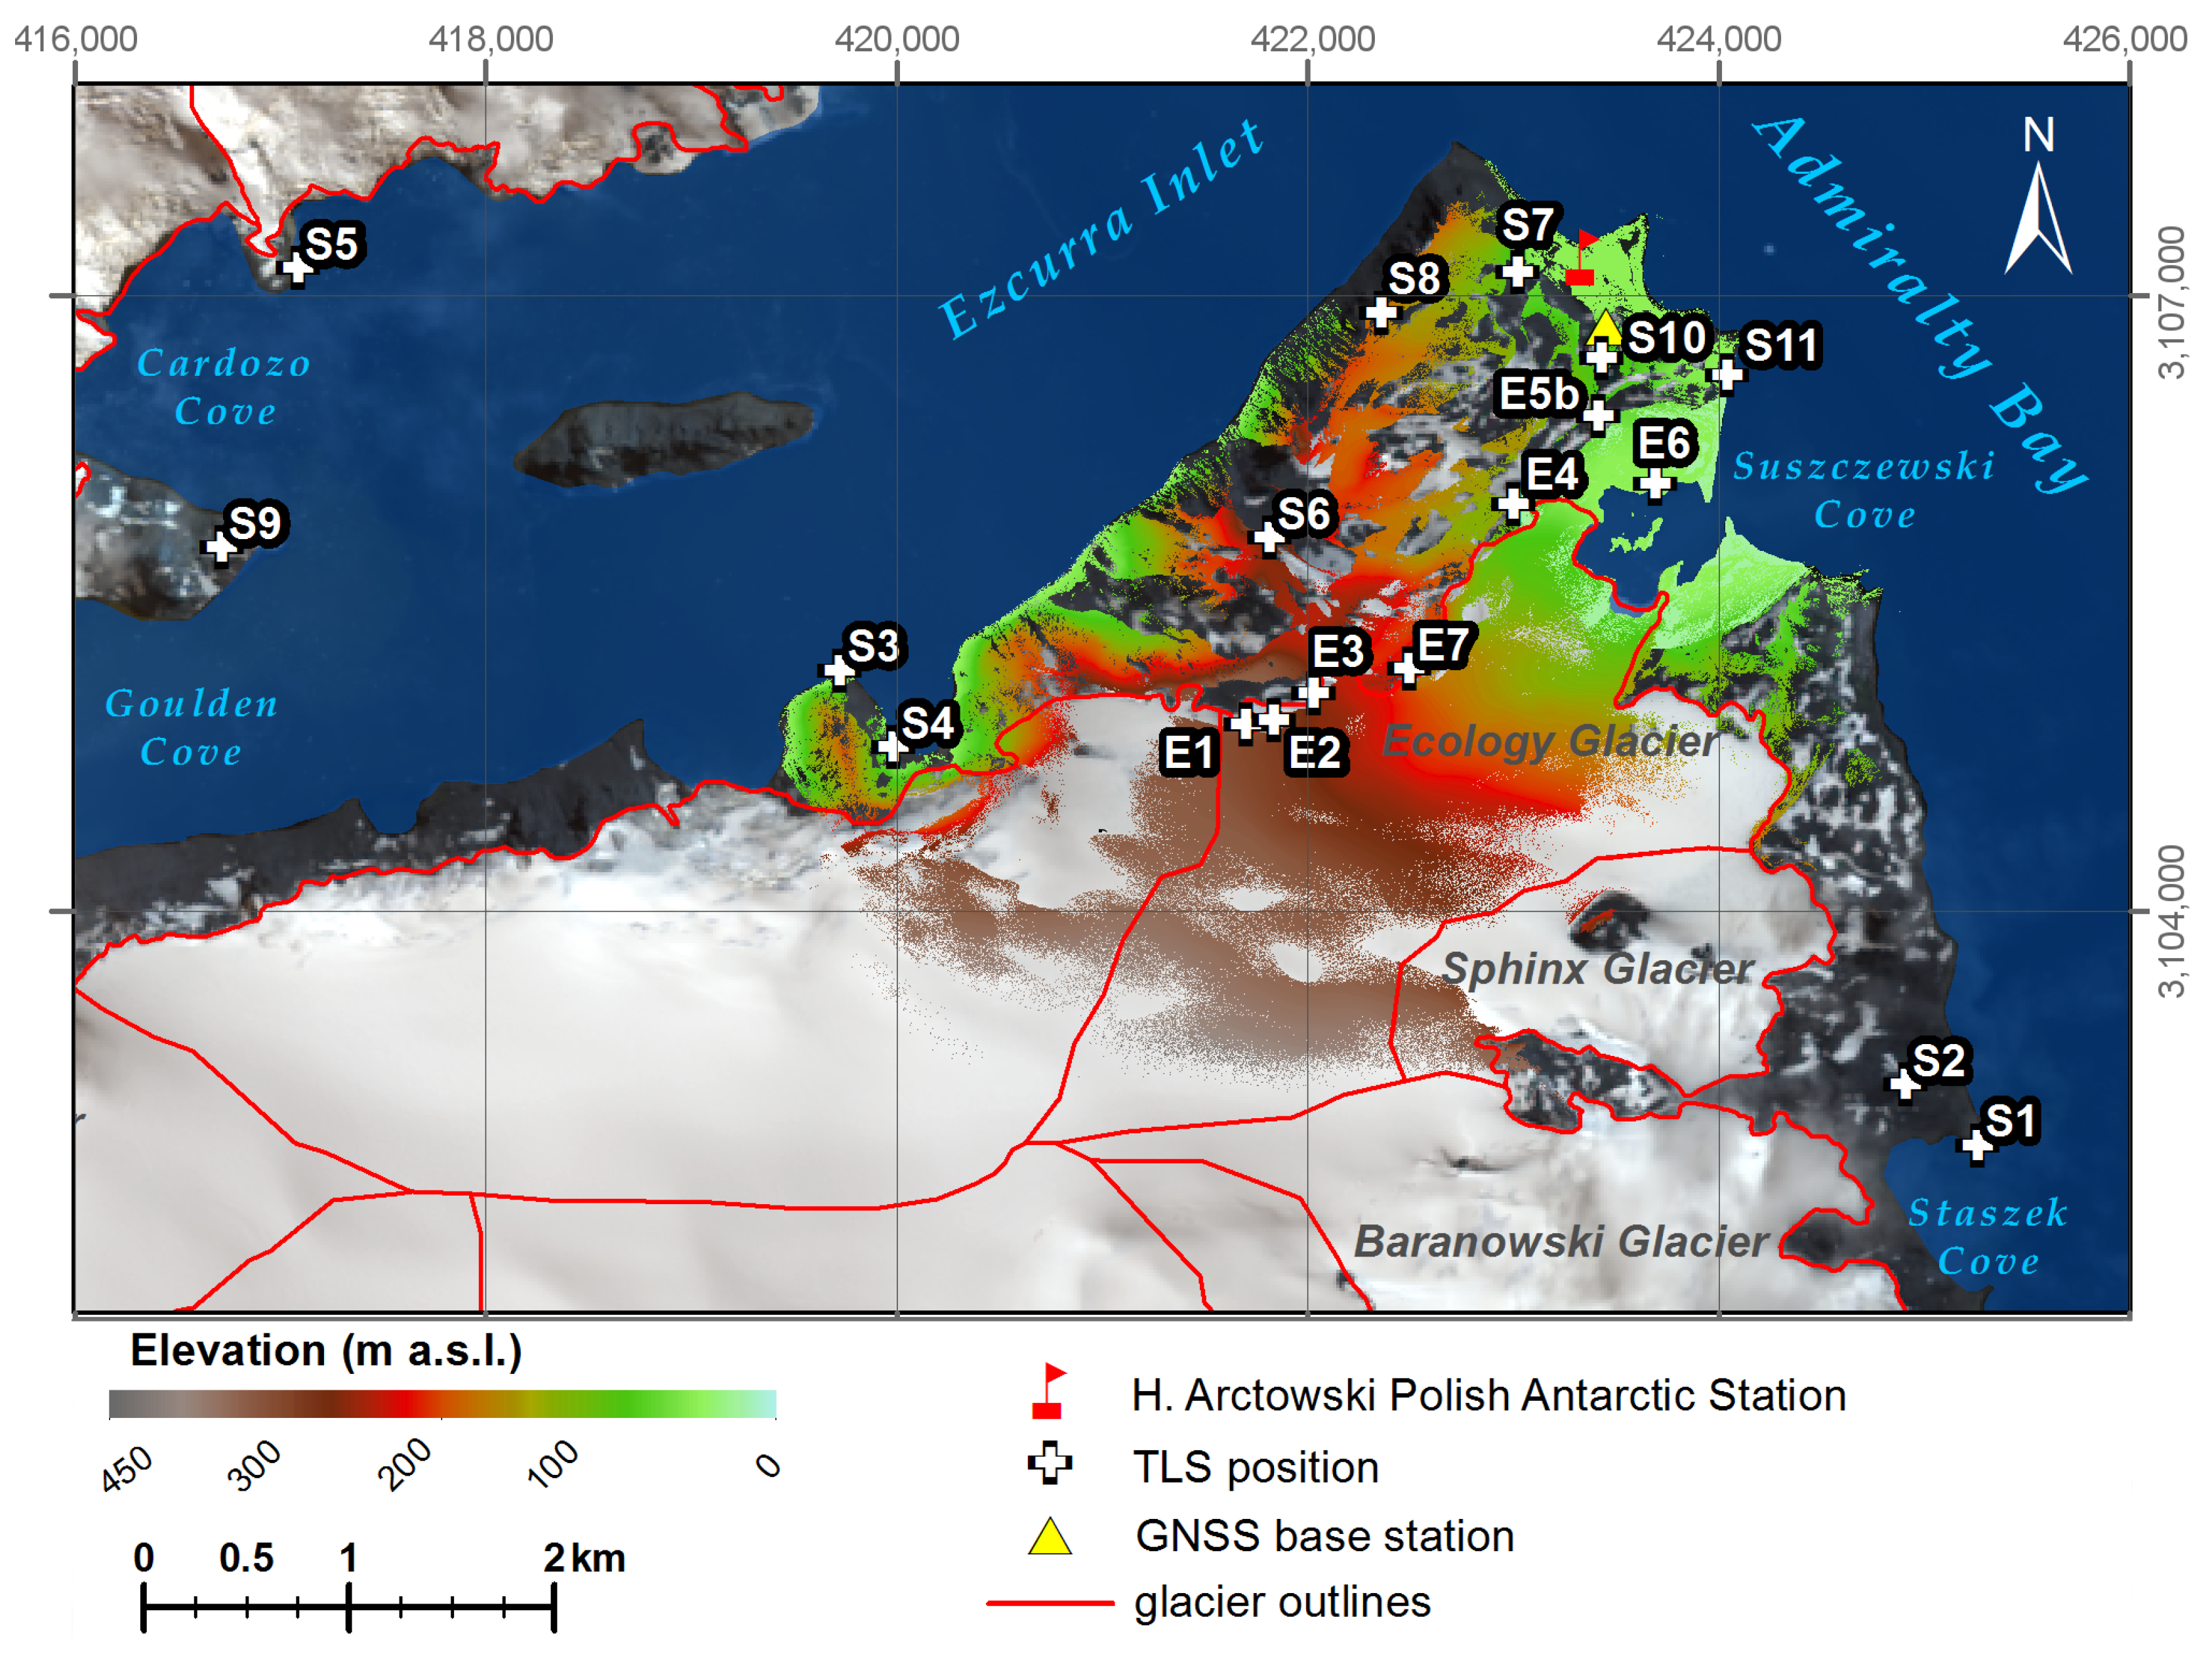
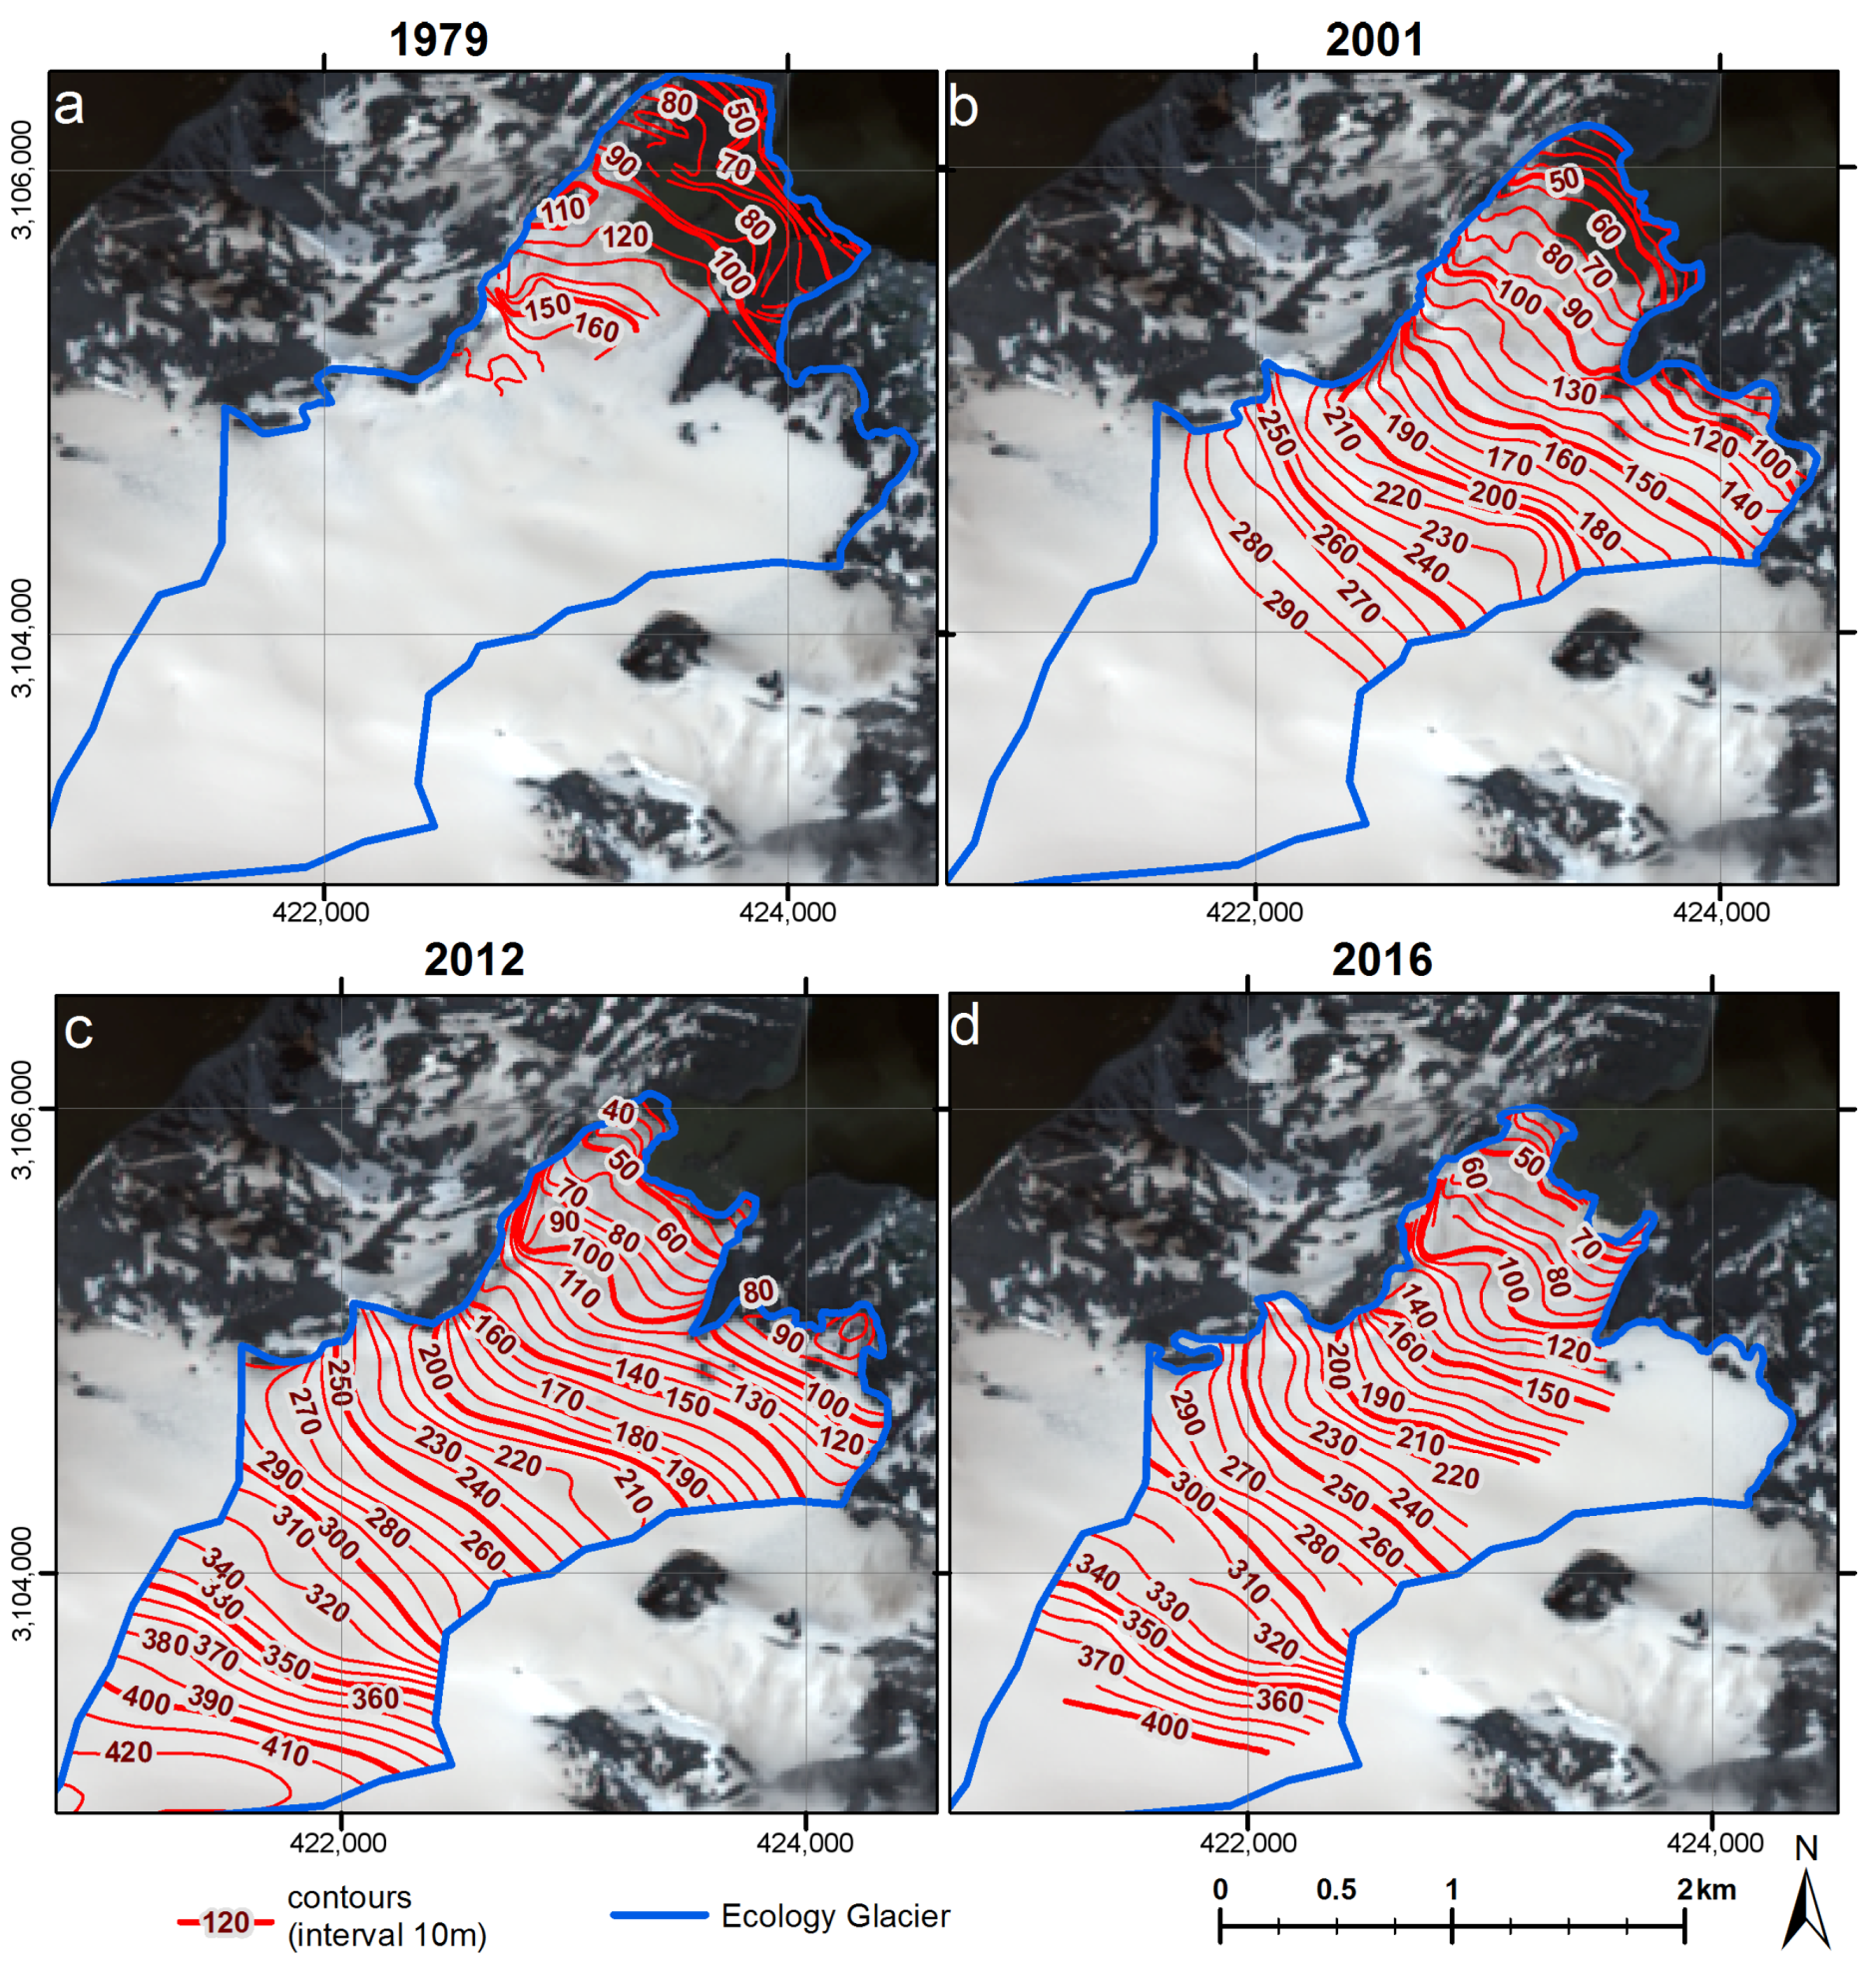
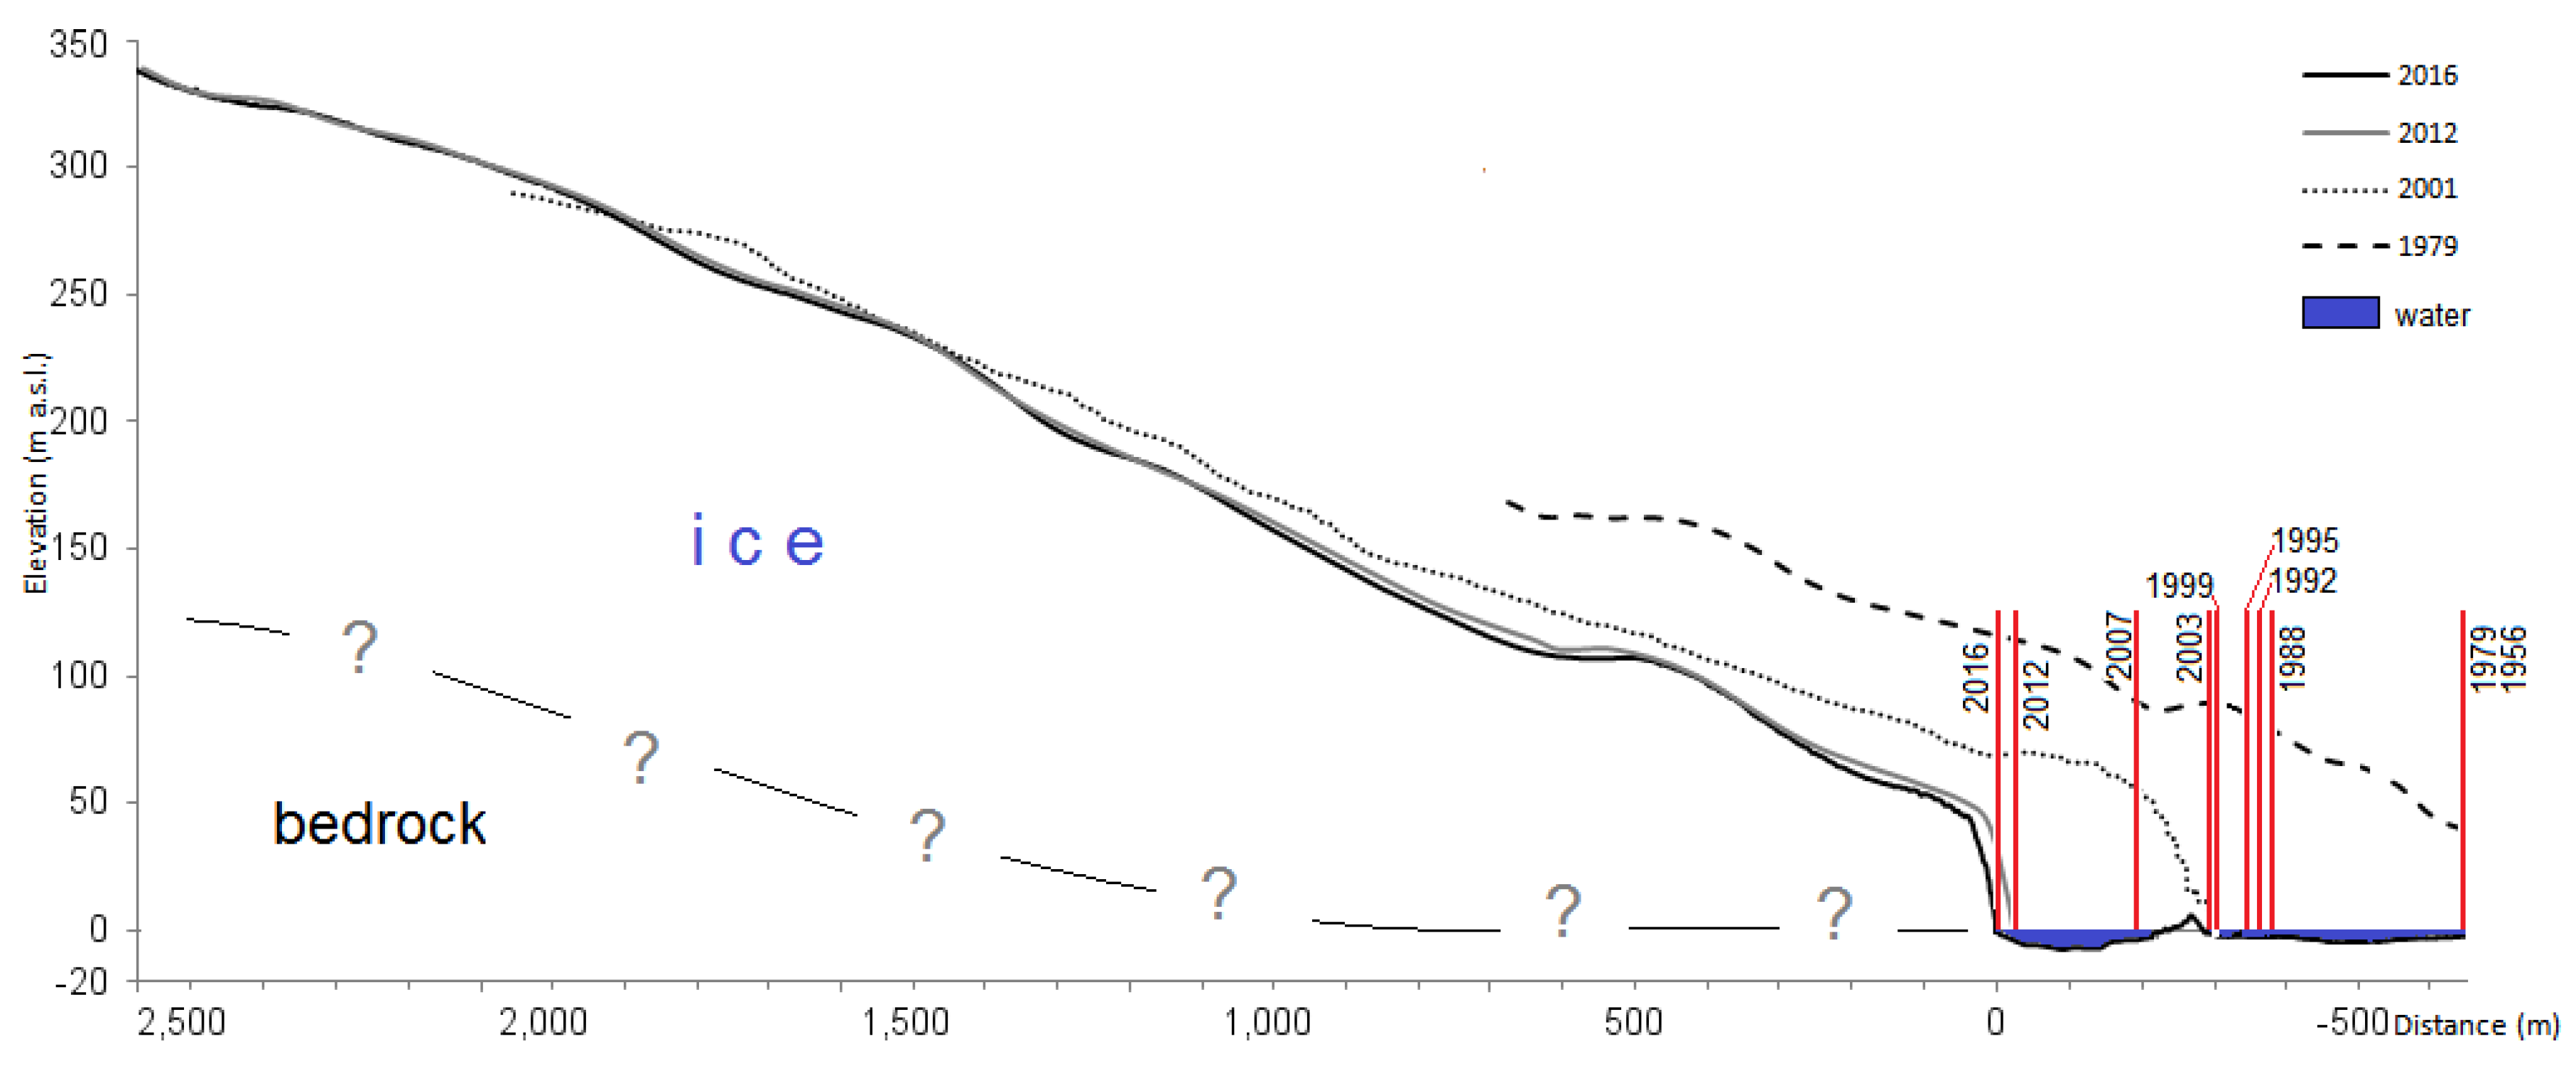
3.1. Digital Elevation Models
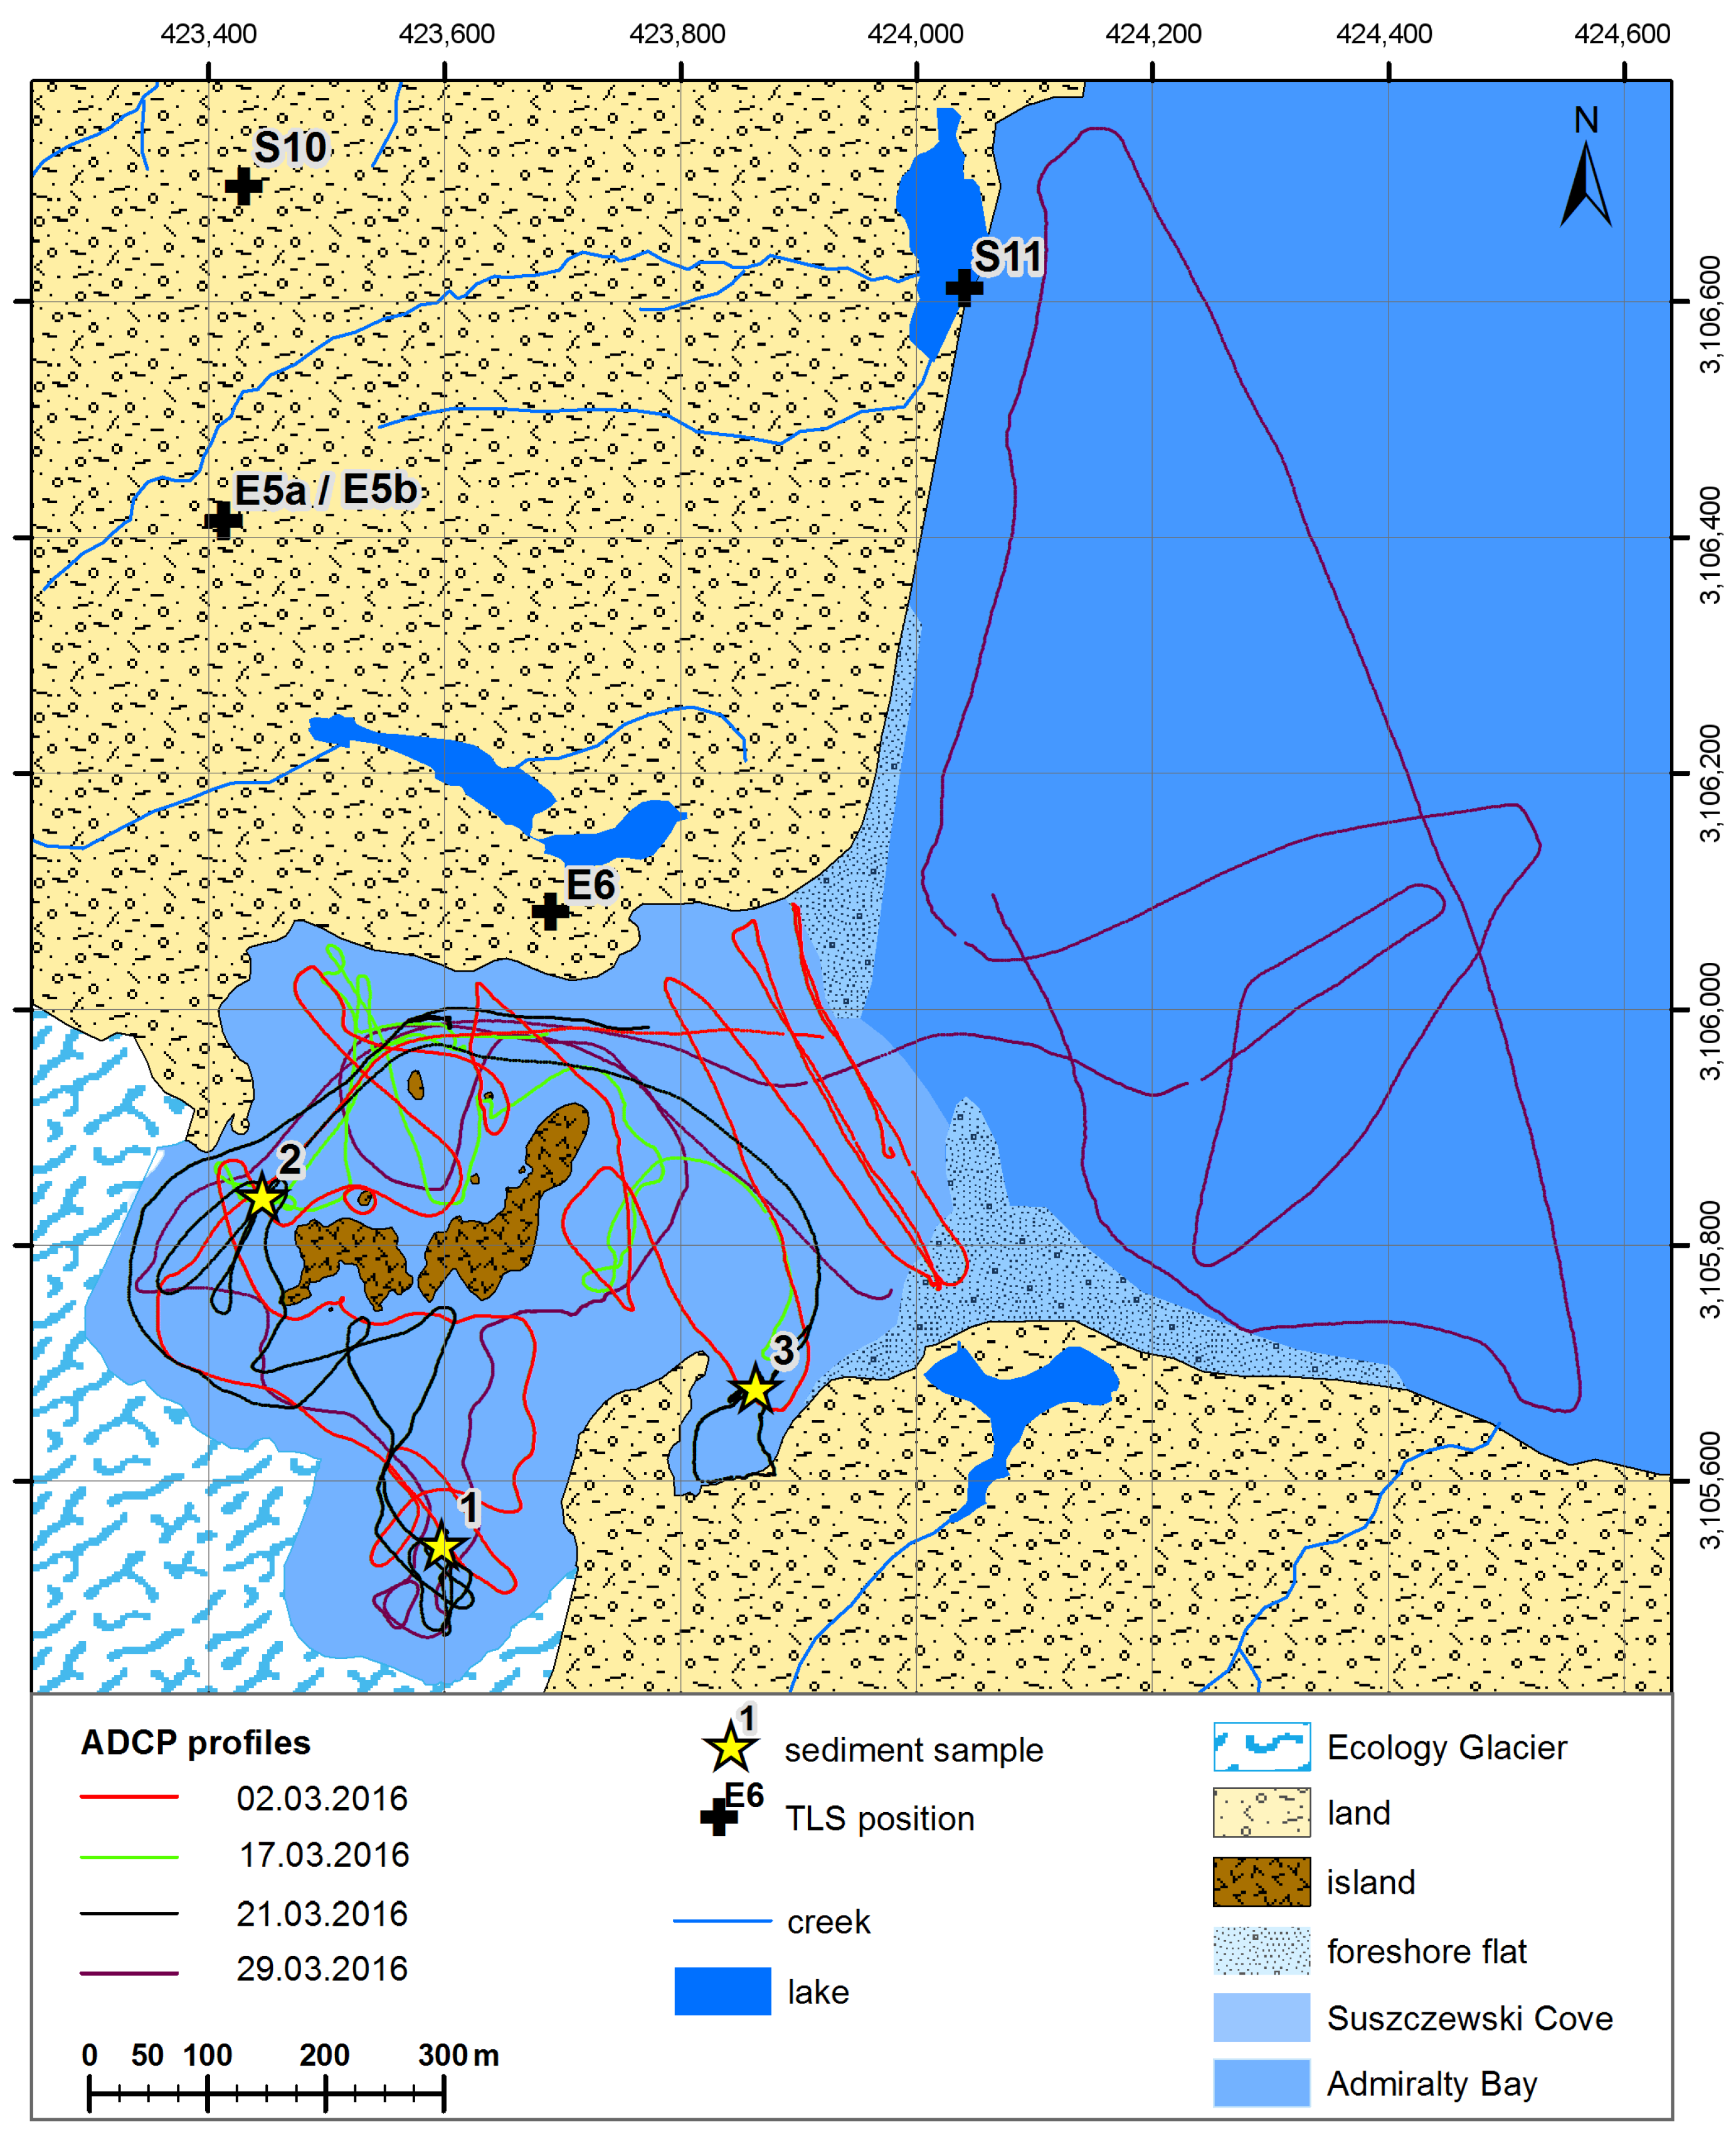
3.2. Pro-Glacial Lagoon Echosounding
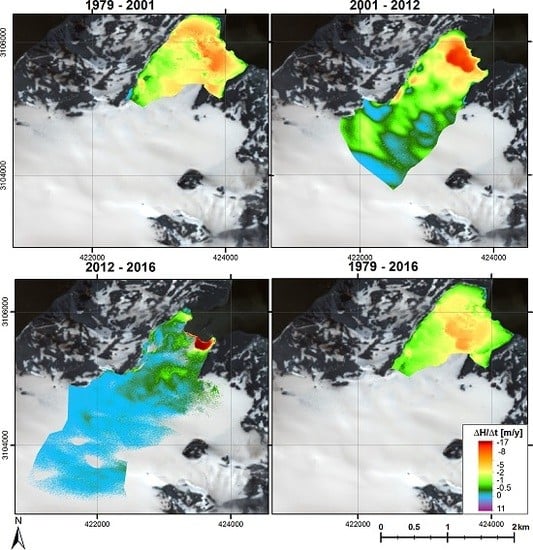
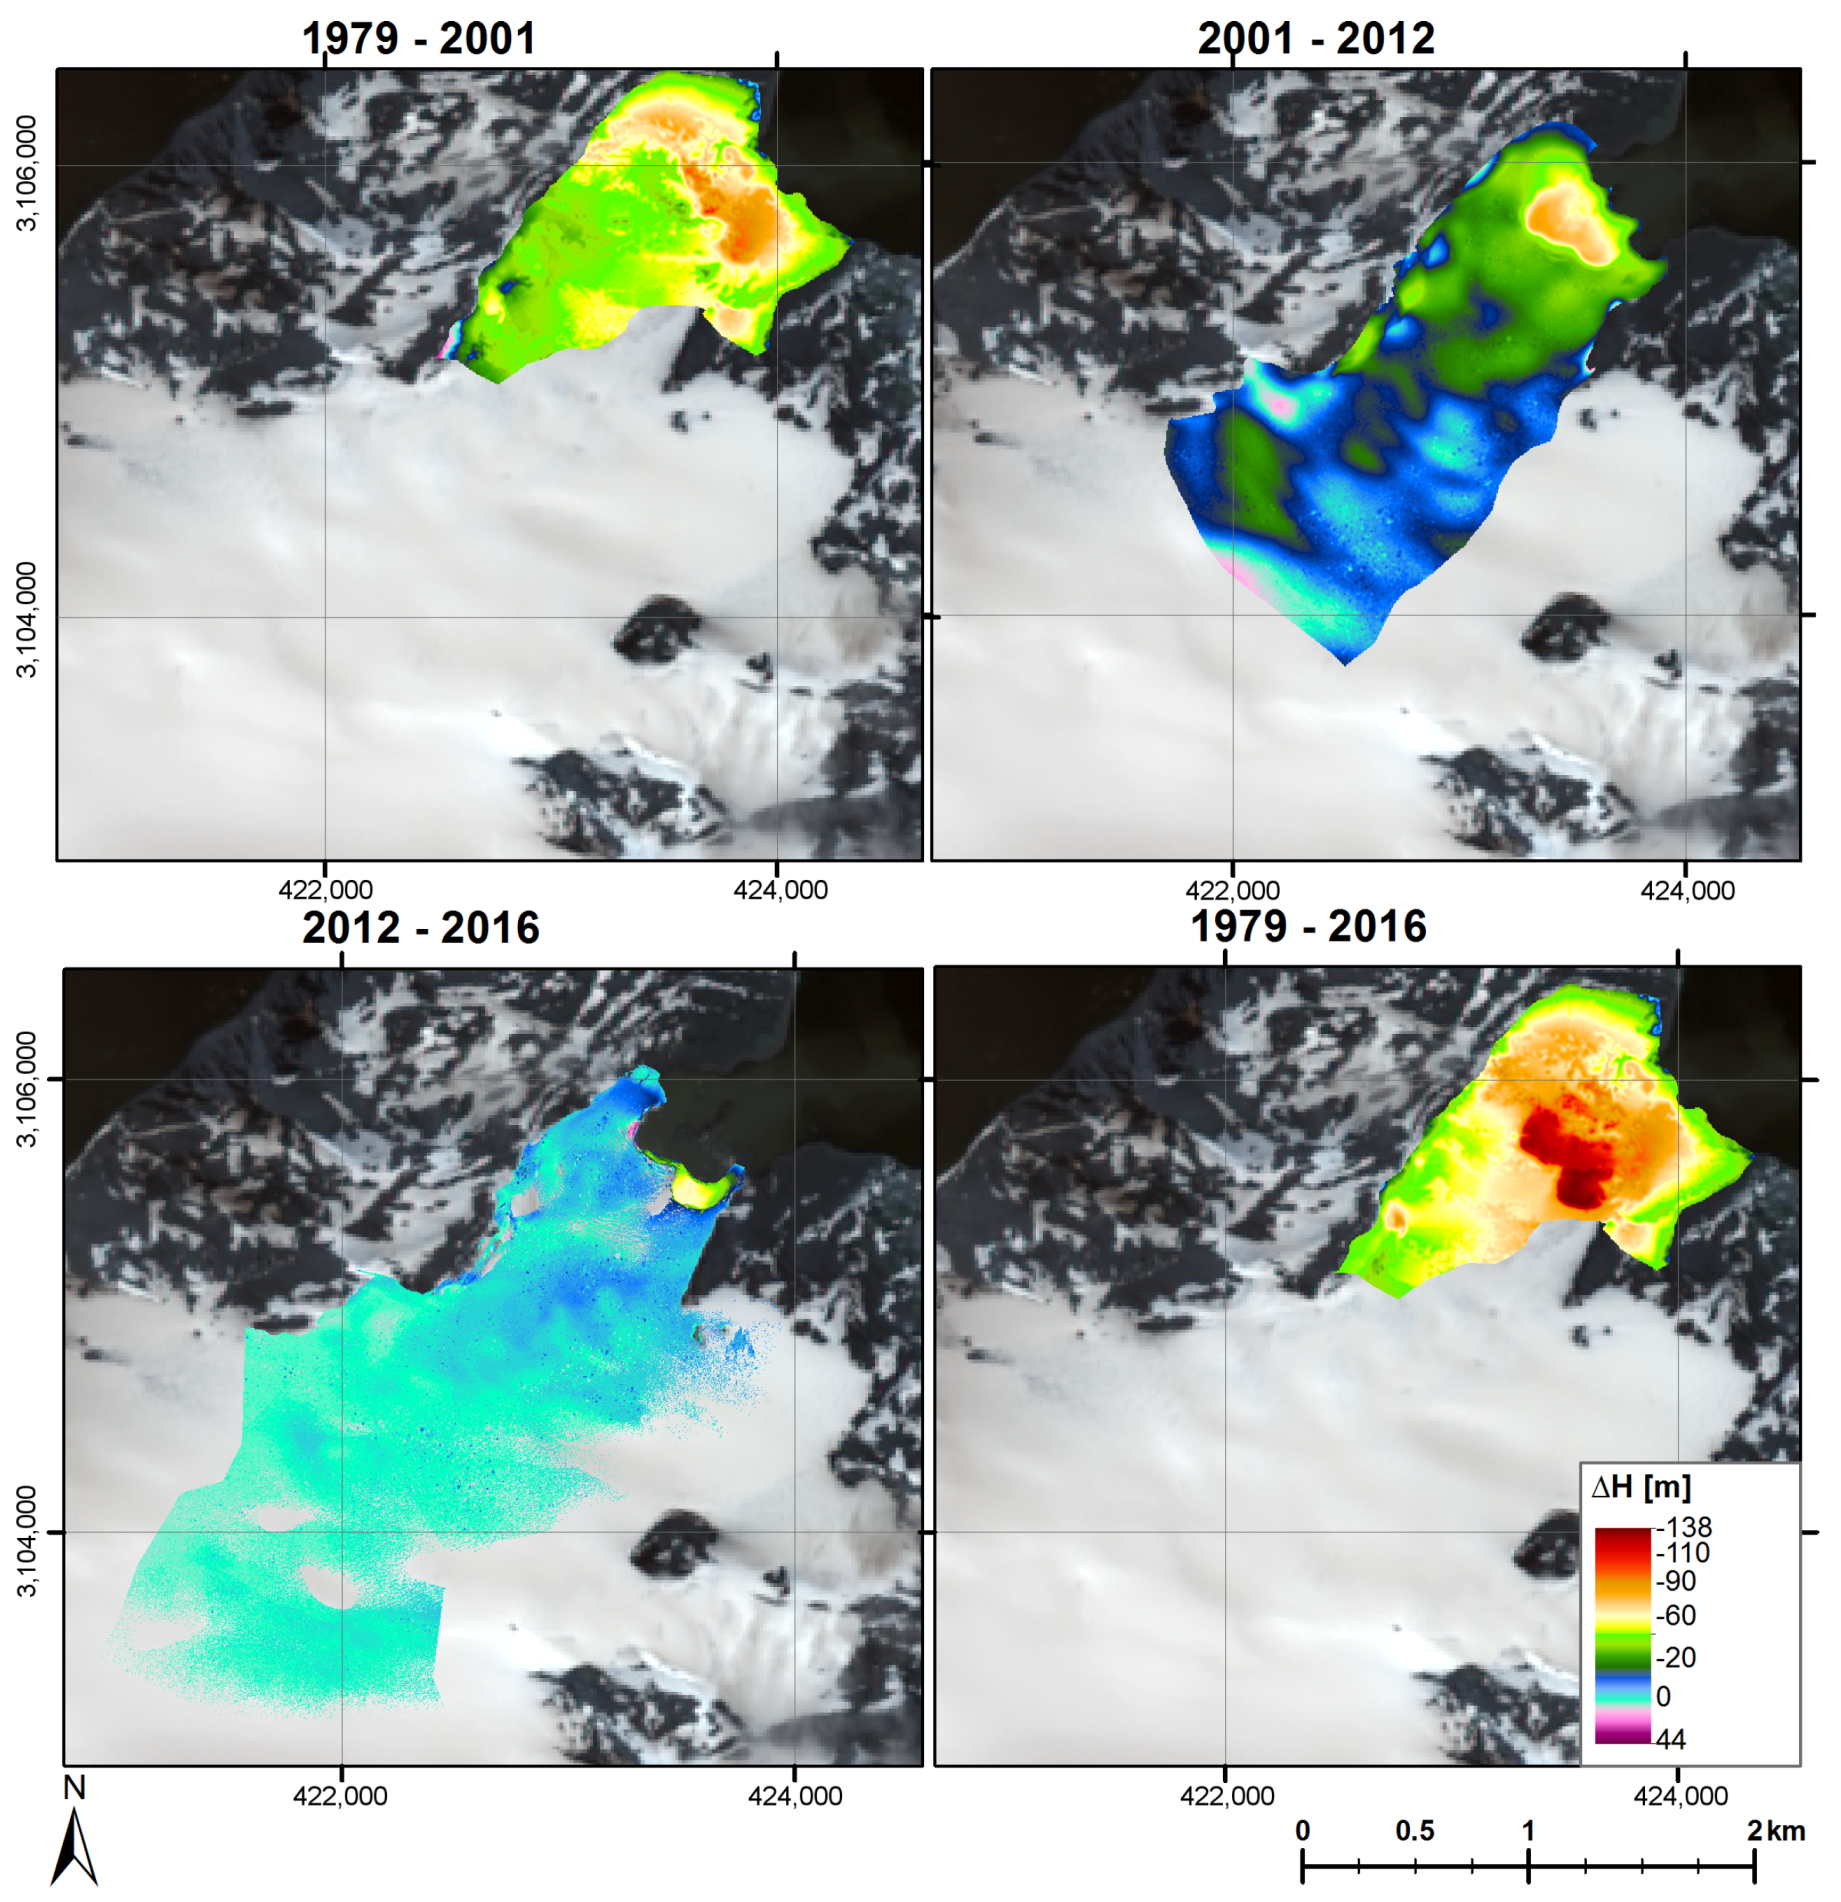
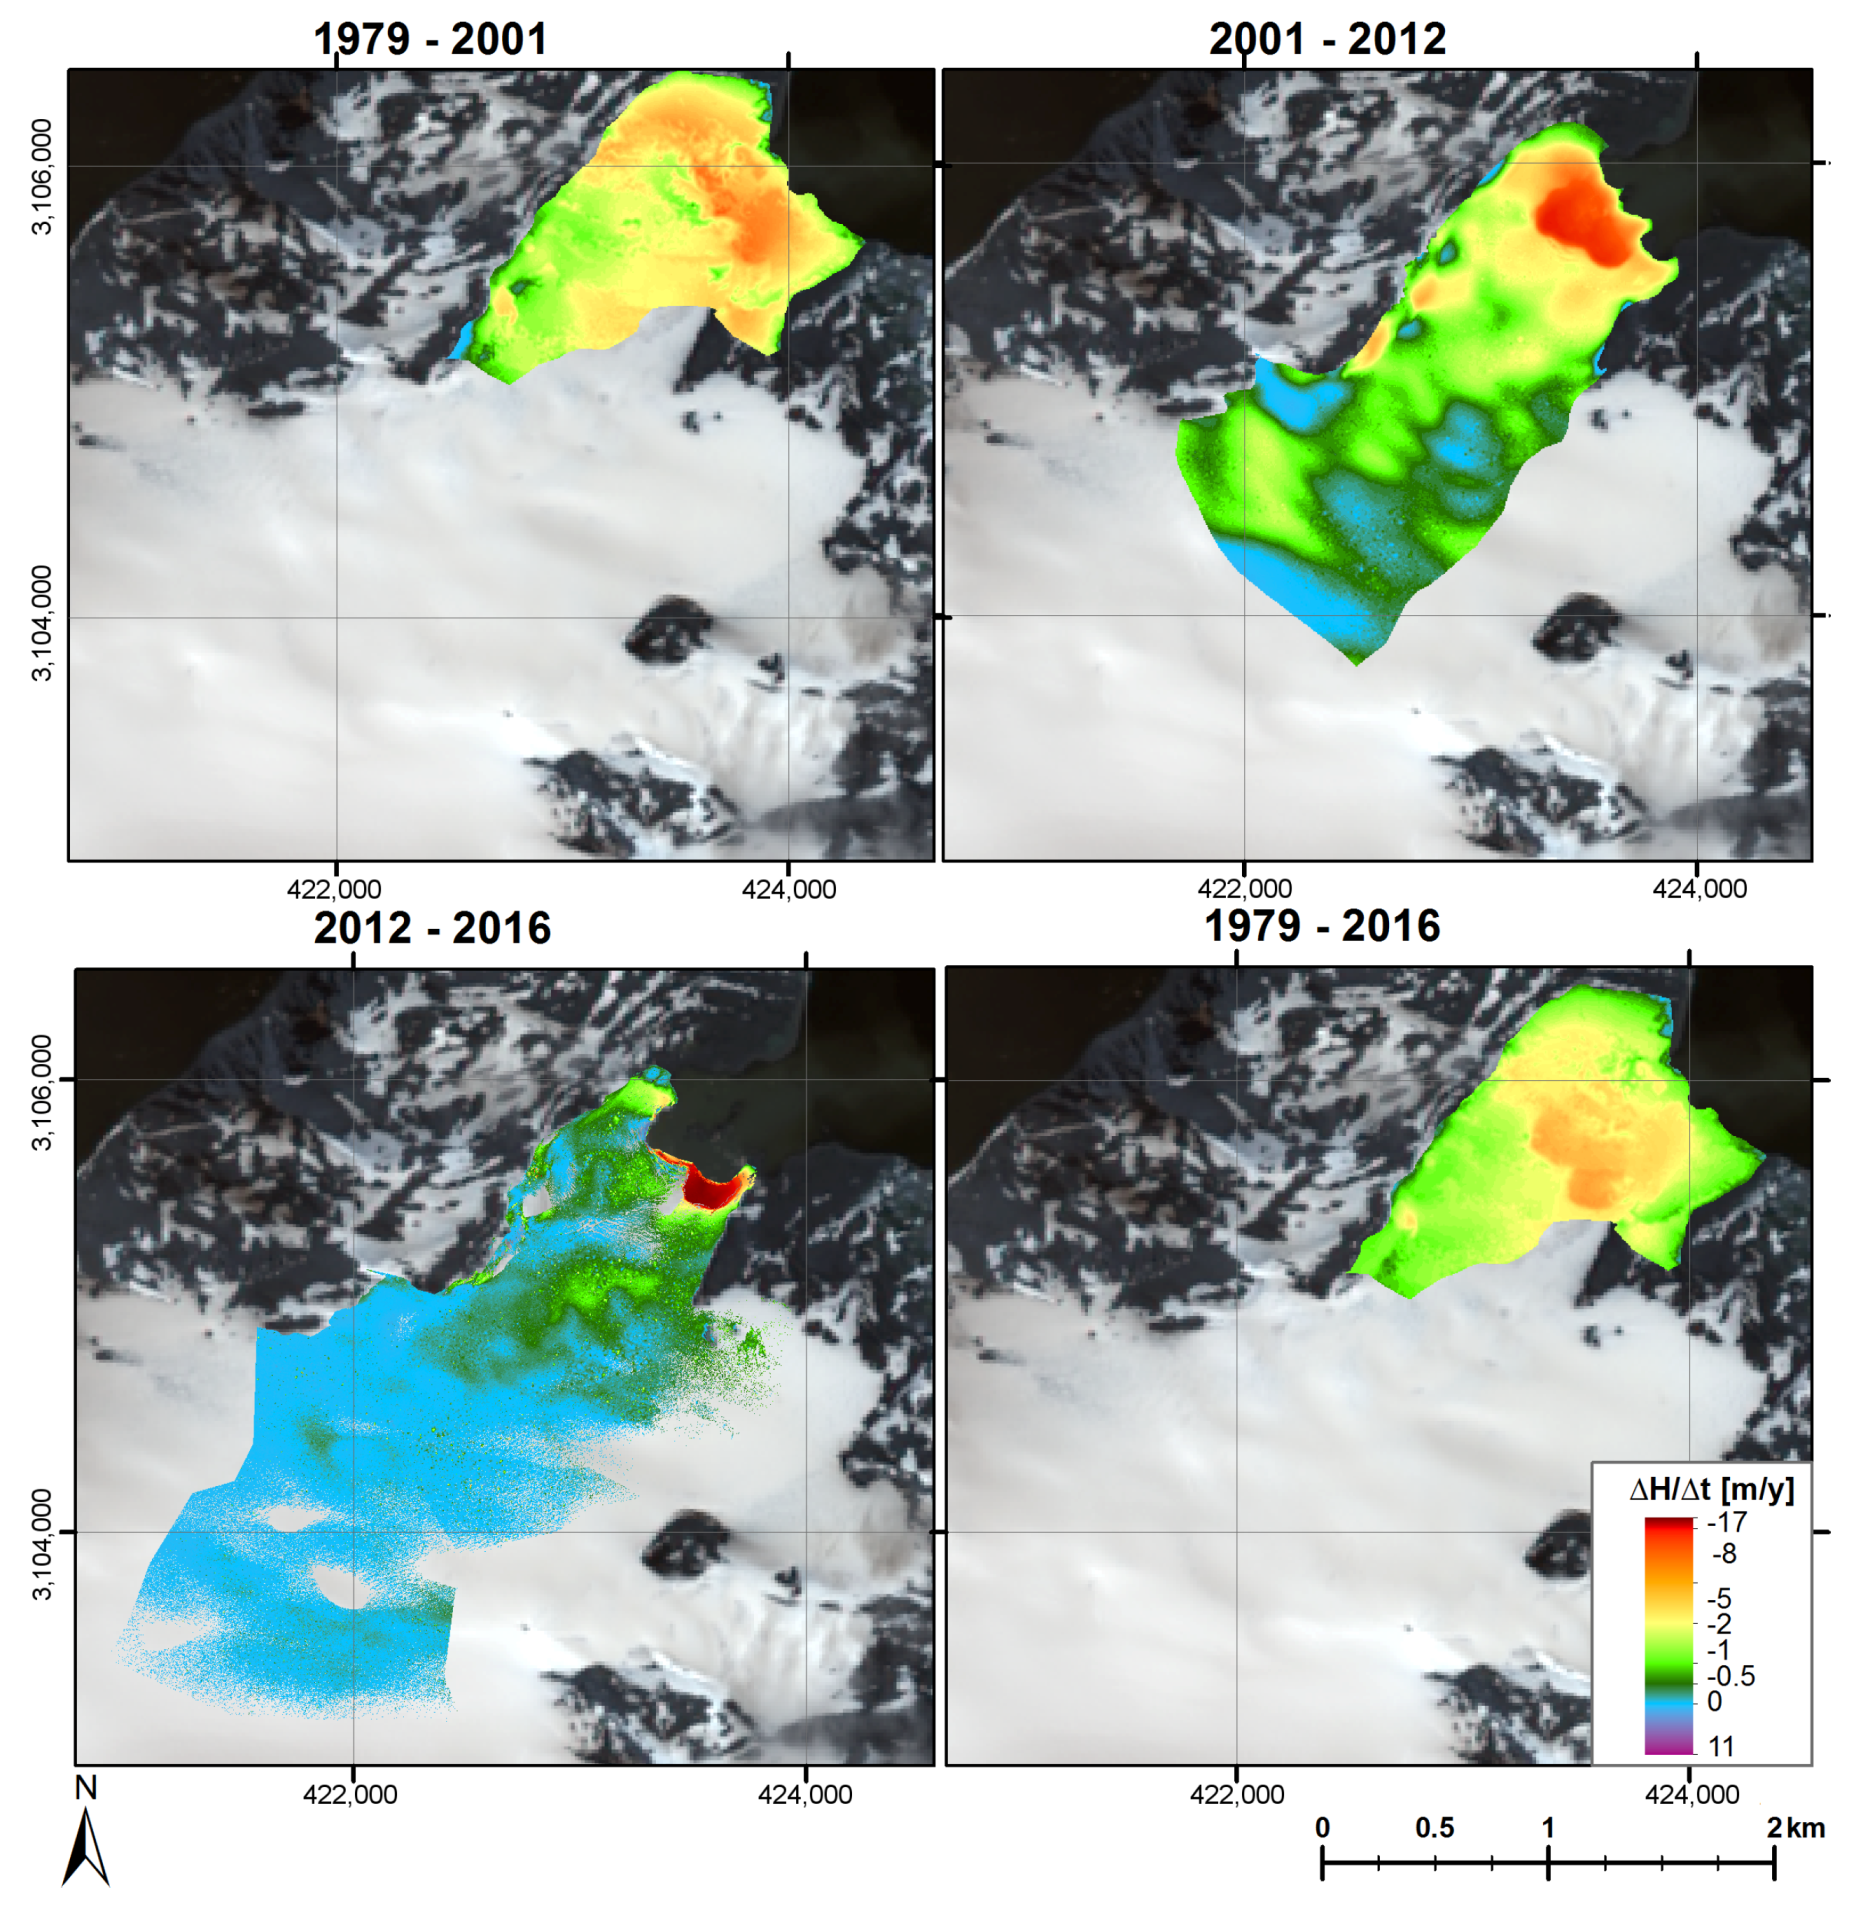
3.3. Ice Elevation Changes
4. Discussion
5. Conclusions
Acknowledgments
Author Contributions
Conflicts of Interest
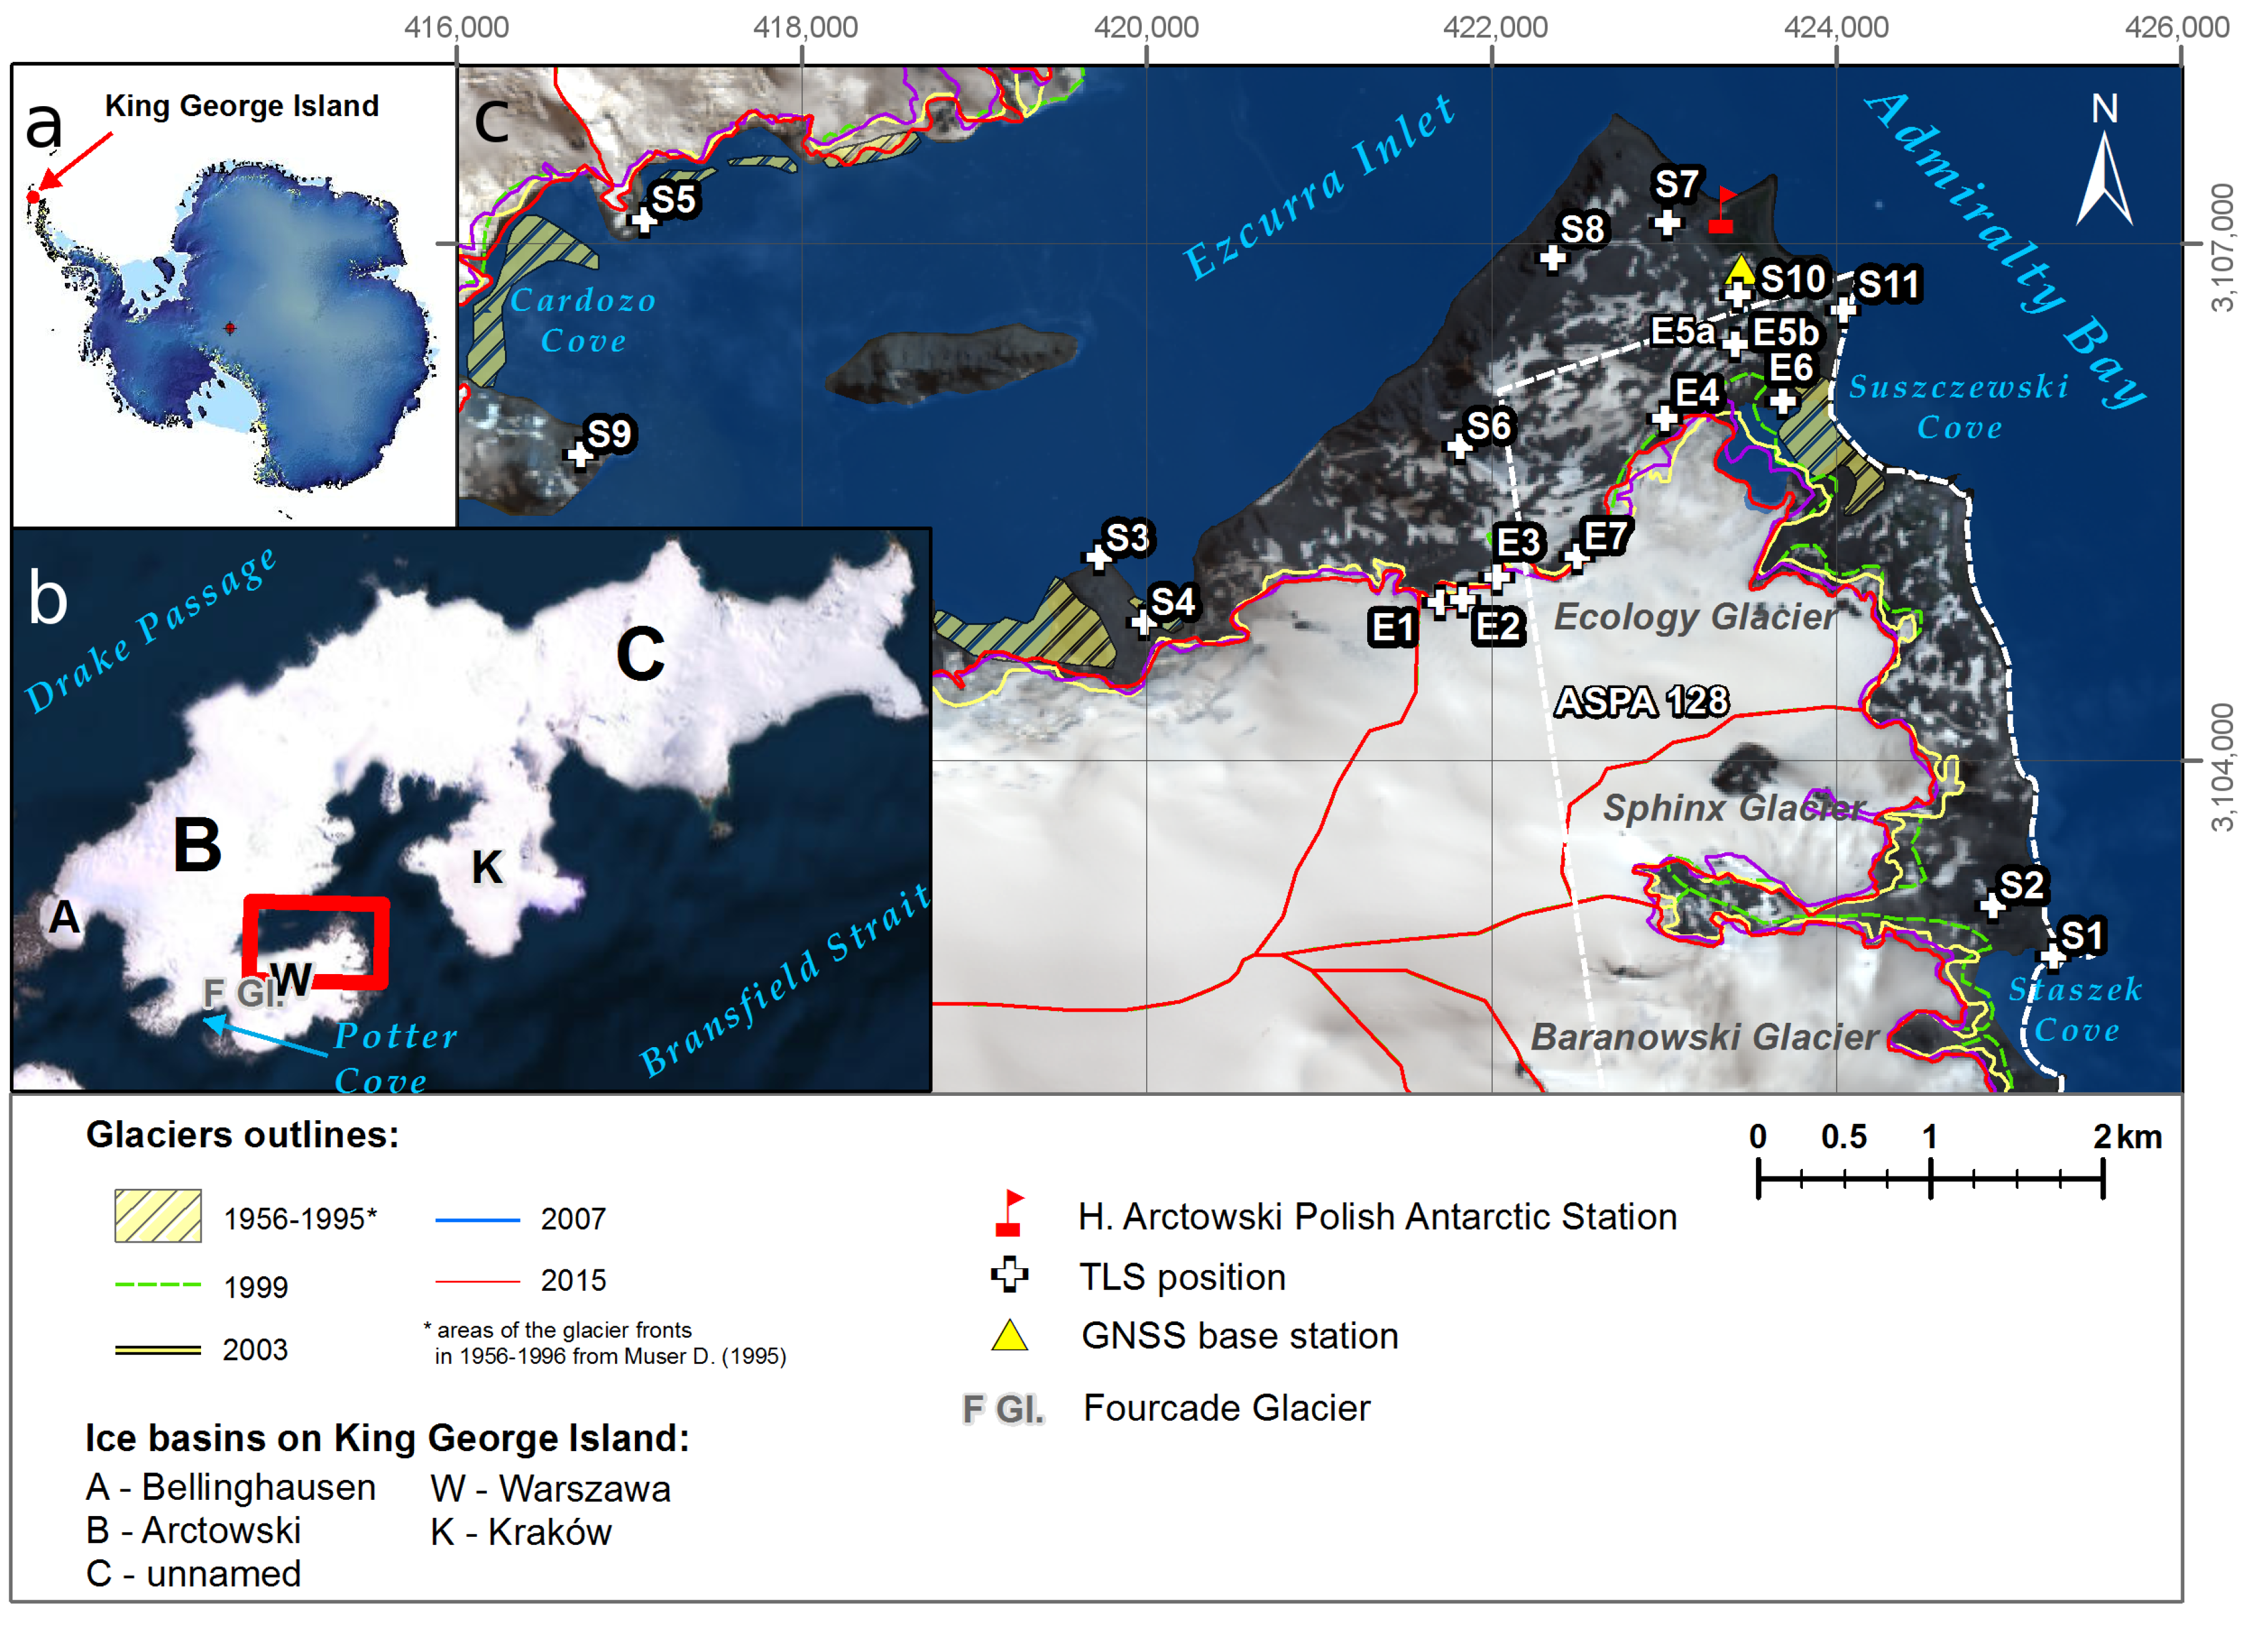
Appendix A. TLS Locations

| Location | Date | Position (UTM 21S, EGM96) | |||
|---|---|---|---|---|---|
| Name | Place | Easting (m) | Northing (m) | Elevation (m) | |
| S1 | Agat Point | 17 January 2016 | 425,263.335 | 3,102,865.460 | 12.910 |
| S2 | Blaszczyk Moraine | 10 February 2016 | 424,909.685 | 3,103,159.080 | 34.283 |
| S3 | Breccia Craig | 14 January 2016 | 419,725.365 | 3,105,175.215 | 8.461 |
| S4 | Dera Icefall | 14 January 2016 | 419,987.270 | 3,104,801.860 | 17.464 |
| E1 | Dutkiewicz Cliff E | 21 March 2016 | 421,701.152 | 3,104,914.030 | 309.498 |
| E2 | Dutkiewicz Cliff S | 21 March 2016 | 421,835.812 | 3,104,933.154 | 300.446 |
| E3 | Dutkiewicz Cliff W | 21 March 2016 | 422,031.467 | 3,105,063.660 | 254.963 |
| E4 | Ecology E | 17 March 2016 | 423,004.110 | 3,105,984.201 | 108.015 |
| E5a | Ecology N | 27 January 2016 | 423,413.154 | 3,106,413.154 | 51.637 |
| E5b | Ecology N | 17 March 2016 | 423,413.372 | 3,106,414.044 | 51.590 |
| E6 | Ecology S | 17 March 2016 | 423,690.545 | 3,106,082.676 | 3.925 |
| S5 | Emerald Point | 15 January 2016 | 417,086.935 | 3,107,134.453 | 10.489 |
| S6 | Kasprowy Hill | 7 February 2016 | 421,816.623 | 3,105,821.195 | 282.570 |
| S7 | Petrified Forest | 2 February 2016 | 423,021.155 | 3,107,116.456 | 35.822 |
| S8 | Panorama Ridge | 7 February 2016 | 422,359.359 | 3,106,913.451 | 155.314 |
| S9 | Pond Hill | 18 January 2016 | 416,717.283 | 3,105,774.282 | 117.998 |
| S10 | Puchalski Tomb | 27 January 2016 | 423,430.061 | 3,106,697.116 | 56.348 |
| S11 | Rakusa Point | 27 January 2016 | 424,041.256 | 3,106,611.373 | 4.849 |
| E7 | Wrobel Cliff | 21 March 2016 | 422,497.392 | 3,105,183.933 | 207.595 |
Appendix B. Ice Elevation Change Maps
References
- Pfeffer, W. A simple mechanism for irreversible tidewater glacier retreat. J. Geophys. Res. Earth Surf. 2007, 112. [Google Scholar] [CrossRef]
- Nick, F.M.; Vieli, A.; Howat, I.M.; Joughin, I. Large-scale changes in Greenland outlet glacier dynamics triggered at the terminus. Nat.Geosci. 2009, 2, 110–114. [Google Scholar] [CrossRef]
- Meier, M.; Post, A. Fast tidewater glaciers. J. Geophys. Res. 1987, 92, 9051–9058. [Google Scholar] [CrossRef]
- Vieli, A.; Funk, M.; Blatter, H. Flow dynamics of tidewater glaciers: A numerical modelling approach. J. Glaciol. 2001, 47, 595–606. [Google Scholar] [CrossRef]
- Howat, I.M.; Joughin, I.; Fahnestock, M.; Smith, B.E.; Scambos, T.A. Synchronous retreat and acceleration of southeast Greenland outlet glaciers 2000–06: Ice dynamics and coupling to climate. J. Glaciol. 2008, 54, 646–660. [Google Scholar] [CrossRef]
- Luckman, A.; Benn, D.I.; Cottier, F.; Bevan, S.; Nilsen, F.; Inall, M. Calving rates at tidewater glaciers vary strongly with ocean temperature. Nat. Commun. 2015, 6, 8566. [Google Scholar] [CrossRef] [PubMed]
- Vieli, A. Retreat instability of tidewater glaciers and marine ice sheets. In Snow and Ice-Related Hazards, Risks and Disasters; Haeberli, W., Whiteman, C., Eds.; Elsevier: Amsterdam, The Netherlands, 2014; pp. 677–712. [Google Scholar]
- Minowa, M.; Sugiyama, S.; Sakakibara, D.; Skvarca, P. Seasonal Variations in Ice-Front Position Controlled by Frontal Ablation at Glaciar Perito Moreno, the Southern Patagonia Icefield. Front. Earth Sci. 2017, 5, 1. [Google Scholar] [CrossRef]
- Motyka, R.J.; Cassotto, R.; Truffer, M.; Kjeldsen, K.K.; van As, D.; Korsgaard, N.J.; Fahnestock, M.; Howat, I.; Langen, P.L.; Mortensen, J.; et al. Asynchronous behavior of outlet glaciers feeding Godthåbsfjord (Nuup Kangerlua) and the triggering of Narsap Sermia’s retreat in SW Greenland. J. Glaciol. 2017, 63, 288–308. [Google Scholar] [CrossRef]
- Oerlemans, J.; Nick, F. A minimal model of tidewater glacier. Ann. Glaciol. 2005, 42, 1–6. [Google Scholar] [CrossRef]
- Roe, G.H.; Baker, M.B.; Herla, F. Centennial glacier retreat as categorical evidence of regional climate change. Nat. Geosci. 2016, 10, 95–99. [Google Scholar] [CrossRef]
- Scambos, T.; Berthier, E.; Haran, T.; Shuman, C.; Cook, A.; Ligtenberg, S.; Bohlander, J. Detailed ice loss pattern in the northern Antarctic Peninsula: widespread decline driven by ice front retreats. Cryosphere 2014, 8, 2135–2145. [Google Scholar] [CrossRef]
- Zemp, M.; Frey, H.; Gärtner-Roer, I.; Nussbaumer, S.U.; Hoelzle, M.; Paul, F.; Haeberli, W.; Denzinger, F.; Ahlstrøm, A.P.; Anderson, B.; et al. Historically unprecedented global glacier decline in the early 21st century. J. Glaciol. 2015, 61, 745–762. [Google Scholar] [CrossRef]
- Oerlemans, J. Extracting a climate signal from 169 glacier records. Science 2005, 308, 675–677. [Google Scholar] [CrossRef] [PubMed]
- Vaughan, D.; Marshall, G.; Connolley, W.; Parkinson, C.; Mulvaney, R.; Hodgson, D.; King, J.; Pudsay, C.; Turner, J. Recent rapid regional climate warming on the Antarctic Peninsula. Clim. Chang. 2003, 60, 243–274. [Google Scholar] [CrossRef]
- Rignot, E.; Casassa, G.; Gogineni, P.; Krabill, W.; Rivera, A.U.; Thomas, R. Accelerated ice discharge from the Antarctic Peninsula following the collapse of Larsen B ice shelf. Geophys. Res. Lett. 2004, 31. [Google Scholar] [CrossRef]
- Pritchard, H.; Vaughan, D. Widespread acceleration of tidewater glaciers on the Antarctic Peninsula. J. Geophys. Res. 2007, 112, F03S29. [Google Scholar] [CrossRef]
- Turner, J.; Lu, H.; White, I.; King, J.; Phillips, T.; Hosking, J.; Bracegirdle, T.; Marshall, G.; Mulvaney, R.; Deb, P. Absence of 21st century warming on Antarctic Peninsula consistent with natural variability. Nature 2016, 535, 411–415. [Google Scholar] [CrossRef] [PubMed]
- Oliva, M.; Navarro, F.; Hrbáček, F.; Hernández, A.; Nývlt, D.; Pereira, P.; Ruiz-Fernández, J.; Trigo, R. Recent regional climate cooling on the Antarctic Penisula and associated impacts on the cryosphere. Sci. Total Environ. 2017, 580, 210–223. [Google Scholar] [CrossRef] [PubMed]
- Navarro, F.; Jonsell, U.; Corcuera, M.; Martin-Espanol, A. Decelerated mass loss of Hurd and Johnsons Glaciers, Livingston Island, Antarctic Peninsula. J. Glaciol. 2013, 59, 115–128. [Google Scholar] [CrossRef]
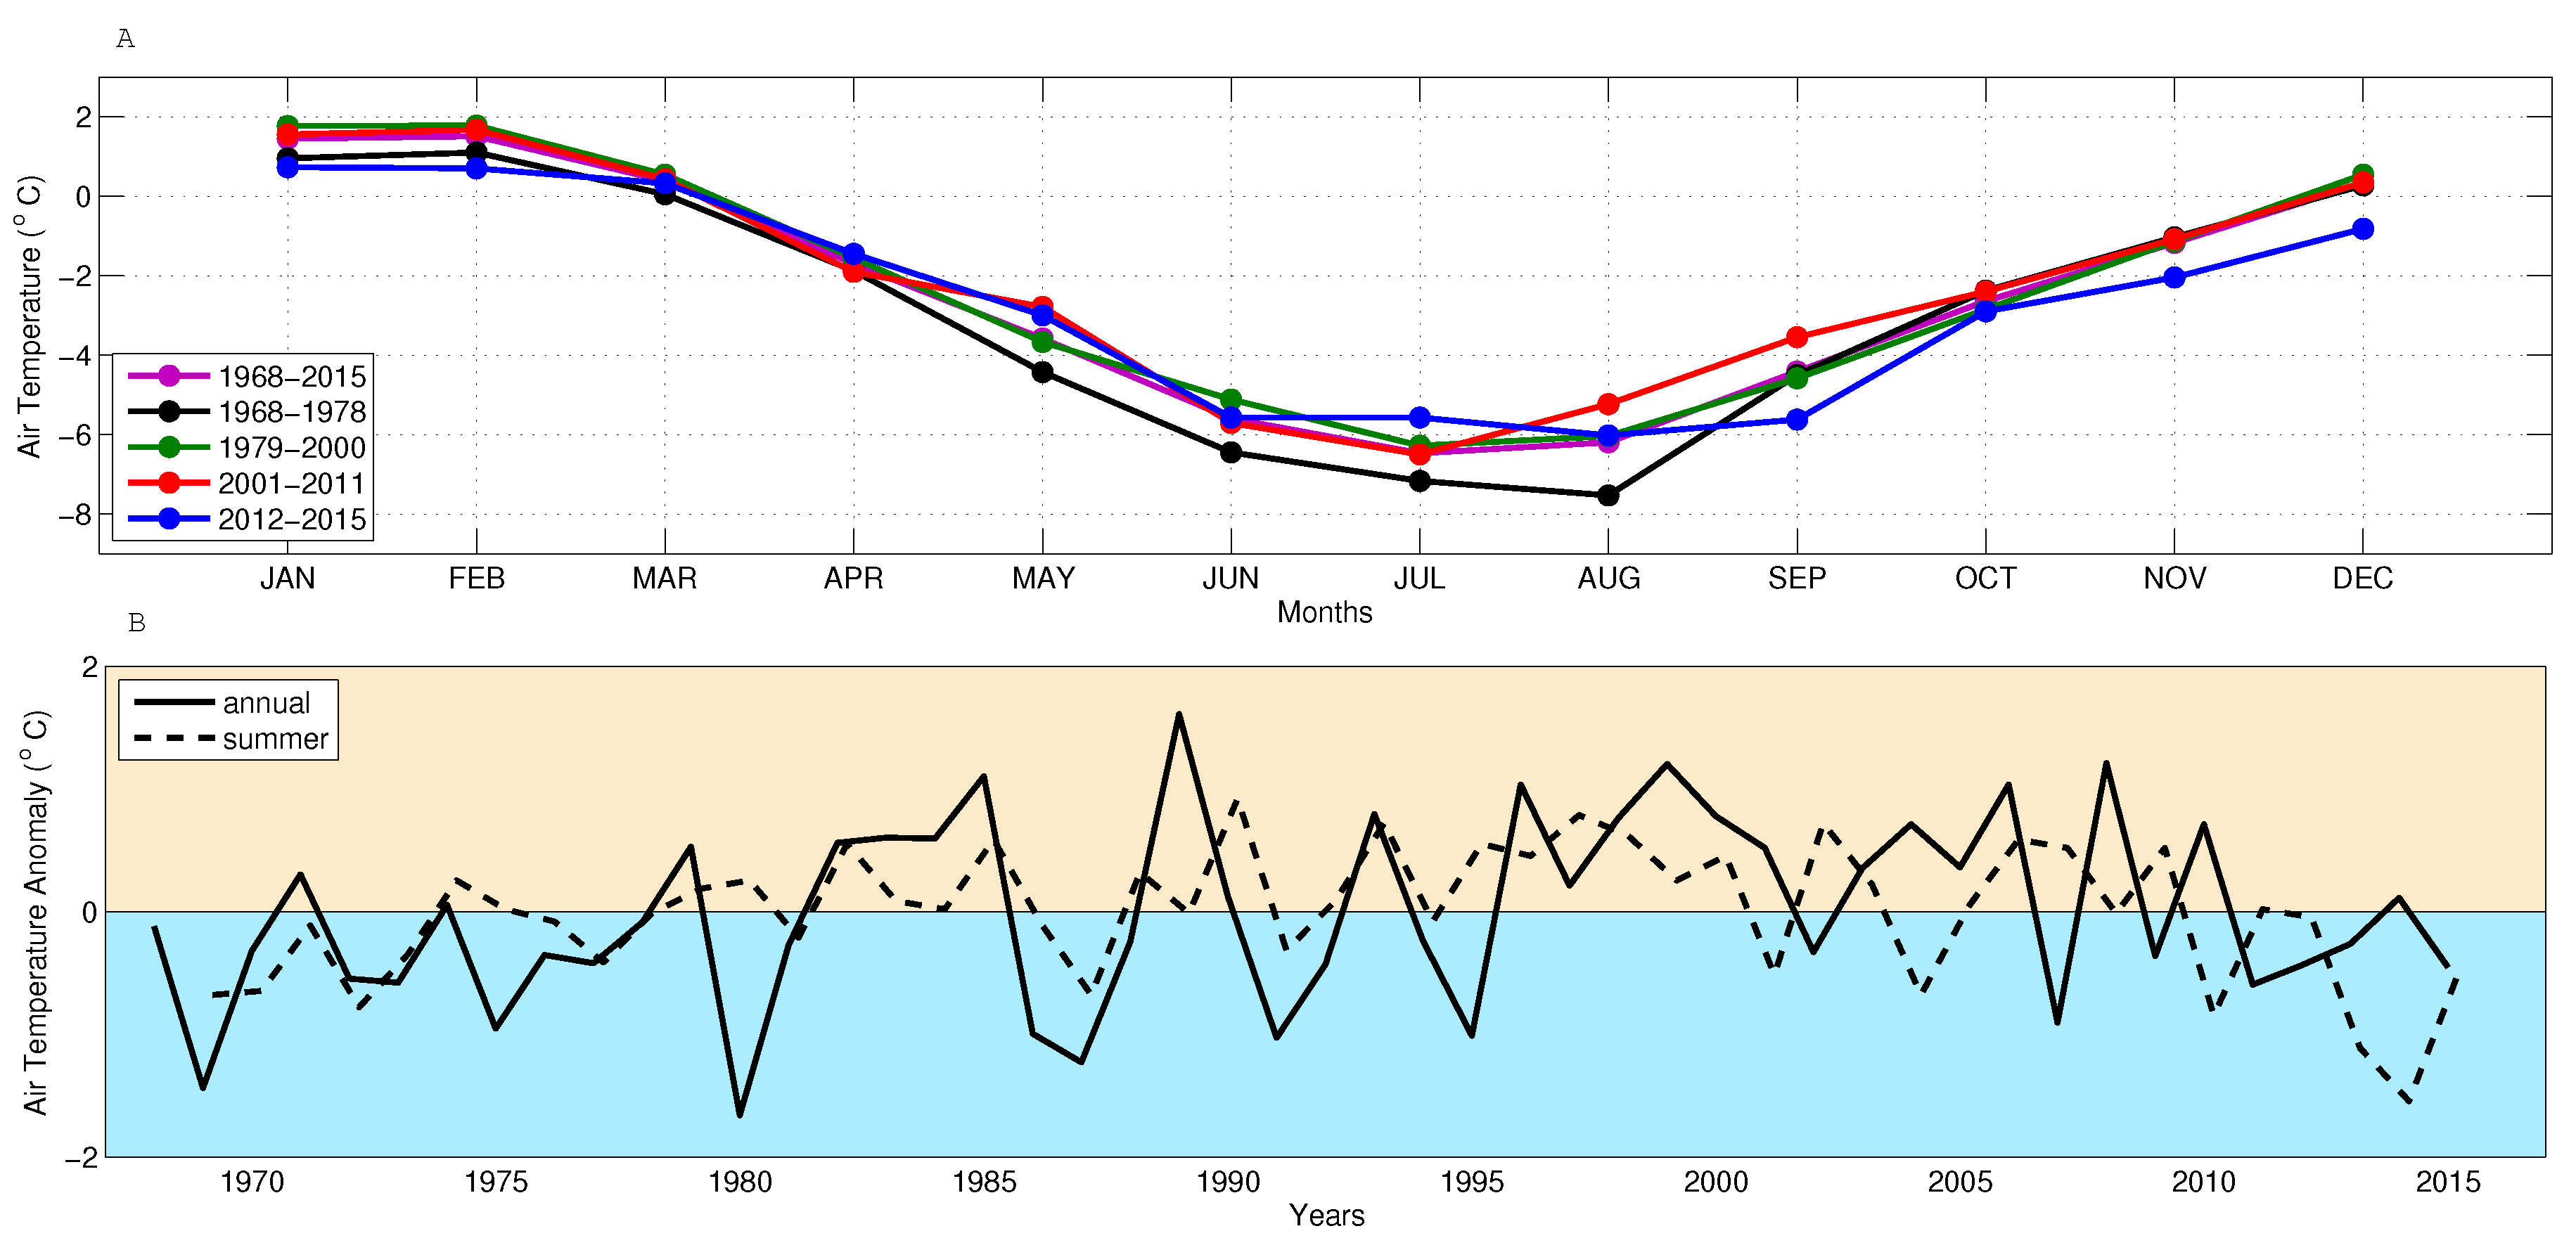
- Arctic and Antarctic Research Institute, St. Petersburg. 2017. Available online: http://www.aari.aq/data/data.php?lang=1&station=0 (accessed on 18 April 2017).
- Hock, R.; de Woul, M.; Radić, V.; Dyurgerov, M. Mountain glaciers and ice caps around Antarctica make a large sea-level rise contribution. Geophys. Res. Lett. 2009, 36, L07501. [Google Scholar] [CrossRef]
- Van den Broeke, M.; Enderlin, E.; Howat, I.; Kuipers Munneke, P.; Noël, B.; van de Berg, W.; van Meijgaard, E.; Wouters, B. On the recent contribution of the Greenland ice sheet to sea level change. Cryosphere 2016, 10, 1933–1946. [Google Scholar] [CrossRef]
- Marinsek, S.; Ermolin, E. 10 year mass balance by glaciological and geodetic methods of Glaciar Bahía del Diablo, Vega Island, Antarctic Peninsula. Ann. Glaciol. 2015, 56, 141–146. [Google Scholar] [CrossRef]
- Simões, J.; Bremer, U.; Aquino, F.; Ferron, F. Morphology and variations of glacial drainage basins in the King George Island ice field, Antarctica. Ann. Glaciol. 1999, 29, 220–224. [Google Scholar] [CrossRef]
- Rückamp, M.; Braun, M.; Suckro, S.; Blindow, N. Observed glacial changes on the King George Island ice cap, Antarctica, in the last decade. Glob. Planet. Chang. 2011, 79, 99–109. [Google Scholar] [CrossRef]
- Osmanoglu, B.; Braun, M.; Hock, R.; Navarro, F. Surface velocity and ice discharge of the ice cap on King George Island, Antarctica. Ann. Glaciol. 2013, 54, 111–119. [Google Scholar] [CrossRef]
- Sobota, I.; Kejna, M.; Araźny, A. Short-term mass changes and retreat of the Ecology and Sphinx glacier system, King George Island, Antarctic Peninsula. Antarct. Sci. 2015, 27, 500–510. [Google Scholar] [CrossRef]
- Cielos, R.R.; de Mata, J.A.; Galilea, A.D.; Alonso, M.Á.; Cielos, P.R.; Valero, F.N. Geomatic methods applied to the study of the front position changes of Johnsons and Hurd Glaciers, Livingston Island, Antarctica, between 1957 and 2013. Earth Syst. Sci. Data 2016, 8, 341–353. [Google Scholar] [CrossRef]
- Molina, C.; Navarro, F.; Calvet, J.; García-Sellés, D.; Lapazaran, J. Hurd Peninsula glaciers, Livingston Island, Antarctica, as indicators of regional warming: ice-volume changes during the period 1956–2000. Ann. Glaciol. 2007, 46, 43–49. [Google Scholar] [CrossRef]
- Bliss, A.; Hock, R.; Cogley, J. A new inventory of mountain glaciers and ice caps for the Antarctic periphery. Ann. Glaciol. 2013, 54, 191–199. [Google Scholar] [CrossRef]
- Braun, M.; Hock, R. Spatially distributed surface energy balance and ablation modelling on the ice cap of King George Island (Antarctica). Glob. Planet. Chang. 2004, 42, 45–58. [Google Scholar] [CrossRef]
- Knap, W.; Oerlemans, J.; Cadée, M. Climate sensitivity of the ice cap of King George Island, South Shetland Islands, Antarctica. Ann. Glaciol. 1996, 23, 154–159. [Google Scholar] [CrossRef]
- Pfeffer, W.T.; Arendt, A.A.; Bliss, A.; Bolch, T.; Cogley, J.G.; Gardner, A.S.; Hagen, J.O.; Hock, R.; Kaser, G.; Kienholz, C.; et al. The Randolph Glacier Inventory: A globally complete inventory of glaciers. J. Glaciol. 2014, 60, 537–552. [Google Scholar] [CrossRef]
- Macheret, Y.; Moskalevsky, M. Study of Lange Glacier on King George Island, Antarctica. Ann. Glaciol. 1999, 29, 202–206. [Google Scholar] [CrossRef]
- Blindow, N.; Suckro, S.; Ruckamp, M.; Braun, M.; Breuer, B.; Saurer, H.; Simoes, J.; Schindler, M.; Lange, M. Geometry and thermal regime of the King George Island ice cap, Antarctica, from GPR and GPS. Ann. Glaciol. 2010, 51, 103–109. [Google Scholar] [CrossRef]
- Bintanja, R. The local surface energy balance of the Ecology Glacier, King George Island, Antarctica: Measurements and modelling. Antarct. Sci. 1995, 7, 315–325. [Google Scholar] [CrossRef]
- Mieczan, T.; Górniak, D.; Świątecki, A.; Zdanowski, M.; Tarkowska-Kukuryk, M.; Adamczuk, M. Vertical microzonation of ciliates in cryoconite holes in Ecology Glacier, King George Island. Pol. Polar Res. 2013, 34, 201–212. [Google Scholar] [CrossRef]
- Zdanowski, M.; Żmuda-Baranowska, M.; Borsuk, P.; Świątecki, A.; Górniak, D.; Wolicka, D.; Jankowska, K.; Grzesiak, J. Culturable bacteria community development in postglacial soils of Ecology Glacier, King George Island, Antarctica. Polar Biol. 2013, 36, 511–527. [Google Scholar] [CrossRef]
- Muser, D. Der Gletscherrückzug auf King George Island, South Shetland Islands Zwischen 1956 und 1992. Eine Digitale Auswertung von Karten, Luftbildern und Satellitendaten. Ph.D. Thesis, Albert-Ludwigs- Universität Freiburg, Freiburg im Breisgau, Germany, 1995. [Google Scholar]
- Birkenmajer, K. Retreat of Ecology Glacier, Admiralty Bay, King George Island (South Shetland Islands, West Antarctica), 1956–2001. Bull. Pol. Acad. Sci. Earth Sci. 2002, 50, 15–29. [Google Scholar]
- Rosa, K.; Vieira, R.; Simões, J. Dinâmica glacial e características sedimentares resultantes na zona proglacial da geleira Ecology-Baía do Almirantado, ilha Rei George-Antártica. Rev. Bras. Geomorfol. 2006, 7, 51–60. [Google Scholar] [CrossRef]
- Battke, Z. Admiralty Bay, 1:50000 Scale (Explanations in Polish); Printed WZKart: Warsaw, Poland, 1980. [Google Scholar]
- Pudełko, R. Two new topographic maps for sites of scientific interest on King George Island, West Antarctica. Pol. Polar Res. 2008, 29, 291–297. [Google Scholar]
- Pudełko, R. Topographic map of the SSSI No. 8, King George Island, West Antarctica. Pol. Polar Res. 2003, 24, 53–60. [Google Scholar]
- Westoby, M.; Brasington, J.; Glasser, N.; Hambrey, M.; Reynolds, J. ‘Structure-from-Motion’ photogrammetry: A low-cost, effective tool for geoscience applications. Geomorphology 2012, 179, 300–314. [Google Scholar] [CrossRef]
- Midgley, N.; Tonkin, T. Reconstruction of former glacier surface topography from archive oblique aerial images. Geomorphology 2017, 282, 18–26. [Google Scholar] [CrossRef]
- Battke, Z. Admiralty Bay. King George Island, 1:50000 Scale; E Romer State Cartographic Publishing House: Warsaw, Poland, 1990. [Google Scholar]
- Berthier, E.; Vincent, C.; Magnússon, E.; Gunnlaugsson, A.; Pitte, P.; Le Meur, E.; Masiokas, M.; Ruiz, L.; Palsson, F.; Belart, J.; et al. Glacier topography and elevation changes derived from Pléiades sub-meter stereo images. Cryosphere 2014, 8, 2275–2291. [Google Scholar] [CrossRef]
- Marti, R.; Gascoin, S.; Berthier, E.; de Pinel, M.; Houet, T.; Laffly, D. Mapping snow depth in open alpine terrain from stereo satellite imagery. Cryosphere 2016, 10, 1361–1380. [Google Scholar] [CrossRef]
- Gabbud, C.; Micheletti, N.; Lane, S. Lidar measurement of surface melt for a temperate Alpine glacier at the seasonal and hourly scales. J. Glaciol. 2015, 61, 963–974. [Google Scholar] [CrossRef]
- Fischer, M.; Huss, M.; Kummert, M.; Hoelzle, M. Application and validation of long-range terrestrial laser scanning to monitor the mass balance of very small glaciers in the Swiss Alps. Cryosphere 2016, 10, 1279–1295. [Google Scholar] [CrossRef]
- Koppes, M.; Hallet, B.; Rignot, E.; Mouginot, J.; Wellner, J.S.; Boldt, K. Observed latitudinal variations in erosion as a function of glacier dynamics. Nature 2015, 526, 100–103. [Google Scholar] [CrossRef] [PubMed]
- Navarro, F.; Glazovsky, A.; Macheret, Y.; Vasilenko, E.; Corcuera, M.; Cuadrado, M. Ice-volume changes (1936–1990) and structure of Aldegondabreen, Spitsbergen. Ann. Glaciol. 2005, 42, 158–162. [Google Scholar] [CrossRef]
- Paul, F.; Haeberli, W. Spatial variability of glacier elevation changes in the Swiss Alps obtained from two digital elevation models. Geophys. Res. Lett. 2008, 35. [Google Scholar] [CrossRef]
- Nuth, C.; Kääb, A. Co-registration and bias corrections of satellite elevation data sets for quantifying glacier thickness change. Cryosphere 2011, 5, 271. [Google Scholar] [CrossRef]
- Falk., U.; Sala, H. Winter melt conditions of the inland ice cap on King George Island, Antarctic Peninsula. Erdkunde 2015, 69, 341–363. [Google Scholar]
- Vieli, A.; Jania, J.; Kolondra, L. The retreat of a tidewater glacier: Observations and model calculations on Hansbreen, Spitsbergen. J. Glaciol. 2002, 48, 592–600. [Google Scholar] [CrossRef]
- Kirkbride, M.; Warren, C. Calving processes at a grounded ice cliff. Ann. Glaciol. 1997, 24, 116–121. [Google Scholar] [CrossRef]
- O’Leary, M.; Christoffersen, P. Calving on tidewater glacier amplified by submarine frontal melting. Cryosphere 2013, 7, 119–128. [Google Scholar] [CrossRef]
- Pętlicki, M.; Ciepły, M.; Jania, J.; Promińska, A.; Kinnard, C. Calving of a tidewater glacier driven by melting at the waterline. J. Glaciol. 2015, 61, 851–863. [Google Scholar] [CrossRef]
- Braun, M.; Saurer, H.; Vogt, S.; Simoes, J.; Gossman, H. The influence of large-scale atmospheric circulation on the surface energy balance of the King George Island ice cap. Int. J. Climatol. 2001, 21, 21–36. [Google Scholar] [CrossRef]
- Moll, A.; Braun, M. Determination of Glacier Velocities on King George Island (Antarctica) by DinSAR. In Proceedings of the International Geoscience and Remote Sensing Symposium (IGARSS 2006), Denver, CO, USA, 31 July–4 August 2006. [Google Scholar]


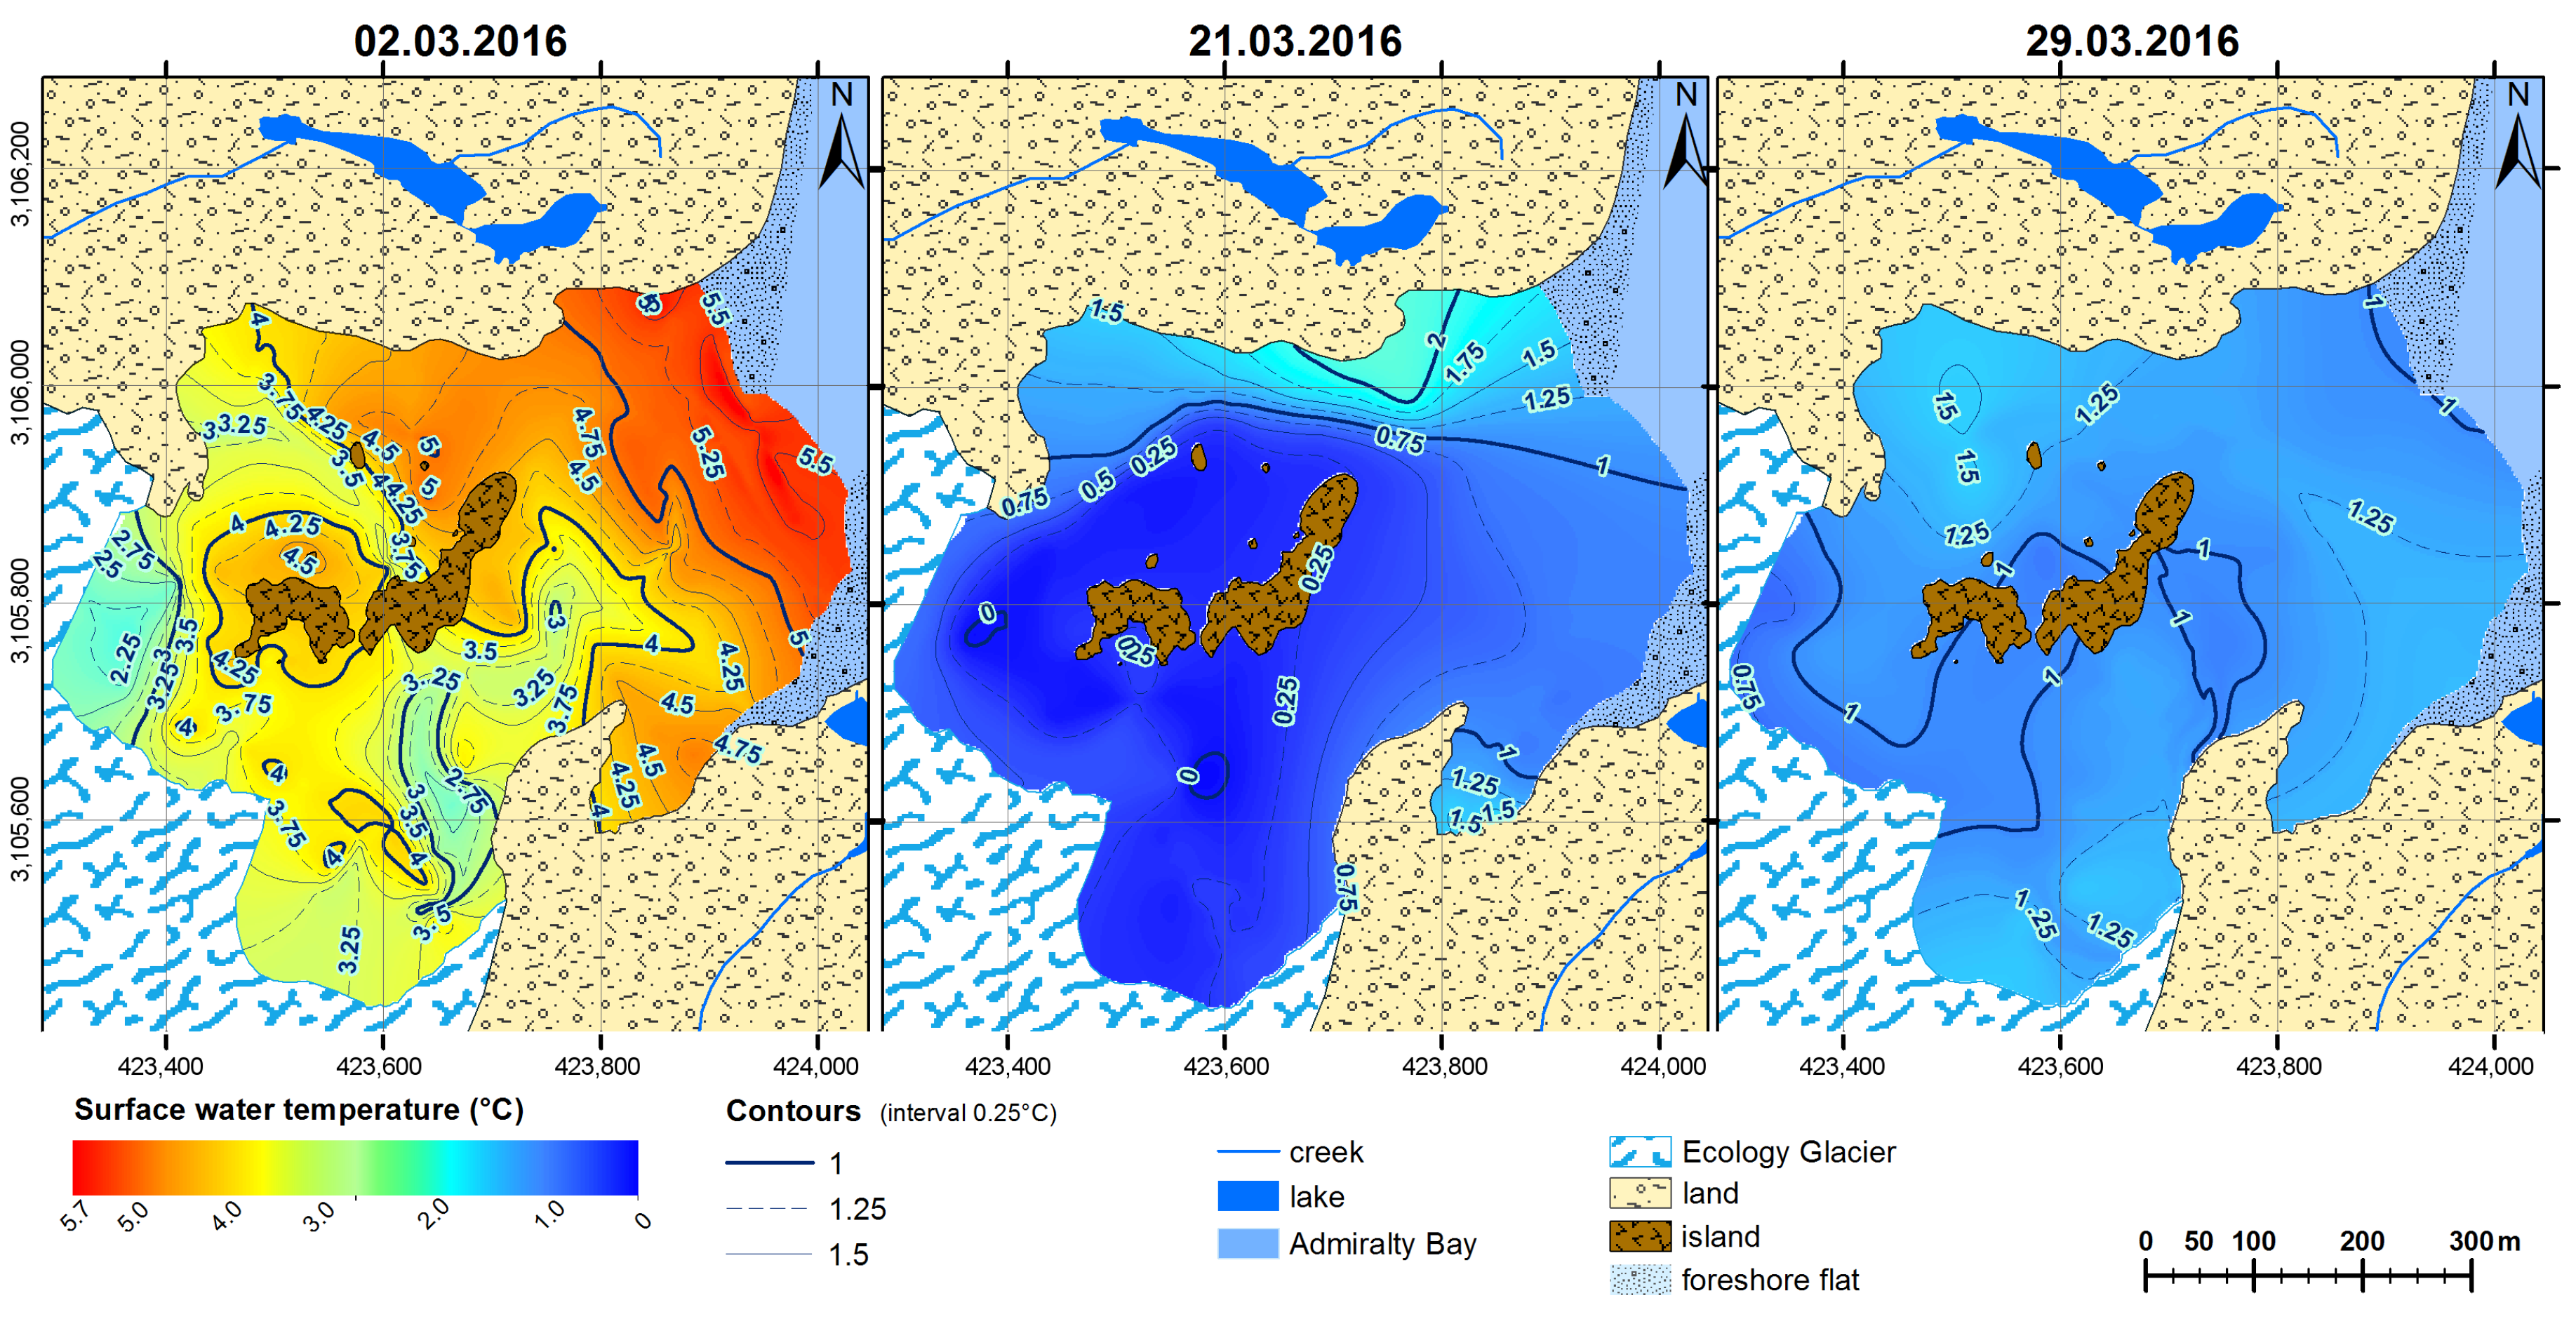
| Date | Track | Number of | Sea Level | Sea Surface | |
|---|---|---|---|---|---|
| Length (m) | Samples | Start (cm) | End (cm) | Temperature (C) | |
| 2 Mar 2016 | 5928 | 5046 | 114 | 110 | 4.41 |
| 17 Mar 2016 | 2293 | 2080 | 120 | 116 | 1.05 |
| 21 Mar 2016 | 4011 | 3938 | 116 | 136 | 0.58 |
| 29 Mar 2016 | 7593 | 4774 | 131 | 112 | 1.16 |
| DEM | Mean Difference (m) | Standard Deviation (m) | Max Difference (m) | Min Difference (m) |
|---|---|---|---|---|
| 2012 | +0.48 | 1.27 | +24.42 | −15.96 |
| 2001 | +1.26 | 6.61 | +27.12 | −53.32 |
| 1979 | +2.87 | 9.70 | +58.85 | −40.71 |
| Period | Mean Ice Elevation Change (m) | Mean Ice Elevation Change Rate (m/Year) |
|---|---|---|
| 2012–2016 | −1.6 ± 1.9 | −0.5 ± 0.6 |
| 2001–2012 | −18.0 ± 5.8 | −1.5 ± 0.5 |
| 1979–2001 | −38.4 ± 9.1 | −1.7 ± 0.4 |
| 1979–2016 | −57.9 ± 10.1 | −1.6 ± 0.3 |
© 2017 by the authors. Licensee MDPI, Basel, Switzerland. This article is an open access article distributed under the terms and conditions of the Creative Commons Attribution (CC BY) license (http://creativecommons.org/licenses/by/4.0/).
Share and Cite
Pętlicki, M.; Sziło, J.; MacDonell, S.; Vivero, S.; Bialik, R.J. Recent Deceleration of the Ice Elevation Change of Ecology Glacier (King George Island, Antarctica). Remote Sens. 2017, 9, 520. https://doi.org/10.3390/rs9060520
Pętlicki M, Sziło J, MacDonell S, Vivero S, Bialik RJ. Recent Deceleration of the Ice Elevation Change of Ecology Glacier (King George Island, Antarctica). Remote Sensing. 2017; 9(6):520. https://doi.org/10.3390/rs9060520
Chicago/Turabian StylePętlicki, Michał, Joanna Sziło, Shelley MacDonell, Sebastián Vivero, and Robert J. Bialik. 2017. "Recent Deceleration of the Ice Elevation Change of Ecology Glacier (King George Island, Antarctica)" Remote Sensing 9, no. 6: 520. https://doi.org/10.3390/rs9060520
APA StylePętlicki, M., Sziło, J., MacDonell, S., Vivero, S., & Bialik, R. J. (2017). Recent Deceleration of the Ice Elevation Change of Ecology Glacier (King George Island, Antarctica). Remote Sensing, 9(6), 520. https://doi.org/10.3390/rs9060520