Abstract
Aerosol Optical Depth (AOD) is crucial for urban air quality assessment. However, the frequently used moderate-resolution imaging spectroradiometer (MODIS) AOD product at 10 km resolution is too coarse to be applied in a regional-scale study. Gaofen-1 (GF-1) wide-field-of-view (WFV) camera data, with high spatial and temporal resolution, has great potential in estimation of AOD. Due to the lack of shortwave infrared (SWIR) band and complex surface reflectivity brought from high spatial resolution, it is difficult to retrieve AOD from GF-1 WFV data with traditional methods. In this paper, we propose an improved AOD retrieval algorithm for GF-1 WFV data. The retrieved AOD has a spatial resolution of 160 m and covers all land surface types. Significant improvements in the algorithm include: (1) adopting an improved clear sky composite method by using the MODIS AOD product to identify the clearest days and correct the background atmospheric effect; and (2) obtaining local aerosol models from long-term CIMEL sun-photometer measurements. Validation against MODIS AOD and ground measurements showed that the GF-1 WFV AOD has a good relationship with MODIS AOD (R2 = 0.66; RMSE = 0.27) and ground measurements (R2 = 0.80; RMSE = 0.25). Nevertheless, the proposed algorithm was found to overestimate AOD in some cases, which will need to be improved upon in future research.
1. Introduction
As an important component of atmosphere, aerosols play a vital role in climate change, earth radiation budget and air quality [1,2,3]. Atmospheric aerosol is a major source of uncertainty in the global climate system for its high spatial and temporal variability and short lifetime [4]. Satellite remote sensing provides a convenient way to estimate aerosol optical properties in space and time [5]. Numerous satellite data-based aerosol retrieval algorithms have been developed in recent years [6,7,8,9].
A key physical parameter which can be retrieved from satellite data is Aerosol Optical Depth (AOD), which is defined as the integrated light extinction over vertical path through the atmosphere. AOD has been widely applied in many aspects such as atmospheric correction of satellite images [6], air quality assessment [10] and haze pollution monitoring [11]. To estimate AOD from satellite data, the core problem is to separate the atmospheric and surface scattering contributions from the total signal observed by satellite. Generally, there exist two uncertain factors in the separating process: the determinations of aerosol model and surface reflectance. Aerosol model is usually derived from long-term AErosol RObotic NETwork (AERONET) or other regional ground measurements [12,13]. Many methods were successively developed in the estimation of surface reflectance from satellite observation. One of the earliest and more classic techniques is called Dark Dense Vegetation (DDV) or Dark Target (DT), a method which utilizes the stable correlations between visible bands and the shortwave infrared (SWIR) band at 2.1 µm [14]. The method and its improved version have been successfully applied in the AOD retrieval of moderate-resolution imaging spectroradiometer (MODIS) [15,16], Landsat TM [17,18], and many other sensors [19,20,21]. The DT method shows a good performance over dark surfaces (e.g., dense vegetation), but tends to overestimate AOD over bright surfaces (especially urbanized areas) [22,23]. Another widely adopted technique is called the Deep Blue (DB) method, which is based on the assumption that the surface reflectance keeps unchanged or changes little during a specified period. The DB method is able to retrieve AOD over bright surfaces (e.g., desert, arid/semiarid and urban regions). The DB algorithms have been developed for many satellite sensors such as SeaWiFS [24], MODIS [25,26] and GOCI [27].
With the rapid growth of industrialization and urbanization in China during recent years, aerosol pollution problems such as haze and high particulate matter concentration have become increasingly severe for most regions of China [28,29]. Valid and high resolution AOD retrieval covering all land surface types (including urban areas) is very important for regional air quality monitoring in China. However, retrieving AOD over urban areas in China remains a challenging problem. The primary difficulty is the estimation of surface reflectance. The DT method is limited over urban areas; moreover, it is difficult to acquire completely “clear” images when using the DB method to establish surface reflectance database over urban areas with heavy aerosol loadings. Furthermore, the determination of the aerosol model is also difficult in many urban regions of China due to the lack of enough ground measurements and complex aerosol sources.
Most of the currently released AOD products (e.g., MODIS, SeaWiFS, MISR and MERIS) are usually at a spatial resolution of a few kilometers, which is too coarse for regional-scale applications. High spatial resolution sensors such as the Landsat series usually have a long re-visiting period (16 days), which makes it more difficult in terms of algorithm design. Gaofen-1 (GF-1) satellite, launched by the Chinese government in April 2013, has four Wide-Field-of-View (WFV) cameras onboard. Four WFV cameras provide multi-spectral images from visible to near-infrared (NIR) band, with a high spatial resolution of 16 m and a re-visiting period of 4 days. Although the absence of SWIR band makes it difficult to retrieve AOD using the DT method, the high temporal resolution makes it possible to use the DB method.
In this paper, we attempted to retrieve high resolution AOD (160 m × 160 m) from GF-1 WFV data by using an improved DB method. The algorithm was implemented over Wuhan, an urban area in central China. In the proposed algorithm, surface reflectance of GF-1 WFV was estimated by establishing a seasonal surface reflectance database with the support of the MODIS AOD product. An aerosol model was determined by statistical analysis of long-term ground measurements. To evaluate the retrieved results from the proposed algorithm, the spatial distribution of retrieved AOD was presented and analyzed in detail, and the retrieved results were compared with corresponding MODIS AOD and ground measurements respectively. Finally, the performance and limitations of the algorithm were also discussed.
2. Study Area and Datasets
2.1. Study Area
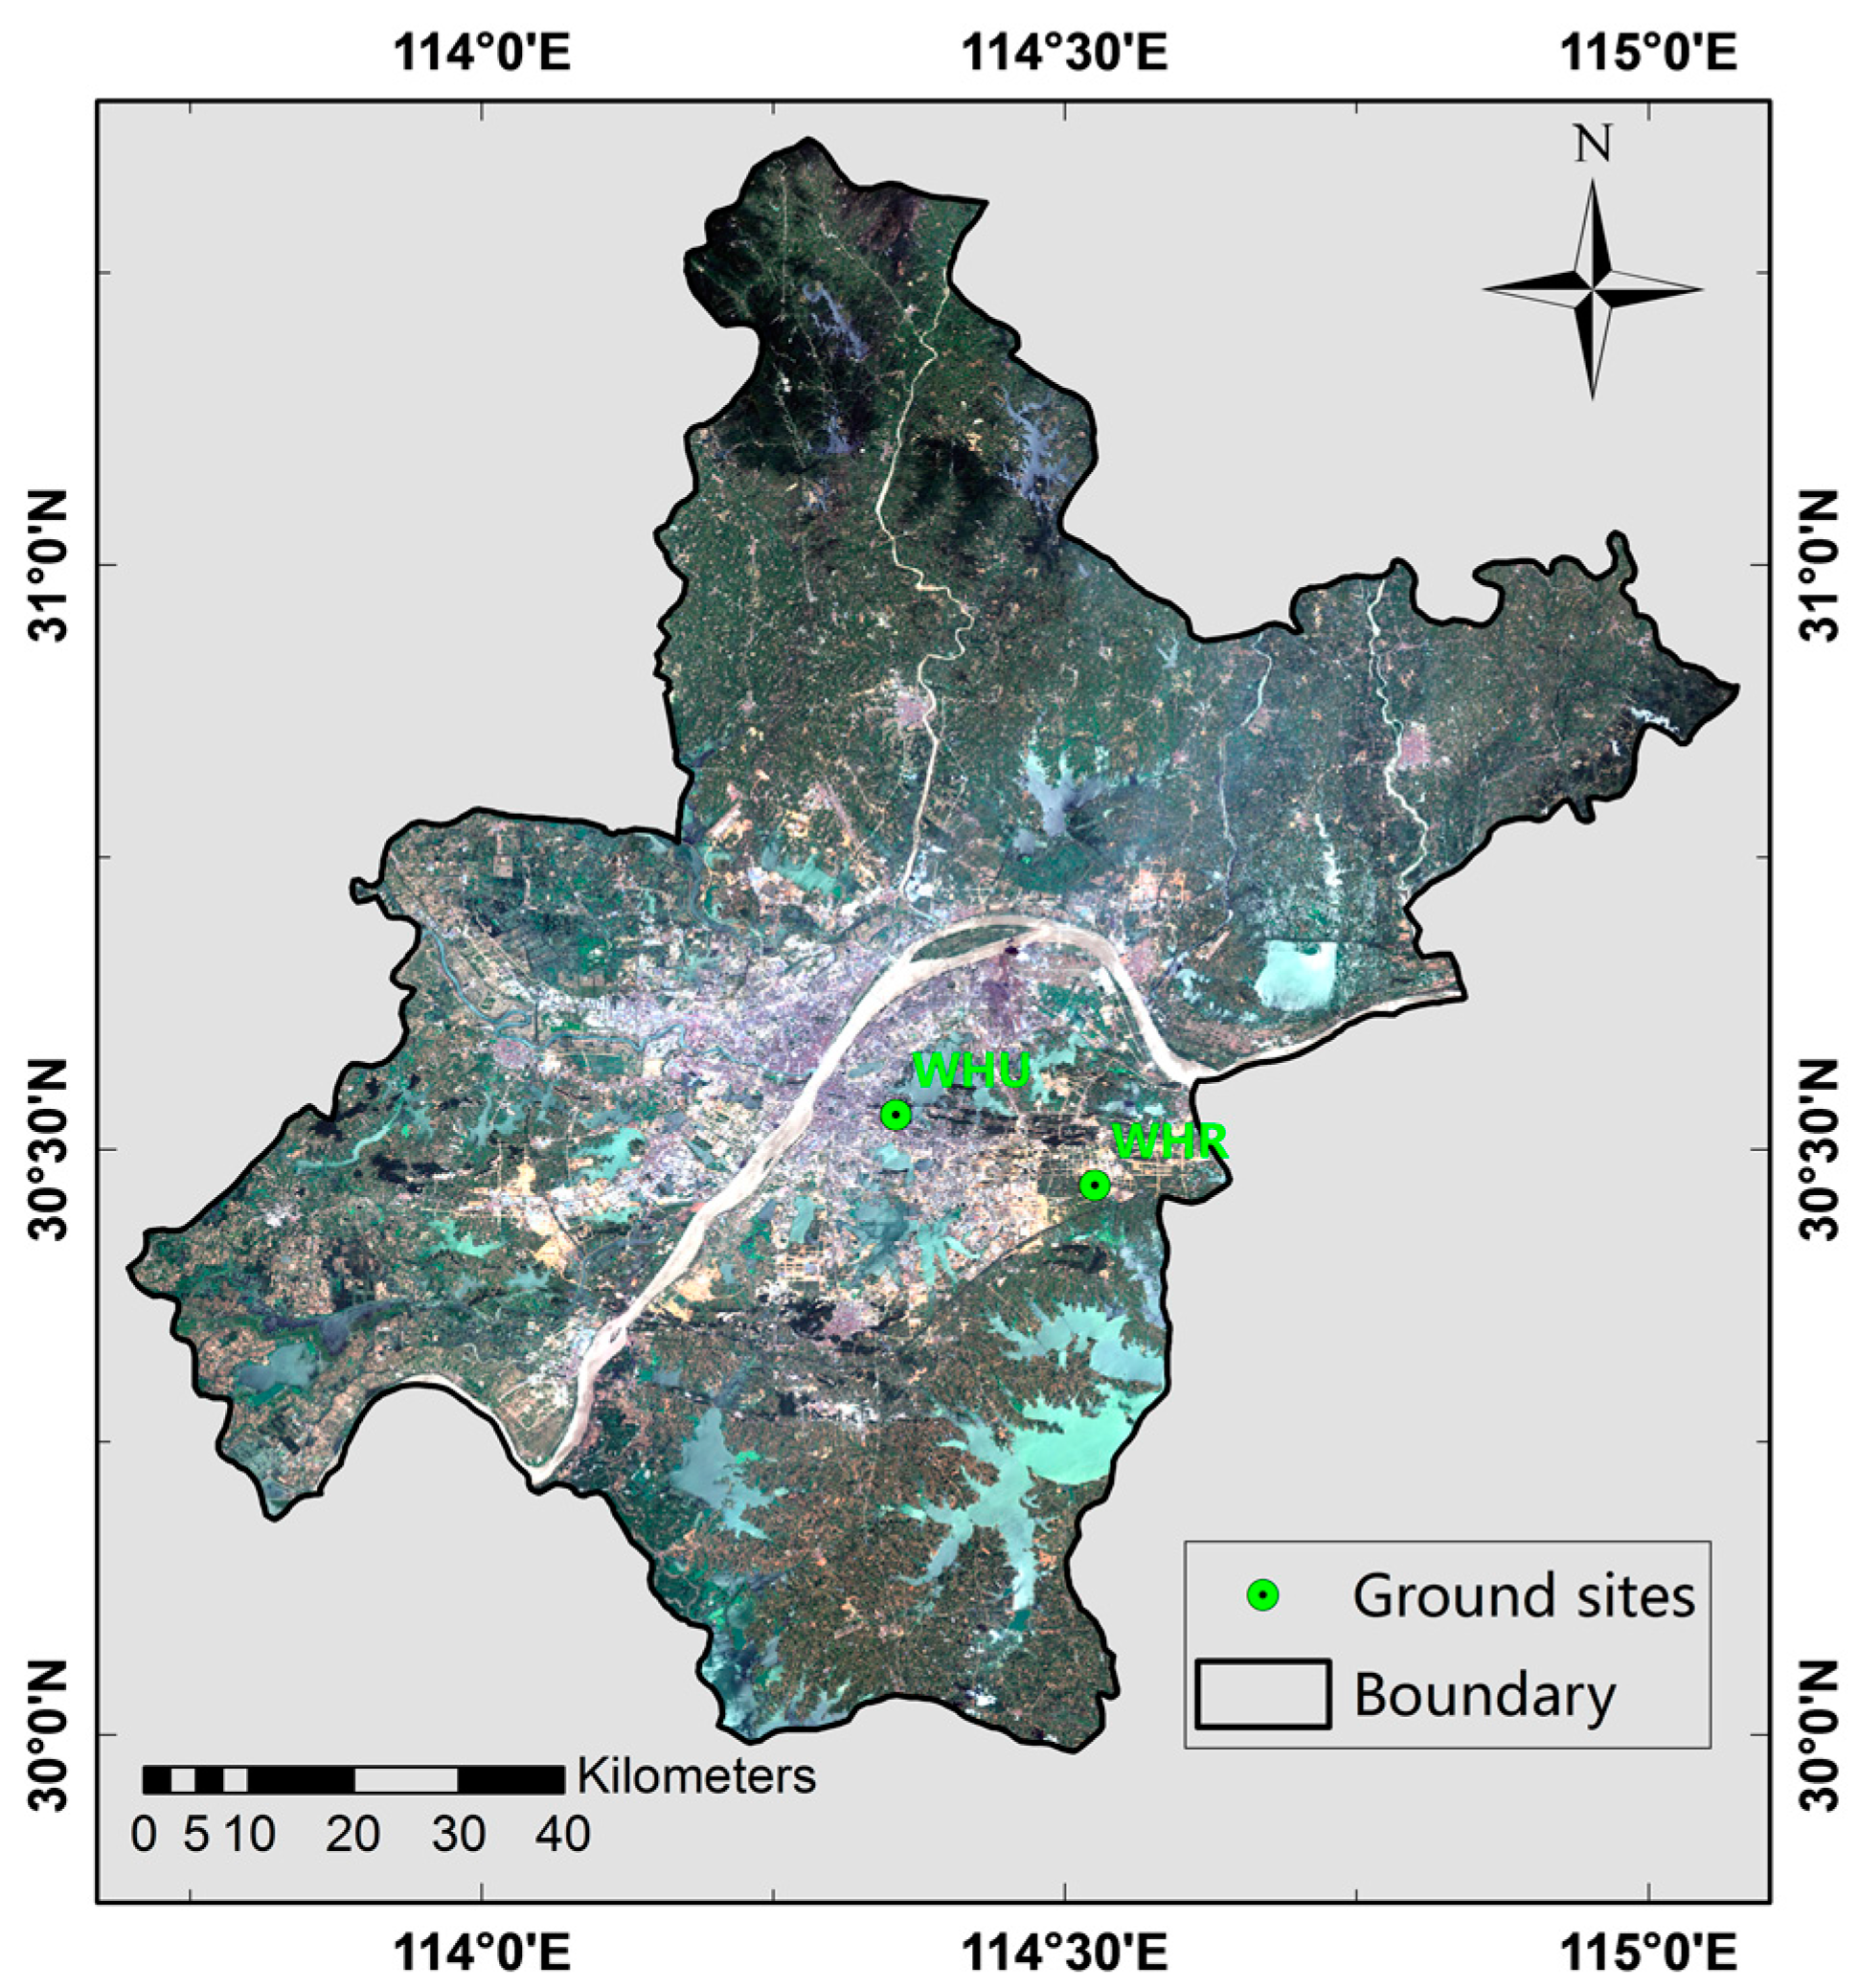
Wuhan (113°41′E–115°05′E, 29°58′N–31°22′N), provincial capital of Hubei province, is the largest city in central China (Figure 1). It is situated on the middle-lower Yangtze Plain and eastern Jianghan Plain, with two large rivers (Yangtze River and Han River) flowing through the main city. As a significant regional economic center in central China, Wuhan has a population of more than ten million, and covers an area of about 8594 km2. According to the classification result from GF-1 WFV data in Wuhan, the built-up area and water occupy about 23% and 15% of the total area, respectively. With the rapid growth of urbanization and industrialization, Wuhan has been suffering from severe air pollution in recent years, including high particulate matter concentrations and haze pollution [30,31]. The annual mean AOD at 500 nm over Wuhan is up to 1.0, and the region is mainly populated with fine-mode particles [32].
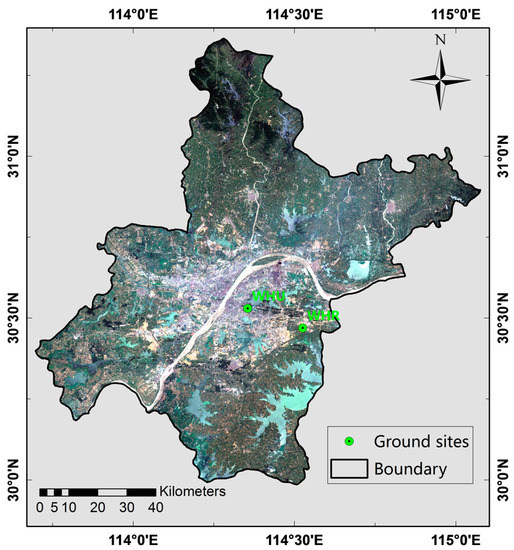
Figure 1.
Geolocation of Wuhan city shown by Gaofen-1 Wide-Field-of-View (GF-1 WFV) image (RGB composited).
2.2. Datasets
2.2.1. Gaofen-1 Wide-Field-of-View (GF-1 WFV) Data
GF-1 WFV data are provided from four WFV cameras onboard the GF-1 satellite, with a spatial resolution of 16 m and a temporal resolution of 4 days. The detailed characteristics of GF-1 WFV instruments are summarized in Table 1. Here we collected all the available GF-1 WFV data over Wuhan from July 2013 to January 2016 (download from http://www.cresda.com/CN/). All data need to be well pre-processed before beginning the AOD retrieval process. The pre-processes include geometric correction, image cutting and mosaic, and radiometric calibration. The accuracy requirement of geometric correction is 1~2 pixels. The accuracy and stability of radiometric calibration is crucial in the AOD retrieval using satellite instruments, especially for GF-1 WFV cameras without on-board calibration. Feng et al. [33] performed a cross-calibration of GF-1 WFV cameras using Landsat 8 Operational Land Imager (OLI) images. Validations with satellite data and in situ measurements showed that the calibration uncertainty is ~8%. The calibration coefficients from the work by Feng et al. were adopted in this paper. In addition, according to the research by Li et al. [34], the signal-to-noise ratio (SNR) of GF-1 WFV cameras at four bands are 294, 125, 77 and 34 respectively, which are slightly lower than the SNR of corresponding MODIS bands. However, considering the difference in spatial resolution, the SNR of GF-1 WFV cameras could have an obvious improvement when resampled to a resolution of 160 m. Therefore, the radiometric performance of GF-1 WFV cameras is in a good condition and could meet the requirement in the AOD retrieval.

Table 1.
Characteristics of WFV (Wide-Field-of-View) cameras aboard on Gaofen-1 satellite.
2.2.2. Moderate-Resolution Imaging Spectroradiometer (MODIS) Aerosol Optical Depth (AOD) Data
The AOD data, derived from MODIS sensors onboard Terra and Aqua, are provided by two independent algorithms (DT and DB) at a nominal spatial resolution of 10 km × 10 km (MOD04 for Terra and MYD04 for Aqua, available from https://ladsweb.nascom.nasa.gov/search/index.html). The recent version of the MODIS AOD product has been updated to Collection 6. As the DT retrieval cannot provide accurate results over urban areas, here we choose MODIS DB AOD in the research for its expansion of spatial coverage over urban areas and improved retrieval accuracy [26]. The spatial coverage of MODIS DB retrieval can reach up to 100% over the Wuhan region in cloudless conditions, which makes it suitable to be used to evaluate the average aerosol loading and its spatial variation. Corresponding to the overpassing time of GF-1 (10:30 local solar time), all MODIS DB AOD data from Terra (MOD04) over Wuhan during 2013–2016 were collected; and then the regional average AOD, its standard deviation and spatial coverage were calculated to assist the automatic selection of GF-1 WFV images in a clean and cloudless condition.
2.2.3. Ground Measurements
Ground measurements from a Cimel sun photometer CE-318 and handheld MICROTOPS-II sun photometer were included in the research. The information of the two instruments is summarized in Table 2, and the geolocation is shown in Figure 1. The sun photometer CE-318 was installed at the campus of Wuhan University, an urban site of Wuhan (30°32′N, 114°21′E, named as WHU here). The instrument provides a long-term observation of aerosols over Wuhan since 2007. The detailed analysis of observation results from the instrument has been described in Wang et al. [32]. The MICROTOPS-II sun photometer was used to measure AOD at a rural site of Wuhan (30°28′N, 114°32′E, named as WHR here) during December 2014 to June 2015. Multiyear observation results from WHU were used to analyze the aerosol model over Wuhan. Measurements from both WHU and WHR were used to evaluate the algorithm accuracy.
Table 2.
The list of input variables used to calculate the look-up table.
3. AOD Retrieval Algorithm
The basic principle of AOD retrieval algorithm is based on radiative transfer theory. Assuming a lambertian surface under a plane-parallel atmosphere, the reflectance at the top of atmosphere (TOA) can be expressed by the following equation [35]:
where is solar zenith angle, is view zenith angle, is relative azimuth angle, λ represents the corresponding sensor band, is the apparent reflectance, is the gaseous transmission, is the atmospheric path reflectance (Rayleigh and aerosol), is the spherical albedo of the atmosphere, and correspond to the downward and upward atmospheric transmission respectively, and is the Lambertian surface reflectance.
To solve the radiative transfer equation, a radiative transfer model Second Simulation of the Satellite Signal in the Solar Spectrum (6S) was adopted in the study [35]. Given specific band, view geometry, atmospheric model, AOD, aerosol type and surface reflectance, the TOA reflectance can be simulated by 6S according to the calculation of three key parameters: . For satellite remotely sensed data, if aerosol type and surface reflectance are determined, AOD can be estimated by comparing measured and simulated TOA reflectance.
Generally, in order to speed up the calculation process, the Look-Up Table (LUT) technique is adopted. The LUT for AOD retrieval is a multidimensional data table, which contains pre-calculated parameters, , under specific view geometry, atmospheric model, AOD, aerosol type and surface reflectance. The detailed set of intervals and ranges for input variables in the LUT is listed in Table 3. Utilizing the pre-calculated LUT, the TOA reflectance for any given pixel can be simulated by linear/nonlinear interpolation between the neighboring bins for geometry, AOD and surface reflectance.
Table 3.
The list of input variables used to calculate the look-up table.
Retrieving AOD from satellite data requires an accurate determination of surface reflectance and local aerosol type. As GF-1 WFV cameras do not have a SWIR band, it is difficult to estimate the surface reflectance from GF-1 WFV data using the DT method. However, a re-visiting period of 4 days makes it possible to estimate the surface reflectance from GF-1 WFV data using the DB method. By compositing the clearest GF-1 WFV images over Wuhan during a season, the seasonal surface reflectance of GF-1 WFV data can be determined. Based on the aerosol optical properties derived from long-term ground observations over Wuhan, aerosol types from each season and different AOD ranges are determined by statistical analysis.
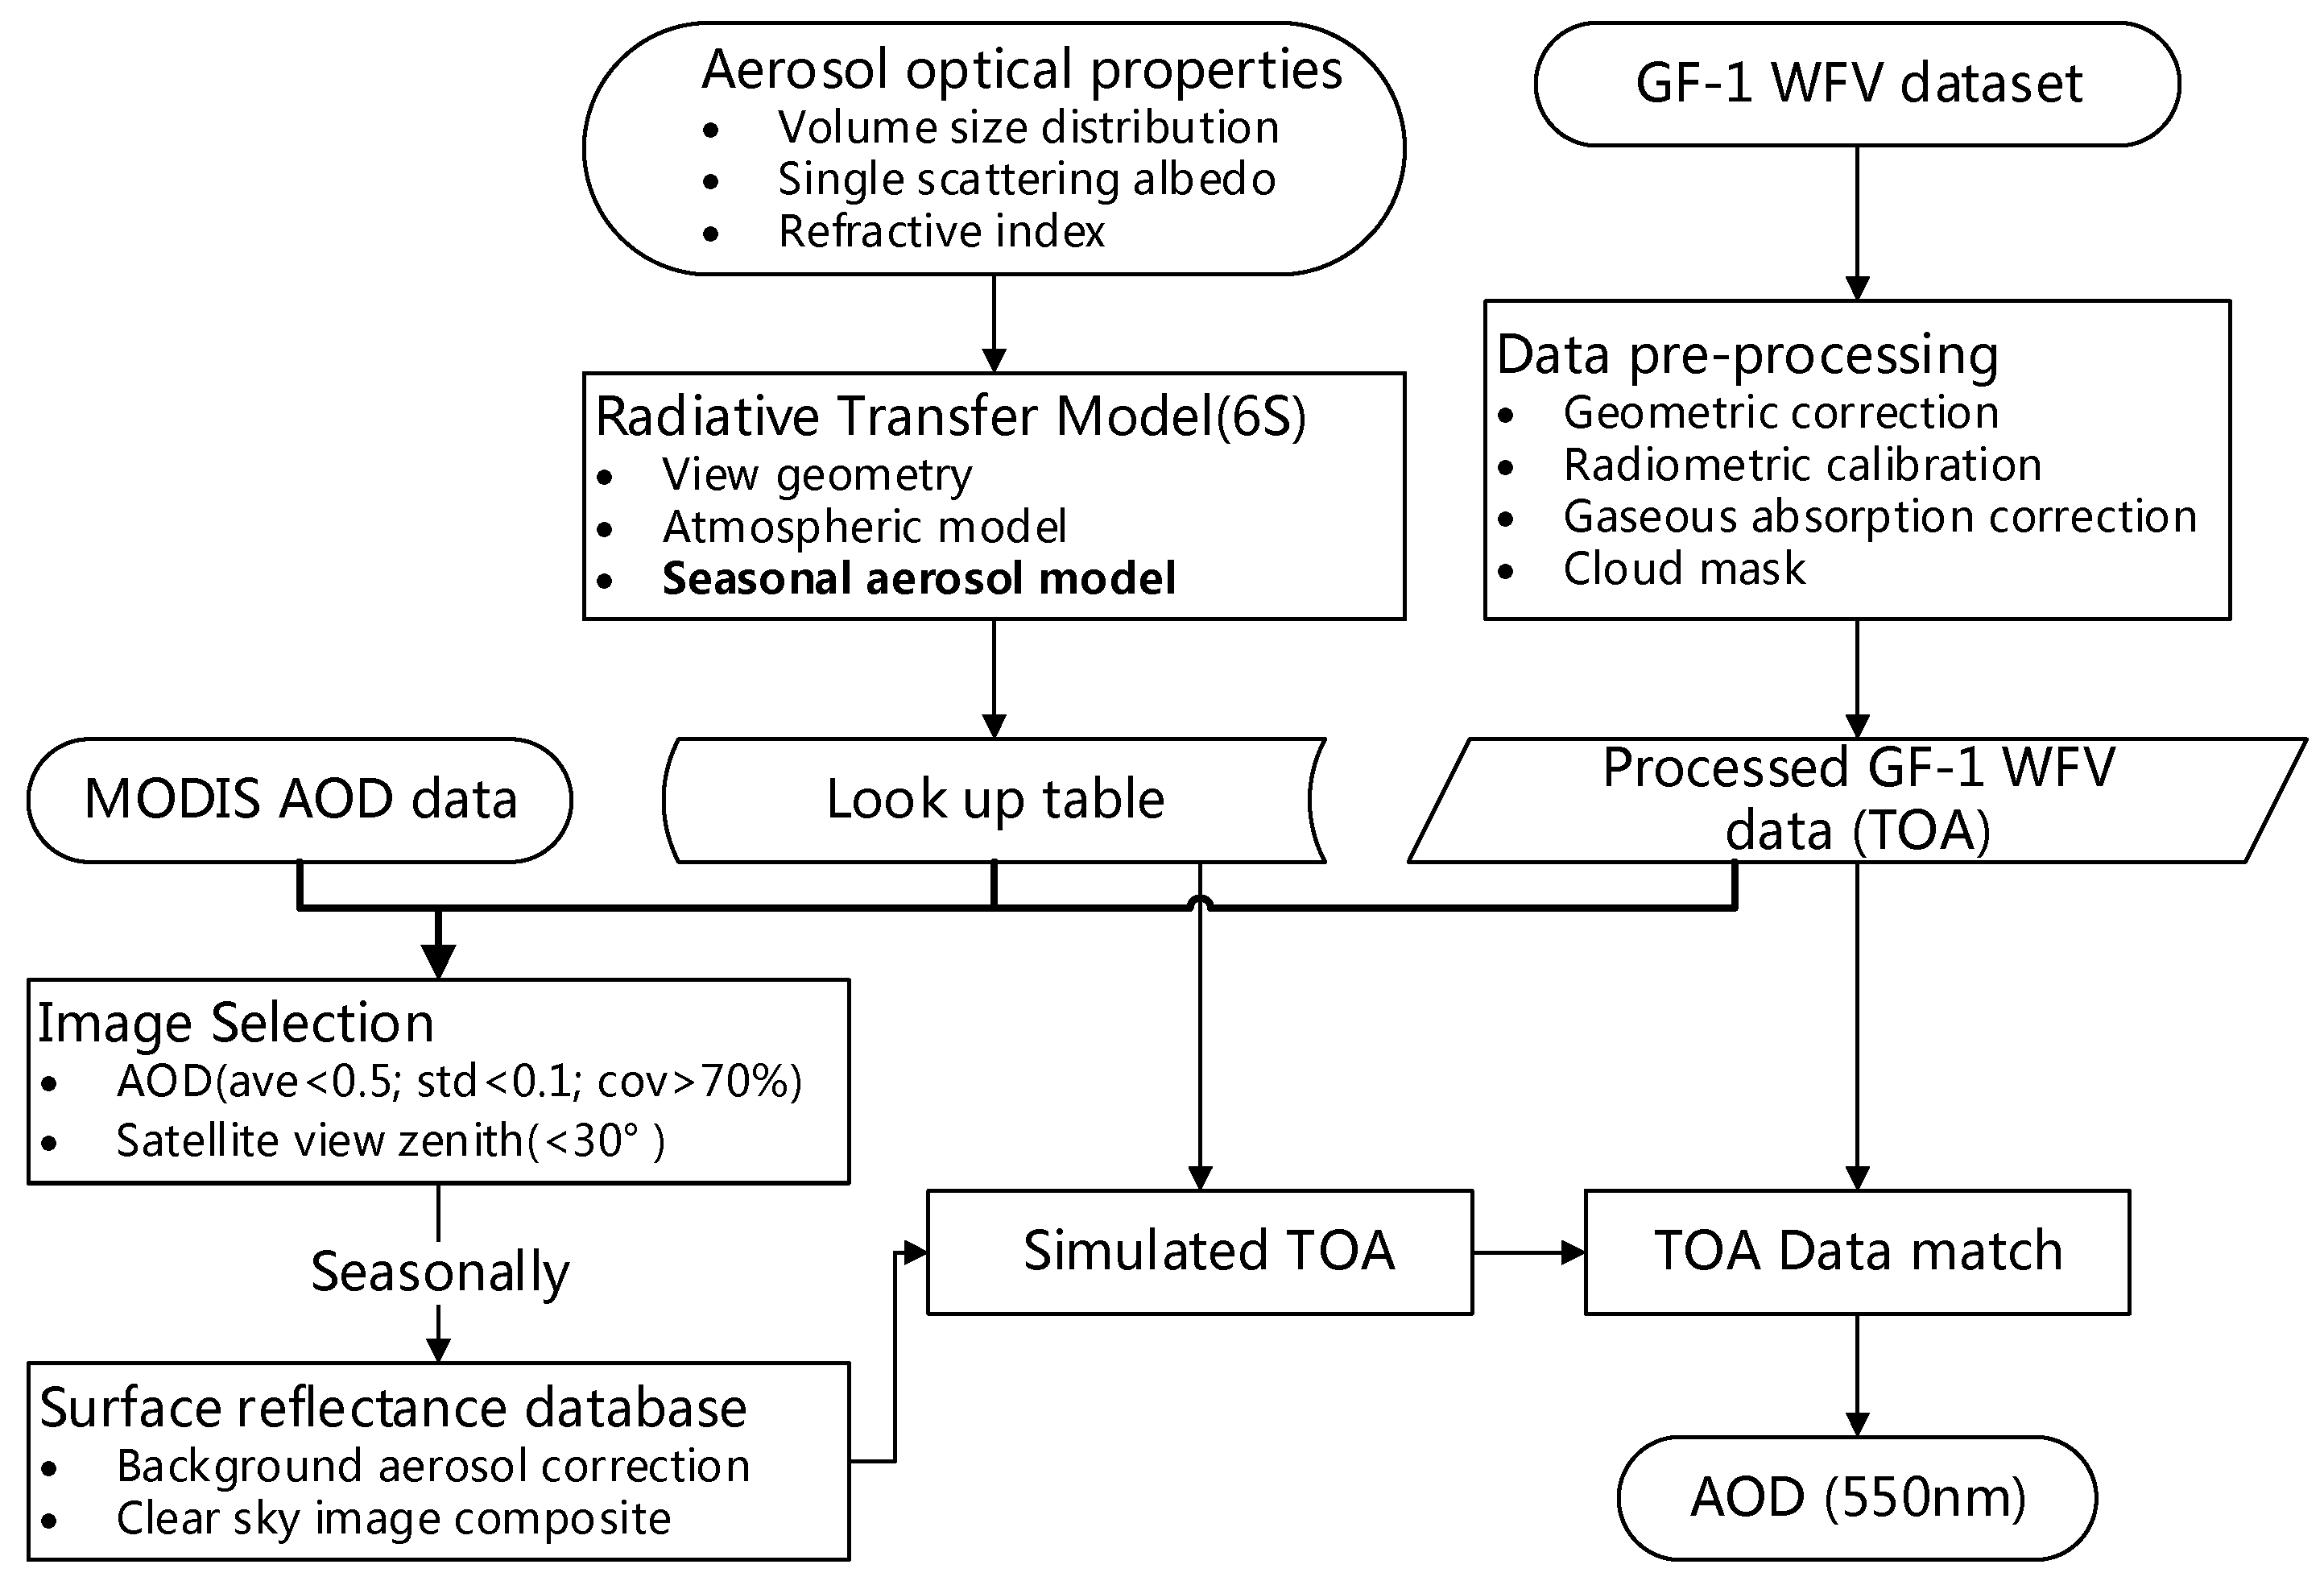
A complete flowchart of the GF-1 WFV AOD retrieval algorithm is shown in Figure 2. The main processes include: pre-process of GF-1 WFV data; calculation of LUT containing local aerosol types and establishment of surface reflectance database. According to the LUT and surface reflectance database established for GF-1 WFV cameras, the TOA reflectance at any geometry and AOD can be simulated. Thus, AOD at 550 nm can be estimated by matching the measured and simulated TOA reflectance.

Figure 2.
Flowchart of AOD retrieval algorithm for GF-1 WFV data. Ave, std and cov represent average value, standard deviation and spatial coverage of MODIS AOD, respectively.
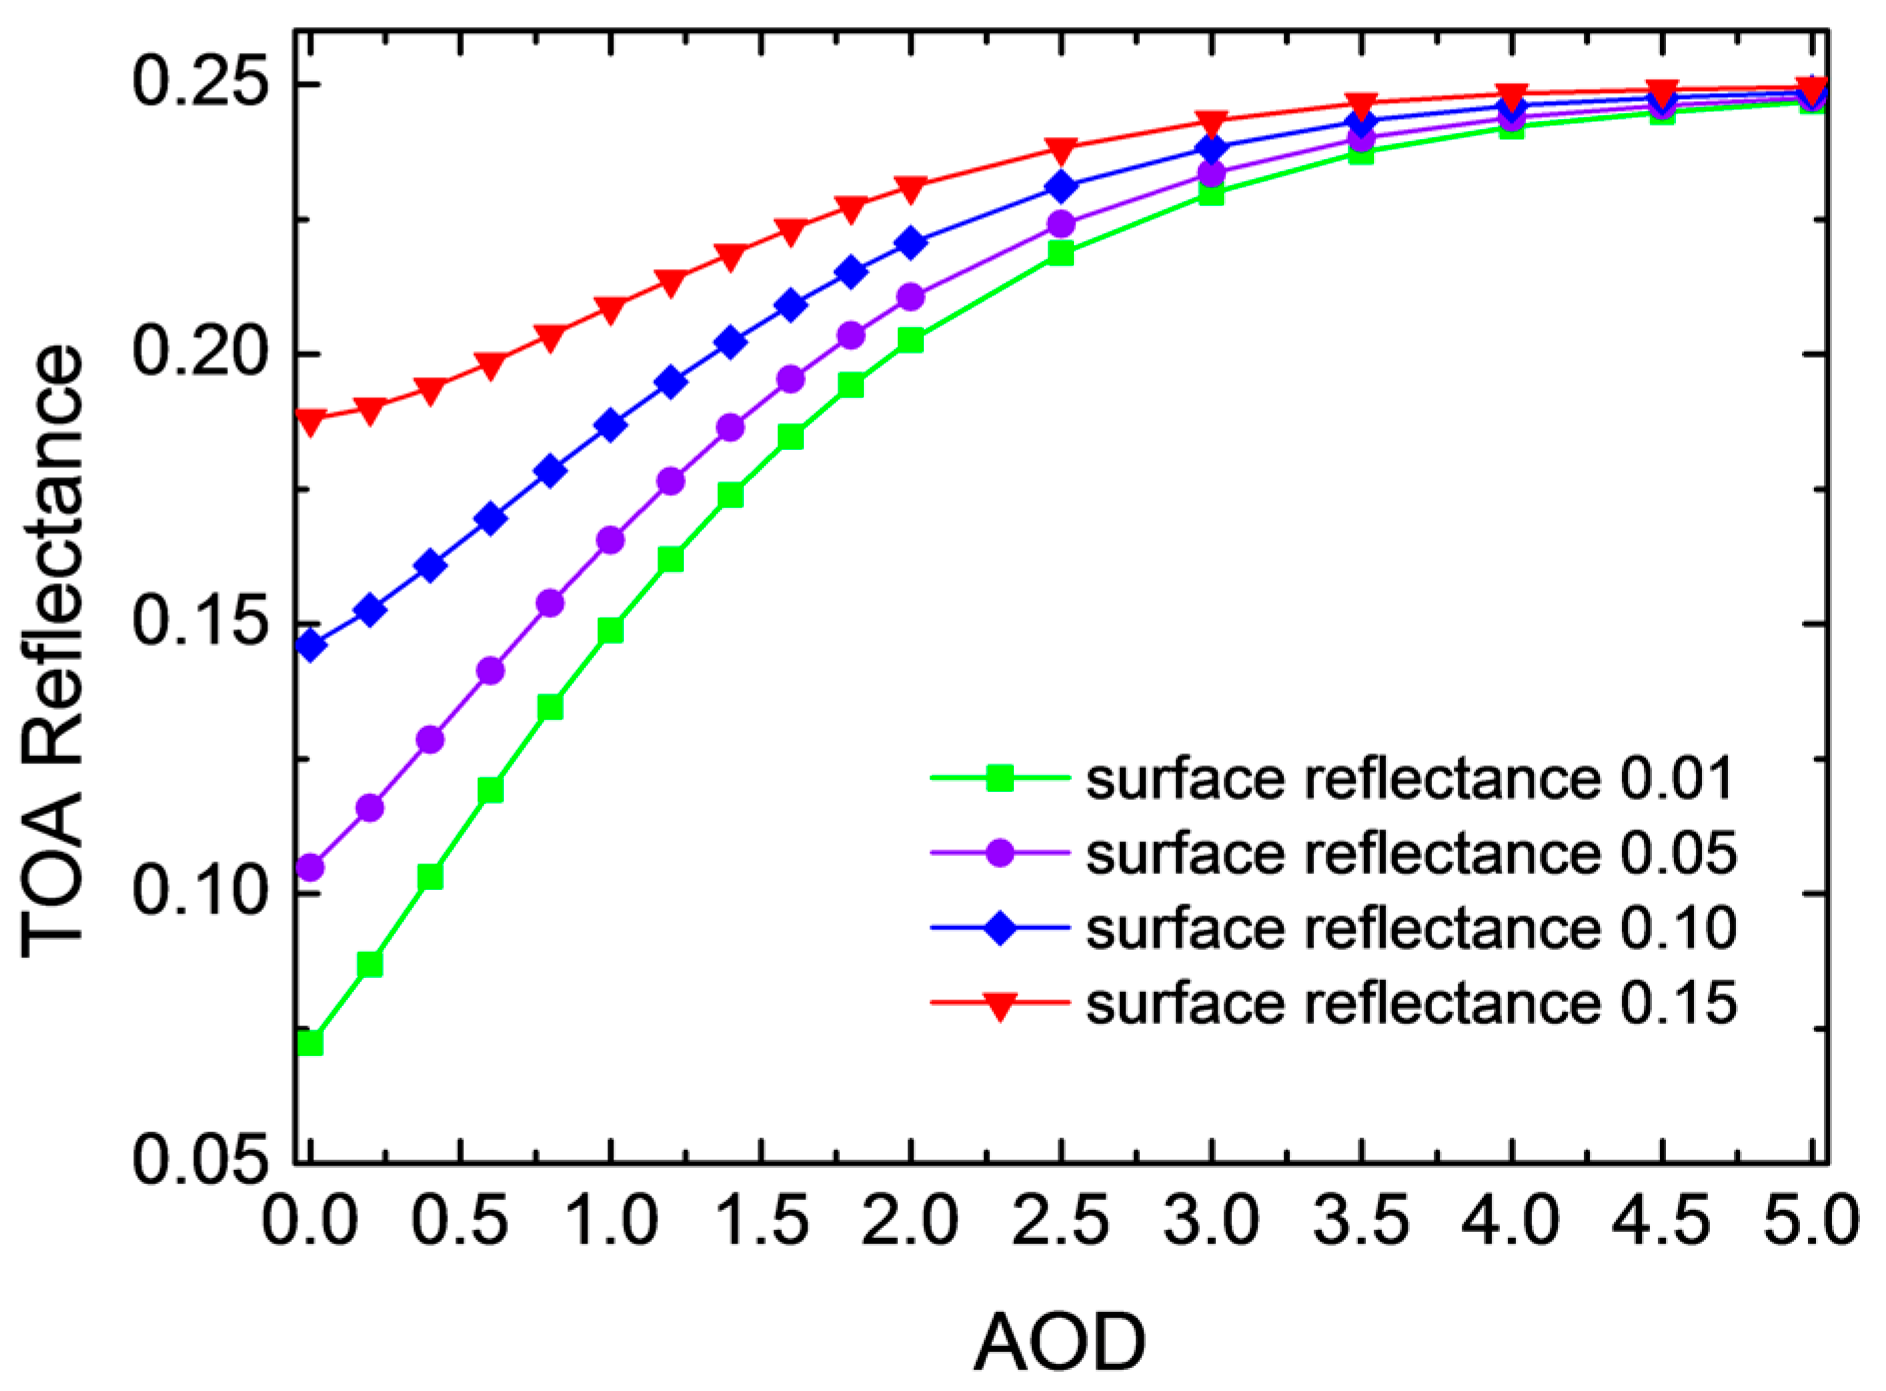
To demonstrate the availability of GF-1 WFV data in AOD retrieval, a sensitive analysis was performed by simulating the TOA reflectance in GF-1 WFV blue band under different AOD and surface conditions (as shown in Figure 3). In the simulation, the view geometry condition was set as: ; and the aerosol type was set as continental mode in the 6S. Obviously, the GF-1 WFV blue band is very sensitive to the AOD in the range of 0 to 3 in various surface conditions. When AOD is greater than 3, the TOA reflectance increases slowly with AOD in all surface conditions. It indicates that AOD could be accurately estimated from GF-1 WFV data in most cases when the surface reflectance and aerosol type are accurately estimated.

Figure 3.
The change of simulated TOA reflectance in GF-1 WFV blue band with different AOD and surface reflectance.
Two important issues in the GF-1 WFV data process need to be noted here. One is cloud mask; the other is gaseous absorption correction (including water vapor and ozone). Since there is no thermal infrared band in GF-1 WFV data, a tailor-made cloud masking method was devised to take advantage of TOA reflectance and corresponding surface reflectance in the three visible bands. The method screens clouds according to the high reflectivity by cloud and high contrast between clouds and the underlying surface. The detailed criterion for cloud masking is listed in Equation (2).
where and are the TOA reflectance and surface reflectance of GF-1 WFV red band respectively. The thresholds determined for cloud mask are based on a trial-and-error approach. Figure 4 shows the cloud mask results for some selected GF-1 WFV images using the proposed approach. Generally, the method shows a good performance in the cloud screening of GF-1 WFV data.
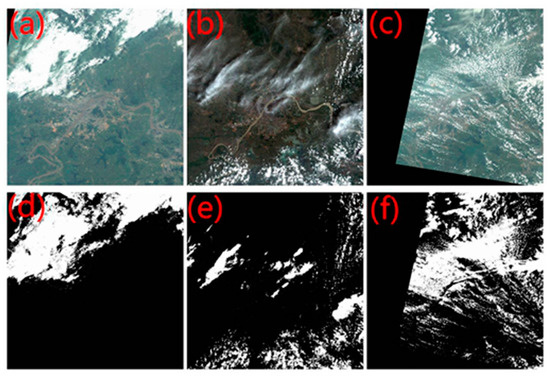
Figure 4.
The origin maps (a–c) and corresponding cloud mask results (d–f) for three selected GF-1 WFV images. The white regions in (d–f) represent cloud covering areas.
Since there is spatio-temporal variation of water vapor and ozone over Wuhan, gaseous absorption correction using standard atmospheric profile from 6S may bring uncertain error. Here an accurate correction of gaseous absorption for water vapor and ozone was performed for all GF-1 WFV data. The water vapor data were collected from NCEP (National Center for Environmental Prediction) reanalysis daily average products (http://www.esrl.noaa.gov/psd/data/reanalysis/reanalysis.shtml); and the ozone data were extracted from OMI (Ozone Monitoring Instrument) 1° × 1° grid ozone products (http://disc.sci.gsfc.nasa.gov/Aura/data-holdings/OMI).
After a description of basic principle of the AOD retrieval algorithm for GF-1 WFV data, two key parts of the algorithm are described in detail. The analysis of aerosol optical properties over Wuhan is described in Section 3.1. The methodology of surface reflectance determination for GF-1 WFV data is addressed in Section 3.2.
3.1. Aerosol Optical Properties over Wuhan
The determination of local aerosol types is crucial for AOD retrieval. It has been reported in many researches that inappropriate aerosol models have a significant impact on the accuracy of MODIS AOD product in China [36,37]. The aerosol optical properties over Wuhan present a complex variation pattern for various aerosol sources such as industries, traffic, biomass burning and dust [32]. According to the aerosol optical properties derived from long-term ground measurements at WHU, the average AOD (550 nm) during 2008–2012 is up to 0.7, and nearly 50% of AOD values are in the range of 0.5–1.0 (Figure 5a); the scattering map of Single Scattering Albedo (SSA) and Fine Mode Fraction of AOD indicates that this region is dominated by urban/industrial, biomass burning and mixed aerosol types (Figure 5b) [38,39].
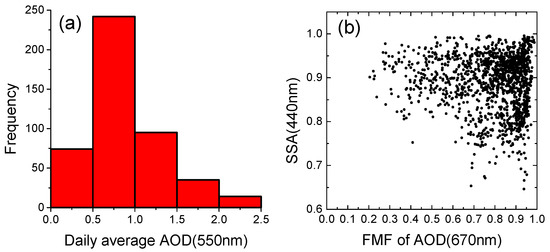
Figure 5.
(a) Frequency distribution of ground-measured daily AOD at 550 nm over Wuhan from 2008 to 2013; (b) Scatter map of SSA at 440 nm and FMF of AOD at 670 nm (SSA: Single Scattering Albedo; FMF: Fine Mode Fraction).
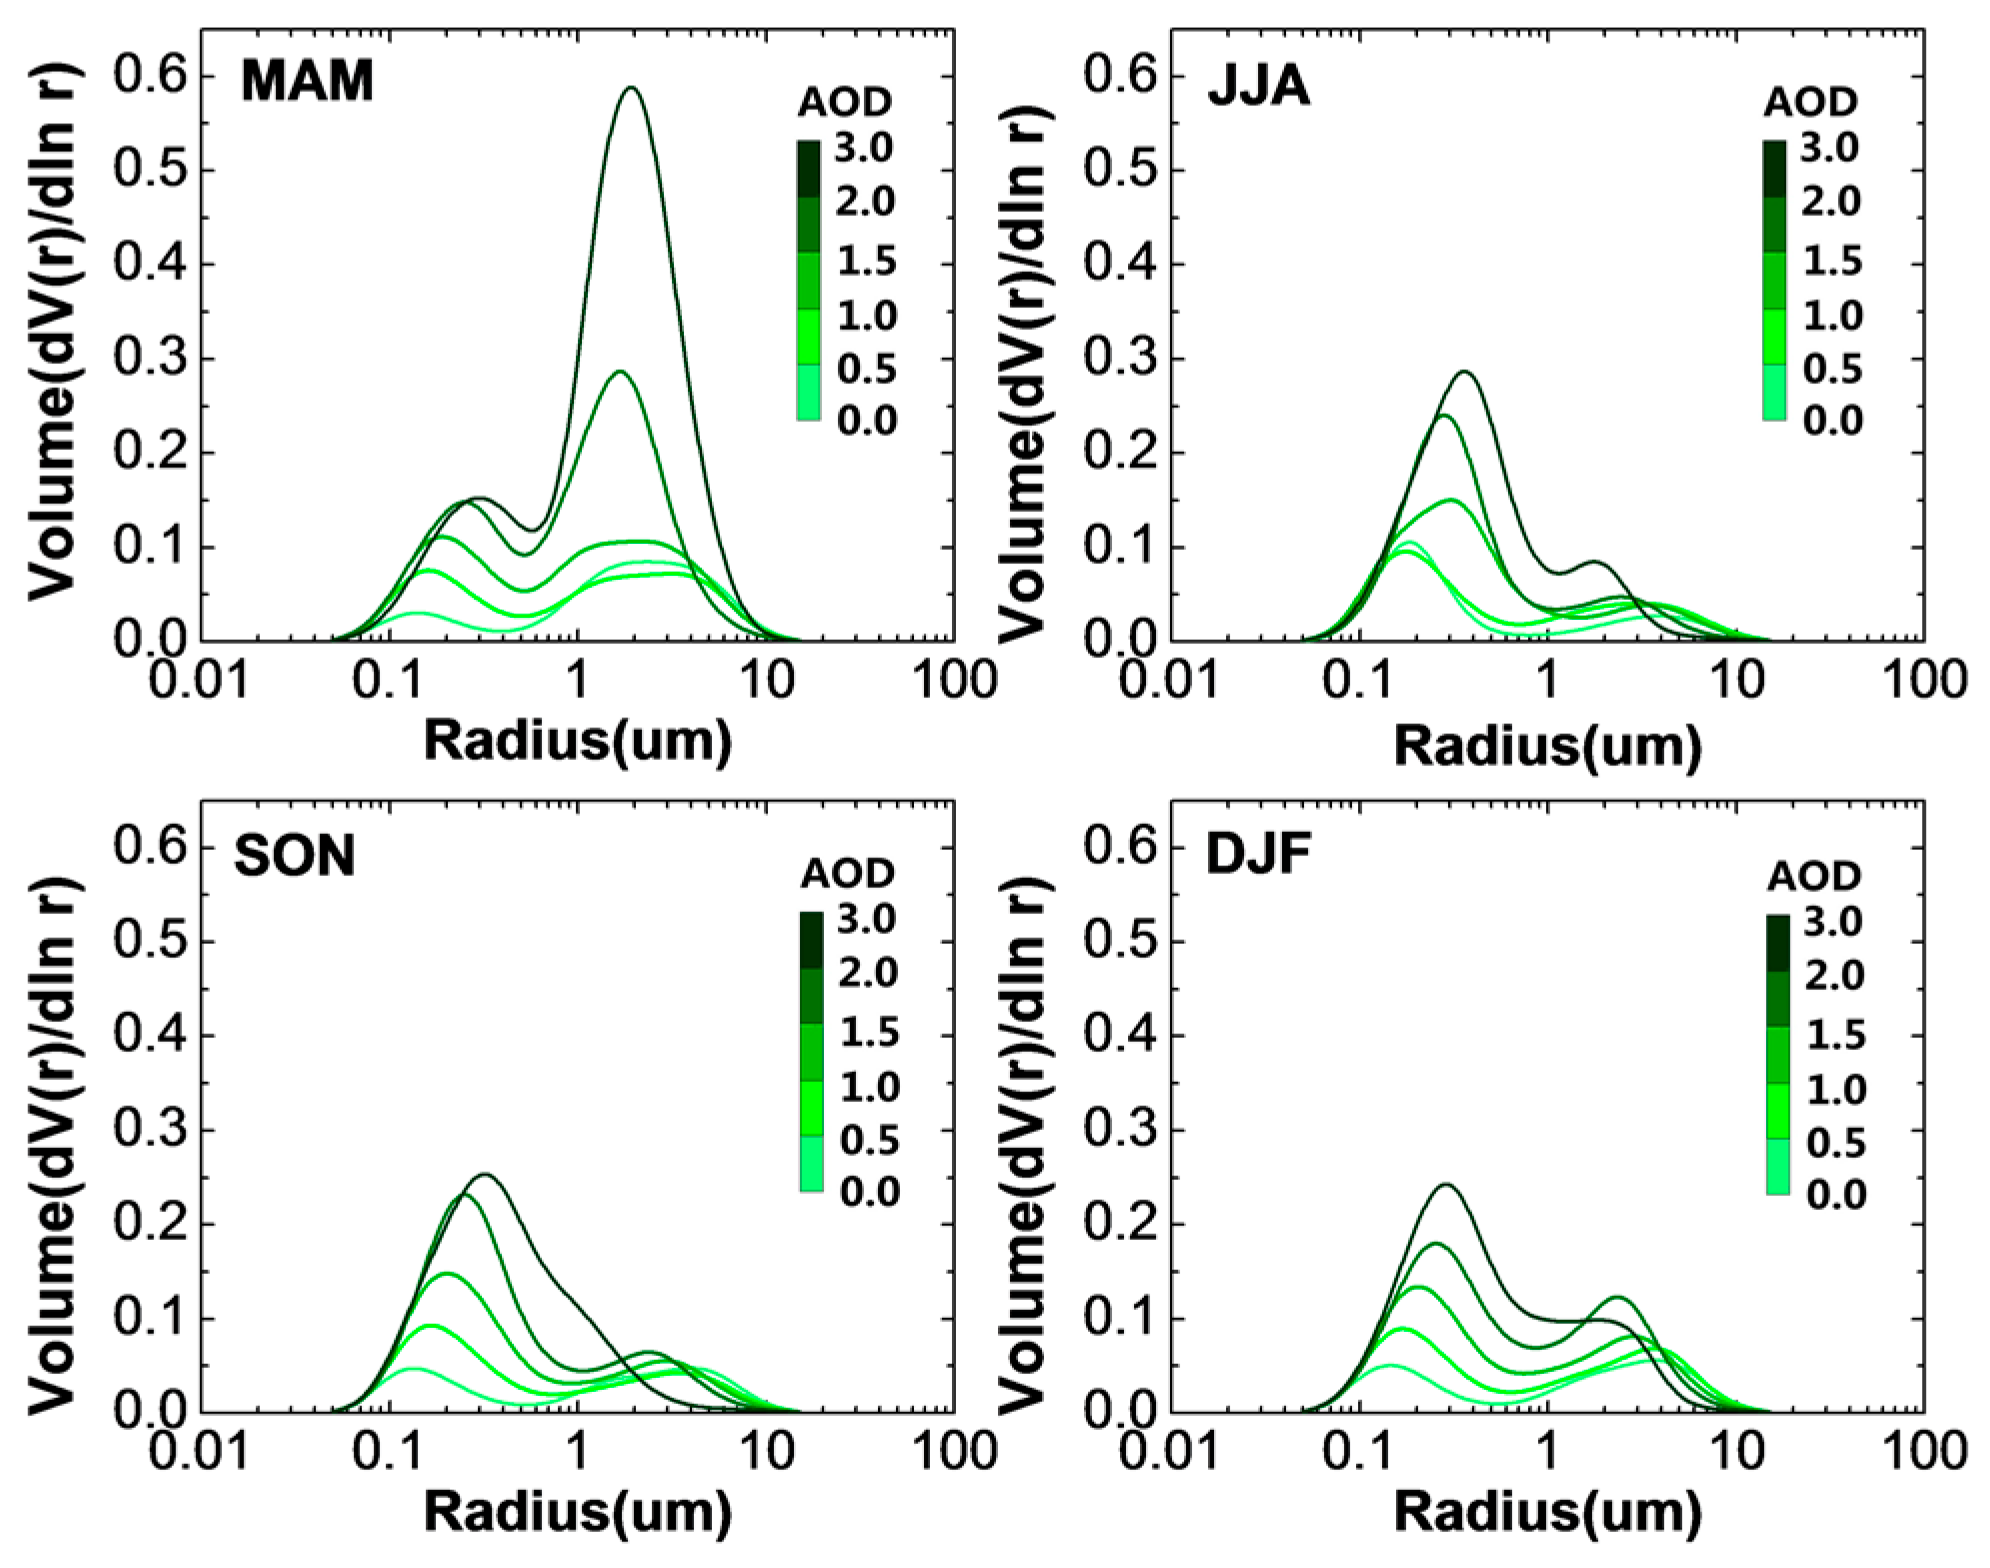
To derive local aerosol types over Wuhan, a method following the research of Kim et al. [40] was adopted in this paper. The method discriminates various aerosol types by statistical analysis of aerosol optical properties in different seasons and AOD ranges. The average volume size distribution for four seasons (spring, summer, autumn and winter) in different AOD ranges is shown in Figure 6, and the corresponding refractive index and SSA data are listed in Table 4. Generally, the aerosol volume size distribution over Wuhan follows a bimodal lognormal size distribution with obvious seasonal variability in volume concentration and peak radius. Fine-mode particles are dominant in all seasons except spring, when frequent dust events cause an increase in coarse-mode particles. It is consistent with the analysis results using AERONET measurements over East Asia [40]. The refractive index and SSA at 670 nm in different seasons and AOD bins, as listed in Table 4, also present a seasonal variability. The average refractive index (real part) for spring (MAM: March, April and May), summer (JJA: June, July and August), autumn (SON: September, October and November), and winter (DJF: December, January and February) are 0.87, 0.86, 0.83 and 0.86 respectively; while the average SSA are 1.50, 1.40, 1.43 and 1.46 for each season in the same order as above.
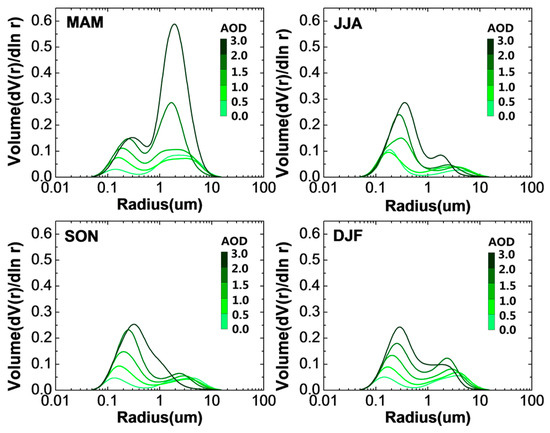
Figure 6.
The average volume size distribution for each season under different AOD ranges. Spring (MAM: March, April and May); summer (JJA: June, July and August); autumn (SON: September, October and November); and winter (DJF: December, January and February).
Table 4.
The refractive index and single scattering albedo at 670 nm for each season under different AOD ranges.
3.2. Surface Reflectance Determination
Assuming a constant surface reflectance over one region during a specific period, the regional surface reflectance can be estimated from time series of satellite images by using clear sky composite technique. The method has been widely applied in the AOD retrieval algorithm for many satellite sensors in global and regional scale. For example, the method was applied in MODIS DB algorithm to provide global land AOD product [41], and it was also used to retrieve regional high resolution AOD from MODIS and Landsat data [42,43]. Allowing for the high spatial and temporal resolution of GF-1 WFV data, it is feasible to retrieve high resolution AOD using clear sky composite method. The main difficulties lie in the complex surface reflectivity (especially over urban areas) brought from high spatial resolution, which may result in complicated variations in satellite signals caused by cloud and topographic shadow, surface feature change and Bidirectional Reflectance Distribution Function (BRDF) effect.
To estimate surface reflectance from GF-1 WFV data, we proposed a novel strategy in the selection and compositing of GF-1 WFV images. The compositing period was determined to be three months in consideration of observing frequency of GF-1 WFV cameras. To avoid directly composite all GF-1 WFV images, MODIS AOD product was introduced in the selection of clear sky images. We calculated the regional mean, minimum, maximum, standard deviation and spatial coverage value of MODIS AOD over Wuhan corresponding to the overpassing time of GF-1 WFV data. Three criteria were adopted to ensure the selection of clearest and cloudless GF-1 WFV images. They were: (1) mean value < 0.5; (2) standard deviation < 0.1; and (3) spatial coverage > 70%. Furthermore, in order to minimize the BRDF effect, only GF-1 WFV images with satellite view zenith less than 30° were selected. The eligible GF-1 WFV images with a total number of 31 are listed in Table 5. A small number of GF-1 WFV images that failed to meet the above criteria were also included to ensure enough eligible images during each season.
Table 5.
List of GF-1 WFV candidate images for surface reflectance database.
As the heavy loading of aerosols over Wuhan, the aerosol effect is non-negligible on clear days. After a first selection of clear sky GF-1 WFV images with the support of prior knowledge from MODIS AOD product, atmospheric correction was performed for all eligible images by using 6S with the corresponding averaged MODIS AOD and established seasonal aerosol model. Finally, the atmospheric corrected images were composited seasonally by using minimum reflectance technique. It should be noted here that the compositing process was not pixel-based but window-based in a 10 × 10 size (corresponding to a spatial resolution of 160 m × 160 m). In each processing window, the 30% brightest and 30% darkest pixels were excluded, and the average value of remaining 40% pixels was used to represent the reflectance of the entire window. The same calculation was performed in the AOD retrieval process. The window-based calculation method can effectively avoid the impact of retained clouds, topographic shadow and changing of surface features on the AOD retrieval.
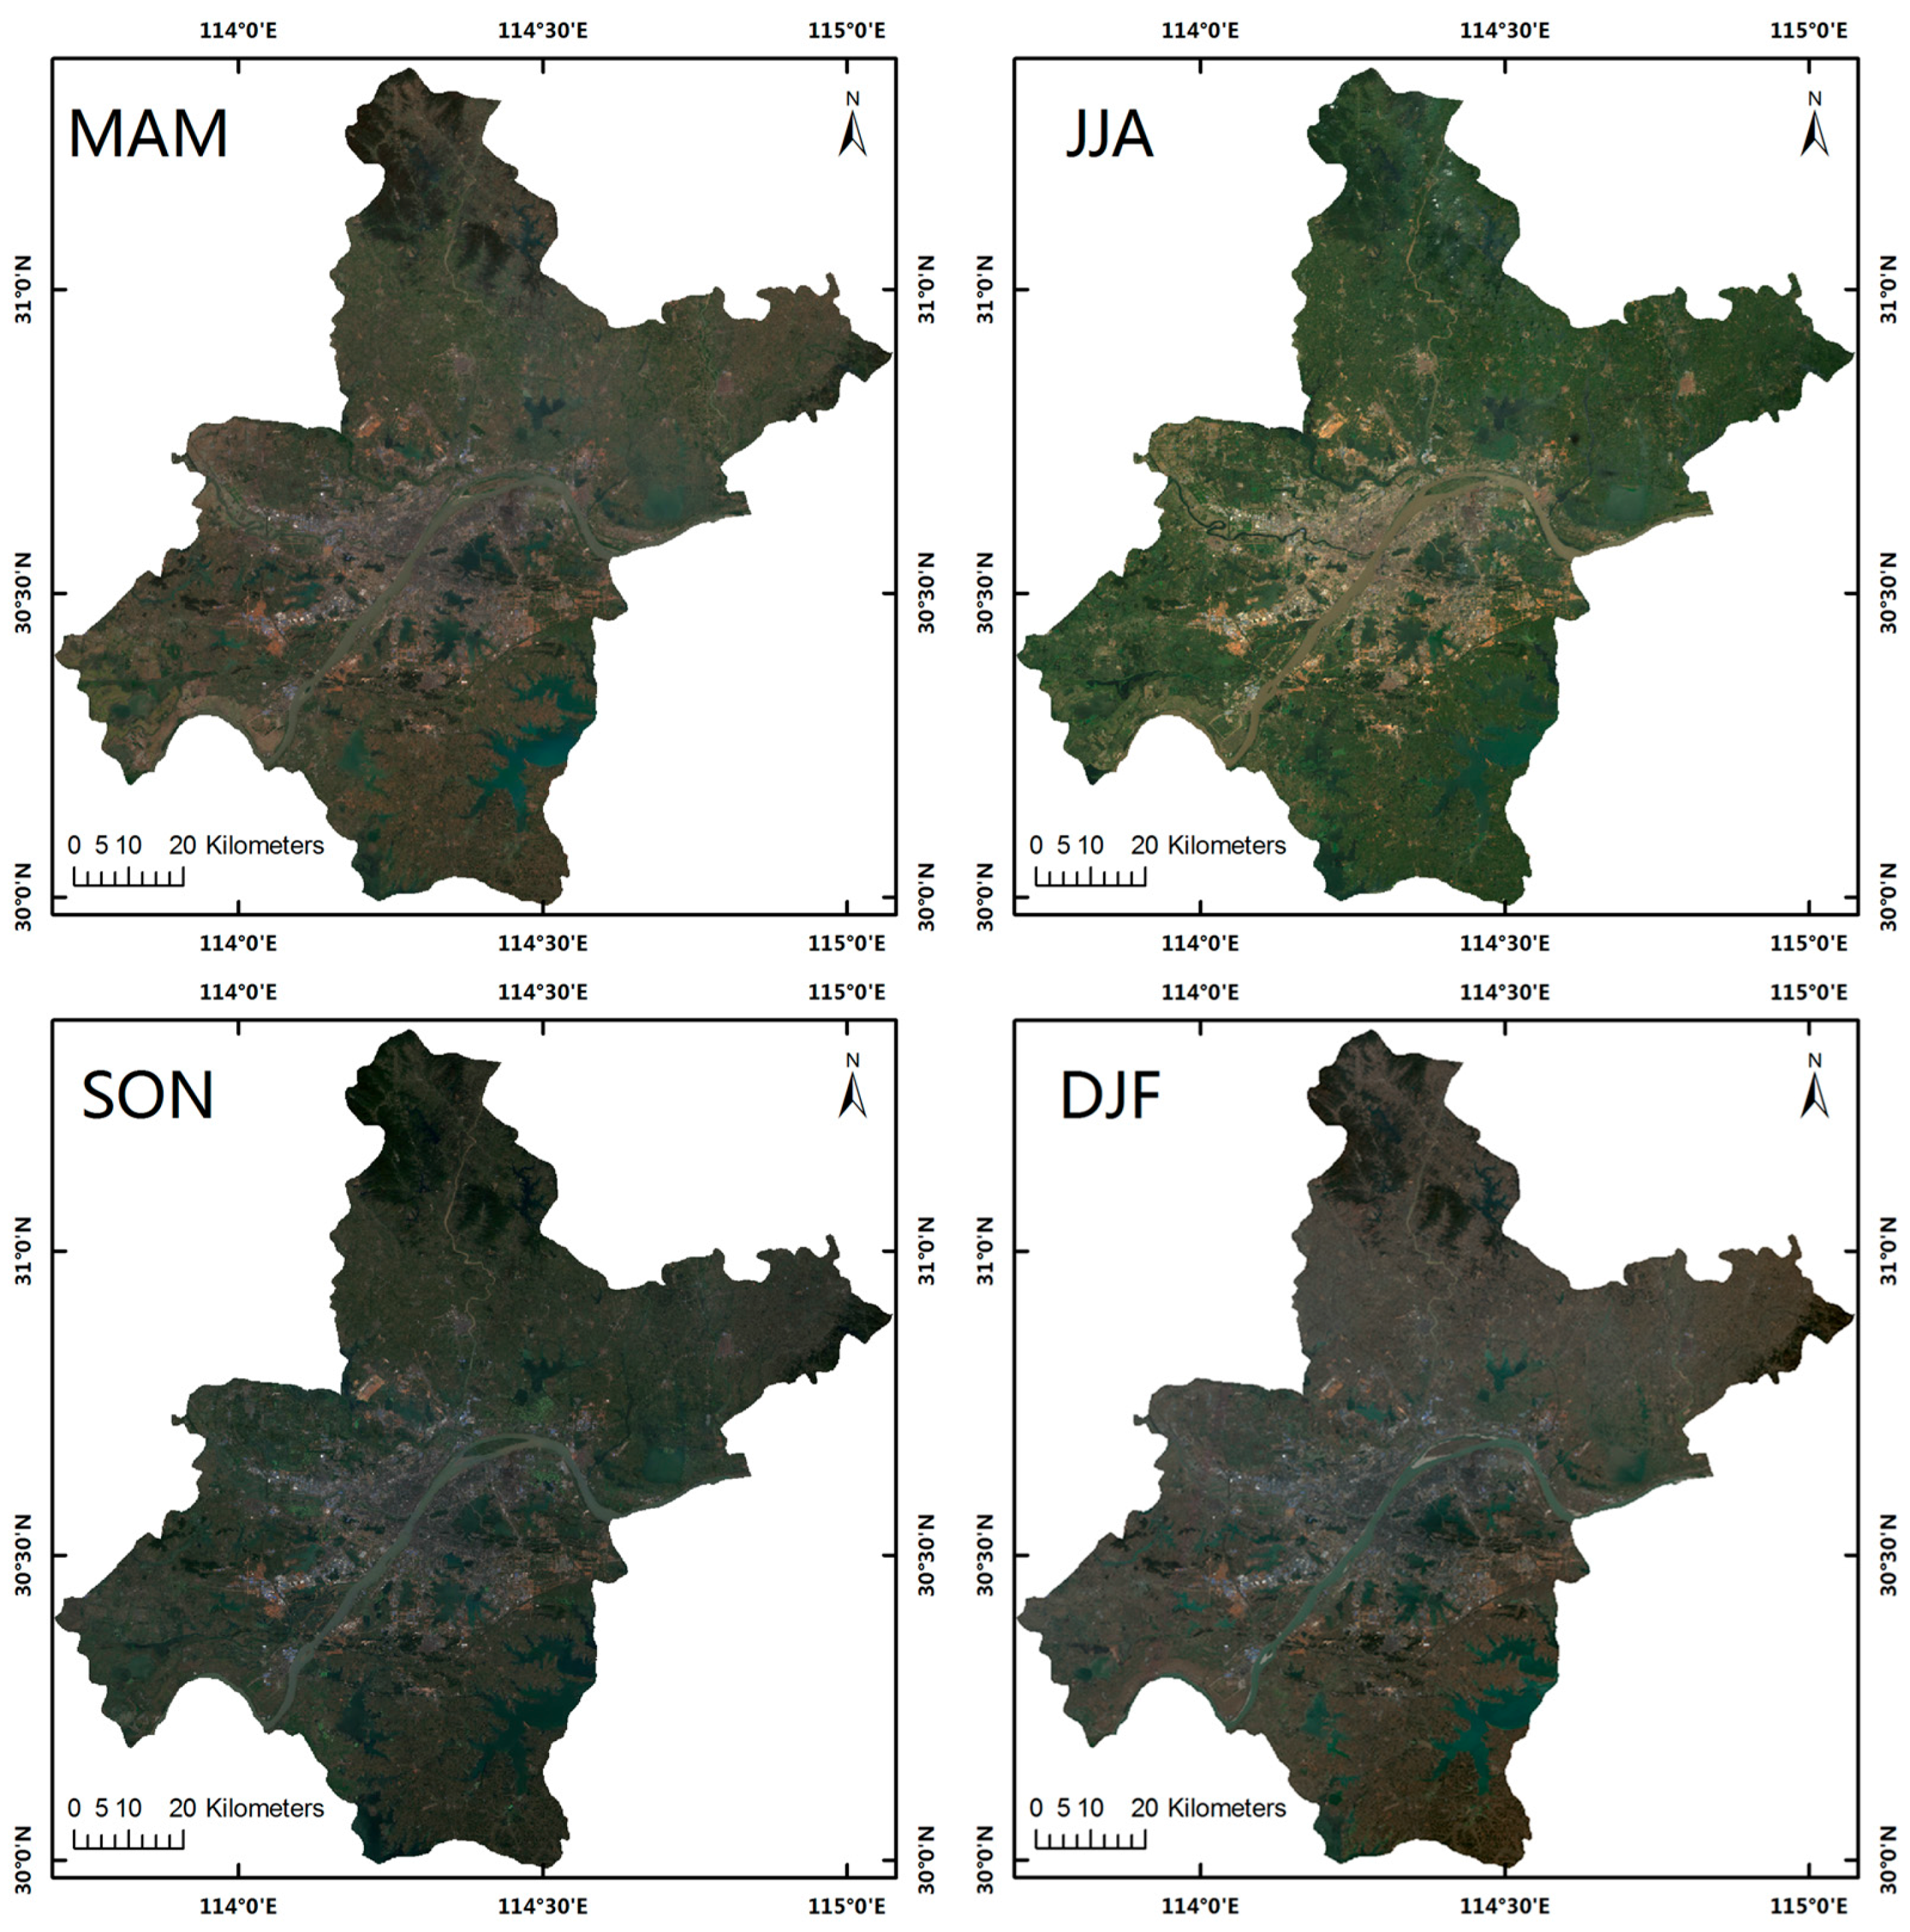
Figure 7 shows the seasonal surface reflectance images (red, green, blue (RGB) composited) derived from GF-1 WFV data over Wuhan during 2014, and Figure 8 shows the seasonal surface reflectance variation of typical land cover types (urban, forest and farmland). It can be seen from the two figures that the surface reflectance over Wuhan presents an obvious seasonal variation pattern.
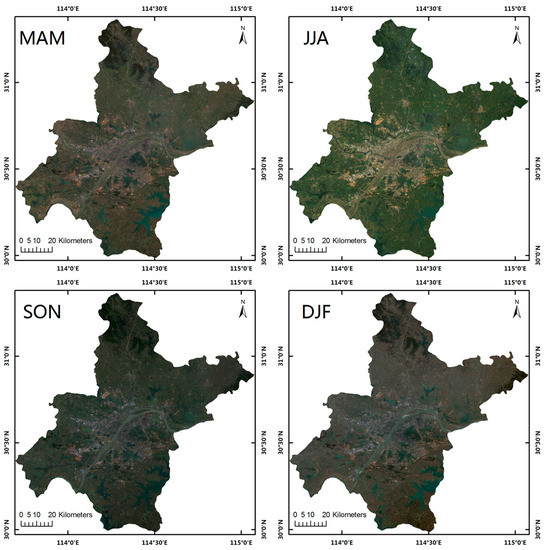
Figure 7.
Seasonal surface reflectance images (red, green, blue (RGB) composited) derived from GF-1 WFV data over Wuhan during 2014. MAM (March, April and May), JJA (June, July and August), SON (September, October and November) and DJF (December, January and February) represent the season of Spring, Summer, Autumn and Winter respectively.
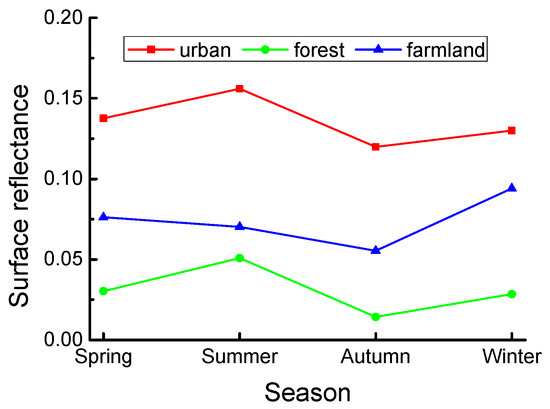
Figure 8.
Seasonal surface reflectance variation of typical land cover types.
4. Results and Discussion
4.1. Retrieved Results from the Proposed Algorithm
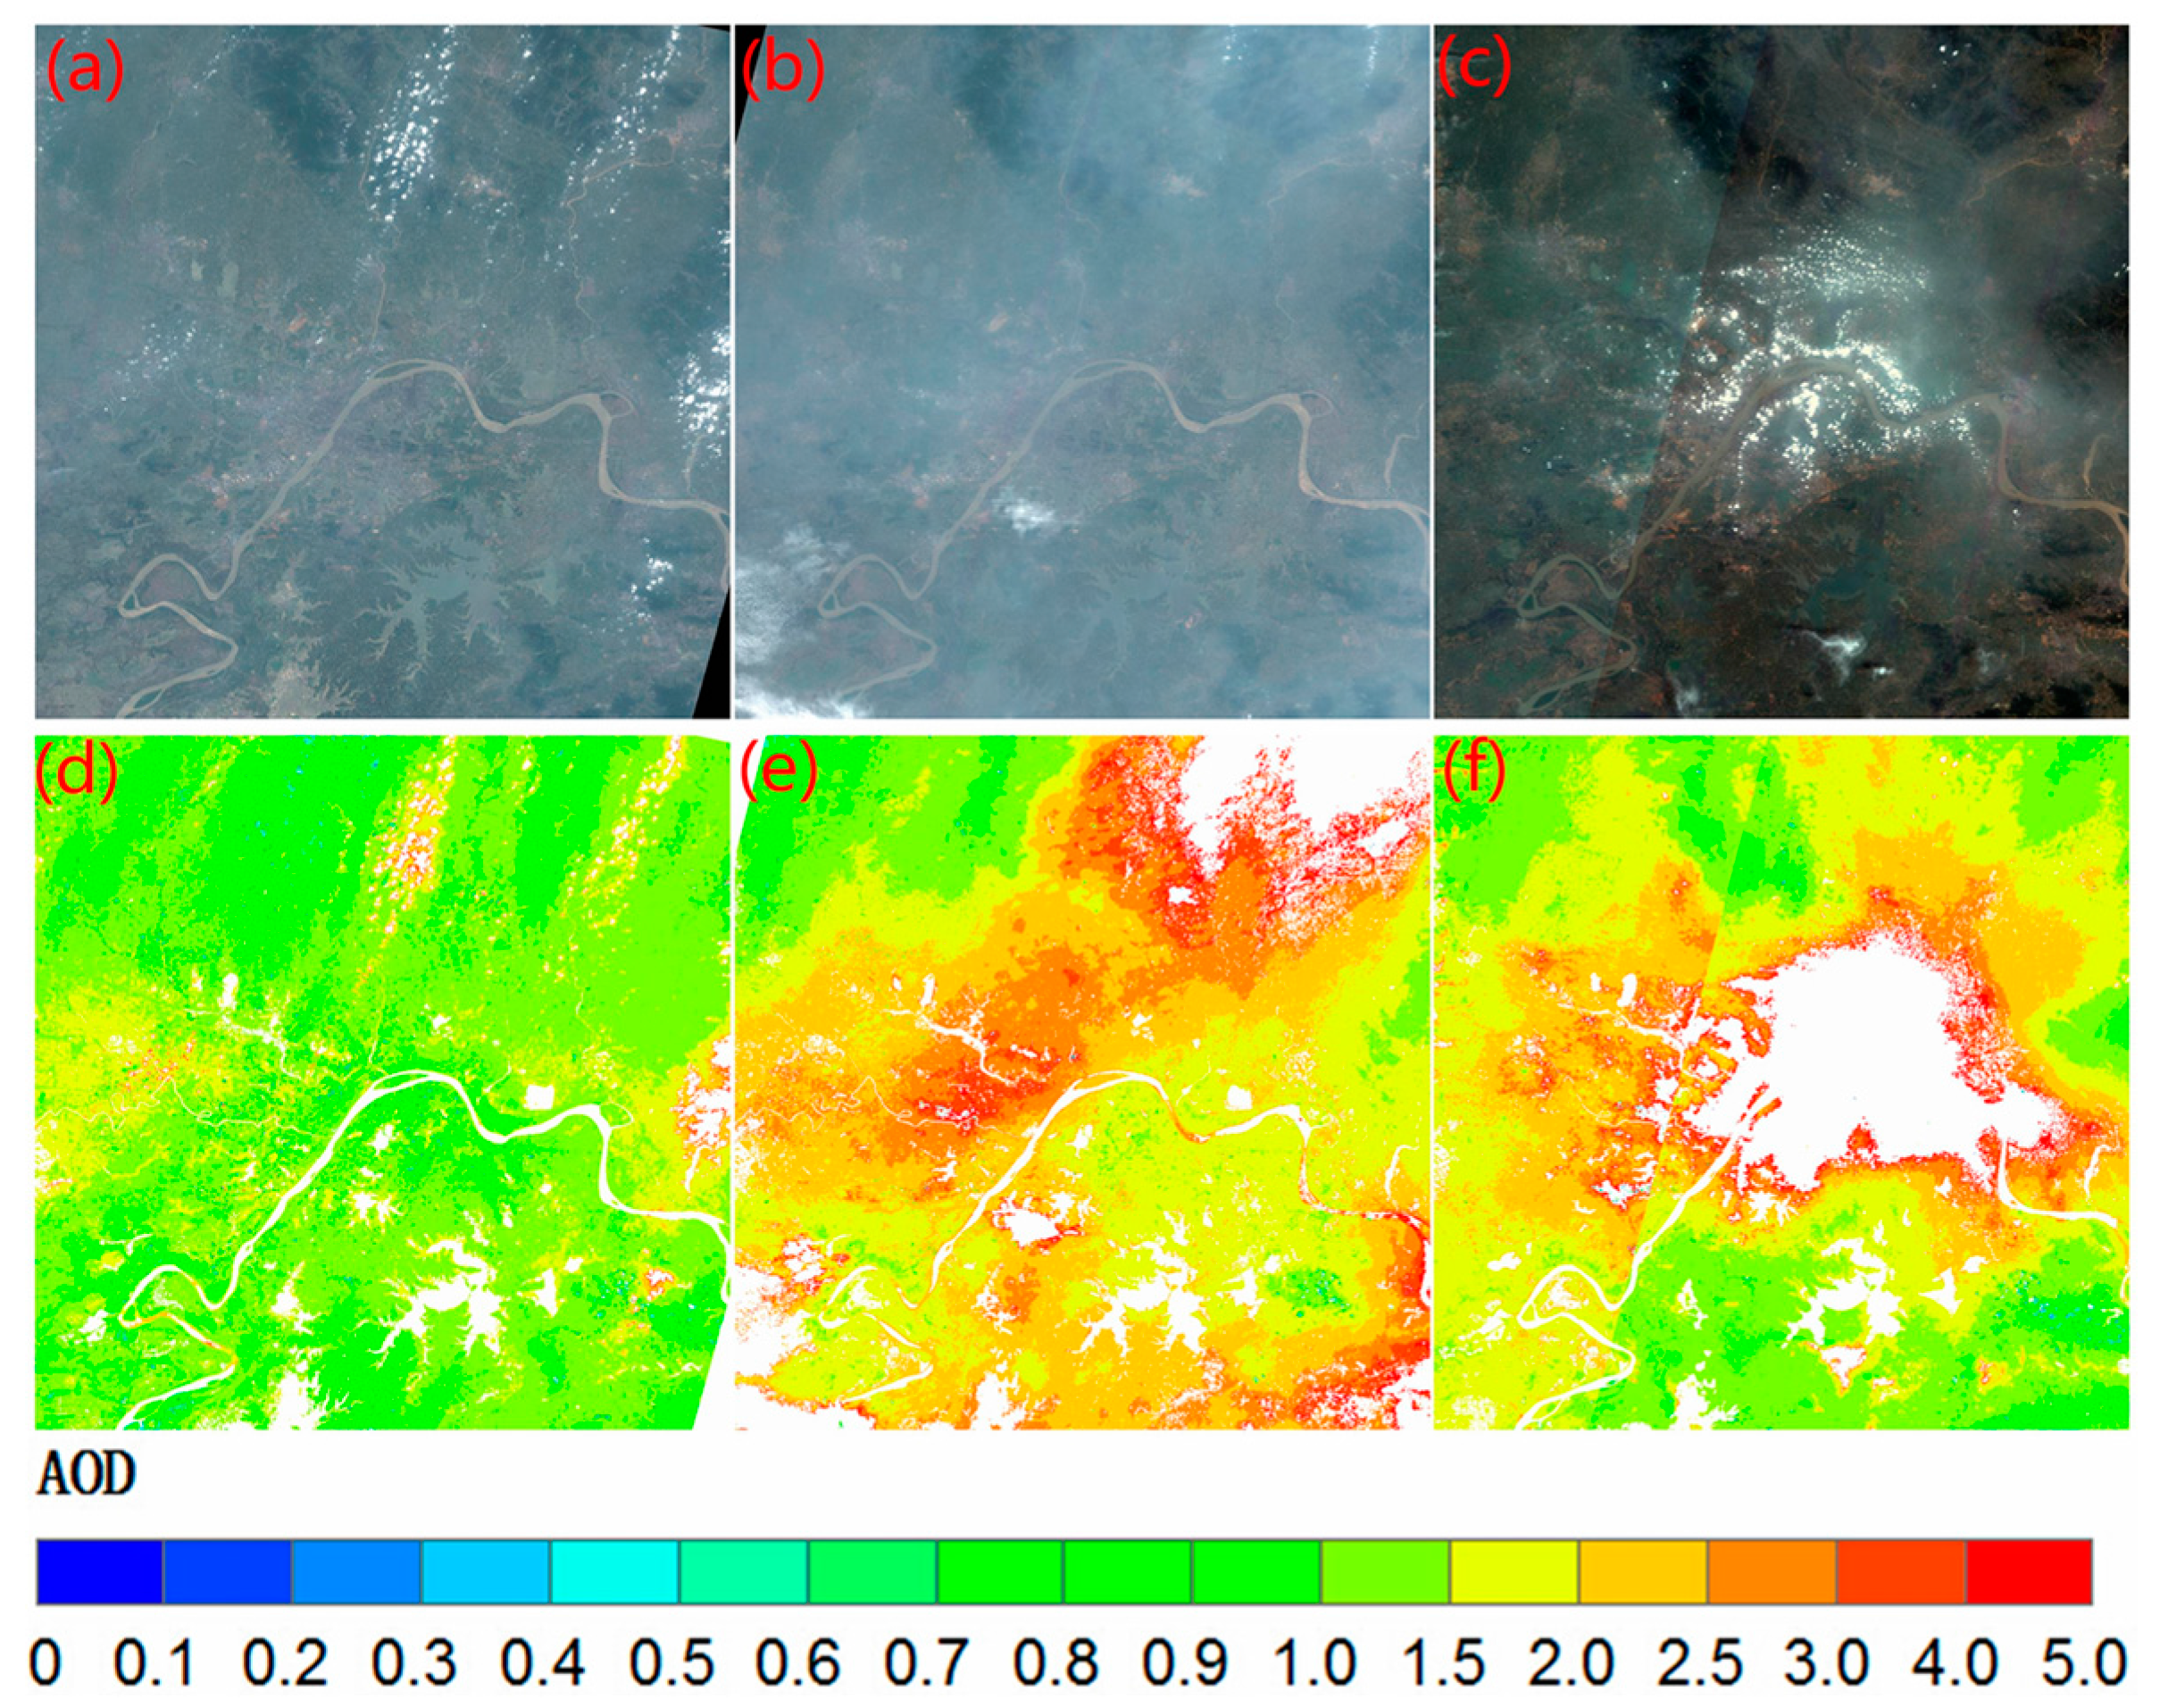
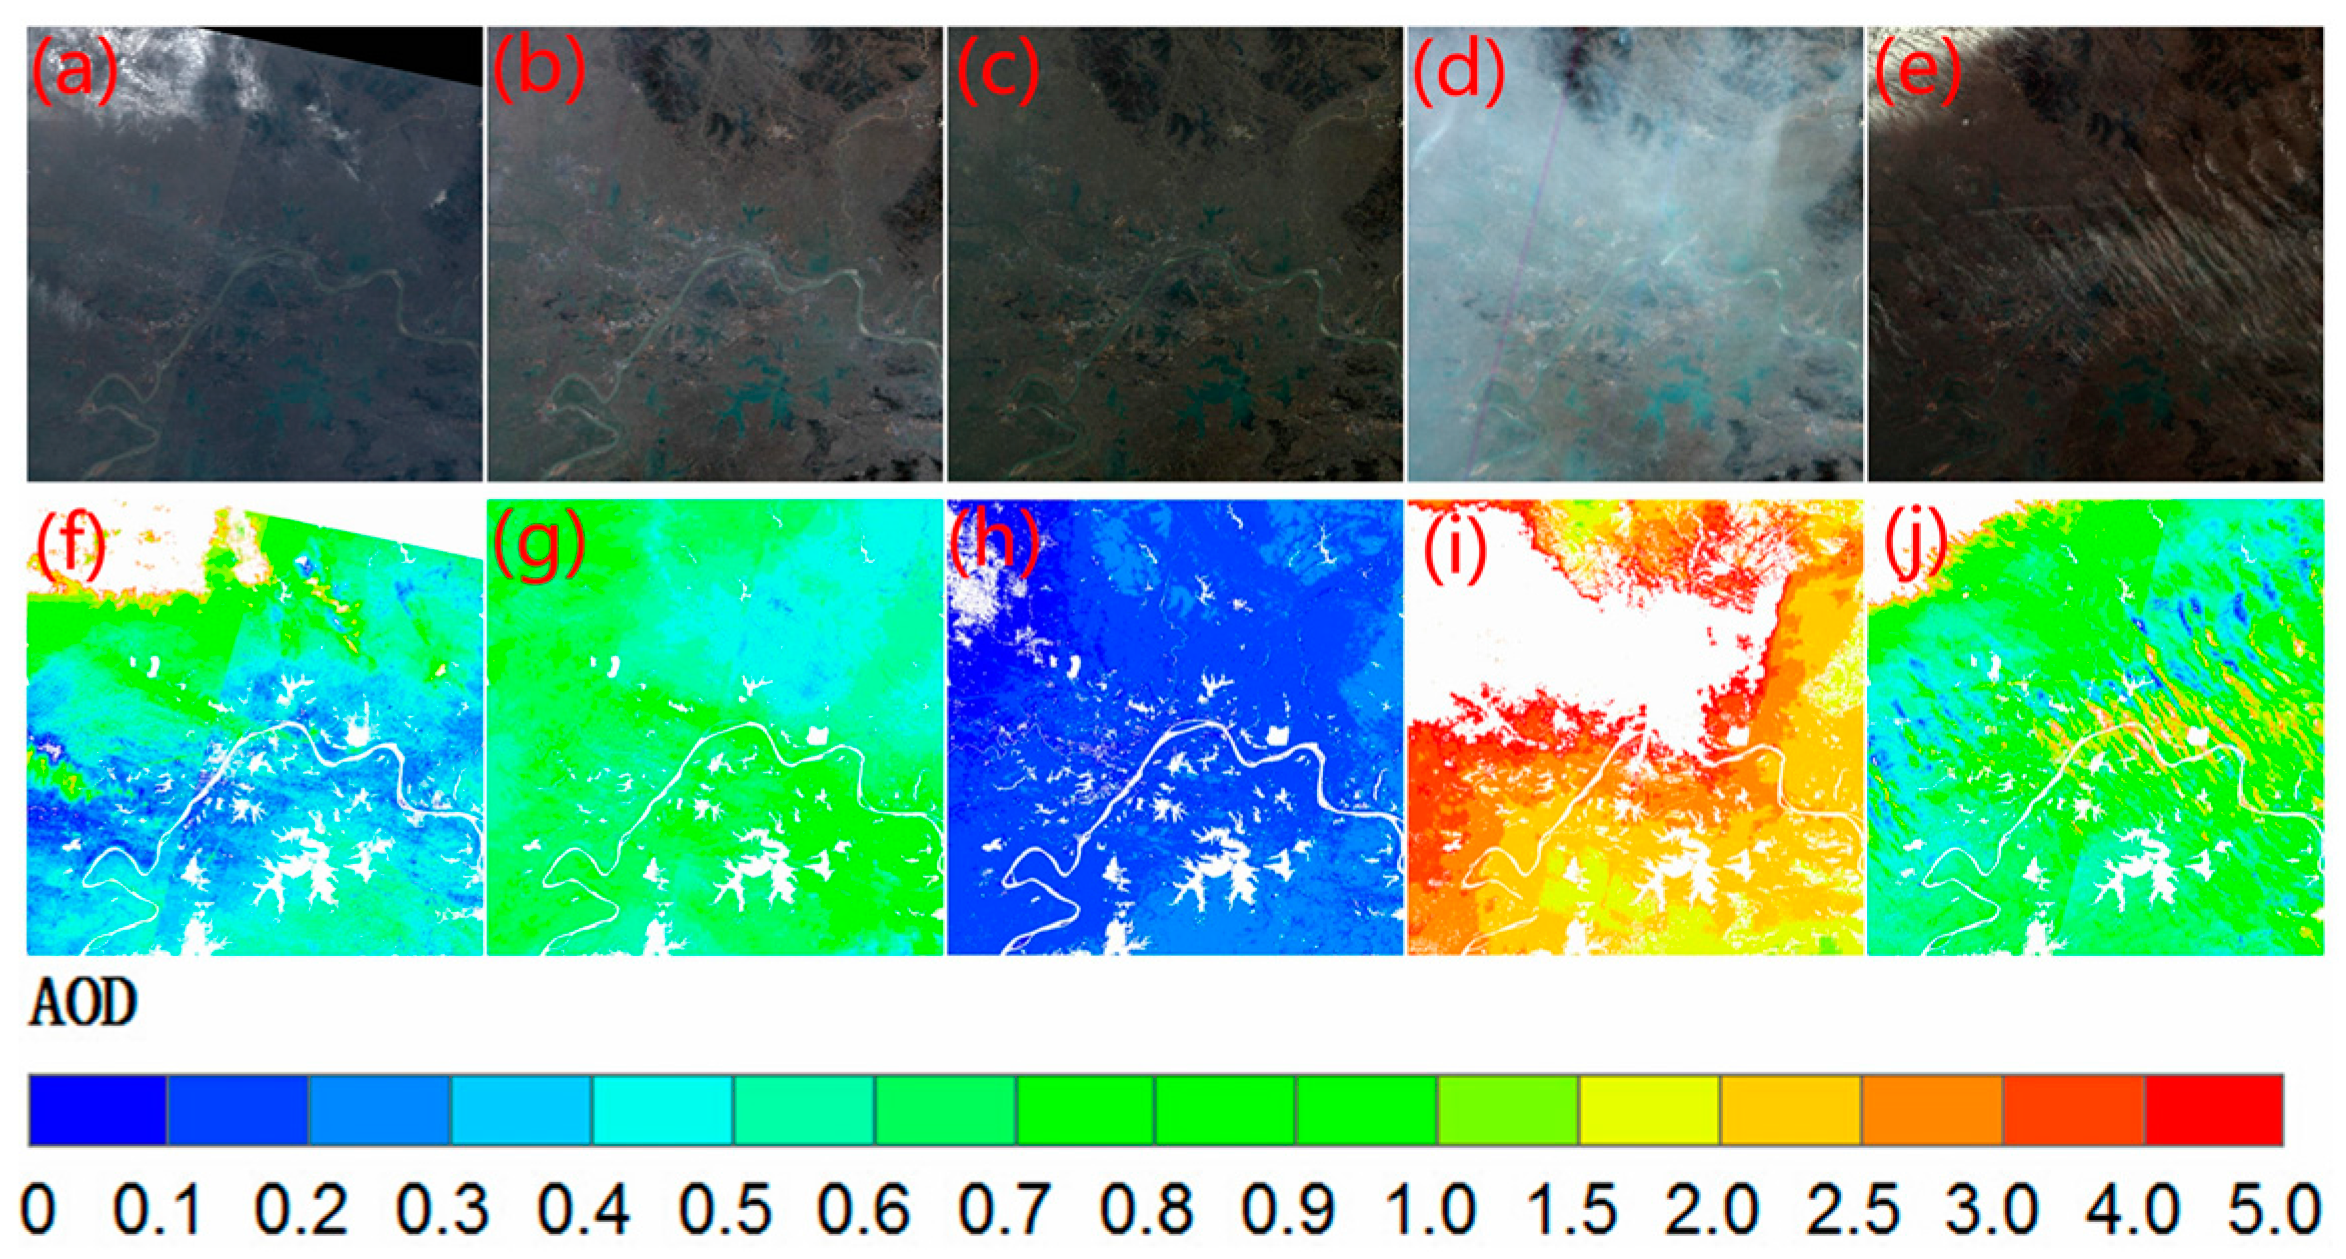
Utilizing the algorithm described above, we processed all the GF-1 WFV data over Wuhan from July 2013 to January 2016. Figure 9 and Figure 10 show continuously retrieved results during haze periods in the summer and winter of 2014 respectively. It can be seen that the proposed algorithm could obtain valid AOD over all land surface types in cloudless condition (Figure 10g,h). Water bodies were masked in the algorithm for their rapid variation in surface reflectance. Because the looser thresholds were set in the cloud screening process, the algorithm could retrieve AOD effectively in hazy conditions (Figure 9e,f and Figure 10i). Nevertheless, looser thresholds also lead to incomplete cloud screening in some cases, and the retained clouds could further result in some extremely high AOD values (Figure 9d and Figure 10j). The retrieved AOD presents a uniform spatial distribution with relatively low value (<0.5) on cloudless and clear days (Figure 10g,h), whereas on polluted and hazy days the AOD rapidly increases, thus presenting an obviously non-uniform spatial distribution (Figure 9f and Figure 10f). The AOD during heavy hazy days ranges from 2 to 4, indicating a severe air pollution (Figure 9e and Figure 10i).
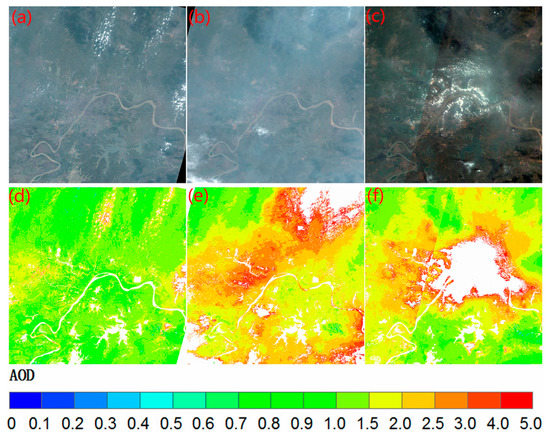
Figure 9.
The AOD retrieval results from GF-1 WFV data during a haze period in summer. (a–c) are the RGB composited GF-1 WFV images on 3 June, 6 June and 11 June of 2014 respectively; (d–f) are the corresponding retrieved AOD at 550 nm. Water bodies were masked in the algorithm.
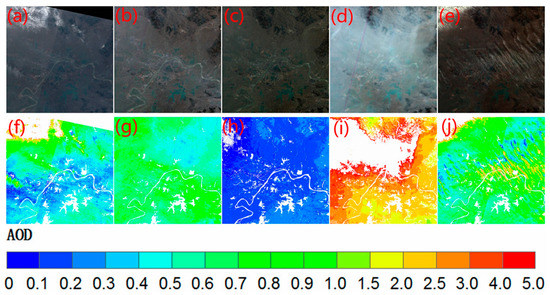
Figure 10.
The AOD retrieval results from GF-1 WFV data during a haze period in winter. (a–e) are the RGB composited GF-1 WFV images on 15 January, 19 January, 23 January, 27 January and 31 January of 2014 respectively; (f–j) are the corresponding retrieved AOD at 550 nm.
Based on the complete AOD results in 2014 and 2015, we obtained the spatial distribution of yearly average AOD over Wuhan (Figure 11). There exists an obvious difference in the spatial distribution of yearly average AOD over urban and non-urban areas of Wuhan. The high AOD value zone is mainly distributed in the urban area of Wuhan (located in the center region), with a regional mean value of about 0.9, whereas most AOD values over non-urban areas of Wuhan range from 0.5 to 0.8. This situation is common in many cities of the world, where the anthropogenic aerosol emissions sourced from traffic, industry and cooking are dominant year round [44]. Annual difference also can be seen in the yearly average AOD map over Wuhan. The high AOD zone was distributed in the east of the urban area in Wuhan during the year 2014, whereas it was found to be partly transported to the western urban area of Wuhan during 2015. This may be caused by the change of aerosol source, wind direction and other environmental factors over this region.
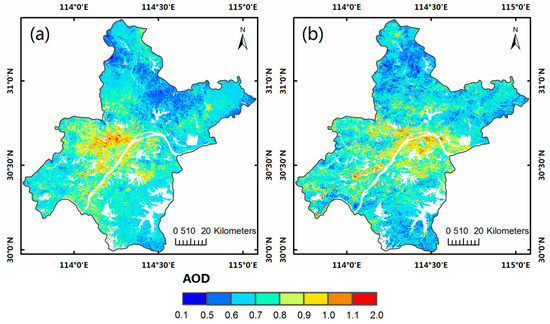
Figure 11.
The spatial distribution yearly average AOD over Wuhan derived from GF-1 WFV data in 2014 (a) and 2015 (b).
4.2. Comparison of GF-1 WFV AOD with MODIS AOD
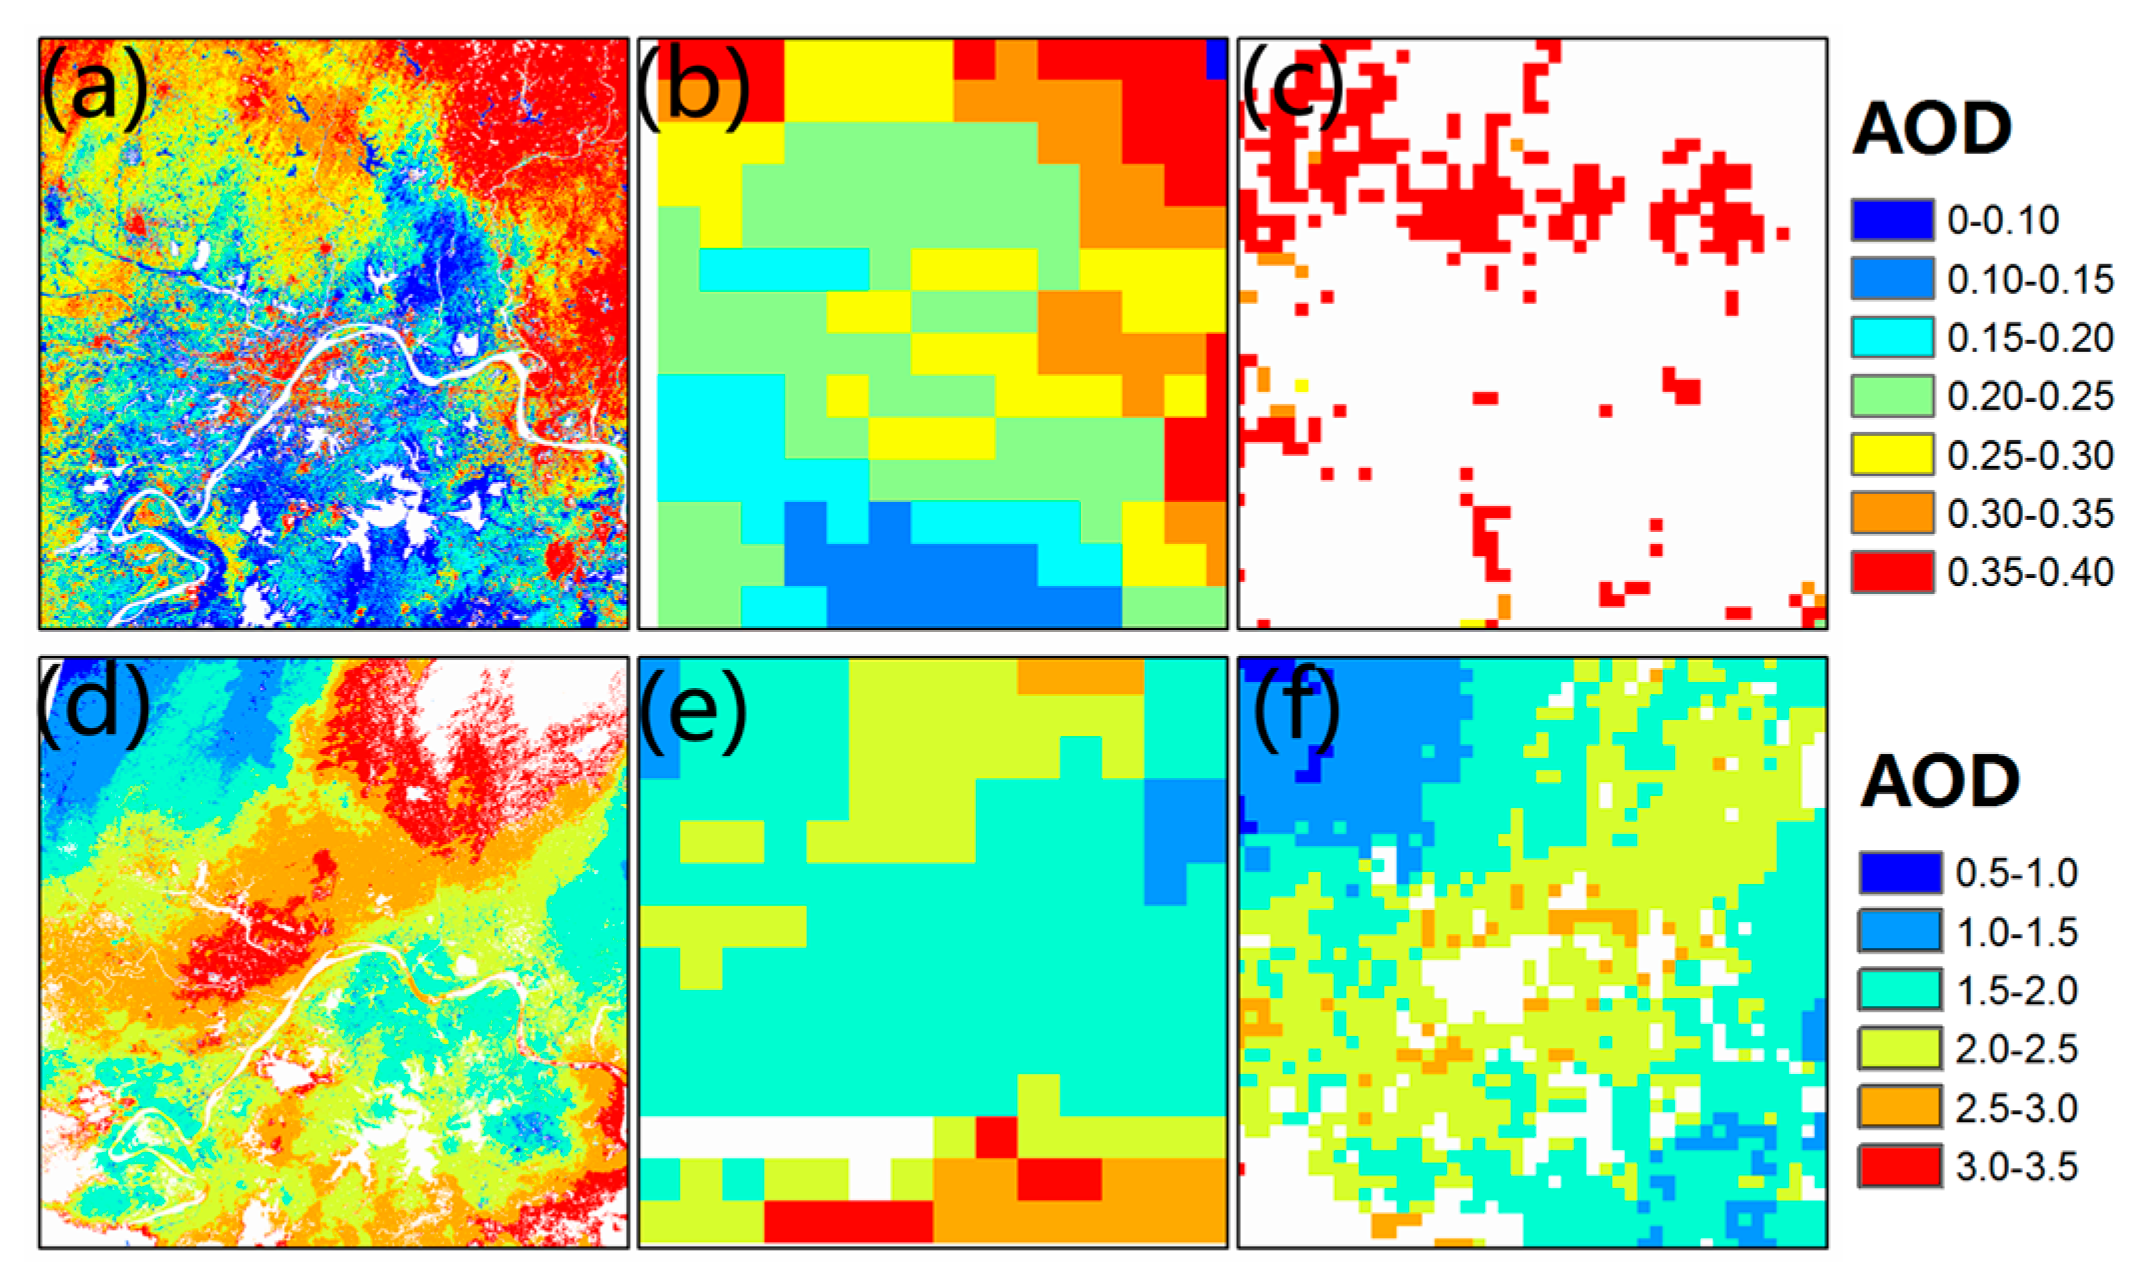
A spatial and temporal comparison between GF-1 WFV AOD and MODIS AOD is presented in this section. First, we perform an intercomparison of spatial distribution between GF-1 WFV AOD (160 m), MODIS DB AOD (10 km) and MODIS DT AOD (3 km). Figure 12 shows the spatial distribution of GF-1 WFV, MODIS DB and MODIS DT AOD on 8 July 2013 (cloudless, clear day) and 7 June 2014 (cloudless, hazy day). It can be seen that the spatial distribution patterns and values of GF-1 WFV, MODIS DB and MODIS DT AOD are roughly consistent with each other. The GF-1 WFV AOD tends to be a little higher than the MODIS DB and DT AOD, which may be caused by the difference in spatial resolution, overpassing time and retrieval algorithm. Similar to GF-1 WFV AOD, the MODIS DB AOD could also cover all land surface types in Wuhan; nevertheless, the GF-1 WFV AOD at a spatial resolution of 160 m provides more abundant details than MODIS DB AOD in the spatial distribution. The MODIS DT AOD has a finer spatial resolution compared to MODIS DB AOD, but it fails to cover bright surfaces (including urban areas) in Wuhan.
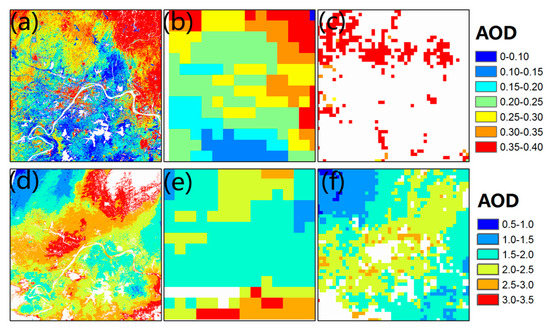
Figure 12.
Comparison between GF-1 WFV AOD at 160 m, MODIS DB AOD at 10 km and MODIS DT AOD at 3 km. (a–c) are the GF-1 WFV AOD, MODIS DB AOD and MODIS DT AOD respectively on 8 July 2013; (d–f) are the GF-1 WFV AOD, MODIS DB AOD and MODIS DT AOD respectively on 7 June 2014.
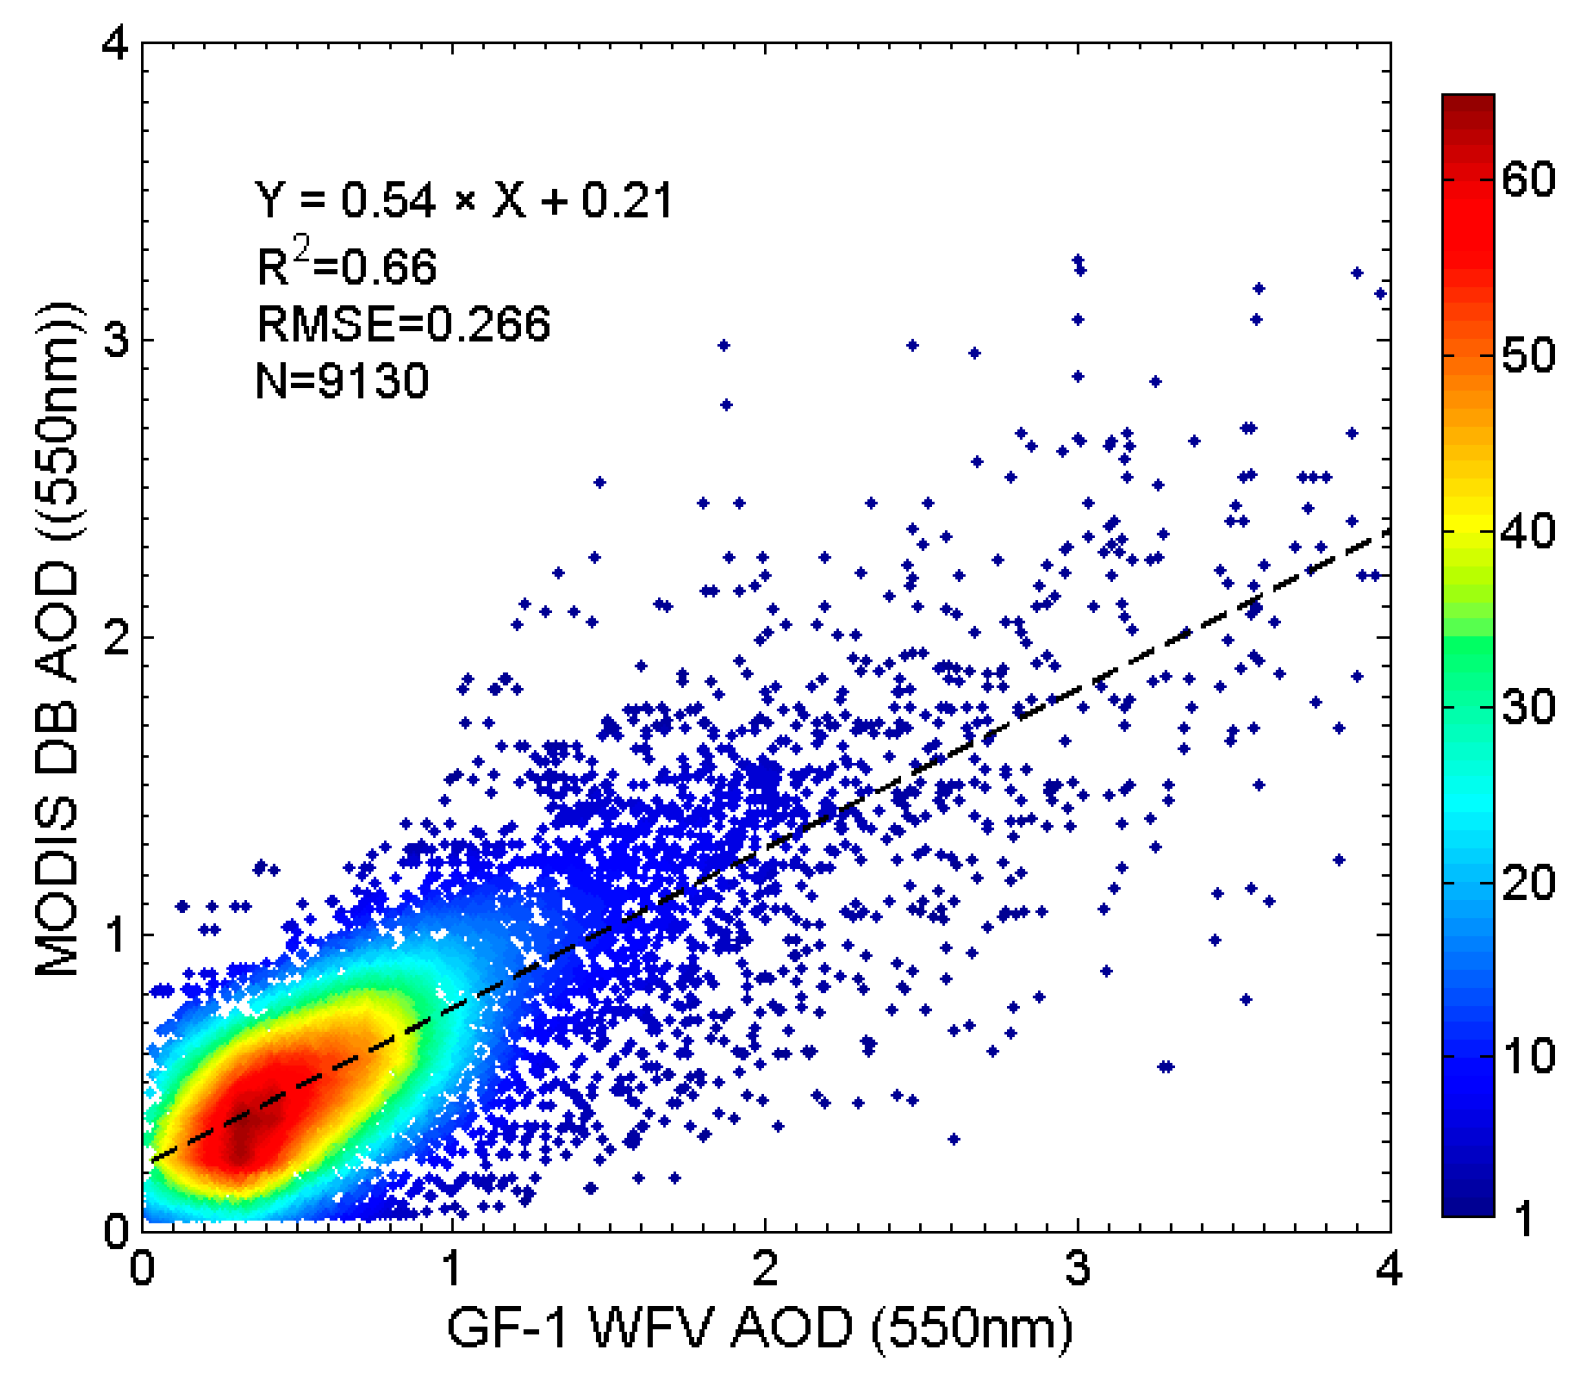
To further validate the spatial and temporal consistency between GF-1 WFV AOD and MODIS AOD, we resampled all the GF-1 WFV AOD data to the same spatial resolution of MODIS DB AOD, and then compared the GF-1 WFV AOD with the spatio-temporally matched MODIS DB AOD. Figure 13 shows the relationship between GF-1 WFV AOD and MODIS DB AOD. They present a reasonable relationship, with a correlation coefficient (R2) of 0.66 and root mean square error (RMSE) of 0.266. The slope (0.54) is less than 1, indicating that GF-1 WFV AOD is generally higher than MODIS DB AOD.
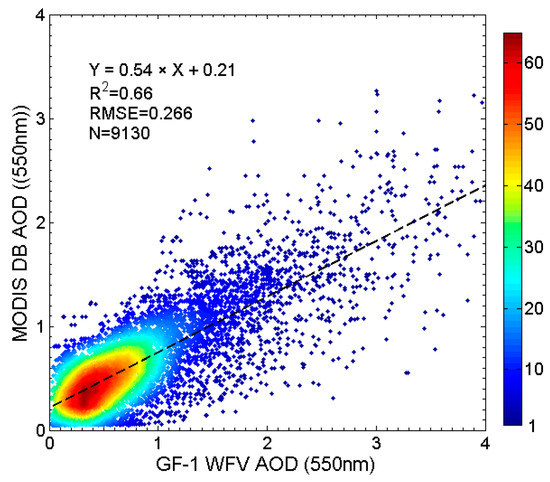
Figure 13.
Relationship between GF-1 WFV AOD and MODIS DB AOD at 550 nm. RMSE and N represent Root Mean Square Error and total number of matched pixels respectively.
4.3. Comparison of GF-1 WFV AOD with Ground Measurements
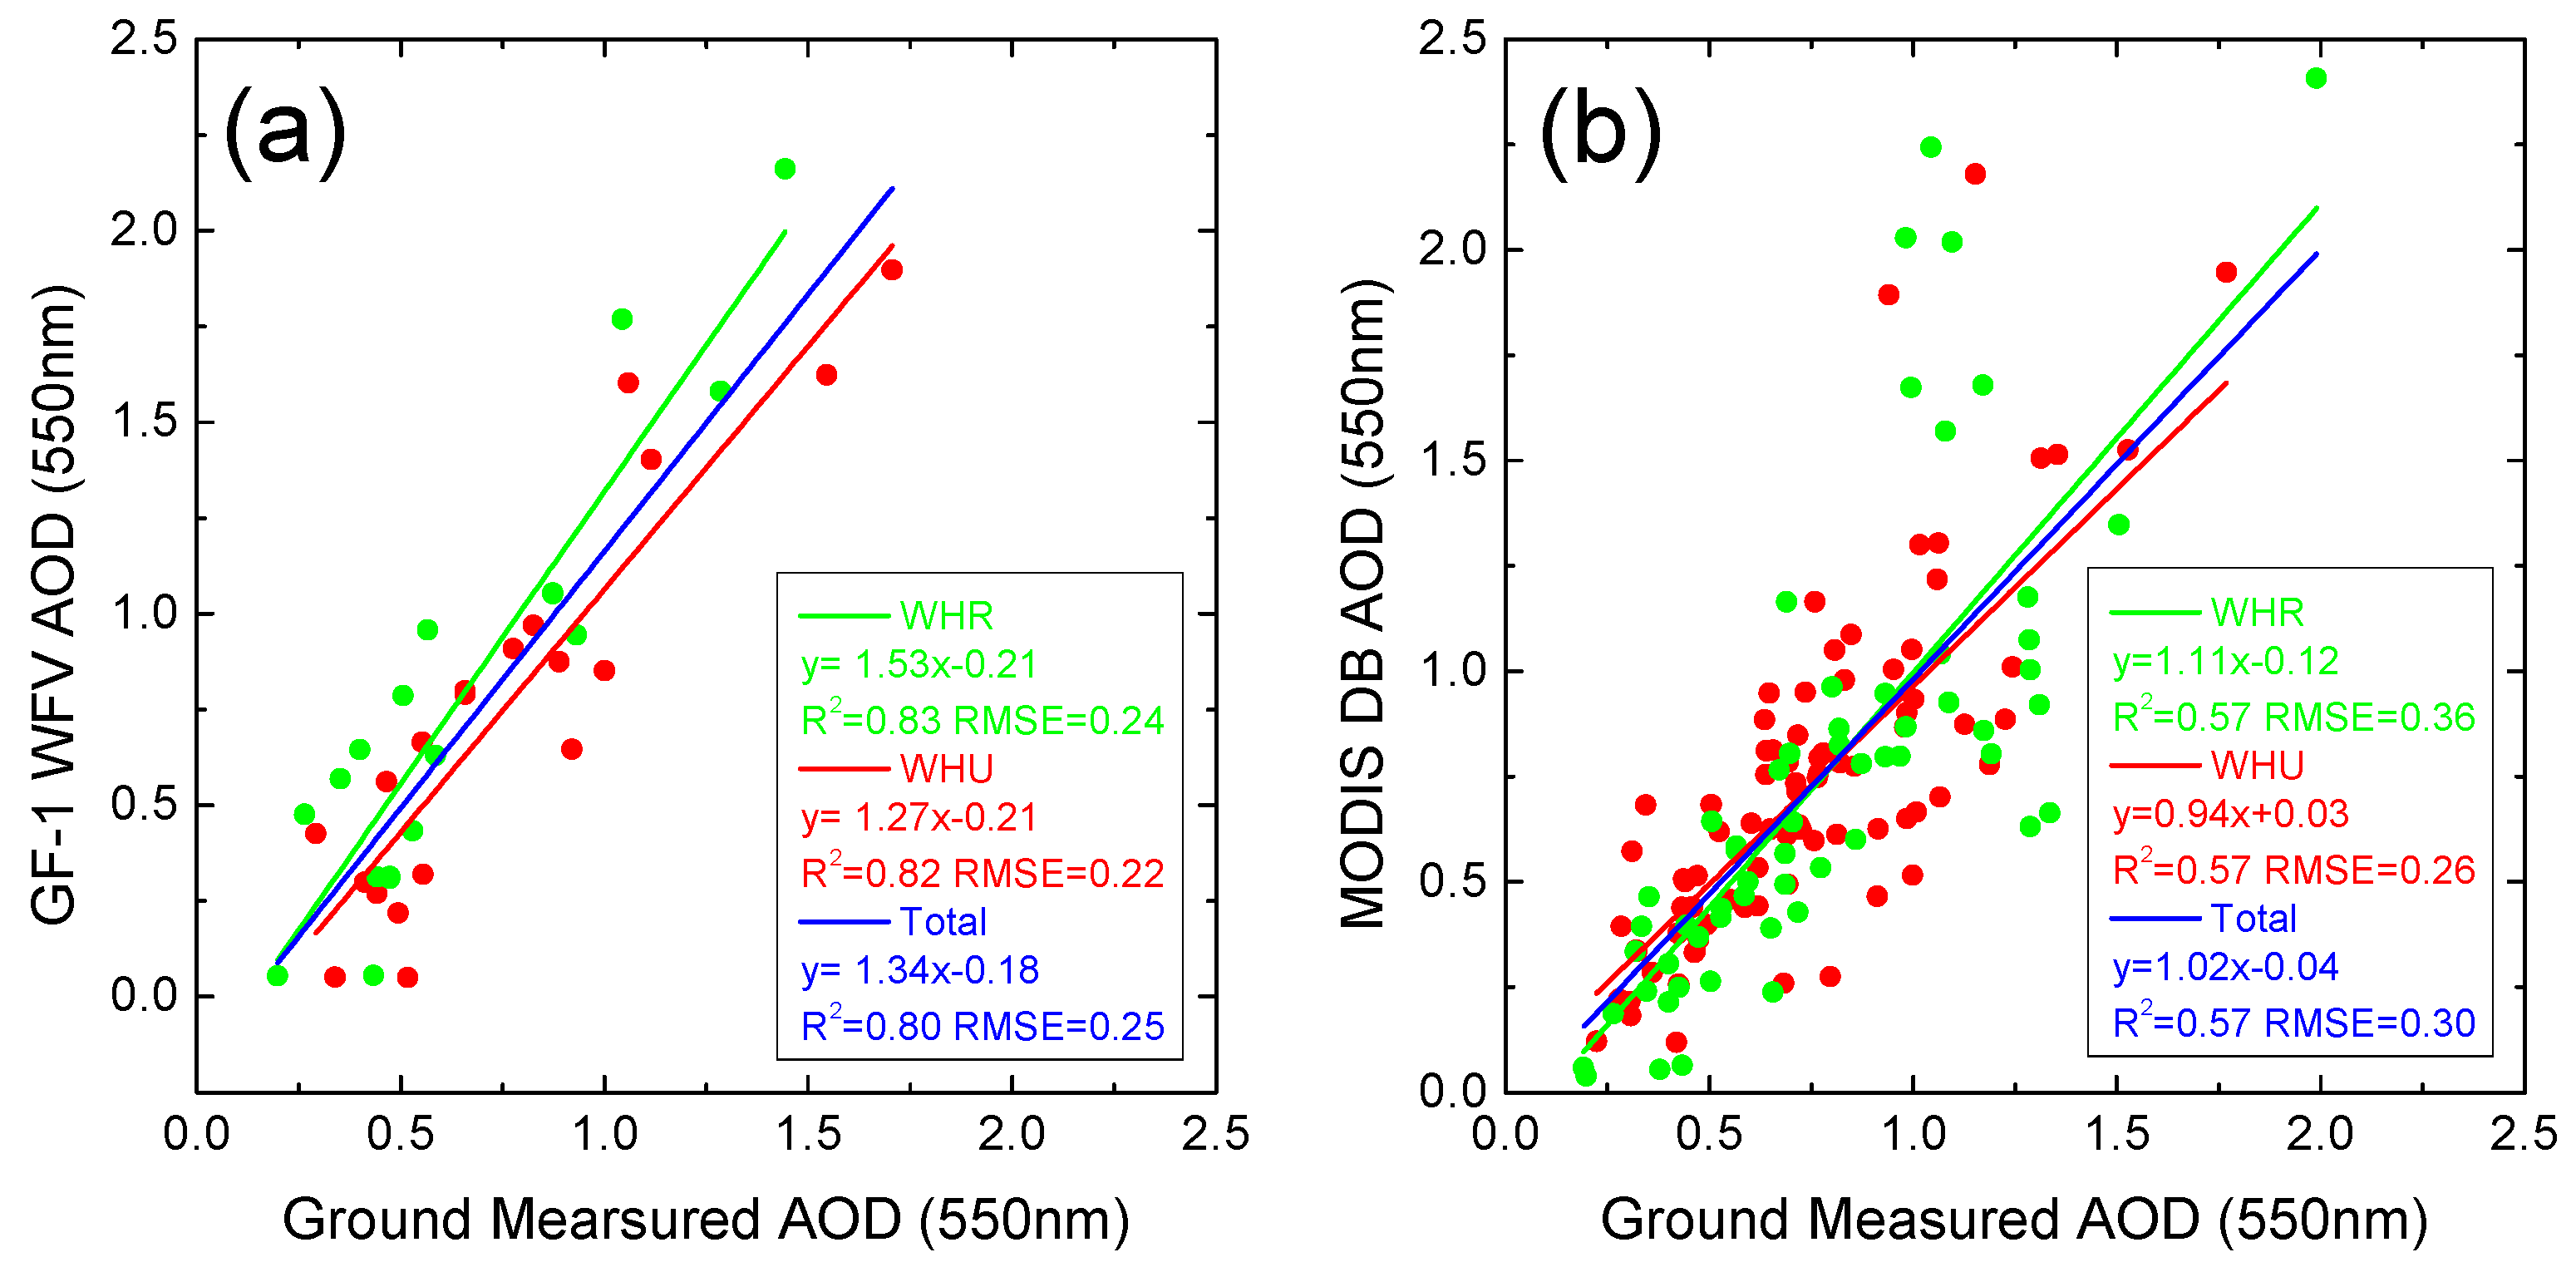
Using the ground measurements at WHU and WHR (See Figure 1) from December 2014 to June 2015, we evaluated the accuracy of GF-1 WFV and MODIS AOD. The criterion of collocation between satellite-derived and ground-measured AOD is: (1) the time difference between satellite and ground measurements is less than 30 minutes; (2) the collocated satellite-derived AOD is the average value of pixels within a sampling widow (3 × 3 for MODIS DB AOD, 5 × 5 for GF-1 WFV AOD) centered on the ground site. The scatter plots between GF-1 WFV AOD, MODIS DB AOD and ground-measured AOD are shown in Figure 14. Because the satellite-derived AOD was reported to show different accuracies and biases in different regions with various surface types [45], we therefore performed independent statistics over ground sites WHU and WHR.
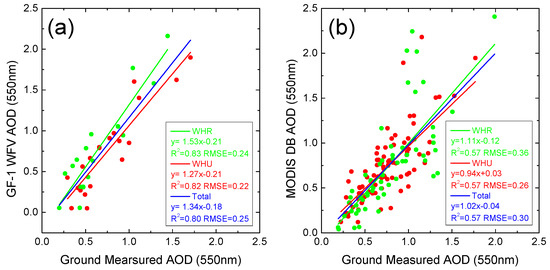
Figure 14.
A comparison between GF-1 WFV AOD, MODIS DB AOD and ground-measured AOD at 550nm. (a) Scatter plot between GF-1 WFV AOD and ground-measured AOD; (b) Scatter plot between MODIS DB AOD and ground-measured AOD.
Compared with MODIS DB AOD (R2 = 0.57; RMSE = 0.30), GF-1 WFV AOD shows a better relationship with ground measurements, with a higher correlation coefficient (R2 = 0.80) and a smaller RMSE (RMSE = 0.25). However, the slope between GF-1 WFV AOD and ground measurements is 1.34, indicating that the proposed algorithm tends to overestimate AOD, whereas the slope between MODIS DB AOD and ground measurements is close to 1, indicating that the MODIS DB algorithm has smaller bias error. Generally, the relationship of satellite-derived and ground-measured AOD is approximately the same at urban (WHU) and rural (WHR) site for GF-1 WFV and MODIS data. Moreover, the slope at WHU is higher than the slope at WHR for both GF-1 WFV and MODIS AOD, thereby indicating that the proposed algorithm and MODIS DB algorithm have better accuracy over urban areas when compared to rural areas.
4.4. Performance and Limitations of the Proposed Algorithm
To our knowledge, retrieving high resolution AOD from satellite data is still uncommon at the present time. In related literature, Sun et al. [9,46] made an attempt to retrieve AOD from Chinese HJ-1 CCD and Landsat 8 OLI data with the support of MODIS surface reflectance products. The method may contain specific uncertainties in the transformation of different satellite data, and is limited in the spatial resolution of retrieved AOD (up to 500 m corresponding to the resolution of MODIS data). Luo et al. [43] proposed a mixed algorithm of the DT and DB methods to retrieve high resolution AOD from Landsat TM data over Beijing. The application potential of the method is limited, however, due to the long re-visiting period (16 days) of Landsat TM images.
By making full use of high spatial and temporal resolution of GF-1 WFV data, an operational AOD retrieval algorithm was proposed in this paper. The algorithm is capable of retrieving AOD over both bright and dark land surfaces in cloudless condition. The retrieved GF-1 WFV AOD has a spatial resolution of 160 m and temporal resolution of 4 days, which makes it possible to capture the detailed spatial variety and complete process of haze pollution over Wuhan region (as shown in Figure 9 and Figure 10). The retrieved GF-1 WFV AOD achieve a high consistency with collocated MODIS AOD (R2 = 0.66; RMSE = 0.27) and ground measurements (R2 = 0.80; RMSE = 0.25). The validation results are on the same level as the performance of regional high resolution MODIS AOD retrieval over north and south China [42,47]. Nevertheless, the proposed algorithm tends to overestimate AOD in the comparison with MODIS AOD and ground measurements, which need to be further analyzed and improved upon in future research.
To analyze the error sources of the proposed algorithm, we visualized the relative errors ((GF-1 WFV AOD − Ground-measured AOD)/Ground-measured AOD) from view of different WFVs, seasons and scattering angles (Figure 15). First, GF-1 satellite has four WFV cameras all used in the AOD retrieval. Satellite data from four WFV cameras have different view geometries and sensor response characteristics, which may result in errors in the retrieval algorithm. The relative error distribution of GF-1 WFV AOD classified by WFVs is shown in Figure 15a. WFV1 has the most collocated AODs, 81% of which show a positive relative error. WFV4 has only 4 collocated AODs, all of them showing a negative relative error. It seems that the algorithm accuracy changes with different WFV sensors, though more data is needed to confirm this conclusion. Second, As GF-1 WFV AOD is retrieved by the seasonal surface reflectance database, there may exist seasonal difference in the algorithm accuracy. It can be seen from the limited collocated AODs that the algorithm tends to overestimate AOD in spring (MAM) and underestimate AOD in winter (DJF) (Figure 15b). The seasonal difference is mainly caused by impact factors such as background aerosol correction and minimum reflectance image composite in the establishment of surface reflectance database. Finally, the BRDF effect correction is significant for the MODIS DB algorithm [26,47], whereas it was also found that the effect of BRDF correction was not significant for MODIS data in a regional study [40]. As for the GF-1 WFV data, the BRDF effect seems to be severer for the high spatial resolution and wide swath. In the proposed algorithm, the BRDF effect was minimized by limiting satellite view zenith angle (<30°) and adopting window-based calculation strategy in the surface reflectance determination process. In order to evaluate the impact of BRDF effect on the algorithm accuracy, the relative error distribution of GF-1 WFV AOD along with corresponding scattering angles were analyzed in Figure 15c. Nearly all AODs with relatively low scattering angles (100°–120°) have a small positive relative error, whereas AODs with high scattering angles (120°–150°) show an irregular variation in the relative error. More specifically, the small number of high relative errors in absolute value (>80%) all occur in high scattering angles (>130°). This analysis demonstrates the impact of the BRDF effect on the accuracy of the proposed algorithm, which needs to be taken into account in future research.
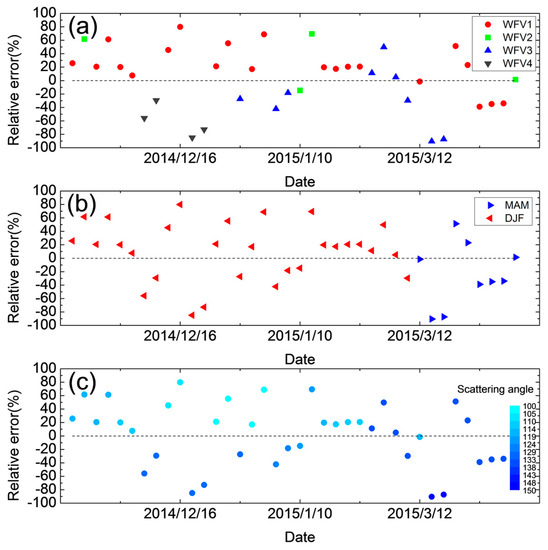
Figure 15.
The relative error distribution of GF-1 WFV AOD. (a) Relative error distribution classified by WFV sensors; (b) relative error distribution classified by seasons; (c) relative error distribution classified by scattering angles (°).
5. Conclusions
To fill in the blank of high resolution Aerosol Optical Depth (AOD) for regional air quality studies, we proposed an improved approach to retrieve AOD from Gaofen-1 Wide-Field-of-View (GF-1 WFV) data. The proposed algorithm can work effectively over all land surface types in Wuhan area, with a spatial resolution of 160 m × 160 m and a temporal resolution of 4 days. The improved techniques used in the algorithm include: (1) Seasonal aerosol model over Wuhan was obtained and introduced in 6S model based on long-term ground measurements; (2) The moderate-resolution imaging spectroradiometer (MODIS) AOD product was introduced to support the image selection and background aerosol correction in the establishment of seasonal surface reflectance database for GF-1 WFV data.
Retrieved results show that the proposed algorithm works well during clear and hazy days, and provides more abundant details in spatial distribution than the MODIS AOD product. The GF-1 WFV AOD data were compared with MODIS and ground-measured AOD respectively for validation. Generally, GF-1 WFV AOD presents a good relationship with MODIS AOD (R2 = 0.66; RMSE = 0.27) and ground measurements (R2 = 0.80; RMSE = 0.25). Moreover, compared with MODIS AOD, GF-1 WFV AOD has a finer spatial resolution and covers more land surface types, rendering it more suitable for application in the studies of regional atmospheric environments such as air quality and haze monitoring.
There still exist some uncertainties to be further determined in the proposed algorithm. Although a high correlation is achieved in the validation against MODIS and ground-measured AOD, the proposed algorithm tends to overestimate AOD in many cases. Key factors including season, different WFV cameras and Bidirectional Reflectance Distribution Function (BRDF) effect were found to have potential impact on the accuracy of the algorithm. In order to improve the stability and accuracy of the algorithm, the impact of these factors need to be further analyzed after a collection of more satellite and ground measurements in the future.
Finally, it should be noted here that in recent years the Chinese government has launched an increasing number of satellites (e.g., HJ-1A/B, CBERS-04, GF-2, and GF-4) for ecological environment monitoring (for detail information, please see http://www.cresda.com/CN/index.shtml). These satellites have similar orbits, band sets, as well as spatial and temporal resolutions. The algorithm described here provides a good example for the application of these satellites to atmospheric environment monitoring.
Acknowledgments
This study was financially supported by the program of Key Laboratory for National Geographic Census and Monitoring, National Administration of Surveying, Mapping and Geo-information (No. 2014NGCM), the Public Interest Fund of Surveying & Mapping and Geoinformation Research (No. 201512026), the China Postdoctoral Science Foundation (Grant No. 2015M572198), the Hubei Provincial Natural Science Foundation of China(No. 2016CFB620), and the National Science Foundation of China (Grant No. 41331174). We thank China Centre for Resources Satellite Data and Application for providing GF-1 WFV data, and MODIS team for the AOD data used in the research.
Author Contributions
Kun Sun designed and performed the experiments, and prepared the manuscript draft. Xiaoling Chen helped to organize the research and outline the manuscript structure. Zhongmin Zhu contributed the data analysis and preparation of the manuscript. Tianhao Zhang helped to process the GF-1 data in the research.
Conflicts of Interest
The authors declare no conflict of interest.
References
- Haywood, J.; Boucher, O. Estimates of the direct and indirect radiative forcing due to tropospheric aerosols: A review. Rev. Geophys. 2000, 38, 513–543. [Google Scholar] [CrossRef]
- Kaufman, Y.J.; Tanre, D.; Boucher, O. A satellite view of aerosols in the climate system. Nature 2002, 419, 215–223. [Google Scholar] [CrossRef] [PubMed]
- Sun, Y.; Wang, Z.; Wild, O.; Xu, W.; Chen, C.; Fu, P.; Du, W.; Zhou, L.; Zhang, Q.; Han, T.; et al. “APEC Blue”: Secondary aerosol reductions from emission controls in Beijing. Sci. Rep. 2016, 6, 20668. [Google Scholar] [CrossRef] [PubMed]
- Mishchenko, M.I.; Geogdzhayev, I.V.; Cairns, B.; Carlson, B.E.; Chowdhary, J.; Lacis, A.A.; Liu, L.; Rossow, W.B.; Travis, L.D. Past, present, and future of global aerosol climatologies derived from satellite observations: A perspective. J. Quant. Spectrosc. Radiat. Transf. 2007, 106, 325–347. [Google Scholar] [CrossRef]
- Yang, J.; Gong, P.; Fu, R.; Zhang, M.; Chen, J.; Liang, S.; Xu, B.; Shi, J.; Dickinson, R. The role of satellite remote sensing in climate change studies. Nat. Clim. Chang. 2013, 3, 875–883, Erratum in 2014, 4, 74. [Google Scholar] [CrossRef]
- Holben, B.; Vermote, E.; Kaufman, Y.J.; Tanré, D.; Kalb, V. Aerosol retrieval over land from AVHRR data-application for atmospheric correction. IEEE Trans. Geosci. Remote Sens. 1992, 30, 212–222. [Google Scholar] [CrossRef]
- Remer, L.A.; Kaufman, Y.; Tanré, D.; Mattoo, S.; Chu, D.; Martins, J.V.; Li, R.-R.; Ichoku, C.; Levy, R.; Kleidman, R. The MODIS aerosol algorithm, products, and validation. J. Atmos. Sci. 2005, 62, 947–973. [Google Scholar] [CrossRef]
- Lee, K.H.; Li, Z.; Kim, Y.J.; Kokhanovsky, A. Atmospheric aerosol monitoring from satellite observations: A history of three decades. In Atmospheric and Biological Environmental Monitoring; Springer: Heidelberg, Germany, 2009; pp. 13–38. [Google Scholar]
- Sun, L.; Sun, C.K.; Liu, Q.H.; Zhong, B. Aerosol optical depth retrieval by HJ-1/CCD supported by MODIS surface reflectance data. Sci. China Earth Sci. 2010, 53, 74–80. [Google Scholar] [CrossRef]
- Ma, Z.; Hu, X.; Sayer, A.M.; Levy, R.; Zhang, Q.; Xue, Y.; Tong, S.; Bi, J.; Huang, L.; Liu, Y. Satellite-based spatiotemporal trends in PM2.5 concentrations: China, 2004–2013. Environ. Health Perspect. 2016, 124, 184–192. [Google Scholar] [CrossRef] [PubMed]
- Tao, M.; Chen, L.; Su, L.; Tao, J. Satellite observation of regional haze pollution over the North China Plain. J. Geophys. Res. Atmos. 2012, 117. [Google Scholar] [CrossRef]
- Omar, A.H.; Won, J.G.; Winker, D.M.; Yoon, S.C.; Dubovik, O.; McCormick, M.P. Development of global aerosol models using cluster analysis of Aerosol Robotic Network (AERONET) measurements. J. Geophys. Res. Atmos. 2005, 110. [Google Scholar] [CrossRef]
- Li, C.; Lau, A.; Mao, J.; Chu, D. Retrieval, Validation, and Application of the 1-km Aerosol Optical Depth from MODIS Measurements over Hong Kong. IEEE Trans. Geosci. Remote Sens. 2005, 43, 2650–2658. [Google Scholar]
- Kaufman, Y.J.; Wald, A.E.; Remer, L.A.; Gao, B.-C.; Li, R.-R.; Flynn, L. The MODIS 2.1-μm channel-correlation with visible reflectance for use in remote sensing of aerosol. IEEE Trans. Geosci. Remote Sens. 1997, 35, 1286–1298. [Google Scholar] [CrossRef]
- Levy, R.C.; Remer, L.A.; Mattoo, S.; Vermote, E.F.; Kaufman, Y.J. Second-generation operational algorithm: Retrieval of aerosol properties over land from inversion of Moderate Resolution Imaging Spectroradiometer spectral reflectance. J. Geophys. Res. Atmos. 2007, 112. [Google Scholar] [CrossRef]
- Kaufman, Y.J.; Tanré, D.; Remer, L.A.; Vermote, E.F.; Chu, A.; Holben, B.N. Operational remote sensing of tropospheric aerosol over land from EOS moderate resolution imaging spectroradiometer. J. Geophys. Res. Atmos. 1997, 102, 17051–17067. [Google Scholar] [CrossRef]
- Liang, S.; Fallah-Adl, H.; Kalluri, S.; JáJá, J.; Kaufman, Y.J.; Townshend, J.R.G. An operational atmospheric correction algorithm for Landsat Thematic Mapper imagery over the land. J. Geophys. Res. Atmos. 1997, 102, 17173–17186. [Google Scholar] [CrossRef]
- Gillingham, S.; Flood, N.; Gill, T.; Mitchell, R. Limitations of the dense dark vegetation method for aerosol retrieval under Australian conditions. Remote Sens. Lett. 2012, 3, 67–76. [Google Scholar] [CrossRef]
- Santer, R.; Ramon, D.; Vidot, J.; Dilligeard, E. A surface reflectance model for aerosol remote sensing over land. Int. J. Remote Sens. 2007, 28, 737–760. [Google Scholar] [CrossRef]
- Nichol, J.E.; Wong, M.S.; Chan, Y.Y. Fine resolution air quality monitoring from a small satellite: CHRIS/PROBA. Sensors 2008, 8, 7581–7595. [Google Scholar] [CrossRef] [PubMed]
- Wang, Z.; Chen, L.; Gong, H.; Gao, H. Modified DDV method of aerosol optical depth inversion over land surfaces from CBERS02B. J. Remote Sens. 2009, 13, 1047–1059. [Google Scholar]
- Munchak, L.; Levy, R.; Mattoo, S.; Remer, L.; Holben, B.; Schafer, J.; Hostetler, C.; Ferrare, R. MODIS 3 km aerosol product: Applications over land in an urban/suburban region. Atmos. Meas. Tech. 2013, 6, 1747–1759. [Google Scholar] [CrossRef]
- Levy, R.C.; Remer, L.A.; Kleidman, R.G.; Mattoo, S.; Ichoku, C.; Kahn, R.; Eck, T.F. Global evaluation of the Collection 5 MODIS dark-target aerosol products over land. Atmos. Chem. Phys. 2010, 10, 10399–10420. [Google Scholar] [CrossRef]
- Hsu, N.C.; Gautam, R.; Sayer, A.M.; Bettenhausen, C.; Li, C.; Jeong, M.J.; Tsay, S.C.; Holben, B.N. Global and regional trends of aerosol optical depth over land and ocean using SeaWiFS measurements from 1997 to 2010. Atmos. Chem. Phys. 2012, 12, 8037–8053. [Google Scholar] [CrossRef]
- Hsu, N.C.; Tsay, S.-C.; King, M.D.; Herman, J.R. Deep blue retrievals of Asian aerosol properties during ACE-Asia. IEEE Trans. Geosci. Remote Sens. 2006, 44, 3180–3195. [Google Scholar] [CrossRef]
- Hsu, N.; Jeong, M.J.; Bettenhausen, C.; Sayer, A.; Hansell, R.; Seftor, C.; Huang, J.; Tsay, S.C. Enhanced deep blue aerosol retrieval algorithm: The second generation. J. Geophys. Res. Atmos. 2013, 118, 9296–9315. [Google Scholar] [CrossRef]
- Lee, J.; Kim, J.; Song, C.H.; Ryu, J.; Ahn, Y.; Song, C.K. Algorithm for retrieval of aerosol optical properties over the ocean from the Geostationary Ocean Color Imager. Remote Sens. Environ. 2010, 114, 1077–1088. [Google Scholar] [CrossRef]
- Guo, J.P.; Zhang, X.Y.; Wu, Y.R.; Zhaxi, Y.; Che, H.Z.; La, B.; Wang, W.; Li, X.W. Spatio-temporal variation trends of satellite-based aerosol optical depth in China during 1980–2008. Atmos. Environ. 2011, 45, 6802–6811. [Google Scholar] [CrossRef]
- Lu, Z.; Zhang, Q.; Streets, D.G. Sulfur dioxide and primary carbonaceous aerosol emissions in China and India, 1996–2010. Atmos. Chem. Phys. 2011, 11, 9839–9864. [Google Scholar] [CrossRef]
- Cheng, H.; Gong, W.; Wang, Z.; Zhang, F.; Wang, X.; Lv, X.; Liu, J.; Fu, X.; Zhang, G. Ionic composition of submicron particles (PM1.0) during the long-lasting haze period in January 2013 in Wuhan, central China. J. Environ. Sci. 2014, 26, 810–817. [Google Scholar] [CrossRef]
- Song, J.; Guang, W.; Li, L.; Xiang, R. Assessment of air quality status in Wuhan, China. Atmosphere 2016, 7, 56. [Google Scholar] [CrossRef]
- Wang, L.; Gong, W.; Xia, X.; Zhu, J.; Li, J.; Zhu, Z. Long-term observations of aerosol optical properties at Wuhan, an urban site in Central China. Atmos. Environ. 2015, 101, 94–102. [Google Scholar] [CrossRef]
- Feng, L.; Li, J.; Gong, W.; Zhao, X.Z.; Chen, X.; Pang, X. Radiometric cross-calibration of Gaofen-1 WFV cameras using Landsat-8 OLI images: A solution for large view angle associated problems. Remote Sens. Environ. 2016, 174, 56–68. [Google Scholar] [CrossRef]
- Li, J.; Chen, X.L.; Tian, L.Q.; Huang, J.; Feng, L. Improved capabilities of the Chinese high-resolution remote sensing satellite GF-1 for monitoring suspended particulate matter (SPM) in inland waters: Radiometric and spatial considerations. ISPRS J. Photogramm. Remote Sens. 2015, 106, 145–156. [Google Scholar] [CrossRef]
- Vermote, E.F.; Tanré, D.; Deuze, J.L.; Herman, M.; Morcette, J. Second simulation of the satellite signal in the solar spectrum, 6S: An overview. IEEE Trans. Geosci. Remote Sens. 1997, 35, 675–686. [Google Scholar] [CrossRef]
- Li, Z.; Niu, F.; Lee, K.; Xin, J.; Hao, W.; Nordgren, B.; Wang, Y.; Wang, P. Validation and understanding of Moderate Resolution Imaging Spectroradiometer aerosol products (C5) using ground-based measurements from the handheld Sun photometer network in China. J. Geophys. Res. Atmos. 2007, 112. [Google Scholar] [CrossRef]
- He, Q.; Li, C.; Tang, X.; Li, H.; Geng, F.; Wu, Y. Validation of MODIS derived aerosol optical depth over the Yangtze River Delta in China. Remote Sens. Environ. 2010, 114, 1649–1661. [Google Scholar] [CrossRef]
- Giles, D.M.; Holben, B.N.; Eck, T.F.; Sinyuk, A.; Smirnov, A.; Slutsker, I.; Dickerson, R.R.; Thompson, A.M.; Schafer, J.S. An analysis of AERONET aerosol absorption properties and classifications representative of aerosol source regions. J. Geophys. Res. Atmos. 2012, 117. [Google Scholar] [CrossRef]
- Russell, P.B.; Bergstrom, R.W.; Shinozuka, Y.; Clarke, A.D.; DeCarlo, P.F.; Jimenez, J.L.; Livingston, J.M.; Redemann, J.; Dubovik, O.; Strawa, A. Absorption angstrom exponent in AERONET and related data as an indicator of aerosol composition. Atmos. Chem. Phys. 2010, 10, 1155–1169. [Google Scholar] [CrossRef]
- Kim, M.; Kim, J.; Wong, M.S.; Yoon, J.; Lee, J.; Wu, D.; Chan, P.W.; Nichol, J.; Chung, C.; Ou, M. Improvement of aerosol optical depth retrieval over Hong Kong from a geostationary meteorological satellite using critical reflectance with background optical depth correction. Remote Sens. Environ. 2014, 142, 176–187. [Google Scholar] [CrossRef]
- Levy, R.; Mattoo, S.; Munchak, L.; Remer, L.; Sayer, A.; Patadia, F.; Hsu, N. The Collection 6 MODIS aerosol products over land and ocean. Atmos. Meas. Tech. 2013, 6, 2989–3034. [Google Scholar] [CrossRef]
- Wong, M.S.; Nichol, J.; Lee, K.H. An operational MODIS aerosol retrieval algorithm at high spatial resolution, and its application over a complex urban region. Atmos. Res. 2011, 99, 579–589. [Google Scholar] [CrossRef]
- Luo, N.; Wong, M.S.; Zhao, W.; Yan, X.; Xiao, F. Improved aerosol retrieval algorithm using Landsat images and its application for PM10 monitoring over urban areas. Atmos. Res. 2015, 153, 264–275. [Google Scholar] [CrossRef]
- Gupta, P.; Khan, M.N.; da Silva, A.; Patadia, F. Modis aerosol optical depth observations over urban areas in Pakistan: Quantity and quality of the data for air quality monitoring. Atmos. Pollut. Res. 2013, 4, 43–52. [Google Scholar] [CrossRef]
- Nichol, J.; Bilal, M. Validation of MODIS 3 km resolution aerosol optical depth retrievals over Asia. Remote Sens. 2016, 8, 328. [Google Scholar] [CrossRef]
- Sun, L.; Wei, J.; Bilal, M.; Tian, X.; Jia, C.; Guo, Y.; Mi, X. Aerosol optical depth retrieval over bright areas using Landsat 8 OLI images. Remote Sens. 2016, 8, 23. [Google Scholar] [CrossRef]
- Li, S.; Chen, L.; Xiong, X.; Tao, J.; Su, L.; Han, D.; Liu, Y. Retrieval of the haze optical thickness in North China Plain using MODIS data. IEEE Trans. Geosci. Remote Sens. 2013, 51, 2528–2540. [Google Scholar] [CrossRef]


© 2017 by the authors; licensee MDPI, Basel, Switzerland. This article is an open access article distributed under the terms and conditions of the Creative Commons Attribution (CC-BY) license (http://creativecommons.org/licenses/by/4.0/).