Article

Analysis of the Qinghai-Xizang Plateau Monsoon Evolution and Its Linkages with Soil Moisture

1
Key Laboratory of Land Surface Process and Climate Change in Cold and Arid Regions, Cold and Arid Regions Environmental and Engineering Research Institute, Chinese Academy of Sciences, Lanzhou 730000, China
2
University of Chinese Academy of Sciences, Beijing 100049, China
*
Author to whom correspondence should be addressed.
Remote Sens. 2016, 8(6), 493; https://doi.org/10.3390/rs8060493
Submission received: 4 March 2016 / Revised: 26 May 2016 / Accepted: 3 June 2016 / Published: 10 June 2016

Abstract

:
The evolution of plateau monsoons is essential to synoptic climatology processes over the Qinghai-Xizang Plateau. Based on ERA-Interim Reanalysis data covering 1979–2014 from the European Centre for Medium-Range Weather Forecasts (ECMWF), we propose a new plateau monsoon index (ZPMI) that can effectively reflect the evolution of monsoons and compare this new index with the existing Plateau Monsoon Indices (PMI), i.e., the Traditional Plateau Monsoon Index (TPMI), the Dynamic Plateau Monsoon Index (DPMI), and the PMI proposed by Qi et al. (QPMI). The results show that the onset and retreat of plateau monsoons determined by the TPMI are approximately 1–2 months earlier than those of the ZPMI and DPMI and that the ZPMI can better reflect seasonal and inter-annual variations in precipitation over the plateau. The plateau summer and winter monsoons have similar inter-annual and inter-decadal variation characteristics and show a rising trend, but the increasing trend of the summer monsoon is more significant. The ZPMI is also capable of effectively reflecting meteorological elements. In stronger plateau summer monsoon years, more (less) precipitation and a higher (lower) air temperature appear over the eastern and central (western) plateau. The ZPMI and soil moisture in April and May are used to explore the influence of soil moisture on plateau monsoons, and a significant correlation is found between the plateau soil moisture in the spring (April–May) and plateau summer monsoons. It is found that when the soil moisture over the central and eastern plateau is higher (lower) than normal (while the soil moisture over the western plateau is lower (higher)), the plateau summer monsoon may be stronger (weaker).

Graphical Abstract

1. Introduction

Research on the Qinghai-Xizang Plateau (hereafter referred to simply as “plateau”) monsoons, as well as their influence on climate, have existed for more than half a century. In the mid-1950s, Ye et al. [1] first proposed that the surface winds around the plateau in the summer are basically due to cyclonic rotation and that the convergence of the airflow causes an ascending motion over the plateau. They suggested that this phenomenon is a direct result of the thermal effect over the plateau. In the free atmosphere, the plateau is a special thermodynamic system, and its seasonal variation in thermal effects can lead to a seasonal pressure system. The shifts of cold and heat sources in the winter and summer over the plateau can also cause the seasonal transformation of the cold high and the warm low, which can lead to a monsoon phenomenon over the plateau, similar to that caused by land-sea thermal differences [2]. The concept of the plateau monsoon was definitively put forward by Gao and Tang at an annual meteorology conference in Gansu Province in 1962 [3]. Since then, the structure of the plateau monsoon and its climatological characteristics of pressure, precipitation, and temperature fields have been analyzed [3,4]. The monsoon in the western part of North America was later determined to be similar to that of the plateau [5] and, since then, the international scientific community has accepted concept of the plateau monsoon. Numerical modelling results have also shown that the warm low and the plateau monsoon in the summer are caused by thermal forcing over the plateau [6]. Therefore, the plateau monsoon has been confirmed from both observational data analysis and simulation experiments.
A monsoon index is a criterion used to measure the intensity of a monsoon and is also a basis for discussing the evolutionary characteristics of a monsoon. The traditional plateau monsoon index (TPMI) was defined based on 600 hPa height fields, and its inter-annual and inter-decadal variation characteristics were preliminarily analyzed [7,8]. Then, Bai et al. [9] put forward a new plateau monsoon index based on the TPMI, and the onset and retreat of the plateau monsoon were preliminarily confirmed. A dynamic plateau monsoon index (DPMI) was constructed as a revision of the TPMI that introduced the center positions of surface pressure systems, and the response of general circulation to plateau summer monsoon anomalies was also investigated [10]. In considering the circulation characteristics of the plateau monsoon, Qi et al. [11] adopted 600 hPa wind fields to define a new plateau monsoon index (QPMI) and compared it to the TPMI; a better correlation was found between the plateau summer monsoon index and the summer meteorological elements over the Sichuan and Chongqing Basins.
Soil moisture is a key factor for characterizing land surface conditions and it also plays an important role in land–atmosphere interactions. By changing the underlying surface parameters, such as thermal capacity and albedo, soil moisture can influence the surface sensible heat and latent heat transport and eventually affect local climate change [12]. A change in soil moisture can also influence the surface water cycle and evaporation and directly affect water and energy exchanges between the land surface and the atmosphere [13]. Previous studies have mainly investigated the contributions of soil moisture anomalies to Asian or African monsoons, rather than to plateau monsoons. For instance, Douville et al. [14,15,16,17] indicated that in India and Africa, spring soil moisture changes can significantly affect the local daily precipitation and inter-annual variation intensity of a monsoon system and that soil moisture also has a great influence on seasonal climate evolution and precipitation predictions. A strong positive correlation was found between spring soil moisture over China and the East Asian summer monsoon [18]. Using a regional climate model, Chow et al. [19] indicated that an increase in initial soil moisture in the Plateau during the spring may lead to an increase in the amount of monsoon precipitation over the mid to lower reaches of the Yangtze River region in eastern China and a decrease over the south China region. Changes in the spring soil moisture of the Plateau have a significant influence on atmospheric circulation during the build-up to the Asian summer monsoon and early summer precipitation over eastern China, as shown by the regional climate model RegCM3.0 [20]. Zhang et al. [21] used both observed and reanalysis data to show that spring (April–May) soil moisture has a significant impact on the summer monsoon circulation over East Asia and on precipitation in east China because it alters surface thermal conditions. The East Asian early winter (November) monsoons are shown to be significantly correlated with soil moisture in the previous summer in eastern China, with a center located at the lower reaches of the Yellow River [22]. Moreover, a significant positive correlation was found between monsoon precipitation in June and the preceding soil moisture over the mid-lower reaches of the Yangtze River basin [23].
As seen from the discussion above, the importance of studies on soil moisture and plateau monsoons has long been realized. However, the evolution of the plateau monsoon and its linkages with soil moisture over the plateau have rarely been discussed. In the present paper, by considering the wind field characteristics over the plateau, a Plateau Monsoon Index (ZPMI), which could effectively reflect the evolution of a monsoon, is constructed. To date, no clear conclusion has been reached on which plateau monsoon index can better describe the characteristics of the plateau monsoon. Thus, a comparative analysis was performed among several typical indices and the newly-defined index in the present study. Additionally, the variation characteristics of the plateau monsoon, as well as the linkages between the spring (April–May) soil moisture over the plateau and the plateau summer monsoon, are investigated.

2. Data and Methodology

2.1. Data

The data used in the study are derived from the European Centre for Medium-Range Weather Forecasts (ECMWF) Interim Reanalysis (ERA-Interim) and have a resolution of 0.75° × 0.75°. Data from 1979–2014 include the daily total precipitation, the monthly mean volumetric water content, the geopotential height, the 2 m temperature, and U and V winds. The soil moisture data are classified into four layers: 7, 21, 72, and 189 cm.
With respect to the reliability of the reanalysis data, some scholars [11,24,25] have used ECMWF reanalysis data to calculate plateau monsoon indices. Therefore, it is feasible to utilize ERA-Interim data for the study of the plateau monsoons. Zhao et al. [26] indicated that ERA-40 reanalysis might reflect the temporal and spatial distributions of temperature and precipitation over China. Previous evaluations of several reanalysis data for China showed that the ERA-40 reanalysis might generally capture the inter-annual variations of soil moisture from the surface to deeper layers [27,28]. Reasonable performances for ECMWF soil moisture analyses in the humid monsoon period were found using in situ measurements over the plateau [29,30]. Liu et al. [31] indicated that the ERA-Interim soil moisture has better performance over the plateau compared to the National Centers for Environmental Prediction (NCEP) Climate Forecast System Reanalysis (CFSR). Ground-based observation sites in western China, especially over the plateau, are scarce, the observation start time is late, and numerous values are missing; these factors all lead to the low availability of data. Furthermore, the time scale of the soil moisture observation data used in the study is currently approximately 10 years. Consequently, for regional-scale or long-term climate research, the model-derived soil moisture data are often utilized as an alternative. The ERA-40 soil moisture has the advantages of uniform distribution, a long-term scale, and high temporal-spatial resolution [32]. The ERA-Interim dataset used in the study is the latest global ECMWF reanalysis data and adopts the same land surface model as ERA-40, the Tiled ECMWF Scheme for Surface Exchanges over Land (TESSEL). However, the data assimilation system of ERA-Interim has been upgraded from that of ERA-40 to a four-dimensional variational analysis (4D-Var). Model parameters have been revised, and more satellite and observational data have been applied to correct and improve the data accuracy and resolution [33].

2.2. Methodology

The main methods applied in this study are the nonparametric Mann-Kendall (MK) test and correlation analysis [34,35]. The MK trend test and Sequential Mann-Kendall (SQMK) test, which is widely applied in the areas of meteorology and hydrology, is commonly utilized to detect trends and abrupt changes in plateau monsoon indices.

2.2.1. MK Trend Test

Given a dataset X consisting of x values with sample size n, that is X = ( x 1 , x 2 , ... , x n ) , the S   statistic of the MK test is computed as follows:
S = k = 1 n 1 j = k + 1 n sgn ( x j x k ) , sgn ( x j x k ) = { + 1        ( x j x k ) > 0 0          ( x j x k ) = 0 1        ( x j x k ) < 0
where 1 ≤ k < jn, and n is the length of the data record. When n ≥ 8, the distribution of S approaches the Gaussian form with a mean E(S) = 0 and a variance given by
V a r ( S ) = n ( n 1 ) ( 2 n + 5 ) m = 1 n [ t i ( m 1 ) ( 2 m + 5 ) m ] 18
where ti is the number of ties of length m. The Z statistic of the MK test is then given as:
Z =    { S 1 V a r ( S )         S > 0         0              S = 0 S + 1 V a r ( S )         S < 0
Positive (negative) Z values indicate the presence of significant increasing (decreasing) trends in plateau monsoons if | Z | Z 1 α / 2 ( α representing the significance level) in a two-sided trend test [34,35].

2.2.2. SQMK Test

Given the time series X = (x1,x2,…,xn), Sk is defined as:
S k = i = 1 k j = 1 i 1 a i j   ( k = 2 , 3 , , n ) ,   a i j = { 1           x j > x i 0          x j x i
The mean and variance of Sk are calculated by Equations (5) and (6), respectively:
E ( S k ) = k ( k 1 ) 4
V a r ( S k ) = k ( k 1 ) ( 2 k + 5 ) 72
where k = 1 , 2 , , n . The sequential progressive values can be calculated by:
U F k = S k E ( S k ) V a r ( S k )
Similarly, sequential backward (UBk) analysis of the MK test is calculated starting from the end of the time series data. Plateau monsoons exhibit a rising (decreasing) trend if UF>0 (UF<0). If UF and UB intersect and the point is located between the corresponding critical lines, then the point corresponds to the time when the abrupt change begins. In this study, the hypothesis tests were performed at the 5% significance level [34,35].

2.3. Plateau Monsoon Indices (PMI)

To date, definitions of the plateau monsoon index have been mainly divided into two categories: one is from the perspective of the height field, and the other is based on the wind field. In the present study, the representative plateau monsoon indices defined by Tang et al. [7], Xun et al. [10], and Qi et al. [11] were selected for contrast analysis.

2.3.1. Calculation of the TPMI

The center position of the surface pressure system over the plateau is located at (32.5°N, 90°E) (point 0), whereas the four points around the center position, which represent the west, south, east, and north positions of the plateau, are located at (32.5°N, 80°E), (25°N, 90°E), (32.5°N, 100°E), and (40°N, 90°E) (points 1–4), respectively. The TPMI formula is as follows:
T P M I = H 1 + H 2 + H 3 + H 4 4 H 0
where H 1 , H 2 , H 3 , H 4 , and H 0 are the 600 hPa height anomalies. The larger the positive TPMI values, the stronger the plateau summer monsoon will be. The larger the absolute value of the negative TPMI values, the stronger the plateau winter monsoon will be [7].

2.3.2. Calculation of the DPMI

By introducing the center position of the surface pressure system over the plateau, the DPMI, which is a revision of the TPMI, is calculated by the following:
D P M I = T P M I ( λ , φ ) = H 1 ( λ + δ λ , φ ) + H 2 ( λ δ λ , φ ) + H 3 ( λ , φ + δ φ ) + H 4 ( λ , φ δ φ ) 4 H 0 ( λ , φ )
where ( λ , φ ) are parameters of the center position of the pressure system and ( δ λ , δ φ ) are the differences along the latitude and longitude, respectively. H 1 ( λ + δ λ , φ ) , H 2 ( λ δ λ , φ ) , H 3 ( λ , φ + δ φ ) , H 4 ( λ , φ δ φ ) , and H 1 ( λ , φ ) are the 600 hPa height anomalies. In this study, δ λ is 9°, and δ φ is 6° [10].

2.3.3. Calculation of the QPMI

Based on the circulation characteristics of the plateau monsoon in the summer, the QPMI was defined using the difference of anomalous zonal wind between (27.5°–30°N, 80°–100°E) and (35°–37.5°N, 80°–100°E) at 600 hPa, averaged from June to August; that is:
Q P M I = U 600 [ 27.5 30 N , 80 100 E ] U 600 [ 35 37.5 N , 80 100 E ]
The larger the QPMI value, the stronger the plateau summer monsoon will be (Qi et al. only defined the summer plateau monsoon. In the present study, the summer QPMI was given only.) [11].

2.3.4. The Definition of the ZPMI

With a mean altitude that exceeds 4000 m and reaches one-third the height of the tropopause, the pressure in the surface layer over the plateau is approximately 600 hPa or less. Therefore, some high-altitude localities have no wind at 600 hPa. The strong heat source of the plateau in the summer triggers an ascending motion, forming a cyclone caused by convergence in the lower level and an anticyclone caused by divergence in the upper level (South Asia high). In terms of the pressure field, a thermal low controls the plateau below 600 hPa and transforms to a warm high above 400 hPa, whereas 500 hPa is a transition layer [36]. Hence, the 550 hPa wind field might be a better choice to define the new plateau monsoon index. Numerous studies [7,11] have revealed that the plateau is controlled by a powerful thermal low in summer, with the center located at (32.5°N, 90°E), and the wind over the plateau presents a cyclonic rotation. Therefore, the northern areas of 32.5°N are controlled by easterly flows, while the southern areas present westerly winds. The western areas of 90°E appear to have northerly flows, whereas the eastern areas appear to have southerly winds. The meridional flows are important for the water-vapor transportation over the plateau. In addition to taking the zonal wind into consideration, the meridional winds are also imperative factors when defining a new plateau monsoon index.
Figure 1 presents the long-term mean 550 hPa height field and horizontal wind field in the summer and winter over the plateau from 1979 to 2014. During the summer (Figure 1a), the surface layer over the plateau is controlled by a powerful warm low. The wind field represents cyclonic rotation, and the airflow over the plateau converges toward the warm low center. There exists zonal wind shear between the northern and southern sides of the center position of the plateau surface pressure system (32.5°N, 90°E), with meridional wind shear between the eastern and western sides. During the winter (Figure 1b), the wind field near the surface shows consistent westerly flow. The newly-constructed plateau monsoon index, a revision of the QPMI, is calculated by the following:
Z P M I = s t d [ U [ 28 31 N , 85 95 E ] U [ 34 37 N , 85 95 E ] ] + s t d [ V [ 30 35 N , 92.5 102.5 E ] V [ 30 35 N , 77.5 87.5 E ] ]
where s t d [ U [ 28 31 N , 85 95 E ] U [ 34 37 N , 85 95 E ] ] is the standardized value of the difference of the mean zonal wind anomalies between (28°–31°N, 85–95°E) and (34°–37°N, 85°–95°E) at 550 hPa, and s t d [ V [ 30 35 N , 92.5 102.5 E ] V [ 30 35 N , 77.5 87.5 E ] ] is the standardized value of the difference of the mean meridional wind anomalies between (30°–35°N, 92.5°–102.5°E) and (30°–35°N, 77.5°–87.5°E) at 550 hPa. The larger ZPMI value indicates a stronger wind shear and cyclonic rotation near the surface over the plateau, and shows that the plateau summer monsoon is stronger. Meanwhile, the smaller ZPMI value indicates a weaker cyclonic rotation of the wind field in the surface layer and a stronger plateau winter monsoon.

3. Results and Discussion

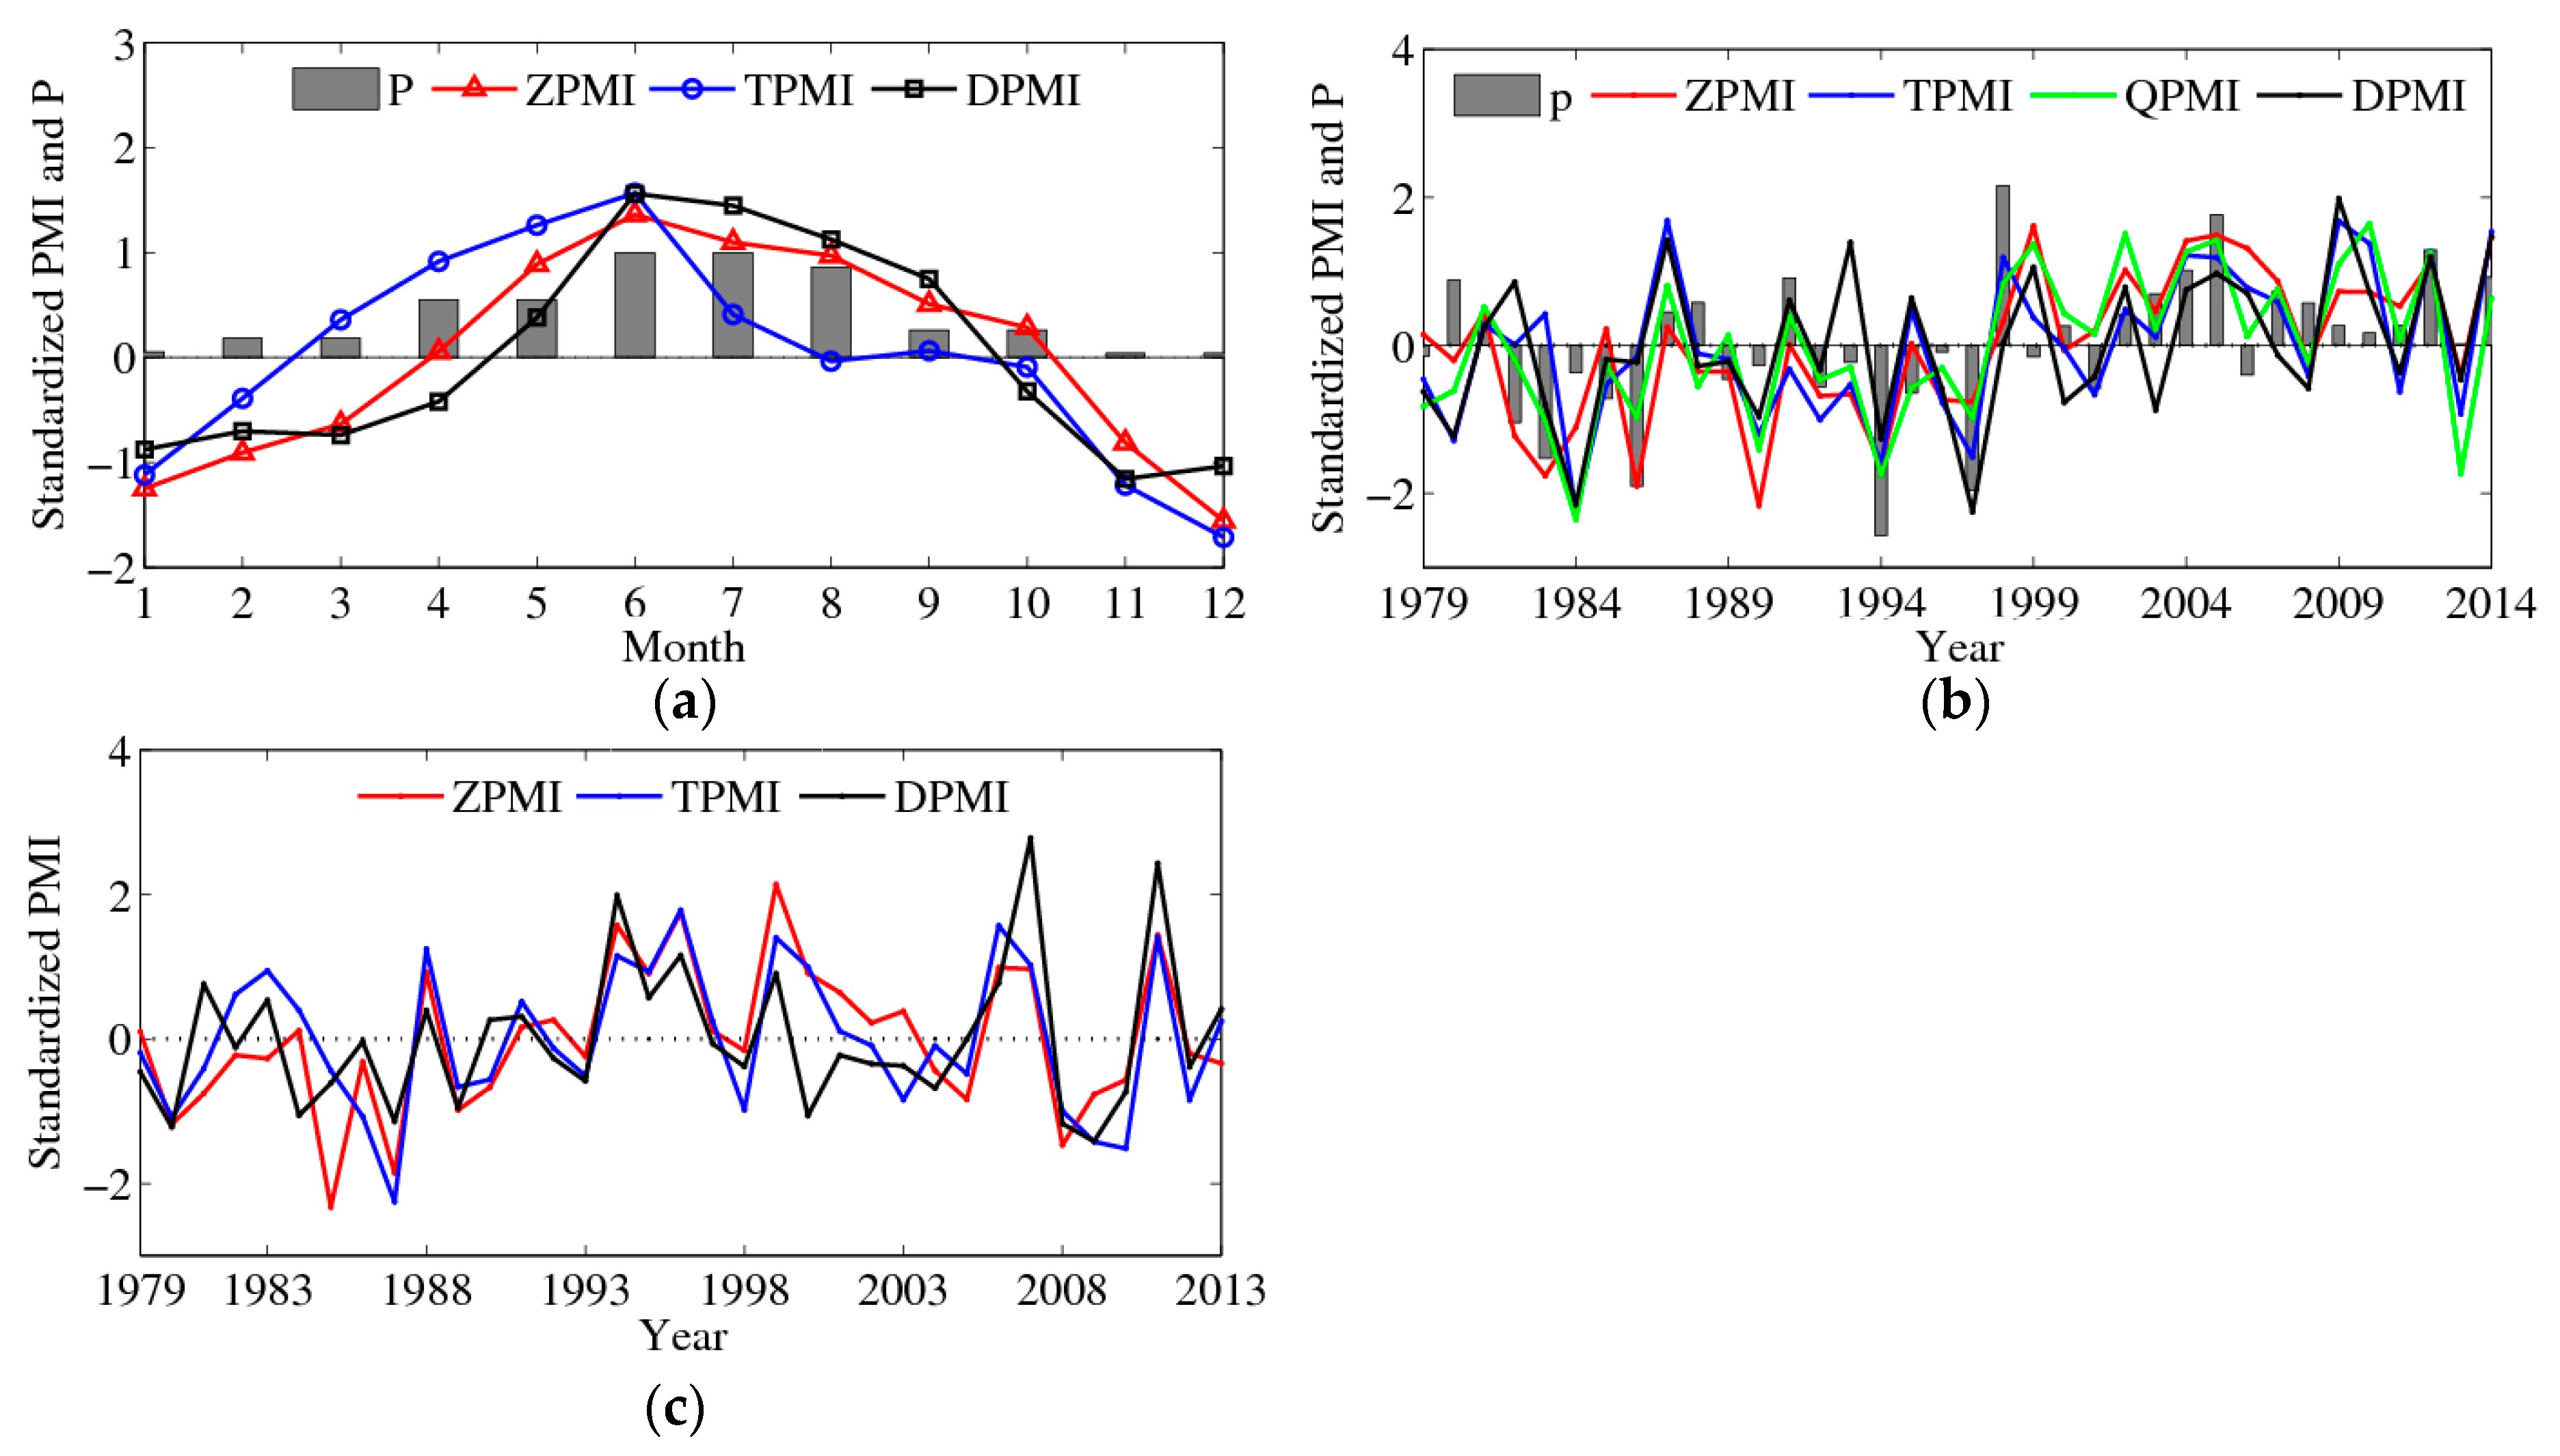
3.1. Contrast Analysis and Evolution Characteristics of Plateau Monsoon Indices

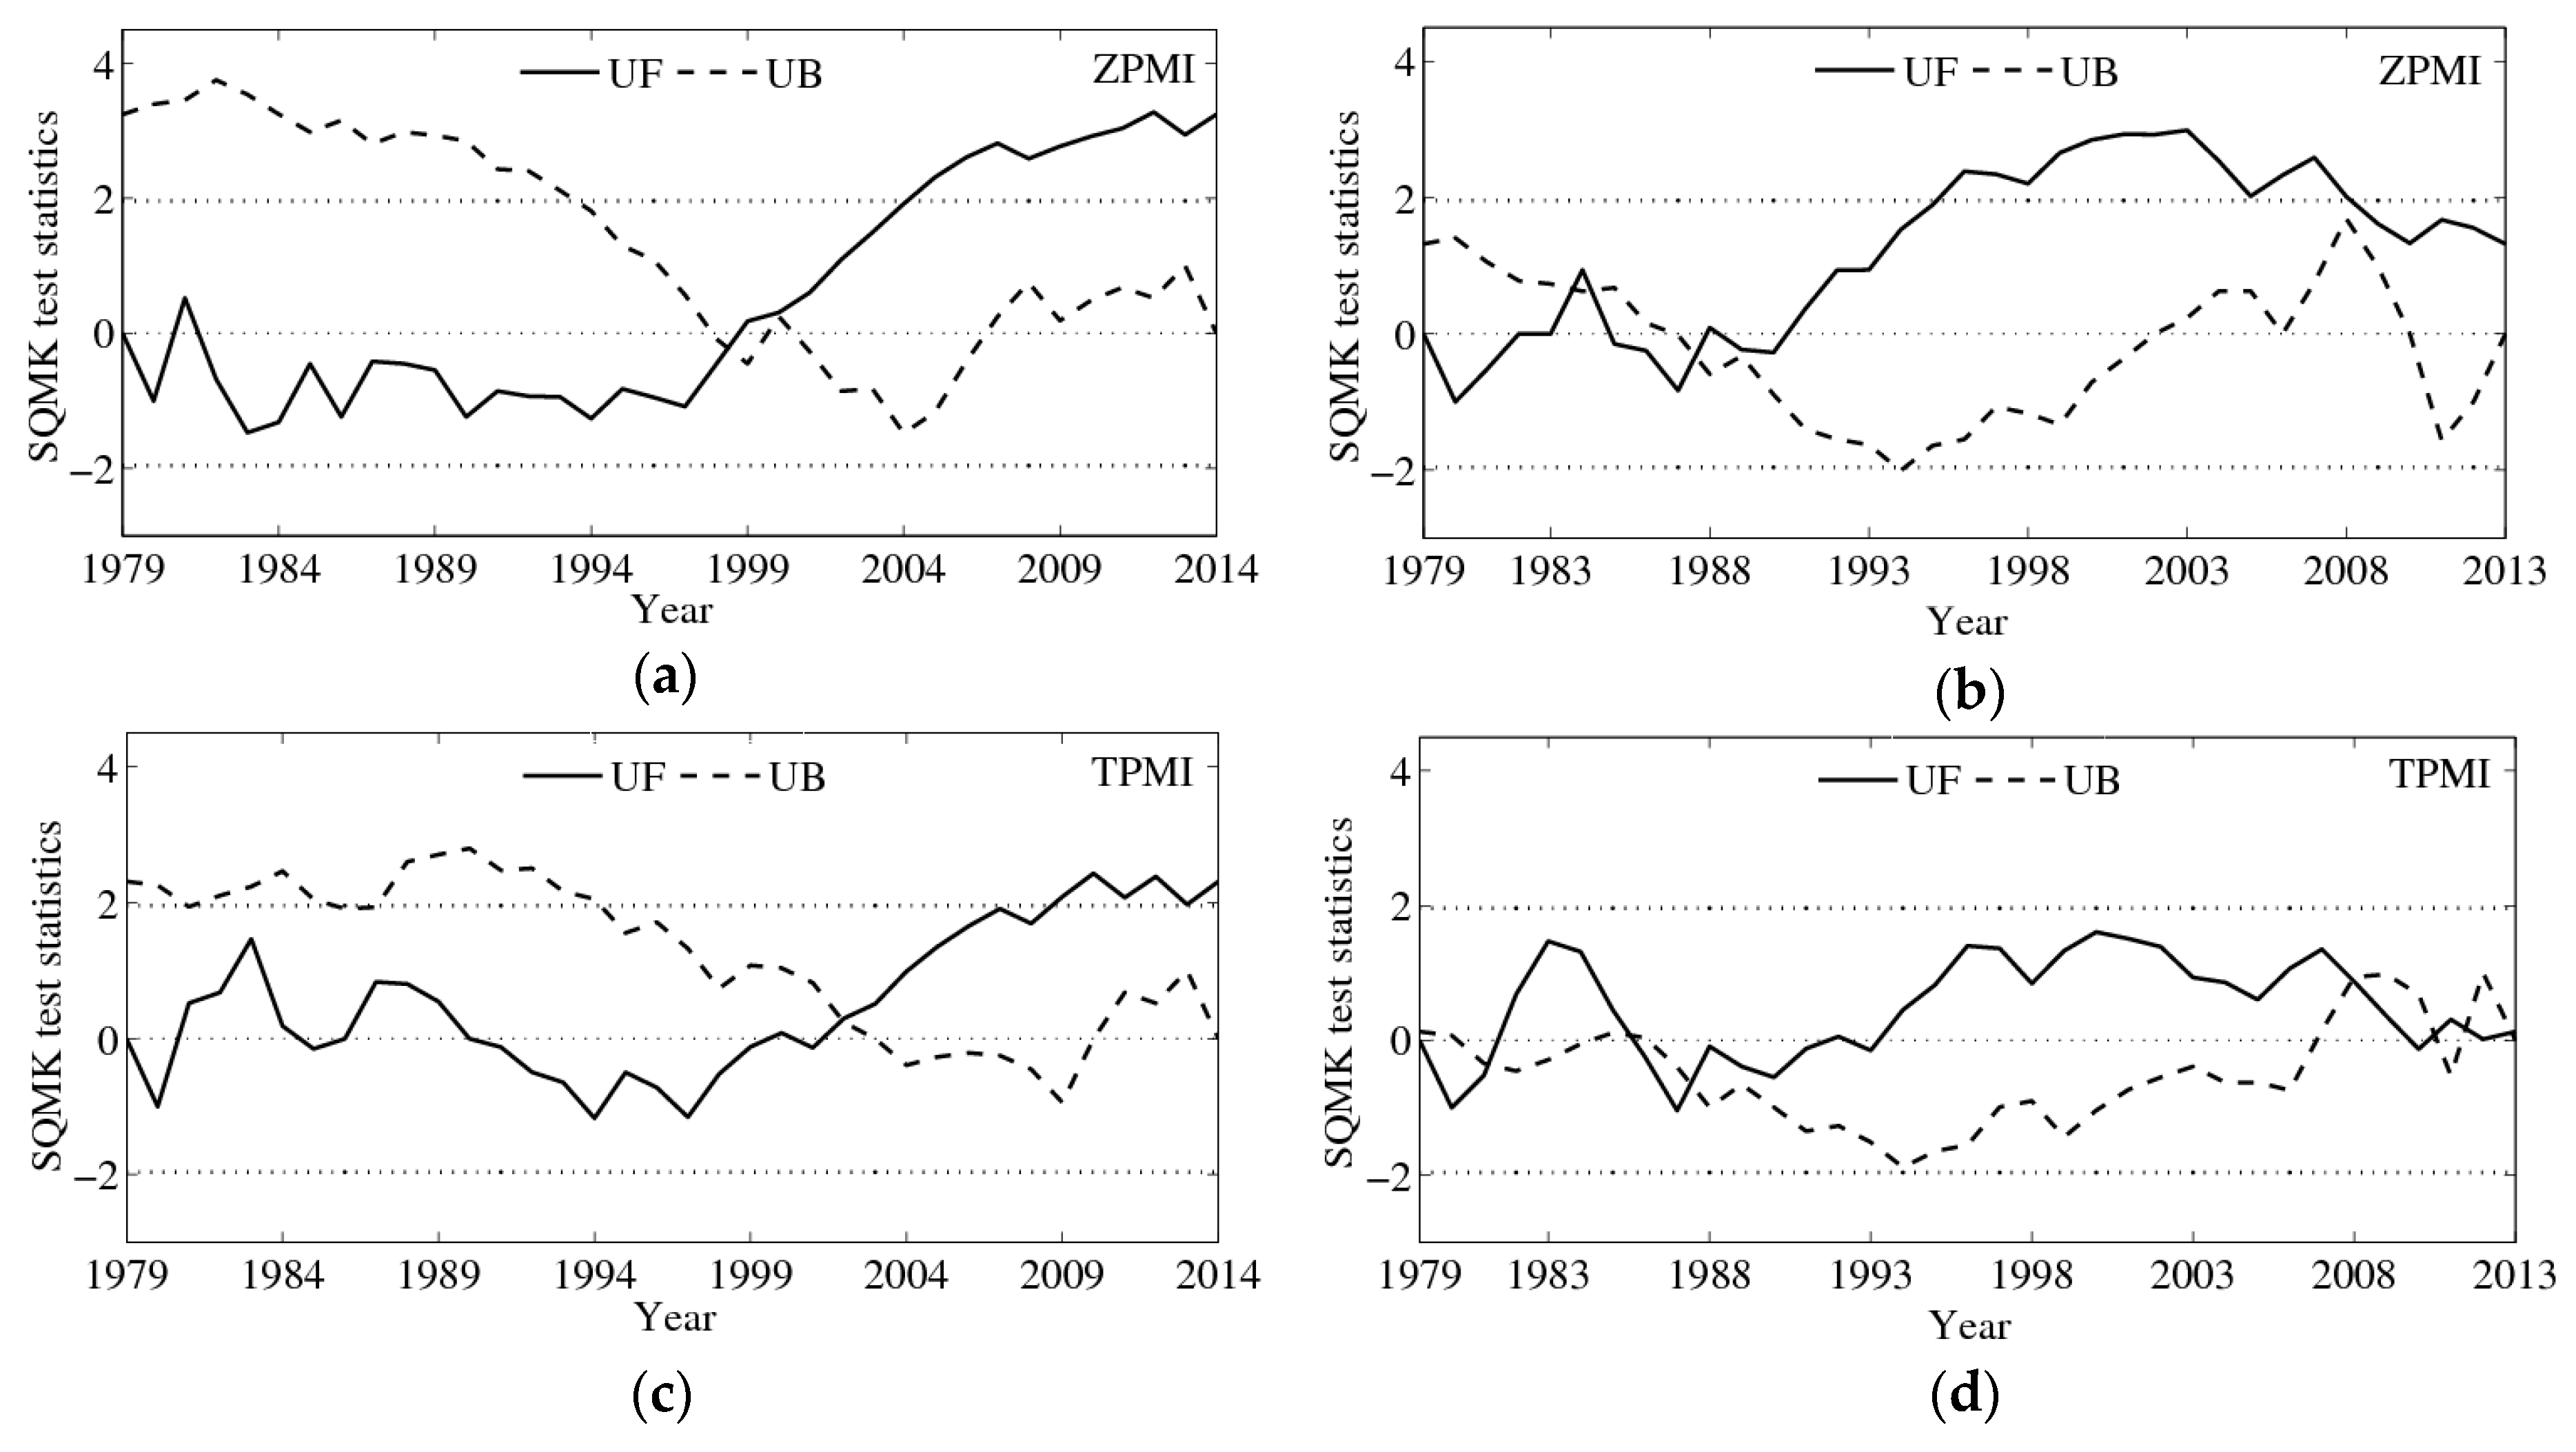
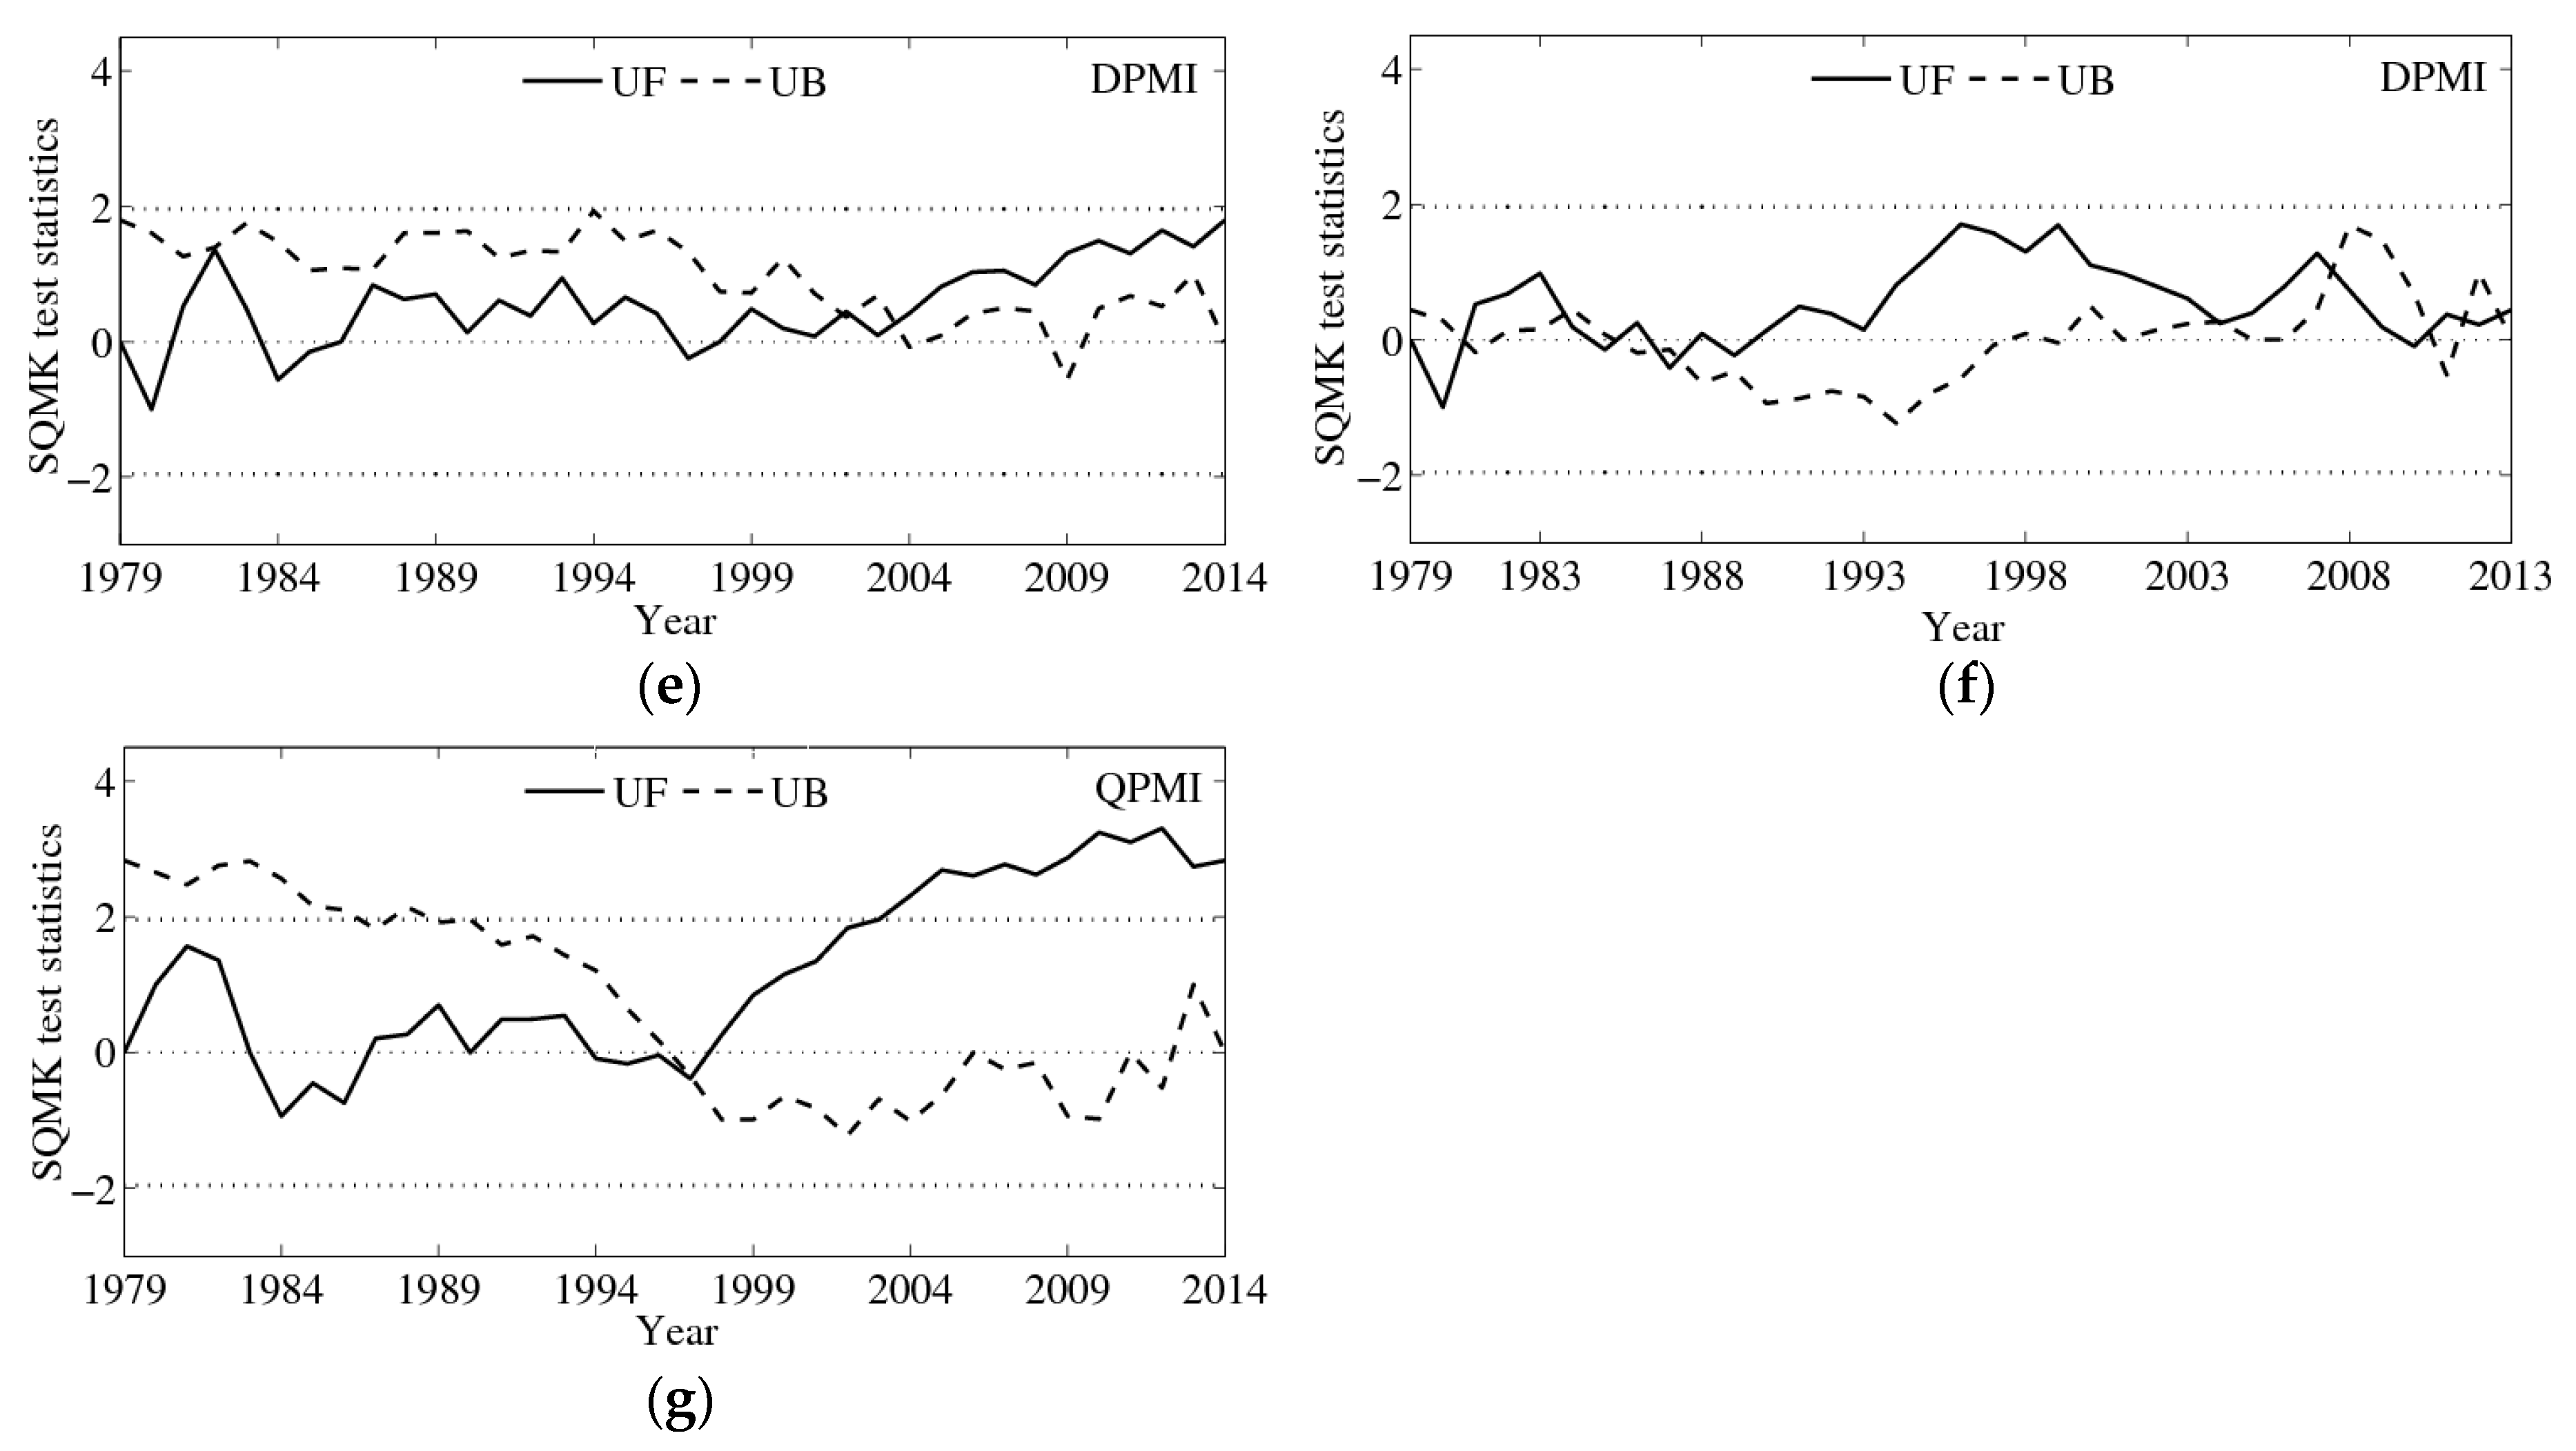
3.1.1. Variation Characteristics of the Plateau Monsoon

The onset and retreat times of the plateau summer and winter monsoon are important indicators for determining the characteristics of the monsoon over the plateau. If the indices are greater than zero, the plateau summer monsoon starts when the plateau is controlled by the thermal low. Indices of less than zero indicate the onset of the plateau winter monsoon. Figure 2a shows the annual variations of the standardized plateau monsoon indices. Although these indices all present distributions of a unimodal type, there are some differences among them in terms of seasonal variation. The TPMI is greater than zero after March, whereas the ZPMI and DPMI are greater than zero after April and May, respectively. All of these indices reach their peak values in June, when the summer monsoon prevails over the plateau, before gradually decreasing. The TPMI is less than zero after September, whereas the DPMI and ZPMI are less than zero around October. This suggests that the onset and retreat of the plateau summer monsoon differ among the various monsoon indices. How to describe the onset and retreat times of the summer and winter monsoons correctly is key to analyzing the characteristics of the plateau monsoons. Overall, the onset and retreat of the TPMI are 1–2 months earlier than those of the DPMI and ZPMI. The TPMI is significantly weaker than the DPMI and ZPMI from July to September. In addition, monsoon precipitation increase and wind shifts over the plateau are the main features of the summer monsoon onset. The plateau receives more precipitation from April to October during which the plateau is controlled by a warm low (the ZPMI is greater than zero) (Figure 2a). Compared with the seasonal variation of precipitation over the plateau, the annual variation characteristics given by the DPMI and ZPMI are better than that of TPMI. In addition to the climatological monthly evolution of precipitation over the plateau, a good monsoon index should also indicate the evolution of precipitation in each year. Considering that the rainy season over the plateau is mainly confined to summer, the inter-annual variation of plateau summer precipitation is given in Figure 2b. The inter-annual and inter-decadal variation tendency of the plateau summer precipitation is consistent with these of the plateau summer monsoon indices. Compared with the correlation between the plateau summer monsoon indices and precipitation (Table 1), the inter-annual variation characteristics given by the ZPMI and QPMI are better than those of the TPMI and DPMI. Overall, the ZPMI can better reflect the seasonal and inter-annual characteristics of the plateau monsoonal precipitation compared with the other indices.
Figure 2 shows the inter-annual variation of the plateau summer (b) and winter (c) monsoon indices from 1979 to 2014. The plateau summer and winter monsoons display similar inter-annual and inter-decadal variation characteristics, with a rising trend that is more significant for the summer monsoon. Table 2 presents the Z statistic of the MK trend test for the plateau summer and winter monsoon indices. For the prescribed significance level, α = 0.05 , the critical value of Z is ±1.96. Without exception, the Z values of the summer monsoon indices are greater than zero, which shows that the summer monsoon presents a rising trend for the period 1979–2014. The MK trend test Z statistic of the ZPMI, TPMI, and QPMI is greater than 1.96, indicating that the increasing trend is significant. For the winter monsoon indices, the Z values are greater than zero but fail to pass the 95% confidence test, demonstrating that the increasing trend of the winter monsoon is not significant.
To further reveal the variation characteristics of the plateau monsoon, the SQMK test is applied to study the abrupt changes in the plateau summer and winter indices. Figure 3a shows the UF and UB curves of the summer ZPMI. During the period 1979–2014, a sudden change appears in 1998, when the variation tendency of the summer monsoon and the warm low over the plateau shift from weak to strong. After 2004, the UF values exceed the significance level of 0.05, indicating that the plateau summer monsoon is enhanced significantly after this time. The UF and UB curves of the winter ZPMI are shown in Figure 3b. Before 1990, the variation characteristics of the plateau winter monsoon display small fluctuations with no significant trend. They show an increasing trend in the subsequent 24 years, with the most significant trend from 1995 to 2008. For the summer TPMI (Figure 3c), the plateau summer monsoon shifts from weak to strong in 2002, and the variation trend is significant after 2009. Meanwhile, for the winter TPMI (Figure 3d), the plateau winter monsoon fluctuates with a small amplitude and no significant changes. The UF and UB curves of the summer DPMI are shown in Figure 3e; the UF values are greater than zero except in a small number of specific years, and the curves of UF and UB do not exceed the critical significance level. The results depicted in Figure 3e indicate that the plateau summer monsoon displays an increasing trend, although the tendency is not obvious. For the winter DPMI (Figure 3f), the variation trends are similar to that of the winter TPMI. The UF and UB curves of the summer QPMI are displayed in Figure 3g; in 1997, the plateau summer monsoon shifts from weak to strong, and the ascending trend is significant after 2003.
The annual cycle of the monsoon is a very important aspect of the monsoon climate [10,37]. Through the above analysis, it is found that the onset and retreat of the plateau summer and winter monsoons reflected by the ZPMI and DPMI are better than that of the TPMI. Additionally, the inter-annual and inter-decadal variability of the plateau summer and winter monsoon indices generated by the different calculation methods are very consistent. Meanwhile, the plateau summer and winter monsoons both present an ascending trend, but the increasing trend of the summer monsoon is more significant. As seen from the SQMK analysis, the plateau summer monsoons reflected by the ZPMI, TPMI, and QPMI shift from weak to strong in 1998, 2002, and 1997, respectively. In contrast, no significant increasing or decreasing trends are detected in the plateau summer monsoon reflected by the DPMI. The plateau winter monsoon reflected by the different indices appears similar, and the winter ZPMI is enhanced more significantly during 1995–2008. Previous studies [38,39] have showed that the annual mean temperature in the plateau experienced two abrupt changes from low to high in 1987 and 1998, respectively. The changing points to an abrupt increase in the annual precipitation and runoff in the plateau occur in 1996 and 1997, respectively [40]. The shifts of the plateau monsoon are bound to cause changes in meteorological elements. Based on the changing point of the meteorological elements mentioned above, the ZPMI has a reasonable performance compared to other indices.

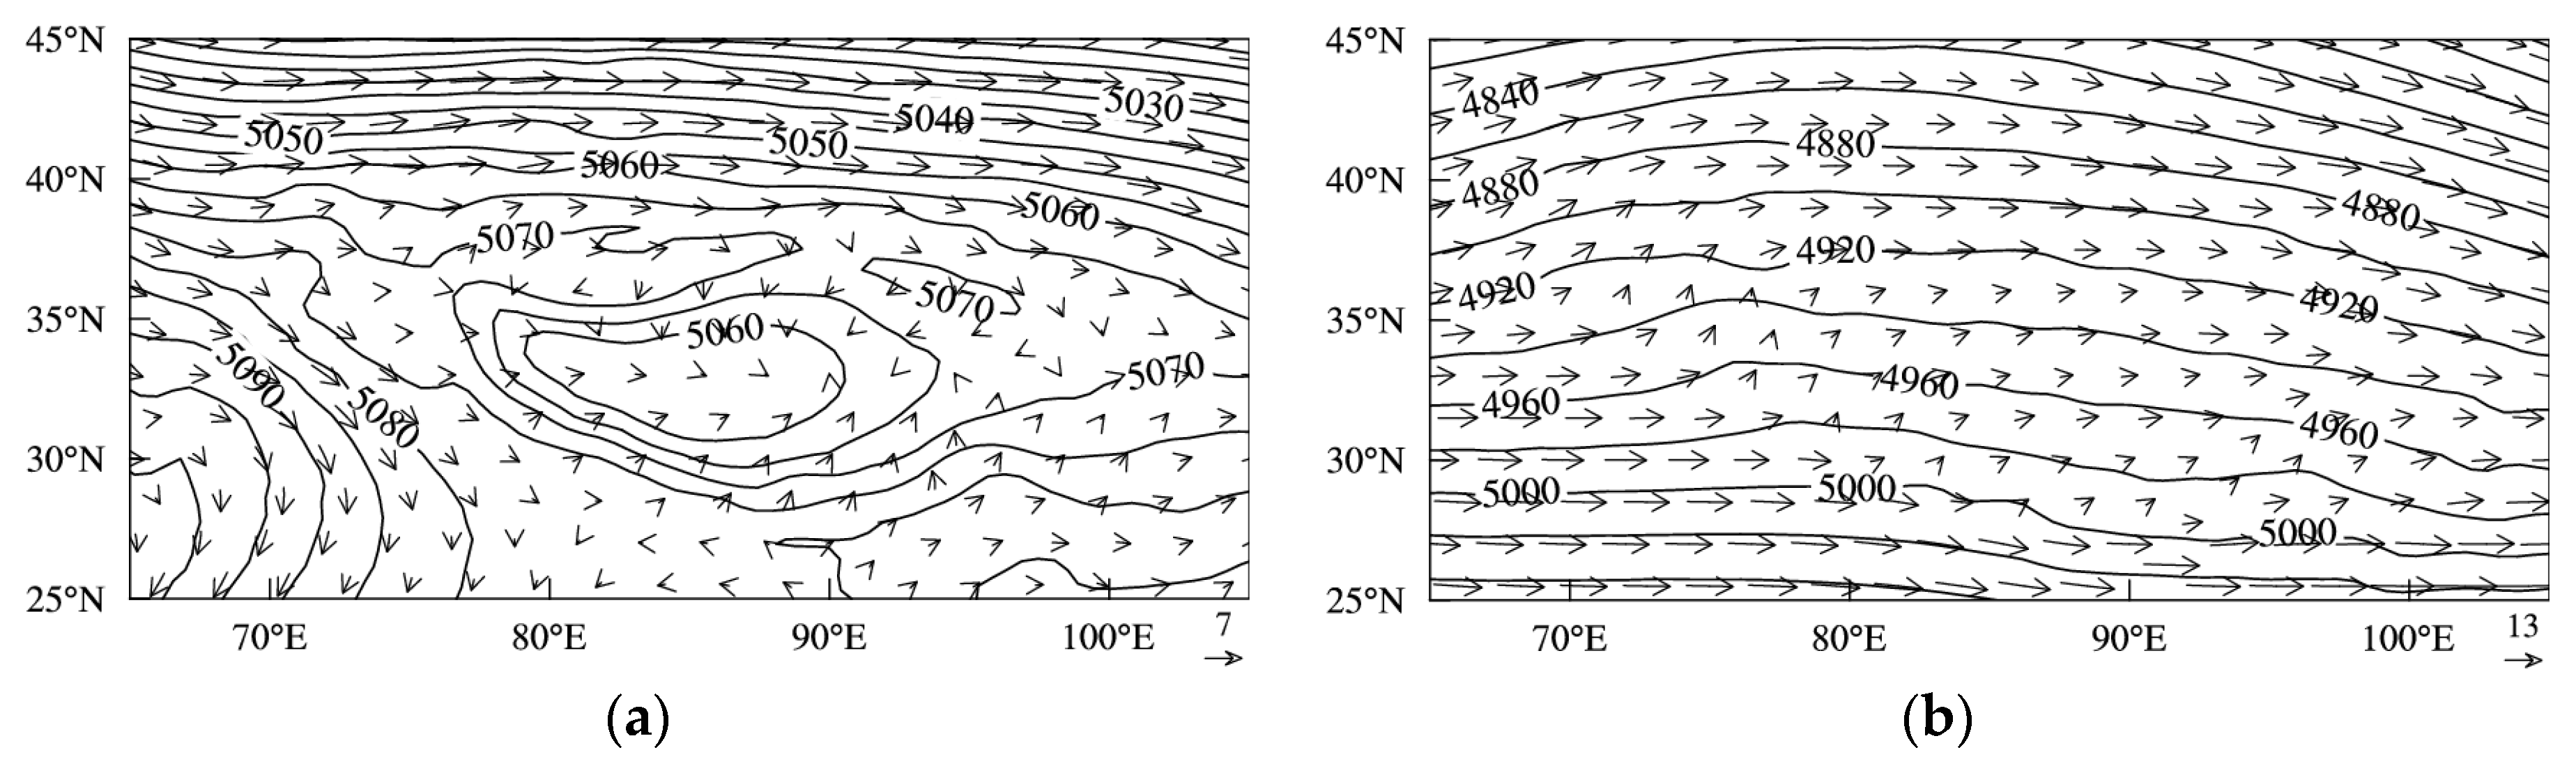
3.1.2. Correlation Analysis between the Plateau Monsoon and Meteorological Elements

A reasonable monsoon index is capable of not only reflecting monsoon circulation characteristics but also explaining relevant weather phenomena [10,41]. In the present study, the linkages between the plateau summer monsoon and meteorological elements over the plateau are discussed.
The correlation between the summer ZPMI and precipitation over the plateau is presented in Figure 4a. A significant positive correlation between the ZPMI and precipitation was detected in the main body of the plateau. The positive correlation center is located in Nagqu (31.47°N, 92.1°E) and its adjacent regions, where the correlation coefficients reach 0.77. Significant negative correlations were located in the northwest of the plateau. The results depicted in Figure 4a indicate that when the plateau summer monsoon is strong (weak), precipitation in the main body of the plateau, especially in Nagqu and its adjacent areas, is higher (lower) than normal, whereas the precipitation over the northwestern plateau is lower (higher). For the TPMI (Figure 4b), the significant positive correlations were confined to the area of (30°–35°N, 85°–102°E), with the coefficients reaching 0.7. The significant negative correlations were located in the western plateau. For the DPMI (Figure 4c), the regions of significant positive correlation over the main body of the plateau decrease obviously compared to those of the ZPMI and TPMI. The distribution characteristics of the correlation between the QPMI and precipitation (Figure 4d) are similar to that of the ZPMI. The positive correlation center is closer to the northern plateau, with coefficients reaching 0.73.
The correlation coefficients between the plateau summer monsoon indices and the summer air temperature are given in Figure 5. The distribution characteristics are similar to these depicted in the Figure 4. Significant positive correlations were located in the main body of the plateau, whereas significant negative correlations were located at the edge of the western plateau. The results depicted in Figure 5 indicate that when the plateau summer monsoon is strong (weak), the air temperature in the main body of the plateau is higher (lower) than normal, while the air temperature over the western marginal areas of plateau is lower (higher).
Through contrast analysis of the correlations between different indices and meteorological elements, similar spatial patterns were detected among the various monsoon indices. Corresponding to stronger plateau summer monsoon, more (less) precipitation and a higher (lower) air temperature appear over the eastern (western) plateau. This result is consistent with that proposed by Tang et al. [7]. In strong (weak) plateau summer monsoon years, there exists an anomalous cyclone (anticyclone) over the plateau, which results in an anomalous ascending (descending) motion. The plateau and its adjacent regions are under the effect of an anomalous southwesterly (northwesterly) wind that can transport more (less) moisture there. All of these factors contribute to more (less) precipitation and a higher (lower) temperature over the eastern and central plateau [10]. Apparently, the ZPMI is capable of effectively reflecting meteorological elements.

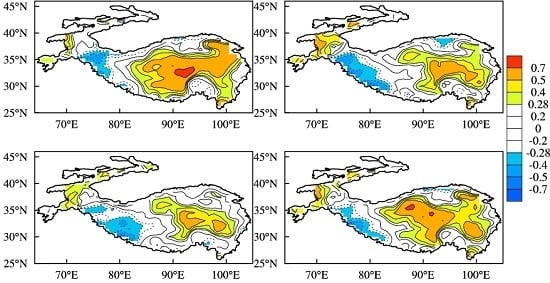
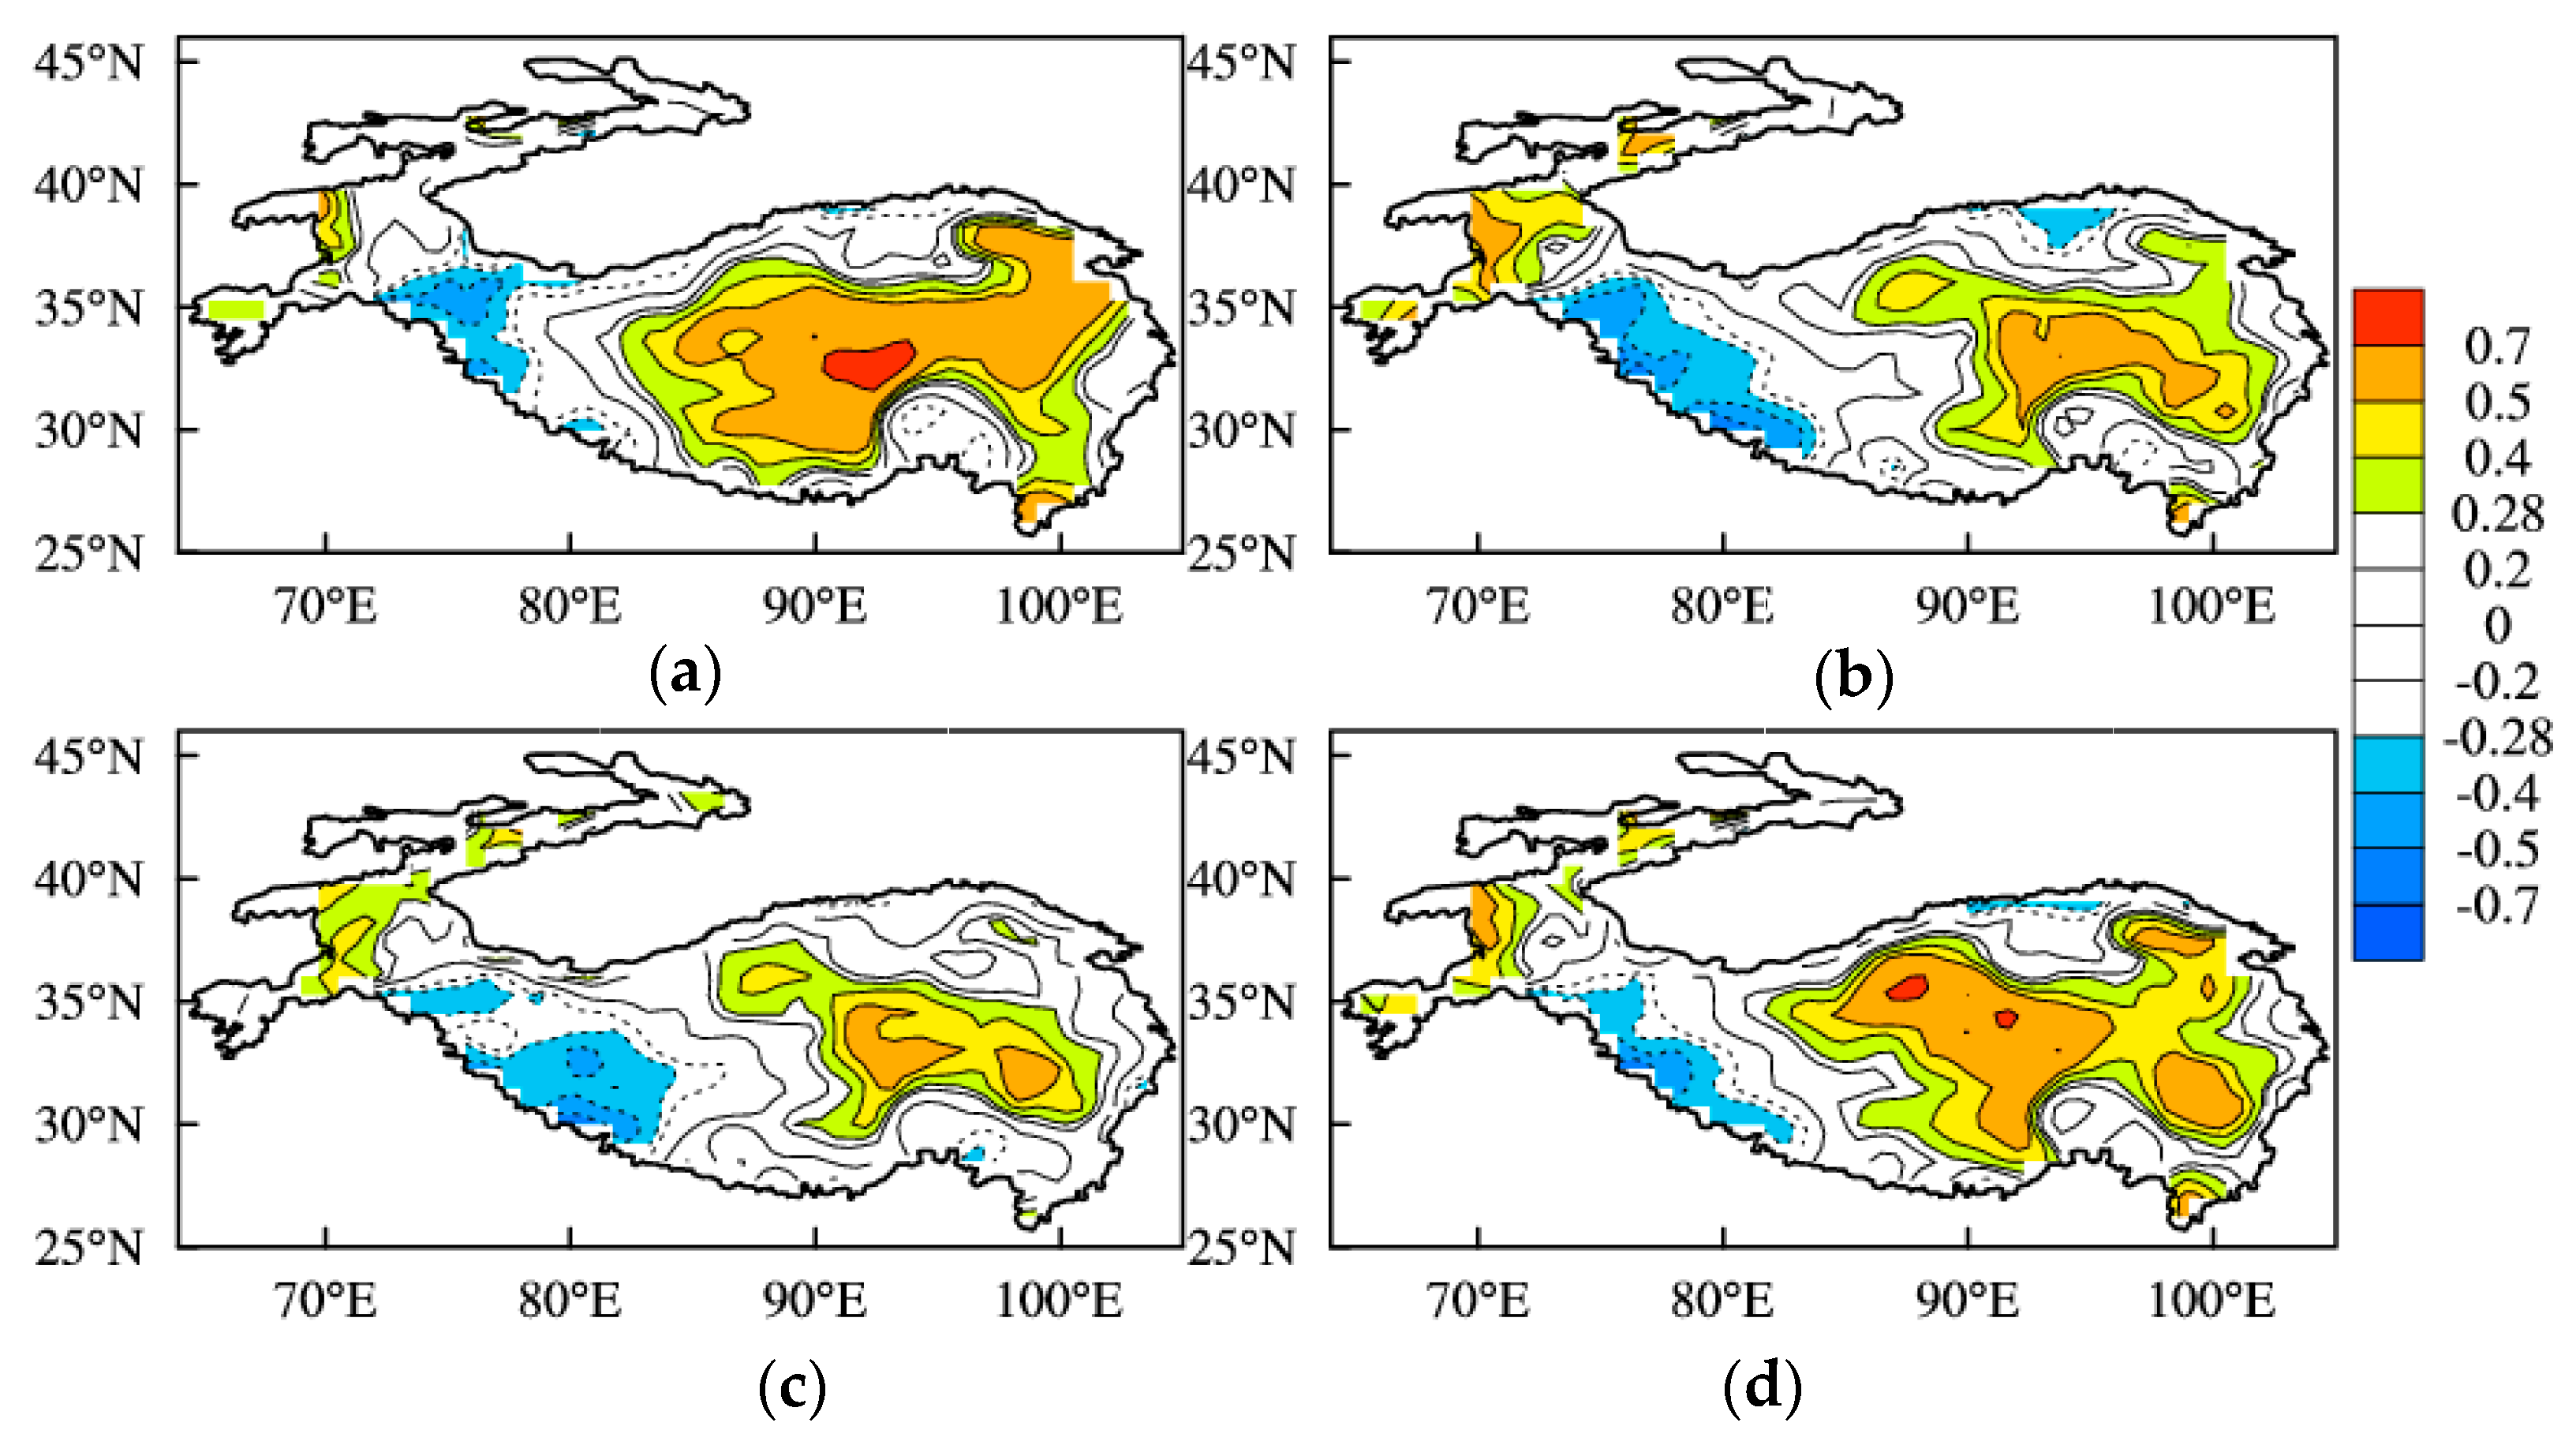
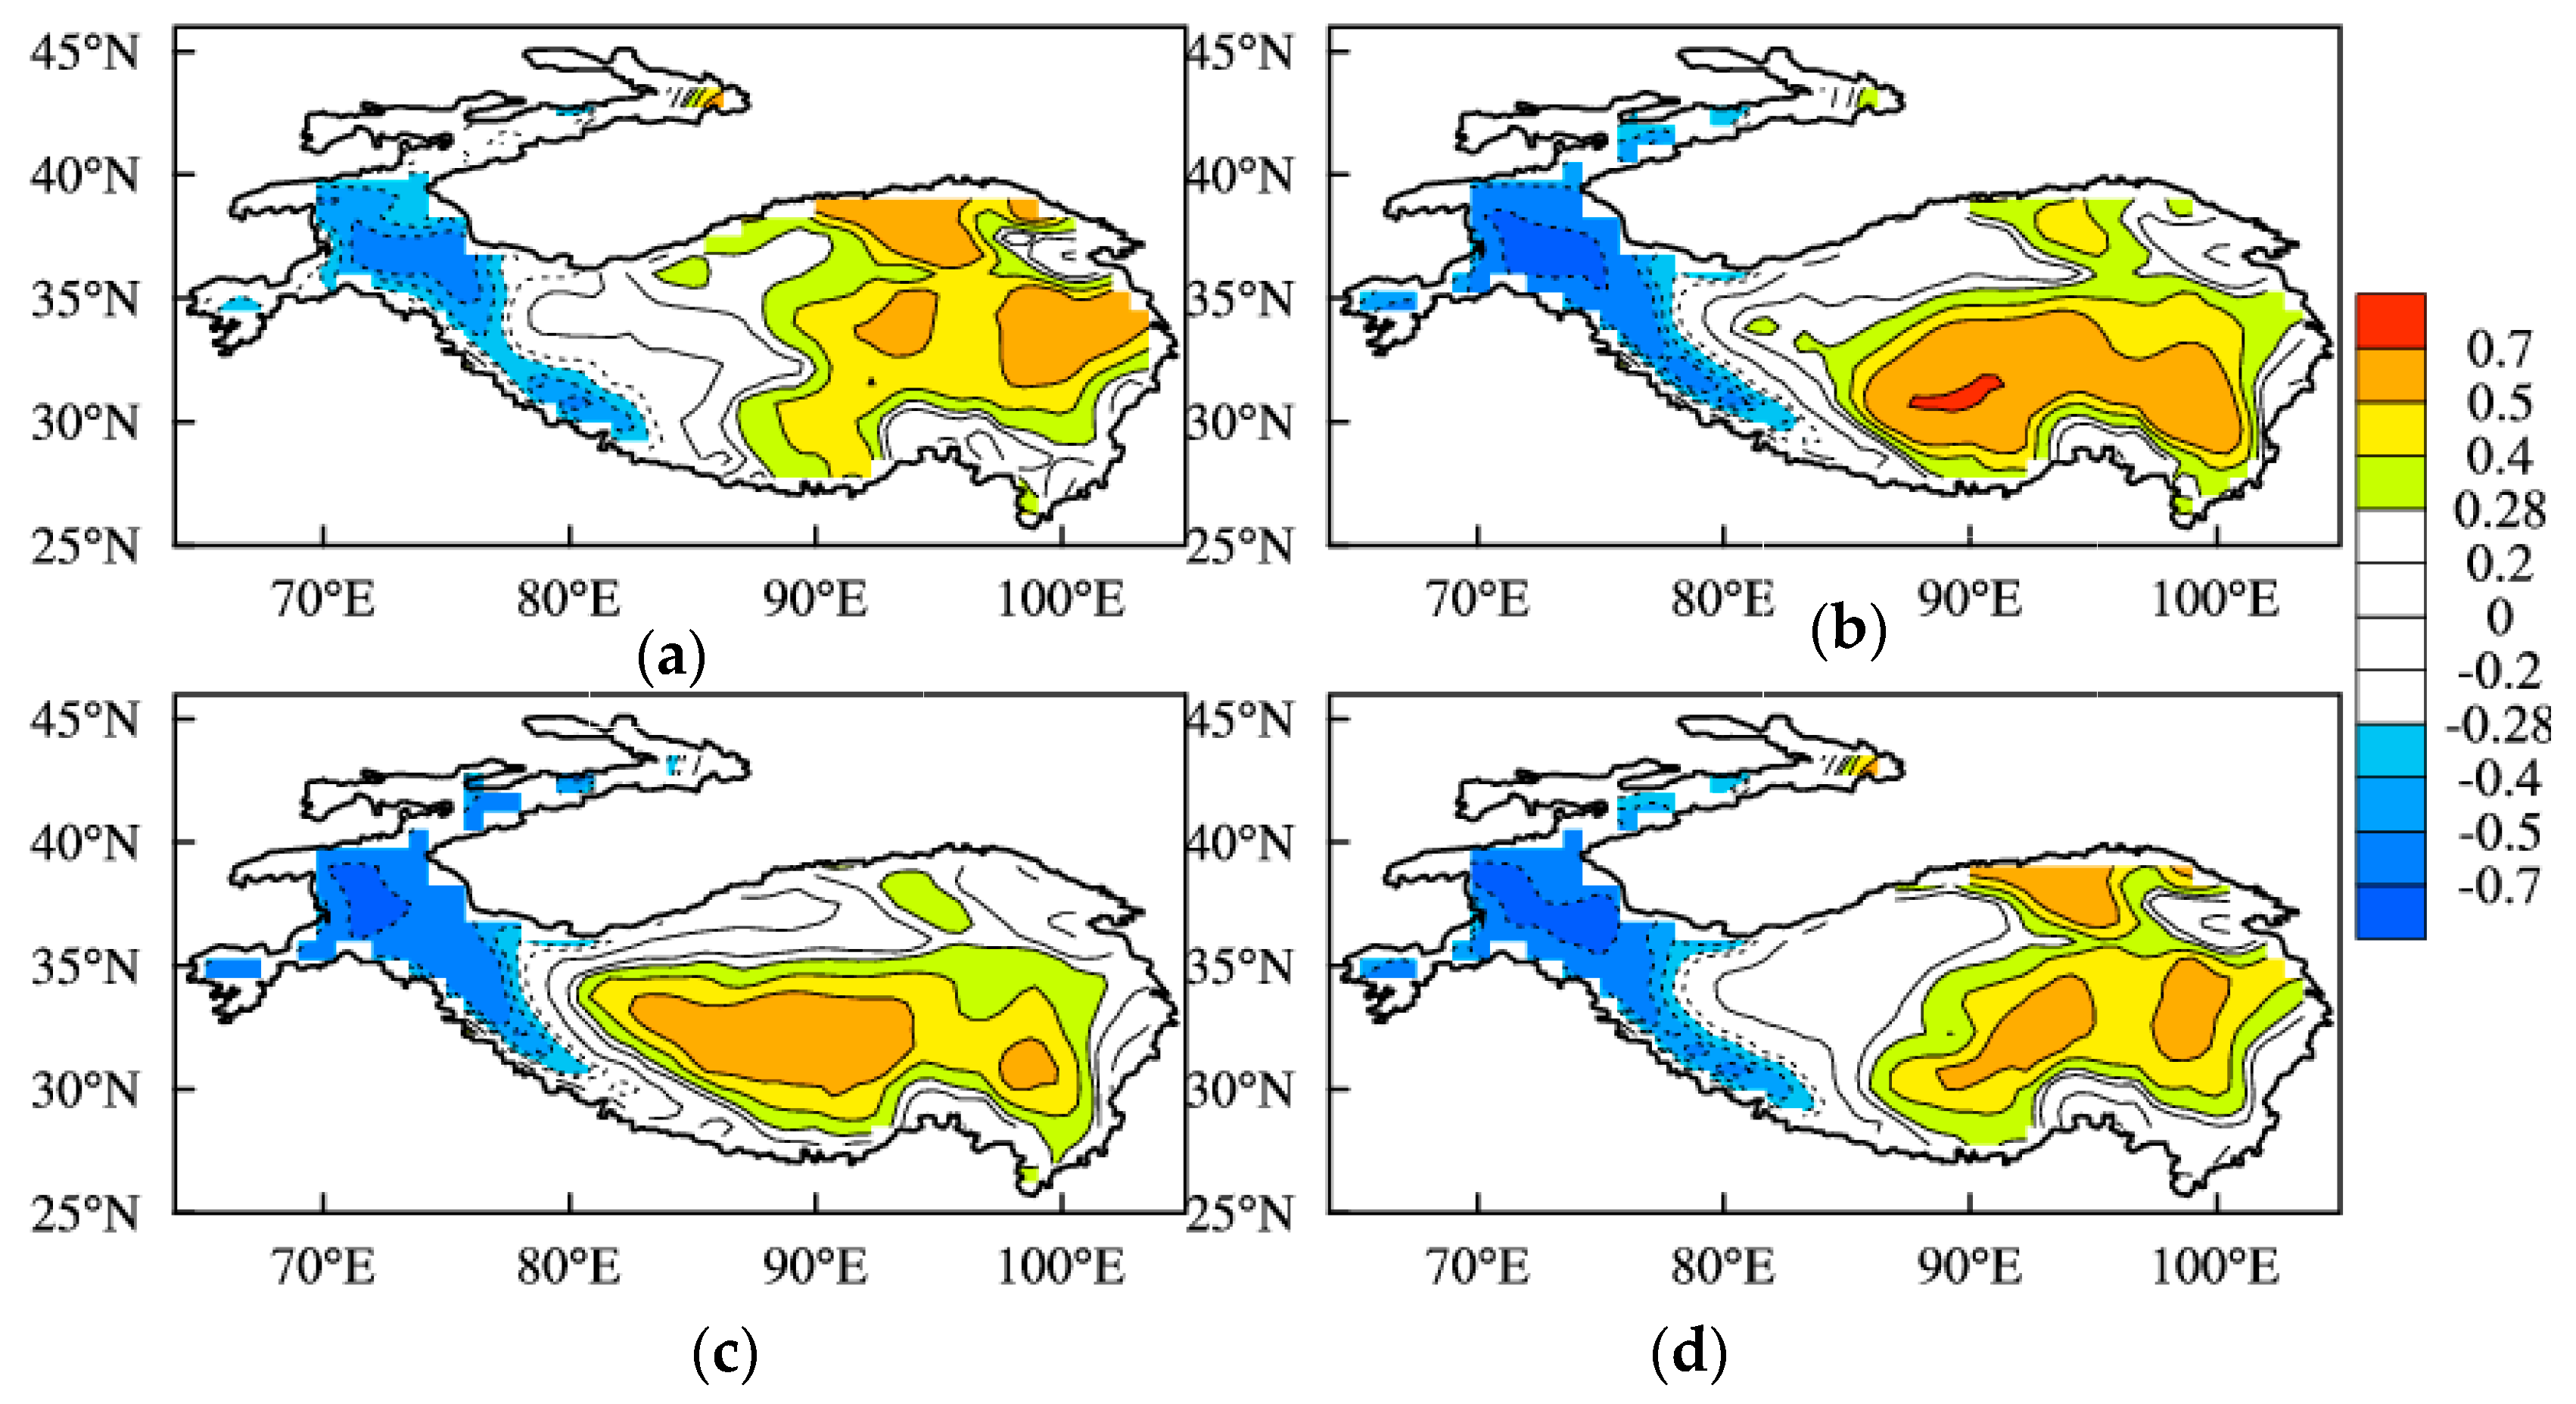
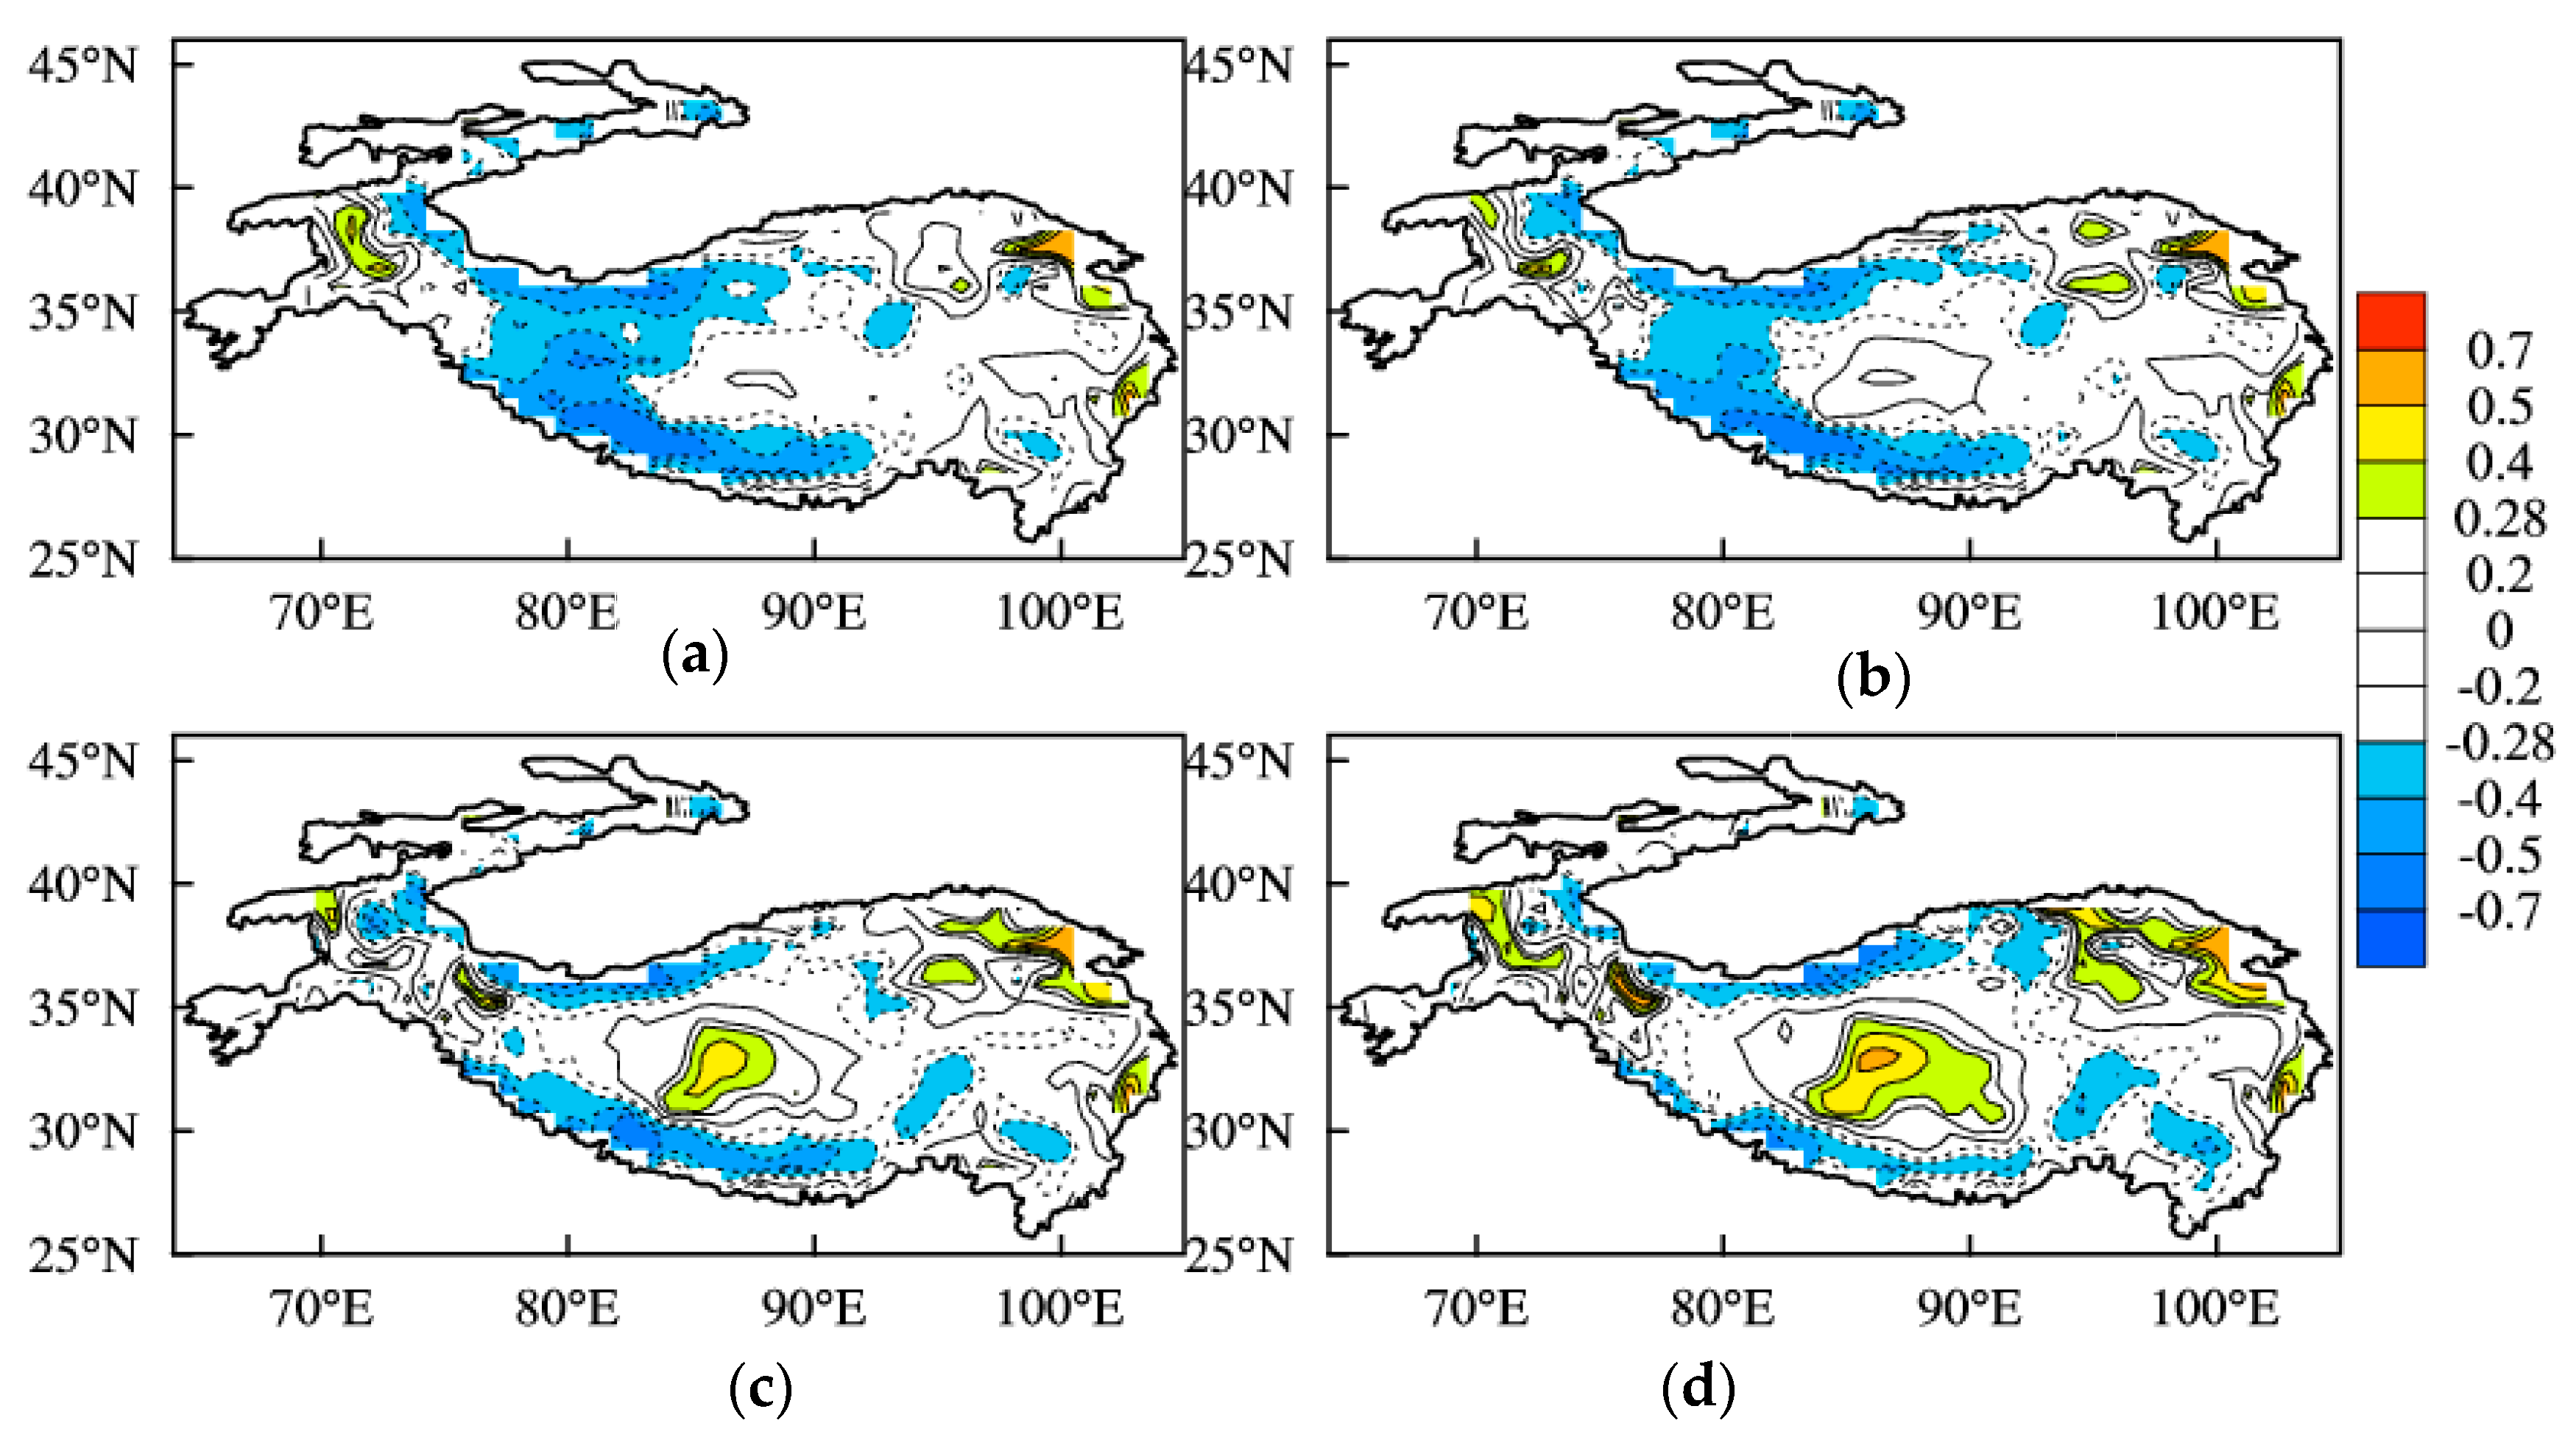
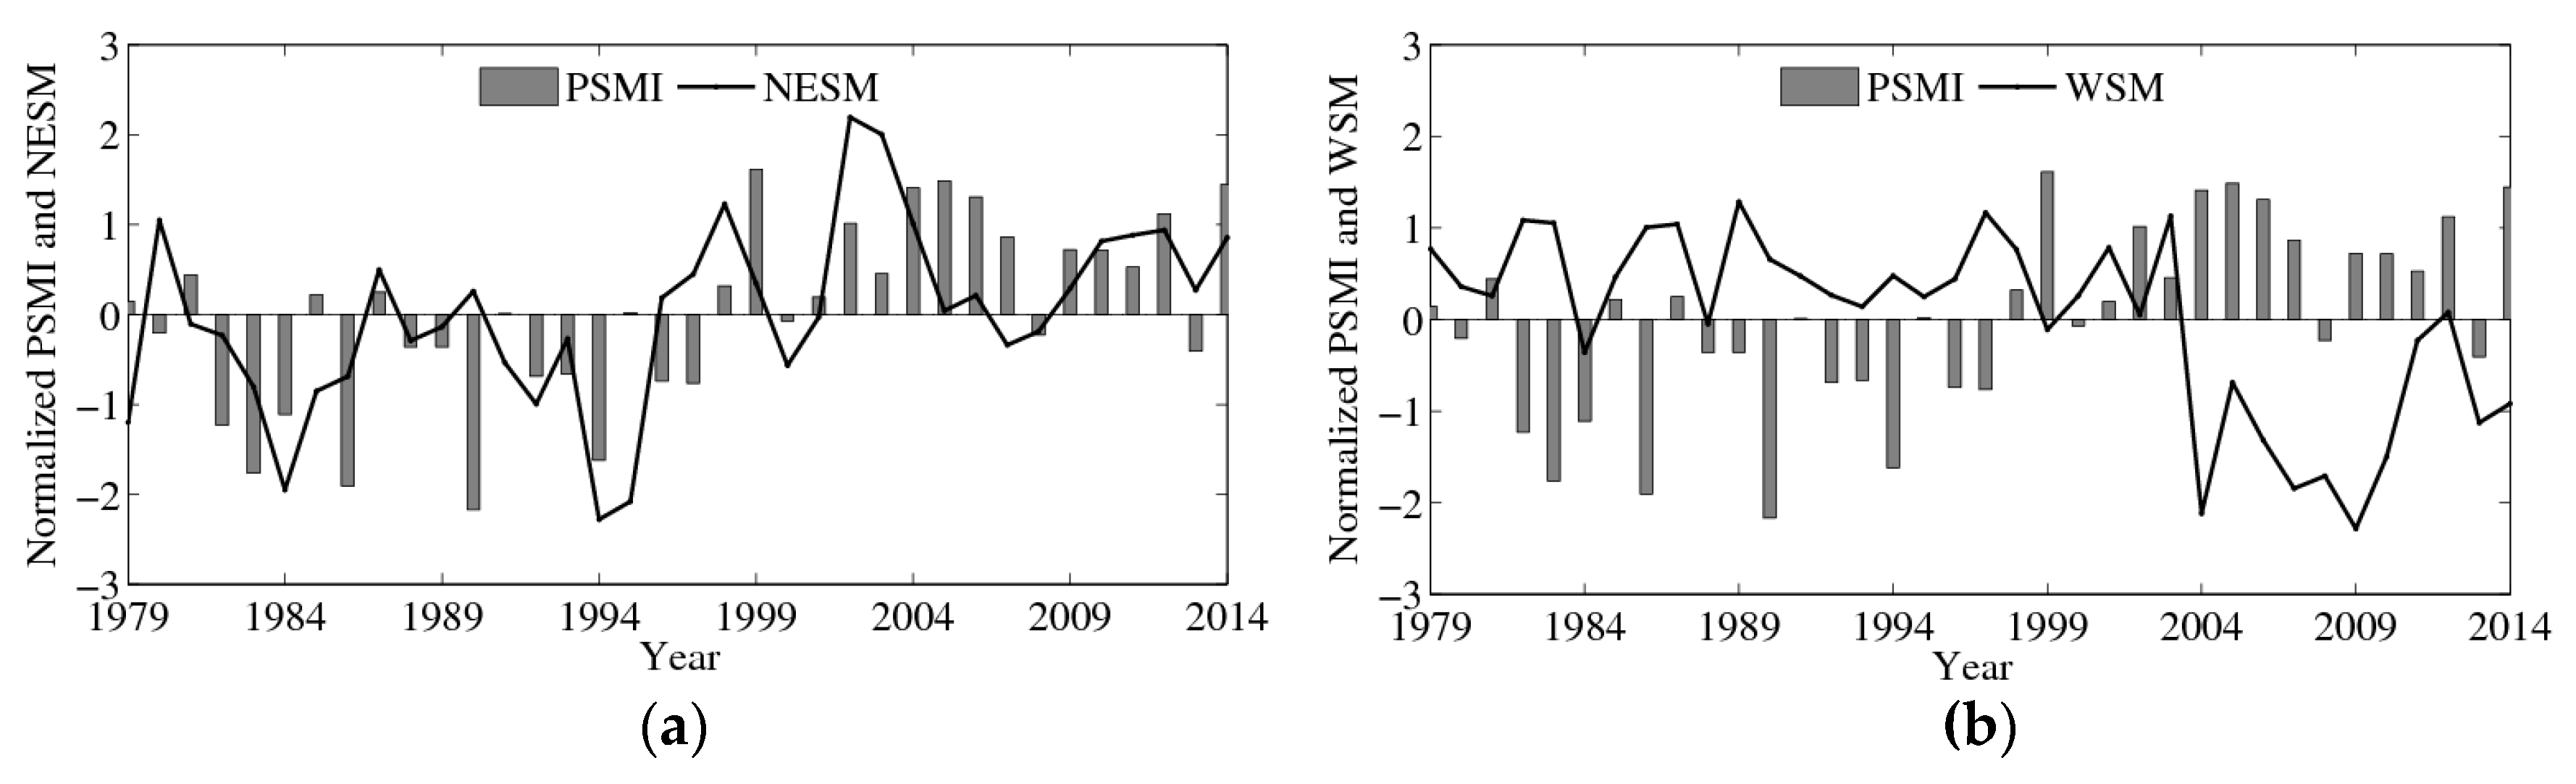
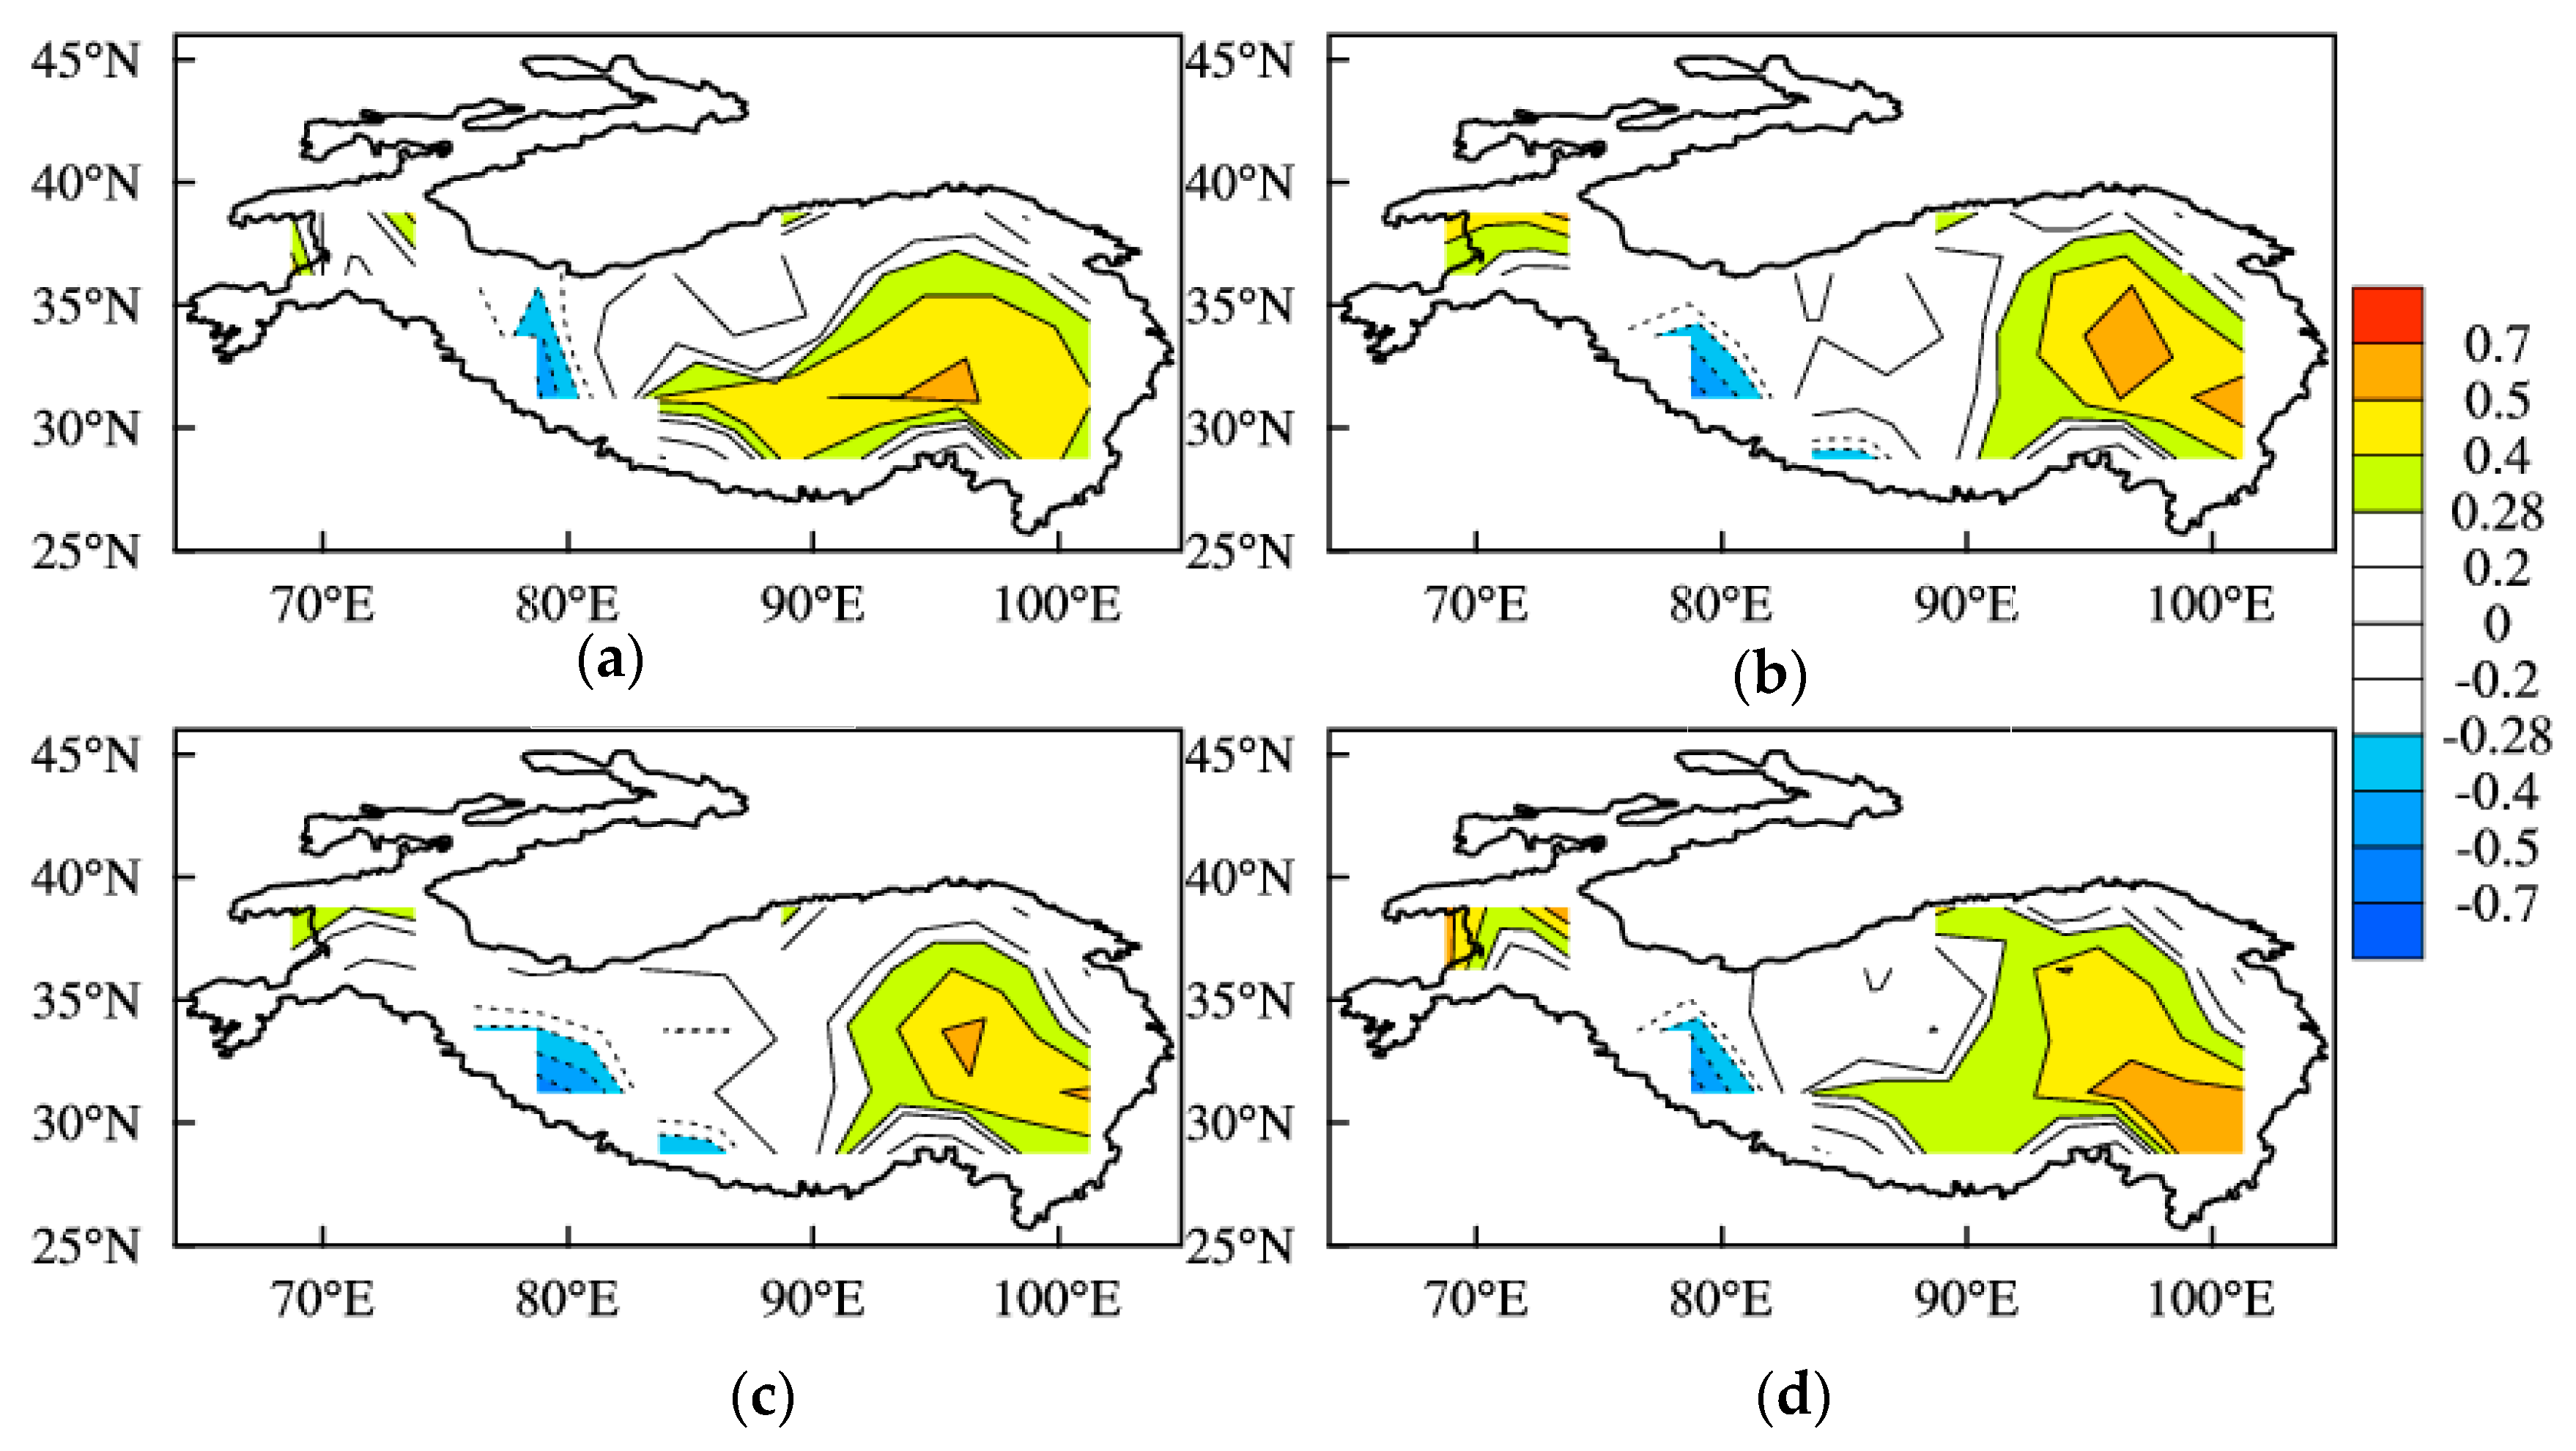
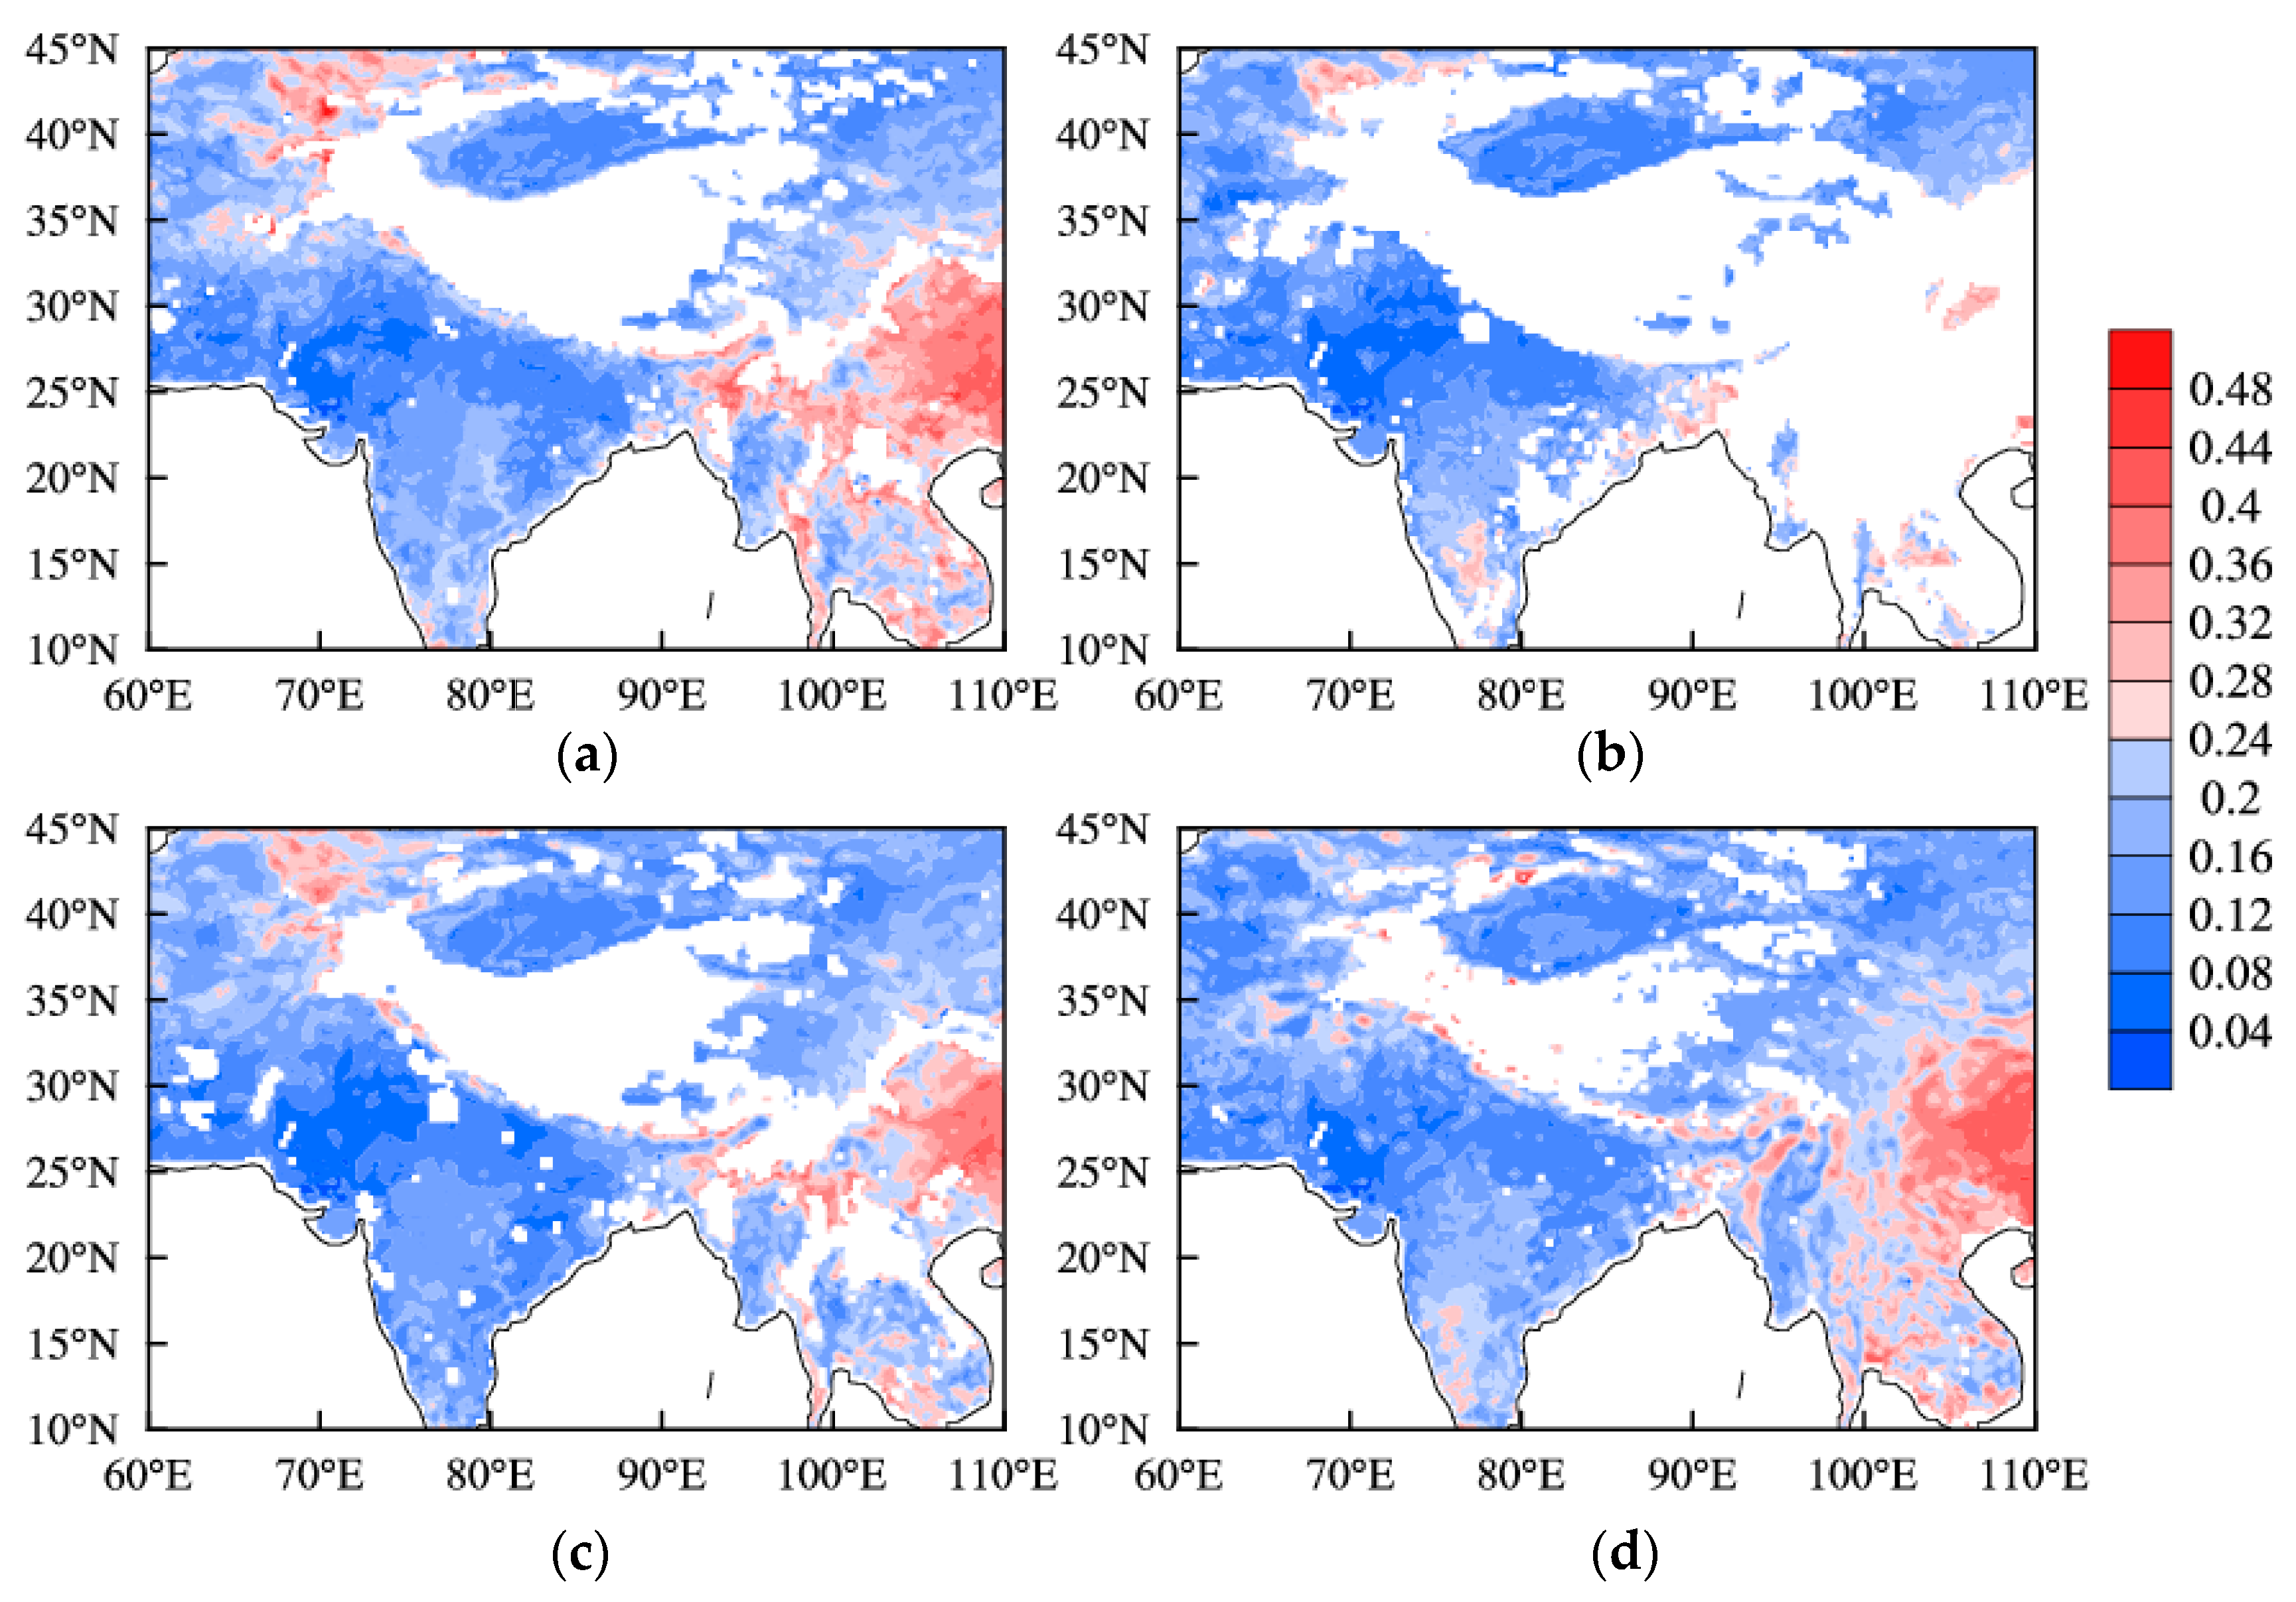
3.2. Correlation Analysis between the Plateau Monsoon and Soil Moisture

Soil moisture anomalies in the middle latitudes of the northern hemisphere could persist for approximately 1 to 2.5 months [42], and the soil over the plateau is frozen in the winter. Therefore, the linkages between the plateau soil moisture in the spring (April to May) and the plateau summer monsoon (June to August) are discussed. Figure 6 shows the correlations between the soil moisture in different layers and the summer monsoon (ZPMI). Significant correlations between the soil moisture in the 7 cm layer and the summer monsoon (Figure 6a) were found, and the regions of positive correlation were located in the central and eastern plateau. The center of significant positive correlations was confined to the northern edge and northeastern region of the plateau, whereas the regions of significant negative correlations were mainly distributed in the western plateau. The results displayed in Figure 6a indicate that when the soil moisture in the spring over the central and eastern plateau is higher (lower) than normal and the soil moisture over the western plateau is lower (higher), the plateau summer monsoon may be stronger (weaker). The spatial patterns of the correlations between the plateau summer monsoon and the soil moisture in the 21 cm, 72 cm, and 189 cm layers are similar to that of the 7 cm layer. However, the regions of significant negative correlation in the 72 cm and 189 cm layers over the western plateau decrease markedly, and the regions of significant positive correlation over the central and northeastern plateau increase markedly. The vertical variations of the soil water content over the plateau are closely related to the conditions of the local underlying surface, vegetation coverage, altitude, etc. The distribution characteristics of the soil moisture in different layers over the plateau vary, which leads to the different correlation patterns in different layers mentioned above [43].
To further reveal the linkages between the plateau soil moisture in the spring and the plateau summer monsoon, the area with a positive correlation exceeding the 90% significance level (36°–38°N, 92°–102°E) was selected to calculate the regional mean soil moisture in April and May (the soil moisture over the northeastern plateau, NESM). Soil moisture over the western plateau (WSM) was obtained using the same method in the negative correlation area (30°–36°N, 75°–85°E). For the time series X (NESM, WSM, and PSMI (the plateau summer monsoon index)) consisting of x values with sample size n, X = ( x 1 , x 2 , ... , x n ) , the X are normalized by N o r m ( x i ) = x i x ¯ s ,           s = 1 n i = 1 n ( x i x ¯ ) 2   (i = 1, 2,…, n), Where x ¯ is the mean value of X , s is the standard deviation. Time series of the normalized NESM, WSM, and PSMI are presented in Figure 7. The inter-annual variation of the NESM is consistent with that of the PSMI, with a correlation coefficient of 0.5 (Figure 7a). Meanwhile, the correlation coefficient between the WSM and PSMI is −0.52, with a more or less opposite inter-annual variability (Figure 7b). The results shown in Figure 7 further confirm that soil moisture in the late spring has a large influence on the plateau summer monsoon.
Numerous studies [23,44] have revealed that wetter (drier) soil leads to a decrease (increase) in the summer surface air temperature, which results in an anomalous sinking (rising) motion in situ. The spring soil moisture anomalies over the western plateau may play the above-mentioned role and result in related plateau monsoon anomalies. Cen et al. [45] indicated that there exists distinct thermal contract between the main area of the eastern plateau and the area north of it and that the thermal contrast is positively correlated with the plateau monsoon. Preceding spring soil moisture anomalies over the northeastern and southeastern plateau may lead to the distinct thermal contrast mentioned above, which ultimately results in plateau monsoon anomalies. Numerous factors contribute to plateau monsoon anomalies [8,46]. Soil moisture is an important factor in relation to climate change. By affecting evaporation and changing atmospheric heating, soil moisture anomalies have a remarkable influence on atmospheric circulation and the climate [47]. Previous studies have demonstrated that soil moisture can have a time-lagged effect on climate, and the time scale at which soil moisture in different latitude bands affects subsequent precipitation and temperature varies. This, in turn, has a great influence on the atmospheric conditions of the corresponding regions [19,48]. By changing the surface albedo, thermal capacity, surface sensible heat, and latent heat, the soil moisture in late spring can affect the thermal forcing over the plateau. The alteration of thermal conditions may lead to complex land–atmosphere interactions over the plateau; thus, the general circulation patterns and the intensity and position of the South Asia High are changed, ultimately affecting the intensity and controlling the domains of the plateau summer monsoon. The linkages between spring soil moisture over the plateau and the plateau summer monsoon are preliminarily investigated in the present study. How the two factors influence one another and the relevant atmospheric circulation characteristics remain to be further studied.

4. Conclusions

Based on the ECMWF ERA-Interim reanalysis data from 1979–2014, a plateau monsoon index (ZPMI) was constructed considering the characteristics of the wind field over the plateau. The inter-annual and inter-decadal variability of the plateau monsoon were analyzed. The linkages between the spring (April–May) soil moisture over the plateau and the plateau summer monsoon were also discussed. The conclusions of this study are as follows:
(1) In terms of seasonal and inter-annual variations, obvious differences exist among the plateau monsoon indices when using different calculation methods. The onset and retreat of the plateau summer monsoon reflected by the TPMI are approximately 1–2 months earlier than those of the DPMI and ZPMI, and the ZPMI can better reflect the seasonal and inter-annual variations in precipitation over the plateau. The plateau summer and winter monsoon indices display similar inter-annual and inter-decadal variation characteristics, i.e., rising trends, but the trend of the summer monsoon is more significant.
(2) In 1998, 2002, and 1997, the plateau summer monsoon reflected by the ZPMI, TPMI, and QPMI shifted from weak to strong. In contrast, no significant increasing or decreasing trends are detected in the plateau summer monsoon reflected by the DPMI. The plateau winter monsoon reflected by the different indices appears similar, and the winter ZPMI is more significantly enhanced during 1995–2008.
(3) In stronger plateau summer monsoon years, more (less) precipitation and a higher (lower) air temperature appear over the eastern and central (western) plateau. The plateau precipitation and air temperature reflected by the ZPMI are better than those of the TPMI, DPMI, and QPMI, and the ZPMI is also capable of effectively reflecting meteorological elements.
(4) A significant correlation is found between the plateau soil moisture in spring (April–May) and the plateau summer monsoon. When the soil moisture over the central and eastern plateau is higher (lower) than normal, while the soil moisture over western plateau is lower (higher), the plateau summer monsoon may be stronger (weaker).

Acknowledgments

This study was supported by funding from the National Natural Science Foundation of China (Grant Nos. 41530529 and 41375022) and the Key Research Program of the Chinese Academy of Sciences (Grant KZZD-EW-13). The authors are grateful to the anonymous reviewers for their constructive comments.

Author Contributions

All of the authors contribute extensively to the present paper. Jun Wen and Juan Zhou conceived and designed the study. Xin Wang helped perform the analysis with constructive discussions. Dongyu Jia and Jinlei Chen contributed analysis tools. Juan Zhou wrote the manuscript. Jun Wen supervised all of the work that has done by the authors, and revised the manuscript extensively.

Conflicts of Interest

The authors declare no conflict of interest.

Appendix A. A Discussion on the Strengthening Trend of Plateau Summer Monsoon and the Weakening Trend of the Asian Summer Monsoon

Numerous studies [49,50] have identified that the variability of the Asian summer monsoon is a result of the atmospheric response to changes in the contrast of thermal heating between land and ocean. The decreasing trend in the surface sensible heat source over the plateau will cause a weakening of the land-ocean thermal difference, which will lead to a weakening of the Asian summer monsoon. In the present study, the plateau summer monsoon presents an increasing trend, which is opposite to the variability of the Asian summer monsoon. This result is consistent with those of a number of researchers [25,51]. Atmospheric thermal differences include not only the large-scale contrast between the land and ocean, but also a relatively smaller-scale contrast between the plateau and its surrounding plains. In addition, the distribution ranges of the plateau monsoon are mainly confined to the main body of the plateau and its adjacent regions. Essentially, the thermal difference between the plateau and the free atmosphere is the primary cause of the generation and maintenance of the plateau monsoonal flow system. Thus, the smaller-scale thermal contrast between the plateau and its surrounding plains has a greater influence on the plateau monsoon. Under the background of the decreasing trend in the land-ocean thermal difference in the Asian monsoon region, the strengthening of the plateau summer monsoon may be related to the enhancement of the thermal difference between the plateau and surrounding plains in the middle-upper troposphere (especially the increase in the thermal difference between the plateau and plain in Eastern China) [25].

Appendix B. A Discussion on the Robustness of the Conclusion Points

Table A1. Correlation coefficients (r) between the plateau summer monsoon indices and the summer GPCP precipitation for the period 1979–2014.
ZPMITPMIDPMIQPMI
r0.54 *0.41 *0.36 *0.51 *
* with the significance level at 95%.
Figure A1. Correlation between the plateau summer monsoon indices and summer GPCP precipitation over the Qinghai-Xizang Plateau for the period 1979–2014: (a) ZPMI, (b) TPMI, (c) DPMI, and (d) QPMI (shading indicates areas exceeding the 90% significance level).
Remotesensing 08 00493 g008
To verify the robustness of the conclusion points, the observationally-based datasets Global Precipitation Climatology Project (GPCP) precipitation [52] and ESA CCI soil moisture (merged soil moisture product has been developed in the framework of the European Space Agency’s Water Cycle Multi-mission Observation Strategy and Climate Change Initiative projects) [53,54] are used to conduct the same analyses. The largest r value listed in the Table A1 is also belonged to the summer ZPMI, and the spatial patterns presented in the Figure A1 are similar to those depicted in the Figure 4. Thus, the GPCP precipitation can capture the results presented above as well. As seen from the Figure A2, there exist a large amount of missing satellite soil moisture data over the plateau in April and May, especially over the western plateau. Therefore, the ESA CCI soil moisture dataset is not suitable for the current study. The limited availability of satellite-based soil moisture estimates over the plateau within ESA CCI merged product mainly due to the inherent difficulties in retrieving soil moisture from permafrost and seasonally frozen ground [30]. Apparently, the ESA CCI soil moisture product is not suitable for the climate change studies at sub-continental and long-time scale due to the sparse retrieval of soil moisture over frozen land surfaces. The low data availability of satellite soil moisture product over the plateau is a well-known issue, which enough attentions and further efforts should be paid to tackling those fundamental problems.
Figure A2. Mean ESA CCI soil moisture in April and May for the year 1979 (a), 1990 (b), 2003 (c), and 2014 (d) (randomly selected, similar distributions have been detected in the other years as well).
Remotesensing 08 00493 g009

References

  1. Ye, D.Z.; Luo, S.W.; Zhu, B.Z. The wind structure and heat balance in the lower troposphere over Tibetan Plateau and its surrounding. J. Meteorol. Res. 1957, 28, 108–121. (In Chinese) [Google Scholar]
  2. Xu, S.Y.; Gao, Y.X. The monsoon phenomenon in Tibetan Plateau. Acta Geogr. Sin. 1962, 28, 111–123. (In Chinese) [Google Scholar]
  3. Tang, M.C.; Shen, Z.B.; Chen, Y.Y. On climatic characteristics of the Xizang Plateau monsoon. Acta Geogr. Sin. 1979, 34, 34–41. (In Chinese) [Google Scholar]
  4. Ye, D.Z.; Gao, Y.X. Qinghai-Xizang Plateau Meteorology; Science Press: Beijing, China, 1979; pp. 1–278. [Google Scholar]
  5. Tang, M.C.; Reiter, E.R. Plateau monsoons of the Northern Hemisphere: a comparison between North America and Tibet. Mon. Weather Rev. 1984, 112, 617–637. [Google Scholar] [CrossRef]
  6. Kuo, H.L.; Qian, Y.F. Influence of the Tibetan Plateau on cumulative and diurnal changes of weather and climate in summer. Mon. Weather Rev. 1981, 109, 2337–2356. [Google Scholar] [CrossRef]
  7. Tang, M.C.; Liang, J.; Shao, M.J.; Shi, G. Preliminary analysis on inter-annual variation of Plateau monsoon. Plateau Meteorol. 1984, 3, 76–82. (In Chinese) [Google Scholar]
  8. Tang, M.C. Discussion on inter-decade oscillation of Plateau monsoon and its causes. Sci. Meteorol. Sin. 1995, 15, 64–68. (In Chinese) [Google Scholar]
  9. Bai, H.Z.; Xie, J.N.; Li, D.L. The principal feature of Qinghai-Xizang Plateau monsoon variation in 40 years. Plateau Meteorol. 2001, 20, 22–27. (In Chinese) [Google Scholar]
  10. Xun, X.Y.; Hu, Z.Y.; Ma, Y.M. The Dynamic Plateau Monsoon Index and its association with general circulation anomalies. Adv. Atmos. Sci. 2012, 29, 1249–1263. [Google Scholar] [CrossRef]
  11. Qi, D.M.; Li, Y.Q.; Bai, Y.Y.; De, D. The definition of plateau summer monsoon index and analysis on its characteristics. Plateau Mt. Meteorol. Res. 2009, 29, 1–9. (In Chinese) [Google Scholar]
  12. Ma, Z.G.; Fu, C.B.; Xie, L.; Chen, W.H.; Tao, S.W. Some problems in the study on the relationship between soil moisture and climate change. Adv. Earth Sci. 2001, 16, 563–568. (In Chinese) [Google Scholar]
  13. Koster, R.D.; Suarez, M.J. Soil moisture memory in climate models. J. Hydrol. 2001, 2, 558–570. [Google Scholar] [CrossRef]
  14. Douville, H. Influence of soil moisture on the Asian and African monsoons. Part II: Interannual variability. J. Clim. 2002, 15, 701–720. [Google Scholar] [CrossRef]
  15. Douville, H. Assessig the influence of soil moisture on seasonal climate variability with AGCMs. J. Hydrometeorol. 2003, 4, 1044–1066. [Google Scholar] [CrossRef]
  16. Douville, H.; Chauvin, F. Relevance of soil moisture for seasonal climate predictions: A preliminary study. Clim. Dyn. 2000, 16, 719–736. [Google Scholar] [CrossRef]
  17. Douville, H.; Chauvin, F.; Broqua, H. Influence of soil moisture on the Asian and African monsoons. Part I: Mean monsoon and daily precipitation. J. Clim. 2001, 14, 2381–2403. [Google Scholar] [CrossRef]
  18. Le, Y.L.; Luo, Y.; Guo, P.W. A study on the relationship between spring soil moisture over China and East Asia Summer Monsoon. J. Trop. Meteorol. 2007, 23, 474–482. (In Chinese) [Google Scholar]
  19. Chow, K.C.; Johnny, C.; Chan, L.; Shi, X.L.; Liu, Y.M.; Ding, Y.H. Time-lagged effects of spring Tibetan Plateau soil moisture on the monsoon over China in early summer. Int. J. Climatol. 2008, 28, 55–67. [Google Scholar] [CrossRef]
  20. Cui, Y. Study on the relationships between the land surface process of Qinghai-Xizang Plateau and the Asian summer monsoon. Ph.D. Thesis, Lanzhou University, Gansu, China, 2010. [Google Scholar]
  21. Zhang, R.H.; Zou, Z.Y. Impact of spring soil moisture on surface energy balance and summer monsoon circulation over East Asia and precipitation in East China. J. Clim. 2011, 24, 3309–3322. [Google Scholar] [CrossRef]
  22. Liu, G.; Chen, J.M.; Ji, L.R.; Sun, S.Q. Relationship of summer soil moisture with early winter monsoon and air temperature over eastern China. Int. J. Climatol. 2012, 32, 1512–1519. [Google Scholar] [CrossRef]
  23. Zhan, Y.L.; Lin, Z.H. The relationship between June precipitation over mid-lower reaches of the Yangtze River basin and spring soil moisture over the East Asian monsoon region. Acta Meteorol. Sin. 2012, 70, 236–243. (In Chinese) [Google Scholar] [CrossRef]
  24. Xun, X.Y.; Hu, Z.Y.; Cui, G.F.; He, H.G.; Sun, J.; Hao, L.; Gu, L.L. Change of monsoon in Qinghai-Xizang Plateau and its correlation with summer precipitation of Ordos Plateau. J. Arid Land Resour. Environ. 2011, 25, 79–83. (In Chinese) [Google Scholar]
  25. Hua, W.; Fan, G.Z.; Wan, B.Y. Variation of Tibetan Plateau summer monsoon and its effect on precipitation in East China. Chin. J. Atmos. Sci. 2012, 36, 784–794. (In Chinese) [Google Scholar]
  26. Zhao, T.B.; Fu, C.B. Preliminary comparison and Analysis between ERA-40, NECP-2 Reanalysis and observations over China. Clim. Environ. Res. 2006, 11, 14–32. (In Chinese) [Google Scholar]
  27. Li, H.B.; Robock, A.; Liu, S.X.; Mo, S.X.; Viterbo, P. Evaluation of reanalysis soil moisture simulations using updated Chinese soil moisture observations. J. Hydrometeorol. 2004, 6, 180–193. [Google Scholar] [CrossRef]
  28. Zhang, W.J.; Zhou, T.J.; Yu, R.C. Spatial distribution and temporal variation of soil moisture over China Part I: Multi-data Intercomparison. Chin. J. Atmos. Sci. 2008, 32, 581–597. (In Chinese) [Google Scholar]
  29. Su, Z.; Rosnay, P.; Wen, J.; Wang, L.; Zeng, Y. Evaluation of ECMWF’s soil moisture analyses using observations on the Tibetan Plateau. J. Geophys. Res. 2013, 118, 5304–5308. [Google Scholar] [CrossRef]
  30. Zeng, Y.J.; Su, Z.B.; van der Velde, R.; Wang, L.C.; Xu, K.; Wang, X.; Wen, J. Blending satellite observed, model simulated, and in situ measured soil moisture over Tibetan Plateau. Remote Sens. 2016, 8, 268. [Google Scholar] [CrossRef]
  31. Liu, C.; Yu, Y.; Xie, J.; Zhou, X.; Li, J.L.; Ge, J. Applicability of soil temperature and moisture in several datasets over Qinghai-Xizang Plateau. Plateau Meteorol. 2015, 34, 653–665. (In Chinese) [Google Scholar]
  32. Zuo, Z.Y.; Zhang, R.H. The temporal and spatial variation characteristics of soil moisture over Eastern China. Sci. China (Ser. D Earth Sci.) 2008, 38, 1428–1437. (In Chinese) [Google Scholar]
  33. Dee, D.P.; Uppala, S.M.; Simmons, A.J.; Berrisford, P.; Paul, P. Shinya Kobayashi The ERA-Interim reanalysis: Configuration and performance of the data assimilation system. Q. J. R. Meteorol. Soc. 2011, 137, 553–597. [Google Scholar] [CrossRef]
  34. Wei, F.Y. Technology of Statistical Diagnosis and Prediction of Modern Climate; China Meteorological Press: Beijing, China, 1999; pp. 62–73. [Google Scholar]
  35. Blain, G.C. Removing the influence of the serial correlation on the Mann-Kendall test. Rev. Bras. Meteorol. 2014, 29, 161–170. [Google Scholar] [CrossRef]
  36. Zhu, Q.G.; Lin, J.R. The Theories and Methods of Synoptic Meteorology; China Meteorological Press: Beijing, China, 2000; pp. 462–555. [Google Scholar]
  37. Webster, P.J.; Magana, V.O.; Palmer, T.N.; Shukla, J.; Tomas, R.A.; Yanai, M.; Yasunari, T. Monsoons: Processes, predictability, and the prospects for prediction. J. Geophys. Res. 1998, 103, 14451–14510. [Google Scholar] [CrossRef]
  38. Jiang, Y.J.; Li, S.J.; Shen, D.F.; Chen, W.; Jin, C.F. Climate change and its impact on the lake environment in the Tibetan Plateau in 1971–2009. Sci. Geogr. Sin. 2012, 32, 1503–1512. (In Chinese) [Google Scholar]
  39. Jiang, Y.J.; Li, S.J.; Shen, D.F.; Chen, W. Climate change and its impact on the regional environment in the source regions of the Yangtze, Yellow and Lantsang Rivers in Qinghai—Tibetan Plateau during 1971–2008. J. Mt. Sci. 2012, 30, 461–469. (In Chinese) [Google Scholar]
  40. Liu, J.S.; Wang, S.Y.; Yu, S.M.; Yang, D.Q.; Zhang, L. Climate warming and growth of high-elevation inland lakes on the Tibetan Plateau. Glob. Planet. Chang. 2009, 67, 209–217. [Google Scholar] [CrossRef]
  41. Li, J.P.; Zeng, Q.C. A unified monsoon index. Geophys. Res. Lett. 2002, 29, 1274. [Google Scholar] [CrossRef]
  42. Vinnikov, K.Y.; Robock, A.; Speranskaya, N.A.; Schlosser, C.A. Scales of temporal and spatial variability of midlatitude soil moisture. J. Geophys. Res. 1996, 101, 7163–7174. [Google Scholar] [CrossRef]
  43. Zhuo, G.; Chen, T.; Zhou, K.S.; Luo, Z. Spatial and temporal distribution of soil moisture over the Tibetan Plateau during 2009–2010. J. Glaciol. Geocryol. 2015, 37, 625–634. (In Chinese) [Google Scholar]
  44. Grimm, A.M.; Jeremy, S.P.; Filippo, G. Connection between spring conditions and peak summer monsoon rainfall in South America: Role of soil moisture, surface temperature, and topography in eastern Brazil. J. Clim. 2007, 20, 5929–5945. [Google Scholar] [CrossRef]
  45. Cen, S.X.; Gong, Y.F.; Lai, X.; Qi, D.M. The relationship of the thermal contrast between the eastern Tibetan Plateau and its northern side with the plateau monsoon and the precipitation in the Yangtze River basin in summer. Acta Meteorol. Sin. 2014, 72, 256–265. (In Chinese) [Google Scholar]
  46. Ma, Z.F.; Gao, W.L. Relationship between interannual change over Qinghai-Xizang Plateau monsoon and climate change in upper rech of Changjiang River. Plateau Meteorol. 2003, 22, 8–16. (In Chinese) [Google Scholar]
  47. Miao, Q.L.; Jiang, Z.H.; Chen, H.S.; Yu, J.H. Contemporary Climatology; China Meteorological Press: Beijing, China, 2011; pp. 163–178. [Google Scholar]
  48. Yeh, T.C.; Wetherald, R.T.; Manabe, S. The effect of soil moisture on the short-term climate and hydrology change-A numerical experiment. Mon. Weather Rev. 1983, 112, 474–490. [Google Scholar] [CrossRef]
  49. Zhao, P.; Zhu, Y.N.; Zhang, R.H. An Asian-Pacific teleconnection in summer tropospheric temperature and associated Asian climate variability. Clim. Dyn. 2007, 29, 293–303. [Google Scholar] [CrossRef]
  50. Duan, A.M.; Wu, G.X. Role of the Tibetan Plateau thermal forcing in the summer climate patterns over subtropical Asia. Clim. Dyn. 2005, 24, 793–807. [Google Scholar] [CrossRef]
  51. Tang, M.C. Some advances on the research of plateau monsoons (A Review). Plateau Meteorol. 1993, 12, 95–101. (In Chinese) [Google Scholar]
  52. Adler, R.F.; Huffman, G.J.; Chang, A.; Ferraro, R.; Xie, P.P.; Janowial, J.; Rudolf, B.; Schneider, U.; Curtis, S.; Bolvin, D.; et al. The version-2 Global Climatology Project (GPCP) monthly precipitation analysis (1979-Present). J. Hydrometeorol. 2003, 4, 1147–1167. [Google Scholar] [CrossRef]
  53. Liu, Y. Y.; Dorigo, W.A.; Parinussa, R.M.; de Jeu, R.A.M.; Wagner, W.; McCabe, M.F.; Evans, J.P.; van Dijk, A.I.J.M. Trend-preserving blending of passive and active microwave soil moisture retrievals. Remote Sens. Environ. 2012, 123, 280–297. [Google Scholar] [CrossRef]
  54. Wagner, W.; Dorigo, W.A.; de Jeu, R.; Fernandez, D.; Benveniste, J.; Haas, E.; Ertl, M. Fusion of active and passive microwave observations to create an Essential Climate Variable data record on soil moisture. ISPRS Ann. Photygramm. Remote Sens. Spat. Inf. Sci. 2012, I-7, 315–321. [Google Scholar] [CrossRef]
Figure 1. Mean 550 hPa height field (unit: gpm) and horizontal wind field (unit: m/s) in the summer (a) and winter (b) over the plateau from 1979 to 2014.
Remotesensing 08 00493 g001
Figure 2. Seasonal variation of precipitation (P) and plateau monsoon indices (a), and inter-annual variation of plateau summer precipitation (P) and monsoon indices (b), and inter-annual variation of plateau winter monsoon indices (c), for the period 1979–2014.
Remotesensing 08 00493 g002
Figure 3. (ag) SQMK test statistics UF and UB of the plateau summer monsoon indices ((a), (c), (e), and (g)) and plateau winter monsoon indices ((b), (d), and (f)) for the period 1979–2014. The dotted line represents the zero line, and the thick dash line the 0.05 significance level.
Remotesensing 08 00493 g003aRemotesensing 08 00493 g003b
Figure 4. Correlation between the plateau summer monsoon indices and summer precipitation over the Qinghai-Xizang Plateau for the period 1979–2014: (a) ZPMI, (b) TPMI, (c) DPMI, and (d) QPMI (shading indicates areas exceeding the 90% significance level).
Remotesensing 08 00493 g004
Figure 5. Correlation between plateau summer monsoon indices and the air temperature at 2 m above the ground surface in the summer (June–August) over the Qinghai-Xizang Plateau for the period 1979–2014: (a) ZPMI, (b) TPMI, (c) DPMI, and (d) QPMI (shading indicates areas exceeding the 90% significance level).
Remotesensing 08 00493 g005
Figure 6. Correlation between the plateau summer monsoon indices (June–August) and soil moisture in April and May over the Qinghai-Xizang Plateau for the period 1979–2014: (a) 7 cm, (b) 21 cm, (c) 72 cm, and (d) 189 cm (shading indicates areas exceeding the 90% significance level).
Remotesensing 08 00493 g006
Figure 7. Time series of normalized soil moisture of (a) the northeastern region (NESM) and (b) the western region (WSM) in April and May and the plateau summer monsoon index (PSMI) over the Qinghai-Xizang Plateau for the period 1979–2014.
Remotesensing 08 00493 g007
Table 1. Correlation coefficients (r) between the plateau summer monsoon indices and the summer precipitation for the period 1979–2014.
ZPMITPMIDPMIQPMI
r0.67 *0.52 *0.42 *0.62 *
* with the significance level at 95%.
Table 2. Z statistics of the Mann-Kendall trend test for the plateau summer and winter monsoon indices from 1979 to 2014.
ZPMITPMIDPMIQPMI
Summer3.23 *2.30 *1.782.82 *
Winter1.310.110.43
* with the significance level at 95%.

