
Landsat ETM+ and SRTM Data Provide Near Real-Time Monitoring of Chimpanzee (Pan troglodytes) Habitats in Africa


Abstract
:
1. Introduction
2. Data and Methods
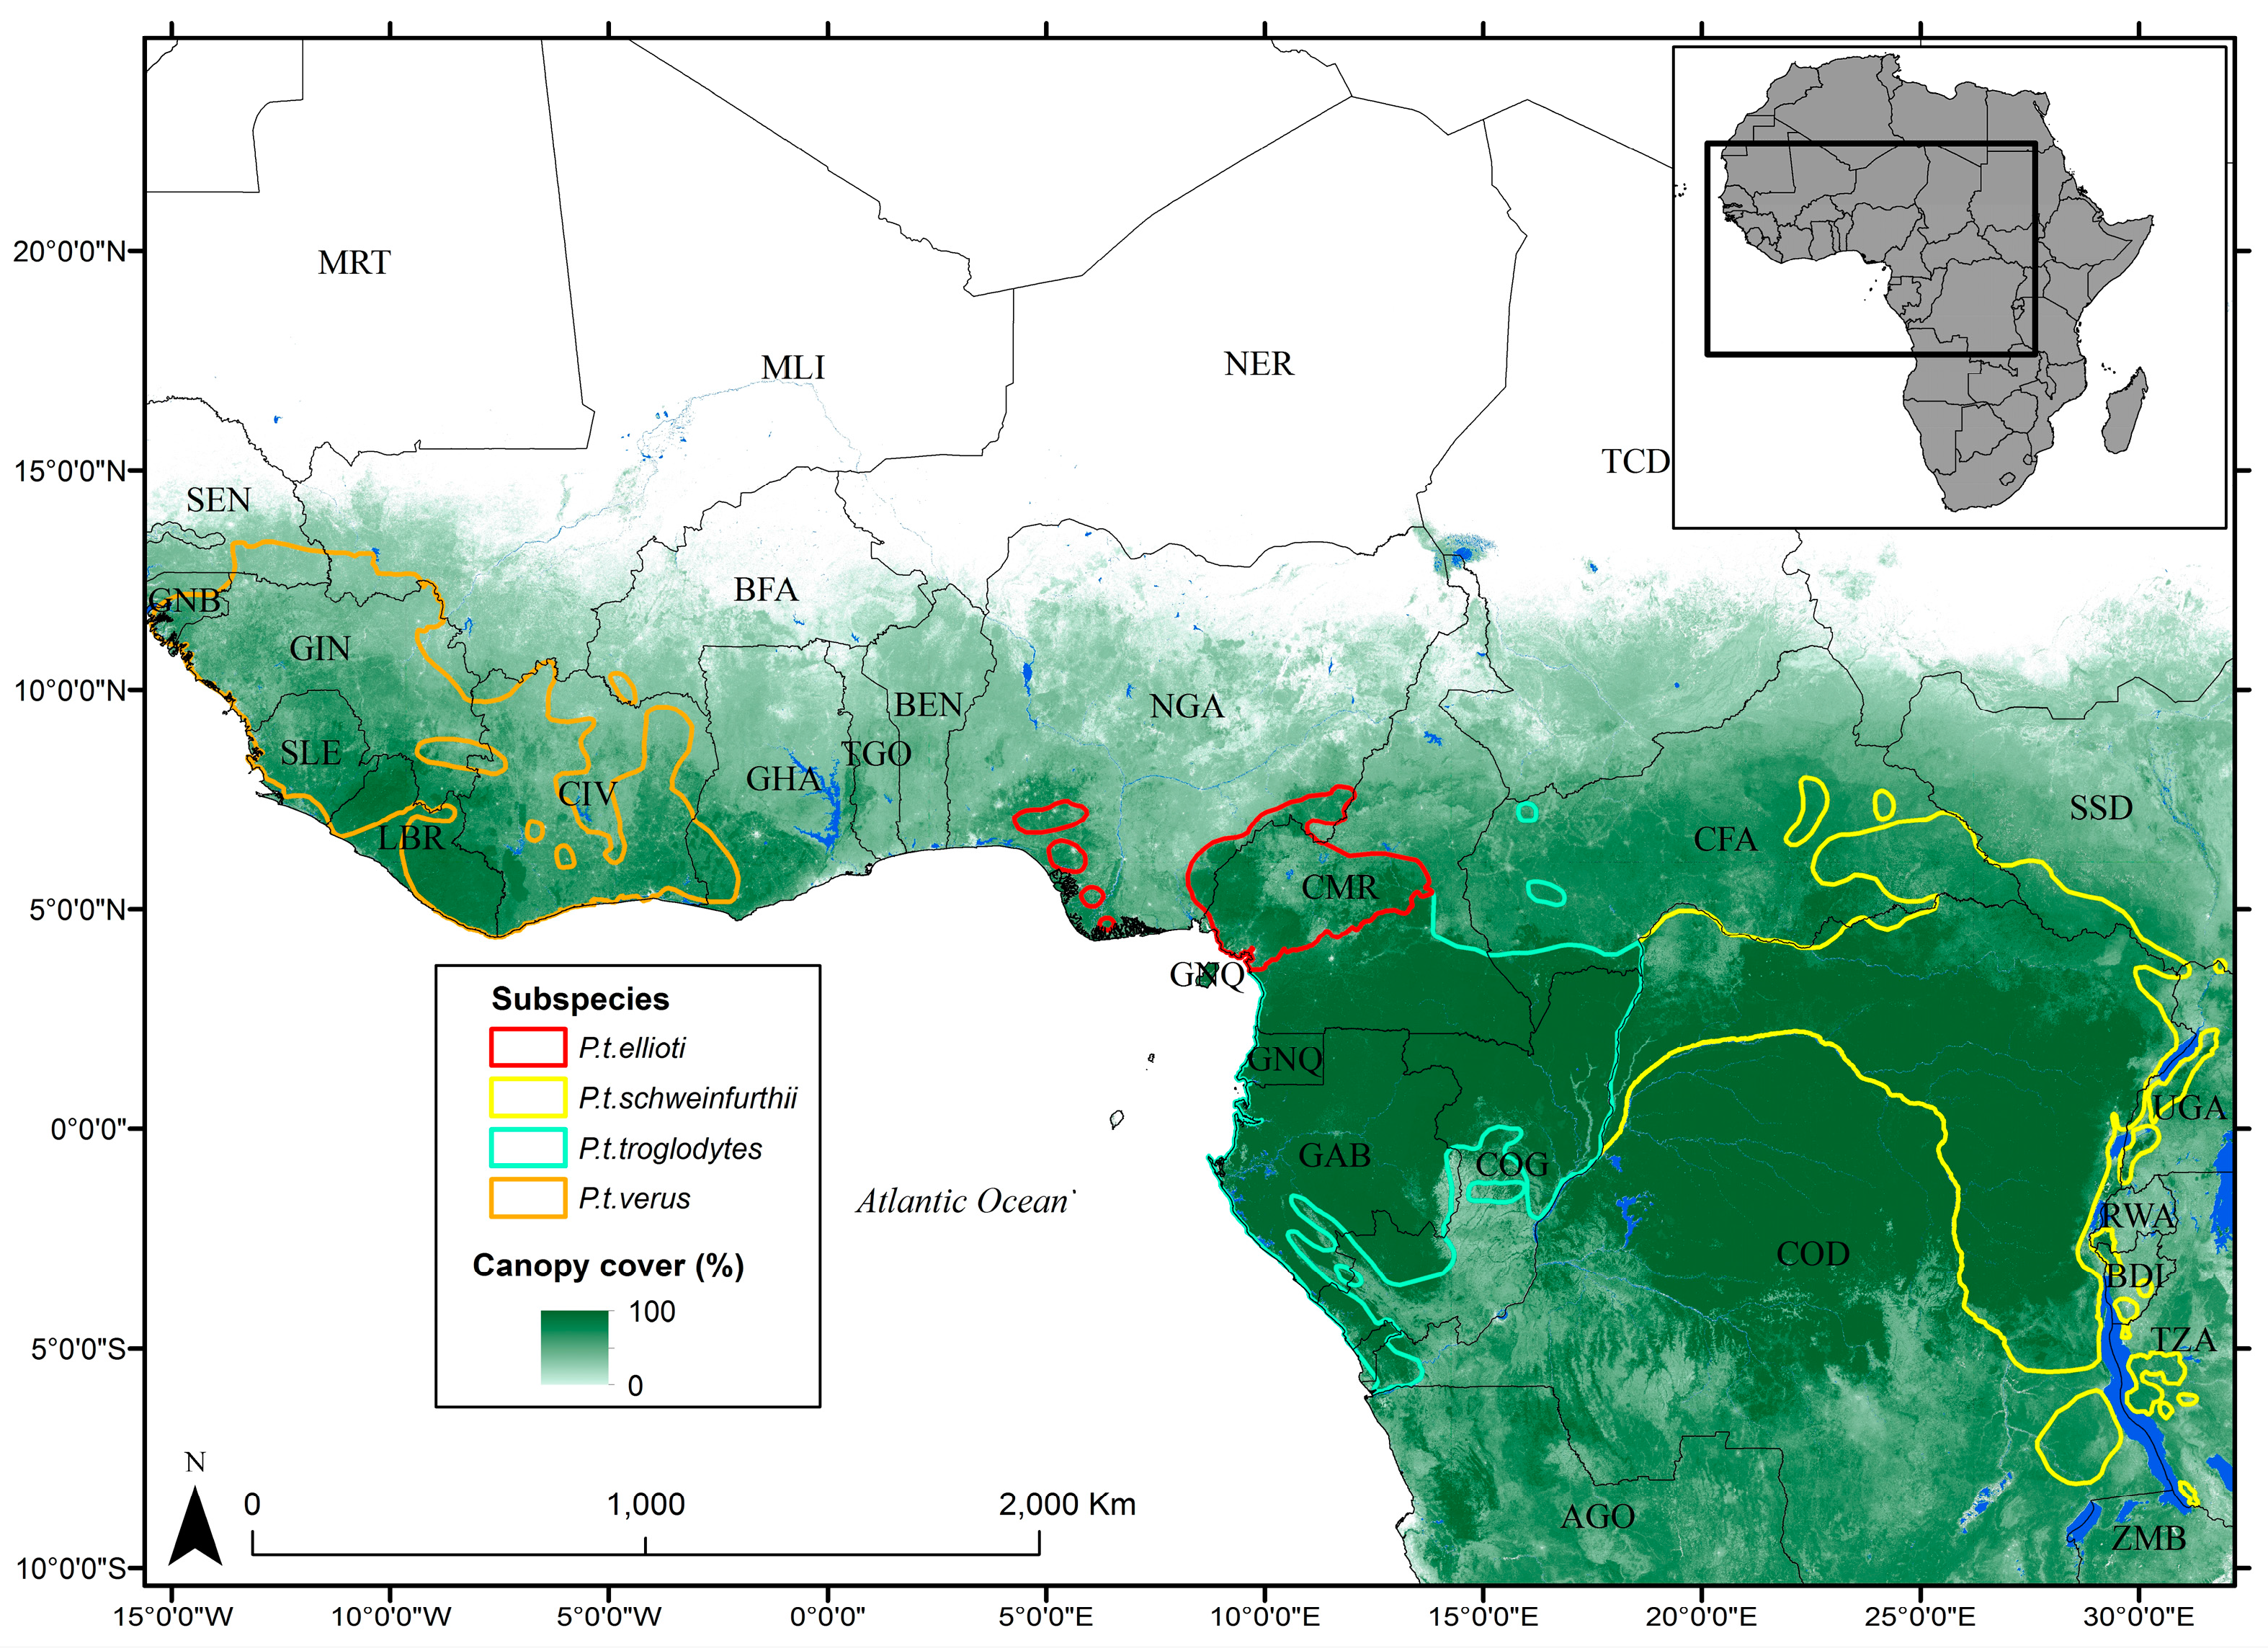
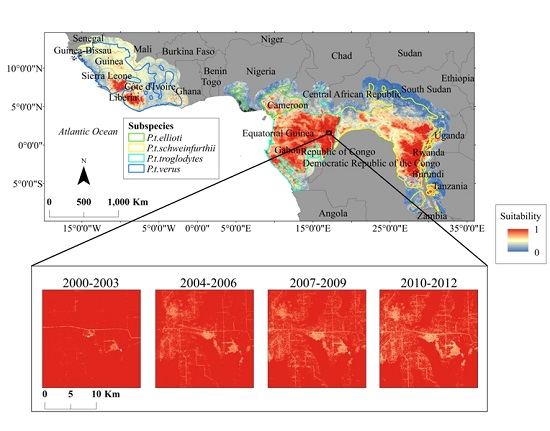
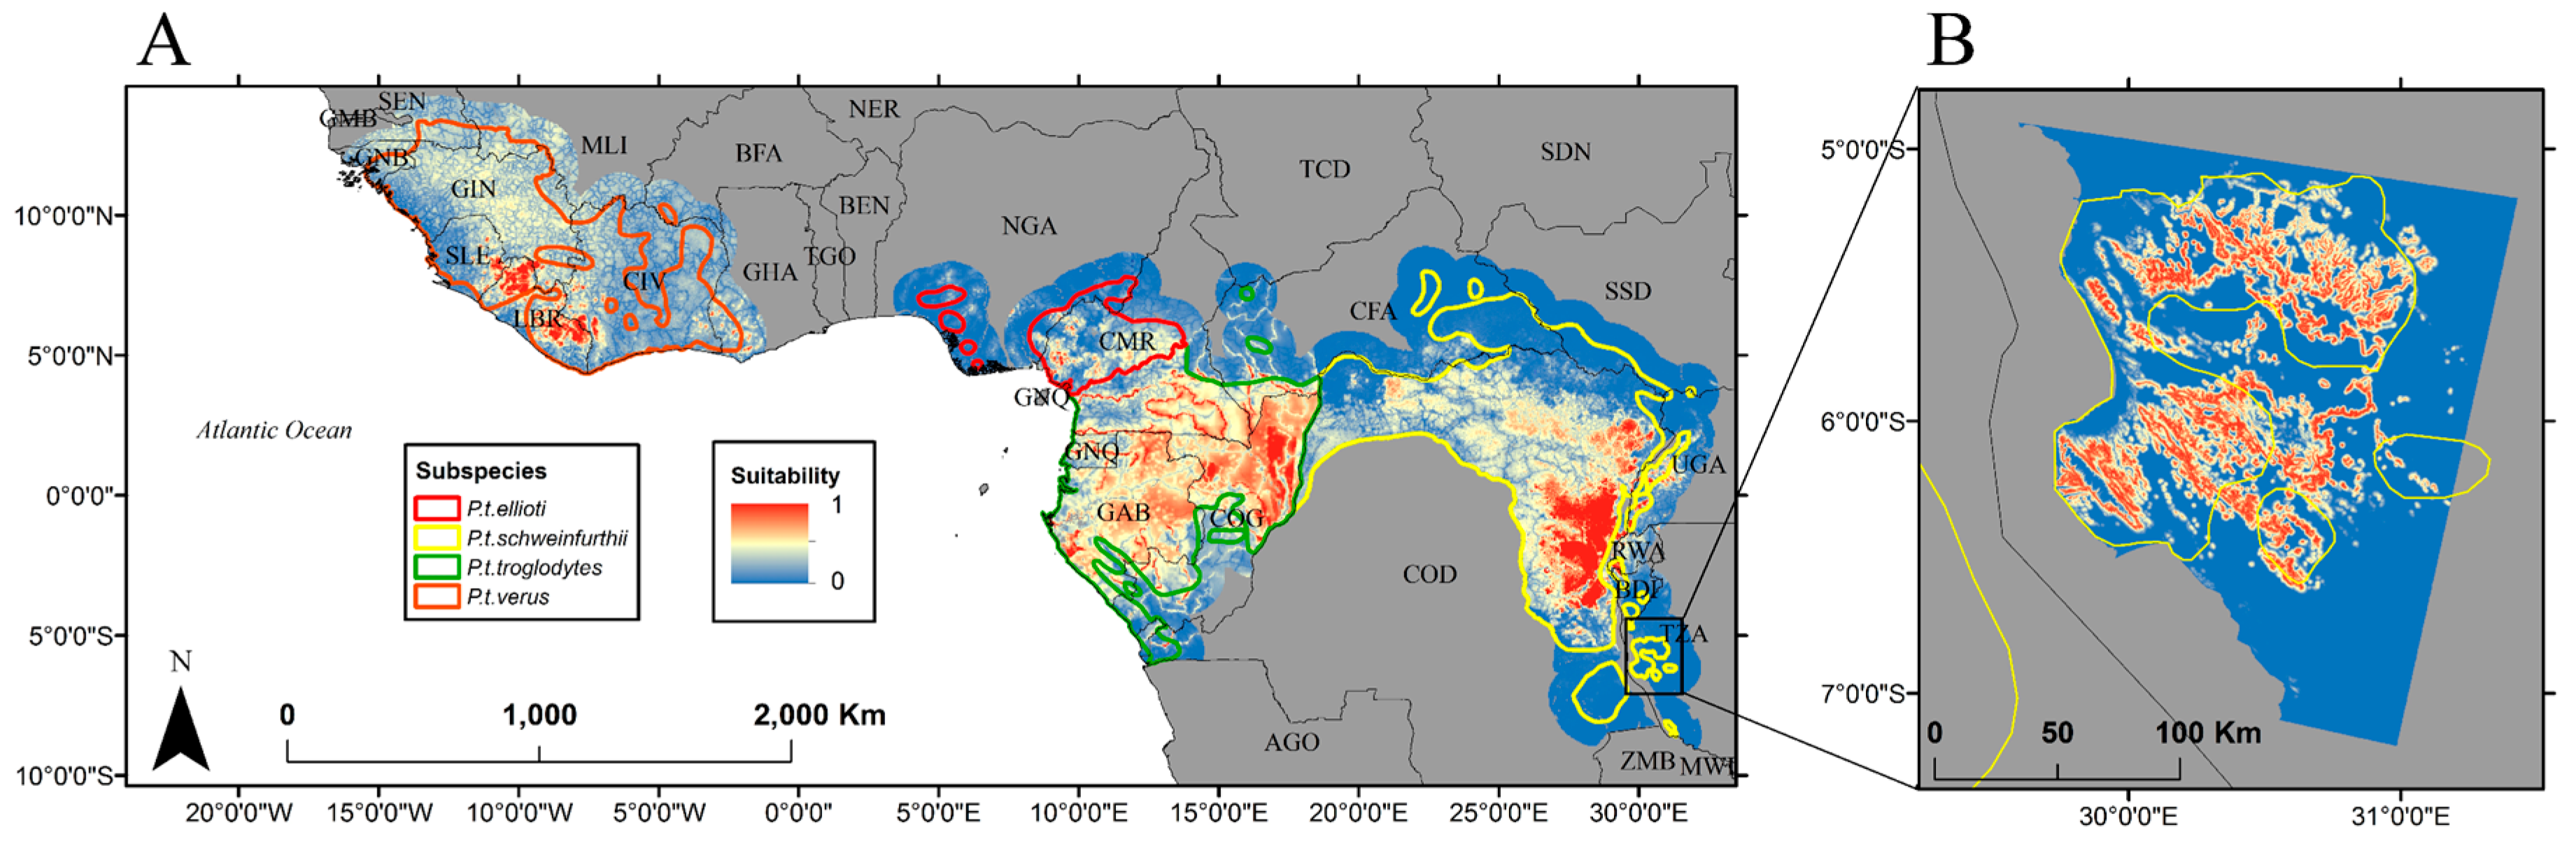
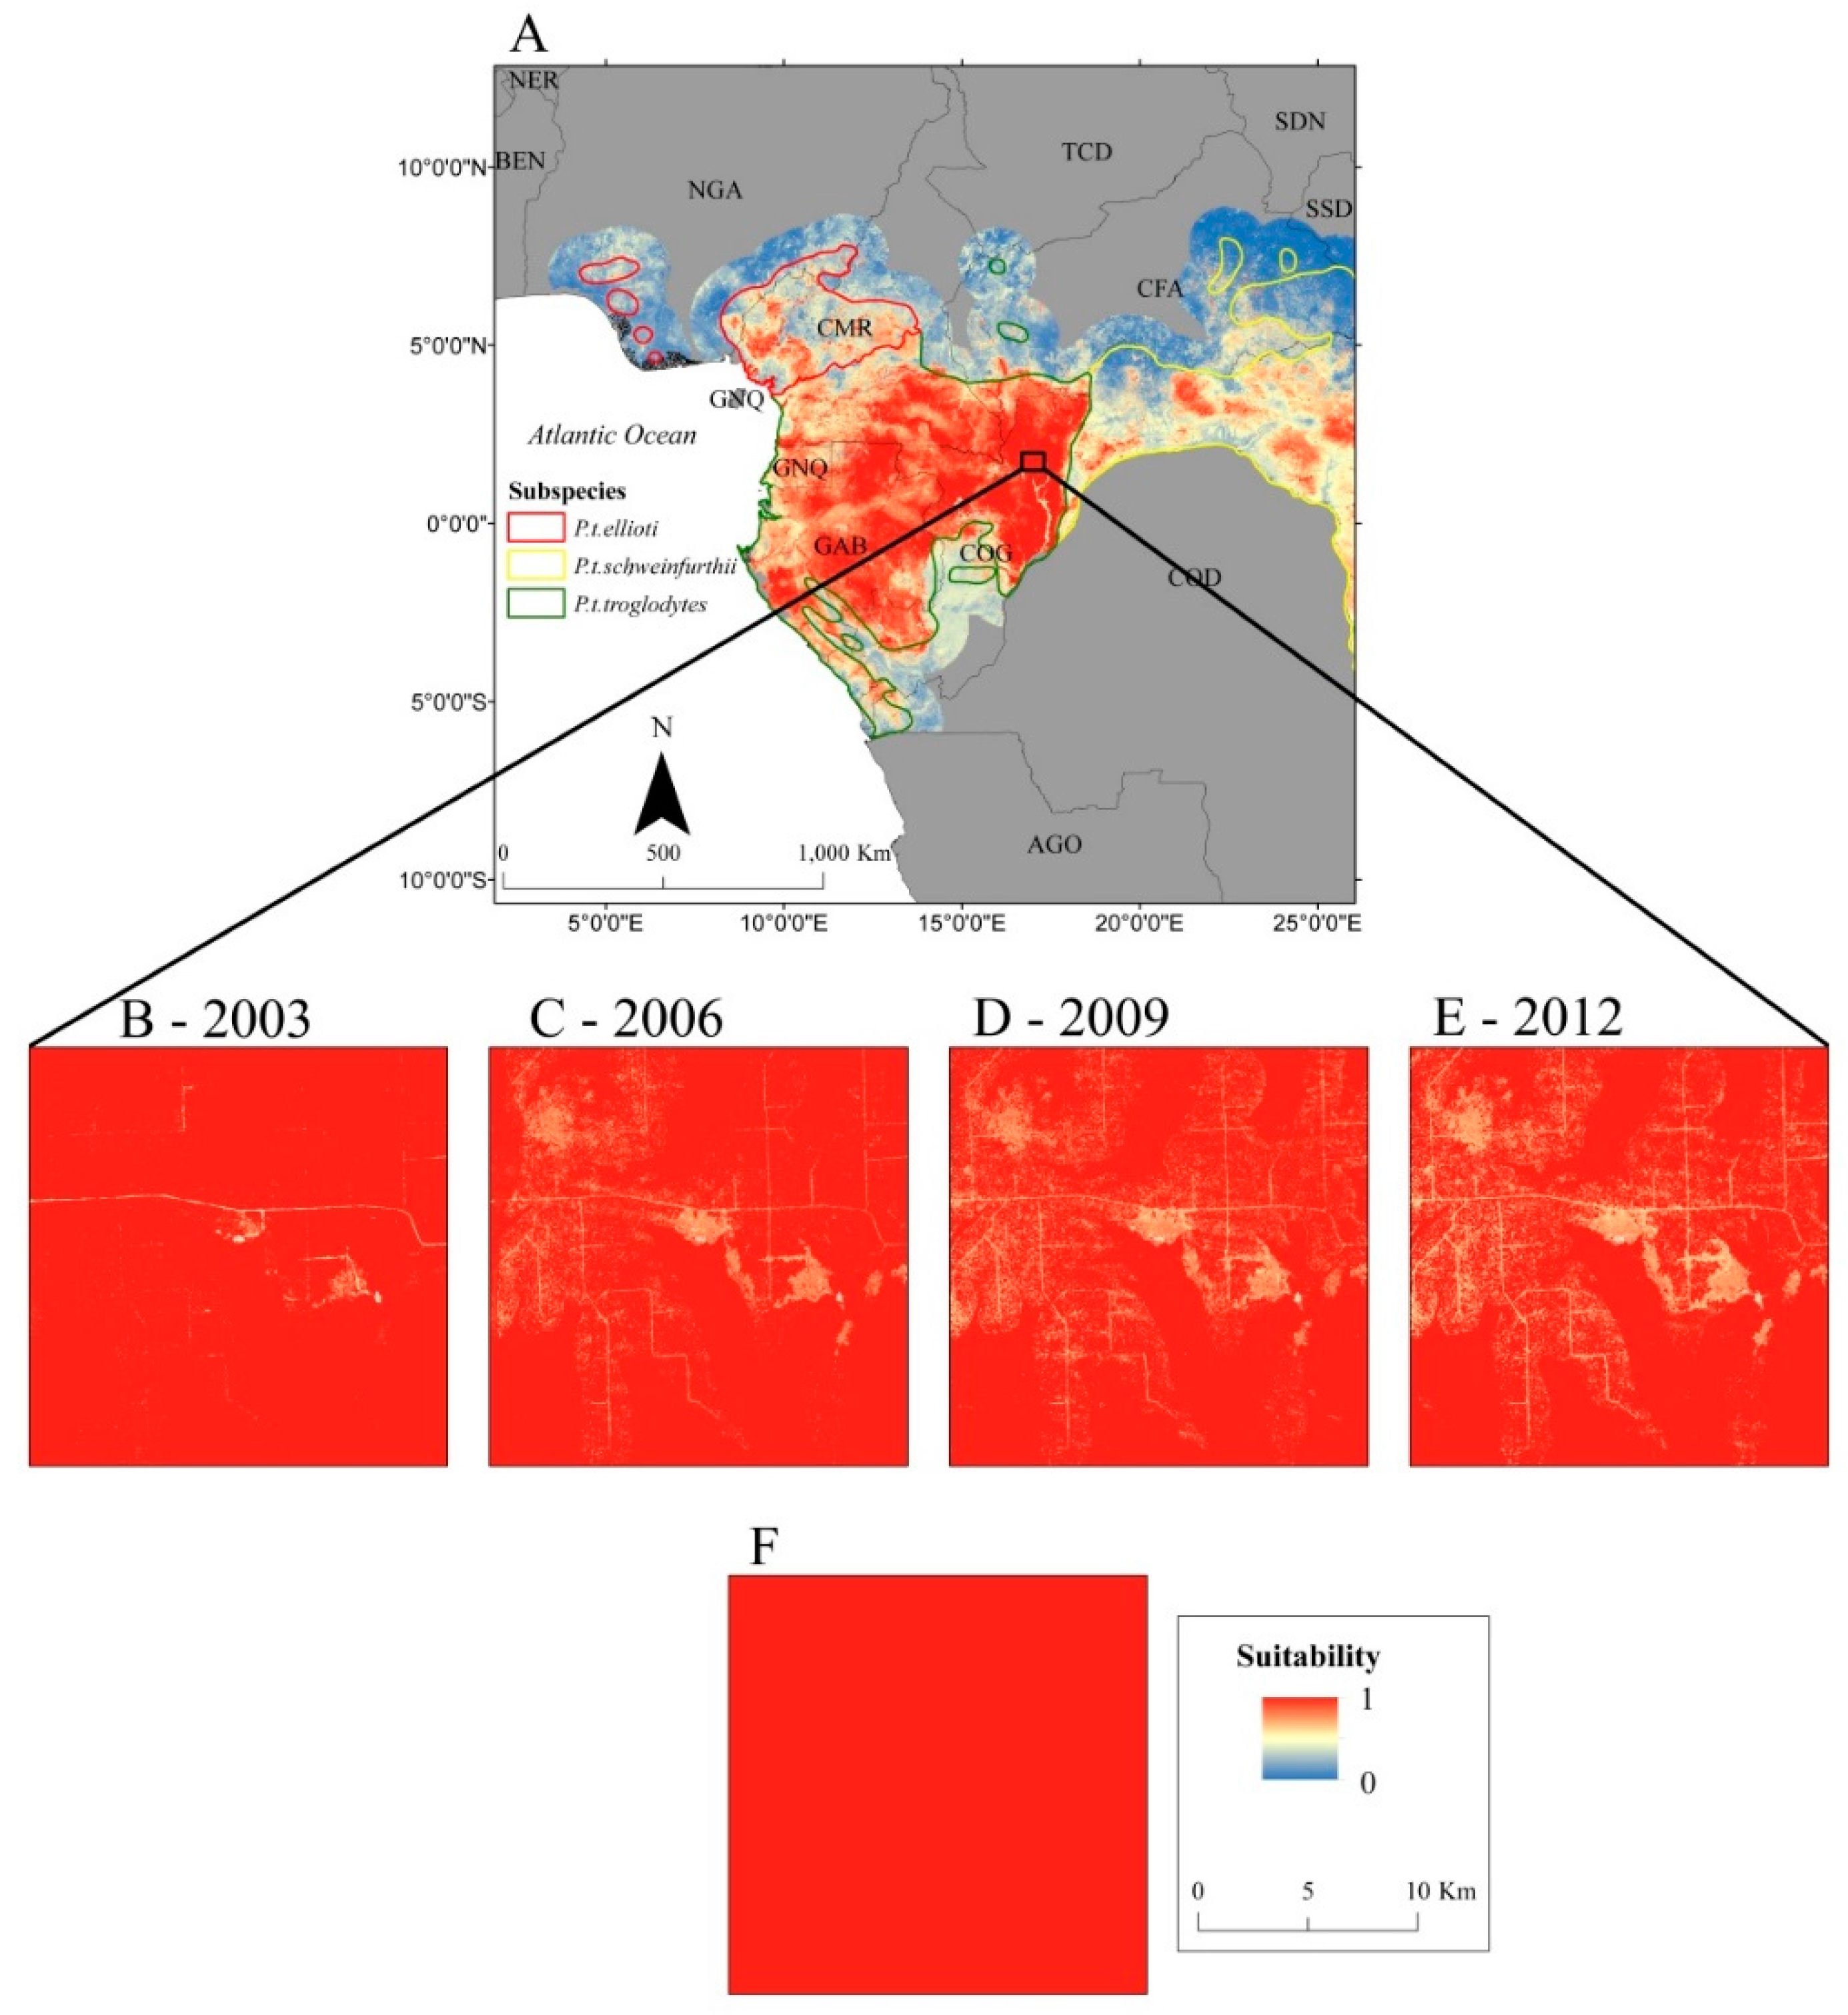
2.1. Study Area
2.2. Habitat Data
2.3. Satellite Data
Derivation of Predictor Variables and Calibration Data
2.4. Habitat Suitability Estimation
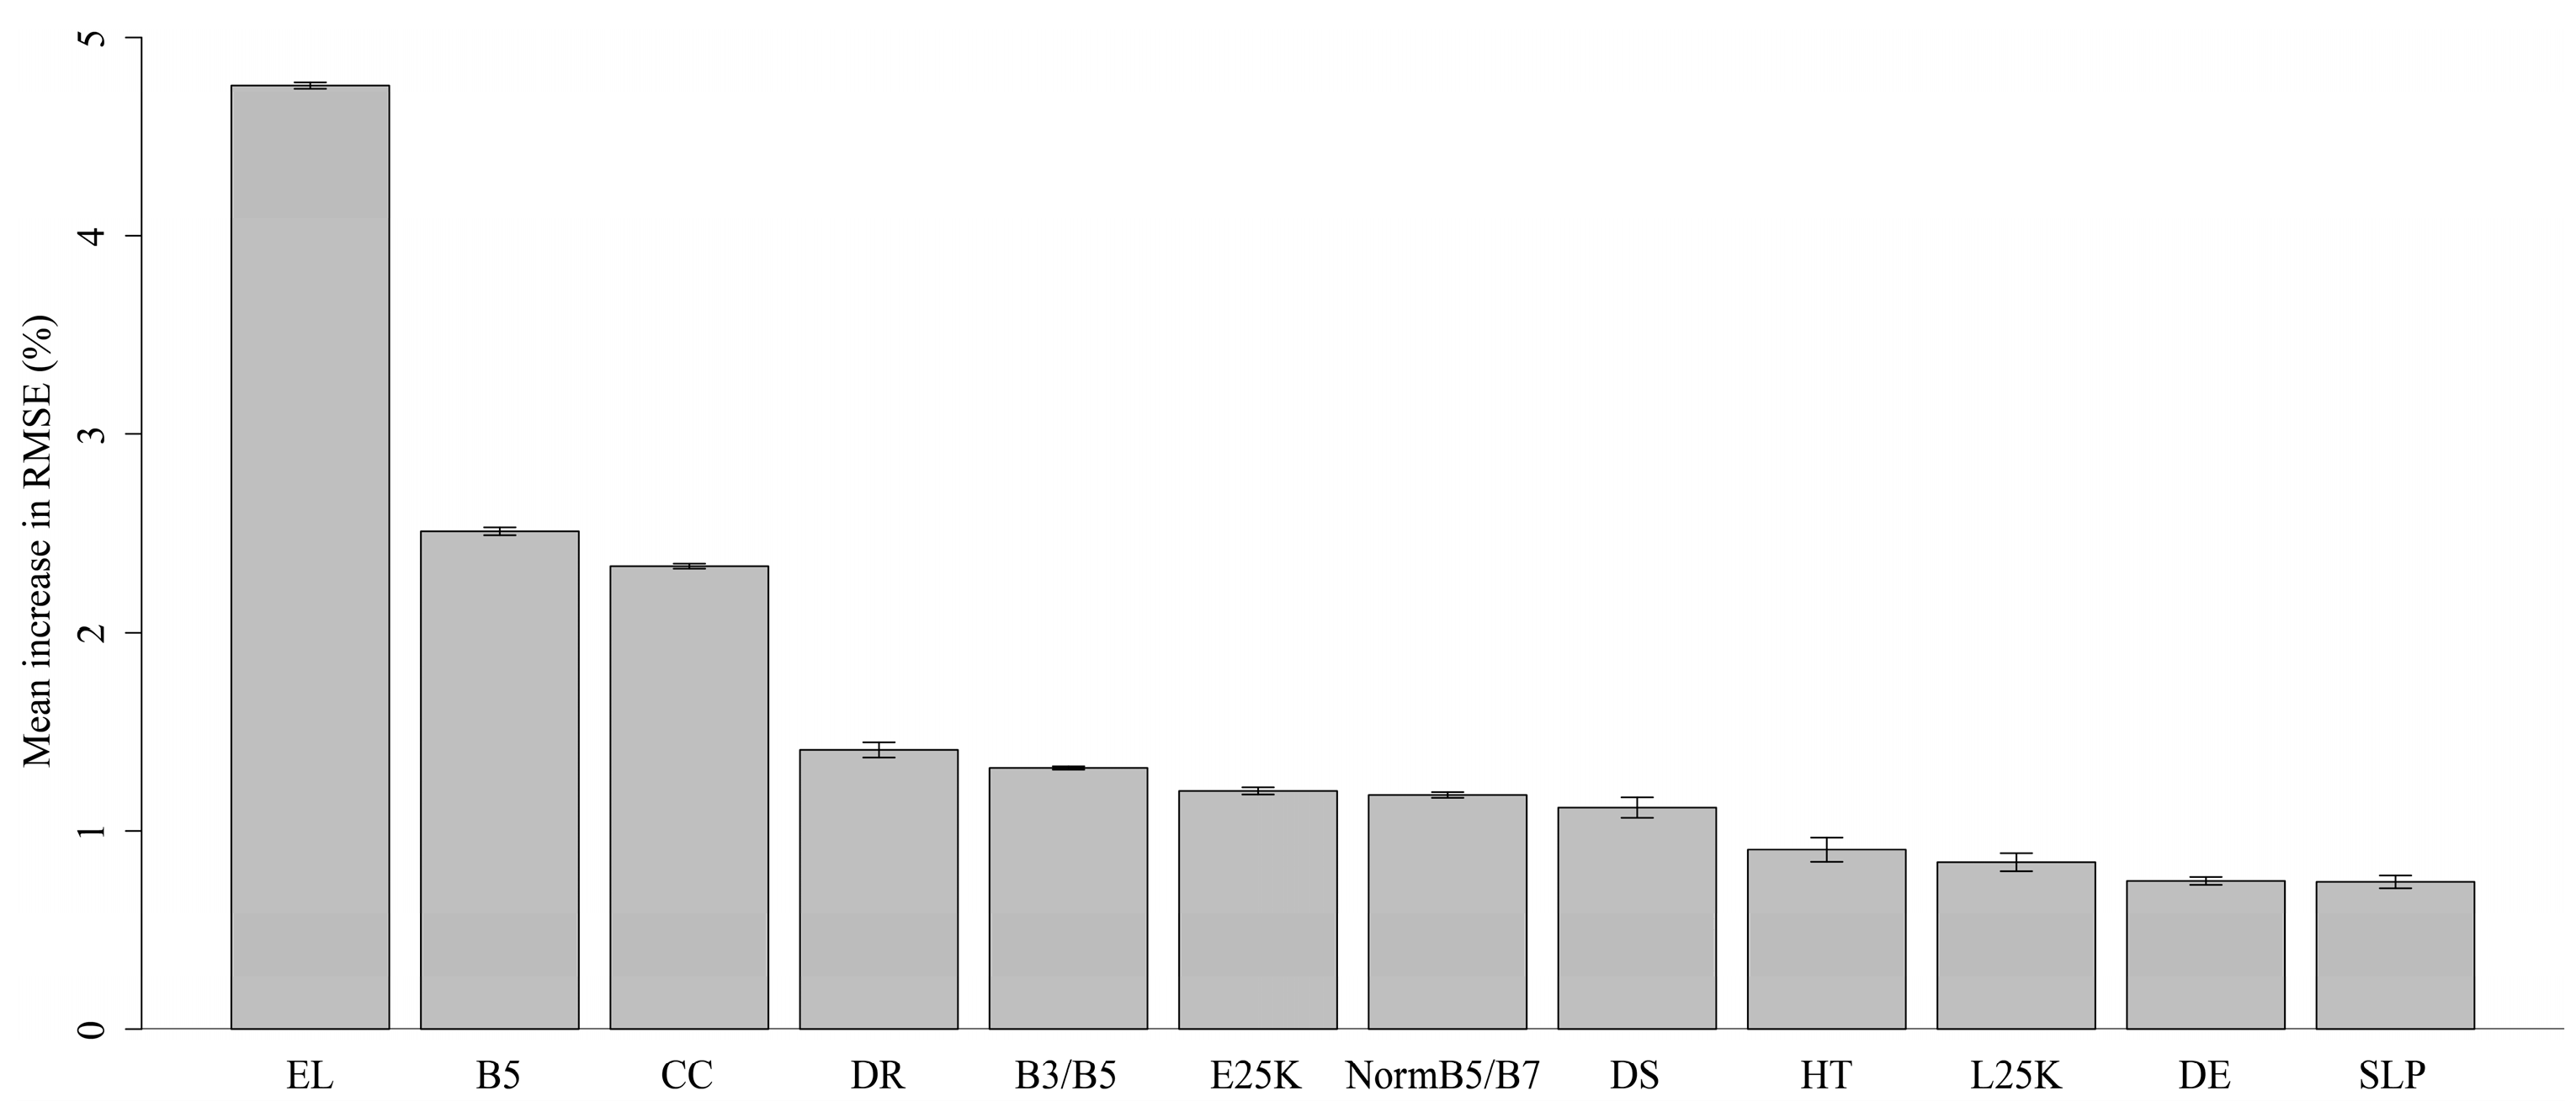
2.4.1. Selection of Predictor Variables
2.5. Habitat Suitability Prediction
3. Results
4. Discussion
5. Conclusions
Acknowledgments
Author Contributions
Conflicts of Interest
References
- Sala, O.E. Global Change and Ecosystem Complexity. In Global Change and Terrestrial Ecosystems; Walker, B., Steffen, W., Eds.; Press Syndicate of the University of Cambridge: New York, NY, USA, 1996. [Google Scholar]
- Purvis, A.; Jones, K.E.; Mace, G.M. Extinction. Bioessays 2000, 22, 1123–1133. [Google Scholar] [CrossRef]
- Baillie, J.E.M.; Hilton-taylor, C.; Stuart, S.N. 2004 IUCN Red List of Threatened Species: A Global Species Assessment; IUCN: Gland, Switzerland; Cambridge, UK, 2004. [Google Scholar]
- Pimm, S.L.; Jenkins, C.N.; Abell, R.; Brooks, T.M.; Gittleman, J.L.; Joppa, L.N.; Raven, P.H.; Roberts, C.M.; Sexton, J.O. The biodiversity of species and their rates of extinction, distribution, and protection. Science 2014, 344, 987–997. [Google Scholar] [CrossRef] [PubMed]
- Sala, O.E.; Chapin, F.S.; Armesto, J.J.; Berlow, E.; Bloomfield, J.; Dirzo, R.; Huber-Sanwald, E.; Huenneke, L.F.; Jackson, R.B.; Kinzig, A.; et al. Global biodiversity scenarios for the year 2100. Science 2000, 287, 1770–1774. [Google Scholar] [CrossRef] [PubMed]
- Wright, S.J. Tropical forests in a changing environment. Trends Ecol. Evol. 2005, 20, 553–560. [Google Scholar] [CrossRef] [PubMed]
- Nellemann, C.; Newton, A. The Great Apes: The Road Ahead: A Globio Perspective on the Impacts of Infrastructural Development on The Great Apes. 2008. Available online: http://www.globio.info/downloads/249/Great+Apes+-+The+Road+Ahead.pdf (accessed on 17 May 2016).
- Kormos, R.; Boesch, C.; Bakarr, M.I.; Butynski, T.M. West African Chimpanzees. Status Survey and Conservation Action Plan; IUCN: Gland, Switzerland; Cambridge, UK, 2003. [Google Scholar]
- Oates, J.F.; Dunn, A.; Greengrass, E.; Morgan, B.J. Pan troglodytes ssp. ellioti. The IUCN Red List of Threatened Species 2008. Available online: http://dx.doi.org/10.2305/IUCN.UK.2008.RLTS.T40014A10301774.en (accessed on 17 May 2016).
- Wilson, M.L.; Balmforth, Z.; Cox, D.; Davenport, T.; Hart, J.; Hicks, C.; Hunt, K.D.; Kamenya, S.; Mitani, J.C.; Moore, J.; et al. Pan troglodytes ssp. schweinfurthii. The IUCN Red List of Threatened Species 2008. Available online: http://dx.doi.org/10.2305/IUCN.UK.2008.RLTS.T15937A5324021.en (accessed on 17 May 2016).
- Tutin, C.E.G.; Baillie, J.E.M.; Dupain, J.; Gatti, S.; Maisels, F.; Stokes, E.J.; Morgan, D.B.; Walsh, P.D. Pan troglodytes ssp. troglodytes. The IUCN Red List of Threatened Species 2008. Available online: http://dx.doi.org/10.2305/IUCN.UK.2008.RLTS.T15936A5323646.en (accessed on 17 May 2016).
- Humle, T.; Boesch, C.; Duvall, C.; Ellis, C.M.; Farmer, K.H.; Herbinger, I.; Blom, A.; Oates, J.F. Pan troglodytes ssp. verus. The IUCN Red List of Threatened Species 2008. Available online: http://dx.doi.org/10.2305/IUCN.UK.2008.RLTS.T15935A5323101.en (accessed on 17 May 2016).
- Wrangham, R.W.; Hagel, G.; Leighton, M.; Marshall, A.J.; Waldau, P.; Nishida, T. The Great Ape World Heritage Species Project. In Conservation in the 21st Century: Gorillas as A Case Study; Stoinski, T.S., Steklis, H.D., Mehlman, P.T., Eds.; Springer Science and Business Media: New York, NY, USA, 2008; pp. 282–296. [Google Scholar]
- Open Standards for the Practice of Conservation; Version 3.0; The Conservation Measures Partnership, 2013; Available online: http://cmp-openstandards.org/wp-content/uploads/2014/03/CMP-OS-V3-0-Final.pdf (Accessed on 17 May 2016).
- Araújo, M.; Peterson, A. Uses and misuses of bioclimatic envelope modeling. Ecology 2012, 93, 1527–1539. [Google Scholar] [CrossRef] [PubMed]
- Franklin, J. Predictive vegetation mapping: Geographic modelling of biospatial patterns in relation to environmental gradients. Prog. Phys. Geogr. 1995, 19, 474–499. [Google Scholar] [CrossRef]
- Guisan, A.; Zimmerman, N.E. Predictive habitat distribution models in ecology. Ecol. Modell. 2011, 135, 147–186. [Google Scholar] [CrossRef]
- Hastie, T.; Fithian, W. Inference from presence-only data; the ongoing controversy. Ecography 2013, 36, 864–867. [Google Scholar] [CrossRef] [PubMed]
- Fitzpatrick, M.C.; Gotelli, N.J.; Ellison, A.M. MaxEnt versus MaxLike: Empirical comparisons with ant species distributions. Ecosphere 2013, 4, 1–15. [Google Scholar] [CrossRef]
- Merow, C.; Smith, M.J.; Silander, J.A. A practical guide to MaxEnt for modeling species’ distributions: What it does, and why inputs and settings matter. Ecography 2013, 36, 1058–1069. [Google Scholar] [CrossRef]
- Pintea, L.; Plumptre, A.J. Prediction of suitable habitat for chimpanzees using remote sensing and GIS. In Surveys of Chimpanzees and Other Biodiversity in Western Tanzania; Moyer, D., Plumptre, A.J., Pintea, L., Hernandez-Aguilar, A., Moore, J., Stewart, F., Davenport, T.R.B., Piel, A., Kamenya, S., Mugabe, H., et al., Eds.; Wildlife Conservation Society, the Jane Goodall Institute, US Fish and Wildlife Service; 2006; pp. 47–54. Available online: http://pages.ucsd.edu/~jmoore/courses/methprimconsweb08/MoyerEtAl2006WCSTanzania.pdf (accessed on 17 May 2016).
- Torres, J.; Brito, J.C.; Vasconcelos, M.J.; Catarino, L.; Gonçalves, J.; Honrado, J. Ensemble models of habitat suitability relate chimpanzee (Pan troglodytes) conservation to forest and landscape dynamics in Western Africa. Biol. Conserv. 2010, 143, 416–425. [Google Scholar] [CrossRef]
- Plumptre, A.; Rose, R.; Nangendo, G.; Williamson, E.; Didier, K.; Hart, J.; Mulindahabi, F.; Hicks, C.; Griffin, B.; Ogawa, H.; et al. Eastern Chimpanzee (Pan troglodytes Schweinfurthii): Status Survey and Conservation Action Plan, 2010–2020; IUCN: Gland, Switzerland, 2010. [Google Scholar]
- Clee, P.R.S.; Abwe, E.E.; Ambahe, R.D.; Anthony, N.M.; Fotso, R.; Locatelli, S.; Maisels, F.; Mitchell, M.W.; Morgan, B.J.; Pokempner, A.A.; et al. Chimpanzee population structure in Cameroon and Nigeria is associated with habitat variation that may be lost under climate change. BMC Evol. Biol. 2015, 15, 1–13. [Google Scholar]
- Junker, J.; Blake, S.; Boesch, C.; Campbell, G.; Toit, L.D.; Duvall, C.; Ekobo, A.; Etoga, G.; Galat-Luong, A.; Gamys, J.; et al. Recent decline in suitable environmental conditions for African great apes. Divers. Distrib. 2012, 18, 1077–1091. [Google Scholar] [CrossRef]
- Caldecott, J.; Miles, L. World Atlas of the Great Apes and Their Conservation; UNEP World Conservation Monitoring Centre: Cambridge, UK, 2005. [Google Scholar]
- Kortlandt, A. Marginal habitats of chimpanzees. J. Hum. Evol. 1983, 12, 231–278. [Google Scholar] [CrossRef]
- Hansen, M.C.; Potapov, P.V.; Moore, R.; Hancher, M.; Turubanova, S.A.; Tyukavina, A.; Thau, D.; Stehman, S.V.; Goetz, S.J.; Loveland, T.R.; et al. High-resolution global maps of 21st-century forest cover change. Science 2013, 342, 850–853. [Google Scholar] [CrossRef] [PubMed]
- Phillips, S.J.; Anderson, R.P.; Schapire, R.E. Maximum entropy modeling of species geographic distributions. Ecol. Modell. 2006, 190, 231–259. [Google Scholar] [CrossRef]
- Moyer, D.; Plumptre, A.J.; Pintea, L.; Hernandez-Aguilar, A.; Moore, J.; Stewart, F.A.; Davenport, T.R.B.; Piel, A.K.; Kamenya, S.; Mugabe, H.; et al. Surveys of Chimpanzees and other Biodiversity in Western Tanzania. 2006. Available online: http://pages.ucsd.edu/~jmoore/courses/methprimconsweb08/MoyerEtAl2006WCSTanzania.pdf (accessed on 17 May 2016).
- Farber, O.; Kadmon, R. Assessment of alternative approaches for bioclimatic modeling with special emphasis on the Mahalanobis distance. Ecol. Modell. 2003, 160, 115–130. [Google Scholar] [CrossRef]
- Clark, J.D.; Dunn, J.E.; Smith, K.G.A. Multivariate Model of Female Black Bear Habitat Use for a Geographic Information System. J. Wildl. Manag. 1993, 57, 519–526. [Google Scholar] [CrossRef]
- Tyukavina, A.; Baccini, A.; Hansen, M.C.; Potapov, P.V.; Stehman, S.V.; Houghton, R.A.; Krylov, A.M.; Turubanova, S.; Goetz, S.J. Aboveground carbon loss in natural and managed tropical forests from 2000 to 2012. Environ. Res. Lett. 2015, 10, 074002. [Google Scholar] [CrossRef]
- Hansen, M.C.; Potapov, P.; Goetz, S.J.; Turubanova, S.; Tyukavina, A.; Krylov, A.; Kommareddy, A.; Egorov, A. Mapping tree height distributions in Sub-Saharan Africa using Landsat 7 and 8 data. Remote Sens. Environ. 2016, 2–13. [Google Scholar] [CrossRef]
- United States Geological Survey. Documentation for the Shuttle Radar Topography Mission (SRTM) Water Body Data Files. 2003. Available online: https://dds.cr.usgs.gov/srtm/version2_1/SWBD/SWBD_Documentation/Readme_SRTM_Water_Body_Data.pdf (accessed on 17 May 2016). [Google Scholar]
- Helmer, E.H.; Ruzycki, T.S.; Wunderle, J.M.; Vogesser, S.; Ruefenacht, B.; Kwit, C.; Brandeis, T.J.; Ewert, D.N. Mapping tropical dry forest height, foliage height profiles and disturbance type and age with a time series of cloud-cleared Landsat and ALI image mosaics to characterize avian habitat. Remote Sens. Environ. 2010, 114, 2457–2473. [Google Scholar] [CrossRef]
- Wilkes, P.; Jones, S.D.; Suarez, L.; Mellor, A.; Woodgate, W.; Soto-Berelov, M.; Haywood, A.; Skidmore, A.K. Mapping forest canopy height across large areas by upscaling als estimates with freely available satellite data. Remote Sens. 2015, 7, 2–25. [Google Scholar] [CrossRef]
- Baccini, A.; Goetz, S.J.; Walker, W.S.; Laporte, N.T.; Sun, M.; Sulla-Menashe, D.; Hackler, J.; Beck, P.S.A.; Dubayah, R.; Friedl, M.A.; et al. Estimated carbon dioxide emissions from tropical deforestation improved by carbon-density maps. Nat. Clim. Chang. 2012, 2, 182–185. [Google Scholar] [CrossRef]
- Food and Agriculture Organization of the United Nations. Global Forest Resources Assessment 2005, Main Report. Progress Towards Sustainable Forest Management; FAO: Rome, Italy, 2006. [Google Scholar]
- Singh, A.; Shi, H.; Zhu, Z.; Foresman, T. An Assessment of the Status of the World’s Remaining Closed Forests; UNEP: Nairobi, Kenya, 2001. [Google Scholar]
- Vitousek, P.M. Beyond Global Warming: Ecology and Global Change. Ecology 1994, 75, 1861–1876. [Google Scholar] [CrossRef]
- Goodall, J. The Chimpanzees of Gombe: Patterns of Behavior; The Belknap Press of Harvard University Press: Cambridge, MA, USA, 1986. [Google Scholar]
- Nowak, R. Walkers Mammals of the World, 6th ed.; Johns Hopkins University Press: Baltimore, MD, USA; London, UK, 1999. [Google Scholar]
- Jones, C.; Jones, C.; Jones, J.; Wilson, D. Pan Troglodytes. Mamm. Species 1996, 529, 1–9. [Google Scholar] [CrossRef]
- Pedregosa, F.; Varoquaux, G. Scikit-learn: Machine Learning in Python. J. Mach. Learn. Res. 2011, 12, 2825–2830. [Google Scholar]
- Breiman, L.; Friedman, J.; Stone, C.J.; Olsen, R.A. Classification and Regression Trees; Chapman and Hall/CRC: Washington, WA, USA, 1984. [Google Scholar]
- Breiman, L. Random forests. Mach. Learn. 2001, 45, 5–32. [Google Scholar] [CrossRef]
- Strobl, C.; Boulesteix, A.-L.; Zeileis, A.; Hothorn, T. Bias in random forest variable importance measures: Illustrations, sources and a solution. BMC Bioinform. 2007, 8, 25. [Google Scholar] [CrossRef] [PubMed]
- Granitto, P.M.; Furlanello, C.; Biasioli, F.; Gasperi, F. Recursive feature elimination with random forest for PTR-MS analysis of agroindustrial products. Chemom. Intell. Lab. Syst. 2006, 83, 83–90. [Google Scholar] [CrossRef]
- Hijmans, R.J.; Cameron, S.E.; Parra, J.L.; Jones, P.G.; Jarvis, A. Very high resolution interpolated climate surfaces for global land areas. Int. J. Climatol. 2005, 25, 1965–1978. [Google Scholar] [CrossRef]
- Hansen, M.C.; Roy, D.P.; Lindquist, E.; Adusei, B.; Justice, C.O.; Altstatt, A. A method for integrating MODIS and Landsat data for systematic monitoring of forest cover and change in the Congo Basin. Remote Sens. Environ. 2008, 112, 2495–2513. [Google Scholar] [CrossRef]
- Walsh, P.; Abernethy, K.; Bermejo, M. Catastrophic ape decline in western equatorial Africa. Nature 2003, 422, 611–614. [Google Scholar] [CrossRef] [PubMed]
- Laporte, N.T.; Stabach, J.A.; Grosch, R.; Lin, T.S.; Goetz, S.J. Expansion of industrial logging in Central Africa. Science 2007, 316, 1451. [Google Scholar] [CrossRef] [PubMed]
- Sexton, J.O.; Song, X.-P.; Feng, M.; Noojipady, P.; Anand, A.; Huang, C.; Kim, D.-H.; Collins, K.M.; Channan, S.; Dimiceli, C.; et al. Global, 30-m resolution continuous fields of tree cover: Landsat-based rescaling of MODIS Vegetation Continuous Fields with lidar-based estimates of error. Int. J. Digit. Earth 2013. [Google Scholar] [CrossRef]
- Ozdemir, I. Linear transformation to minimize the effects of variability in understory to estimate percent tree canopy cover using RapidEye data. GISci. Remote Sens. 2014, 1603, 37–41. [Google Scholar] [CrossRef]
- Stevens, S.S. On the Theory of Scales of Measurement. Science 1946, 103, 677–680. [Google Scholar] [CrossRef] [PubMed]
- Gao, F.; Masek, J.; Schwaller, M.; Hall, F. On the Blending of the MODIS and Landsat ETM+ Surface Reflectance. IEEE Trans. Geosci. Remote Sens. 2006, 44, 2207–2218. [Google Scholar]
- Guisan, A.; Graham, C.H.; Elith, J.; Huettmann, F.; Dudik, M.; Ferrier, S.; Hijmans, R.; Lehmann, A.; Li, J.; Lohmann, L.G.; et al. Sensitivity of predictive species distribution models to change in grain size. Divers. Distrib. 2007, 13, 332–340. [Google Scholar] [CrossRef]


| Variable | Units | Source | Abbreviation |
|---|---|---|---|
| Landsat ETM+ band 3 (0.63–0.69 µM) | % reflectance | Hansen et al. 2013 [28] | B3 |
| Landsat ETM+ band 4 (0.77–0.90 µM) | % reflectance | Hansen et al. 2013 [28] | B4 |
| Landsat ETM+ band 5 (1.55–1.75 µM) | % reflectance | Hansen et al. 2013 [28] | B5 * |
| Landsat ETM+ band 7 (2.09–2.35 µM) | % reflectance | Hansen et al. 2013 [28] | B7 |
| Normalized difference band4/band3 | Unitless | Hansen et al. 2013 [28] | NormB4/B3 |
| Normalized difference band4/band5 | Unitless | Hansen et al. 2013 [28] | NormB4/B5 |
| Normalized difference band4/band7 | Unitless | Hansen et al. 2013 [28] | NormB4/B7 * |
| band3/band5 | Unitless | Hansen et al. 2013 [28] | B3/B5 * |
| band3/band7 | Unitless | Hansen et al. 2013 [28] | B3/B7 |
| band5/band7 | Unitless | Hansen et al. 2013 [28] | B5/B7 |
| Canopy cover | Percent | Hansen et al. 2013 [28] | CC * |
| Canopy height | M | Hansen et al. 2013 [28] | HT * |
| Distance to forest | M | Hansen et al. 2013 [28] | DF |
| Distance to forest loss | M | Hansen et al. 2013 [28] | DL |
| Forest loss in 1 km buffer | Proportion | Hansen et al. 2013 [28] | L1K |
| Forest loss in 25 km buffer | Proportion | Hansen et al. 2013 [28] | L25K * |
| Distance to forest edge | M | Hansen et al. 2013 [28] | DE * |
| Forest edge in 1 km buffer | Proportion | Hansen et al. 2013 [28] | E1K |
| Forest edge in 25 km buffer | Proportion | Hansen et al. 2013 [28] | E25K * |
| Distance to rivers | M | SWBD [35] | DR * |
| Distance to steep slopes | M | SRTM [35] | DS * |
| Elevation | M | SRTM [35] | EL * |
| Slope | Degrees | SRTM [35] | SLP * |
| Range | Mean r2 | Standard Error |
|---|---|---|
| Range-wide | 0.82 | 0.001 |
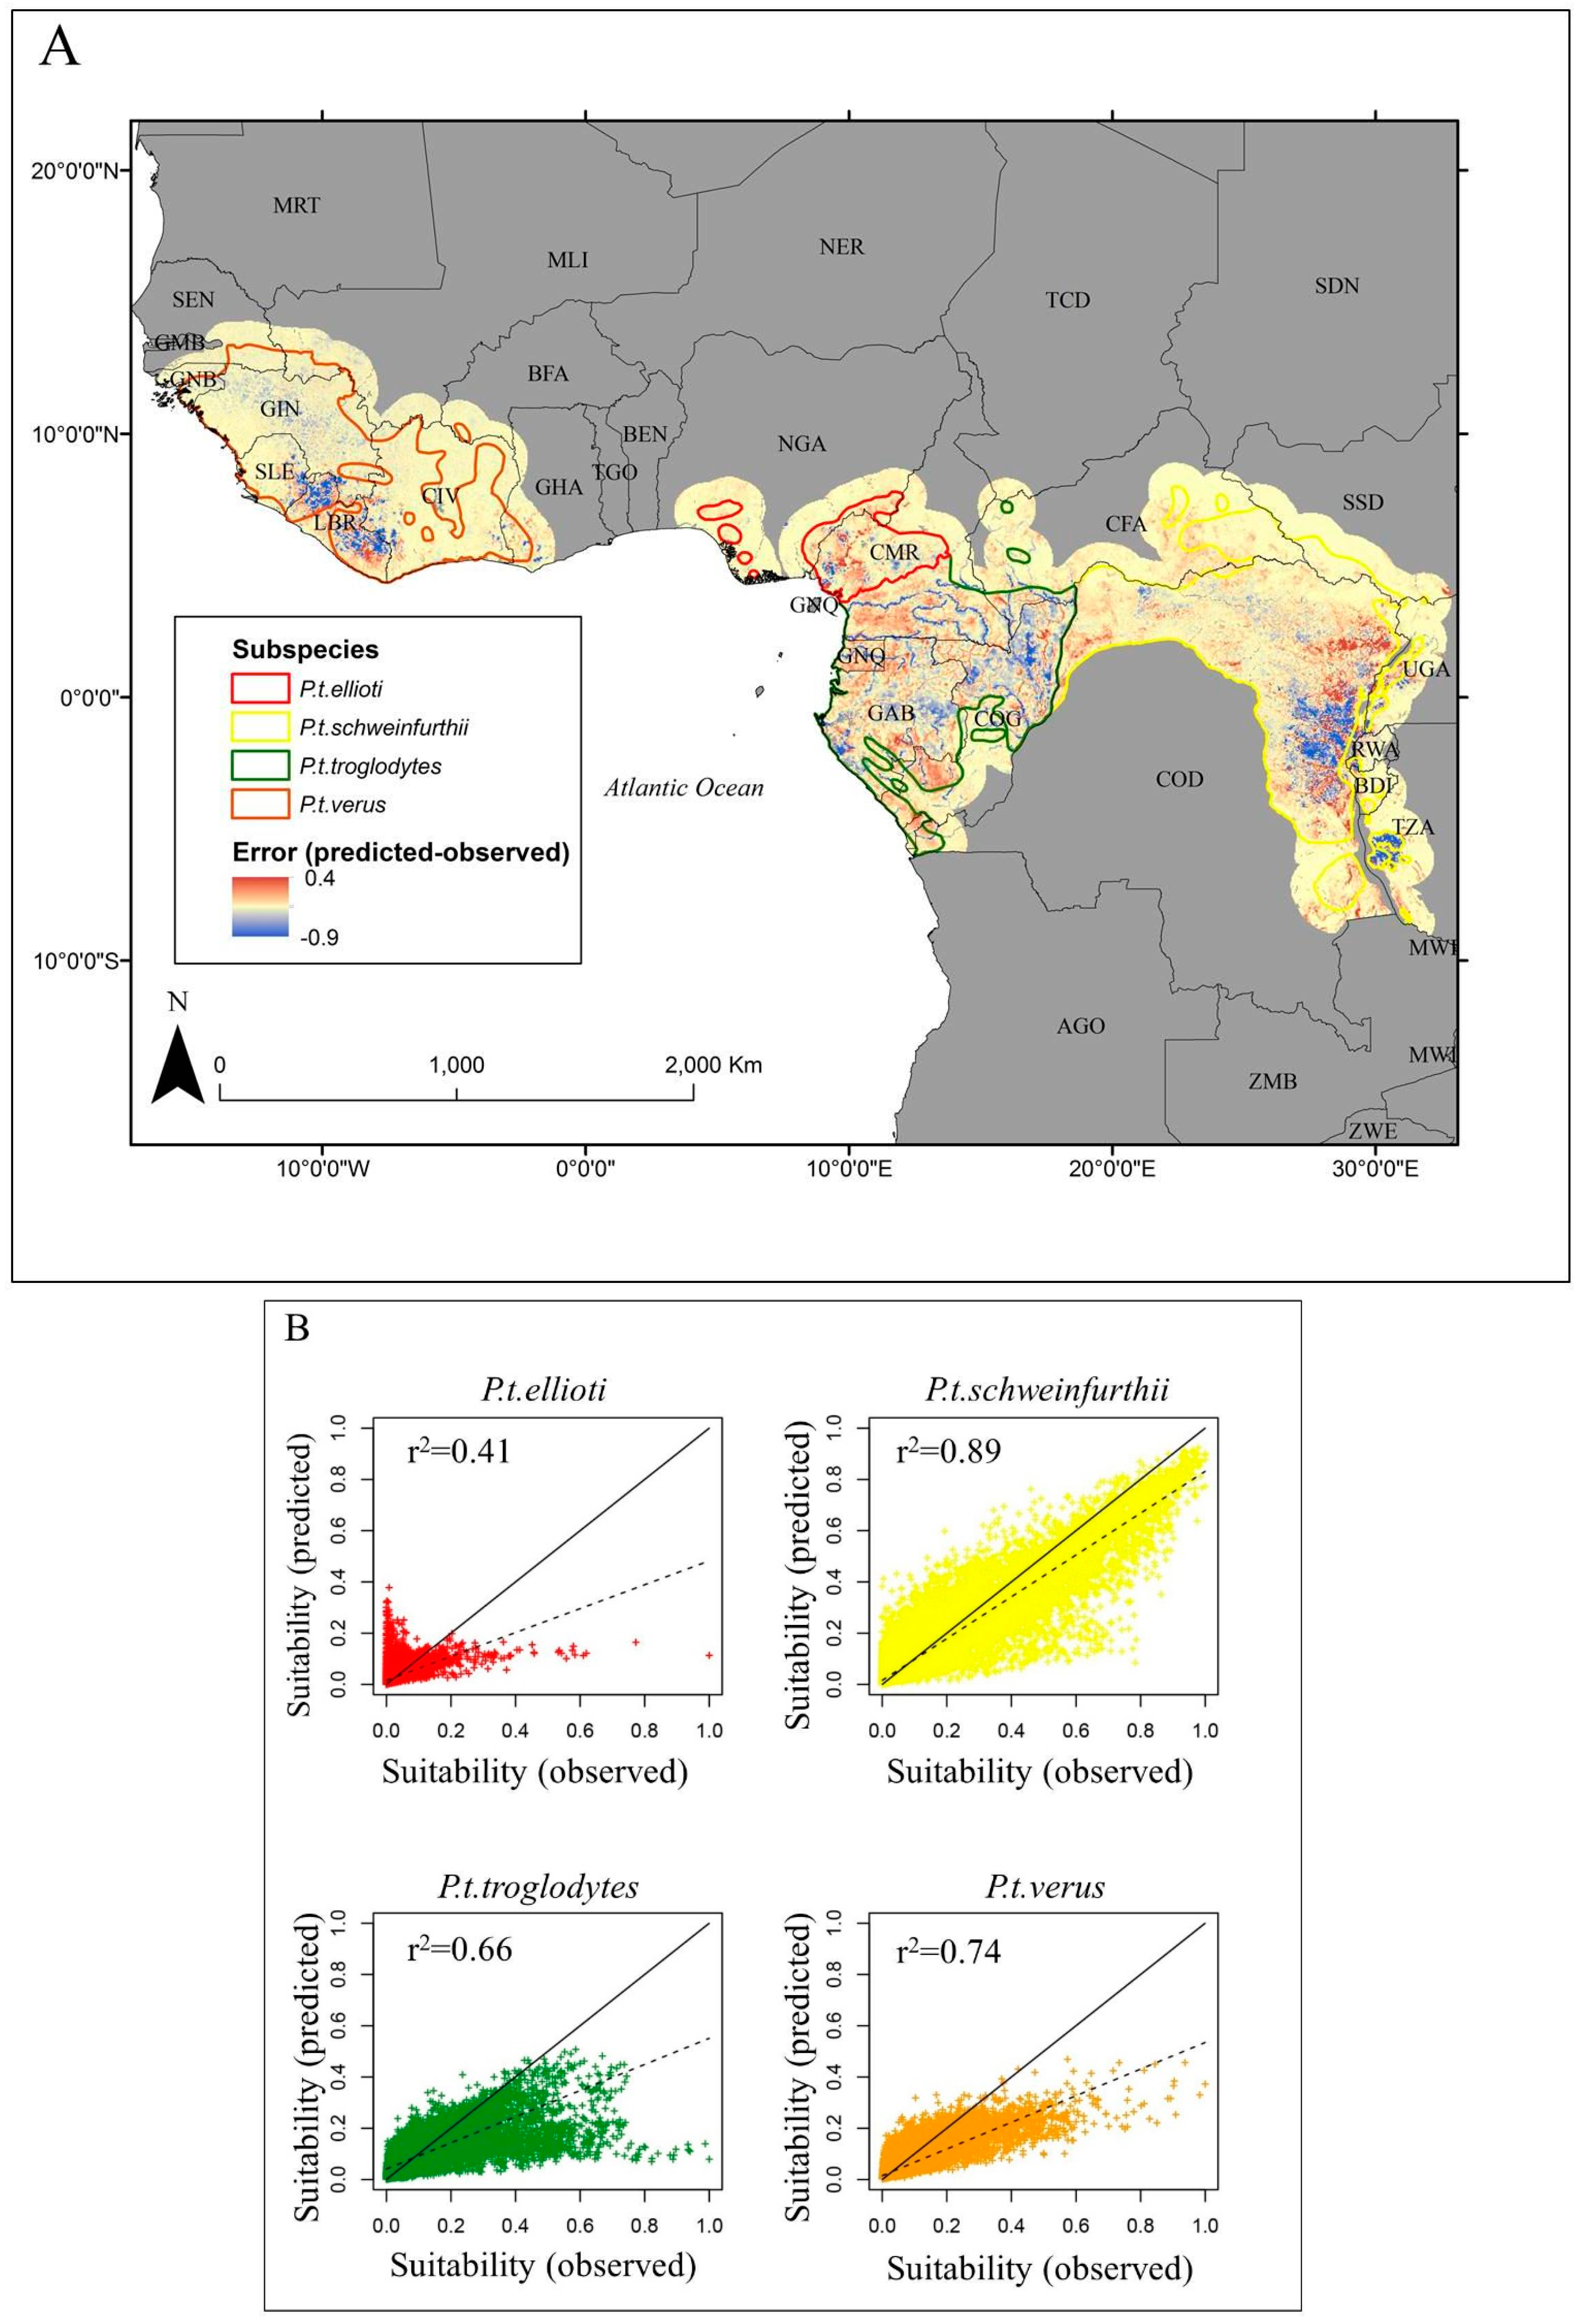
| P.t. ellioti | 0.35 | 0.01 |
| P.t. schweinfurthii | 0.89 | 0.001 |
| P.t. troglodytes | 0.66 | 0.002 |
| P.t. verus | 0.73 | 0.002 |
© 2016 by the authors; licensee MDPI, Basel, Switzerland. This article is an open access article distributed under the terms and conditions of the Creative Commons Attribution (CC-BY) license (http://creativecommons.org/licenses/by/4.0/).
Share and Cite
Jantz, S.M.; Pintea, L.; Nackoney, J.; Hansen, M.C. Landsat ETM+ and SRTM Data Provide Near Real-Time Monitoring of Chimpanzee (Pan troglodytes) Habitats in Africa. Remote Sens. 2016, 8, 427. https://doi.org/10.3390/rs8050427
Jantz SM, Pintea L, Nackoney J, Hansen MC. Landsat ETM+ and SRTM Data Provide Near Real-Time Monitoring of Chimpanzee (Pan troglodytes) Habitats in Africa. Remote Sensing. 2016; 8(5):427. https://doi.org/10.3390/rs8050427
Chicago/Turabian StyleJantz, Samuel M., Lilian Pintea, Janet Nackoney, and Matthew C. Hansen. 2016. "Landsat ETM+ and SRTM Data Provide Near Real-Time Monitoring of Chimpanzee (Pan troglodytes) Habitats in Africa" Remote Sensing 8, no. 5: 427. https://doi.org/10.3390/rs8050427
APA StyleJantz, S. M., Pintea, L., Nackoney, J., & Hansen, M. C. (2016). Landsat ETM+ and SRTM Data Provide Near Real-Time Monitoring of Chimpanzee (Pan troglodytes) Habitats in Africa. Remote Sensing, 8(5), 427. https://doi.org/10.3390/rs8050427