
Satellite Climate Data Records: Development, Applications, and Societal Benefits


Abstract
:
1. Introduction
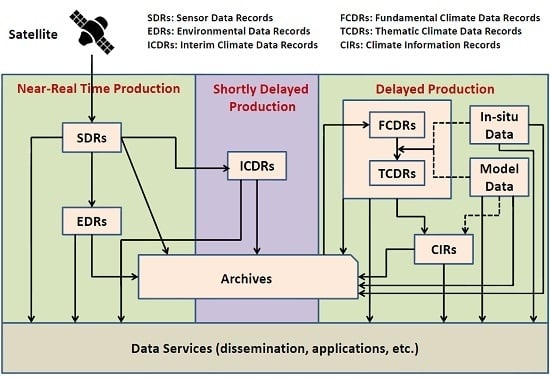
2. CDRs and Development
2.1. Calibration and FCDR
2.2. Retrieval and TCDR
2.3. Value-Added ICDR and CIR
2.4. International Coordination
3. CDR Products and Applications
3.1. CDRs and Scientific Applications
3.1.1. NOAA Climate Data Record Program
- -
- MSU/AMSU brightness temperatures: These are inter-calibrated brightness temperatures from microwave temperature sounding instruments: Microwave Sounding Unit (MSU)/Advanced Microwave Sounding Unit (AMSU), on-board NOAA and METOP (Meteorological Operational Satellite) operational polar orbiting satellites [38,39]. These FCDRs are fundamental to climate monitoring because tropospheric and stratospheric temperature changes can be estimated from these datasets [40].
- -
- AVHRR Reflectance—PATMOS-x: The PATMOS-x product [32] provides a reflectance CDR for the visible channels of AVHRR on the Polar Operational Satellites (POES) and METOP platforms. Due to its length, the AVHRR data record offers a unique resource for multi-decadal climate studies. PATMOS-x improved the quality of the dataset through work with re-calibrating and re-navigating the data. The resulting TCDRs, such as various cloud properties, provide confidence to climate variability studies over the last 30 years [41].
- -
- Geostationary Brightness Temperature—GridSat B1: The Gridded Satellite (GridSat-B1) data [19] facilitates geostationary data usage for a wide range of users. The complete dataset provides data from 3 channels: the CDR-quality infrared window channel (near 11 μm), the visible channel (near 0.6 μm) and the infrared water vapor channel (near 6.7 μm). The three-hourly International Satellite Cloud Climatology Project (ISCCP) B1 data are regridded to a 0.07 degree latitude equal-angle grid, resulting in a CDR that spans from 1980-present. The CDR merges satellites by selecting the nadir-most observations for each grid point. There are wide ranges of applications for this dataset. For example, Bain et al. [42] used this data set to derive ITCZ climatology in the East Pacific.
- -
- HIRS Channel 12 Brightness Temperature: The high-resolution infrared radiation sounder (HIRS) channel 12 (~6.52 μm) measures upper tropospheric humidity. HIRS level-1b data in conjunction with cloud-clearing, limb-correction, and inter-satellite calibration [43] provide necessary inputs to produce the Brightness Temperature FCDR. This dataset is extensively used in climate studies due to the high importance of upper tropospheric humidity in our climate system [44]. It is worth noting that there is a European Union (EU) project named fidelity and uncertainty in climate data records from earth observations (FIDUCEO [45]) which has embarked on creating an FCDR covering all channels of HIRS instrument.
- -
- SSMI(S) Brightness Temperatures: The FCDR of Special Sensor Microwave Imager/Sounder (SSMI(S)) brightness temperature (Tb) dataset comprises window-channel Tb from a series of 10 microwave radiometers flown on board the Defense Meteorological Satellite Program (DMSP) series of satellites [46,47,48]. Six SSM/I instruments first flown on DMSP F08 in July 1987 provide the inter-calibrated data along with the data from four currently operational SSMIS instruments. This FCDR dataset provides input into a number of TCDR products including precipitation, sea surface wind speed, sea ice extent, snow cover, cloud liquid water, and total precipitable water content. Numerous publications have used this dataset to look at climate applications [49].
- -
- PERSIANN Precipitation CDR: The CDR of Precipitation Estimation from Remotely Sensed Information [22] using Artificial Neural Networks (PERSIANN) is produced primarily by using infrared brightness temperature data from GridSat-B1 FCDR as input to the trained PERSIANN algorithm. Rainfall estimates are bias-corrected using monthly Global Precipitation Climatology Project (GPCP) data. PERSIANN CDR is a daily product at 1/4° spatial resolution. It spans 1983 to current (updated quarterly) with a nearly global coverage: from 60°S to 60°N latitude and 0° to 360° longitude. This global precipitation dataset is intended to support climatologists, hydrologists, hydrometeorologists, and hydroclimatologists in various forms of climate research and application, including extreme event (flood and drought) analysis [50].
- -
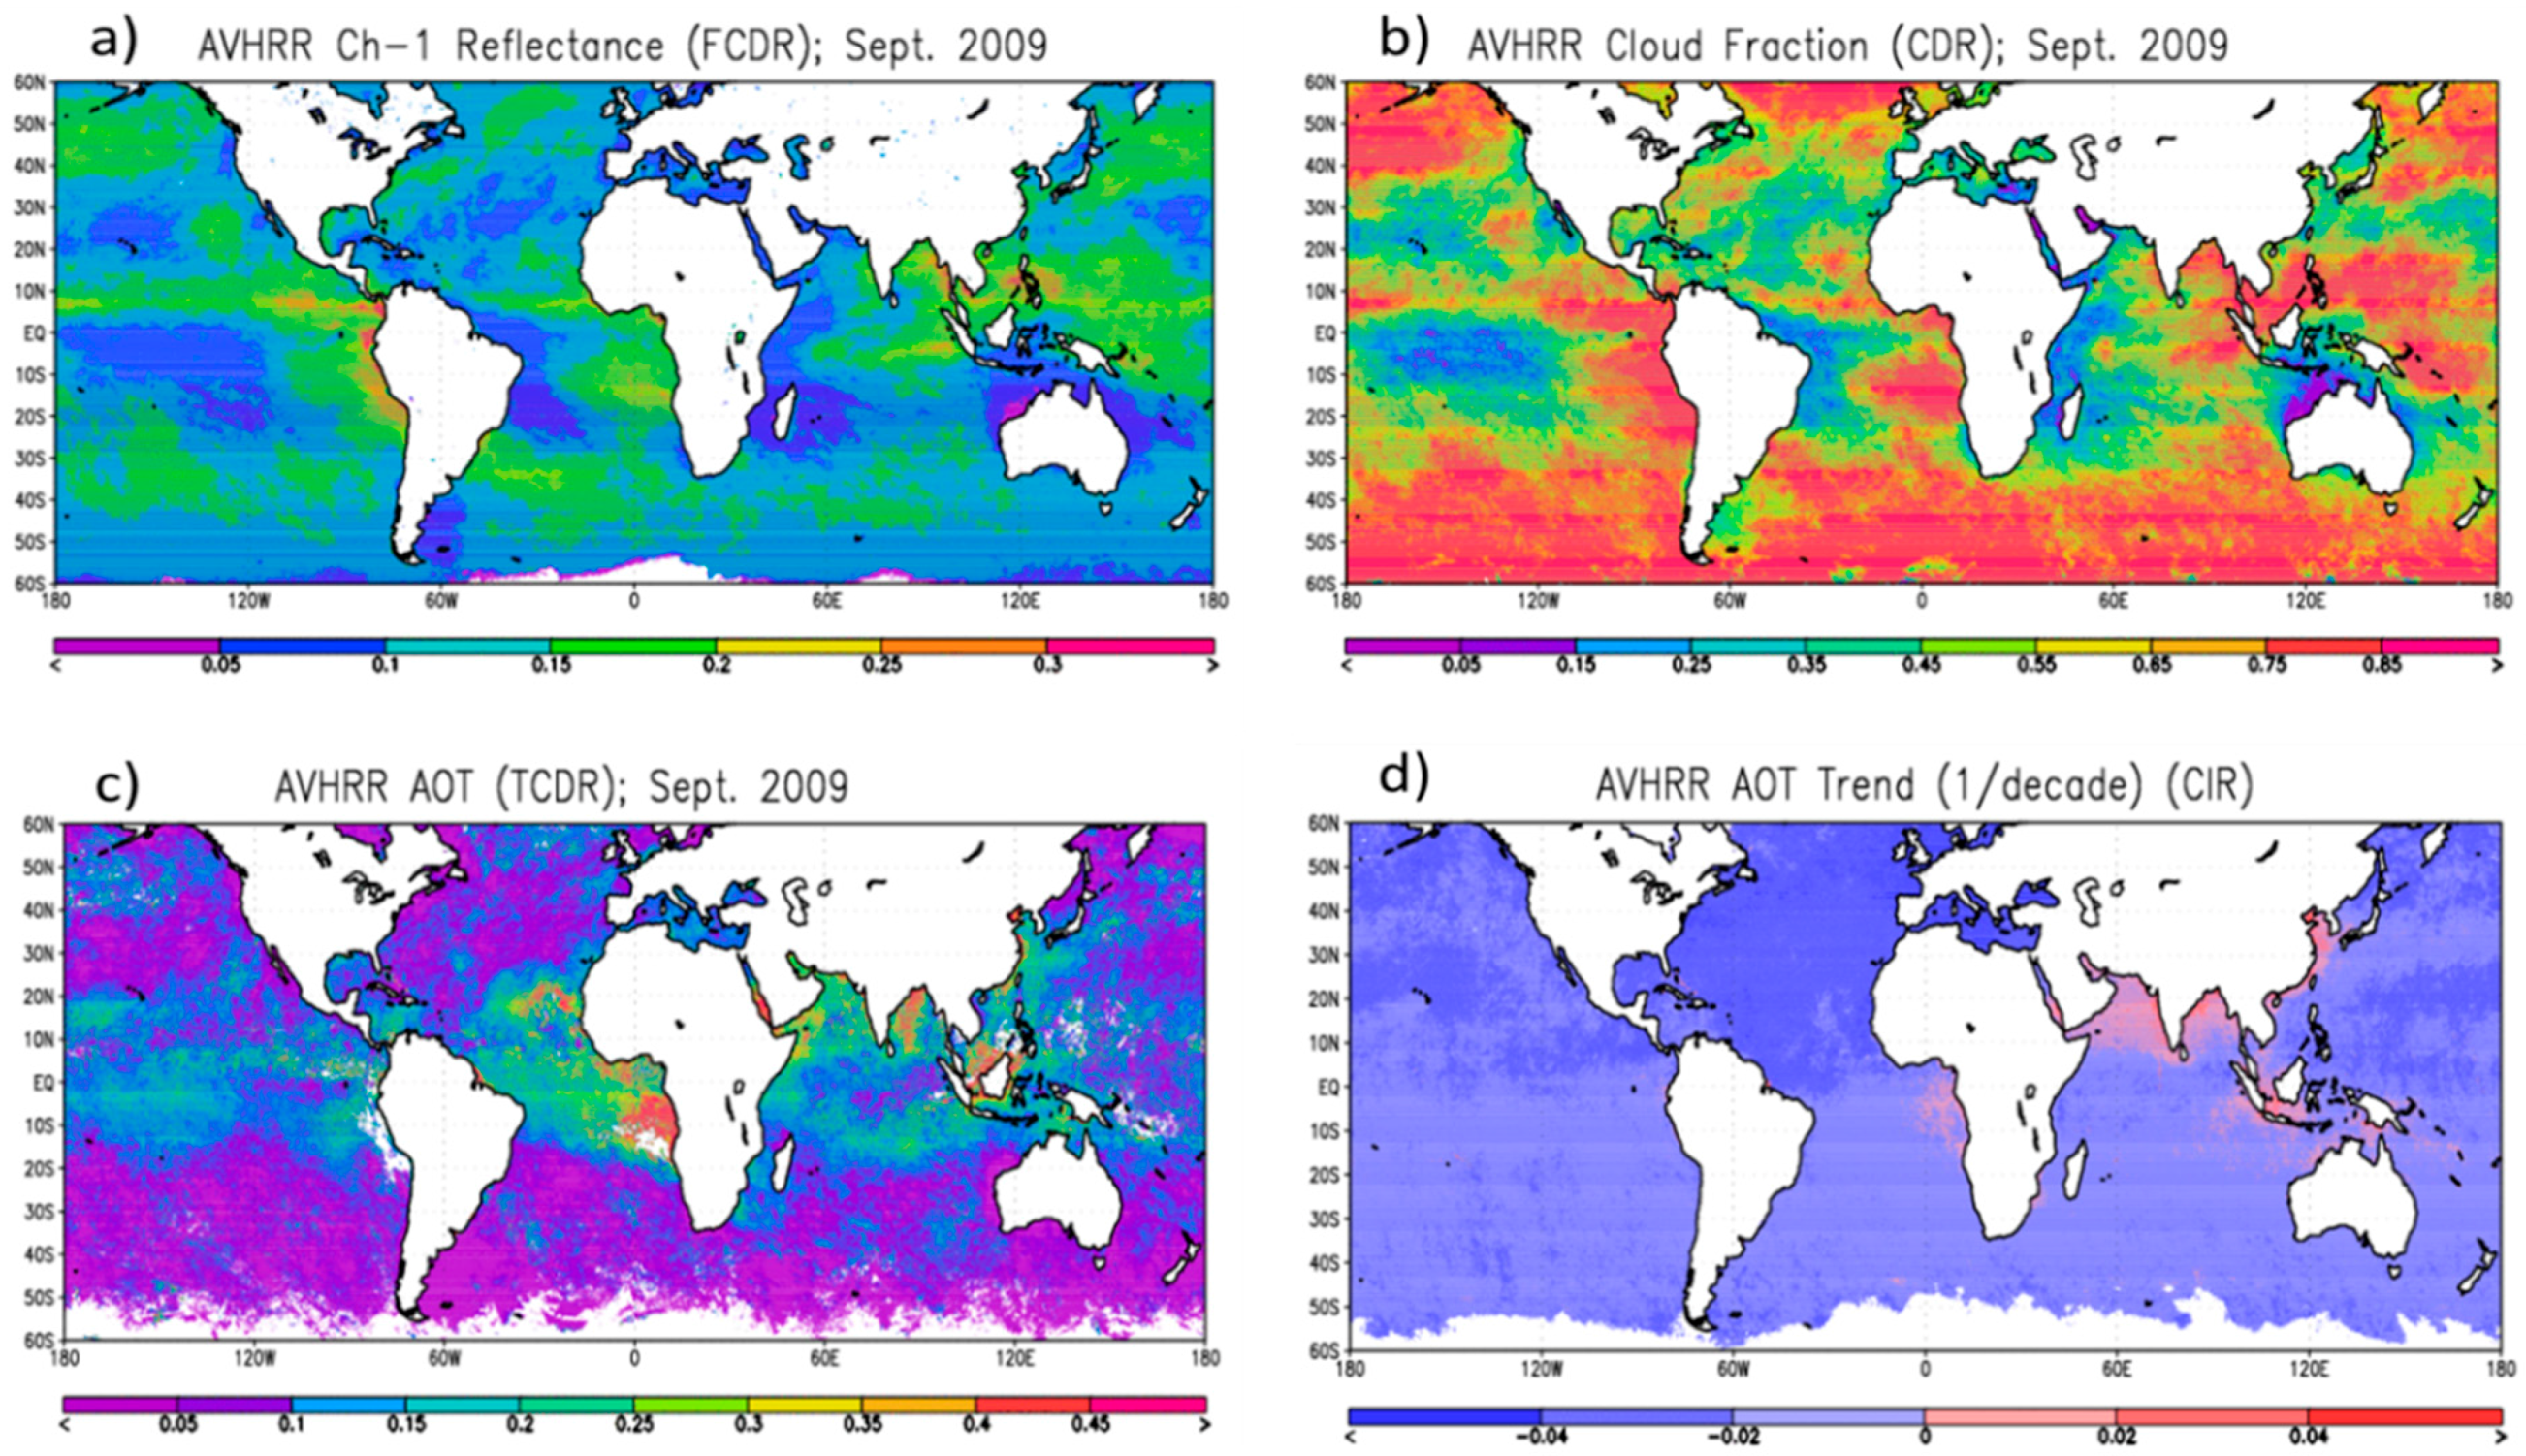
- AVHRR Aerosol Optical Thickness: AVHRR AOT CDR provides an optical measure of aerosol column loading derived from the global ocean pixel-level PATMOS-x AVHRR clear-sky reflectance CDR at 0.63 μm channel on both daily and monthly scales. The current operational version of the product spans from 1981 to 2009 and has been used to study the long-term trends of aerosol loading [34] and air quality changes in coastal regions [51].
- -
- AVHRR PATMOS-x cloud properties: These products provide high quality CDRs of multiple cloud properties along with AVHRR brightness temperatures [32]. Different algorithms were used to derive these cloud products during daytime and nighttime. They are output together with the inter-calibrated radiances and selected ancillary data as the Level-2b daily CDR products, which allow other applications and CDRs to be generated from the PATMOS-x CDR data, such as the above AVHRR AOT CDR (also in Figure 2). The PATMOS-x CDR data span 1978 to present and will be forward extended through 2020. The products have many applications, such as detecting and studying climate variability [52], verifying and validating climate models [53], energy and hydrology studies [54], and supporting aviation safety [55].
- -
- Ocean Near-Surface Atmospheric Properties and Heat Flux: Near-surface atmospheric temperature, humidity, and wind along with similar values at the sea surface describe essential aspects of the air-sea exchange. The Special Sensor Microwave/Imager (SSM/I), a passive microwave sensor, along with the sea surface temperature CDR provide this data after the application of a combination of statistical techniques using neural networks and diurnal warming parameterizations [56]. From these data, the near-surface fluxes of latent and sensible heat calculations produce a CDR on a three-hourly 0.25° resolution grid over the global ice-free oceans. The products have been widely used in the surface energy budget analysis and water cycle study [57,58].
- -
- Outgoing Longwave Radiation: The amount of terrestrial radiation that is released to space and, by extension, the amount of cloud cover and water vapor that intercepts radiation in the atmosphere defines the daily and monthly Outgoing Longwave Radiation (OLR) CDR. Data (Level-1b) from the HIRS and GridSat-B1 are the primary inputs into the daily OLR record. Application of a combination of statistical techniques, including OLR regression, instrument ambient temperature prediction coefficients, and inter-satellite bias corrections produce the final record [59]. The products have been widely used in various applications, such as radiation budget studies and Madden-Julian oscillation (MJO) diagnostics and forecasts [26].
- -
- Sea Ice Concentration: The sea ice concentration CDR provides a daily and monthly, time series of sea ice concentrations for both the north and south polar regions on a 25 km × 25 km grid [60]. These data comprise an estimate of the fraction of ocean area covered by sea ice that is produced by combining concentration estimates created using two algorithms developed at the National Aeronautics and Space Administration (NASA) Goddard Space Flight Center (GSFC). Gridded brightness temperatures acquired from a number of DMSP passive microwave radiometers provide the necessary input to produce the CDR. The product has applications that include studying and monitoring climate variability and providing guidance for the industries of shipping and fisheries.
- -
- Sea Surface Temperature—Optimum Interpolation: The NOAA 1/4° daily Optimum Interpolation Sea Surface Temperature (or daily OISST) provides complete ocean temperature fields constructed by combining bias-adjusted observations from different platforms (satellite, ships, buoys) on a regular global grid, with gaps filled in by the interpolation [23]. Satellite data from AVHRR provides the main input which permits the high temporal-spatial coverage beginning in late 1981 to the present; this must be adjusted to the buoys due to erroneous cold SSTs following the Mt Pinatubo and El Chichön eruptions. Applications include climate modeling, resource management, ecological studies on annual to daily scales [61].
- -
- AVHRR Surface Reflectance: Surface reflectance provides a measure of the fraction of incoming solar radiation that is reflected from Earth’s surface in two spectral ranges of the AVHRR sensors: red (around 0.64 µm) and the near infrared (around 0.86 µm). As a key variable, surface reflectance supplies the primary input for essentially all higher-level land surface geophysical parameters, such as NDVI and LAI CDRs. The surface reflectance CDR delivers valuable surface information dating back to 1981 as a daily product on a 0.05° grid [62]. It has been used to study long-term climate variability along with climate model verification and validation.
- -
- Land Area Index and FAPAR: The Leaf Area Index (LAI) and Fraction of Absorbed Photosynthetically Active Radiation (FAPAR) are biophysical variables that characterize the canopy and photosynthetic activity of plants. The one-sided green leaf area per unit ground surface area describes the LAI dataset. The fraction of the incoming solar radiation in the Photosynthetically Active Radiation spectral region that is absorbed by the plants defines the FAPAR data set. The LAI/FAPAR CDR is a daily product on a 0.05° grid from 1981 to present derived from AVHRR sensors [62]. It can be used to evaluate vegetation stress and forecast agricultural yields [63,64].
- -
- Normalized Difference Vegetation Index: The Normalized Difference Vegetation Index (NDVI) CDR summarizes the measurement of surface vegetation coverage. The surface reflectance calculations in the red and the near infrared spectral bands derived from AVHRR provide NDVI values [62]. The NDVI CDR produces daily output on a 0.05° grid, from 1981 to present. This consistent, long-term record of remotely sensed vegetation observations allows scientists to characterize the health of vegetation in different regions across the world [63,64].
- -
- Snow Cover Extend (Northern Hemisphere): The weekly Northern Hemisphere (NH) Snow Cover Extend (SCE) CDR spans the period from late 1966 to present, comprising the longest satellite-based CDR of any environmental variable. This CDR combines the NOAA visible satellite-based SCE analyses generated weekly through May 1999 and daily since June 1999 to form a continuous NH record [65]. The resulting continental SCE product informs climate studies, climate change monitoring, and climate model validation [66,67].
3.1.2. ESA Climate Change Initiative
- -
- Aerosol CCI: Aerosol CCI [69,70] was a three year intensive algorithm development effort that incorporated sensitivity analysis, validation and inter-comparison activities [71], along with a round robin exercise of seven different retrieval algorithms [72]. It produced: (1) AOT and Ångström exponent (AE); (2) Stratospheric extinction profiles and aerosol optical thickness; and (3) Absorbing aerosol index (AAI). AOT/AE datasets are provided for two main purposes: climate aerosol model evaluation, data assimilation into global aerosol re-analysis/forecasting model systems. The stratospheric dataset is provided as a correction to the total column AOT retrievals (mostly relevant in the case of major volcanic eruptions) and for stratospheric climate model evaluation. The AAI dataset so far is the only information for aerosol absorption (though only qualitative at present) has been prepared for comparison to model datasets by developing a model AAI simulator and analyzing major sensitivities.
- -
- GHG-CCI: The Greenhouse Gas (GHG)-CCI [73] data products contain information on regional CO2 and CH4 surface fluxes (emissions and uptake) and, therefore, can be used to improve our knowledge of GHG surface fluxes. These products are generated with GHG-CCI “ECV Core Algorithms” (ECAs). ECAs are algorithms to retrieve dry-air column-averaged mole fractions of carbon dioxide (CO2) and methane (CH4), denoted XCO2 (in ppm) and XCH4 (in ppb) from two satellite instruments: SCanning Imaging Absorption spectroMeter for Atmospheric CHartographY (SCIAMACHY) onboard Environmental Satellite (ENVISAT) (2002–2012) and Thermal And Near infrared Sensor for carbon Observation - Fourier Transform Spectrometer (TANSO-FTS) onboard Greenhouse gases Observing SATellite (GOSAT) (2009-ongoing).
- -
- SST CCI: The first version of the long-term SST CCI Analysis product version are derived from infrared imagery obtained from several Earth-observing satellite missions, combined to give daily, spatially complete information over the global oceans spanning 20 years [74]. The principal recommended applications are for climate research applications requiring ~20 years of stable, low bias records of SST. The dataset is particularly valuable if a representation of global SST is required that is independent of in situ SST measurements.
- -
- Ocean-Color CCI: The ESA-CCI ocean color ECV dataset [75] provides ocean color data, with a focus on Case 1 (open ocean, not coastal) waters, which can be used by climate change prediction and assessment models. The dataset is created by band-shifting and bias-correcting atmosphere corrected MEdium Resolution Imaging Spectrometer (MERIS) and Aqua Moderate Resolution Imaging Spectroradiometer (MODIS) data to match Sea-Viewing Wide Field-of-View Sensor (SeaWiFS) data, merging the datasets and computing per-pixel uncertainty estimates.
- -
- CCI Sea Ice Concentration: ESA-CCI Sea Ice Concentration (SIC) dataset [76] provides SIC and its uncertainties (both in % from 0 to 100) for both Northern hemisphere (NH) and Southern hemisphere (SH). Each file includes daily averaged SIC, processing status, three estimates of uncertainty, flags of SIC values retrieved outside the physical range of 0%–100%, and relevant metadata information.
- -
- CCI Soil Moisture: This soil moisture product is being developed and provided in the frame of the ESA Climate Change Initiative. The global soil moisture data set has been generated using active and passive microwave space-borne instruments and covers the 35-year period from November 1978 to December 2013 [77].
- -
- CCI Land Cover: ESA—Land Cover (LC) CCI databases [78] consist of: (a) three global LC maps at 300 m spatial resolution for three epochs centered on the years 2010 (2008–2012), 2005 (2003–2007) and 2000 (1998–2002). The maps were obtained using the full MERIS archive (2003–2012) and the Satellite Pour l’Observation de la Terre (SPOT)-Vegetation time series. The legend counts 22 classes defined using the Food and Agriculture Organization (FAO) Land Cover Classification System (LCCS); (b) three global climatological seven-day time series over the 1998–2012 period representing typical seasonal dynamics of the land surface at the pixel level: the vegetation greenness as described by the Normalized Vegetation Index, the snow occurrence and the Burnt Areas (BA) distribution. They are compiled from existing global datasets; and (c) Global surface reflectance (SR) time series of the whole MERIS Full and Reduced Resolution archive (2002–2012) provided in seven-day composites.
3.1.3. EUMETSAT’s Climate Monitoring SAF
- -
- SSM/I FCDR: The CM SAF Fundamental Climate Data Record of SSM/I Brightness Temperatures provides homogenized and inter-calibrated brightness temperatures from the six SSM/I radiometers aboard F08, F10, F11, F13, F14, and F15 of DMSP. The applications of this FCDR are similar to those described above for the NOAA SSMI Brightness Temperature CDR.
- -
- Free Tropospheric Humidity (FTH): FTH is an important climate variable due to its large sensitivity to OLR and thus a strong feedback factor in the Earth’s climate system. Monitoring of FTH globally is therefore important to understand our changing climate. However, measuring humidity in the free troposphere is a challenge and there are only a few datasets available for FTH. The FTH dataset produced by the EUMETSAT’s CMSAF [80] are derived from Meteosat (Meteorological Satellites) 1st and 2nd generation geostationary satellites. FTH is a key climate variable that plays a very important role in Earth’s radiation budget, however, FTH is not well simulated by current climate models [81].
- -
- HOAPS: The Hamburg Ocean Atmosphere Parameters and Fluxes from Satellite (HOAPS) data set [82] is a satellite-based climatology of precipitation, evaporation, freshwater budget (evaporation minus precipitation), related turbulent heat fluxes and atmospheric state variables as well as liquid water path and total column water vapor over the global ice free oceans.
- -
- CLARA-A1: CM SAF Clouds, Albedo and Radiation AVHRR data edition 1 (CLARA A1) surface radiation properties, cloud properties, and surface albedo datasets [83] are a global dataset derived from measurements of the series of AVHRR on the NOAA satellite series including METOP-A satellite. Its applications are similar to the NOAA AVHRR cloud CDRs.
- -
- SARAH: The Surface Solar Radiation Data Set—Heliosat (SARAH) [84] is a satellite-based climatology of the solar surface irradiance, the surface direct normalized irradiance and the effective cloud albedo derived from satellite observations of the visible channels of the Meteosat Visible and Infrared Imager (MVIRI) and Spinning Enhanced Visible and Infrared Imager (SEVIRI) instruments onboard the geostationary Meteosat satellites. The data are available from 1983 to 2013 and cover the region ±65° longitude and ±65° latitude. The products are available as monthly, daily, and hourly averages on a regular latitude/longitude grid with a spatial resolution of 0.05° × 0.05°.
3.2. Industry and Commercial Applications
4. Societal Benefit
4.1. Agriculture
4.2. Forestry
4.3. Fisheries
4.4. Energy
4.5. Health
4.6. Water
4.7. Transportation
4.8. Tourism
5. Conclusion
Acknowledgments
Author Contributions
Conflicts of Interest
Abbreviations
| AAI | Absorbing Aerosol Index |
| AE | Ångström Exponent |
| AMSU | Advanced Microwave Sounding Unit |
| AOT | Aerosol Optical Thickness |
| AVHRR | Advanced Very High Resolution Radiometer |
| BA | Burnt Area |
| CCI | Climate Change Initiative |
| CDR(s) | Climate Data Record(s) |
| CDRP | CDR Program |
| CEOS | Committee on Earth Observation Satellite |
| CGMS | Coordination Group for Meteorological Satellite |
| CIR | Climate Information Record |
| CLARA A1 | Clouds, Albedo and Radiation AVHRR data edition 1 |
| CM | Climate Monitoring |
| CMSAF | Satellite Application Facility on Climate Monitoring |
| CropWatch | A leading crop monitoring system |
| DMSP | Defense Meteorological Satellite Program |
| DIF | Diffuse Horizontal Irradiance |
| DNI | Direct Normal Irradiance |
| ECAs | ECV Core Algorithms |
| ECV(s) | Essential Climate Variable(s) |
| EDR(s) | Environmental Data Records |
| EnviSat | Environmental Satellites (ESA’s Earth observation satellite) |
| ESA | Europe Space Agency |
| EU | European Union |
| EUMETSAT | European Organization for the Exploitation of Meteorological Satellites |
| FAO | Food and Agriculture Organization |
| FAPAR | Fraction of Absorbed Photosynthetically Active Radiation |
| FCDR | Fundamental CDR |
| FIDUCEO | Fidelity and Uncertainty in Climate Data Records from Earth Observations |
| FTH | Free Tropospheric Humidity |
| GCOS | Global Climate Observing System |
| GHI | Global Horizontal Irradiance |
| GHG | Greenhouse Gas |
| GIS | Geographic Information System |
| GOSAT | Greenhouse gases Observing SATellite |
| GPS | Global Positioning System |
| GridSat | Geostationary IR Channel Brightness Temperature |
| GSFC | Goddard Space Flight Center |
| GS&T | Global Science & Technology, Inc. |
| HIRS | High-resolution Infrared Radiation Sounder |
| HOAPS | Hamburg Ocean Atmosphere Parameters and Fluxes from Satellite |
| ICDR | Interim CDR |
| ISCCP | International Satellite Cloud Climatology Project |
| LAI | Leaf Area Index |
| LandSat | Land Satellites (Joint NASA/USGS satellite series for providing the longest continuous space-based record of Earth’s land) |
| LC | Land Cover |
| LCCS | Land Cover Classification System |
| MERIS | MEdium Resolution Imaging Spectrometer |
| Meteosat | Geostationary Meteorological Satellites |
| METOP | Meteorological Operational Satellite |
| MJO | Madden–Julian oscillation |
| MODIS | Moderate Resolution Imaging Spectroradiometer |
| MSU | Microwave Sounding Unit |
| MTSAT | Multi-functional Transport Satellites |
| MVIRI | Meteosat Visible and Infrared Imager |
| NASA | National Aeronautics and Space Administration |
| NDVI | Normalized Difference Vegetation Index |
| NH | Northern Hemisphere |
| NOAA | National Oceanic and Atmospheric Administration |
| NPP | National Polar-orbiting Partnership |
| OISST | Optimum Interpolation Sea Surface Temperature |
| OLR | Outgoing Longwave Radiation |
| PATMOS-x | Pathfinder Atmospheres-Extended |
| PERSIANN | Precipitation Estimation from Remotely Sensed Information using Artificial Neural Networks |
| POES | Polar Operational Satellites |
| PV-GIS | Photovoltaic Geographical Information System |
| R2O | Research to Operation |
| Radarsat | Radar Satellites (Canada’s commercial Earth observation satellites) |
| REDR(s) | Reference Environment Data Record(s) |
| RS | Remote Sensing |
| SAF | Satellite Application Facility |
| SAR | Synthetic Aperture Radar |
| SARAH | The Surface Solar Radiation Data Set - Heliosat |
| SCE | Snow Cover Extend |
| SCIAMACHY | SCanning Imaging Absorption spectroMeter for Atmospheric CHartographY |
| SCOPE-CM | Sustained, Coordinated Processing of Environmental Satellite Data for Climate Monitoring |
| SDR(s) | Sensor Data Record(s) |
| SeaWiFS | Sea-Viewing Wide Field-of-View Sensor |
| SEVIRI | Spinning Enhanced Visible and Infrared Imager |
| SH | Southern Hemisphere |
| SI | International Standards |
| SIC | Sea Ice Concentration |
| SPOT | Satellite Pour l’Observation de la Terre |
| SR | Surface Reflectance |
| SSMI(S) | Special Sensor Microwave Imager/Sounder |
| SST | Sea Surface Temperature |
| TANSO-FTS | Thermal And Near infrared Sensor for carbon Observation—Fourier Transform Spectrometer |
| TCDR | Thematic CDR |
| TOA | Top of Atmosphere |
| VI | Vegetation Indices |
| VIIRS | Visible Infrared Imaging Radiometer Suite |
References
- Schulz, J.; Albert, P.; Behr, H.D.; Caprion, D.; Deneke, H.; Dewitte, S.; Durr, B.; Fuchs, P.; Gratzki, A.; Hechler, P.; et al. Operational climate monitoring from space: The EUMETSAT satellite application facility on climate monitoring (CM-SAF). Atmos. Chem. Phys. 2009, 9, 1687–1709. [Google Scholar] [CrossRef]
- Hollmann, R.; Merchant, C.J.; Saunders, R.; Downy, C.; Buchwitz, M.; Cazenave, A.; Chuvieco, E.; Defourny, P.; de Leeuw, G.; Forsberg, R.; et al. The ESA climate change initiative satellite data records for essential climate variables. Bull. Am. Meteorol. Soc. 2013, 94, 1541–1552. [Google Scholar] [CrossRef]
- Bates, J.J.; Privette, J.L.; Kearns, E.; Glance, W.; Zhao, X.-P. Sustained production of multidecadal climate records—Lessons from NOAA climate data record program. Bull. Am. Meteorol. Soc. 2016, in press. [Google Scholar] [CrossRef]
- NRC (National Research Council). Climate Data Records from Environmental Satellites: Interim Report; National Academies Press: Washington, DC, USA, 2004. [Google Scholar]
- NRC (National Research Council). Ensuring the Climate Record from the NPOESS and Goes-R Spacecraft: Elements of a Strategy to Recover Measurement Capabilities Lost in Program Restructuring; National Academies Press: Washington, DC, USA, 2008. [Google Scholar]
- Cao, C.Y.; Xiong, X.X.; Wu, A.H.; Wu, X.Q. Assessing the consistency of AVHRR and MODIS L1B reflectance for generating fundamental climate data records. J. Geophys. Res. Atmos. 2008, 113. [Google Scholar] [CrossRef]
- Heidinger, A.K.; Cao, C.; Sullivan, J.T. Using moderate resolution imaging spectrometer (MODIS) to calibrate advanced very high resolution radiometer reflectance channels. J. Geophys. Res. 2002, 107, 4702. [Google Scholar] [CrossRef]
- Cao, C.; Weinreb, M.; Xu, H. Predicting simultaneous NADIR overpasses among polar-orbiting meteorological satellites for the intersatellite calibration of radiometers. J. Atmos. Ocean. Technol. 2004, 21, 537–542. [Google Scholar] [CrossRef]
- Smith, G.R.; Levin, R.H.; Abel, P.; Jacobowitz, H. Calibration of the solar channels of NOAA-9 AVHRR using high altitude aircraft measurements. J. Atmos. Ocean. Technol. 1988, 5, 631–639. [Google Scholar] [CrossRef]
- Stone, T.C.; Kieffer, H.H. Use of the moon to support on-orbit sensor calibration for climate change measurements. Proc. SPIE 2006, 6296, 62961–62969. [Google Scholar]
- Matthews, G. Celestial body irradiance determination from an underfilled satellite radiometer: Application to albedo and thermal emission measurements of the moon using CEREs. Appl. Opt. 2008, 47, 4981–4993. [Google Scholar] [CrossRef] [PubMed]
- Cao, C.Y.; Vermote, E.; Xiong, X.X. Using AVHRR lunar observations for NDVI long-term climate change detection. J. Geophys. Res. Atmos. 2009, 114. [Google Scholar] [CrossRef]
- Eplee, R.E.; Sun, J.Q.; Meister, G.; Patt, F.S.; Xiong, X.X.; McClain, C.R. Cross calibration of SeaWiFS and MODIS using on-orbit observations of the moon. Appl. Opt. 2011, 50, 120–133. [Google Scholar] [CrossRef] [PubMed]
- Uprety, S.; Cao, C.Y. Radiometric and spectral characterization and comparison of the Antarctic Dome C and Sonoran Desert sites for the calibration and validation of visible and near-infrared radiometers. J. Appl. Remote Sens. 2012, 6, 063541. [Google Scholar]
- Doelling, D.R.; Morstad, D.; Scarino, B.R.; Bhatt, R.; Gopalan, A. The characterization of deep convective clouds as an invariant calibration target and as a visible calibration technique. IEEE Trans. Geosci. Remote Sens. 2013, 51, 1147–1159. [Google Scholar] [CrossRef]
- Wielicki, B.A.; Young, D.F.; Mlynczak, M.G.; Thome, K.J.; Leroy, S.; Corliss, J.; Anderson, J.G.; Ao, C.O.; Bantges, R.; Best, F.; et al. Achieving climate change absolute accuracy in orbit. Bull. Am. Meteorol. Soc. 2013, 94, 1519–1539. [Google Scholar] [CrossRef]
- Pearlman, A.; Datla, R.; Kacker, R.; Cao, C.Y. Translating radiometric requirements for satellite sensors to match international standards. J. Res. Natl. Inst. Stand. 2014, 119, 272–276. [Google Scholar] [CrossRef] [PubMed]
- Weng, F.Z.; Yang, H. Validation of ATMS calibration accuracy using Suomi NPP pitch maneuver observations. Remote Sens. 2016. accepted. [Google Scholar]
- Knapp, K.R.; Ansari, S.; Bain, C.L.; Bourassa, M.A.; Dickinson, M.J.; Funk, C.; Helms, C.N.; Hennon, C.C.; Holmes, C.D.; Huffman, G.J.; et al. Globally gridded satellite observations for climate studies. Bull. Am. Meteorol. Soc. 2011, 92, 893–907. [Google Scholar] [CrossRef]
- Bates, J.J.; Privette, J.L. A maturity model for assessing the completeness of climate data records. EOS Trans. Am. Geophys. Union 2012, 93, 441. [Google Scholar] [CrossRef]
- Huffman, G.J.; Adler, R.F.; Rudolf, B.; Schneider, U.; Keehn, P.R. Global precipitation estimates based on a technique for combining satellite-based estimates, rain-gauge analysis, and NWP model precipitation information. J. Clim. 1995, 8, 1284–1295. [Google Scholar] [CrossRef]
- Ashouri, H.; Hsu, K.L.; Sorooshian, S.; Braithwaite, D.K.; Knapp, K.R.; Cecil, L.D.; Nelson, B.R.; Prat, O.P. Persiann-CDR daily precipitation climate data record from multisatellite observations for hydrological and climate studies. Bull. Am. Meteorol. Soc. 2015, 96, 69–83. [Google Scholar] [CrossRef]
- Reynolds, R.W.; Smith, T.M.; Liu, C.; Chelton, D.B.; Casey, K.S.; Schlax, M.G. Daily high-resolution-blended analyses for sea surface temperature. J. Clim. 2007, 20, 5473–5496. [Google Scholar] [CrossRef]
- Walther, A.; Heidinger, A.K. Implementation of the daytime cloud optical and microphysical properties algorithm (Dcomp) in PATMOS-x. J. Appl. Meteorol. Clim. 2012, 51, 1371–1390. [Google Scholar] [CrossRef]
- Heidinger, A.; Foster, M.; Botambekov, D.; Hiley, M.; Li, Y.; Walther, A. Using the NASA EOS a-train to probe the performance of the NOAA PATMOS-x cloud fraction CDR. Remote Sens. 2016. submitted. [Google Scholar]
- Schreck, C.J.; Cordeira, J.M.; Margolin, D. Which MJO events affect North American temperatures? Mon. Weather Rev. 2013, 141, 3840–3850. [Google Scholar] [CrossRef]
- Schreck, C.J.; Shi, L.; Kossin, J.P.; Bates, J.J. Identifying the MJO, equatorial waves, and their impacts using 32 years of HIRS upper-tropospheric water vapor. J. Clim. 2013, 26, 1418–1431. [Google Scholar] [CrossRef]
- Sherbinin, A.D.; Levy, M.A.; Zell, E.; Weber, S.; Jaiteh, M. Using satellite data to develop environmental indicators. Environ. Res. Lett. 2014, 9, 084013. [Google Scholar] [CrossRef]
- Schreck, C.J.; Bennett, S.; Cordeira, J.M.; Crouch, J.; Dissen, J.; Lang, A.L.; Margolin, D.; O’Shay, A.; Rennie, J.; Schneider, T.I.; et al. Natural gas prices and the extreme winters of 2011/12 and 2013/14 causes, indicators, and interactions. Bull. Am. Meteorol. Soc. 2015, 96, 1879–1894. [Google Scholar] [CrossRef]
- Heidinger, A.K.; Straka, W.C.; Molling, C.C.; Sullivan, J.T.; Wu, X.Q. Deriving an inter-sensor consistent calibration for the AVHRR solar reflectance data record. Int. J. Remote Sens. 2010, 31, 6493–6517. [Google Scholar] [CrossRef]
- Heidinger, A.K.; Evan, A.T.; Foster, M.J. A Naive Bayesian cloud-detection scheme derived from CALIPSO and applied within PATMOS-x. J. Appl. Meteorol. Climatol. 2012. [Google Scholar] [CrossRef]
- Heidinger, A.K.; Foster, M.J.; Walther, A.; Zhao, X.-P. The pathfinder atmospheres-extended AVHRR climate dataset. Bull. Am. Meteorol. Soc. 2014, 95, 909–922. [Google Scholar] [CrossRef]
- Zhao, X.-P.; Dubovik, O.; Smirnov, A.; Holben, B.N.; Sapper, J.; Pietras, C.; Voss, K.J.; Frouin, R. Regional evaluation of an advanced very high resolution radiometer (AVHRR) two-channel aerosol retrieval algorithm. J. Geophys. Res. 2004, 109, D02204. [Google Scholar] [CrossRef]
- Zhao, T.X.; Chan, P.K.; Heidinger, A.K. A global survey of the effect of cloud contamination on the aerosol optical thickness and its long-term trend derived from operational AVHRR satellite observations. J. Geophys. Res. Atmos. 2013, 118, 2849–2857. [Google Scholar] [CrossRef]
- WGClimate. Available online: http://ceos.org/ourwork/workinggroups/climate (accessed on 8 April 2016).
- SCOPE-CM. Available online: http://www.scope-cm.org (accessed on 8 April 2016).
- CDRP. Available online: http://www.ncdc.noaa.gov/cdr (accessed on 8 April 2016).
- Zou, C.Z.; Wang, W.H. Intersatellite calibration of AMSU-A observations for weather and climate applications. J. Geophys. Res. Atmos. 2011, 116. [Google Scholar] [CrossRef]
- Zou, C.Z.; Goldberg, M.D.; Cheng, Z.H.; Grody, N.C.; Sullivan, J.T.; Cao, C.Y.; Tarpley, D. Recalibration of microwave sounding unit for climate studies using simultaneous nadir overpasses. J. Geophys. Res. Atmos. 2006, 111. [Google Scholar] [CrossRef]
- Santer, B.D.; Painter, J.F.; Mears, C.A.; Doutriaux, C.; Caldwell, P.; Arblaster, J.M.; Cameron-Smith, P.J.; Gillett, N.P.; Gleckler, P.J.; Lanzante, J.; et al. Identifying human influences on atmospheric temperature. Proc. Natl. Acad. Sci. USA 2013, 110, 26–33. [Google Scholar] [CrossRef] [PubMed]
- Foster, M.J.; Heidinger, A. Entering the era of +30-year satellite cloud climatologies: A North American case study. J. Clim. 2014, 27, 6687–6697. [Google Scholar] [CrossRef]
- Bain, C.L.; De Paz, J.; Kramer, J.; Magnusdottir, G.; Smyth, P.; Stern, H.; Wang, C.C. Detecting the ITCZ in instantaneous satellite data using spatiotemporal statistical modeling: ITCZ climatology in the East Pacific. J. Clim. 2011, 24, 216–230. [Google Scholar] [CrossRef]
- Shi, L.; Bates, J.J. Three decades of intersatellite-calibrated high-resolution infrared radiation sounder upper tropospheric water vapor. J. Geophys. Res. Atmos. 2011, 116. [Google Scholar] [CrossRef]
- Chung, E.S.; Soden, B.; Sohn, B.J.; Shi, L. Upper-tropospheric moistening in response to anthropogenic warming. Proc. Natl. Acad. Sci. USA 2014, 111, 11636–11641. [Google Scholar] [CrossRef] [PubMed]
- FIDUCEO. Available online: http://www.fiduceo.eu/ (accessed on 8 April 2016).
- Berg, W.; Sapiano, M.R.P.; Horsman, J.; Kummerow, C. Improved geolocation and earth incidence angle information for a fundamental climate data record of the SSM/I sensors. IEEE Trans. Geosci. Remote Sens. 2013, 51, 1504–1513. [Google Scholar] [CrossRef]
- Sapiano, M.R.P.; Berg, W.K.; McKague, D.S.; Kummerow, C.D. Toward an intercalibrated fundamental climate data record of the SSM/I sensors. IEEE Trans. Geosci. Remote Sens. 2013, 51, 1492–1503. [Google Scholar] [CrossRef]
- Hilburn, K.A.; Wentz, F.J. Intercalibrated passive microwave rain products from the unified microwave ocean retrieval algorithm (UMORA). J. Appl. Meteorol. Clim. 2008, 47, 778–794. [Google Scholar] [CrossRef]
- Allan, R.P.; Soden, B.J. Atmospheric warming and the amplification of precipitation extremes. Science 2008, 321, 1481–1484. [Google Scholar] [CrossRef] [PubMed]
- Miao, C.Y.; Ashouri, H.; Hsu, K.L.; Sorooshian, S.; Duan, Q.Y. Evaluation of the Persiann-CDR daily rainfall estimates in capturing the behavior of extreme precipitation events over China. J. Hydrometeorol. 2015, 16, 1387–1396. [Google Scholar] [CrossRef]
- Zhao, X.-P. Satellite observed aerosol optical thickness and trend around megacities in the coastal zone. Adv. Meteorol. 2015, 2015, 170672. [Google Scholar] [CrossRef]
- Sun, B.M.; Free, M.; Yoo, H.L.; Foster, M.J.; Heidinger, A.; Karlsson, K.G. Variability and trends in U.S. Cloud cover: ISCCP, PATMOS-x, and CLARA-A1 compared to homogeneity-adjusted weather observations. J. Clim. 2015, 28, 4373–4389. [Google Scholar] [CrossRef]
- Klein, S.A.; McCoy, R.B.; Morrison, H.; Ackerman, A.S.; Avramov, A.; de Boer, G.; Chen, M.X.; Cole, J.N.S.; Del Genio, A.D.; Falk, M.; et al. Intercomparison of model simulations of mixed-phase clouds observed during the arm mixed-phase arctic cloud experiment. I: Single-layer cloud. Q. J. R. Meteorol. Soc. 2009, 135, 979–1002. [Google Scholar] [CrossRef]
- Nielsen, J.K.; Foster, M.; Heidinger, A. Tropical stratospheric cloud climatology from the PATMOS-x dataset: An assessment of convective contributions to stratospheric water. Geophys Res Lett 2011, 38. [Google Scholar] [CrossRef]
- Mecikalski, J.R.; Feltz, W.F.; Murray, J.J.; Johnson, D.B.; Bedka, K.M.; Bedka, S.T.; Wimmers, A.J.; Pavolonis, M.; Berendies, T.A.; Haggerty, J.; et al. Aviation applications for satellite-based observations of cloud properties, convection initiation, in-flight icing, turbulence, and volcanic ash. Bull. Am. Meteorol. Soc. 2007, 88, 1589–1607. [Google Scholar] [CrossRef]
- Clayson, C.A.; Curry, J.A. Determination of surface turbulent fluxes for the tropical ocean-global atmosphere coupled ocean-atmosphere response experiment: Comparison of satellite retrievals and in situ measurements. J. Geophys. Res. Oceans 1996, 101, 28515–28528. [Google Scholar] [CrossRef]
- Rodell, M.; Beaudoing, H.K.; L’Ecuyer, T.S.; Olson, W.S.; Famiglietti, J.S.; Houser, P.R.; Adler, R.; Bosilovich, M.G.; Clayson, C.A.; Chambers, D.; et al. The observed state of the water cycle in the early twenty-first century. J. Clim. 2015, 28, 8289–8318. [Google Scholar] [CrossRef]
- L’Ecuyer, T.S.; Beaudoing, H.K.; Rodell, M.; Olson, W.; Lin, B.; Kato, S.; Clayson, C.A.; Wood, E.; Sheffield, J.; Adler, R.; et al. The observed state of the energy budget in the early twenty-first century. J. Clim. 2015, 28, 8319–8346. [Google Scholar] [CrossRef]
- Lee, H.T.; Gruber, A.; Ellingson, R.G.; Laszlo, I. Development of the HIRS outgoing longwave radiation climate dataset. J. Atmos. Ocean. Technol. 2007, 24, 2029–2047. [Google Scholar] [CrossRef]
- NSIDC. Available online: http://nsidc.org/data/G02202/versions/1 (accessed on 8 April 2016).
- Donlon, C.; Robinson, I.; Casey, K.S.; Vazquez-Cuervo, J.; Armstrong, E.; Arino, O.; Gentemann, C.; May, D.; LeBorgne, P.; Piolle, J.; et al. The global ocean data assimilation experiment high-resolution sea surface temperature pilot project. Bull. Am. Meteorol. Soc. 2007, 88, 1197–1213. [Google Scholar] [CrossRef]
- Pedelty, J.; Devadiga, S.; Masuoka, E.; Brown, M.; Pinzon, J.; Tucker, C.; Roy, D.P.; Ju, J.J.; Vermote, E.; Prince, S.; et al. Generating a long-term land data record from the AVHRR and MODIS instruments. In Proceedings of the IEEE International Geoscience and Remote Sensing Symposium, Barcelona, Spain, 23–27 July 2007.
- Zhou, L.; Tian, Y.; Myneni, R.B.; Ciais, P.; Saatchi, S.; Liu, Y.Y.; Piao, S.; Chen, H.; Vermote, E.F.; Song, C.; et al. Widespread decline of Congo rainforest greenness in the past decade. Nature 2014, 509, 86–90. [Google Scholar] [CrossRef] [PubMed]
- Morton, D.C.; Nagol, J.; Carabajal, C.C.; Rosette, J.; Palace, M.; Cook, B.D.; Vermote, E.F.; Harding, D.J.; North, P.R.J. Amazon forests maintain consistent canopy structure and greenness during the dry season. Nature 2014, 506, 221–224. [Google Scholar] [CrossRef] [PubMed]
- Brown, R.D.; Robinson, D.A. Northern hemisphere spring snow cover variability and change over 1922–2010 including an assessment of uncertainty. Cryosphere 2011, 5, 219–229. [Google Scholar] [CrossRef]
- Foster, J.L.; Cohen, J.; Robinson, D.A.; Estilow, T.W. A look at the date of snowmelt and correlations with the arctic oscillation. Ann. Glaciol. 2013, 54, 196–204. [Google Scholar] [CrossRef]
- Mioduszewski, J.R.; Rennermalm, A.K.; Robinson, D.A.; Mote, T.L. Attribution of snowmelt onset in Northern Canada. J. Geophys. Res. Atmos. 2014, 119, 9638–9653. [Google Scholar] [CrossRef]
- CCI. Available online: http://cci.esa.int/ (accessed on 6 April 2016).
- Popp, T.; de Leeuw, G.; Bingen, C.; Bruhl, C.; Capelle, V.; Chedin, A.; Clarisse, L.; Dubovik, O.; Griesfeller, J.; Heckel, A.; et al. Development, production and evaluation of aerosol climate data records from European satellite observations (Aerosol_cci). Remote Sens. 2016. (accepted). [Google Scholar]
- CCI-Aerosol. Available online: http://www.esa-aerosol-cci.org/ (accessed on 6 April 2016).
- Holzer-Popp, T.; de Leeuw, G.; Griesfeller, J.; Martynenko, D.; Kluser, L.; Bevan, S.; Davies, W.; Ducos, F.; Deuze, J.L.; Graigner, R.G.; et al. Aerosol retrieval experiments in the ESA Aerosol_cci project. Atmos. Meas. Tech. 2013, 6, 1919–1957. [Google Scholar] [CrossRef]
- De Leeuw, G.; Holzer-Popp, T.; Bevan, S.; Davies, W.H.; Descloitres, J.; Grainger, R.G.; Griesfeller, J.; Heckel, A.; Kinne, S.; Kluser, L.; et al. Evaluation of seven European aerosol optical depth retrieval algorithms for climate analysis. Remote Sens. Environ. 2015, 162, 295–315. [Google Scholar] [CrossRef]
- CCI-GHG. Available online: http://www.esa-ghg-cci.org/ (accessed on 8 April 2016).
- CCI-SST. Available online: http://www.esa-sst-cci.org/ (accessed on 8 April 2016).
- CCI-OC. Available online: http://www.esa-oceancolour-cci.org/ (accessed on 8 April 2016).
- CCI-SIC. Available online: http://esa-cci.nersc.no/ (accessed on 8 April 2016).
- CCI-SM. Available online: http://esa-cci.nersc.no/ (accessed on 8 April 2016).
- CCI-LC. Available online: http://www.esa-landcover-cci.org/ (accessed on 8 April 2016).
- CMSAF. Available online: http://www.cmsaf.eu/ (accessed on 8 April 2016).
- FTH. Available online: http://wui.cmsaf.eu/safira/action/viewDoiDetails?acronym=FTH_METEOSAT_V001 (accessed on 8 April 2016).
- John, V.O.; Soden, B.J. Temperature and humidity biases in global climate models and their impact on climate feedbacks. Geophys. Res. Lett. 2007, 34. [Google Scholar] [CrossRef]
- HOAPS. Available online: http://www.hoaps.zmaw.de/ (accessed on 8 April 2016).
- CLARA-A1. Available online: https://climatedataguide.ucar.edu/climate-data/clara-a1-cloud-properties-surface-albedo-and-surface-radiation-products-based-avhrr (accessed on 8 April 2016).
- SARAH. Available online: https://climatedataguide.ucar.edu/climate-data/surface-solar-radiation-data-set-heliosat-sarah-edition-1 (accessed on 8 April 2016).
- 3TIER. Available online: http://www.3tier.com (accessed on 8 April 2016).
- 3TIER-Solar. Available online: http://www.3tier.com/en/support/solar-prospecting-tools/what-solar-prospecting-data-has-been-created/ (accessed on 8 April 2016).
- Huld, T.; Muller, R.; Gambardella, A. A new solar radiation database for estimating PV performance in Europe and Africa. Sol. Energy 2012, 86, 1803–1815. [Google Scholar] [CrossRef]
- Wu, B.F.; Meng, J.H.; Li, Q.Z.; Yan, N.N.; Du, X.; Zhang, M. Remote sensing-based global crop monitoring: Experiences with China’s cropwatch system. Int. J. Digit. Earth 2014, 7, 113–137. [Google Scholar] [CrossRef]
- Santos, A.M.P. Fisheries oceanography using satellite and airborne remote sensing methods: A review. Fish. Res. 2000, 49, 1–20. [Google Scholar] [CrossRef]
- Klemas, V. Fisheries applications of remote sensing: An overview. Fish. Res. 2013, 148, 124–136. [Google Scholar] [CrossRef]
- Nagne, A.D.; Gawali, B.W. Transportation network analysis by using remote sensing and GIS a review. Int. J. Eng. Res. Appl. 2013, 3, 70–76. [Google Scholar]
- Johannessen, O.M.; Alexandrov, V.Y.; Frolov, I.Y.; Sandven, S.; Pettersson, L.H.; Bobylev, L.P.; Kloster, K.; Smirnov, V.G.; Mironov, Y.U.; Babich, N.G. Remote Sensing of Sea Ice in the Northern Sea Route Studies and Applications Afterword; Springer: Berlin, Germany, 2007; pp. 423–425. [Google Scholar]
- Estilow, T.W.; Young, A.H.; Robinson, D.A. A long-term northern hemisphere snow cover extent data record for climate studies and monitoring. Earth Syst. Sci. Data 2015, 7, 137–142. [Google Scholar] [CrossRef]
- Smith, K. Environmental Hazards Assessing Risk and Reducing Disasters, 6th ed.; Routledge: Abingdon, UK, 2013. [Google Scholar]
- Mouillot, F.; Schultz, M.G.; Yue, C.; Cadule, P.; Tansey, K.; Ciais, P.; Chuvieco, E. Ten years of global burned area products from spaceborne remote sensing—A review: Analysis of user needs and recommendations for future developments. Int. J. Appl. Earth Obs. 2014, 26, 64–79. [Google Scholar] [CrossRef]
- Bach, H.; Appel, F.; Fellah, K.; de Fraipont, P. Application of flood monitoring from satellite for insurance. In Proceedings of the International Geoscience and Remote Sensing Symposium (IGARSS), Seoul, Korea, 25–29 July 2005.
- Young, F.; Chandler, O.; Apan, A. Crop hail damage: Insurance loss assessment using remote sensing. In Proceedings of the Remote Sensing and Photogrammetry Society Conference, Aberdeen, UK, 7–10 September 2004.
- Rojas, O.; Vrieling, A.; Rembold, F. Assessing drought probability for agricultural areas in Africa with coarse resolution remote sensing imagery. Remote Sens. Environ. 2011, 115, 343–352. [Google Scholar] [CrossRef]
- Leeuw, J.D.; Vrieling, A.; Shee, A.; Atzberger, C.; Hadgu, K.M.; Biradar, C.M.; Keah, H.; Turvey, C. The potential and uptake of remote sensing in insurance: A review. Remote Sens. 2014, 6, 10888–10912. [Google Scholar] [CrossRef]
- Precision Farming. Available online: http://earthobservatory.nasa.gov/Features/PrecisionFarming/ (accessed on 8 April 2016).
- Hall, A.; Lamb, D.W.; Holzapfel, B.; Louis, J. Optical remote sensing applications in viticulture—A review. Aust. J. Grape Wine Res. 2002, 8, 36–47. [Google Scholar] [CrossRef]
- Zarco-Tejada, P.J.; Berjon, A.; Lopez-Lozano, R.; Miller, J.R.; Martin, P.; Cachorro, V.; Gonzalez, M.R.; de Frutos, A. Assessing vineyard condition with hyperspectral indices: Leaf and canopy reflectance simulation in a row-structured discontinuous canopy. Remote Sens. Environ. 2005, 99, 271–287. [Google Scholar] [CrossRef]
- Asrar, G. Theory and Applications of Optical Remote Sensing; John Wiley & Sons: New York, NY, USA, 1989. [Google Scholar]
- Huete, A.R.; Didan, K.; Shimabukuro, Y.E.; Ratana, P.; Saleska, S.R.; Hutyra, L.R.; Yang, W.Z.; Nemani, R.R.; Myneni, R. Amazon rainforests green-up with sunlight in dry season. Geophys. Res. Lett. 2006, 33. [Google Scholar] [CrossRef]
- Myneni, R.B.; Yang, W.Z.; Nemani, R.R.; Huete, A.R.; Dickinson, R.E.; Knyazikhin, Y.; Didan, K.; Fu, R.; Juarez, R.I.N.; Saatchi, S.S.; et al. Large seasonal swings in leaf area of amazon rainforests. Proc. Natl. Acad. Sci. USA 2007, 104, 4820–4823. [Google Scholar] [CrossRef] [PubMed]
- Hansen, M.C.; Potapov, P.V.; Moore, R.; Hancher, M.; Turubanova, S.A.; Tyukavina, A.; Thau, D.; Stehman, S.V.; Goetz, S.J.; Loveland, T.R.; et al. High-resolution global maps of 21st-century forest cover change. Science 2013, 342, 850–853. [Google Scholar] [CrossRef] [PubMed]
- Ruddell, S.; Walsh, M.J.; Kanakasabai, M. Forest Carbon Trading and Marketing in the United States; Society of American Foresters: Bethesda, MD, USA, 2006. [Google Scholar]
- Leblon, B. Forest wildfire hazard monitoring using remote sensing: A review. Remote Sens. Rev. 2001, 20, 1–43. [Google Scholar] [CrossRef]
- Chassot, E.; Bonhommeau, S.; Reygondeau, G.; Nieto, K.; Polovina, J.J.; Huret, M.; Dulvy, N.K.; Demarcq, H. Satellite remote sensing for an ecosystem approach to fisheries management. ICES J. Mar. Sci. 2011, 68, 651–666. [Google Scholar] [CrossRef]
- Stuart, V.; Platt, T.; Sathyendranath, S.; Pravin, P. Remote sensing and fisheries: An introduction. ICES J. Mar. Sci. 2011, 68, 639–641. [Google Scholar] [CrossRef]
- Stuart, V.; Platt, T.; Sathyendranath, S. The future of fisheries science in management: A remote-sensing perspective. ICES J. Mar. Sci. 2011, 68, 644–650. [Google Scholar] [CrossRef]
- Laurs, R.M.; Fiedler, P.C.; Montgomery, D.R. Albacore tuna catch distributions relative to environmental features observed from satellites. Deep Sea Res. 1984, 31, 1085–1099. [Google Scholar] [CrossRef]
- Straka, W.C.; Seaman, C.J.; Baugh, K.; Cole, K.; Stevens, E.; Miller, S.D. Utilization of the Suomi national polar-orbiting partnership (NPP) visible infrared imaging radiometer suite (VIIRS) day/night band for Arctic ship tracking and fisheries management. Remote Sens. 2015, 7, 971–989. [Google Scholar] [CrossRef]
- Goodman, J.A.; Samuel, J.P.; Stuart, R.P. Coral Reef Remote Sensing; Springer: Berlin, Germany, 2013. [Google Scholar]
- Tooke, T.R.; Coops, N.C. A review of remote sensing for urban energy system management and planning. In Proceedings of the Joint Urban Remote Sensing Event (JURSE), Sao Paulo, Brazil, 21–23 April 2013.
- GST-Report. Available online: https://www.cicsnc.org/assets/pdfs/events/energy-sector-resilience/Acclimatise_NCEI_Jan8.pdf (accessed on 6 April 2016).
- Kazmi, S.J.H.; Usery, E.L. Application of remote sensing and GIS for the monitoring of diseases: A unique research agenda for geographers. Remote Sens. Rev. 2001, 20, 26. [Google Scholar] [CrossRef]
- Hayes, R.O.; Maxwell, E.L.; Mitchell, C.J.; Woodzick, T.L. Detection, identification, and classification of mosquito larval habitats using remote-sensing scanners in earth-orbiting satellites. Bull. World Health Organ. 1985, 63, 361–374. [Google Scholar] [PubMed]
- Martin, R.V. Satellite remote sensing of surface air quality. Atmos. Environ. 2008, 42, 7823–7843. [Google Scholar] [CrossRef]
- Hutchison, K.D. Applications of MODIS satellite data and products for monitoring air quality in the State of Texas. Atmos. Environ. 2003, 37, 2403–2412. [Google Scholar] [CrossRef]
- Ritchie, J.C.; Zimba, P.V.; Everitt, J.H. Remote sensing techniques to assess water quality. Photogramm. Eng. Remote Sens. 2003, 69, 695–704. [Google Scholar] [CrossRef]
- Alsdorf, D.E.; Rodriguez, E.; Lettenmaier, D.P. Measuring surface water from space. Rev. Geophys. 2007, 45. [Google Scholar] [CrossRef]
- Toll, D.; Doorn, B.; Engman, E. NASA’S water resources element within the applied sciences program. In Proceedings of the 2010 IEEE International Geoscience and Remote Sensing Symposium (IGARSS), Honolulu, HI, USA, 25–30 July 2010.
- Kalma, J.D.; McVicar, T.R.; McCabe, M.F. Estimating land surface evaporation: A review of methods using remotely sensed surface temperature data. Surv. Geophys. 2008, 29, 421–469. [Google Scholar] [CrossRef]
- Ralph, F.M.; Neiman, P.J.; Wick, G.A.; Gutman, S.I.; Dettinger, M.D.; Cayan, D.R.; White, A.B. Flooding on California’s Russian river: Role of atmospheric rivers. Geophys. Res. Lett. 2006, 33. [Google Scholar] [CrossRef]
- Stephens, G.L.; Kummerow, C.D. The remote sensing of clouds and precipitation from space: A review. J. Atmos. Sci. 2007, 64, 3742–3765. [Google Scholar] [CrossRef]
- Alley, W.M.; Healy, R.W.; LaBaugh, J.W.; Reilly, T.E. Hydrology—Flow and storage in groundwater systems. Science 2002, 296, 1985–1990. [Google Scholar] [CrossRef] [PubMed]
- Wagner, W.; Bloschl, G.; Pampaloni, P.; Calvet, J.C.; Bizzarri, B.; Wigneron, J.P.; Kerr, Y. Operational readiness of microwave remote sensing of soil moisture for hydrologic applications. Nordrol. Hydrol. 2007, 38, 1–20. [Google Scholar] [CrossRef]
- Casse, C.; Gosset, M. Analysis of hydrological changes and flood increase in Niamey based on the PERSIANN-CDR satellite rainfall estimate and hydrological simulations over the 1983–2013 period. Proc. IAHS 2015, 370, 117–123. [Google Scholar] [CrossRef]
- Luchetti, N.T.; Sutton, J.R.P.; Wright, E.E.; Kruk, M.C.; Marra, J.J. When El Niño rages: How satellite data can help water-stressed islands. Bull. Am. Meteorol. Soc. 2016. [Google Scholar] [CrossRef]
- World Disasters Report, International Federation of Red Cross and Red Crescent Societies; Imprimerie Chirat: Lyons, France, 2012.
- Wu, H.; Adler, R.F.; Tian, Y.D.; Huffman, G.J.; Li, H.Y.; Wang, J.J. Real-time global flood estimation using satellite-based precipitation and a coupled land surface and routing model. Water Resour. Res. 2014, 50, 2693–2717. [Google Scholar] [CrossRef]
- NASA-ASP. Available online: https://c3.nasa.gov/water/projects/ (accessed on 8 April 2016).
- U.S. Department of transportation. Remote sensing for transportation: Products and results: Foundations for the future. In Proceedings of Committee for Conferences on Remote Sensing and Spatial Information Technologies for Transportation; Washington, DC, USA, 10–12 December 2001.
- Jensen, J.R.; Cowen, D.C. Remote sensing of urban suburban infrastructure and socio-economic attributes. Photogramm. Eng. Remote Sens. 1999, 65, 611–622. [Google Scholar]
- Bahaire, T.; Elliott-White, M. The application of geographical information systems (GIS) in sustainable tourism planning: A review. J. Sustain. Tour. 1999, 7, 159–174. [Google Scholar] [CrossRef]
- Levy, R.M.; Dickson, E.E. GIS, remote sensing, and tourism destination management. In Community Destination Management in Developing Economies; The Haworth Hospitality Press: New York, NY, USA, 2006; pp. 101–112. [Google Scholar]
- National Oceanic and Atmospheric Administration. NOAA’S Next Generation Strategic Plan; National Oceanic and Atmospheric Administration: Silver Spring, MD, USA, 2010.
- Gössling, S.; Peeters, P.; Hall, C.M.; Ceron, J.P.; Dubois, G.; Scott, D. Tourism and water use: Supply, demand, and security. Tourism Management 2012, 33, 1–15. [Google Scholar] [CrossRef]
- Nagendra, H.; Tucker, C.; Carlson, L.; Southworth, J.; Karmacharya, M.; Karna, B. Monitoring parks through remote sensing: Studies in Nepal and Honduras. Environ. Manag. 2004, 34, 748–760. [Google Scholar] [CrossRef] [PubMed]
- Southworth, J.; Nagendra, H.; Munroe, D.K. Introduction to the special issue: Are parks working? Exploring human-environment tradeoffs in protected area sonservation. Appl. Geogr. 2006, 26, 87–95. [Google Scholar] [CrossRef]
- Zhang, X.Y.; Goldberg, M.D. Monitoring fall foliage coloration dynamics using time-series satellite data. Remote Sens. Environ. 2011, 115, 382–391. [Google Scholar] [CrossRef]
- Saha, S.; Moorthi, S.; Pan, H.L.; Wu, X.R.; Wang, J.D.; Nadiga, S.; Tripp, P.; Kistler, R.; Woollen, J.; Behringer, D.; et al. The NCEP climate forecast system reanalysis. Bull. Am. Meteorol. Soc. 2010, 91, 1015–1057. [Google Scholar] [CrossRef]
- Dee, D.P.; Uppala, S.M.; Simmons, A.J.; Berrisford, P.; Poli, P.; Kobayashi, S.; Andrae, U.; Balmaseda, M.A.; Balsamo, G.; Bauer, P.; et al. The era-interim reanalysis: Configuration and performance of the data assimilation system. Q. J. R. Meteorol. Soc. 2011, 137, 553–597. [Google Scholar] [CrossRef]
- Rienecker, M.M.; Suarez, M.J.; Gelaro, R.; Todling, R.; Bacmeister, J.; Liu, E.; Bosilovich, M.G.; Schubert, S.D.; Takacs, L.; Kim, G.K.; et al. MERRA: NASA’S modern-era retrospective analysis for research and applications. J. Clim. 2011, 24, 3624–3648. [Google Scholar] [CrossRef]

© 2016 by the authors; licensee MDPI, Basel, Switzerland. This article is an open access article distributed under the terms and conditions of the Creative Commons by Attribution (CC-BY) license (http://creativecommons.org/licenses/by/4.0/).
Share and Cite
Yang, W.; John, V.O.; Zhao, X.; Lu, H.; Knapp, K.R. Satellite Climate Data Records: Development, Applications, and Societal Benefits. Remote Sens. 2016, 8, 331. https://doi.org/10.3390/rs8040331
Yang W, John VO, Zhao X, Lu H, Knapp KR. Satellite Climate Data Records: Development, Applications, and Societal Benefits. Remote Sensing. 2016; 8(4):331. https://doi.org/10.3390/rs8040331
Chicago/Turabian StyleYang, Wenze, Viju O. John, Xuepeng Zhao, Hui Lu, and Kenneth R. Knapp. 2016. "Satellite Climate Data Records: Development, Applications, and Societal Benefits" Remote Sensing 8, no. 4: 331. https://doi.org/10.3390/rs8040331
APA StyleYang, W., John, V. O., Zhao, X., Lu, H., & Knapp, K. R. (2016). Satellite Climate Data Records: Development, Applications, and Societal Benefits. Remote Sensing, 8(4), 331. https://doi.org/10.3390/rs8040331