Article

Combining L- and X-Band SAR Interferometry to Assess Ground Displacements in Heterogeneous Coastal Environments: The Po River Delta and Venice Lagoon, Italy

1
Institute of Marine Sciences, National Research Council, Arsenale Tesa 104, Castello 2737/F, Venezia 30122, Italy
2
Gamma Remote Sensing, Worbstrasse 225, Gümligen 3073, Switzerland
3
Department of Civil, Environmental and Architectural Engineering, University of Padova, Via Trieste 63, Padova 35121, Italy
*
Author to whom correspondence should be addressed.
Remote Sens. 2016, 8(4), 308; https://doi.org/10.3390/rs8040308
Submission received: 30 December 2015 / Revised: 26 February 2016 / Accepted: 21 March 2016 / Published: 6 April 2016
(This article belongs to the Special Issue Remote Sensing in Coastal Environments)

Abstract

:
From leveling to SAR-based interferometry, the monitoring of land subsidence in coastal transitional environments significantly improved. However, the simultaneous assessment of the ground movements in these peculiar environments is still challenging. This is due to the presence of relatively small built-up zones and infrastructures, e.g., coastal infrastructures, bridges, and river embankments, within large natural or rural lands, e.g., river deltas, lagoons, and farmland. In this paper we present a multi-band SAR methodology to integrate COSMO-SkyMed and ALOS-PALSAR images. The method consists of a proper combination of the very high-resolution X-band Persistent Scatterer Interferometry (PSI), which achieves high-density and precise measurements on single structures and constructed areas, with L-band Short-Baseline SAR Interferometry (SBAS), properly implemented to raise its effectiveness in retrieving information in vegetated and wet zones. The combined methodology is applied on the Po River Delta and Venice coastland, Northern Italy, using 16 ALOS-PALSAR and 31 COSMO-SkyMed images covering the period between 2007 and 2011. After a proper calibration of the single PSI and SBAS solution using available GPS records, the datasets have been combined at both the regional and local scales. The measured displacements range from ~0 mm/yr down to −35 mm/yr. The results reveal the variable pattern of the subsidence characterizing the more natural and rural environments without losing the accuracy in quantifying the sinking of urban areas and infrastructures. Moreover, they allow improving the interpretation of the natural and anthropogenic processes responsible for the ongoing subsidence.

Graphical Abstract

1. Introduction

Over the last century, climate changes and land subsidence have produced a relative sea level rise (RSLR) on the Northern Adriatic coastland ranging from centimeters to meters [1]. Considering that the sea level has been increasing with an average rate of 1.2 mm/yr [2], land subsidence has been the main component of the RSLR [3].
Land subsidence has been monitored in the Po River Delta-Venice (PDV) region since the end of the 19th century. The length of the leveling network increased over the time from a few hundreds to thousands of kilometers [4] and about ten continuous GPS stations (CGPS) have been established since the beginning of the 2000s [5].
In the new millennium, the use of satellite SAR interferometric methods improved the monitoring of ground movements and opened new possibilities for a more accurate interpretation of the land subsidence and its driving mechanisms.
The first SAR analysis on the historical center of Venice carried out by Differential SAR Interferometry (DInSAR) provided thousands of measurement points, much more than those previously obtained by leveling on a few hundreds of benchmarks [6]. More recently, the use of Persistent Scatterer Interferometry (PSI) [7,8] has remarkably increased the number of measurable targets in the PDV region, achieving accuracies comparable to that of leveling and CGPS [4,9,10,11]. In the last years, the use of new very-high-resolution X-band radar satellites has allowed applying PSI to monitor movements of single structures with millimeter precision and meter-range spatial resolution [12,13]. Therefore, PSI has progressively reduced the use of in situ traditional techniques for measuring land subsidence [10,14], although PSI has not yet completely replaced leveling and CGPS because in situ data provides the references to update the SAR-based measurements from relative to absolute movements.
PSI has revealed that the movements in the PDV region are characterized by a complex areal pattern due to the superposition of natural and anthropogenic driving mechanisms acting at different depth, times, and areal scales [15]. Tectonics, natural consolidation of poorly consolidated shallow sedimentary sequences [11], consolidation due to surface loads [13], oxidation of recently reclaimed marshes [16], and fluid removal from the subsurface [17] all contribute to the cumulative displacements.
The PDV region is characterized by a high environmental heterogeneity, including deltas, lagoons, wetlands, littoral strips, farmlands, islands, and urbanized areas. Interferometric processing of images acquired by C- and X-band sensors has allowed revealing the different characteristics in time and space of the ground movements. ERS-ENVISAT scenes (C-band) acquired over 20 years with a regular 35-day revisiting time provided an excellent long-term image of the coastland ground movements [14]. Very-high-resolution TerraSAR-X and COSMO-SkyMed scenes (X-band) with repeat cycle of 11 and 16 days, respectively, highlighted the short-term displacements at impressive detail, up to the scale of the single structures [12]. Furthermore, the combining of C-band and X-band allowed distinguishing between the natural and anthropogenic displacements in the city of Venice [13].
Nonetheless, the ground movements are still poorly detected in vegetated areas such as wetlands, salt marshes, and farmlands because of temporal decorrelation and lack of point-like targets (reflector points). Hence, land subsidence has been estimated by interpolating the data measured on the available scattered structures [3,4,9], with distances between the measurements and the interpolated locations that can amount to 2–3 km, or establishing a small number of proper artificial reflectors within the natural zones [18].
In order to overcome this PSI limitation, an innovative experimental network of about 50 artificial trihedral corner reflectors (TCR) has been established in 2007 on the salt marshes and tidal flats of the Venice Lagoon [18]. The use of TCRs provided new insight on the ground movement of natural tidal environments and pointed out a large variability in the displacement rates that can be difficultly resolved by some tens of measuring points. An attempt to overcome this limit has been recently carried out by using L-band sensors, which are characterized by a longer wavelength (λ = 23.6 cm), and multi-looked interferometric processing [19]. This approach has the potential to retain phase coherence over time periods longer than C- or X-band instruments in vegetated zones [20,21,22]. Hence, in some low coherence areas, as the coastal wetlands and farmlands, more point-like scatterers can be identified allowing filling important information gaps.
Various authors have recently try to integrate multi-band and multi-resolution SAR sensors for improving the knowledge of the ground movements in complex environments. For example, [23] jointed the ERS-1/2 PSI outcomes with ALOS PALSAR imagery acquired on the Wieliczka Salt Mine area, Poland. The aim is to extend the PS coverage to areas with few man-made features, i.e., where C-band PSI failed, taking advantage of the reduced temporal and volumetric decorrelation of the L-band. [24] proposed a method to optimize X-band (TerraSAR-X) acquisition planning in combination with L-band (ALOS PALSAR) images. They showed the complementarity of these two bands for measuring subsidence in urban and non-urban areas at Tianjin, China. [25] pointed out the advantages of the synergistic use of ALOS PALSAR and TerraSAR-X data for a comprehensive understanding and monitoring of unstable slopes in Hong Kong, China. They produced different outcomes in relation to data reliability and spatial-temporal resolution: L-band processing was used to monitor large-scale natural zones owing to its width swath and high coherence preservation in vegetated areas, while X-band data allowed extracting detailed information, e.g., the identification of unstable slope boundary, taking advantage of the high resolution and the shorter revisit times. [26] applied a multi-temporal differential SAR interferometry technique on ENVISAT ASAR and COSMO-SkyMed ascending and descending datasets to investigate the spatial and temporal patterns of land subsidence in the Sibari Plain, Southern Italy, and to discriminate the vertical and east-west displacement components.
Most of these works have processed both L- and X-band SAR interferometry in a common investigated area and analyzed separately the two intereferometric outcomes comparing their outcomes to derive a comprehensive interpretation of the ground movements. The purpose of this paper is to present an original approach for improving the quantification of the ground movements in coastal sectors poorly investigated because of scarce point-like reflectors and the challenging accessibility to in situ surveys. The method consists in a proper combination of the very high-resolution X-band PSI [8], which achieves high-density and precise measurements on single structures and constructed areas, with the L-band SBAS [27], tuned to raise its effectiveness in retrieving information in vegetated and wet zones. The specific investigation is focused on the PDV region; however, the methodology can be applied to other worldwide transitional coastal environments.
The present work develops as follows. Firstly, X-band PSI on COSMO-SkyMed images and L-band SBAS on ALOS-PALSAR scenes are carried out at the scale of the whole coastal PDV plain. Secondly, the outcomes of the two datasets are calibrated and validated by available CGPS, and statistically compared to check for consistency. Thirdly, the COSMO-SkyMed and ALOS-PALSAR SAR-based results are combined in the superposition area, with the post-processing that is specifically carried out both at a regional (about 100 km) and a local (from 1 to 10 km) scale. Finally, the advantages of the X- and L-band combination are discussed in terms of new insights on the land movements in the PDV region.

2. Study Site and Dataset

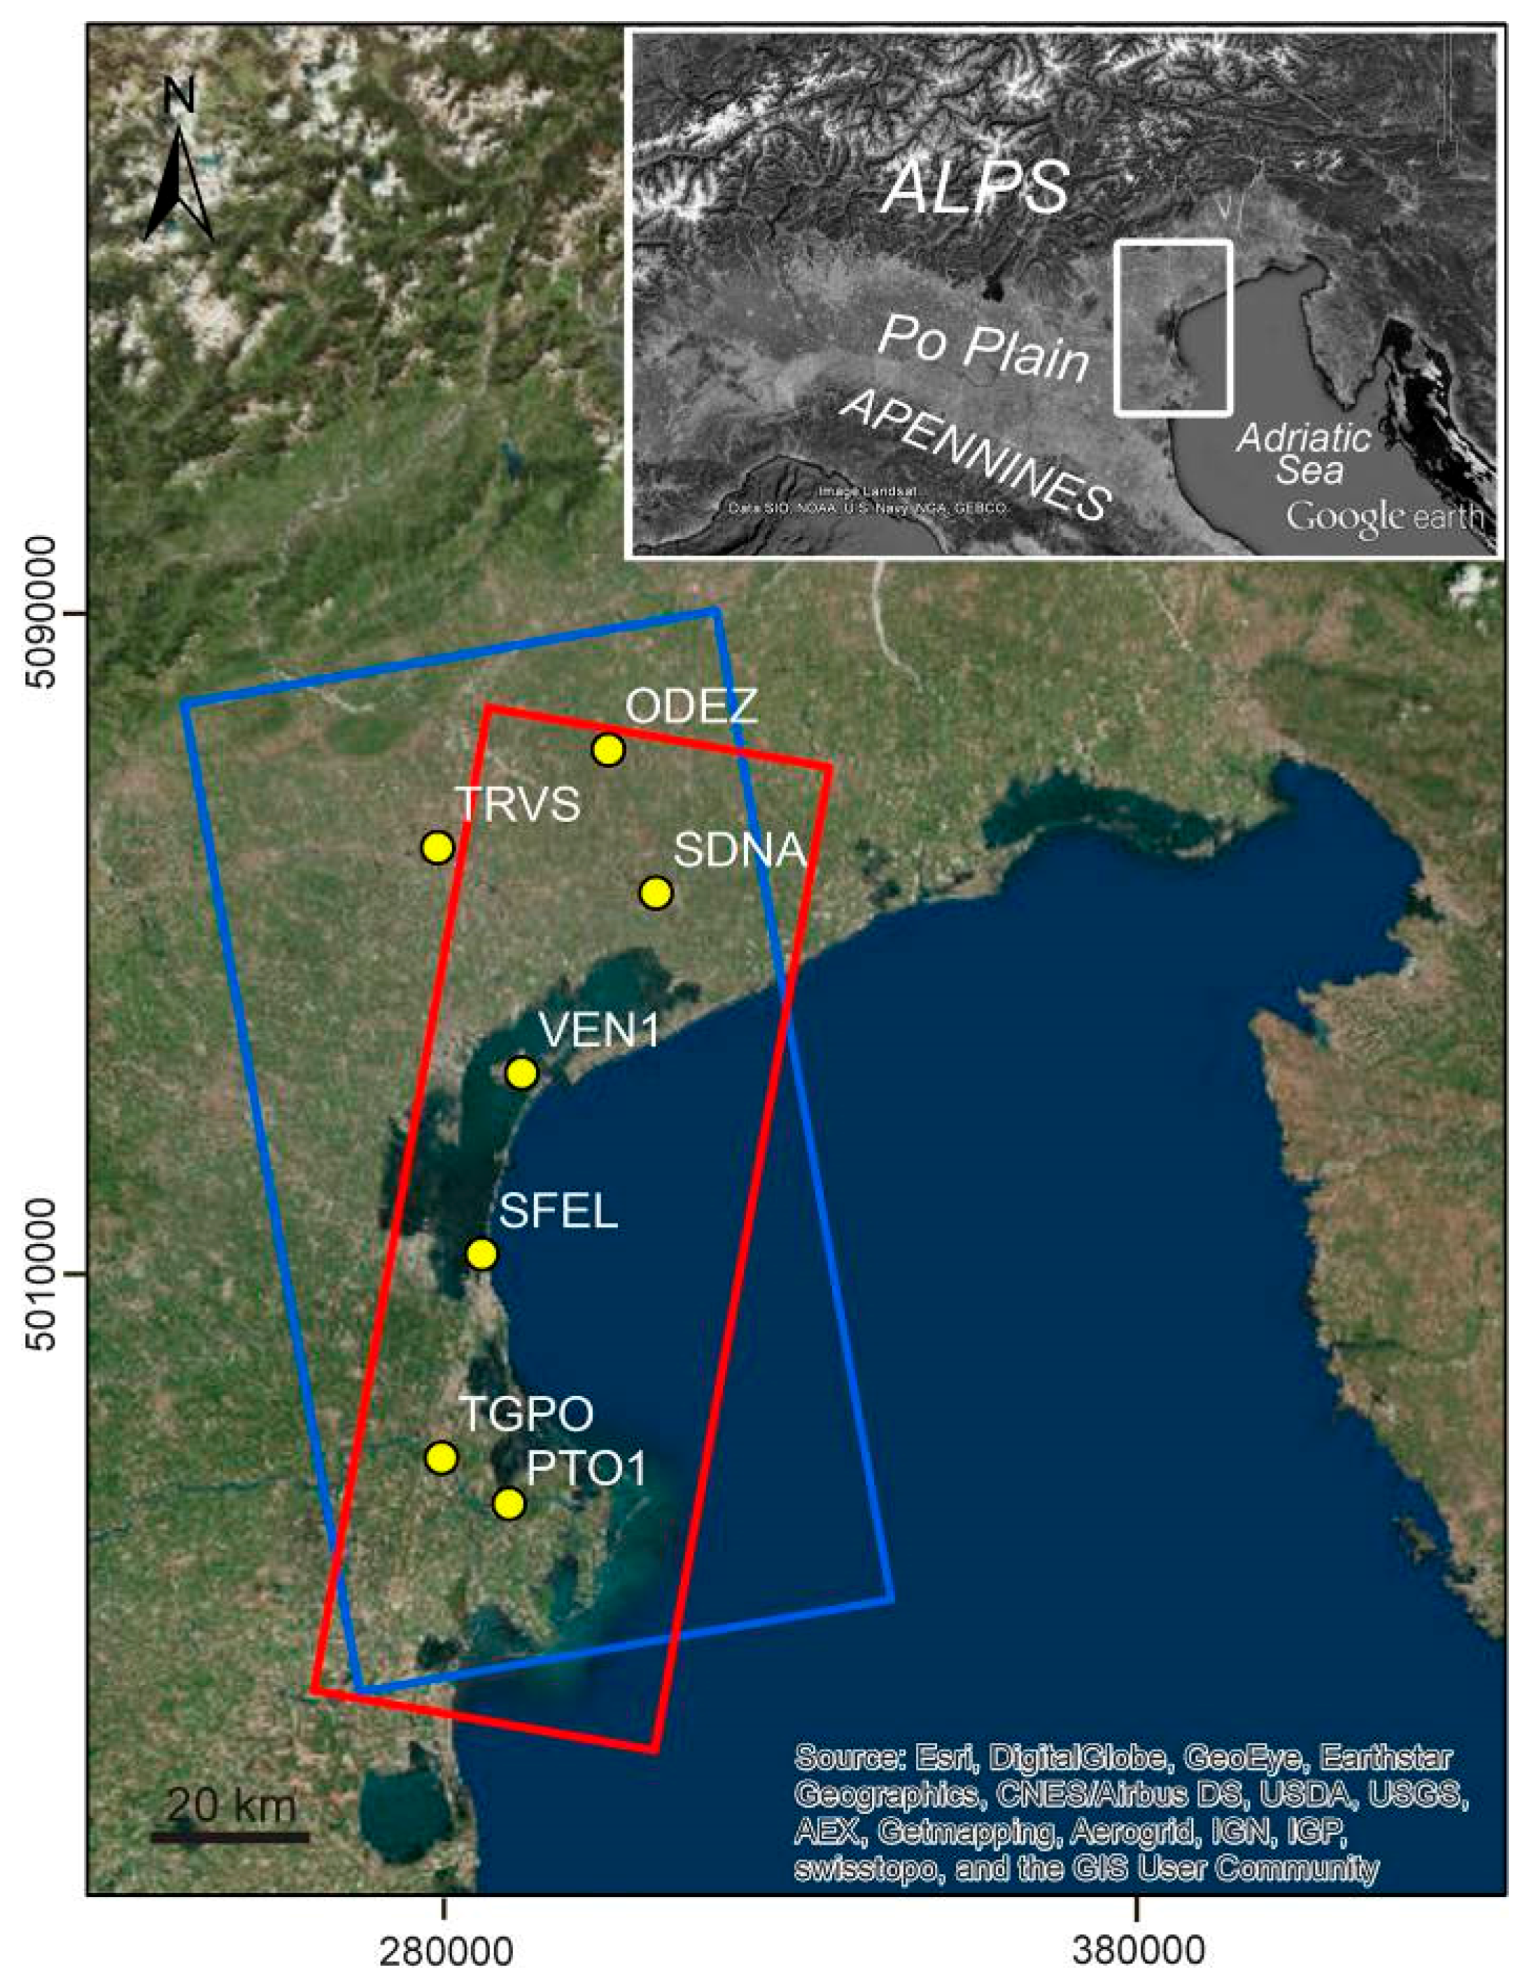
2.1. Study Site and Problem Statement

The current study focuses on the Northern Adriatic coast encompassing the Po River Delta and the Venice Lagoon (Figure 1). The PDV region is part of a broad foreland region located between the NE-verging Northern Apennine, the SSE-verging Eastern South-Alpine and the WSW-verging Dinaric mountain chains. The Plio-Pleistocene succession represents part of the infill of the foreland region and is composed of terrigenous sediments of up to 2000 m thick, whose accumulation is more pronounced in the area characterized by the largest tectonic subsidence, the so-called depocenter, corresponding to the Po River Delta [28,29].
The study area covers about 11,000 km2 and includes a wide range of environments such as lagoons, river mouths, small islands, littoral strips, urban and industrial areas, farmlands. Within them, there is a variety of morphologies and anthropogenic structures, such as saltmarshes, mud flats, wetlands, lowlands, farmlands, fish farms, embankments, and jetties.
The Po River Delta and the Venice Lagoon are high valuable ecosystems and their existence is vulnerable due to climate change and human inference (e.g., [31]). Most of the Northern Adriatic coastland lays below the mean sea level, hence it is very sensitive to relative sea level rise, the main component of which is land subsidence. Ground displacements in the Northern Adriatic coastland are caused by both natural and anthropogenic factors, acting individually or together, and on different time scales (millions to thousands, and hundreds to tens of years), thus reflecting the geological history and the human development of the territory. The role played by the long-term natural causes, i.e., tectonics and glacio-isostasy, is negligible in modern times, while natural compaction of recent alluvial fine-grained deposits, which increases from the mainland toward the sea, has assumed a major importance.
Anthropogenic subsidence due groundwater withdrawal in the Venice area and gas-bearing water pumping in the Po River Delta became a key problem for land elevation over the 20th century, and especially after World War II, when the civil, industrial, agricultural, and tourist development required huge amounts of water and an increasing energy supply [32,33]. From the early 1970s, countermeasures have been taken and anthropogenic subsidence strongly reduced or stopped all over the Eastern Po plain. Another cause that contributes to increasing the loss in elevation with respect to the mean sea level is the geochemical subsidence induced by (i) the biochemical oxidation of the soil organic matter in the reclamation area; and by (ii) the salinization of the interstitial water in clay layers because of the widespread seawater intrusion along the coastal margin. During the last century, the cumulative subsidence has reached values of some centimeters in the Venice area and 2–3 m in the Po River Delta, with serious environmental impacts.
The subsidence rates in the Po Delta and Venice sectors reduced over the last three decades following the regulation on fluid withdrawals [1]. However, in the PDV region, this process continues to be alarming with sinking rates up to 10 mm/yr, especially in low-lying sectors, the cumulative effect of the elevation loss because of the irreversibility of the process, and the expected scenarios of sea level rise.

2.2. SAR Data

Ground movements have been measured performing multi-temporal spaceborne SAR interferometry on 16 ALOS-PALSAR L-band (~24 cm wavelength) and 31 COSMO-SkyMed X-band (~3 cm wavelength) images.
The ALOS-PALSAR images were acquired between 15 January 2007, and 26 July 2010, along ascending orbits in stripmap mode at HH polarization, an incidence angle of 35°, and a 10 × 5 m nominal spatial resolution. The COSMO-SkyMed images were acquired between 26 September 2008, and 17 July 2011, along descending orbits in stripmap mode at HH polarization, an incidence angle of 34°, and a nominal 3 × 3 m pixel dimension. Time intervals and perpendicular baseline distribution of the 16 ALOS-PALSAR and 31 COSMO-SkyMed images are shown in Figure 2. The ALOS-PALSAR scenes have perpendicular baseline values between −2728 and 2211 m with respect to the central reference image dated 23 January 2010, a 14 MHz (Fine Beam Dual) or 28 MHz (Fine Beam Single) bandwidth, and Doppler values ranging from −30 to 178 Hz. COSMO-SkyMed scenes have perpendicular baseline ranging from −719 to 695 m with respect to the central reference image dated 19 January 2010, a 100 MHz bandwidth, and Doppler values from 600 to 800 Hz. The possible effect of the one year shift between the L- and X-band datasets on the recorded displacements is, generally, negligible because the processes driving land subsidence in the PVD region remain unchanged over the 2007–2011 time interval.

2.3. Ground Data

Tens of permanent GPS stations have been established in the Northern Adriatic coastland by various Authorities and for most of them the time series are available in the web (e.g., [5,30,34,35,36]). However, because of the shortness and irregularity of data acquisition, the movement series available from these stations are not always useful to calibrate/validate the ground movement velocities obtained by SAR interferometry.
Among the CGPS stations located within the COSMO-SkyMed and ALOS-PALSAR frames, the following seven CGPS have provided reliable long-term series of measurements: TRVS (Treviso), ODEZ (Oderzo), VEN1 (Venice historical center), SFEL (San Felice, Chioggia), PTO1 (Porto Tolle), SDNA (San Donà di Piave), and TGPO (Taglio di Po) (Figure 1 and Table 1).
Notice that the time intervals spanned by the CGPS differ among themselves and are, generally, different from those monitored by the SAR images. However, based on the outcome from previous investigations [15], it can be reasonably assumed that the processes driving the recent land subsidence are generally remained unchanged over the decade 2005–2015, thus supporting the use of the various datasets for calibration/validation irrespective of the specific period of acquisition. This does not hold for SFEL, whose displacement trend significantly changed in 2009 due to the MoSE construction at the lagoon inlet. The IGS08 solution indicates horizontal movements at the stations of 20.5–21.3 mm/yr in the north component and 16.2–17.5 mm/yr in the east component (Table 1). This motion primarily reflects a rigid motion of the Eurasian plate with respect to IGS08. To note that SFEL shows a certain difference of the displacements likely due to the effect of the MoSE works.

3. Methods

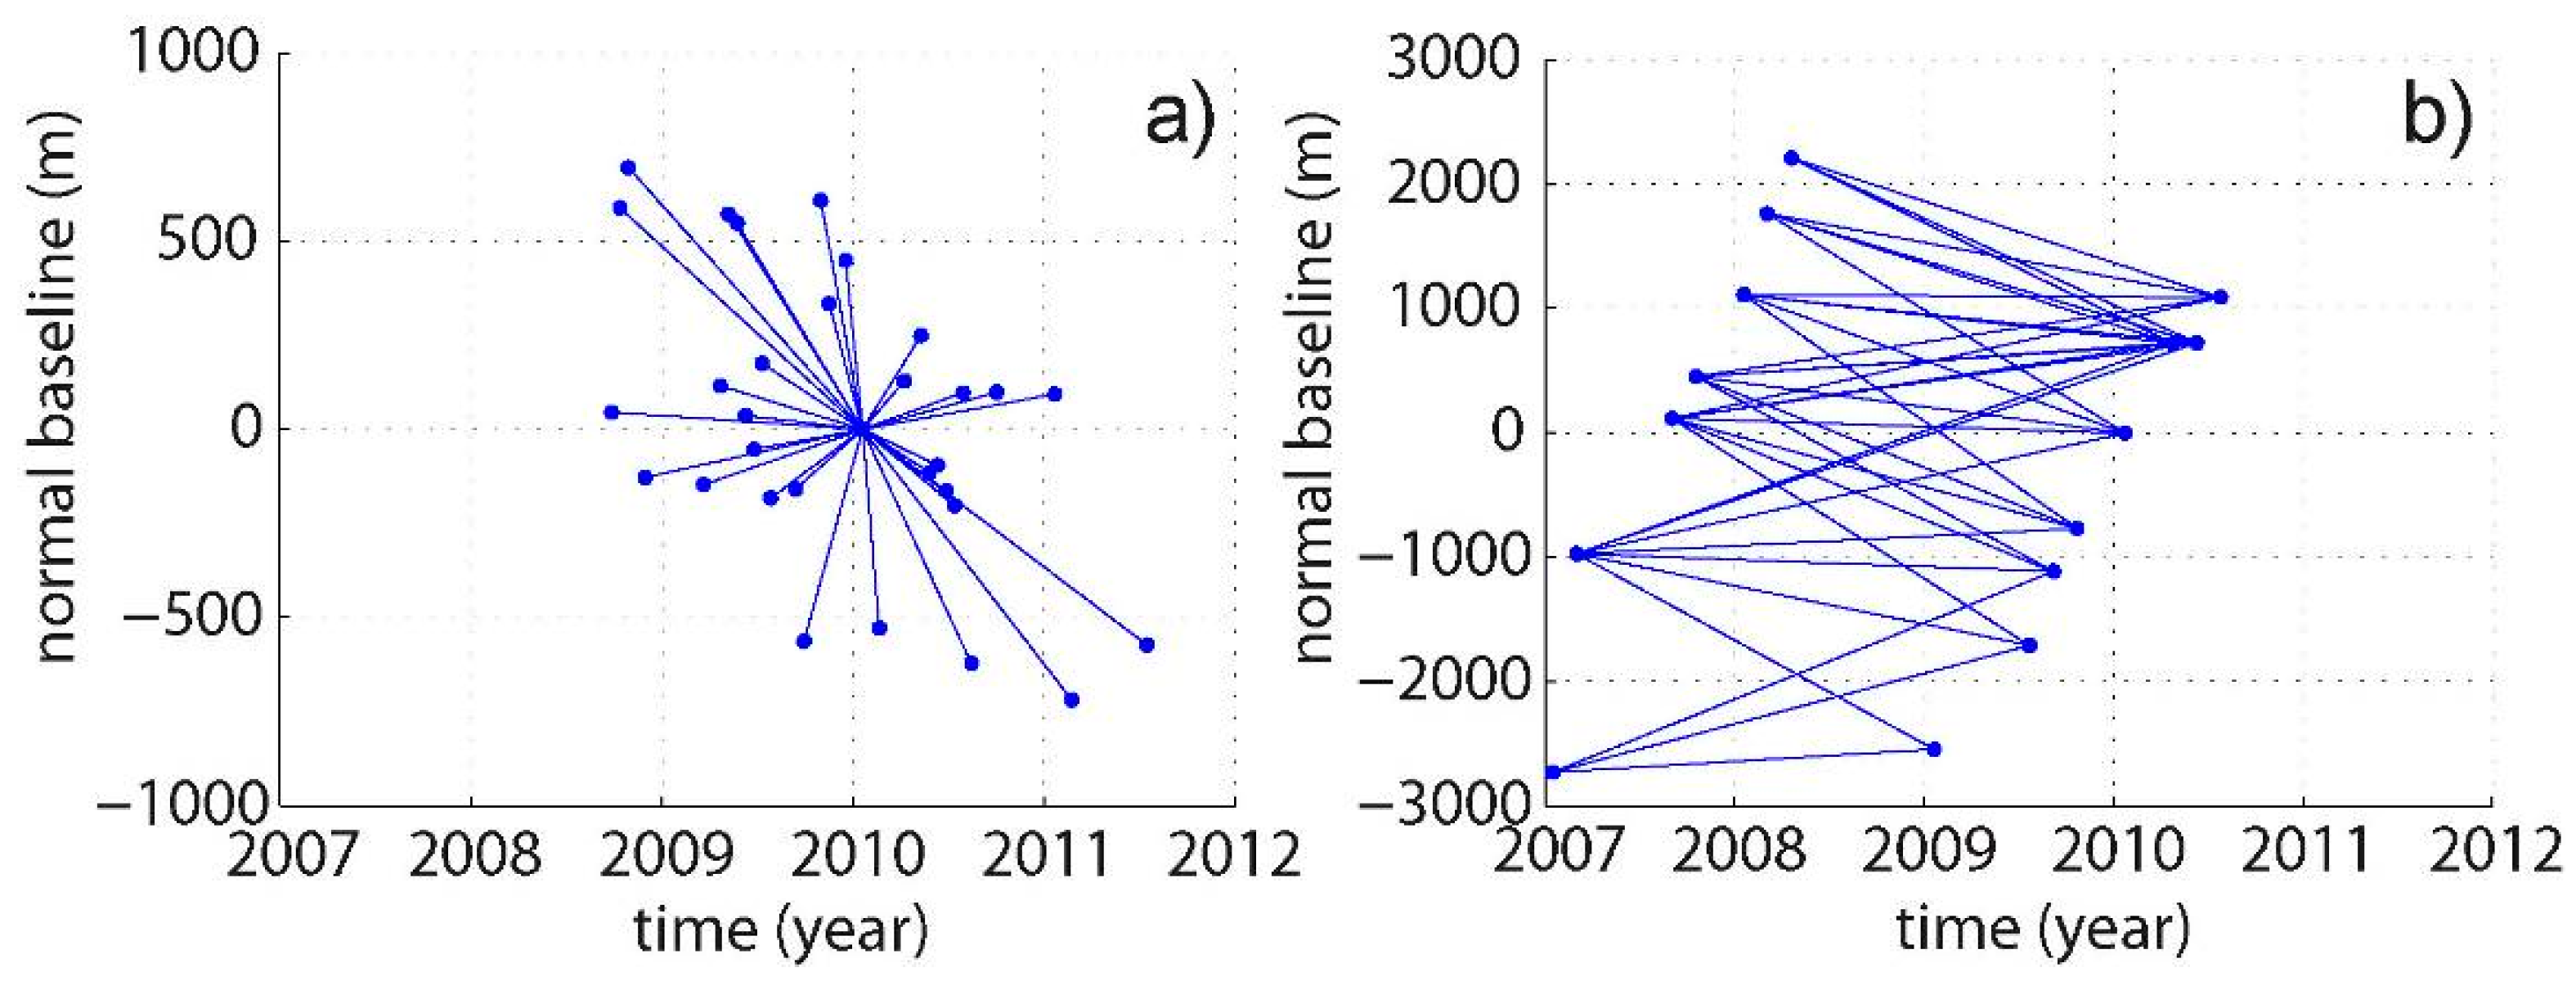
3.1. COSMO-SkyMed Persistent Scatterer Interferometry (PSI)

The Interferometric Point Target Analysis (IPTA) [8], a Persistent Scatterer Interferometry (PSI) implementation chain, is applied to the stack of COSMO-SkyMed images as described in [10]. The selection of candidate point targets is based on a temporal mean-to-standard deviation ratio of the co-registered SAR intensity images above 1.4 and a spectral correlation averaged over the single-look complex stack of more than 0.4. For the initial topographic estimation, and later on for terrain geocoding, the SRTM heights are considered [37]. An initial two-dimensional linear regression is applied on the candidate point targets to solve simultaneously for the height corrections and deformation rate of a point relative to another point after solving the 2π phase ambiguity in the temporal domain. Only pairs of points with a regression standard deviation of less than 0.9 are retained. Neighboring patches with a dimension of a few hundreds of meters are iteratively used. After this initial interferometric step, phase unwrapping errors are corrected on the spatial domain using a minimum cost-flow algorithm for sparse data. Then, with consideration of the initial height and deformation estimates, the residual phase images containing the atmospheric phase, nonlinear deformation, and error terms, are interpolated to the initial list of point targets. Two-dimensional linear regression with respect to height and deformation rate is iterated various times with reference to a point near the Rialto Bridge in Venice in order to include as many points as possible, because the quality of potential additional points can be evaluated more reliably if the improved model for the validated points is available. At the last stage, points with a regression standard deviation of less than 1.0 rad are considered. The discrimination of atmospheric phase, non-linear deformation, and error terms is based on their differing spatial and temporal dependencies. The atmospheric path delay is assumed to be correlated on a spatial window of about 500 m size, but independent from pass to pass. The non-linear deformation is assumed to be temporally correlated and a 1000 days filter was applied in this case. The phase noise is random in both spatial and temporal dimensions. IPTA-derived deformation measurements are finally interpreted for a number of point radar-bright and radar-phase-stable targets (point targets, PTs) that are coherent over the entire time interval and cover the monitored area as a sparse “natural” benchmark net.

3.2. Short-Baseline SAR Interferometry of ALOS PALSAR

In consideration of the limited number of available acquisitions, a short-baseline SAR interferometric approach (SBAS) [27] was applied for processing the ALOS PALSAR data using the GAMMA commercial InSAR processing software. In total, 36 interferograms with perpendicular baseline values between −2000 and 2000 m and a time interval between 600 and 1200 days (Figure 2b) were computed with four looks in range and eight looks in azimuth from the co-registered single-look complex images all oversampled at 14 MHz bandwidth. Consistently with the IPTA investigation, the SRTM heights [37] were used for topographic estimation and terrain geocoding. Baseline refinement based on the fringe rates was necessary in order to improve for the limited precision of the orbital data. Ionospheric phase corrections using split-beam interferometry [38] was required only for the image pairs containing the acquisition of 10 June 2010. Tropospheric correction was accomplished by removing a height-dependent phase term and subsequent low-pass filtering with a size of about 15 km. Phase unwrapping to retrieve surface displacement was performed after adaptive phase filtering [39] for coherent points. The coherence mask was prepared considering three criteria:
  • Regions with a spatial coherence higher than 0.18 computed on the raw interferogram;
  • areas with a spatial coherence higher than 0.88 computed on the filtered interferograms; and
  • pixels with a standard deviation below 0.8 computed with a temporal least-square model regression on candidate PTs selected based on a temporal mean-to-standard deviation ratio of the co-registered SAR intensity images above 1.8 and a spectral correlation averaged over the single look complex stack of more than 0.38.
With this approach, subsidence information is also retrieved over single structures, which would not be detected by spatial coherence alone. Finally, stacking [40] of the 36 unwrapped differential phase images was employed to estimate the mean subsidence rate over the time period 2007–2010 with respect to a reference point near the Rialto Bridge in Venice. No time series of surface subsidence were retrieved with ALOS-PALSAR data.

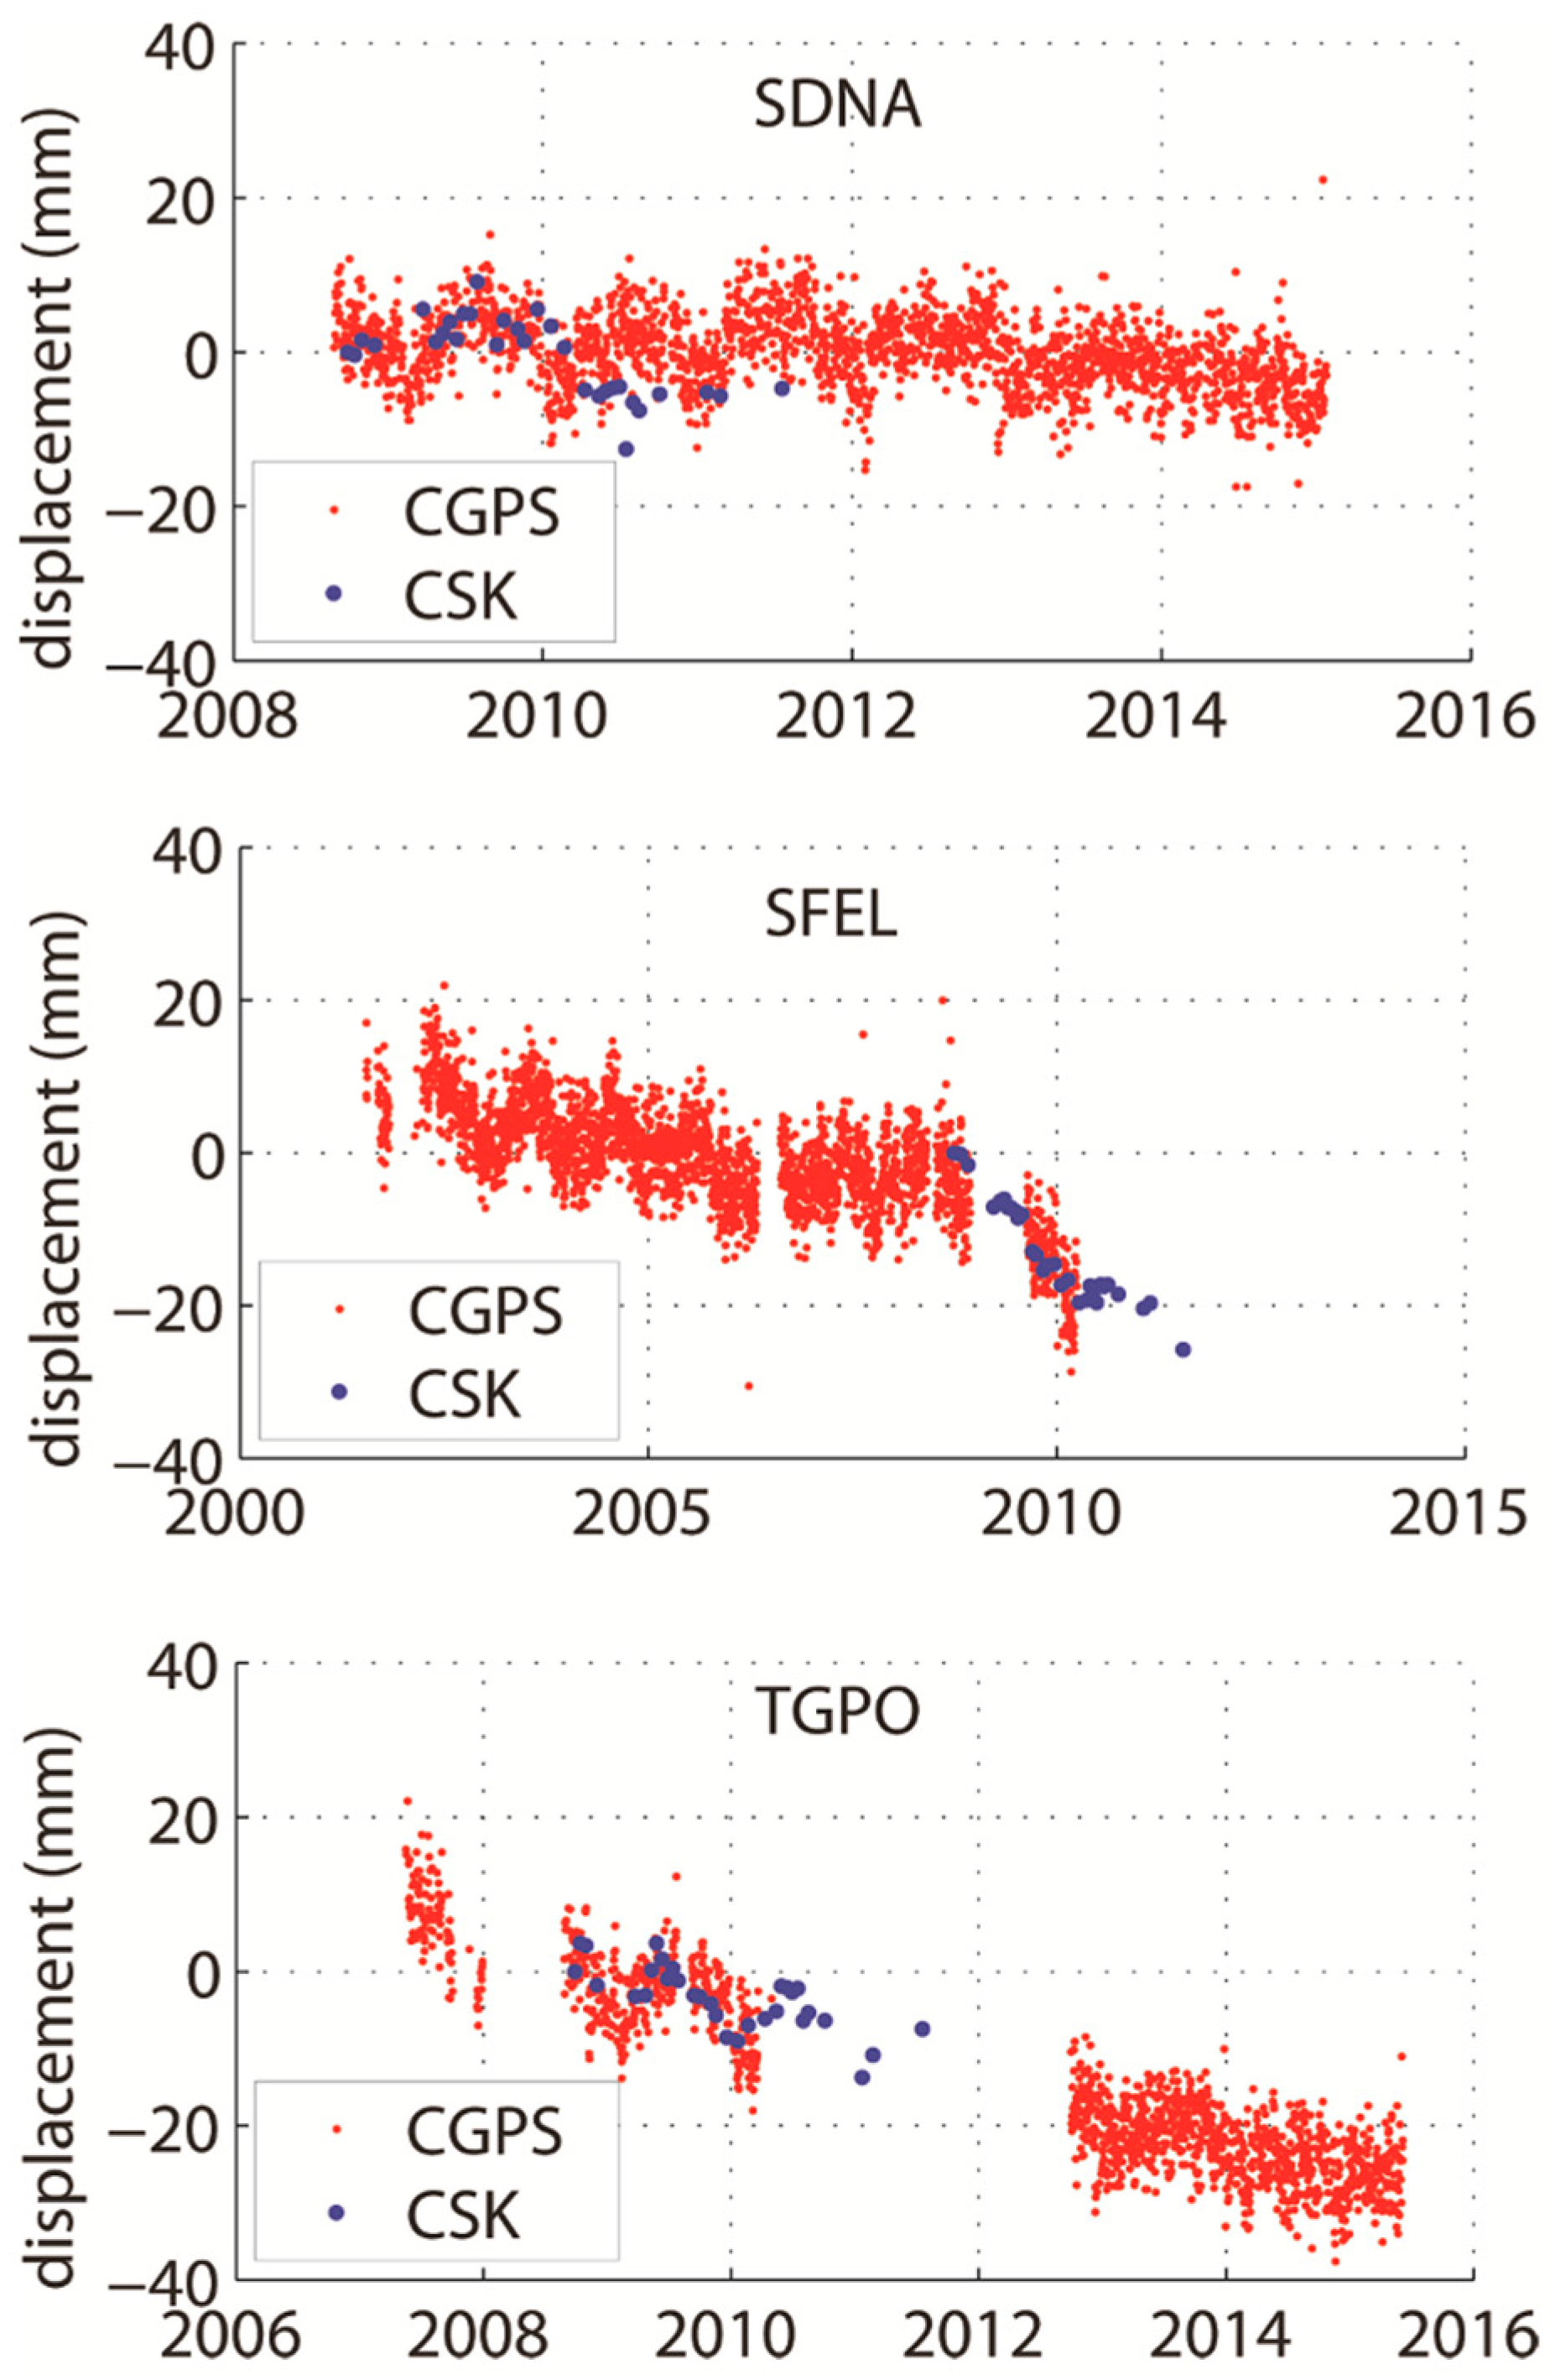
3.3. Calibration and Validation

X-band and L-band interferometric solutions have been calibrated using the ground velocities recorded by the CGPS stations (ODEZ, VEN1, PTO1 and TRVS, VEN1, PTO1) to mitigate the so-called flattening problem, i.e., the slight phase tilt resulting by the inaccuracy in estimation of the orbital baseline due to the not perfect knowledge of the satellite positions [14,41]. We have preferred to use TRVS instead of ODEZ for ALOS-PALSAR as the time period of the former superposes with the interferometric time interval. Conversely, TRVS cannot to be used for COSMO-SkyMed calibration as its position is close to the frame boundary (Figure 1). SAR interferometry provides land displacements along the line-of-sight (LOS) between the satellite and the targets. Since SAR provides relative displacements and we are interested in the absolute movements along the vertical direction only, we defined a local reference frame based on TRVS GPS that is located outside the lagoon and the most subsiding coastland. This is simply accomplished by removing the average of its horizontal components in the north and in the east directions from all the other GPS stations (Table 1), while the vertical components were unchanged. In order to refer the GPS and SAR motions to the same frame, we projected the three-dimensional GPS vectors in the local reference system into the SAR LOS using the relationship:
GPS LOS = sin ( θ ) cos ( φ ) E + sin ( θ ) sin ( φ ) N + cos ( θ ) U P
where θ and φ are the ground track and incidence angle, respectively.
Notice that the differential component of the horizontal displacement rate perpendicular to the COSMO-SkyMed and ALOS-PALSAR inclination orbits is much smaller than the vertical displacement rate. Moreover, the difference in the GPS displacement projected along the LOS of the two satellites is also very small (less than 1 mm/yr). Finally, note that in our results the difference between the LOS and the vertical components of the movement (about 20% and 18% for COSMO-SkyMed and ALOS-PALSAR, respectively, i.e., less than 1 mm/yr for the large majority of the PTs) is also usually negligible.
The validation of the two SAR-based calibrated datasets has been performed using the CGPS stations not accounted for in the calibration phase.

3.4. COSMO-SkyMed and ALOS-PALSAR Integration

The integration of the two SAR results can significantly improve the knowledge of the land displacements along the PDV. The synergic use of COSMO-SkyMed IPTA and ALOS-PALSAR SBAS is aimed at taking advantage of the different potentialities of the two sensors/processing chains, i.e.,:
  • The high accuracy of the displacements detected by X-band IPTA on even small-size anthropogenic structures scattered in the investigated area; and
  • the high temporal coherence over the long time of L-band SBAS allowing for evaluating land displacements over natural environments, such as marshlands and crop-fields located in the investigated area.
The integration processing has been performed differently depending on the scale of investigation. At the regional scale, i.e., at the scale of the whole study area, the two datasets have been simply jointed and interpolated using the Kriging method [42] on a 100-m regular grid. The measurement points with a distance less than 20 m are averaged before their use in the gridding computation. The impressive large number of monitoring points, which amounts, globally, to more than 10 million, does not allow for a much sophisticated processing. A nugget effect of the order of 0.7 mm/yr, as suggested by the experimental variogram, has been used to filter out local large variability. At the local scale, i.e., at a scale of few km2, where the PTs/pixels can be managed manually, the strategy we developed can be divided into the following steps: (1) superposition of the X-band PTs and the L-band pixels on a common map; (2) removal of the L-band pixels which are located at a distance less than 10 m, i.e., the characteristic dimension of the L-band pixel, from a PT on account of the highest accuracy of X-band derived information; (3) built-up of a unique “improved” dataset and its interpolation using the Kriging method [42] on a 10-m regular grid.

4. Results and Discussion

4.1. Outcome from the Calibration-Validation Procedure

The vertical ground velocity of the CGPS and the LOS velocity before and after the calibration are shown in Table 2 and Table 3.
The maps of the average land displacements in the PDV region obtained by IPTA on COSMO-SkyMed images and SBAS on ALOS-PALSAR images are shown in Figure 3. An impressive number of 4,703,210 point targets with a density of ~427 points/km2 and 5,901,189 coherent pixels with a density of ~909 points/km2 have been obtained within the COSMO-SkyMed and ALOS-PALSAR frames, respectively.
Concerning COSMO-SkyMed, Figure 4 compares the displacement time series obtained from the CGPS and a PT located in the station surroundings. Table 4 shows the satisfactory match between the CGPS vertical velocity and the calibrated velocity of the ALOS-PALSAR SBAS solution close to the CGPS stations.
The maps of the average land displacements in the PDV region obtained by IPTA on COSMO-SkyMed images and SBAS on ALOS-PALSAR images are shown in Figure 3. An impressive number of 4,703,210 point targets with a density of ~427 points/km2 and 5,901,189 coherent pixels with a density of ~909 points/km2 have been obtained within the COSMO-SkyMed and ALOS-PALSAR frames, respectively.
Concerning COSMO-SkyMed, Figure 4 compares the displacement time series obtained from the CGPS and a PT located in the station surroundings. Table 4 shows the satisfactory match between the CGPS vertical velocity and the calibrated velocity of the ALOS-PALSAR SBAS solution close to the CGPS stations. Finally, the calibrated COSMO-SkyMed and ALOS-PALSAR outcomes have been cross-validated. The two SAR solutions, in term of average velocity, have been compared and check for consistency in the area covered by both the satellites. Table 5 summarizes the results for the representative sites highlighted in Figure 3. The values point out that the SAR results from the two solutions are characterized by comparable rates in the whole coastal zone. Notice that, although the average rates are similar, the standard deviations are quite different, with those computed from COSMO-SkyMed always larger than those derived from ALOS-PALSAR. This difference is due to both the different interferometric algorithms used to process the image stacks and the characteristics of the images itself.

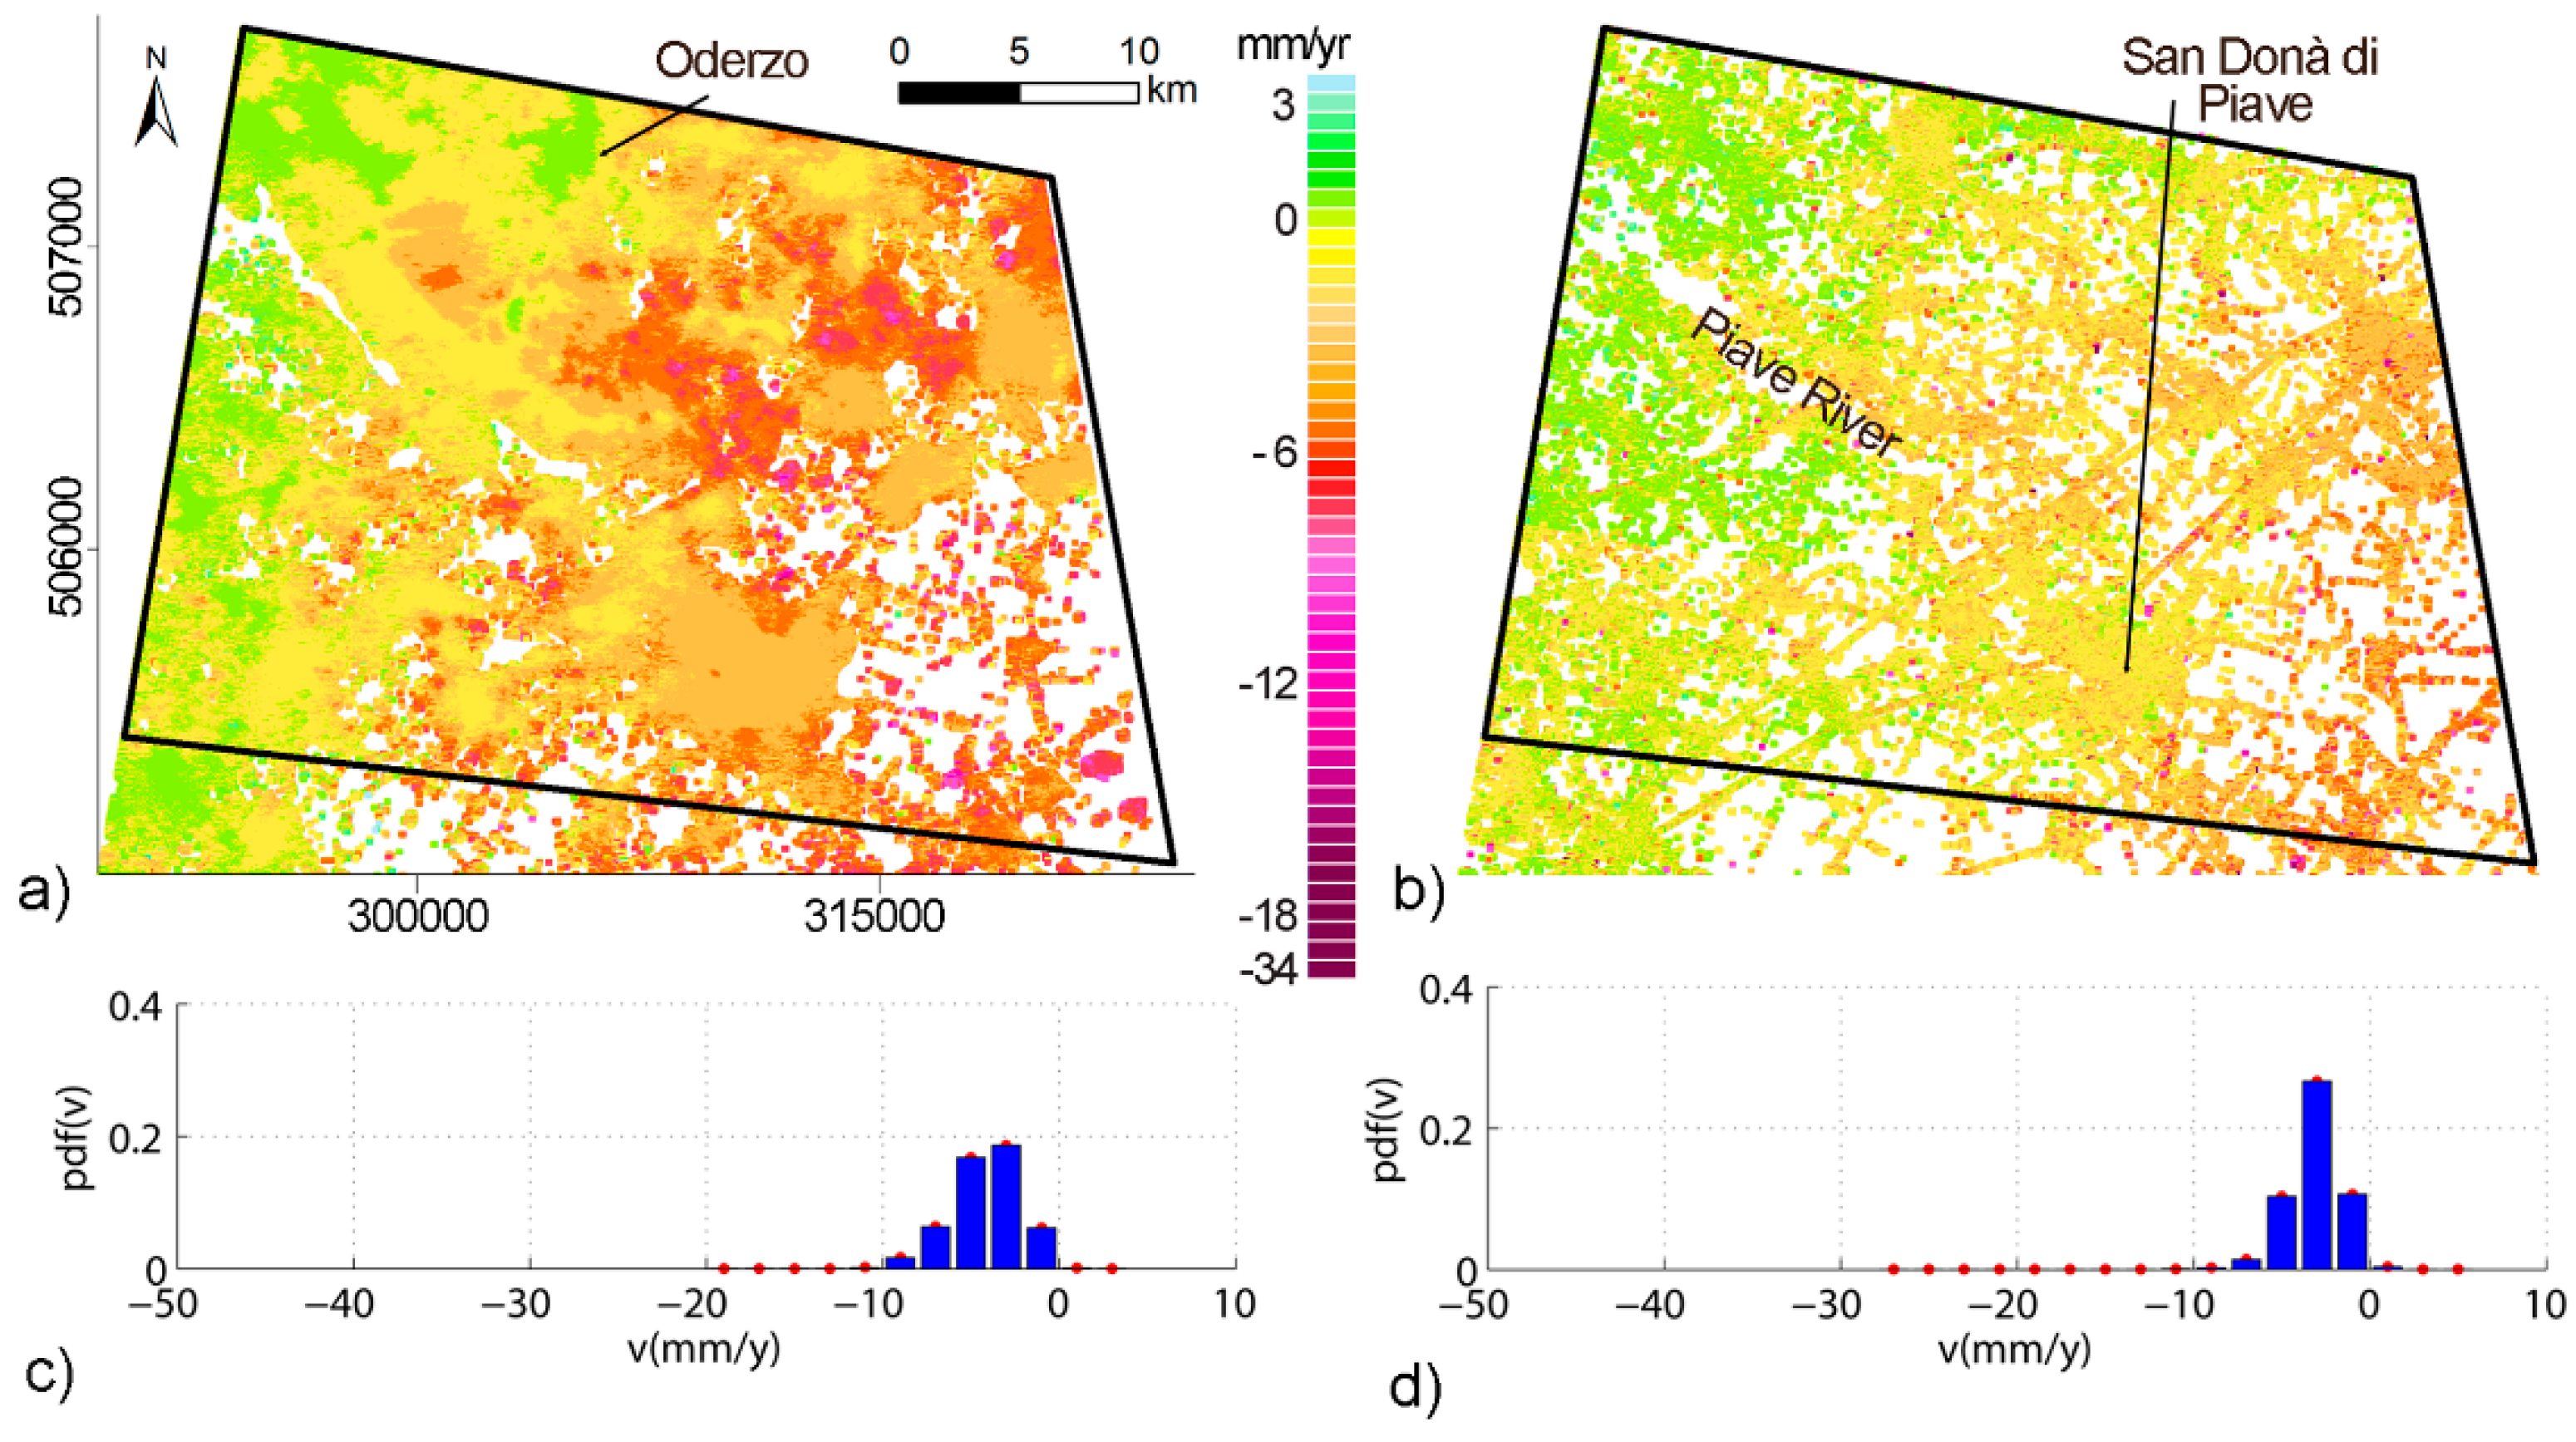
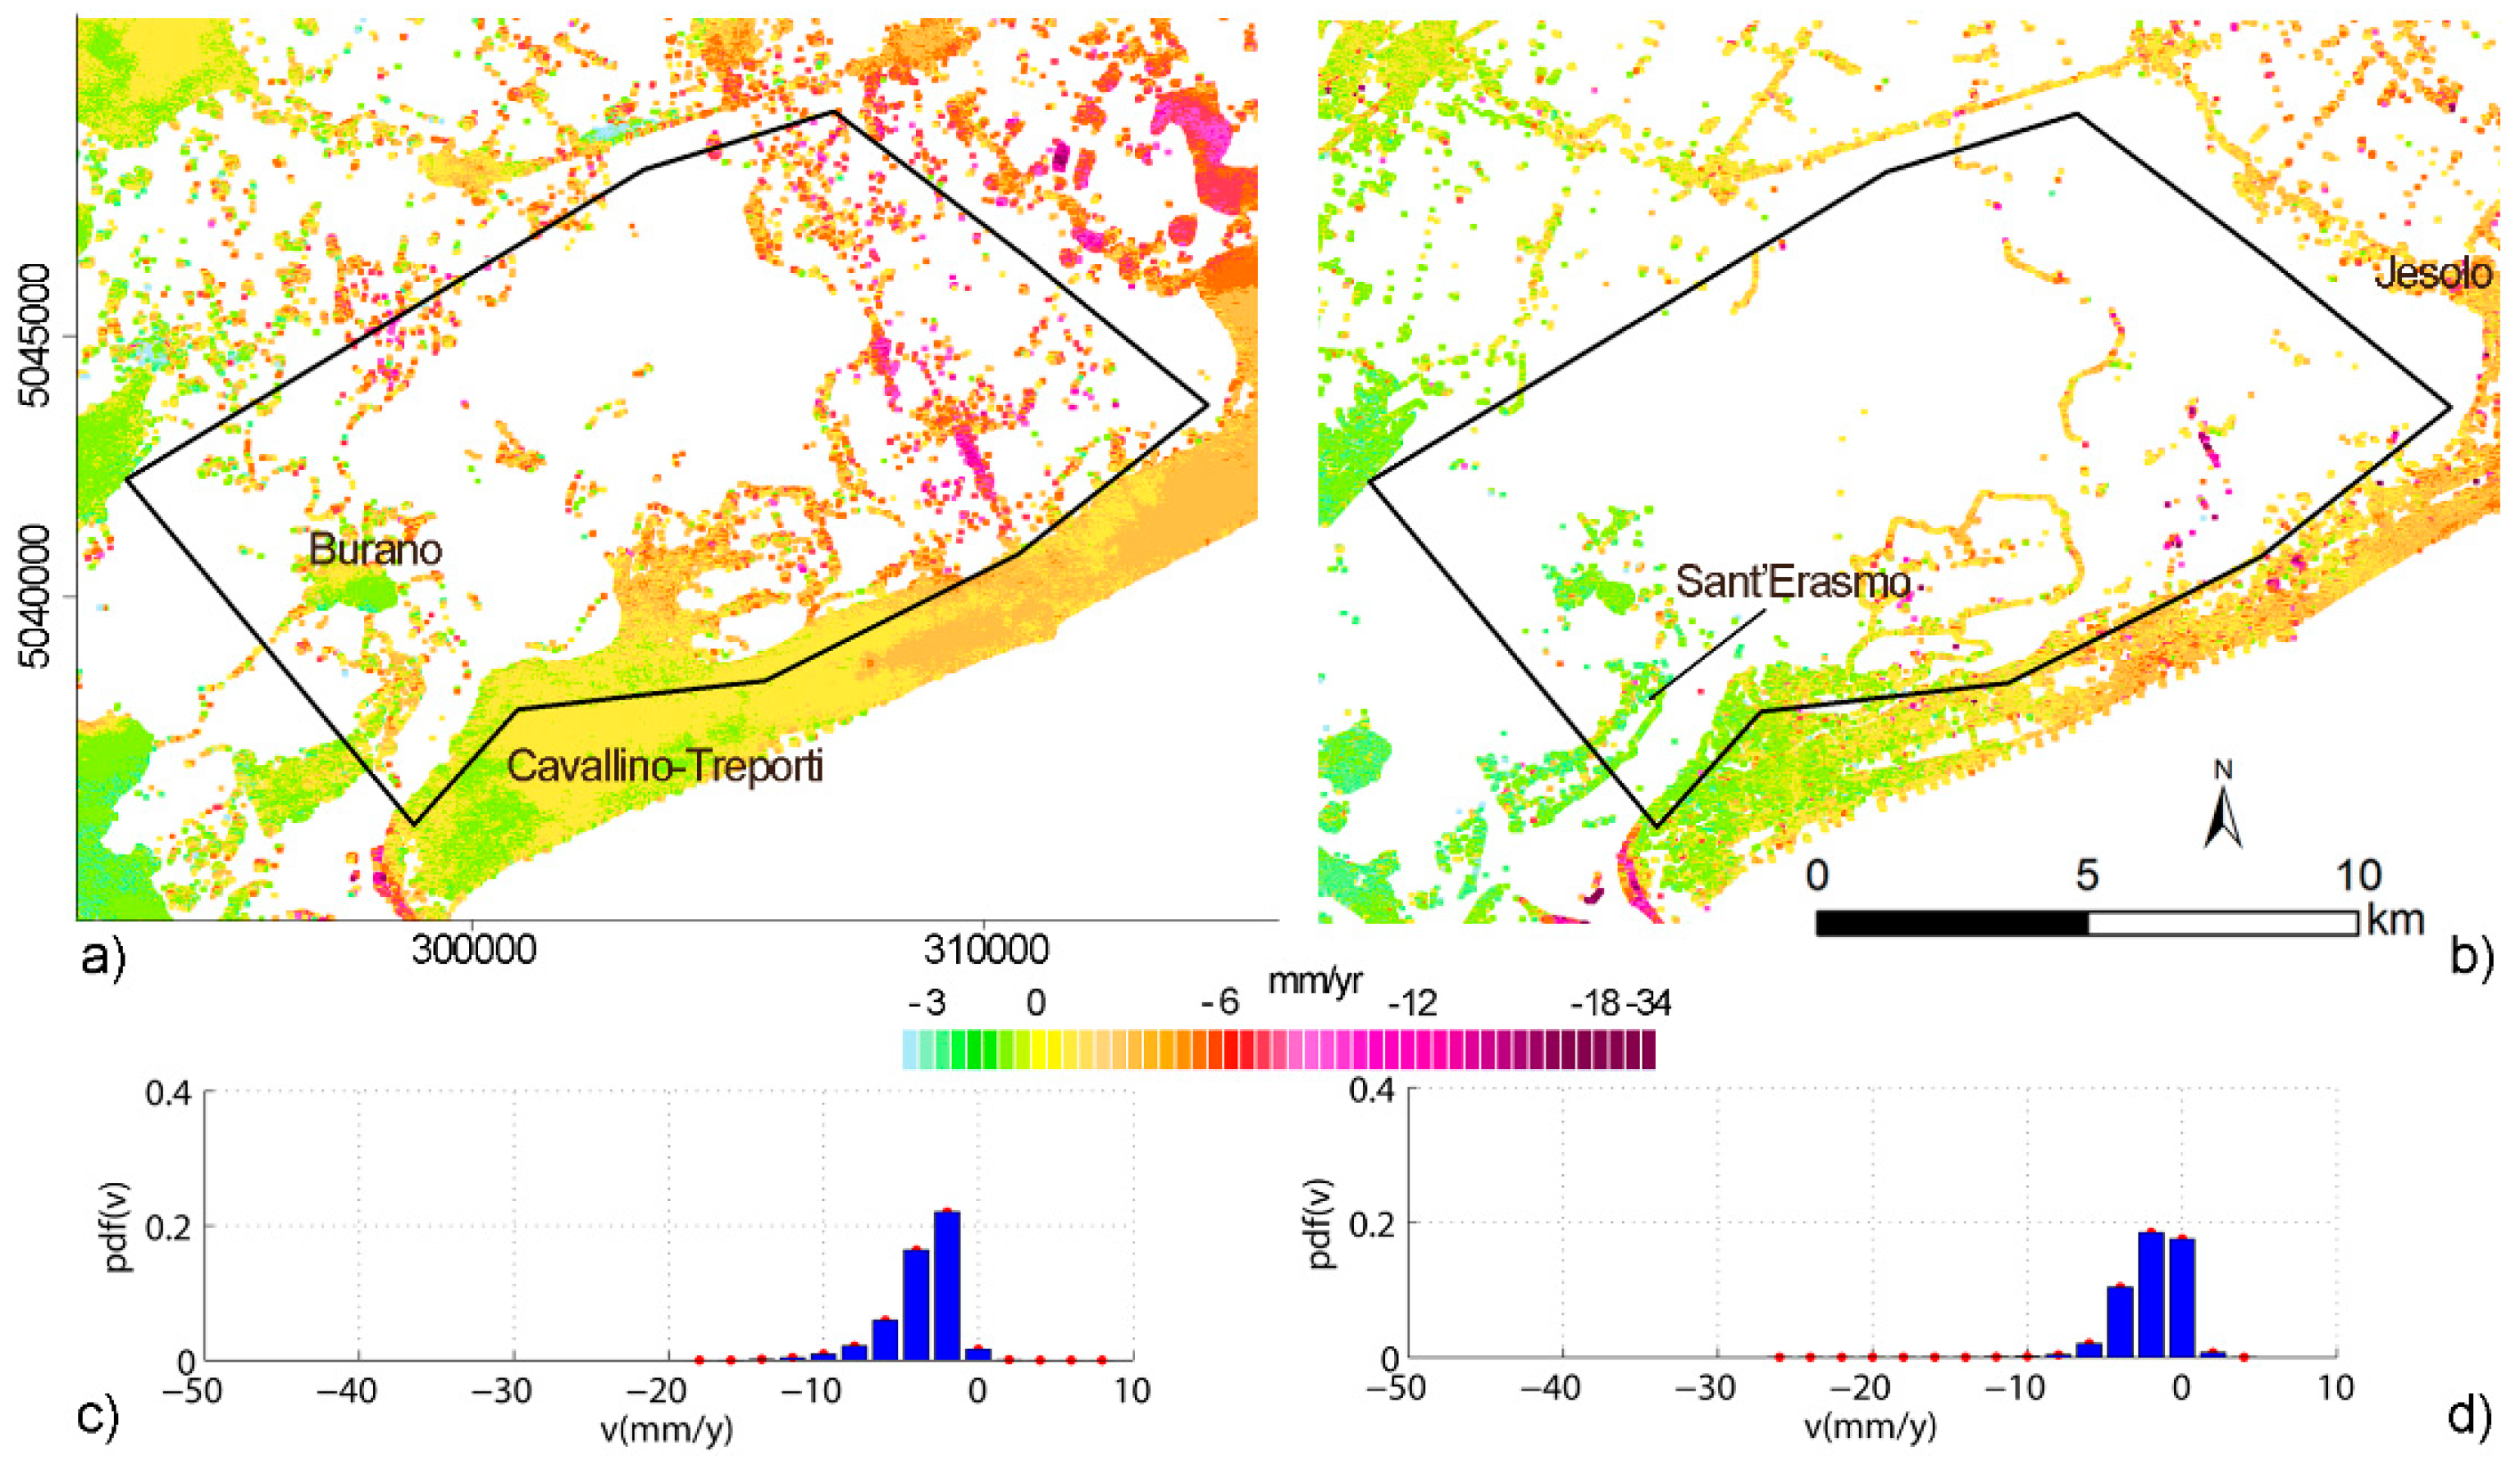
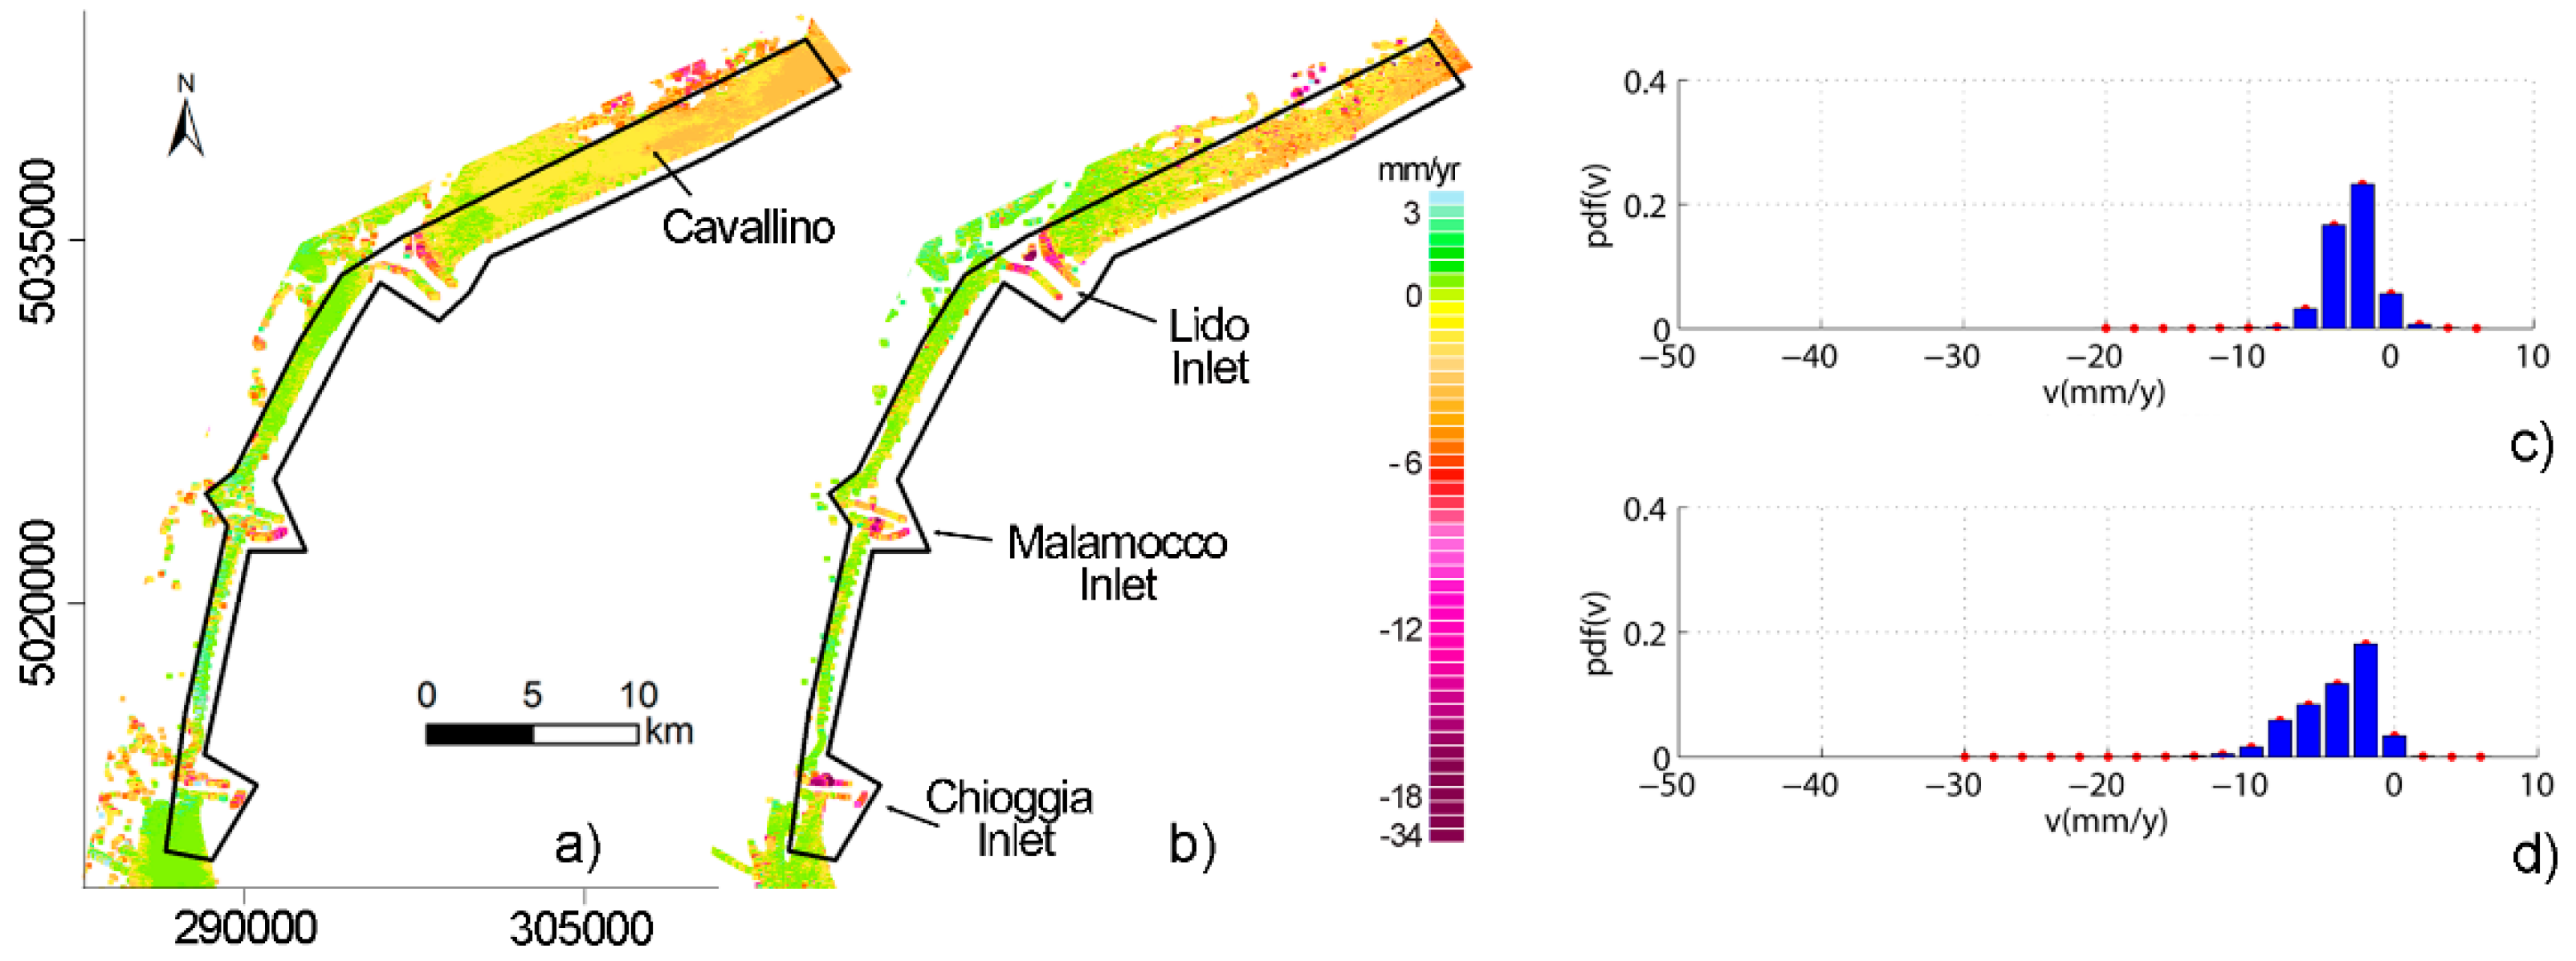
4.2. Comparison of L- and X-Band Results

In this section the results obtained by the L- and X-band interferometric analyses are presented separately, highlighting the similarities and peculiarities of the two datasets. Considering the high variability of the ground velocities and the different physiographic characteristics of the PDV region, the analysis has been distinguished for the northern mainland, the northern and the southern lagoon, the littoral strips, and the Po Delta. Each sub-region has been characterized by the probability density functions pdf(v) of the measured displacement rates.
Figure 5 summarized the SAR outcome for the mainland to the north of the Venice Lagoon, which is characterized by the main settlement of San Donà di Piave and an extensive farmland, partially located below the mean sea level and crossed by a dense distribution of transportation and reclamation infrastructures, farmhouses, small villages, and industrial centers. Due to this, both the satellites and SAR analyses detect a large number of monitoring points, amounting to about 950 pixels/km2 with ALOS-PALSAR (SBAS) and about 740 PTs/km2 with COSMO-SkyMed (IPTA). The mode of the ground velocity pdf(v) distribution is the same for the two satellites and equal to −3 mm/yr (Figure 5c,d).
ALOS-PALSAR detects a negative tail slightly more asymmetrical than the picked one detected by COSMO-SkyMed, but the largest subsidence rates, up to 25 mm/yr, are measured by IPTA. The two analyses agree in showing a subsidence that increases moving south-eastward, i.e., toward the Adriatic coast, with regional displacement values from 0 to the north-west to −5 mm/yr to the south-east.
However, the largest values are measured in the inner mainland and usually correspond to different targets, depending on the L-band or X-band processing. With the latter, very high localized displacement rates (from −15 to −20 mm/yr) relate to local structures/infrastructure recently built-up; with the former large zone of displacements ranging from −7 to −10 mm/yr are located in the farmland that, being reclaimed in the last centuries, is characterized by a high fraction of organic soils which oxidize in response to drainage and crop practices, e.g., tillage and plowing [16,43]. It is interesting to note how these zones usually correspond to the areas where the PT density obtained by COSMO-SkyMed is small.
In the northern sector of the Venice Lagoon (Figure 6), ALOS-PALSAR (SBAS) and COSMO-SkyMed (IPTA) perform quite differently in terms of measurement distribution. A large number of monitoring points have been detected by ALOS-PALSAR on salt marshes and intertidal environments, where no structures are established and COSMO-SkyMed is almost useless. The capability of the L-band to penetrate the halophytic vegetation grown on the tidal marshlands and provide subsidence measurements (on the range of 5 to 10 mm/yr) for these lagoon features is evident (Figure 6a). This information assumes a key role in evaluating the conditions under which ecogeomorphic feedbacks allow coastal wetlands to adapt to the present and projected changes in relative sea level [44,45]. COSMO-SkyMed mainly restricts its efficiency in providing information on the walled embankments of fish-farms that occupy the northernmost sector of the lagoon (Figure 6b). Due to the large areal extent of inner waters, in this zone the areal density of measured pixels/PTs reduces to about 150 points/km2 with both the satellites. The two pdf(v) distributions have the same mode (−2 mm/yr), with COSMO-SkyMed that is characterized by a significant frequency at 0 mm/yr and ALOS-PALSAR by a more negative skewed tail. Therefore, IPTA reveals that old and/or relatively deep-founded structures (no constructions have been established in this area over the last 50 years) are relative stable, while SBAS highlights that shallow subsidence, i.e., the subsidence characterizing the natural lagoon environments, is here a main fraction of the total subsidence.
At the regional scale land subsidence increases, moving from the almost stable zone of Burano and Sant'Erasmo islands toward the northern tip of the lagoon, confirming a trend already observed in the last two decades [10,15,33].
Very few monitoring points are detected from both ALOS-PALSAR and, especially, COSMO-SkyMed in the central and southern portions of the Venice Lagoon (Figure 7), with a spatial data density of ~14 points/km2. However, as already highlighted for the northern lagoon, the L-band acquisitions allow monitoring the movement of the margins of the Cassa di Colmata (i.e., the artificial islands built up in the late 1960s with the material dredged from the Malamocco-Marghera Canal) to the north-west and the “briccole” (i.e., the Venetian wood posts located along the main lagoon canals), or very shallow (about −0.2 m below msl) tidal flats, or wood fish-houses and mussel-farming nets located along the sides of the Spignon, Valgrande, Perognola, and Novissimo Canals to the south of the Malamocco inlet. ALOS-PALSAR reveals a highly variable subsidence range (the pdf(v) is characterized by an almost equal frequency for the 0, −2, and −4 mm/yr classes) while the COSMO-SkyMed pdf(v) is very narrow with a mode equal to 0 mm/yr, highlighting the stability of the small islands detectable by the X-band satellite.
Focusing on the littoral strips of the lagoon (Figure 8), the two satellites provide comparable information. The southern and central strips are almost stable, with the northern one having experienced a subsidence rate increasing from 0 to 2–3 mm/yr moving from the Lido inlet, northward. The largest displacements, up to −40 mm/yr, are localized at the three inlets of the lagoon, where the MoSE structures under construction or reinforcement produce large consolidation of the shallow lagoon deposits, which are mainly constituted by unconsolidated sand, due to the structure load [12]. The pdf(v) of the two SAR-based datasets present similar, quite narrow shapes confirming that in this highlight urbanized environments the two satellites are able to intercept almost similar structures on the ground. However, notice that the maximum subsidence rates provided by IPTA almost double those detected by SBAS due to the spatial filtering of this latter approach. ALOS-PALSAR detects about 670 pixels/km2 and COSMO-SkyMed about 1900 PTs/km2.
In the Po Delta region (Figure 9), the outcome from ALOS-PALSAR SBAS is characterized by a pixel density that almost doubles that of the PTs detected by IPTA using COSMO-SkyMed images (almost 300 points/km2 for the former and 150 PTs/km2 for the latter). In this zone the pdf(v) of the ground vertical movements obtained by the two satellite are comparable. Considerations similar to those reported for the northern mainland hold in the Po Delta area as well. This portion of the coastal zone is also characterized by large farmlands, a couple of main villages (Porto Tolle and Porto Viro), and a number of isolated houses and reclamation infrastructures used to keep dry a territory whose elevation ranges between −2 and −4 m above msl. The L-band processing provides a large number of information in several rural zones and crop fields where the X-band failed to detect measuring radar targets. Conversely, very detailed measurements are provided by the X-band analysis along the embankments bounding the Po River trenches, the several lagoons and fish-farms located along the outer part of the deltaic area. Confirming the outcome provided by [11] using ERS images, at the regional scale the subsidence rates increase from the stable westernmost side of the area, which is constituted by a coarse-grained, wave-dominated paleo-beach system, toward the eastern tip of the delta, which developed very fast over the last 500 years and is mainly composed by unconsolidated, highly-compressible, thick prodelta muds.
Finally, three exemplifying areas have been selected to highlight the complementarity of the ALOS-PALSAR and COSMO-SkyMed datasets at a more local scale than above: a first one in the northern lagoon of Venice and the nearby farmland, the second zone at the southern edge of the Venice Lagoon, which includes the city of Chioggia, and the last one corresponding to the central sector of the Po River Delta (Figure 10). In general, the ground velocities obtained from the X- and L-band are similar where the two datasets overlapped, although a certain difference occurs in some zones. For instance, in the northern Venice Lagoon the ALOS-PALSAR results (Figure 10a) shows slightly higher velocities in the nearby of the urban center of Jesolo than those measured by COSMO-SkyMed (Figure 10b), or in the western Po Delta X-band rates (Figure 10f) are slightly higher than those detected by L-band (Figure 10e).
The X-band IPTA allows to measure a significant number of PTs along the main river and lagoon embankments and in urbanized areas, whereas only a few radar reflectors are detected inside the lagoon basin in correspondence of the salt marshes and in the farmland. The advantage of the L-band SBAS is clearly shown in the inner lagoons and in the crop fields where it detected a conspicuous number of data. Specifically, it is clear the capability of ALOS-PALSAR in measuring ground displacements ranging from −20 mm/yr to −15 mm/yr in a number of fields northwest of Jesolo and in the nearby of the lagoon margin (Figure 10a) and from −20 mm/yr to 1 mm/yr in the farm fields of the Po delta (Figure 10e). In the southern lagoon of Venice, L-band certainly provides a number of information into the lagoon basin, generally related to small fishing house, mooring posts and poles marking the border between the tidal flats and the navigation channels (Figure 10c). However, X-band is much more detailed and suitable for the more urbanized sectors, e.g., the inlet, the MoSE infrastructures, and the city of Chioggia (Figure 10d).

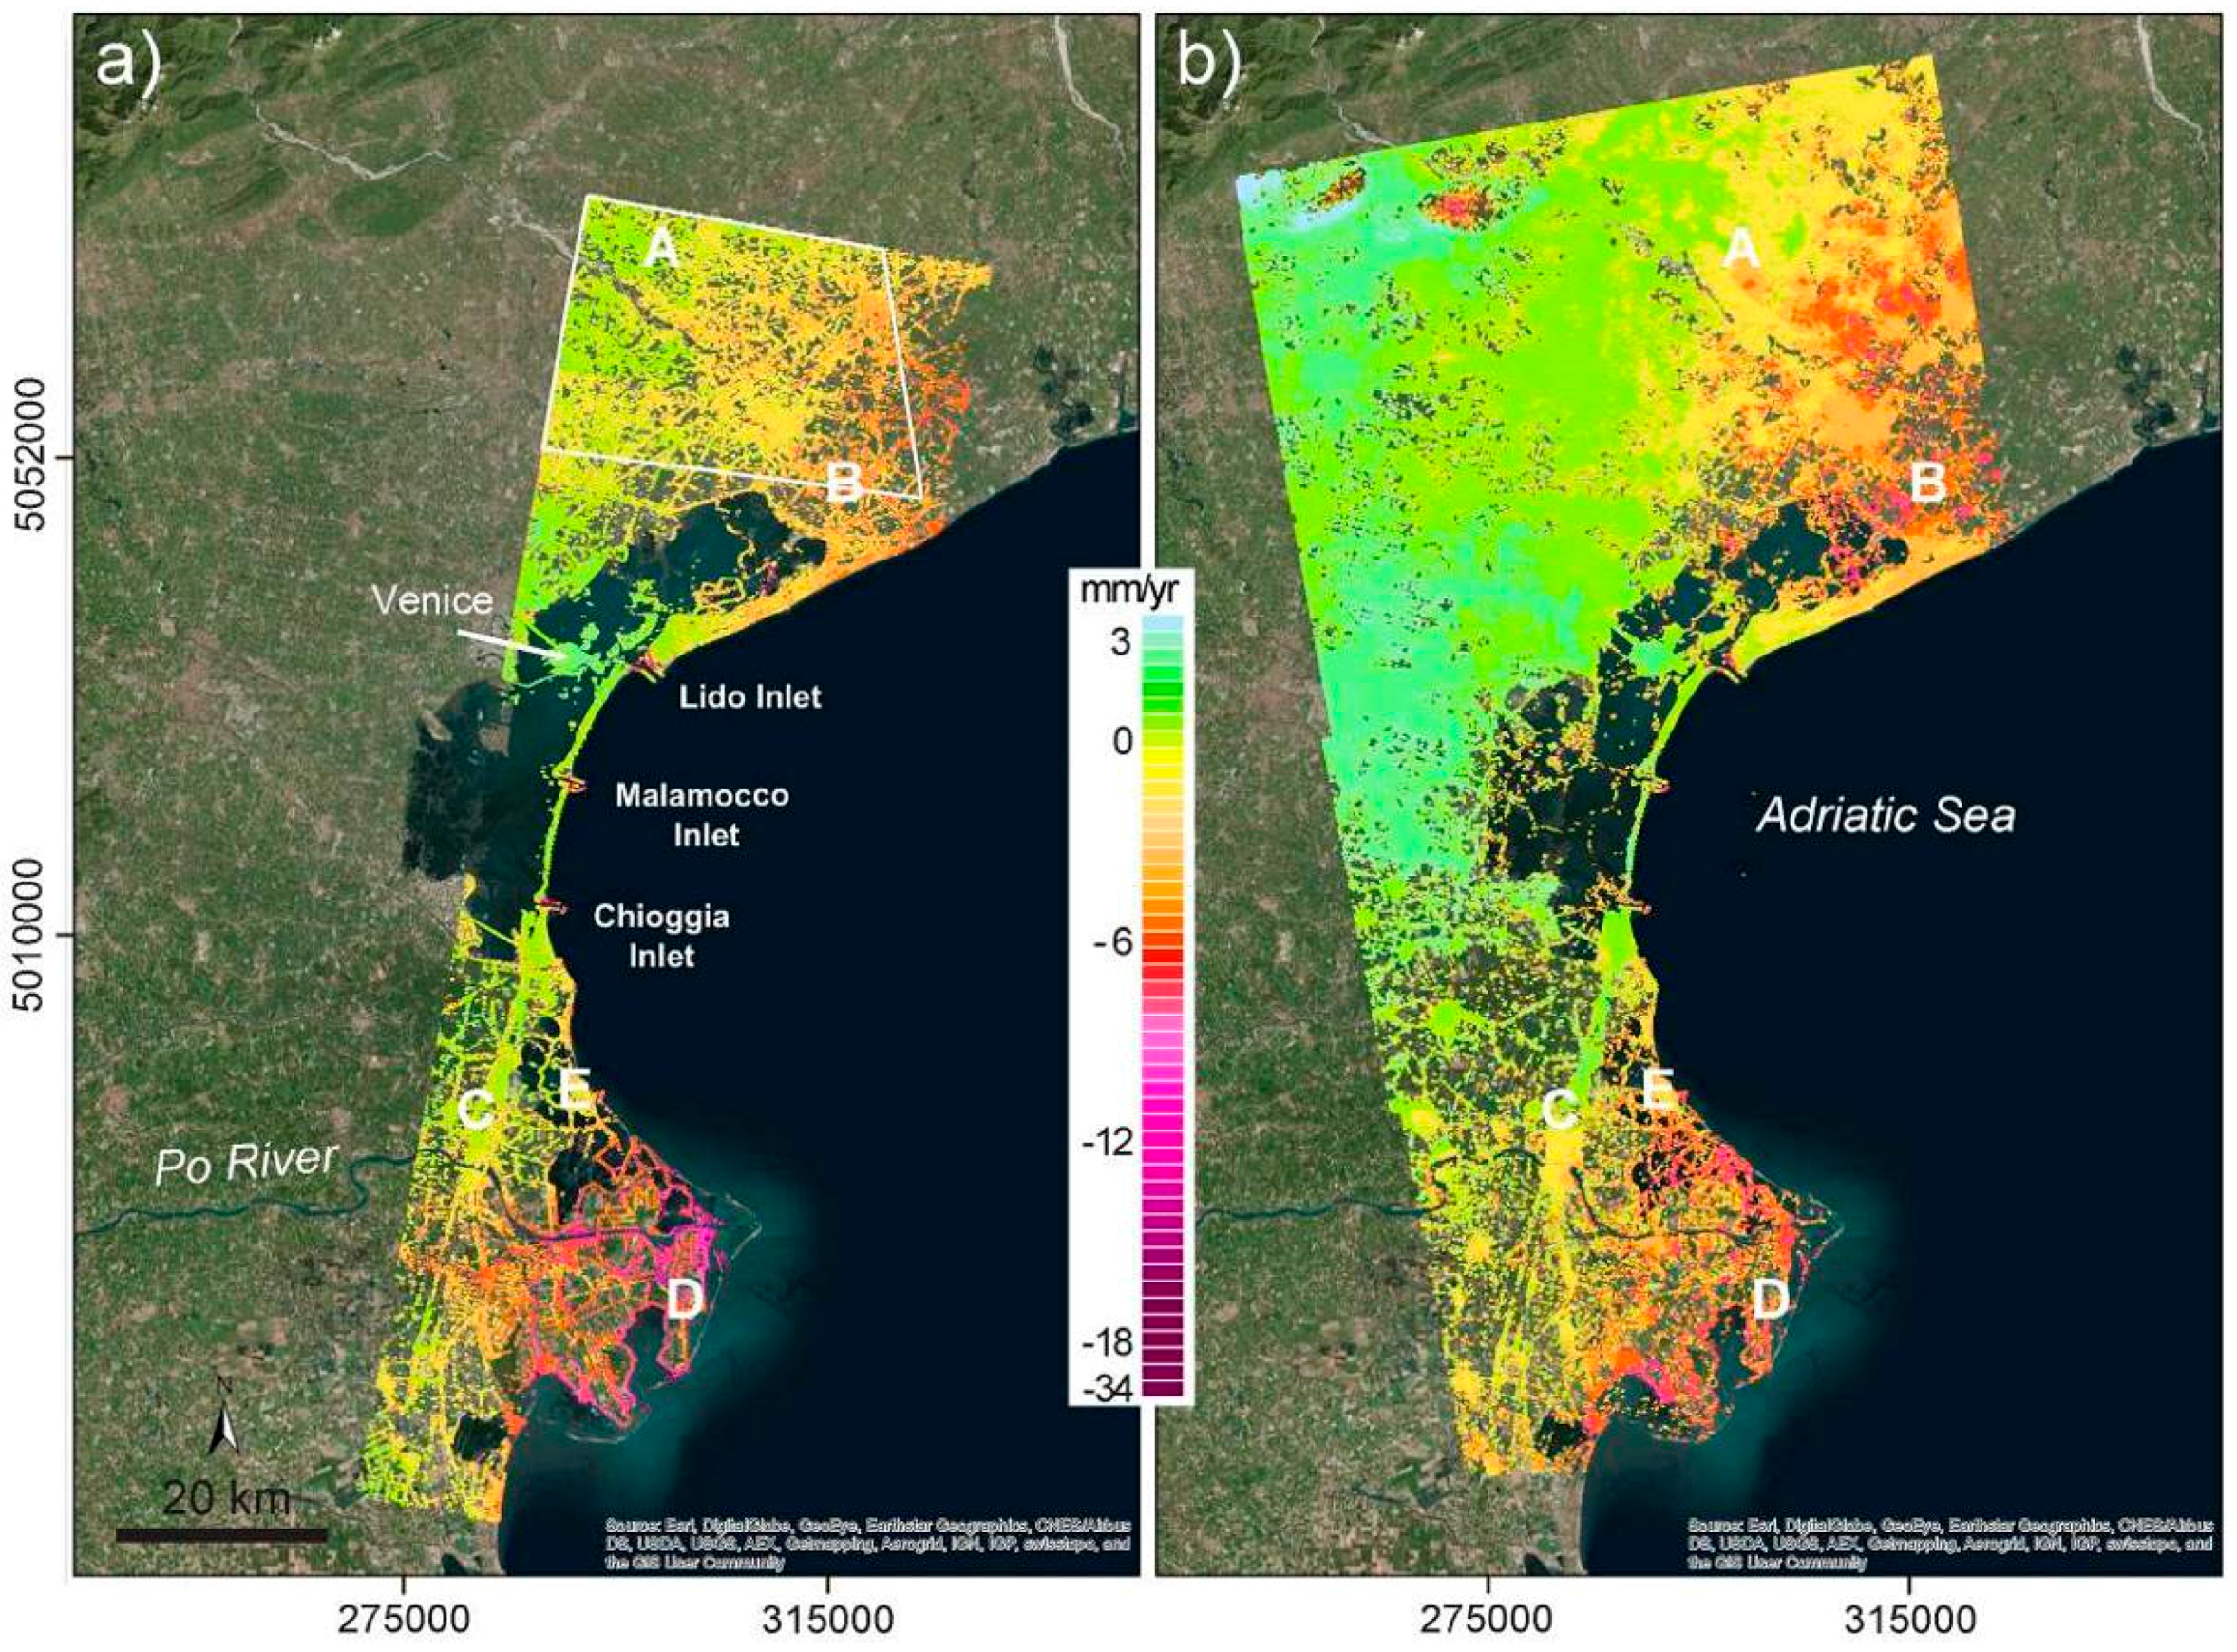
4.3. Multi-Band Combined Results

The L- and X-band datasets have been combined at the regional and local scales using the methodologies described in Section 3.4. The main goal is to gather together the best subsidence information in both the vegetated and constructed areas that can be extracted from the two satellites, respectively.
Figure 11 shows the maps of the average displacement rates obtained at the regional scale. With a relatively stable central and secondarily southern parts of the Venice Lagoon and the seriously sinking northern coastland and outer Po River Delta (from −5 to −15 mm/yr), the outcome confirms the results presented in previous studies [1,4,9,11,15].
However, the present multi-band combination reveals the detailed pattern of the subsidence characterizing the more natural and rural environments without losing the accuracy in quantifying the sinking of urban areas and infrastructures. Evident examples are the −3 to −5 mm/yr subsidence characterizing the central and southern basins of the Venice Lagoon on one hand, and the sinking constructions at the three inlets of the Venice Lagoon where the MoSE project is under realization on the other hand.
Table 6 compares the average velocities provided by the GPS stations along the LOS with the values obtained by each SAR processing and that obtained by the multi-band combined outcome. These latter are the rates at the 100-m cells of the interpolated grid (Figure 11) corresponding to the GPS locations.
As above, we have selected three local representative areas (Figure 12), shared in the two datasets, where the maximum is the contribution of the two bands. These are, primarily, natural or rural environments where the presence of low vegetation does not completely hinder the L-band monitoring capability and bounded or crossed by linear infrastructures, such as embankments and bridges, whose displacements can be measured with a great accuracy by X-band IPTA. The zones, whose areal extent ranges between 10 and 20 km2, correspond to the northern and southern tips of the Venice Lagoon and a central portion of the Po River Delta. The multi-panel Figure 12 is organized as follows: each line provides the various outcomes for a same area and each column shows the same outcome for the various areas. The first (Figure 12a–c) and the second (Figure 12d–f) column shows the outcomes obtained by the ALOS-PALSAR and COSMO-SkyMed, respectively, with the displacement of each pixel/PT that has been attributed to a circle of 250-m radius to highlight its visibility. Notice:
(1)
the complementarity of the two datasets in term of spatial distribution of the detected monitoring points with the X-band measurements manly placed along the boundaries of the selected zones (Figure 12d,f) or along the bridge that crosses the southern lagoon (Figure 12e); and
(2)
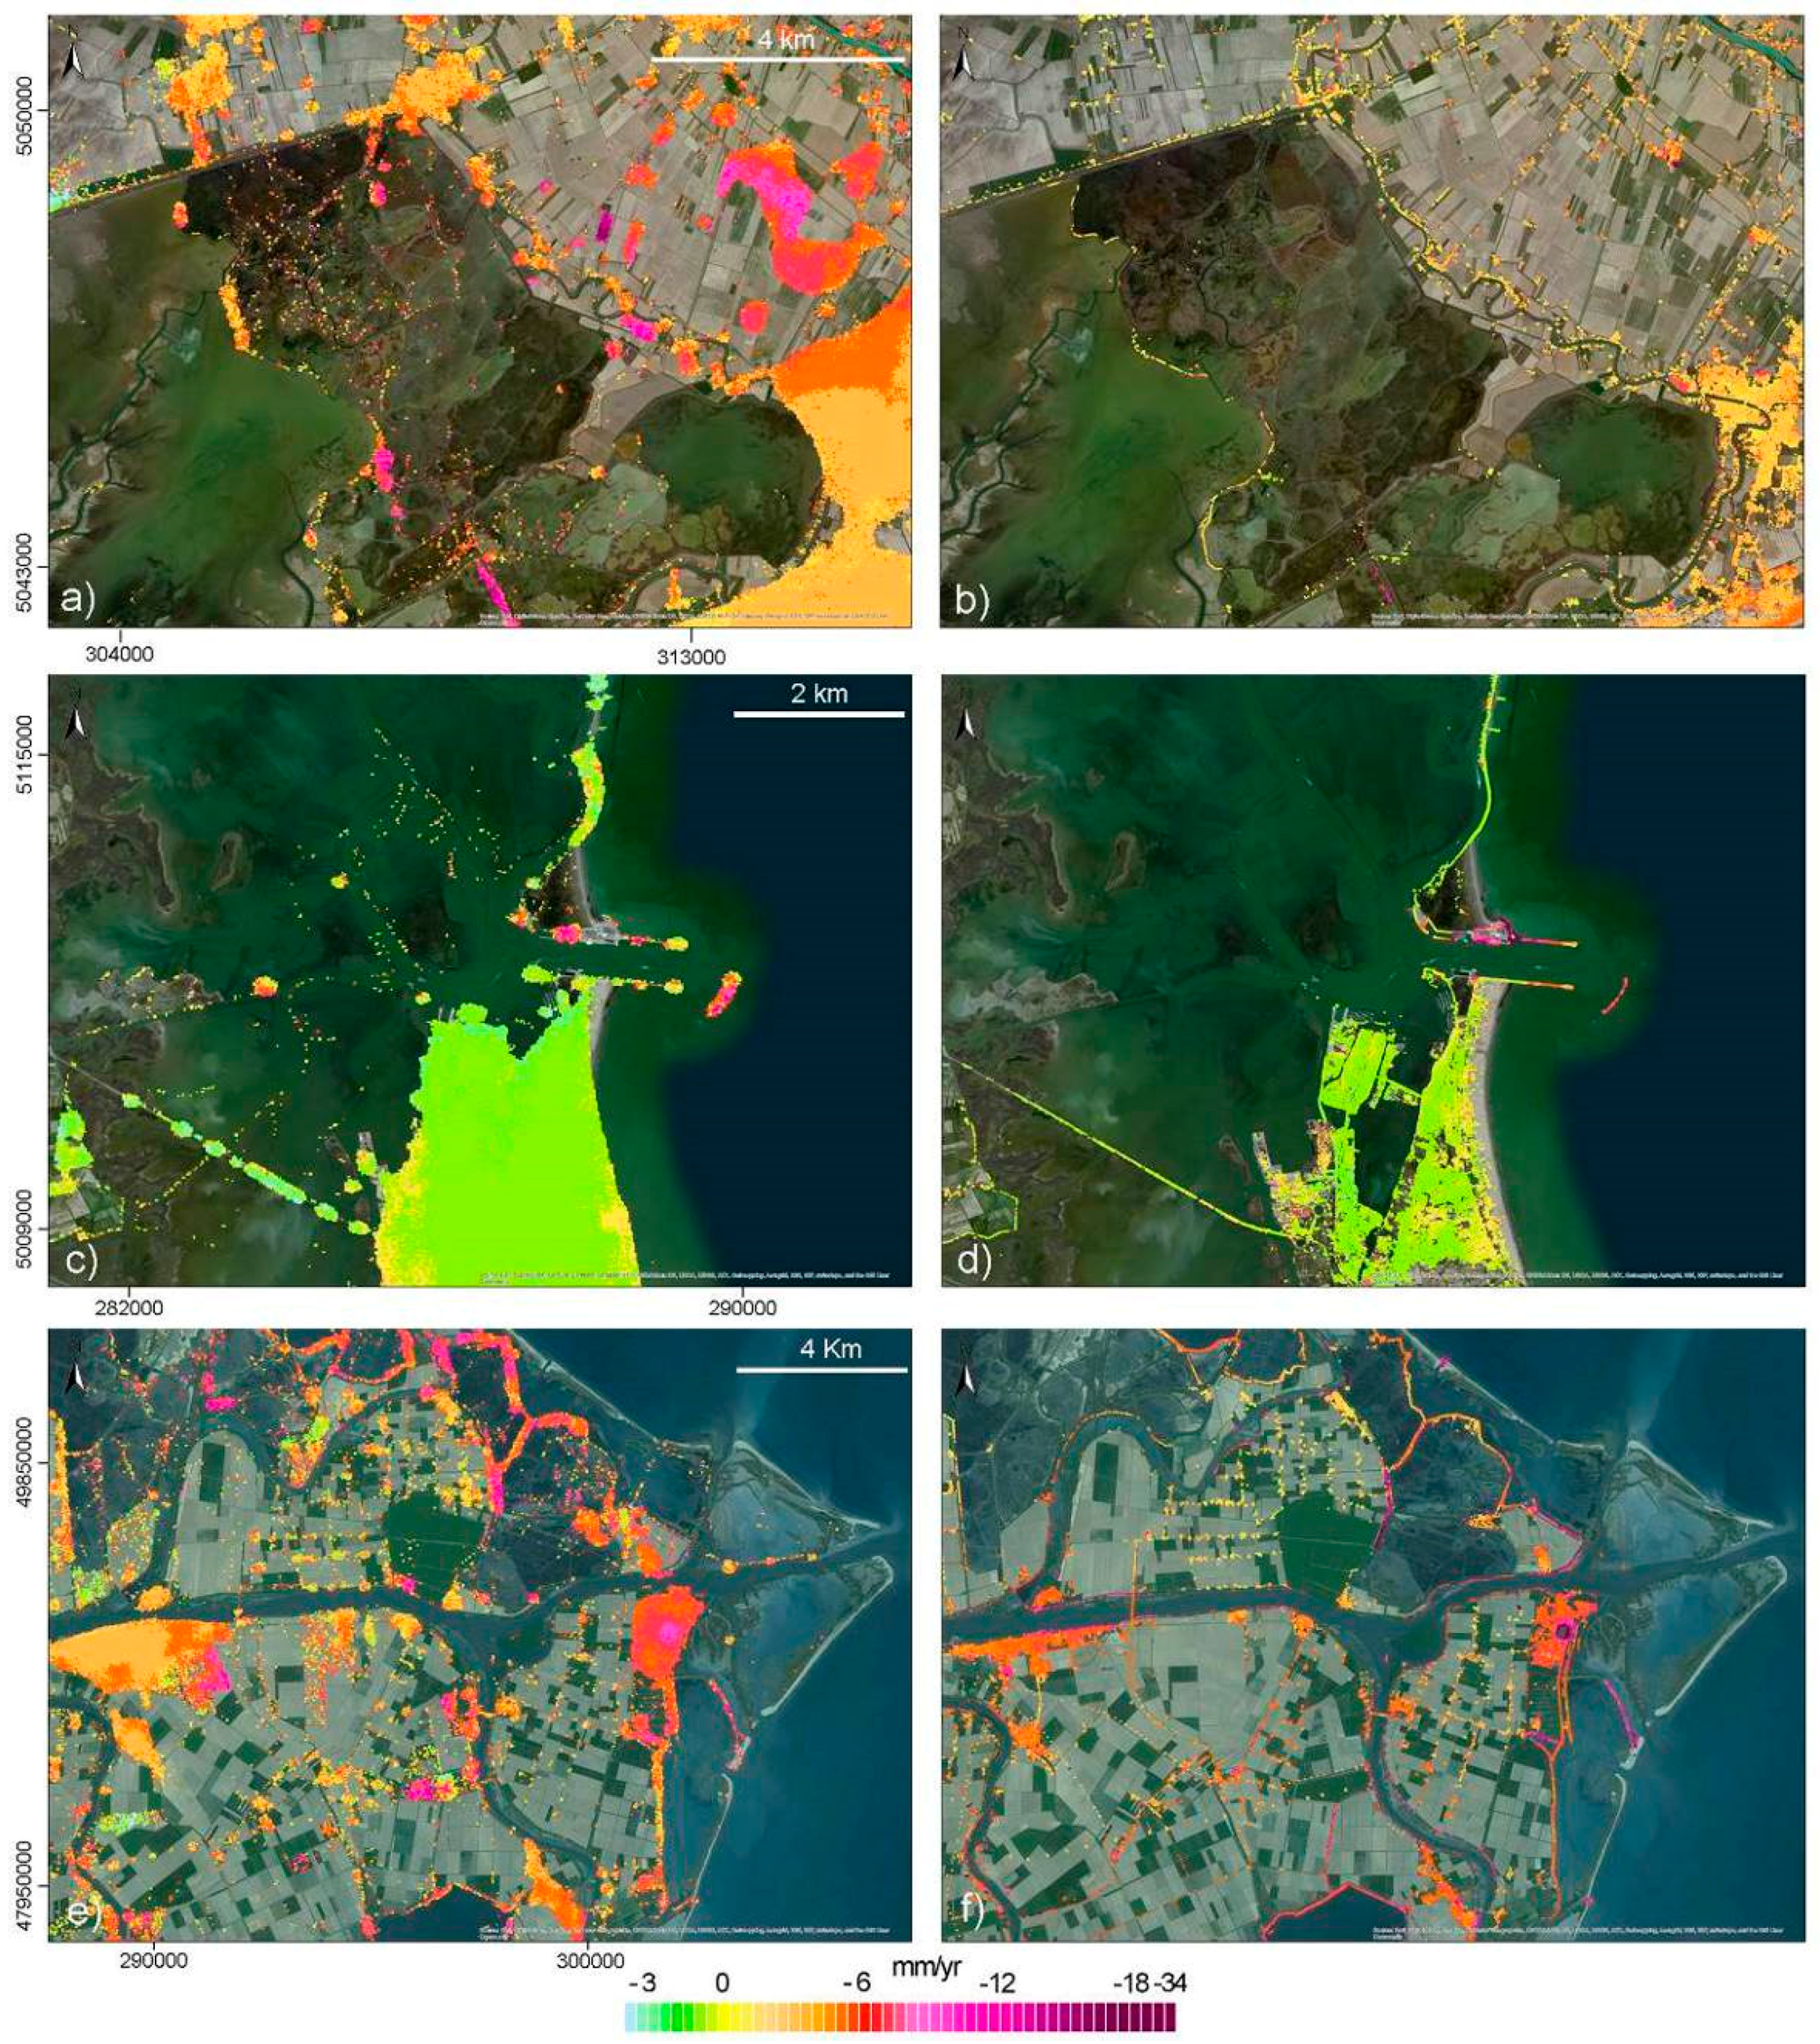
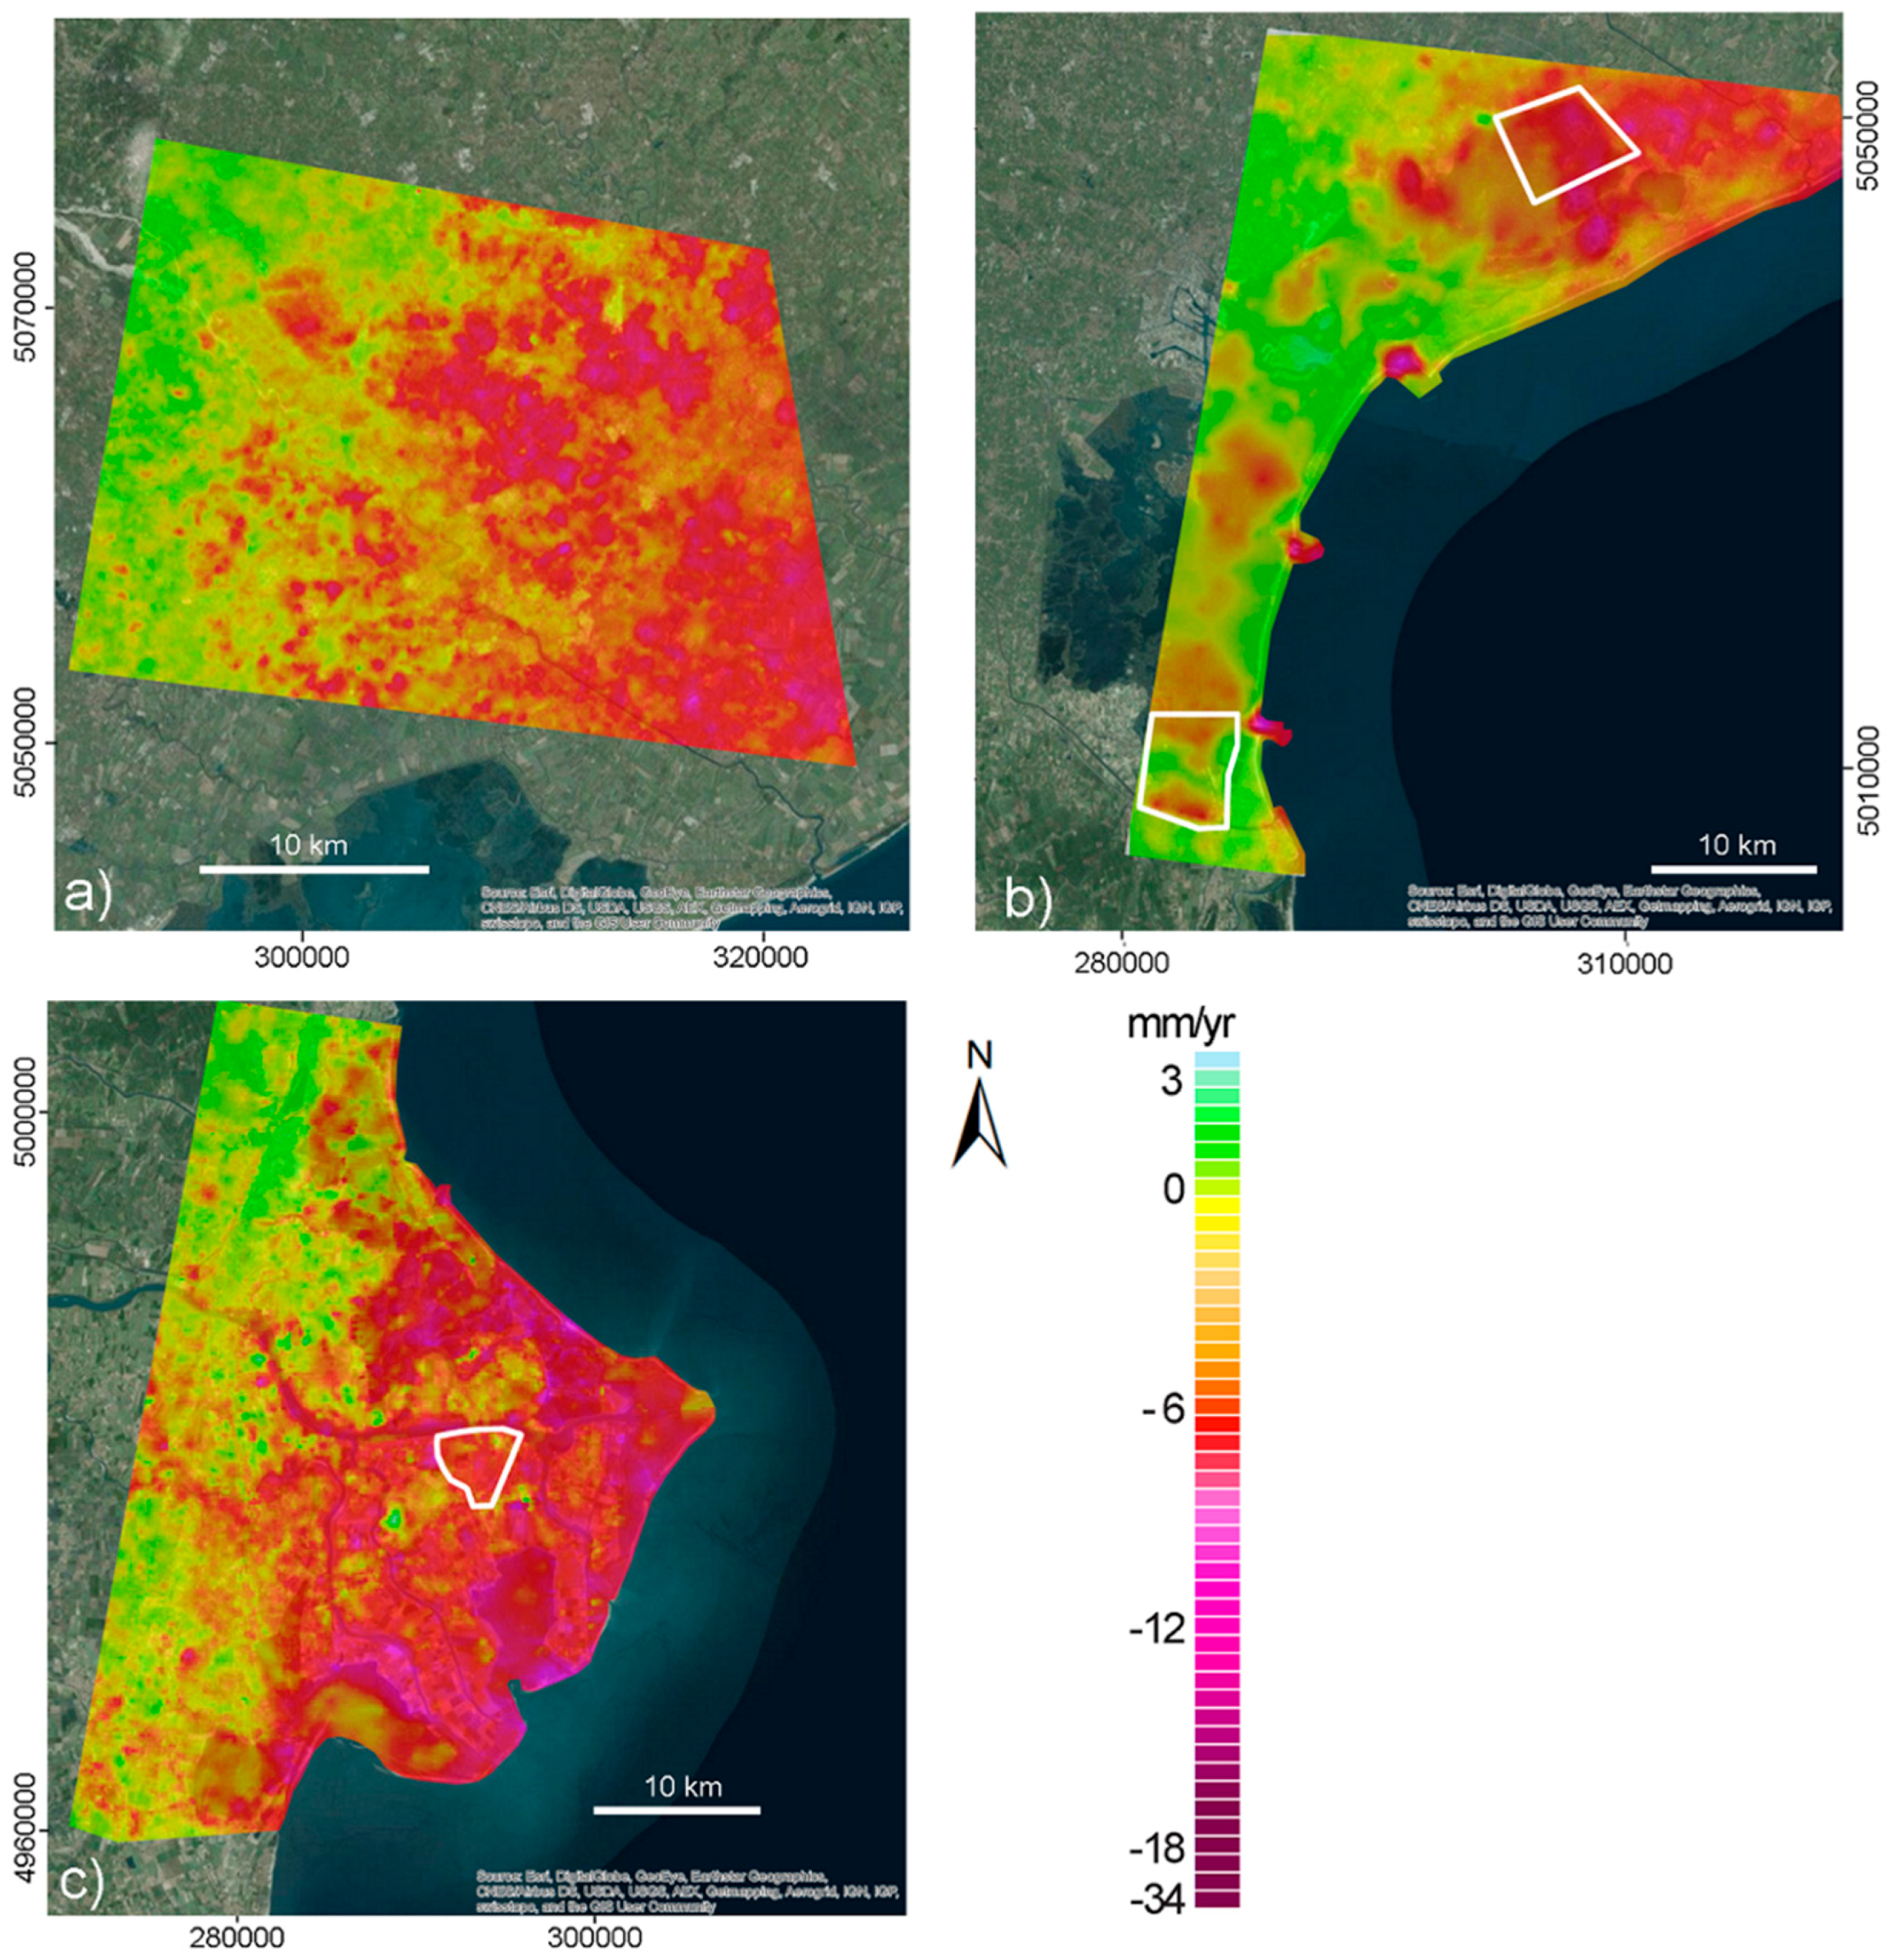
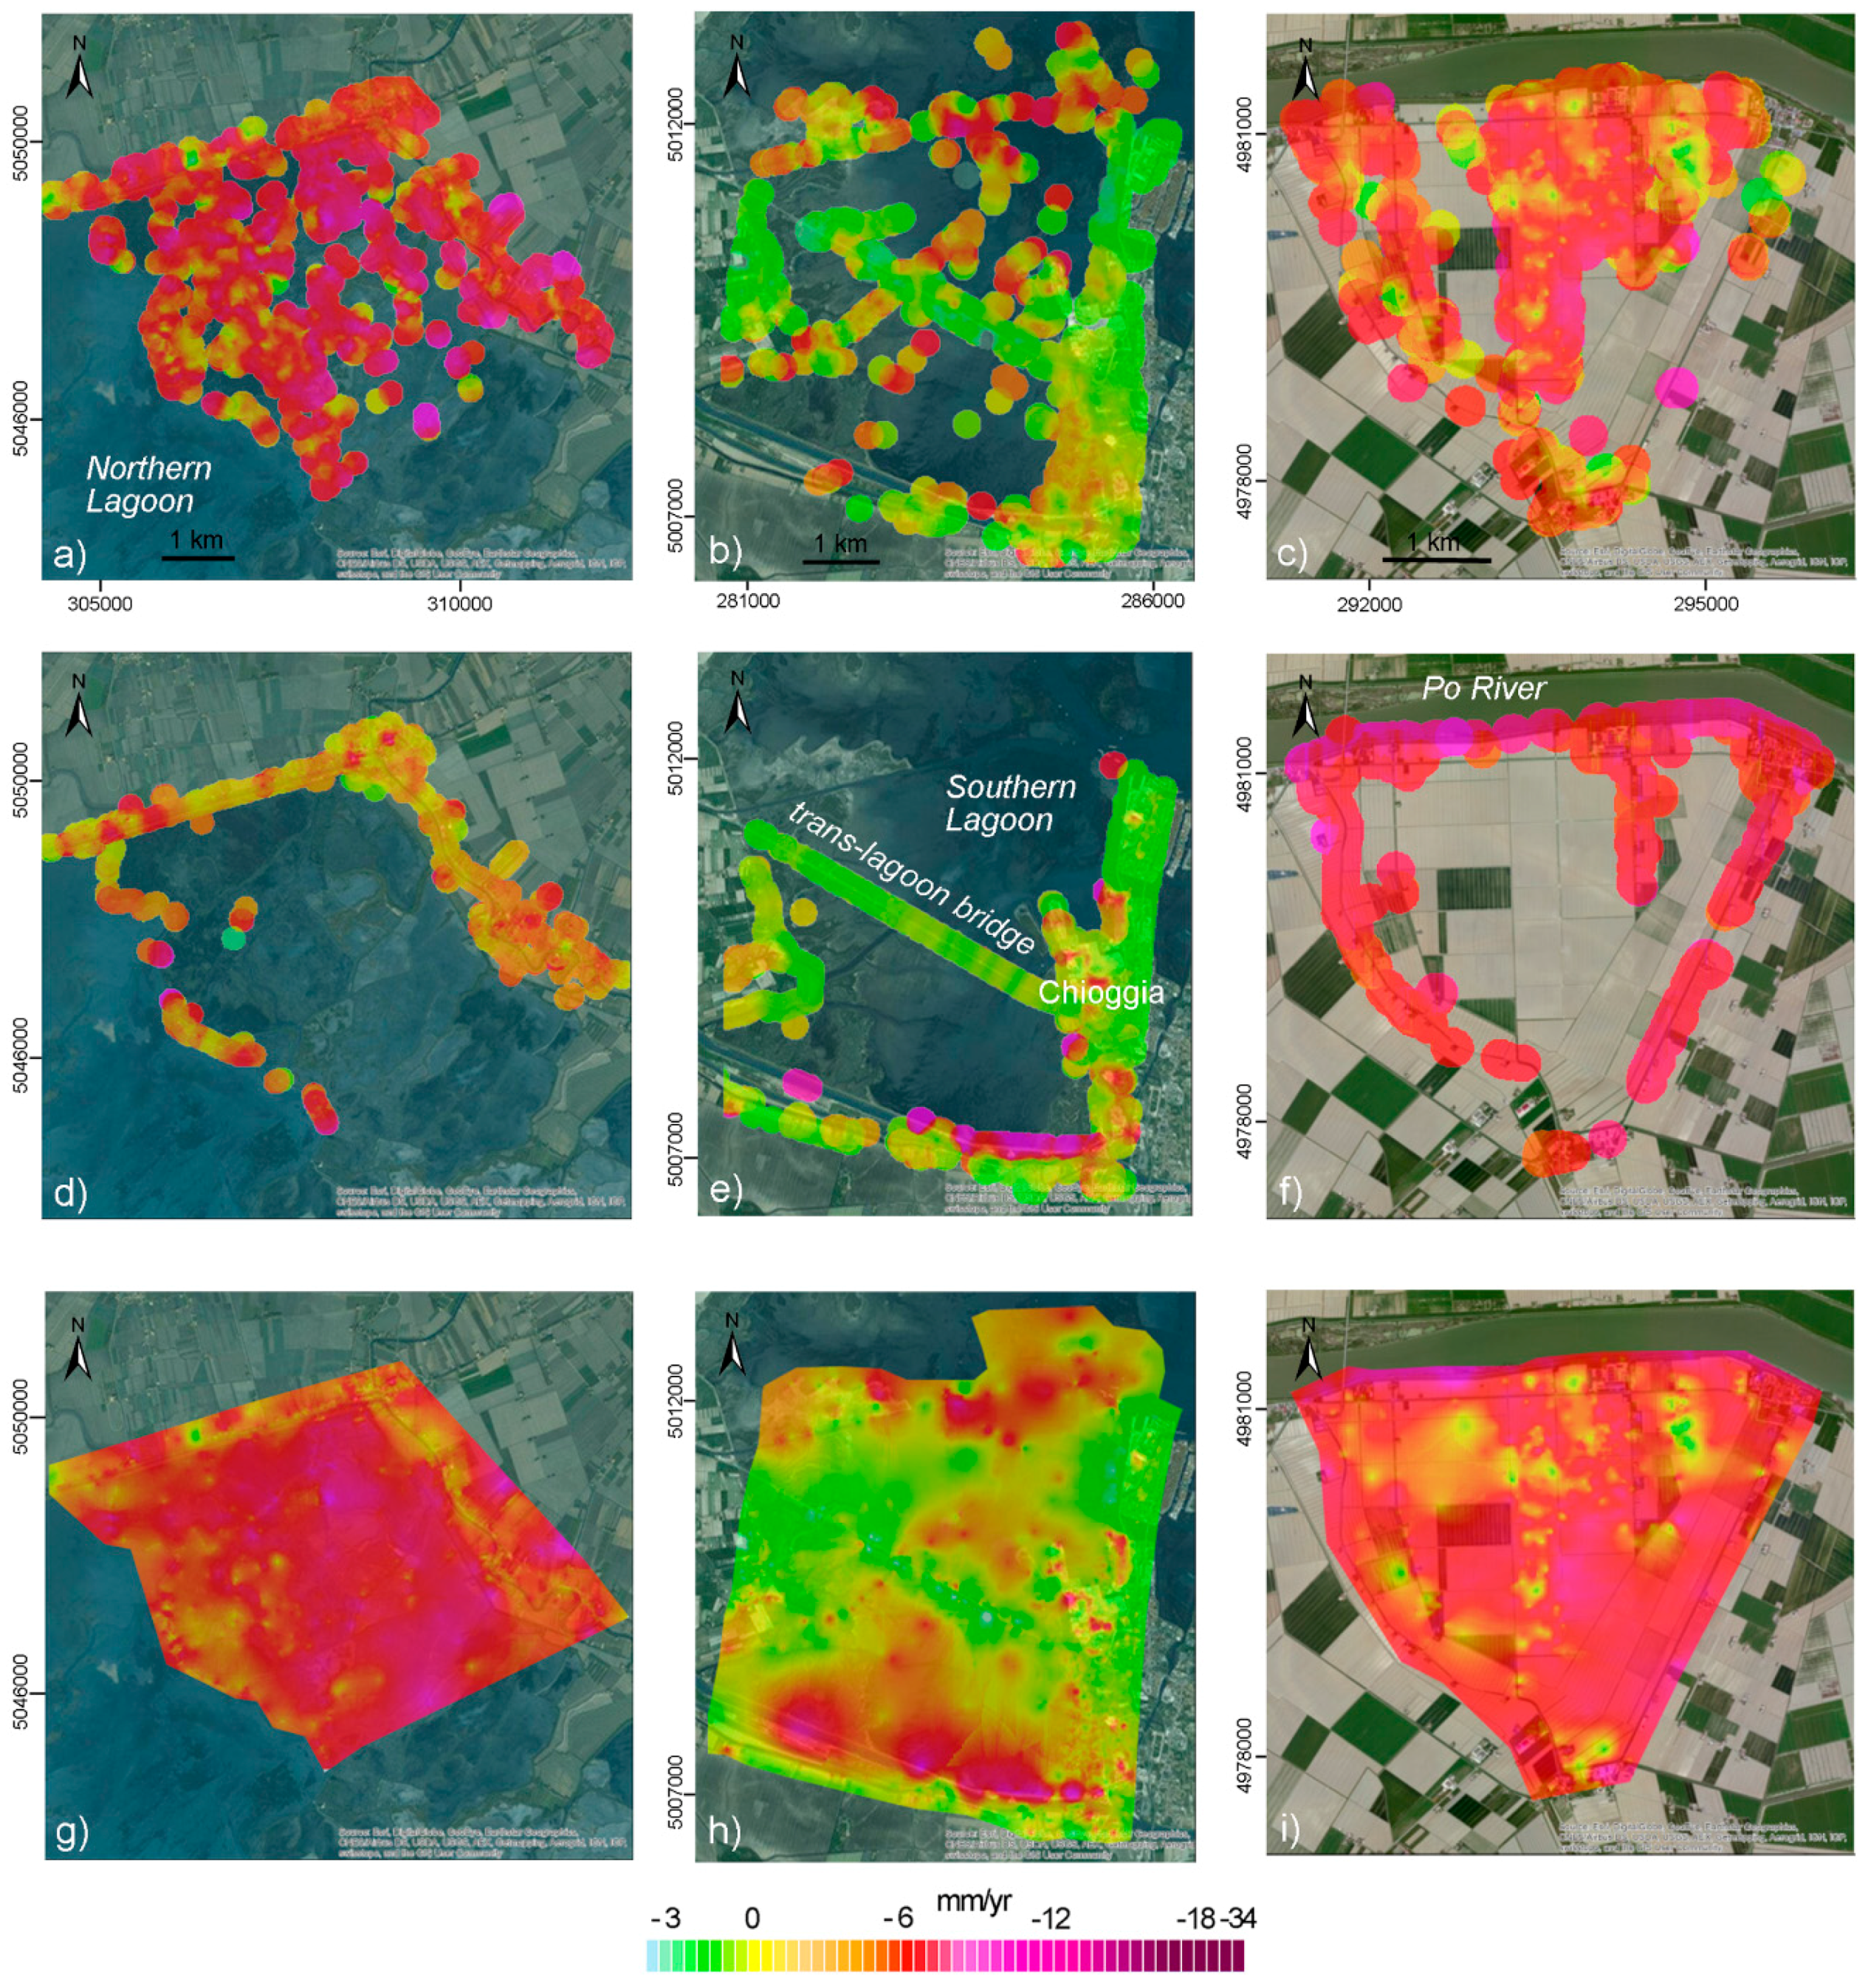
the significant difference between the displacement rates observed in the inner (by L-band SBAS) and the outer boundaries (by X-band IPTA) of each zone. Notice, for example, that at the northern tip of the Venice Lagoon the subsidence rate of the inner natural zone (Figure 12a) almost doubles the values characterizing the embankments (Figure 12d), i.e., on the average about −7 mm/yr for the former versus −4 mm/yr for the latter. Conversely, in the Po River Delta the farmland (Figure 12c) is subsiding at 5 mm/yr on the average, i.e., less than the embankments and houses located on the basin boundaries (Figure 12f) that are moving at −7 mm/yr.
The combined maps (Figure 12g–i) keep these peculiarities that are inherently connected to the role of the various processes contributing to the cumulative land subsidence and allow improving the interpretation of the ongoing processes themselves. In the northern tip of the Venice Lagoon, regional processes are responsible for a subsidence on the order 3 to 4 mm/yr.
Tectonics and groundwater pumping are the main responsible for these values [15]. The contribution due to structure/infrastructure load is negligible, as revealed by the similarity between the local movements showed in Figure 12d with the values derived at the regional scale (Figure 11a,d). The medium-to-coarse deposits of the shallow sequence, the deposition of this coastal zone a few thousand year ago [46], and the buildup of the main structures/infrastructure long in the past support the small subsidence and the end of the local consolidation due to these surficial loads. Surficial processes contribute significantly to land subsidence in the lagoon marshes and fish-farms. Here, half of the measured subsidence on the order of 3 to 4 mm/yr is likely due to shallow consolidation no more counterbalanced by sediment deposition.
At the southern edge of the Venice Lagoon (Figure 12h) clearly emerges the stability of the trans-lagoon bridge, whose foundations are few meter deep, with respect to the lagoon bottom which is gently subsiding at approximately 2 mm/yr due to shallow residual consolidation. Therefore, the effect of deep processes (e.g., tectonics, glacio-isostasy, fluid withdrawals) is negligible in this zone. The largest subsidence (more than 10 mm/yr) along the southernmost edge of the lagoon is caused by a recent stone reinforcement of the embankment bounding the lagoon. Lastly, in the Po River Delta the consolidation due to the anthropogenic loads resting on the land surface superposes to the natural consolidation still ongoing. In fact, this zone developed very recently, during the last few centuries, when a sharp increase in the human intervention (i.e., river diversions, construction of artificial channels and dams, land reclamation) significantly increased the river sediment transport and the delta prograded very rapidly, up to 200 m/yr, with a thick prodelta mud deposition [47]. These muds are characterized by a very high compressibility and low permeability, thus consolidation is still ongoing [11]. Regional tectonics and isostatic subsidence associated with sediment loading likely provide a negligible contribution [48] as recently demonstrated for other river deltas [49].

5. Conclusions

The low coherence in vegetated areas and the lack of radar reflectors in the lagoons, wetlands, and farmlands have precluded or at least strongly reduced the use C- and X-band sensors to detect ground movement in these environments.
Although L-band ALOS-PALSAR sensor has recently allowed detecting ground movements of salt marshes and farmlands [18], due to the reduced image number in the PDV region, PSI cannot be applied to process these acquisitions. Therefore, the accurate quantification of structure/infrastructure movements has been precluded.
This study adopts a strategy to obtain the best advantage from different SAR-band sensors consisting in the integration of their outcomes. Specifically, we have investigated the capability of the combination of ALOS PALSAR and COSMO-SkyMed interferometric outcomes into a sort of new unique L/X-band dataset.
The multi-band approach has allowed to improve the spatial coverage in the highly heterogeneous environments of the PDV region.
In addition, the increased dataset offered by the multi-band combination analysis has also allowed the improvement in the knowledge of the subsidence occurrence with respect to the understanding achievable by the independent use of each single satellite. In particular, this study has pointed out a significant difference between the land subsidence in the crop fields, with respect to that experienced by the structure and infrastructures located along the plot bounds. The subsidence of the latter can be smaller or larger than the former depending on the subsoil deposits and the period of deposition of the coastal zone. Similarly, the ground movements detected in the inner basins of the Venice and Po Delta lagoons and their bounding farmlands significantly differ from those detected in the embankments and other structures.
Moreover, with respect to the previous investigations the multi-band results has revealed (i) a more heterogeneity of the ground movements imprinted by the different contribution of the shallow and deep processes to the cumulative subsidence in the northern, central, and southern sectors of the PDV coastland; and (ii) a generally higher rate of subsidence in the northern mainland, the lagoon basin, and the Po River Delta.
In conclusion, as the importance of reliable and accurate monitoring of the ground elevation of lagoons, deltas, wetlands, and coastal farmlands is increasing worldwide in view of the expected sea level rise, the multi-band combined approach presented in this study represents a powerful tool that could be used in many other coastal areas with physiographic characteristics similar to the PDV region.

Acknowledgments

This work has been developed in the framework of the Flagship Project RITMARE—The Italian Research for the Sea—coordinated by the Italian National Research Council and funded by the Italian Ministry of Education, University and Research within the National Research Program 2011–2013. Data courtesy: (1) COSMO-SkyMed AO, Project ID 2100 © ASI Land movements in the Venice Lagoon: measuring the natural/regional and anthropogenic/local components by SAR Interferometric Point Target Analysis (IPTA); (2) ALOS PALSAR, Project AOALO-3550, © JAXA; CGPS Time series, Nevada Geodetic Laboratory (NGL). The paper benefited from the constructive comments of four anonymous reviewers.

Author Contributions

Luigi Tosi, Cristina Da Lio and Pietro Teatini conceived and designed the experiment. Tazio Strozzi performed the SAR processing by GAMMA Software. Luigi Tosi, Cristina Da Lio and Pietro Teatini calibrated and validated the interferometric solutions by CGPS, processed and analyzed the outcomes, interpreted data and wrote the paper.

Conflicts of Interest

The authors declare no conflict of interest.

References

  1. Carbognin, L.; Teatini, P.; Tosi, L.; Strozzi, T.; Tomasin, A. Present relative sea level rise in the northern Adriatic coastal area. In Marine Research at CNR—Theme 3 “Coastal and Marine Spatial Planning”; Brugnoli, E., Cavarretta, G., Mazzola, S., Trincardi, F., Ravaioli, M., Santoleri, R., Eds.; CNR-DTA: Roma, Italy, 2011; pp. 1123–1138. [Google Scholar]
  2. Carbognin, L.; Teatini, P.; Tomasin, A.; Tosi, L. Global change and relative sea level rise at Venice: What impact in term of flooding. Clim. Dyn. 2010, 35, 1055–1063. [Google Scholar] [CrossRef]
  3. Tosi, L.; Teatini, P.; Strozzi, T.; Da Lio, C. Relative land subsidence of the Venice coastland, Italy. In Engineering Geology for Society and Territory; Lollino, G., Ed.; Springer: Cham, Switzerland, 2014; Volume 4, pp. 171–173. [Google Scholar]
  4. Tosi, L.; Teatini, P.; Strozzi, T.; Carbognin, L.; Brancolini, G.; Rizzetto, F. Ground surface dynamics in the northern Adriatic coastland over the last two decades. Rend. Lincei Sci. Fis. 2010, 21, 115–129. [Google Scholar] [CrossRef]
  5. Veneto GPS Network. Available online: http://retegnssveneto.cisas.unipd.it/Web/index.php (accessed on 25 November 2015).
  6. Tosi, L.; Carbognin, L.; Teatini, P.; Strozzi, T.; Wegmüller, U. Evidence of the present relative land stability of Venice, Italy, from land, sea, and space observations. Geophys. Res. Lett. 2002, 29. [Google Scholar] [CrossRef] [Green Version]
  7. Ferretti, A.; Prati, C.; Rocca, F. Permanent scatterers in SAR interferometry. IEEE Trans. Geosci. Remote Sens. 2001, 39, 8–20. [Google Scholar] [CrossRef]
  8. Werner, C.; Wegmüller, U.; Strozzi, T.; Wiesmann, A. Interferometric point target analysis for deformation mapping. In Proceedings of the IEEE International Geoscience and Remote Sensing Symposium (IGARSS 2003), Toulouse, France, 21–25 July 2003; pp. 4362–4364.
  9. Teatini, P.; Tosi, L.; Strozzi, T.; Carbognin, L.; Wegmüller, U.; Rizzetto, F. Mapping regional land displacements in the Venice coastland by an integrated monitoring system. Remote Sens. Environ. 2005, 98, 403–413. [Google Scholar] [CrossRef]
  10. Teatini, P.; Strozzi, T.; Tosi, L.; Wegmüller, U.; Werner, C.; Carbognin, L. Assessing short- and long-time displacements in the Venice coastland by synthetic aperture radar interferometric point target analysis. J. Geophys. Res. Earth Surface 2007, 112. [Google Scholar] [CrossRef] [Green Version]
  11. Teatini, P.; Tosi, L.; Strozzi, T. Quantitative evidence that compaction of Holocene sediments drives the present land subsidence of the Po Delta, Italy. J. Geophys. Res. Solid Earth 2011, 116. [Google Scholar] [CrossRef]
  12. Strozzi, T.; Teatini, P.; Tosi, L. TerraSAR-X reveals the impact of the mobile barrier works on the Venice coastal stability. Remote Sens. Environ. 2009, 113, 2682–2688. [Google Scholar] [CrossRef]
  13. Tosi, L.; Teatini, P.; Strozzi, T. Natural versus anthropogenic subsidence of Venice. Sci. Rep. 2013, 3. [Google Scholar] [CrossRef] [PubMed]
  14. Teatini, P.; Tosi, L.; Strozzi, T.; Carbognin, L.; Cecconi, G.; Rosselli, R.; Libardo, S. Resolving land subsidence within the Venice Lagoon by persistent scatterer SAR interferometry. Phys. Chem. Earth 2012, 40–41, 72–79. [Google Scholar] [CrossRef]
  15. Tosi, L.; Teatini, P.; Carbognin, L.; Brancolini, G. Using high resolution data to reveal depth-dependent mechanisms that drive land subsidence: The Venice coast, Italy. Tectonophysics 2009, 474, 271–284. [Google Scholar] [CrossRef]
  16. Gambolati, G.; Putti, M.; Teatini, P.; Camporese, M.; Ferraris, S.; Gasparetto-Stori, G.; Nicoletti, V.; Rizzetto, F.; Silvestri, S.; Tosi, L. Peatland oxidation enhances subsidence in the Venice watershed. EOS Trans. AGU 2005, 86, 217–224. [Google Scholar] [CrossRef]
  17. Teatini, P.; Gambolati, G.; Tosi, L. A new 3-D non-linear model of the subsidence of Venice. In Land Subsidence; Barends, F.B.J., Ed.; IAHS Publishing: Wallingford, UK, 1995; pp. 353–361. [Google Scholar]
  18. Strozzi, T.; Teatini, P.; Tosi, L.; Wegmüller, U.; Werner, C. Land subsidence of natural transitional environments by satellite radar interferometry on artificial reflectors. J. Geophys. Res. Earth Surface 2013, 118, 1177–1191. [Google Scholar] [CrossRef]
  19. Kourkouli, P.; Wegmüller, U.; Teatini, P.; Tosi, L.; Strozzi, T.; Wiesmann, A.; Tansey, K. Ground deformation monitoring over Venice Lagoon using combined DInSAR/PSI techniques. In Engineering Geology for Society and Territory; Lollino, G., Ed.; Springer: Cham, Switzerland, 2014; Volume 4, pp. 181–186. [Google Scholar]
  20. Rosen, P.A.; Hensley, S.; Zebker, H.A.; Webb, F.H.; Fielding, E.J. Surface deformation and coherence measurements of Kilauea Volcano, Hawaii, from SIR-C radar interferometry. J. Geophys. Res. 1996, 101. [Google Scholar] [CrossRef]
  21. Wegmüller, U.; Werner, C.; Strozzi, T.; Wiesmann, A. Monitoring mining induced surface deformation. In Proceedings of the IEEE International Geoscience and Remote Sensing Symposium (IGARSS 2004), Anchorage, AK, USA, 20–24 September 2004; pp. 1933–1935.
  22. Strozzi, T.; Wegmüller, U.; Werner, C.; Wiesmann, A.; Spreckels, V. JERS SAR interferometry for land subsidence monitoring. IEEE Trans. Geosci. Remote Sens. 2003, 41, 1702–1708. [Google Scholar] [CrossRef]
  23. Nitti, D.O.; De Vitis, L.; Bovenga, F.; Nutricato, R.; Refice, A.; Wasowski, J. Multi-temporal L-band SAR interferometry confirms C-band spatial patterns of subsidence in the ancient Wieliczka Salt Mine (Unesco Heritage Site, Poland). In Proceedings of the Fringe 2009 Workshop, Frascati, Italy, 4 December 2009.
  24. Luo, Q.; Perissin, D.; Zhang, Y.; Jia, Y. L- and X-Band multi-temporal InSAR analysis of Tianjin subsidence. Remote Sens. 2014, 6, 7933–7951. [Google Scholar] [CrossRef]
  25. Chen, F.; Lin, H.; Hu, X. Slope superficial displacement monitoring by small baseline SAR interferometry using data from L-band ALOS PALSAR and X-band TerraSAR: A case study of Hong Kong, China. Remote Sens. 2014, 6, 1564–1586. [Google Scholar] [CrossRef]
  26. Cianflone, G.; Tolomei, C.; Brunori, C.A.; Dominici, R. InSAR time series analysis of natural and anthropogenic coastal plain subsidence: The case of Sibari (Southern Italy). Remote Sens. 2015, 7, 16004–16023. [Google Scholar] [CrossRef] [Green Version]
  27. Berardino, P.; Fornaro, G.; Lanari, R.; Sansosti, E. A new algorithm for surface deformation monitoring based on small baseline differential SAR interferograms. IEEE Trans. Geosci. Remote Sens. 2002, 40, 2375–2383. [Google Scholar] [CrossRef]
  28. Doglioni, C. Some remarks on the origin of foredeeps. Tectonophysics 1993, 228, 1–20. [Google Scholar] [CrossRef]
  29. Carminati, E.; Doglioni, C.; Scrocca, D. Apennines subduction-related subsidence of Venice (Italy). Geophys. Res. Lett. 2003, 30. [Google Scholar] [CrossRef]
  30. MAGNET GPS Network. Available online: http://geodesy.unr.edu/billhammond/gpsnetmap/GPSNetMap.html (accessed on 25 November 2015).
  31. Torresan, S.; Critto, A.; Rizzi, J.; Marcomini, A. Assessment of coastal vulnerability to climate change hazards at the regional scale: The case study of the North Adriatic Sea. Nat. Hazards Earth Syst. Sci. 2012, 12, 2347–2368. [Google Scholar] [CrossRef]
  32. Sestini, G. Land subsidence and sea—level rise: The case of the Po Delta Region, Italy. In Sea Level Rise and Coastal Subsidence: Causes, Consequences, and Strategies; Milliman, J.D., Haq, B.U., Eds.; Springer: Dordrecht, The Netherlands, 1996; pp. 235–248. [Google Scholar]
  33. Carbognin, L.; Teatini, P.; Tosi, L. Relative land subsidence in the lagoon of Venice, Italy, at the beginning of the new millennium. J. Mar. Syst. 2004, 51, 345–353. [Google Scholar] [CrossRef]
  34. Jet Propulsion Laboratory—GPS Time Series. Available online: http://sideshow.jpl.nasa.gov/post/series.html (accessed on 25 November 2015).
  35. SOPAC GPS Data. Available online: http://sopac.ucsd.edu/map.shtml (accessed on 25 November 2015).
  36. FReDNet GPS Network. Available online: http://frednet.crs.inogs.it/ItalianSite/XFReDNetHome.htm (accessed on 25 November 2015).
  37. Jarvis, A.; Reuter, H.I.; Nelson, A.; Guevara, E. Hole-Filled SRTM for the Globe 2008 Version 4. Available online: http://srtm.csi.cgiar.org (accessed on 19 August 2008).
  38. Wegmüller, U.; Strozzi, T.; Werner, C. Ionespheric path delay estimation using split-beam interferometry. In Proceedings of the IGARSS 2012, Munich, Germany, 12 January 2012; pp. 3631–3634.
  39. Goldstein, R.; Werner, C. Radar ice motion interferometry. In Proceedings of the Third ERS Symposium, Florence, Italy, 17–21 March 1997; pp. 969–972.
  40. Strozzi, T.; Wegmüller, U.; Tosi, L.; Bitelli, G.; Spreckels, V. Land subsidence monitoring with differential SAR interferometry. Photogramm. Eng. Remote Sens. 2001, 67, 1261–1270. [Google Scholar]
  41. Teatini, P.; Tosi, L.; Strozzi, T. Comment on “Recent subsidence of the Venice Lagoon from continuous GPS and interferometric synthetic aperture radar”. Geochem. Geophys. Geosys. 2012, 13. [Google Scholar] [CrossRef]
  42. Cressie, N. Statistics for Spatial Data; John Wiley & Sons: New York, NY, USA, 1991. [Google Scholar]
  43. Zanello, F.; Teatini, P.; Putti, M.; Gambolati, G. Long term peatland subsidence: Experimental study and modeling scenarios in the Venice coastland. J. Geophys. Res. Earth Surface 2011, 116. [Google Scholar] [CrossRef]
  44. Kirwan, M.L.; Guntenspergen, G.R.; D’Alpaos, A.; Morris, J.T.; Mudd, S.M.; Temmerman, S. Limits on the adaptability of coastal marshes to rising sea level. Geophys. Res. Lett. 2010, 37. [Google Scholar] [CrossRef]
  45. D'Alpaos, A.; Da Lio, C.; Marani, M. Biogeomorphology of tidal landforms: Physical and biological processes shaping the tidal landscape. Ecohydrology 2012, 5. [Google Scholar] [CrossRef]
  46. Tosi, L.; Rizzetto, F.; Bonardi, M.; Donnici, S.; Serandrei Barbero, R.; Toffoletto, F. Note Illustrative Della Carta Geologica D’Italia Alla Scala 1:50.000, Foglio 128 Venezia; APAT—Dipartimento Difesa del Suolo, Servizio Geologico d’Italia: Roma, Italy, 2007; p. 164. [Google Scholar]
  47. Bondesan, M.; Favero, V.; Viñals, M.J. New evidence on the evolution of the Po-delta coastal plain during the Holocene. Quat. Int. 1995, 29–30, 105–110. [Google Scholar] [CrossRef]
  48. Carminati, E.; Di Donato, G. Separating natural and anthropogenic vertical movements in fast subsiding areas: The Po Plain (N. Italy) case. Geophys. Res. Lett. 1999, 26, 2291–2294. [Google Scholar] [CrossRef]
  49. Wolstencroft, M.; Shen, Z.; Törnqvist, T.E.; Milne, G.A.; Kulp, M. Understanding subsidence in the Mississippi Delta region due to sediment, ice, and ocean loading: Insights from geophysical modeling. J. Geophys. Res. Solid Earth 2014, 119, 3838–3856. [Google Scholar] [CrossRef] [Green Version]
Figure 1. Image of the Po River Delta and Venice coastland. Cosmo-SkyMed and ALOS-PALSAR frames are shown by red and blue rectangles (Track 639, Frames 890/900), respectively. Yellow dots indicate the positions of the CGPS stations (Table 1) used to reference the SAR solutions. Base map source: Esri, DigitalGlobe, GeoEye, Earthstar Geographics, CNES/Airbus DS, USDA, USGS, AEX, Getmapping, Aerogrid, IGN, IGP, swisstopo, and the GIS User Community.
Remotesensing 08 00308 g001
Figure 2. Images graph. X-axis: temporal baseline of the acquisition. Y-axis: normal baseline of the acquisition. (a) COSMO-SkyMed PSI analysis; and (b) ALOS-PALSAR short baseline SBAS analysis.
Remotesensing 08 00308 g002
Figure 3. Average calibrated land displacements (mm/yr) along the LOS in the PDV region: (a) 2008–2011 by PSI on Cosmo-SkyMed images; and (b) 2007–2010 SBAS on ALOS-PALSAR images. Positive values mean uplift, negative values mean land subsidence. The sites labeled by A, B, C, D, and E are used for satellite cross-validation. Base map source: Esri, DigitalGlobe, GeoEye, Earthstar Geographics, CNES/Airbus DS, USDA, USGS, AEX, Getmapping, Aerogrid, IGN, IGP, swisstopo, and the GIS User Community.
Remotesensing 08 00308 g003
Figure 4. Data validation. Comparison between the LOS displacements provided by the CGPS (red dots) and the calibrated COSMO-SkyMed PT (blue dots) time series.
Remotesensing 08 00308 g004
Figure 5. Northern mainland: calibrated (a) ALOS-PALSAR; and (b) COSMO-SkyMed average displacement rates (mm/yr) over the period 2007–2010 and 2008–2011, respectively; (c,d) provide the respective pdf(v) for the pixels/PTs located within the black polygon. Negative values indicate subsidence, positive mean uplift. The trace of the area is provided in Figure 3.
Remotesensing 08 00308 g005
Figure 6. Northern lagoon: calibrated (a) ALOS-PALSAR; and (b) COSMO-SkyMed average displacement rates (mm/yr) over the period 2007–2010 and 2008–2011, respectively; (c,d) provide the respective pdf(v) for the pixels/PTs located within the black polygon. Negative values indicate subsidence, positive mean uplift.
Remotesensing 08 00308 g006
Figure 7. Central and southern lagoon: calibrated (a) ALOS-PALSAR; and (b) COSMO-SkyMed average displacement rates (mm/yr) over the period 2007–2010 and 2008–2011, respectively; (c,d) provide the respective pdf(v) for the pixels/PTs located within the black polygon. Negative values indicate subsidence, positive mean uplift.
Remotesensing 08 00308 g007
Figure 8. Littoral strips of the Venice Lagoon: calibrated (a) ALOS-PALSAR; and (b) COSMO-SkyMed average displacement rates (mm/yr) over the period 2007–2010 and 2008–2011, respectively; (c,d) provide the respective pdf(v) for the pixels/PTs located within the black polygon. Negative values indicate subsidence, positive mean uplift.
Remotesensing 08 00308 g008
Figure 9. Po River Delta: calibrated (a) ALOS-PALSAR; and (b) COSMO-SkyMed average displacement rates (mm/yr) over the period 2007–2010 and 2008–2011, respectively; (c,d) provide the respective pdf(v) for the pixels/PTs located within the black polygon. Negative values indicate subsidence, positive mean uplift.
Remotesensing 08 00308 g009
Figure 10. Average displacement rates (mm/yr) between January 2007 and July 2010 on ALOS-PALSAR images and from September 2008 to July 2011 on COSMO-SkyMed images. (a) ALOS-PALSAR outcome in the northern Venice Lagoon; (b) COSMO-SkyMed outcome in the northern Venice Lagoon; (c) ALOS-PALSAR outcome in the southern Venice Lagoon; (d) COSMO-SkyMed outcome in the southern Venice Lagoon; (e) ALOS-PALSAR outcome in the Po River Delta; (f) COSMO-SkyMed outcome in the Po River Delta. Negative values indicate subsidence, positive mean uplift. The image background is from Esri, DigitalGlobe, GeoEye, Earthstar Geographics, CNES/Airbus DS, USDA, USGS, AEX, Getmapping, Aerogrid, IGN, IGP, Swisstopo, and the GIS User Community.
Remotesensing 08 00308 g010
Figure 11. Combined L- and X-band maps of the average displacement rates at the regional scale: (a) northern mainland; (b) Venice Lagoon, and (c) Po River Delta. Negative values indicate subsidence, positive mean uplift; The white boxes in (b,c) represent the location of the areas provided in Figure 12. The image background is from Esri, DigitalGlobe, GeoEye, Earthstar Geographics, CNES/Airbus DS, USDA, USGS, AEX, Getmapping, Aerogrid, IGN, IGP, Swisstopo, and the GIS User Community.
Remotesensing 08 00308 g011
Figure 12. Combined L- and X-band maps of the average displacement rates at the local scale. (a) ALOS-PALSAR results in the northern tip of the Venice Lagoon; (b) ALOS-PALSAR results in the southern edge of the Venice Lagoon; (c) ALOS-PALSAR results in the central basin of the Po River Delta; (d) COSMO-SkyMed results in the northern tip of the Venice Lagoon; (e) COSMO-SkyMed results in the southern edge of the Venice Lagoon; (f) COSMO-SkyMed results in the central basin of the Po River Delta; (g) combined maps in the northern tip of the Venice Lagoon; (h) combined maps in the southern edge of the Venice Lagoon; (i) combined maps in the central basin of the Po River Delta. The location of (a,d,g), (b,e,h), (c,f,i) areas is shown in Figure 11. Negative values indicate subsidence, positive mean uplift. The image background is from Esri, DigitalGlobe, GeoEye, Earthstar Geographics, CNES/Airbus DS, USDA, USGS, AEX, Getmapping, Aerogrid, IGN, IGP, Swisstopo, and the GIS User Community.
Remotesensing 08 00308 g012
Table 1. Position, time span and easting (E), northing (N), and vertical (UP) velocities of the selected CGPS stations. E, N and UP refer to the time span used to calibrate and validate the SAR results. Time series are from [30].
Station IDStation NameLon
(deg)
Lat
(deg)
Time Span
(years)
Used Time Span
(years)
E
(mm/yr)
N
(mm/yr)
UP
(mm/yr)
TRVSTreviso12.22245.6802009–20152009–201221.117.5−1.0
ODEZOderzo12.48945.7882011–20152011–201420.516.8−2.3
VEN1Venice12.35445.4312008–20152008–201121.116.6−0.6
SFELSan Felice12.29145.2302001–20102007–201016.913.6−8.0
PTO1Porto Tolle12.33444.9522011–20152011–201420.816.9−4.9
SDNASan Donà di Piave12.56445.6302008–20152008–201221.317.3−1.9
TGPOTaglio di Po12.22845.0032007–20152007–201121.316.2−5.2
Table 2. Data calibration. Comparison between CGPS and Point Targets average velocities acquired by COSMO-SkyMed. CGPS values are converted to the COSMO-SkyMed LOS displacements. IPTAu (uncalibrated) and IPTAc (calibrated) are the averaged velocities of the PTs located within a 30-m circle centered on the CGPS stations. This circle radius is large enough to include a significant number of PTs (more than five) but not too large for excluding the effect of subsoil/process heterogeneities.
CGPS StationTime SpanCGPS LOS (mm/yr)IPTAu (mm/yr)IPTAc (mm/yr)#PTs
ODEZ2011–2015−2.3−0.3 ± 0.5−2.2 ± 0.531
PTO12011–2015−4.3−4.7 ± 0.6−5.1 ± 0.666
VEN12008–2011−0.60.1 ± 0.9−0.7 ± 0.810
Table 3. Data calibration. Comparison between CGPS and SBAS average velocities acquired by ALOS-PALSAR. CGPS values are converted to the ALOS-PALSAR LOS displacements. SBASu (uncalibrated) and SBASc (calibrated) are the averaged velocities of the pixels located within a 60-m circle centered on the CGPS stations. This circle radius is large enough to include a significant number of Pixels (more than five) but not too large for excluding the effect of subsoil/process heterogeneities.
CGPS StationTime SpanCGPS LOS (mm/yr)SBASu (mm/yr)SBASc (mm/yr)#Pixels
TRVS2009–2015−0.8−1.8 ± 0.1−1.0 ± 0.115
PTO12011–2015−3.7−3.5 ± 0.1−4.2 ± 0.19
VEN12008–2011−0.60.5 ± 0.1−0.5 ± 0.120
Table 4. Data validation. Comparison between the CGPS LOS displacement rate and the calibrated SBAS average velocities of the ALOS-PALSAR records included in a 60-m circle area centered on the CGPS stations.
CGPS StationPeriodCGPS LOS (mm/yr)SBASc (mm/yr)#Pixel
TGPO2007–2011−4.4−4.1 ± 0.213
ODEZ2011–2015−1.5−1.9 ± 0.116
Table 5. Cross-validation between the calibrated ground vertical movements detected by COSMO-SkyMed and ALOS-PALSAR in a number of sites within the PDV region. The values represent the average rate and its standard deviation calculated from all the PTs/pixels located, for example, within a 250- and 500-m circle area. The site locations are mapped in Figure 3.
250-m Circle Area500-m Circle Area
SITEIPTAc (mm/yr)SBASc (mm/yr)IPTAc (mm/yr)SBASc (mm/yr)
A−1.0 ± 0.7−1.0 ± 0.1−0.9 ± 0.7−1.1 ± 0.1
B−6.4 ± 1.7−6.7 ± 0.4−6.2 ± 1.5−6.6 ± 0.5
C−1.2 ± 0.9−1.2 ± 0.4−1.6 ± 1.1−1.3 ± 0.6
D−6.2 ± 1.1−6.2 ± 0.6−6.8 ± 1.6−6.8 ± 1.0
E−1.6 ± 0.7−3.1 ± 0.3−2.1 ± 0.9−3.4 ± 0.5
Table 6. Comparison between the displacement rates measured by GPS and L-band and X-band interferometry and the results obtained by the regional multi-band SAR outcome at the GPS locations. Consistently with Table 3 and Table 4, the X-band and L-band values corresponds to the averaged velocities of the PTs and the pixels located within a 30-m and a 60-m circle, respectively, centered on the CGPS stations.
Station IDGPS Time Span
(years)
GPS LOS ALOS
(mm/yr)
GPS LOS CSK
(mm/yr)
L-Band 2007–2010
(mm/yr)
X-Band 2008–2011
(mm/yr)
Regional Multi-Band (2007–2011)
(mm/yr)
TRVS2009–2012−0.8−0.8−1.0 ± 0.1n.a.n.a.
ODEZ2011–2014−1.6−2.3−1.9 ± 0.1−2.2 ± 0.5−2.1
VEN12008–2011−0.6−0.7−0.5 ± 0.1−0.7 ± 0.8−0.6
SFEL2007–2010−2.3−7.4−2.1 ± 0.8−6.1 ± 0.2−3.4
PTO12011–2014−3.8−4.3−4.2 ± 0.1−5.1 ± 0.6−4.9
SDNA2008–2012−2.6−1.5−5.0 ± 0.1−3.4 ± 0.4−3.9
TGPO2007–2011−4.4−4.3−4.1 ± 0.2−4.1 ± 0.8−4.1

