Abstract
The Spectranomics approach to tropical forest remote sensing has established a link between foliar reflectance spectra and the phylogenetic composition of tropical canopy tree communities vis-à-vis the taxonomic organization of biochemical trait variation. However, a direct relationship between phylogenetic affiliation and foliar reflectance spectra of species has not been established. We sought to develop this relationship by quantifying the extent to which underlying patterns of phylogenetic structure drive interspecific variation among foliar reflectance spectra within three Neotropical canopy tree communities with varying levels of soil fertility. We interpreted the resulting spectral patterns of phylogenetic signal in the context of foliar biochemical traits that may contribute to the spectral-phylogenetic link. We utilized a multi-model ensemble to elucidate trait-spectral relationships, and quantified phylogenetic signal for spectral wavelengths and traits using Pagel’s lambda statistic. Foliar reflectance spectra showed evidence of phylogenetic influence primarily within the visible and shortwave infrared spectral regions. These regions were also selected by the multi-model ensemble as those most important to the quantitative prediction of several foliar biochemical traits. Patterns of phylogenetic organization of spectra and traits varied across sites and with soil fertility, indicative of the complex interactions between the environmental and phylogenetic controls underlying patterns of biodiversity.
1. Introduction
Advances in ecological remote sensing over recent decades have contributed substantial new insights into patterns and processes of biophysical and biochemical variation in species-rich tropical forests. Imaging spectroscopy, also known as hyperspectral imaging (HSI), has served as the technological backbone for many of these advances [1], as the fine spectral resolution (2–10 nm) and extended spectral range (380–2500 nm) provided by HSI facilitate the quantitative retrieval of a wide range of biochemical attributes [2,3,4]. Variation in remotely-sensed biochemical traits has been used to assess forest canopy functioning, including water stress, pest pressure, and canopy fluxes in nutrients and carbon [5,6,7]. Further, HSI data have shown significant potential for mapping community composition, including species and plant functional groups, based largely on their biochemical traits [8,9,10]. However, a challenge remains to understand whether trait variation (measured directly or remotely sensed) arising from taxonomic differences is confounded by environmental gradients [11,12].
Phylogenetic relatedness, i.e., the degree to which species share evolutionary histories, can explain a substantial proportion of morphological and genetic variation among species within ecological communities [13,14]. However, only recently have sufficient data on the relationships of rare tropical tree species become available to allow researchers to assess phylogenetic patterns of trait variation, in addition to their impact on emergent, community-level properties [15,16,17]. Recent phylogenetic studies have contributed insights into the assembly of tropical forest tree communities [18,19,20,21], but little work has been done to relate phylogenies with remote sensing approaches to tropical canopy community ecology. In the context of high-diversity tropical forests, extensive DNA sequence data, e.g., from DNA barcoding efforts, may prove particularly valuable for understanding the spectral properties of closely-related taxa. For the most part, phylogenetic methods have not been incorporated into remote-sensing based analyses of foliar trait variation. An exception is the work of Asner and Martin (2009) [12], which quantified the taxonomic and environmental components of trait variation across a gradient of soil fertility in a lowland Amazonian forest, using a hierarchical ANOVA procedure to partition taxonomic variance of biochemical traits into family, genus-within-family, and species-within-genus components. However, while this approach quantifies the entire pattern in phylogenetic relatedness in a community, it does not allow for variance in the distance between taxa at the same taxonomic rank. Explicit phylogenetic analyses using phylogenies derived from DNA sequence data may resolve the role of relatedness in determining patterns of trait variation, particularly among species and genera [22].
Many traits that are capable of being detected or quantified from HSI, such as foliar nitrogen, chlorophyll, phosphorus, and specific leaf area vary among tropical tree species in proportion to phylogenetic relatedness or exhibit “phylogenetic signal” [12,21,23]. Moreover, patterns of multivariate trait co-variation, such as stoichiometric ratios between foliar nutrients, are tightly linked with patterns of species diversity [24], so much so that species-specific chemical portfolios are now utilized to identify species using an approach called Spectranomics, developed by Asner and Martin (2009) [25]. Other spectroscopic techniques, such as near-infrared spectroscopy of dried plant materials have been utilized to discriminate species on the basis of their chemical properties [26,27]. It might therefore be anticipated that, along with the biochemical traits themselves, variations among the reflectance spectra of co-existing species within a tropical tree community may directly reflect the phylogenetic structure of that community. Methods to quantify the degree of phylogenetic signal are well established for assessing patterns of interspecific trait variation [13,14,28,29], and adapting such methods to spectral analysis may be achieved by calculating phylogenetic signal for each wavelength across the reflectance spectrum.
Here we ask whether tropical canopy tree foliar reflectance spectra exhibit phylogenetic signal, as measured by the Pagel’s λ [28], for three distinct Neotropical rainforest canopy communities that vary in soil fertility and community composition. We then investigate the relationship between foliar reflectance spectra and phylogenetic structure by (1) examining the relationships between spectra and a suite of nine biochemical traits that relate to a wide range of leaf functions and which are known to be expressed in leaf reflectance spectra; and (2) directly quantifying the phylogenetic signal of these biochemical traits.
2. Methods
2.1. General Approach
We examined patterns of phylogenetic signal of foliar spectra at high and low fertility forest sites in the context of the established relationships of foliar biochemical traits with both spectral and phylogenetic patterns. Our dataset included nine traits that represent a range of leaf functions and have established quantitative relationships with foliar reflectance spectra: nitrogen (N; %), phosphorus (P; %), calcium (Ca; %), leaf-mass-per-area (LMA; g·m−2), lignin (Lig; %), cellulose (Cel; %), total phenols (Phe; mg·g−1), condensed tannins (Tan; mg·g−1), and chlorophyll (Chl; mg·g−1) [2,3,12]. Foliar N, LMA, and chlorophyll relate to growth rates and rates of leaf turnover [30,31,32]. Foliar P and Ca are rock-derived nutrients often thought to limit growth in tropical forests [33]. Lignin and cellulose reflect foliar investments into leaf structure and longevity [34], and phenols and tannins are known to function primarily as anti-herbivore defenses [35,36]. We quantified the relationships between spectra and traits utilizing the multi-model ensemble of Feilhauer et al. [37], which has been shown to improve the robustness of the spectral band selection process relative to utilizing a single technique alone. We measured the phylogenetic relationships of both spectra and traits with two different phylogenies, one derived from the supertree available through the program Phylomatic [38], and one reconstructed from a concatenated alignment of DNA sequences for two plastid markers commonly utilized in plant DNA barcoding, matK and rbcL. The former includes all taxa but lacks resolution among species within genera and among genera within families.
2.2. Site Descriptions
This study was conducted in three Neotropical forests that are similar in climate but span a wide range of soil fertility (Figure 1; Table 1). Barro Colorado Island (BCI), Panama is a roughly 15 km2 island located in Lake Gatun. The forests of BCI are characterized as moist deciduous tropical forest underlain by sedimentary volcanic and marine substrates of the early and late Oligocene, and an andesite cap forming the highest point on the island (elevation = 137 m. a.s.l.) [39]. Soils on BCI have been classified as primarily Combisols and Ferralsols by Baillie et al. (2007) [40], and are unusually fertile compared to continental neotropical soils [40,41,42], with soil macronutrients evenly distributed across the landscape [43,44]. Two additional sites were located along the Tambopata River in the southern Peruvian Amazon basin, distinguished by varying soil classifications. This area is known as “Chuncho”, and encompasses 6033 ha of moderately high terraces (13–17 m) and adjacent expansive floodplains located upriver from the confluence of the Malinowski and Tambopata Rivers [45]. The first site in this area, Tam-I, was on floodplain forests characterized by high-fertility Inceptisols, originating in the Andes and deposited throughout the Holocene [46]. The second site, Tam-U, was located in the terra firme forests on flat to undulating Pleistocene surfaces c. 15–20 m. above the floodplain forests and are classified as weathered, lower fertility haplic Ultisols.
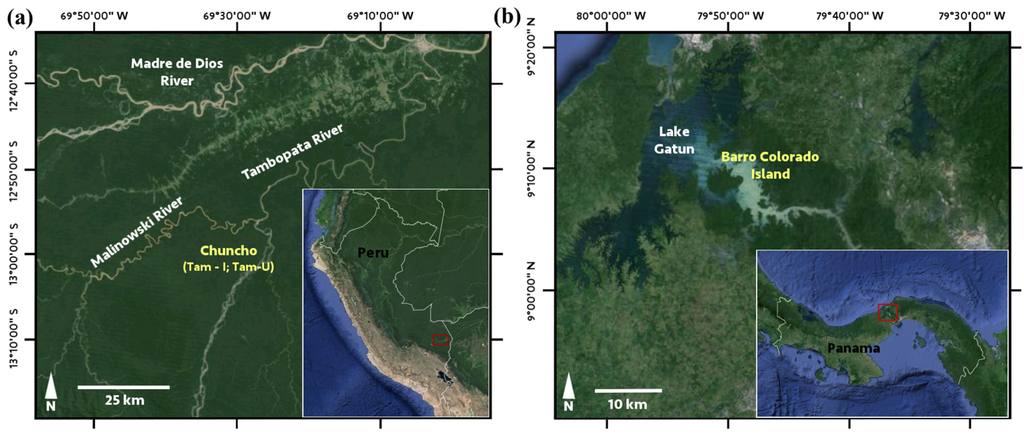
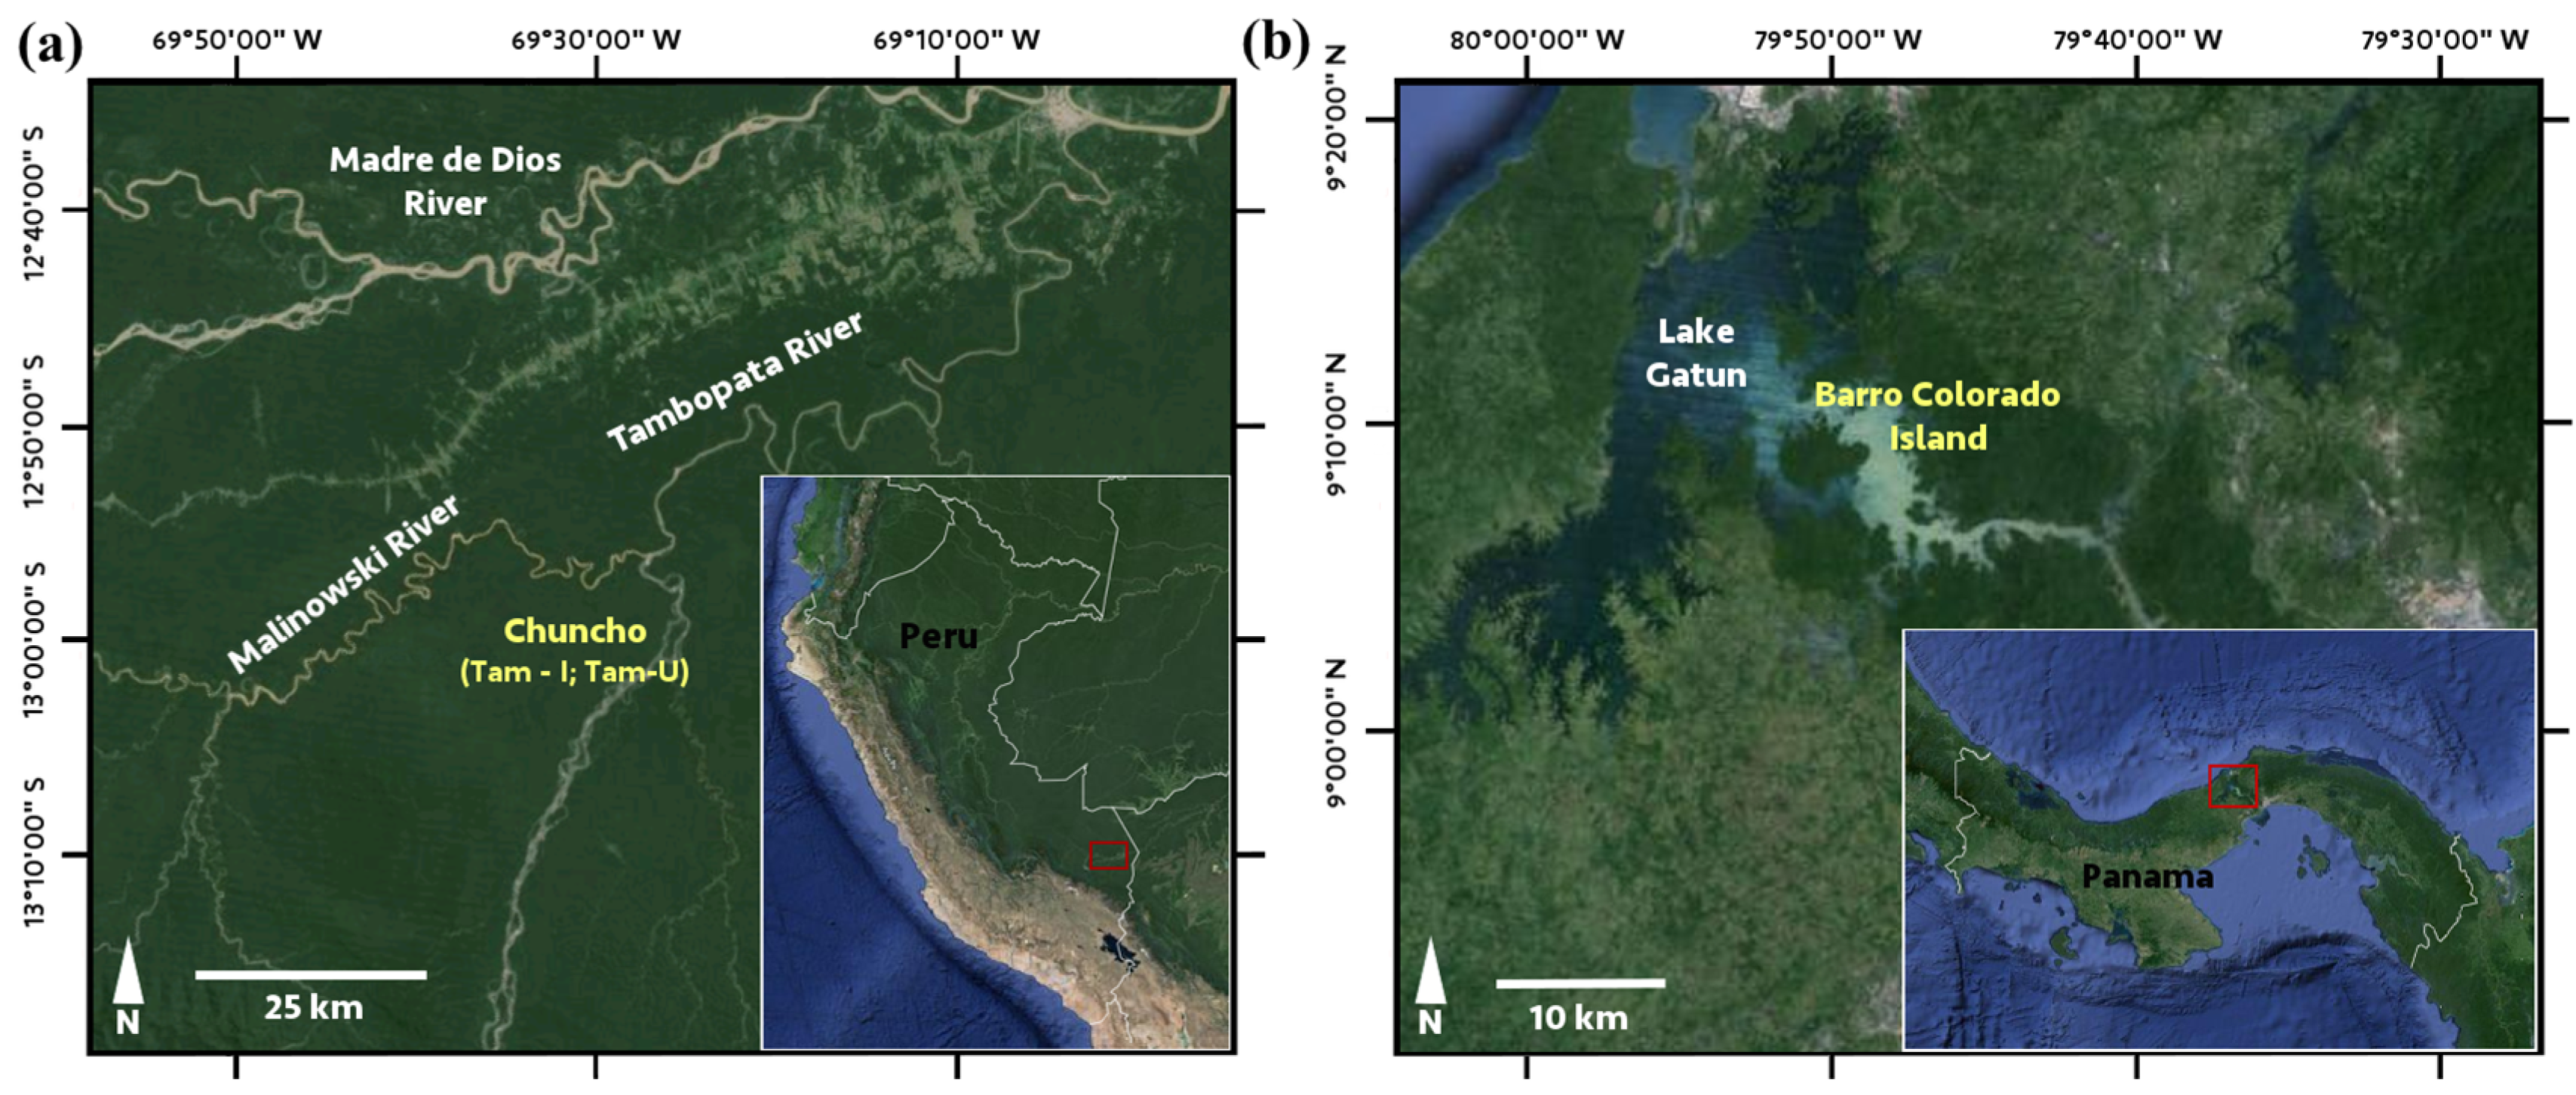
Figure 1.
Study site locations in (a) Peru, with Tam-I and Tam-U on adjacent landscapes in in the “Chuncho” region along the Tambopata River; and (b) Panama, at Barro Colorado Island, located in Lake Gatun, north of the Panama Canal. Image© Google Earth 2015.

Table 1.
Demographics and environmental characteristics for study locations. For each site, the species, genera, and families that co-occur at least one other site is given in parentheses. BCI = Barro Colorado Island (Panama); Tam-I = Tambopata (Peru) Inceptisol site; Tam-U = Tambopata Ultisol site. MAP = mean annual temperature; MAT = mean annual precipitation. MAT and MAT data are averaged over the ranges 1972–1999 for BCI and 2008–2013 for Tambopata [43,45].
2.3. Species Data for Chemical, Spectral, and Phylogenetic Analyses
Biochemical trait data, spectral reflectance signatures, and genetic data were obtained for 299 species, in 154 genera and 46 families (Table 1). Data for nine traits (P, Ca, N, LMA, Chl, Lig, Cel, Phe, Tan) were obtained for fully-sunlit, top-of-canopy foliage (Table 2), and were quantified as part of a pan-tropical analysis of foliar biochemical traits previously reported in Asner and Martin (2015) [47]. Sampling was designed to capture the diversity of sunlit canopies throughout the sites, while also maintaining statistical power for replication at the family, genus, and species levels. Between 19% and 32% of species overlapped between sites, with greater overlap at higher taxonomic levels (45%–58% of genera, and 76%–93% of families; Table 1). Sample collection methodology, along with analyses of within-species and within-crown variation were previously reported in Asner and Martin (2011) [12] for Tambopata sites and Asner and Martin (2015) [47] for BCI. The chemical assays utilized, along with instruments and standards, are described in detail in Asner and Martin (2011) [12], and detailed protocols are available on the Carnegie Spectranomics Project website (spectranomics.ciw.edu). Trait data were transformed where necessary to improve normality (Table 2).
Table 2.
Trait statistics and phylogenetic signal for all sites. Site-level trait means are reported ± standard deviation. Units of measurement are reported in parentheses. CV = coefficient of variation. The phylogenetic signal for each trait is reported for analyses based on DNA and Phylomatic phylogenies subset to the species present at each site (λDNA and λPhyl). F is the F statistic reported for a one-way ANOVA for trait variation among sites. Superscripts (a, b, c) on site-specific trait means correspond to groups found to be significantly different via Tukey’s post-hoc test for each trait. Site variables are defined in the caption to Table 1. Chl = Chlorophyll.
Spectroscopic measurements were made concurrently with sample collection, following the method of Asner and Martin (2011) [12]. A detailed methodology of the spectroscopic measurement procedure for the two Peruvian sites is provided in the supplement to Asner and Martin (2011) [12], and further information is available from spectranomics.ciw.edu. This procedure was also utilized for the BCI data collection. Briefly, six leaves were randomly selected from the outermost surface of branches, with all signs of epiphyll growth, endophytes, and herbivory intact to represent the state of the tree at the time of collection. Spectra were collected with a custom-build field spectrometer that records in 2151 bands spanning the 350 to 2500 nm wavelength region (FS-3 with custom detectors and exit slit configuration to maximize signal-to-noise performance; Analytical Spectra Devices, Inc., Boulder, CO, USA), an integrating sphere designed for high-resolution spectroscopic measurements (approx. 9 mm dia. field-of-view), and an illumination collimator [12]. The spectra were calibrated for dark current and stray light, referenced to a calibration block (Spectralon, Labsphere Inc., Durham, NH, USA) in the integrating sphere. Hemispherical reflectance was measured on the leaf adaxial surface mid-way between the main vein and the leaf edge, and roughly halfway from petiole to leaf tip. Large primary or secondary veins were avoided to the extent possible. Calibrated spectra were then resampled to a 10 nm bandwidth, and trimmed to the 400–2500 nm range. The high fidelity of the resulting spectra did not require smoothing or other filters. Each of the six reflectance spectra for an individual were averaged, which were then averaged to the species level.
2.4. DNA Sequencing, Alignment, and Assembly into a Supermatrix
Genetic material (10 7-mm frozen leaf discs per individual) from samples for all individuals at both Tambopata sites were submitted to the Canadian Centre for DNA Barcoding (CCDB) at the Biodiversity Institute of Ontario, University of Guelph for sequencing. Samples were sequenced at two separate loci corresponding to the DNA barcode markers rbcL and matK, which together provide resolution of basal and more recent evolutionary relationships [16]. DNA extraction, PCR, and sequencing were performed at the CCDB following standard high-throughput protocols [48]. DNA barcodes for the same two markers for taxa present within the BCI site were obtained from the Smithsonian Institution, Department of Botany.
We combined DNA sequences for BCI and Tambopata into single FASTA files for matK and rbcL markers, respectively, prior to alignment. We aligned both matK and rbcL sequences using the MAFFT multiple sequence alignment software available online (v.7) [49]. We visually examined and corrected the aligned sequences utilizing the Mesquite software program (v.3.04), and excluded sites that represented gaps across >99% of sequences. No rbcL sites were below this threshold, while 4.7% of matK sites were omitted during this step.
2.5. Phylogenetic Reconstruction: DNA-Sequence Based Method
We constructed a phylogeny from a concatenated matrix of rbcL and matK DNA sequences from all three sites using maximum likelihood via the RAxML software (v.8.2.4) [50] on the CIPRES online portal [51]. For the rbcL marker, 278 of the 299 species had sequence data available; for the matK marker, 210 species had data available. For the combined matrix, we selected only one sequence per marker per species. To include the maximum number of species possible within the combined phylogeny, we utilized a hierarchical approach to select sequences within species, described in Supplementary Methods. The combined phylogeny included 283 out of 299 species, of which 205 had data for matK + rbcL and 78 had data for a single marker only (5 for matK and 73 for rbcL). We made the final tree ultrametric using the nonparametric rate smoothing method of Sanderson (1997) [52] via the chronos function in the ape package for R [53,54].
2.6. Phylogeny Reconstruction: Supertree Method
We constructed a phylogenetic tree for all taxa at the study locations using the computer program Phylomatic (v3) [38], with the most recent phylogenetic hypothesis available at the time of analysis (R20120829 phylogenetic tree for plants, derived from the Angiosperm Phylogeny Group III reconstruction; APGIII, 2009). Phylomatic matches a user-submitted list of taxa against a master phylogeny of plant family and genus-level relationships and returns a trimmed phylogeny for the taxa desired. We used the BLADJ algorithm in Phylocom [55] with the ages file from Gastauer and Meira-Neto (2013) [56] to adjust the branch lengths of the phylogeny using known ages of plant fossils [57]. Although providing little to no resolution below (or frequently at) the family level, the branching pattern of the resulting Phylomatic phylogeny was largely consistent with that of the DNA-based phylogeny at higher taxonomic levels (Supplementary Figure S1).
2.7. Quantifying Phylogenetic Signal of Spectra and Traits
We estimated phylogenetic signal for foliar reflectance spectra and traits across all sites and species, utilizing the Phylomatic and DNA-based phylogenies described in Section 2.5 and 2.6, and also for each study location individually, by subsetting both the DNA phylogeny and Phylomatic phylogeny to the taxa present at each site (Supplementary Figures S2–S7). We estimated phylogenetic signal for species mean reflectance values at each wavelength and species mean trait values using the lambda (λ) statistic introduced by Pagel [28]. λ is a scaling parameter that is used to evaluate the extent to which phylogenetic relatedness determines the covariance matrix among species for a given trait (or spectral wavelength, in this study) [58]. Estimates of λ were compared to two alternative evolutionary hypotheses, that of a star phylogeny in which all tips are equidistant (i.e., no phylogenetic signal; λ = 0) and that of a trait evolving along the given phylogeny under a model of Brownian motion (λ = 1). We quantified λ independently for each site, with separate estimates for both phylogenies. Significance is computed for each hypothesis via a χ2 test of the likelihood that the observed pattern of trait expression is generated from a phylogenetic tree with λ equal to zero or one [59].
2.8. Multi-Method Ensemble Selection of Biochemically-Related Spectral Bands
To evaluate the extent to which spectral features were correlated with biochemical traits, we utilized the multi-method ensemble approach of Feilhauer et al. (2015) [37]. The ensemble consists of three regression models used in parallel to quantify foliar traits from leaf reflectance spectra: Partial Least Squares (PLS), Random Forest (RF), and Support Vector Machine (SVM), which provide separate estimates of the relationship between a biochemical trait and the corresponding spectral signal measured at the leaf level. Models were constructed utilizing biochemical trait data for all species included in the study; trait data were standardized to have a mean of zero and unit variance. From each model, we obtained a vector of coefficients indicating the spectral bands most important for the prediction of a given foliar trait. These coefficients were weighted based on model fit and merged to form an ensemble assessment of the bands most influential to the prediction of trait variation. The ensemble utilized data from all three sites, to capture the full range of trait and spectral variation.
2.9. Quantification of Trait Correlations and Determination of Phylogenetic Independent Contrasts
Trait correlations may reduce the independence of individual trait-spectral models or estimates of the phylogenetic signal of traits. To determine the interdependency of traits, we calculated pairwise correlation among species mean trait values as well as among phylogenetically-corrected trait values, known as phylogenetic independent contrasts (PICs). PICs provide an adjusted estimate of trait variation among species which accounts for the relatedness of taxa, and are useful for determining whether patterns of trait co-variation are found broadly across a phylogeny or show phylogenetic dependency (e.g., restricted to the taxa within a given clade) [60]. PICs were calculated for each trait using standardized trait data based on the evolutionary distances given by the DNA-based phylogeny. We then calculated pairwise correlations of PICs, which were forced through the origin following Garland et al. (1992) [61].
3. Results
3.1. Spectral Variation across Soil Types
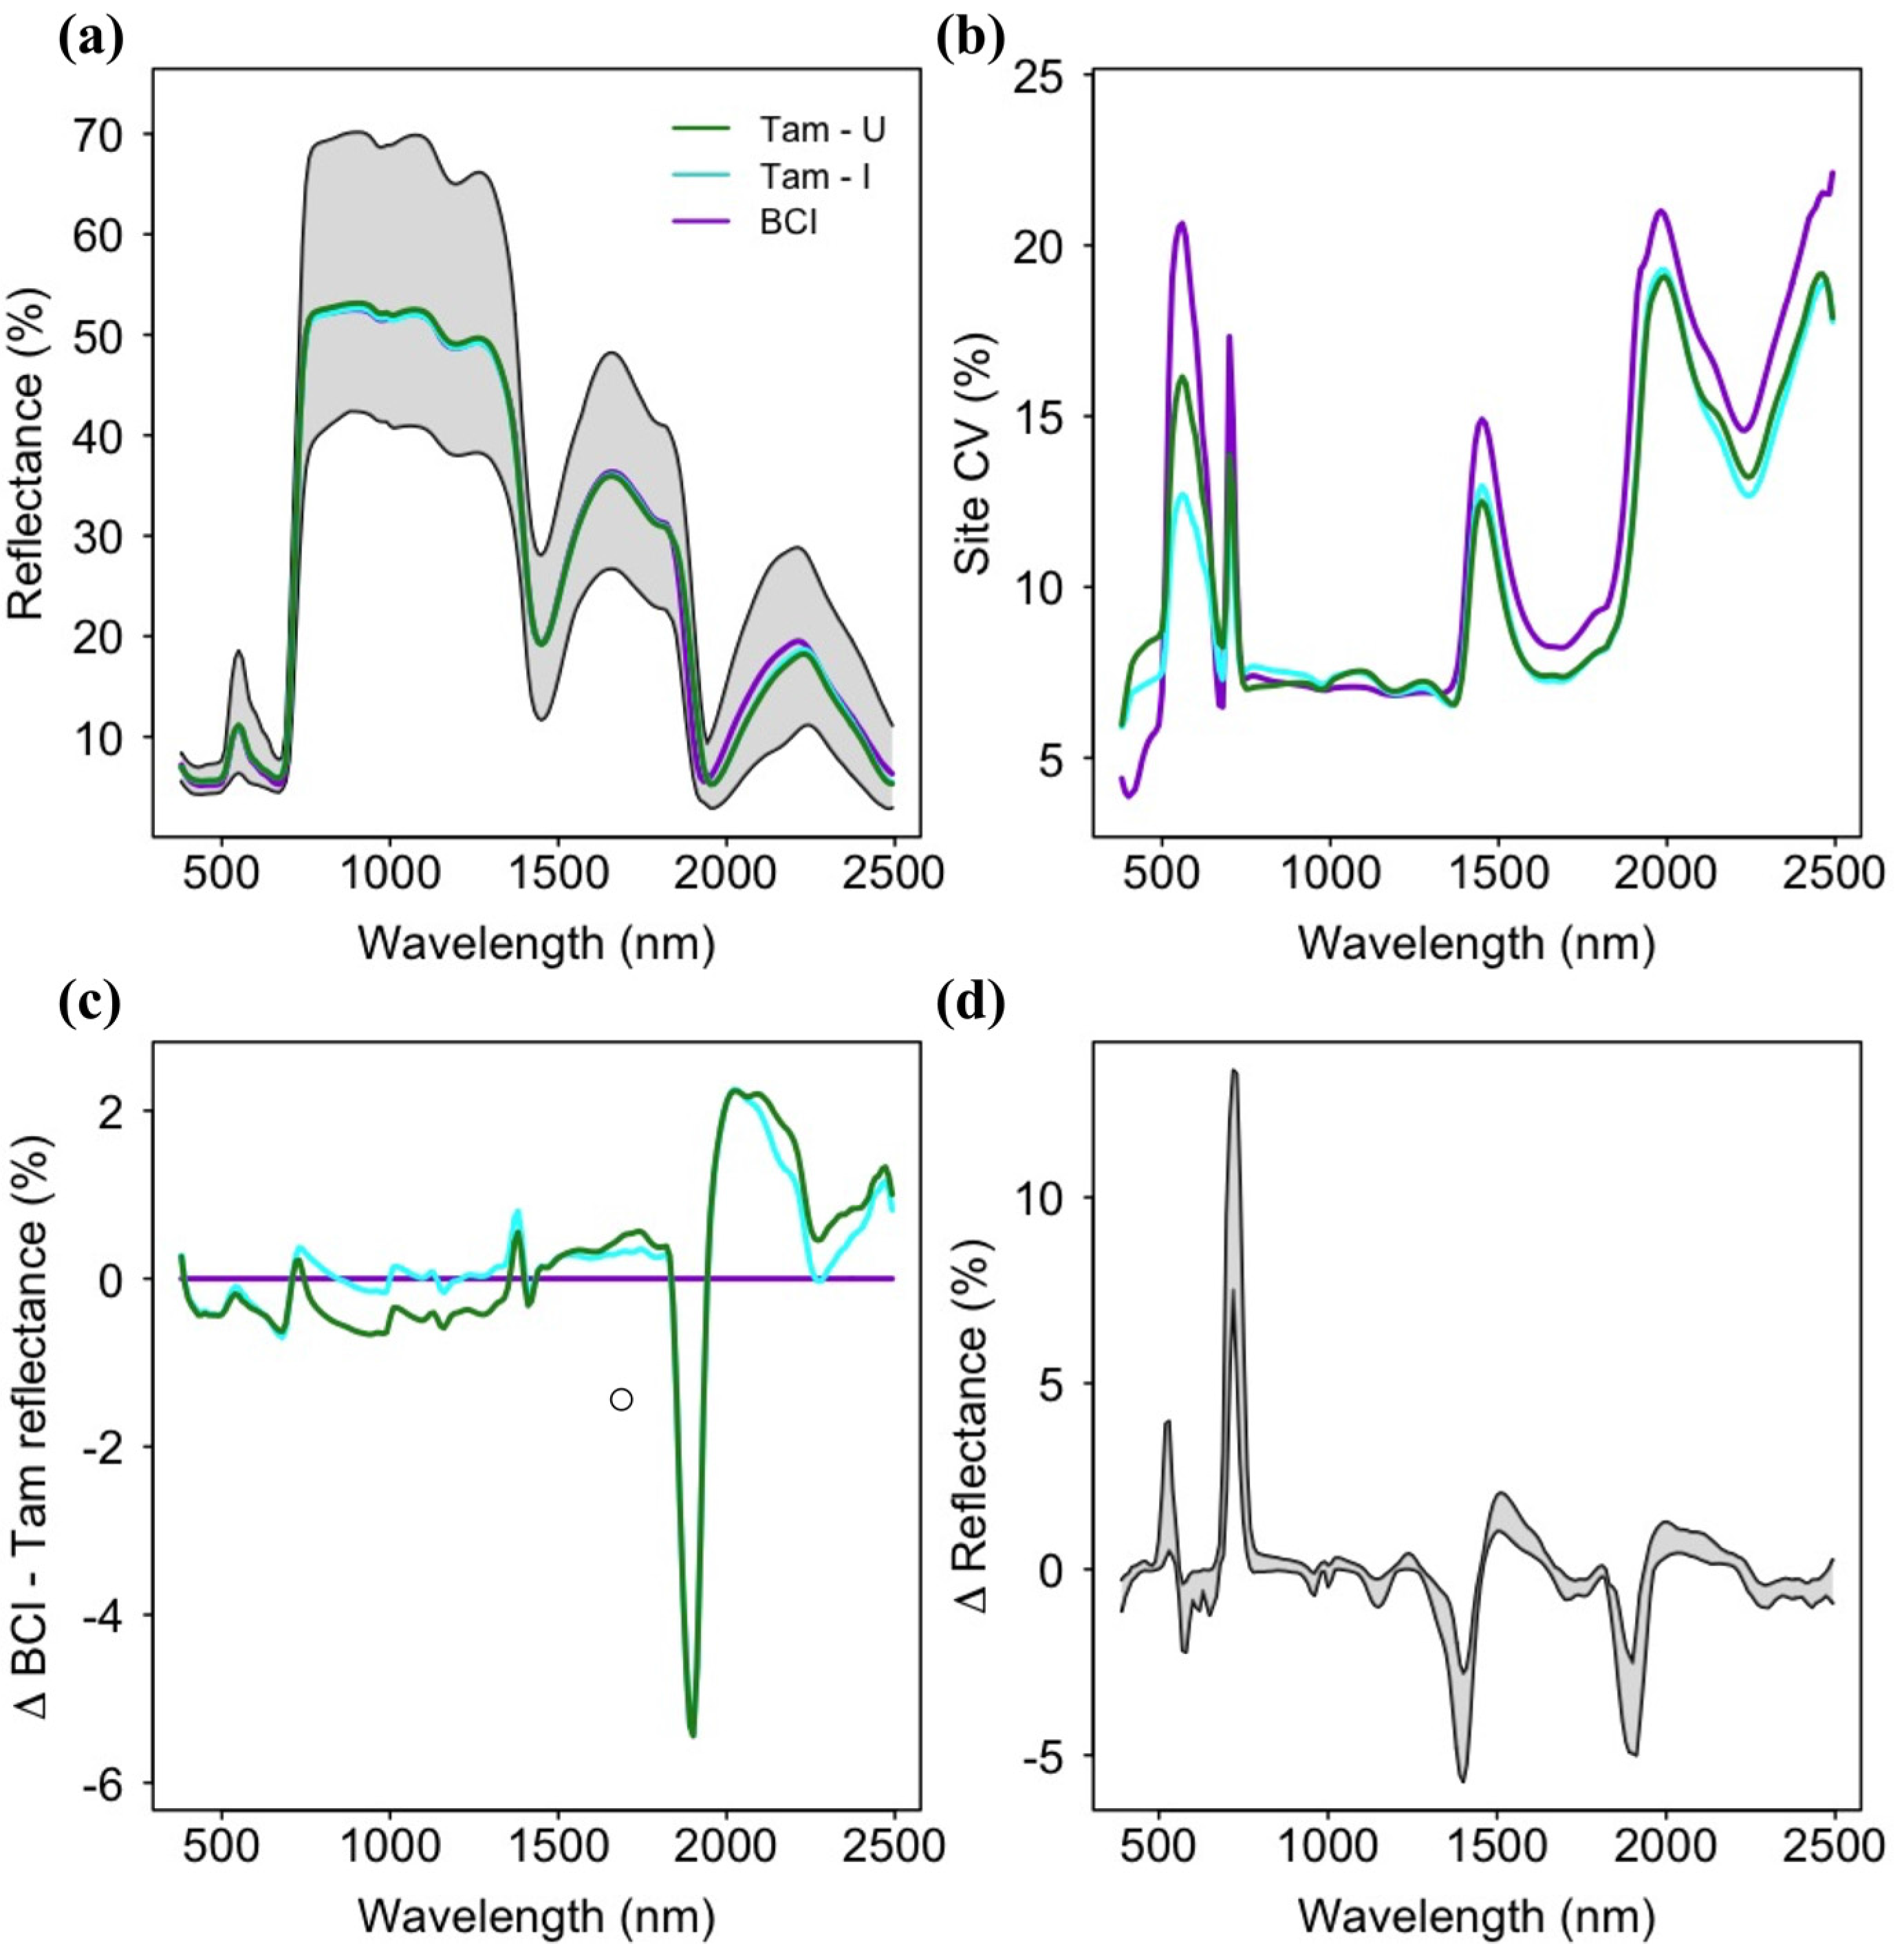
Leaf reflectance spectra indicated similar mean values across sites and high variance among species at all three sites (Figure 2). The highest reflectance values and greatest range were observed in the near-infrared (NIR; 750–1300 nm), but the highest coefficients of variation were found in the shortwave-infrared (SWIR; 1500–2500 nm), followed by the visible spectra region (400–750 nm). Leaf reflectance spectra for Tam-I and Tam-U were generally similar and lower than BCI spectra in the visible range, and generally higher than BCI in the SWIR, with the exception of the absorption feature at ~1800 nm present at both Tambopata sites but absent at BCI. Tam-I and BCI were similar and higher than Tam-U in the NIR. Across the three sites, the change in spectral reflectance from one wavelength to the next (e.g., spectral first derivative) showed low inter-site variation.

Figure 2.
(a) Mean reflectance spectra for each site (colored lines) and range of all reflectance spectra for all sites included in the study (grey area); (b) Spectral coefficients of variation for all sites; (c) Mean differences in spectral reflectance values between sites, with mean BCI reflectance as a baseline for comparison; (d) Minimum and maximum values of the first derivative of spectral reflectance for species at all sites. BCI = Barro Colorado Island (Panama); Tam-I = Tambopata (Peru) Inceptisol site; Tam-U = Tambopata Ultisol site.
3.2. Patterns of Trait Variation and Co-Variation
The majority of traits varied linearly with soil fertility (Table 2). Chlorophyll was significantly different between all three sites, and decreased linearly from the highest fertility site (BCI) to the lowest fertility site (Tam-U). LMA and tannins were highest at Tam-U, and both showed no significant differences between BCI and Tam-I. Phosphorus was highest at the floodplain site in Peru (Tam-I), and Ca was lowest at the terra firme site (Tam-U), with no significant difference between the two high-fertility sites. Phenols and lignin were lowest at Tam-I, and had no significant difference between Tam-U and BCI. No significant between-site differences were found for nitrogen or cellulose. Coefficients of variation were highest for BCI for nearly all traits (excepting Ca and phenols).
Both species mean trait values and phylogenetic independent contrasts (PICs) revealed substantial trait interdependency (Supplementary Table S1). Trait correlations were common among groups of functionally-related traits, such as among the growth-related traits N, LMA, and chlorophyll, which were significantly related among both traits and PICs. Traits co-varied less across functional groups, with moderately weak (r < ~0.4) to no correlations observed among growth, defense, and structural compounds. Species mean trait values for two rock-derived traits, P and Ca, were significantly correlated with nearly all other traits; however, several of these correlations were weaker among PICs, indicating a phylogenetic basis for some patterns of P and Ca covariation (such as both P and Ca with chlorophyll; P with lignin, cellulose, and tannins; and Ca with LMA and phenols). The strongest correlation observed, between species mean values for phenols and tannins (r = 0.90), is largely a consequence of the derivation of tannins as a fraction of total phenols.
3.3. Phylogenetic Structure of Spectra
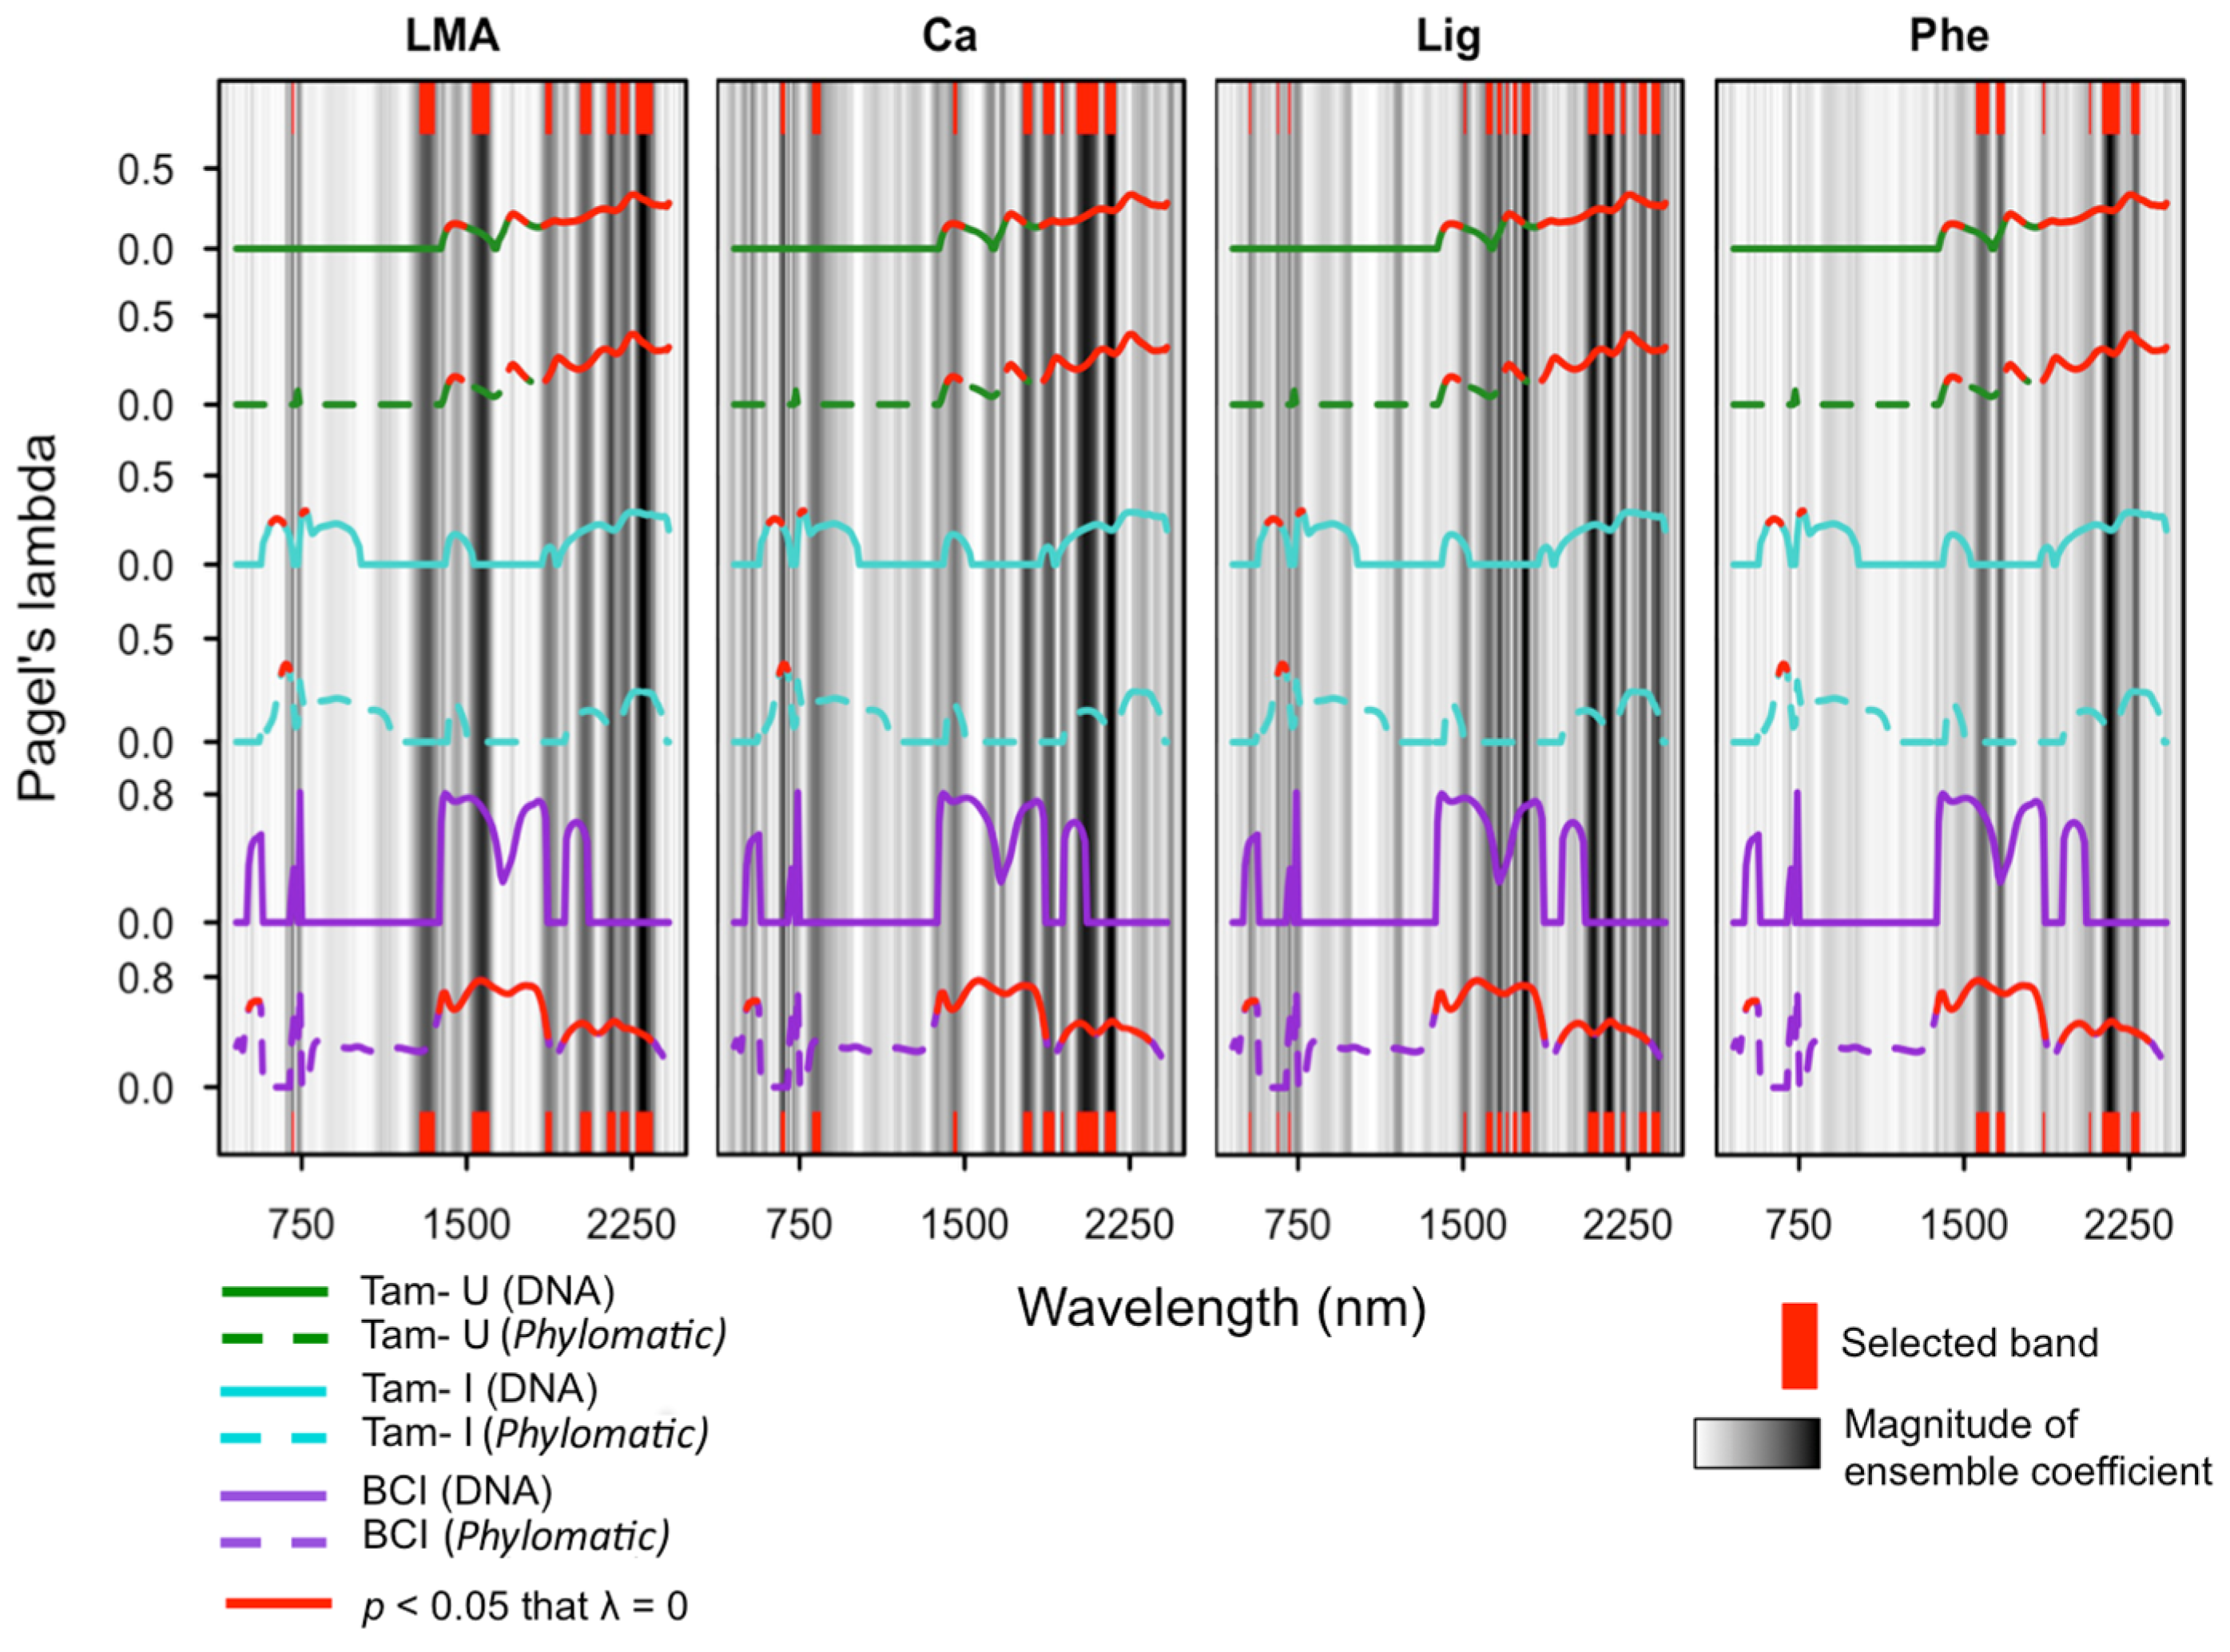
Spectral regions with λ values significantly greater than zero were observed at all sites, and across all phylogenies apart from the DNA-based phylogeny constructed for BCI (Figure 3; Supplementary Figures S8 and S9). Both the DNA-based and Phylomatic phylogenies constructed for all species included in the study showed significant phylogenetic signal within the SWIR, and the Phylomatic phylogeny indicated significant phylogenetic signal within the NIR additionally. A substantial drop in phylogenetic signal is present at ~1900 nm for analyses using both phylogenies, which is concurrent with a well-established water feature present at this spectral location [2,62]. Among the site-specific phylogenies, phylogenetic signal was highest across the SWIR, with λ values significantly greater than zero from ~1400 to 2450 nm at both Tam-U (DNA-based and Phylomatic phylogenies) and BCI (Phylomatic phylogeny only). At the two high-fertility sites, Tam-I and BCI, narrow regions within the visible and near-infrared ranges (VNIR) exhibited λ values significantly greater than zero. At BCI, λ values exhibited two discrete peaks within the visible range, from 440 to 490 nm and from 690 to 720 nm, although only the first peak demonstrated statistical significance (Figure 3). At Tam-I, statistically significant peaks were found from 550 to 610 nm and from 700 to 720 nm. Phylogenetic signal was consistently low or absent throughout the near-infrared (NIR) region across all three sites.
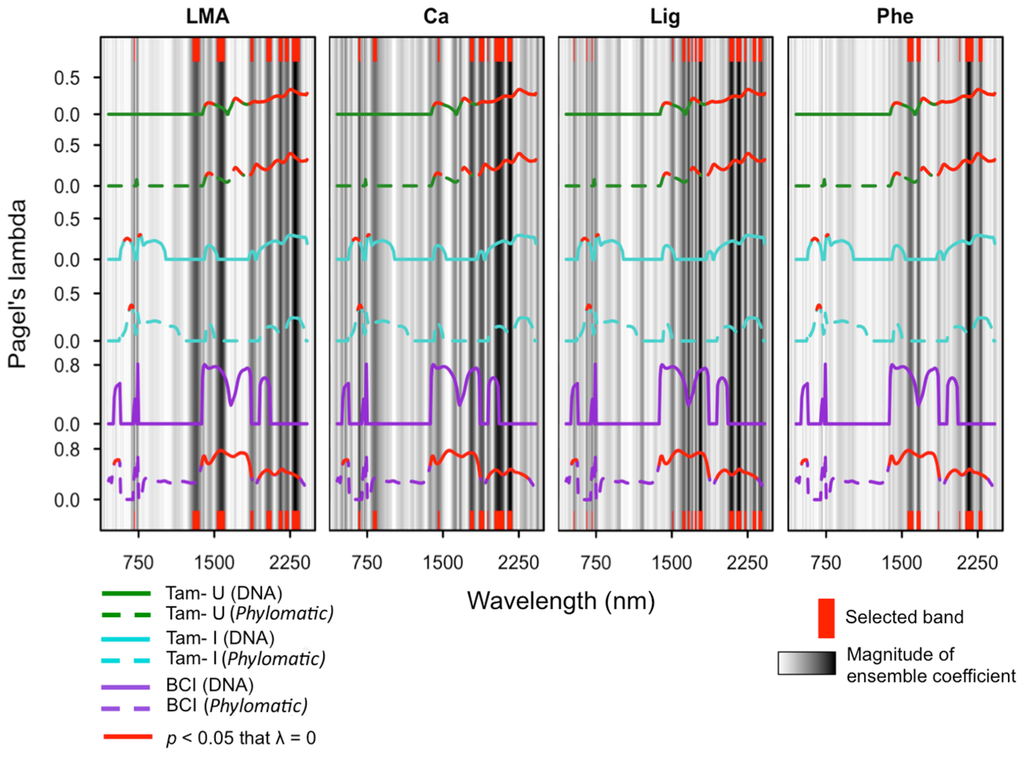
Figure 3.
Phylogenetic signal, as Pagel’s lambda, of species reflectance coefficients at each site for four representative functional traits, overlaid on the multi-model ensemble regression coefficients (grey bars) as measures of band importance to each trait model. Site-specific lambda spectra are indicated by color: BCI=purple; Tam-I = cyan; Tam-U = green; and phylogeny used to generate lambda is indicated by line style: DNA = solid lines; Phylomatic = dashed lines. Red bars (top and bottom) indicate bands selected by the ensemble as most important to the relationship between reflectance and chemical concentration/trait variation. LMA = leaf dry mass per unit area; Ca = calcium; Lig = lignin; Phe = total polyphenols.
3.4. Phylogenetic Structure of Traits
Patterns of phylogenetic signal for traits varied by site and with the methods of phylogenetic construction (e.g., Phylomatic or DNA-based phylogeny; Table 2). For most traits, phylogenetic signal was strongest when all sites were included in the phylogenetic analysis. For all phylogenetic analyses, including both the full phylogenies and site-specific phylogenies, λ values were consistently significantly less than one, the value predicted for traits evolving according to a Brownian motion model of evolution. All traits exhibited λ values significantly greater than zero for the full Phylomatic phylogeny, and all traits except for P and phenols exhibited λ values significantly greater than zero for the full DNA-based phylogeny. Among the site-specific phylogenies, Ca and lignin were the only traits to exhibit λ values significantly greater than zero across all sites. At Tam-I, we consistently found evidence of phylogenetic signal for several traits across both community phylogenies, including N, P, Ca, LMA, and lignin. At Tam-U, both phylogenies indicated phylogenetic signal for N and Ca, and the DNA-based phylogeny additionally indicated phylogenetic signal for lignin, phenols, and tannins.
3.5. Ensemble Selection of Bands for Biochemical Traits
Multi-method ensemble analyses indicated a generally robust link between foliar spectroscopy and leaf traits. Mean ensemble fits (combined R2) ranged from a low of 0.29 for lignin to a high of 0.71 for LMA (Table 3). Among the individual models, PLS and SVM regression models consistently outperformed the RF regression model. Weighted spectral coefficients indicated frequent agreement between the PLS and SVM models in the importance of individual bands for the prediction of biochemical traits, which contributed to the selection of these bands by the ensemble, even when the corresponding RF coefficient was comparatively weak (Supplementary Figures S10). Ensemble models selected 24–40 bands of importance per trait, with the majority of selected bands in the SWIR (Figure 3; Table 3). The two defense traits, phenols and tannins, were expressed exclusively in the SWIR, while the growth related traits (chlorophyll, N, LMA), rock-derived nutrients (Ca, P), and lignin were additionally related to narrow spectral features within the visible range. Only the cellulose and chlorophyll models included bands selected within the NIR.
Table 3.
Ensemble model goodness-of-fit statistics for all traits, including fits for the three regression models which comprise the ensemble, the ensemble average, and the number of bands selected for each trait model. PLS = Partial Least Squares; RF = Random Forest; SVM = Support Vector Machine.
4. Discussion
Within three Neotropical forest communities, we found evidence for phylogenetic structure in foliar reflectance spectra primarily within the visible (400–750 nm) and shortwave infrared (1500–2500 nm) spectral regions, both of which are known to be sensitive to foliar biochemistry (reviewed in Ollinger, 2011 [62]). Moreover, spectral regions exhibiting significant phylogenetic signal broadly overlapped with the spectral regions selected by the multi-model ensemble as those most important to the quantitative prediction of the nine foliar traits measured in this study (Figure 2). The general co-incidence of phylogenetic signal and biochemical correlations within the visible and short spectral regions affirms the importance of these broad regions to quantifying foliar traits and detecting taxonomic differences, and further suggests a biochemical basis for species identification via Spectranomics [25]. However, both the specific spectral regions that displayed phylogenetic structure varied considerably among sites, which may indicate differences in the evolutionary and ecological processes acting within the tropical tree communities at each site.
Within the visible portion of the spectra, we observed contrasting patterns of phylogenetic organization between high and low fertility sites. The phylogenetic signal for species reflectance within discrete regions of the visible spectrum at both high-fertility sites, Tam-I and BCI, may indicate a phylogenetic basis for the absorption of light by chlorophyll and other pigments, which are the predominant biochemical constituents active within this region [3,61]. While we found evidence for a strong chlorophyll band selection in this region, we did not observe phylogenetic signal for chlorophyll itself. However, non-pigment biochemical constituents are known to have an indirect influence on the efficacy of the photosynthetic apparatus, as elements such as N and P are directly and indirectly involved in the biochemistry of photosynthesis [30,63,64].
Soil fertility may play a role in the among-site differences in phylogenetic signal of this spectral region. Nutrient limitation is known to facilitate habitat associations in low-resource tropical tree communities, favoring species that allocate limited resources towards longer-lived, better-defended foliage [11,65]. Across a diverse phylogeny, this process may be expected to yield the convergence of distantly related species on similar trait values, which would reduce phylogenetic signal compared to a Brownian expectation [23]. However, within a relatively high-fertility site, local-scale differences in resource availability (including light availability) may contribute to the maintenance of a wide range of life-history strategies, and therefore permit greater conservation of differences among species [20,66]. Although other explanations are possible, it is not implausible to speculate that resource-based constraints on photosynthesis may explain differences in patterns of phylogenetic signal within the visible range between the high and low-fertility sites in this study.
Phylogenetic structure was observed across broad regions within the SWIR when comparing all species included in the study and was observed to some degree among species present at each site, albeit λ was not significant at all sites or within all community phylogenies (Figure 3). The majority of bands selected by the ensemble for importance to foliar biochemical traits were also located within the SWIR. However, a comparison of patterns of phylogenetic organization between the two Tambopata sites reveals that while more phylogenetic signal is found for foliar reflectance spectra at Tam-U, a larger number of foliar traits show evidence of phylogenetic signal at Tam-I. The relationship between foliar biochemistry and reflectance spectra is complex, particularly within the SWIR, where numerous biochemical constituents may absorb at overlapping wavelengths [67]. Direct links between leaf biochemistry and spectral reflectance within the SWIR are driven by changes in the vibrational or rotational properties of molecules [62,67]. The relationship between these absorption features and elemental leaf traits, such as N, P, or more broadly-defined functional traits such as LMA, is indirect—contingent upon the allocation of elemental resources to specific biochemical compounds (such as N to Rubisco), or biochemical compounds to foliar functional traits (such as lignin to LMA) [31,61]. Patterns of phylogenetic structure within the SWIR may relate more to these specific biochemical differences among species than to laboratory estimates of elemental concentrations or broader functional traits.
A low coefficient of variation (CV) within the near-infrared (750–1500 nm) spectral region across all sites likely contributes to the apparent lack of site-specific phylogenetic signal or importance to prediction of foliar biochemistry within this spectral range (Figure 2b and Figure 3). Given the high diversity of tropical tree species found at each site, low dispersion of reflectance values is likely to result in distantly-related species with spectral values more similar than would be predicted by Brownian model of evolution. However, a high spectral CV does not necessarily predict a high value for lambda, as this variation may or may not correspond to patterns of phylogenetic relatedness. Similarly, low spectral dispersion among species reduces the utility of this region for the prediction of foliar biochemistry (Supplementary Figures S10).
The pattern of phylogenetic organization of traits and spectra at BCI was more contingent upon the methods of phylogenetic construction than for either site at Tambopata. While λ values generated using the Phylocom phylogeny revealed significant phylogenetic structure across a substantial portion of the reflectance spectrum and for a few foliar traits (Ca, lignin), values of λ generated using the DNA-based phylogeny revealed no significant phylogenetic signal for spectra or traits. This contrast is likely driven by differences in phylogenetic resolution between the two phylogenies (Supplementary Figures 1–7). The megatree from which the Phylomatic phylogeny is derived is resolved only to the genus level, and assumes a “comb-shaped” and unresolved phylogeny below this level (i.e., all species equally related) [38]. The Phylomatic phylogeny emphasizes evolutionary signal at the basal branches of the phylogeny, whereas the DNA-based phylogeny also includes resolution at the tips of the phylogeny. Thus, the degree of trait divergence among congeneric species in our DNA-based phylogeny outweighs the estimate for phylogenetic signal restricted to the basal nodes in the Phylomatic phylogeny. While this interpretation holds true across all sites, the effects are most pronounced within the BCI community phylogenies, where a relatively higher proportional representation of recently evolved clades such as Inga and Ficus increases the influence of these evolutionary relationships at the tips of the phylogenetic branches on the overall pattern of phylogenetic signal.
Previous work by Asner and Martin (2011) [12] established the substantial contribution of taxonomic organization to between-species variation of several foliar biochemical traits, many of which contribute to the spectral reflectance signatures of canopy tree species. In the current study, we demonstrate that phylogenetic organization is directly expressed in patterns of spectral variation among species. The patterns of phylogenetic signal observed in the reflectance spectra of three distinct tropical canopy tree communities provide a direct confirmation of the phylogenetic basis of foliar reflectance inferred from the relationships of foliar spectra and traits, and foliar traits and taxonomy [68]. Quantifying this component, using λ or other phylogenetic metrics [14,69], may have many applications in remote sensing, from improving species identification algorithms to providing insights into the processes driving community assembly. Further, incorporating phylogenetic analyses into spectral regression models, such as PLS, RF, and SVM, may facilitate more robust models, by accounting for the statistical non-independence of species [60]. The increasing availability of well-resolved phylogenies and methods for phylogenetic analysis create an opportunity for all those interested in the evolutionary underpinnings of ecological remote sensing.
5. Conclusions
Phylogenetic relationships are known to explain a considerable amount of trait variation among species within tropical forest communities, and foliar trait variation is known to underlie differences in foliar reflectance spectra. In this study, we established that foliar reflectance spectra themselves are influenced by the phylogenetic relatedness of species, and that patterns of trait variation among canopy tree communities vary in ways that are suggestive of both phylogenetic and abiotic constraints on ecological strategies. The increasing ease of obtaining and utilizing well-resolved phylogenies now makes incorporating evolutionary approaches into ecological remote sensing a feasible means of accounting for the statistical non-independence of species, for addressing broad questions of community assembly, and for many other applications in which a robust understanding of the underlying phylogenetic structure of species is useful.
Supplementary Materials
The following are available online at www.mdpi.com/2072-4292/8/3/196, Table S1: Pairwise Pearson’s correlation coefficients for species’ standardized mean foliar trait values (lower diagonal) and phylogenetic independent contrasts (PICs) of trait values utilizing the DNA-based phylogeny (upper diagonal). Levels of significance are indicated with asterisks. LMA = leaf mass per area; Chl = chlorophyll. Figure S1: Comparison of the branching patterns of the DNA-based phylogeny (left-hand tree) and Phylomatic phylogeny (right hand tree) to the family level for all taxa included in the study. ^: families included only in the DNA-based phylogeny; *: families included only in the Phylomatic phylogeny. Figure S2: DNA phylogeny for BCI, representing 62 species with available genetic sequences. Figure S3: Phylomatic phylogeny for BCI, representing 69 species included in the APG megatree. Figure S4: DNA phylogeny for Tam-I, representing 121 species with available genetic sequences. Figure S5: Phylocom phylogeny for Tam-I, representing 115 species included in the APG megatree. Figure S6: DNA phylogeny for Tam-U, representing 141 species with available genetic sequences. Figure S7: Phylomatic phylogeny for Tam-U, representing 144 species included in the APG megatree. Figure S8: Phylogenetic signal, as Pagel’s lambda, of species reflectance coefficients for all species at all sites included in the study, utilizing (a) the DNA-based phylogeny and (b) the Phylomatic phylogeny. Figure S9: Phylogenetic signal, as Pagel’s lambda, of species reflectance coefficients at each site for five functional traits, overlaid on the multi-model ensemble regression coefficients (grey bars) as measures of band importance to each trait model. Site-specific lambda spectra are indicated by color: BCI = purple; Tam-I = cyan; Tam-U = green; and phylogeny used to generate lambda is indicated by line style: DNA = solid lines; Phylocom = dashed lines. Red bars (top and bottom) indicate bands selected by the ensemble as most important to the relationship between reflectance and chemical concentration/trait variation. Chl = chlorophyll; N = nitrogen; P = phosphorus; Cel = cellulose; Tan = tannins. Figure S10: Spectral coefficients for three regression models that comprise the multi-model ensemble, weighted by individual model fit statistic (R2). For each wavelength, the ensemble coefficient is equal to the sum of the three individual model coefficients. Bands selected as most influential for each biochemical trait by the ensemble are indicated by grey bars. LMA = leaf mass per area; Chl = chlorophyll; N = nitrogen; Ca = calcium; P = phosphorus; Cel = cellulose; Phe = phenols; Tan = tannins; Lig = lignin.
Acknowledgments
We thank the Spectranomics team for field, laboratory, and remote sensing assistance. We thank Caroline Puente and the Smithsonian Tropical Research Institute for assistance with the molecular data for species collected at BCI, Panama, and we thank the Canadian Centre for DNA Barcoding (CCDB) at the Biodiversity Institute of Ontario, University of Guelph for assistance with the processing of genetic sequences from sites in Tambopata, Peru. This study and the Spectranomics Project are supported by the John D. and Catherine T. MacArthur Foundation.
Author Contributions
K.M.M., G.P.A., and C.B.F. conceived and designed this study. G.P.A. and R.E.M. developed and implemented the sampling design, spectral analyses, and chemical analyses. K.G.D., W.J.K., and K.M.M. collaborated on the phylogenetic analyses. K.M.M. wrote the manuscript; all authors provided editorial advice.
Conflicts of Interest
The authors declare no conflict of interest.
References
- Asner, G.P. Organismic remote sensing for tropical forest ecology and conservation. Ann. Mo. Bot. Gard. 2015, 100, 127–140. [Google Scholar] [CrossRef]
- Kokaly, R.F.; Asner, G.P.; Ollinger, S.V.; Martin, M.E.; Wessman, C.A. Characterizing canopy biochemistry from imaging spectroscopy and its application to ecosystem studies. Remote Sens. Environ. 2009, 113, S78–S91. [Google Scholar] [CrossRef]
- Ustin, S.L.; Gitelson, A.A.; Jacquemoud, S.; Schaepman, M.; Asner, G.P.; Gamon, J.A.; Zarco-Tejada, P. Retrieval of foliar information about plant pigment systems from high resolution spectroscopy. Remote Sens. Environ. 2009, 113, S67–S77. [Google Scholar] [CrossRef]
- Homolová, L.; Malenovský, Z.; Clevers, J.G.P.W.; García-Santos, G.; Schaepman, M.E. Review of optical-based remote sensing for plant trait mapping. Ecol. Complex. 2013, 15, 1–16. [Google Scholar] [CrossRef]
- White, J.C.; Coops, N.C.; Hilker, T.; Wulder, M.A.; Carroll, A.L. Detecting mountain pine beetle red attack damage with EO-1 Hyperion moisture indices. Int. J. Remote Sens. 2007, 28, 2111–2121. [Google Scholar] [CrossRef]
- Dahlin, K.M.; Asner, G.P.; Field, C.B. Environmental and community controls on plant canopy chemistry in a Mediterranean-type ecosystem. Proc. Natl. Acad. Sci. USA 2013, 110, 6895–6900. [Google Scholar] [CrossRef] [PubMed]
- Fassnacht, F.E.; Latifi, H.; Ghosh, A.; Joshi, P.K.; Koch, B. Assessing the potential of hyperspectral imagery to map bark beetle-induced tree mortality. Remote Sens. Environ. 2014, 140, 533–548. [Google Scholar] [CrossRef]
- Clark, M.; Roberts, D.; Clark, D. Hyperspectral discrimination of tropical rain forest tree species at leaf to crown scales. Remote Sens. Environ. 2005, 96, 375–398. [Google Scholar] [CrossRef]
- Kalacska, M.; Bohlman, S.; Sanchez-Azofeifa, G.A.; Castro-Esau, K.; Caelli, T. Hyperspectral discrimination of tropical dry forest lianas and trees: Comparative data reduction approaches at the leaf and canopy levels. Remote Sens. Environ. 2007, 109, 406–415. [Google Scholar] [CrossRef]
- Feret, J.-B.; Asner, G.P. Mapping tropical forest canopy diversity using high-fidelity imaging spectroscopy. Ecol. Appl. 2014, 24, 1289–1296. [Google Scholar] [CrossRef]
- Fyllas, N.M.; Patiño, S.; Baker, T.R.; Bielefeld Nardoto, G.; Martinelli, L.A.; Quesada, C.A.; Paiva, R.; Schwarz, M.; Horna, V.; Mercado, L.M.; et al. Basin-wide variations in foliar properties of Amazonian forest: Phylogeny, soils and climate. Biogeosciences 2009, 6, 2677–2708. [Google Scholar] [CrossRef]
- Asner, G.P.; Martin, R.E. Canopy phylogenetic, chemical and spectral assembly in a lowland Amazonian forest. New Phytol. 2011, 189, 999–1012. [Google Scholar] [CrossRef] [PubMed]
- Freckleton, R.P.; Harvey, P.H.; Pagel, M. Phylogenetic analysis and comparative data: A test and review of evidence. Am. Nat. 2002, 160, 712–726. [Google Scholar] [CrossRef] [PubMed]
- Blomberg, S.P.; Garland, T.; Ives, A.R. Testing for phylogenetic signal in comparative data: Behavioral traits are more labile. Evolution 2003, 57, 717–745. [Google Scholar] [CrossRef] [PubMed]
- Webb, C.O.; Ackerly, D.D.; McPeek, M.A.; Donoghue, M.J. Phylogenies and community ecology. Annu. Rev. Ecol. Syst. 2002, 33, 475–505. [Google Scholar] [CrossRef]
- Kress, W.J.; Erickson, D.L.; Jones, F.A.; Swenson, N.G.; Perez, R.; Sanjur, O.; Bermingham, E. Plant DNA barcodes and a community phylogeny of a tropical forest dynamics plot in Panama. Proc. Natl. Acad. Sci. USA 2009, 106, 18621–18626. [Google Scholar] [CrossRef] [PubMed]
- Hollingsworth, P.M.; Graham, S.W.; Little, D.P. Choosing and using a plant DNA barcode. PLoS ONE 2011, 6. [Google Scholar] [CrossRef] [PubMed]
- Kembel, S.W.; Hubbell, S.P. The phylogenetic structure of a neotropical forest tree community. Ecology 2006, 87, S86–S99. [Google Scholar] [CrossRef]
- Kraft, N.J.B.; Cornwell, W.K.; Webb, C.O.; Ackerly, D.D. Trait evolution, community assembly, and the phylogenetic structure of ecological communities. Am. Nat. 2007, 170, 271–283. [Google Scholar] [CrossRef] [PubMed]
- Wright, S.J.; Kitajima, K.; Kraft, N.J.B.; Reich, P.B.; Wright, I.J.; Bunker, D.E.; Condit, R.; Dalling, J.W.; Davies, S.J.; Díaz, S.; et al. Functional traits and the growth–mortality trade-off in tropical trees. Ecology 2010, 91, 3664–3674. [Google Scholar] [CrossRef] [PubMed]
- Baraloto, C.; Hardy, O.J.; Paine, C.E.T.; Dexter, K.G.; Cruaud, C.; Dunning, L.T.; Gonzalez, M.-A.; Molino, J.-F.; Sabatier, D.; Savolainen, V.; et al. Using functional traits and phylogenetic trees to examine the assembly of tropical tree communities. J. Ecol. 2012, 100, 690–701. [Google Scholar] [CrossRef]
- Kress, W.J.; García-Robledo, C.; Uriarte, M.; Erickson, D.L. DNA barcodes for ecology, evolution, and conservation. Trends Ecol. Evol. 2014, 30, 25–35. [Google Scholar] [CrossRef] [PubMed]
- Kraft, N.J.B.; Ackerly, D.D. Functional trait and phylogenetic tests of community assembly across spatial scales in an Amazonian forest. Ecol. Monogr. 2010, 80, 401–422. [Google Scholar] [CrossRef]
- Townsend, A.R.; Cleveland, C.C.; Asner, G.P.; Bustamante, M.M.C. Controls over foliar N:P ratios in tropical rain forests. Ecology 2007, 88, 107–118. [Google Scholar] [CrossRef]
- Asner, G.P.; Martin, R.E. Airborne spectranomics: Mapping canopy chemical and taxonomic diversity in tropical forests. Front. Ecol. Environ. 2009, 7, 269–276. [Google Scholar] [CrossRef]
- Durgante, F.M.; Higuchi, N.; Almeida, A.; Vicentini, A. Species spectral signature: Discriminating closely related plant species in the Amazon with near-infrared leaf-spectroscopy. For. Ecol. Manag. 2013, 291, 240–248. [Google Scholar] [CrossRef]
- Lang, C.; Costa, F.R.C.; Camargo, J.L.C.; Durgante, F.M.; Vicentini, A. Near infrared spectroscopy facilitates rapid identification of both young and mature Amazonian tree species. PLoS ONE 2015, 10. [Google Scholar] [CrossRef] [PubMed]
- Pagel, M. Inferring the historical patterns of biological evolution. Nature 1999, 401, 877–884. [Google Scholar] [CrossRef] [PubMed]
- Crisp, M.D.; Cook, L.G. Phylogenetic niche conservatism: What are the underlying evolutionary and ecological causes? New Phytol. 2012, 196, 681–694. [Google Scholar] [CrossRef] [PubMed]
- Field, C.; Mooney, H.A. Photosynthesis-nitrogen relationship in wild plants. In Proceedings of the Sixth Maria Moors Cabot Symposium on the Economy of Plant Form and Function, 29 August 1986; Givnish, T.J., Ed.; Cambridge University Press: Cambridge, UK; pp. 25–56.
- Westoby, M. A leaf-height-seed (LHS) plant ecology strategy scheme. Plant Soil 1998, 199, 213–227. [Google Scholar] [CrossRef]
- Poorter, H.; Niinemets, Ü.; Poorter, L.; Wright, I.J.; Villar, R. Causes and consequences of variation in leaf mass per area (LMA): A meta-analysis. New Phytol. 2009, 182, 565–588. [Google Scholar] [CrossRef] [PubMed]
- Vitousek, P.M.; Sanford, R.L. Nutrient cycling in moist tropical forest. Annu. Rev. Ecol. Syst. 1986, 17, 137–167. [Google Scholar] [CrossRef]
- Melillo, J.M.; Aber, J.D.; Muratore, J.F. Nitrogen and lignin control of hardwood leaf litter decomposition dynamics. Ecology 1982, 63, 621–626. [Google Scholar] [CrossRef]
- Feeny, P. Plant apparency and chemical defense. Recent Adv. Phytochem. 1976, 10, 1–40. [Google Scholar]
- Coley, P.D. Costs and benefits of defense by tannins in a neotropical tree. Oecologia 1986, 70, 238–241. [Google Scholar] [CrossRef]
- Feilhauer, H.; Asner, G.P.; Martin, R.E. Multi-method ensemble selection of spectral bands related to leaf biochemistry. Remote Sens. Environ. 2015, 164, 57–65. [Google Scholar] [CrossRef]
- Webb, C.O.; Donoghue, M.J. Phylomatic: Tree assembly for applied phylogenetics. Mol. Ecol. Notes 2005, 5, 181–183. [Google Scholar] [CrossRef]
- Woodring, W.P. Geology of Barro Colorado Island, Canal Zone; Smithsonian Institution: Washington, DC, USA, 1958; Volume 4304. [Google Scholar]
- Baillie, I.; Elsenbeer, H.; Barthold, F.; Grimm, R.; Stallard, R.F. Semi-Detailed Soil Survey of Barro Colorado Island; Smithsonian Tropical Research Institute: Panama City, Panama, 2007. [Google Scholar]
- Vitousek, P.M. Litterfall, nutrient cycling, and nutrient limitation in tropical forests. Ecology 1984, 65, 285–298. [Google Scholar] [CrossRef]
- Messmer, T.; Elsenbeer, H.; Wilcke, W. High exchangeable calcium concentrations in soils on Barro Colorado Island, Panama. Geoderma 2014, 217–218, 212–224. [Google Scholar] [CrossRef]
- Leigh, E.G. Tropical Forest Ecology: A View from Barro Colorado Island; Oxford University Press: Oxford, UK, 1999. [Google Scholar]
- Yavitt, J.B. Nutrient dynamics of soil derived from different parent material on Barro Colorado Island, Panama. Biotropica 2000, 32, 198–207. [Google Scholar] [CrossRef]
- Asner, G.P.; Anderson, C.B.; Martin, R.E.; Tupayachi, R.; Knapp, D.E.; Sinca, F. Landscape biogeochemistry reflected in shifting distributions of chemical traits in the Amazon forest canopy. Nat. Geosci. 2015, 8, 567–573. [Google Scholar] [CrossRef]
- Quesada, C.A.; Lloyd, J.; Schwarz, M.; Baker, T.R.; Phillips, O.L.; Patiño, S.; Czimczik, C.; Hodnett, M.G.; Herrera, R.; Arneth, A.; et al. Regional and large-scale patterns in Amazon forest structure and function are mediated by variations in soil physical and chemical properties. Biogeosci. Discuss. 2009, 6, 3993–4057. [Google Scholar] [CrossRef]
- Asner, G.P.; Martin, R.E. Convergent elevation trends in canopy chemical traits of tropical forests. Glob. Change Biol. 2015. [Google Scholar] [CrossRef] [PubMed]
- Martin, C.C. Environmental Genomics; Methods in Molecular Biology; Humana Press: Totowa, NJ, USA, 2008; Volume 410. [Google Scholar]
- Katoh, K. MAFFT: A novel method for rapid multiple sequence alignment based on fast Fourier transform. Nucleic Acids Res. 2002, 30, 3059–3066. [Google Scholar] [CrossRef] [PubMed]
- Stamatakis, A.; Hoover, P.; Rougemont, J. A rapid bootstrap algorithm for the RAxML web servers. Syst. Biol. 2008, 57, 758–771. [Google Scholar] [CrossRef] [PubMed]
- Miller, M.A.; Pfeiffer, W.; Schwartz, T. Creating the CIPRES Science Gateway for inference of large phylogenetic trees. In Proceedings of the 2010 Gateway Computing Environments Workshop (GCE), New Orleans, LA, USA, 14 November 2010; pp. 1–8.
- Sanderson, M.J. A nonparametric approach to estimating divergence times in the absence of rate constancy. Mol. Biol. Evol. 1997, 14, 1218–1231. [Google Scholar] [CrossRef]
- Paradis, E.; Claude, J.; Strimmer, K. APE: Analyses of phylogenetics and evolution in R language. Bioinformatics 2004, 20, 289–290. [Google Scholar] [CrossRef] [PubMed]
- R Development Core Team. R Data Import/Export, Version 2.10.0; 2009. [Google Scholar]
- Webb, C.O.; Ackerly, D.D.; Kembel, S.W. Phylocom: Software for the analysis of phylogenetic community structure and trait evolution. Bioinformatics 2008, 24, 2098–2100. [Google Scholar] [CrossRef] [PubMed]
- Gastauer, M.; Meira-Neto, J.A.A. Avoiding inaccuracies in tree calibration and phylogenetic community analysis using Phylocom 4.2. Ecol. Inform. 2013, 15, 85–90. [Google Scholar] [CrossRef]
- Wikström, N.; Savolainen, V.; Chase, M.W. Evolution of the angiosperms: Calibrating the family tree. Proc. Biol. Sci. 2001, 268, 2211–2220. [Google Scholar] [CrossRef] [PubMed]
- Münkemüller, T.; Lavergne, S.; Bzeznik, B.; Dray, S.; Jombart, T.; Schiffers, K.; Thuiller, W. How to measure and test phylogenetic signal. Methods Ecol. Evol. 2012, 3, 743–756. [Google Scholar] [CrossRef]
- Revell, L.J. Phytools: An R package for phylogenetic comparative biology (and other things). Methods Ecol. Evol. 2012, 3, 217–223. [Google Scholar] [CrossRef]
- Felsenstein, J. Confidence limits on phylogenies: An approach using the bootstrap. Evolution 1985, 39, 783–791. [Google Scholar] [CrossRef]
- Garland, T.; Harvey, P.H.; Ives, A.R. Procedures for the analysis of comparative data using phylogenetically independent contrasts. Syst. Biol. 1992, 41, 18–32. [Google Scholar] [CrossRef]
- Ollinger, S. V. Sources of variability in canopy reflectance and the convergent properties of plants. New Phytol. 2011, 189, 375–394. [Google Scholar] [CrossRef] [PubMed]
- Mutanga, O.; Skidmore, A.K.; van Wieren, S. Discriminating tropical grass (Cenchrus ciliaris) canopies grown under different nitrogen treatments using spectroradiometry. ISPRS J. Photogramm. Remote Sens. 2003, 57, 263–272. [Google Scholar] [CrossRef]
- Reich, P.B.; Oleksyn, J.; Wright, I.J. Leaf phosphorus influences the photosynthesis-nitrogen relation: A cross-biome analysis of 314 species. Oecologia 2009, 160, 207–212. [Google Scholar] [CrossRef] [PubMed]
- Fine, P.V.A.; Miller, Z.J.; Mesones, I.; Irazuzta, S.; Appel, H.M.; Stevens, M.H.H.; Sääksjärvi, I.; Schultz, J.C.; Coley, P.D. The growth-defense trade-off and habitat specialization by plants in Amazonian forests. Ecology 2006, 87, S150–S162. [Google Scholar] [CrossRef]
- Reich, P.B.; Wright, I.J.; Cavender-Bares, J.; Craine, J.M.; Olesksyn, J.; Westoby, M.; Walters, M.B. The evolution of plant functional variation: Traits, spectra, and strategies. Int. J. Plant Sci. 2003, 164, S143–S164. [Google Scholar] [CrossRef]
- Curran, P.J. Remote sensing of foliar chemistry. Remote Sens. Environ. 1989, 30, 271–278. [Google Scholar] [CrossRef]
- Asner, G.P.; Martin, R.E.; Tupayachi, R.; Anderson, C.B.; Sinca, F.; Carranza-Jiménez, L.; Martinez, P. Amazonian functional diversity from forest canopy chemical assembly. Proc. Natl. Acad. Sci. USA 2014, 111, 5604–5609. [Google Scholar] [CrossRef] [PubMed]
- Revell, L.J. Size-correction and principal components for interspecific comparative studies. Evolution 2009, 63, 3258–3268. [Google Scholar] [CrossRef] [PubMed]
© 2016 by the authors; licensee MDPI, Basel, Switzerland. This article is an open access article distributed under the terms and conditions of the Creative Commons by Attribution (CC-BY) license (http://creativecommons.org/licenses/by/4.0/).