1. Introduction
Maritime traffic on the world’s oceans is growing as a result of increasing international trade in commodities and goods [
1]. This has led to demands for improved global surveillance capability in the maritime domain, in order to monitor usage of particular maritime routes, ensure adherence to international policies and decisions concerning global sea-borne trade, reduce its adverse impacts on the marine environment, and better manage the associated risks [
2]. It is thus fundamental to develop knowledge about ship traffic distribution which, in turn, depends partly on being able to compile statistics on a global scale. One of the main challenges to creating a global ship density map is the possibility of generating timely statistics, independently of any support from ground services.
In general, the main techniques used for objectively reporting ship movements are the AIS (Automatic Identification System), the LRIT (Long Range Identification and Tracking), and the VMS (Vessel Monitoring System) [
3,
4,
5]. The AIS data can be collected from coastal stations or satellites. The LRIT data are limited to EU-Flagged ships, and the main purpose of the VMS is to monitor fishing vessels. However, the global ocean is not uniformly covered. Coastal stations provide coverage in some areas, with a typical range of 20 nautical miles. Satellites provide a more homogeneous geographical coverage, but still provide relatively poor spatio-temporal coverage for various reasons, including the fact that AIS equipment is not mandatory for smaller ships. Therefore, ship reporting data needs to be combined with other sources of information in order to estimate ship density maps at the global scale.
Ship detection by spaceborne Synthetic Aperture Radar (SAR) and high-resolution optical sensors is a mature discipline (see [
6,
7,
8,
9,
10,
11]). Recently, a satellite technique based on pulse-limited radar altimetry has been proposed [
12] and the increased availability of open-access satellite data has stimulated further the development of these techniques. Based on the analysis of high posting-rate waveform data, echoes returned from ships appear as signatures in the noise portion of the received waveforms (
i.e., in the samples received by the radar before the echo return from the sea surface). Other non-ocean targets (e.g., lighthouses and icebergs) can also be identified from the different level of their backscattered power. Hence, altimeter data could potentially be used to estimate global maritime traffic density. Indeed, altimeter data from seven different satellites has been used to generate a database of ships over two decades (1992–2012) allowing annual density maps of maritime traffic to be produced for the entire globe [
13].
With the introduction of SAR altimetry, which offers coherent Doppler processing of the received signals and makes more efficient usage of the power reflected from the surface [
14], providing better along-track resolution and a higher signal-to-noise ratio (SNR), it is now possible to detect smaller features than before [
15]. This improvement in performance has already been demonstrated thanks to the data from the Synthetic Interferometric Radar Altimeter (SIRAL) carried on the European Space Agency (ESA) CryoSat-2 [
16]. SIRAL has three different working modalities, including the emulation of “conventional” pulse-limited altimetry. SAR-mode operation is mostly used in the contexts of sea-ice, coastal areas and in some specific inland waters. The ESA mission Sentinel-3, recently launched (16 February 2016) as part of the Copernicus program, will be the first mission to provide SAR-mode altimetry over the entire ocean. Hence, enhanced operational mapping of global maritime traffic is a very real possibility in the near future.
In this paper we analyze the capabilities of the CryoSat-2 SIRAL instrument operating in SAR mode for the detection and discrimination of multiple targets in a complex electromagnetic scenario. We propose a strategy for the detection of electromagnetic anomalies, which are usually associated with large ships. As an example of the potential of SAR altimetry, we present a test-case including a scenario with multiple targets and focus on geometric aspects, so as to assess the compatibility between the structures detected and the actual location and characteristics of the ships observed. The information retrieved from the analysis of the CryoSat-2 SIRAL SAR waveforms has been validated against ships’ position data provided by the AIS. The possibility of roughly estimating the height of individual vessels using radargrams after an unfocused SAR compression is also discussed and validated against the known specifications of the particular vessels detected. Hence, the main contribution of this work is to further improve conventional altimetry analysis for the automatic detection of anomalous targets.
The paper is organized as follows: radar altimetry and ground truth (
in situ) data sets are presented in
Section 2.
Section 3 presents the methodology applied to the radar waveforms in order to detect anomalous targets.
Section 4 shows the results of the analysis in terms of detection and geometry estimation of the anomalous targets, and validation using ground truth data. Finally, in
Section 5 there is a short discussion of the results and concluding remarks about the potential of SAR altimetry for operational maritime surveillance.
2. Datasets
2.1. CryoSat-2 Data
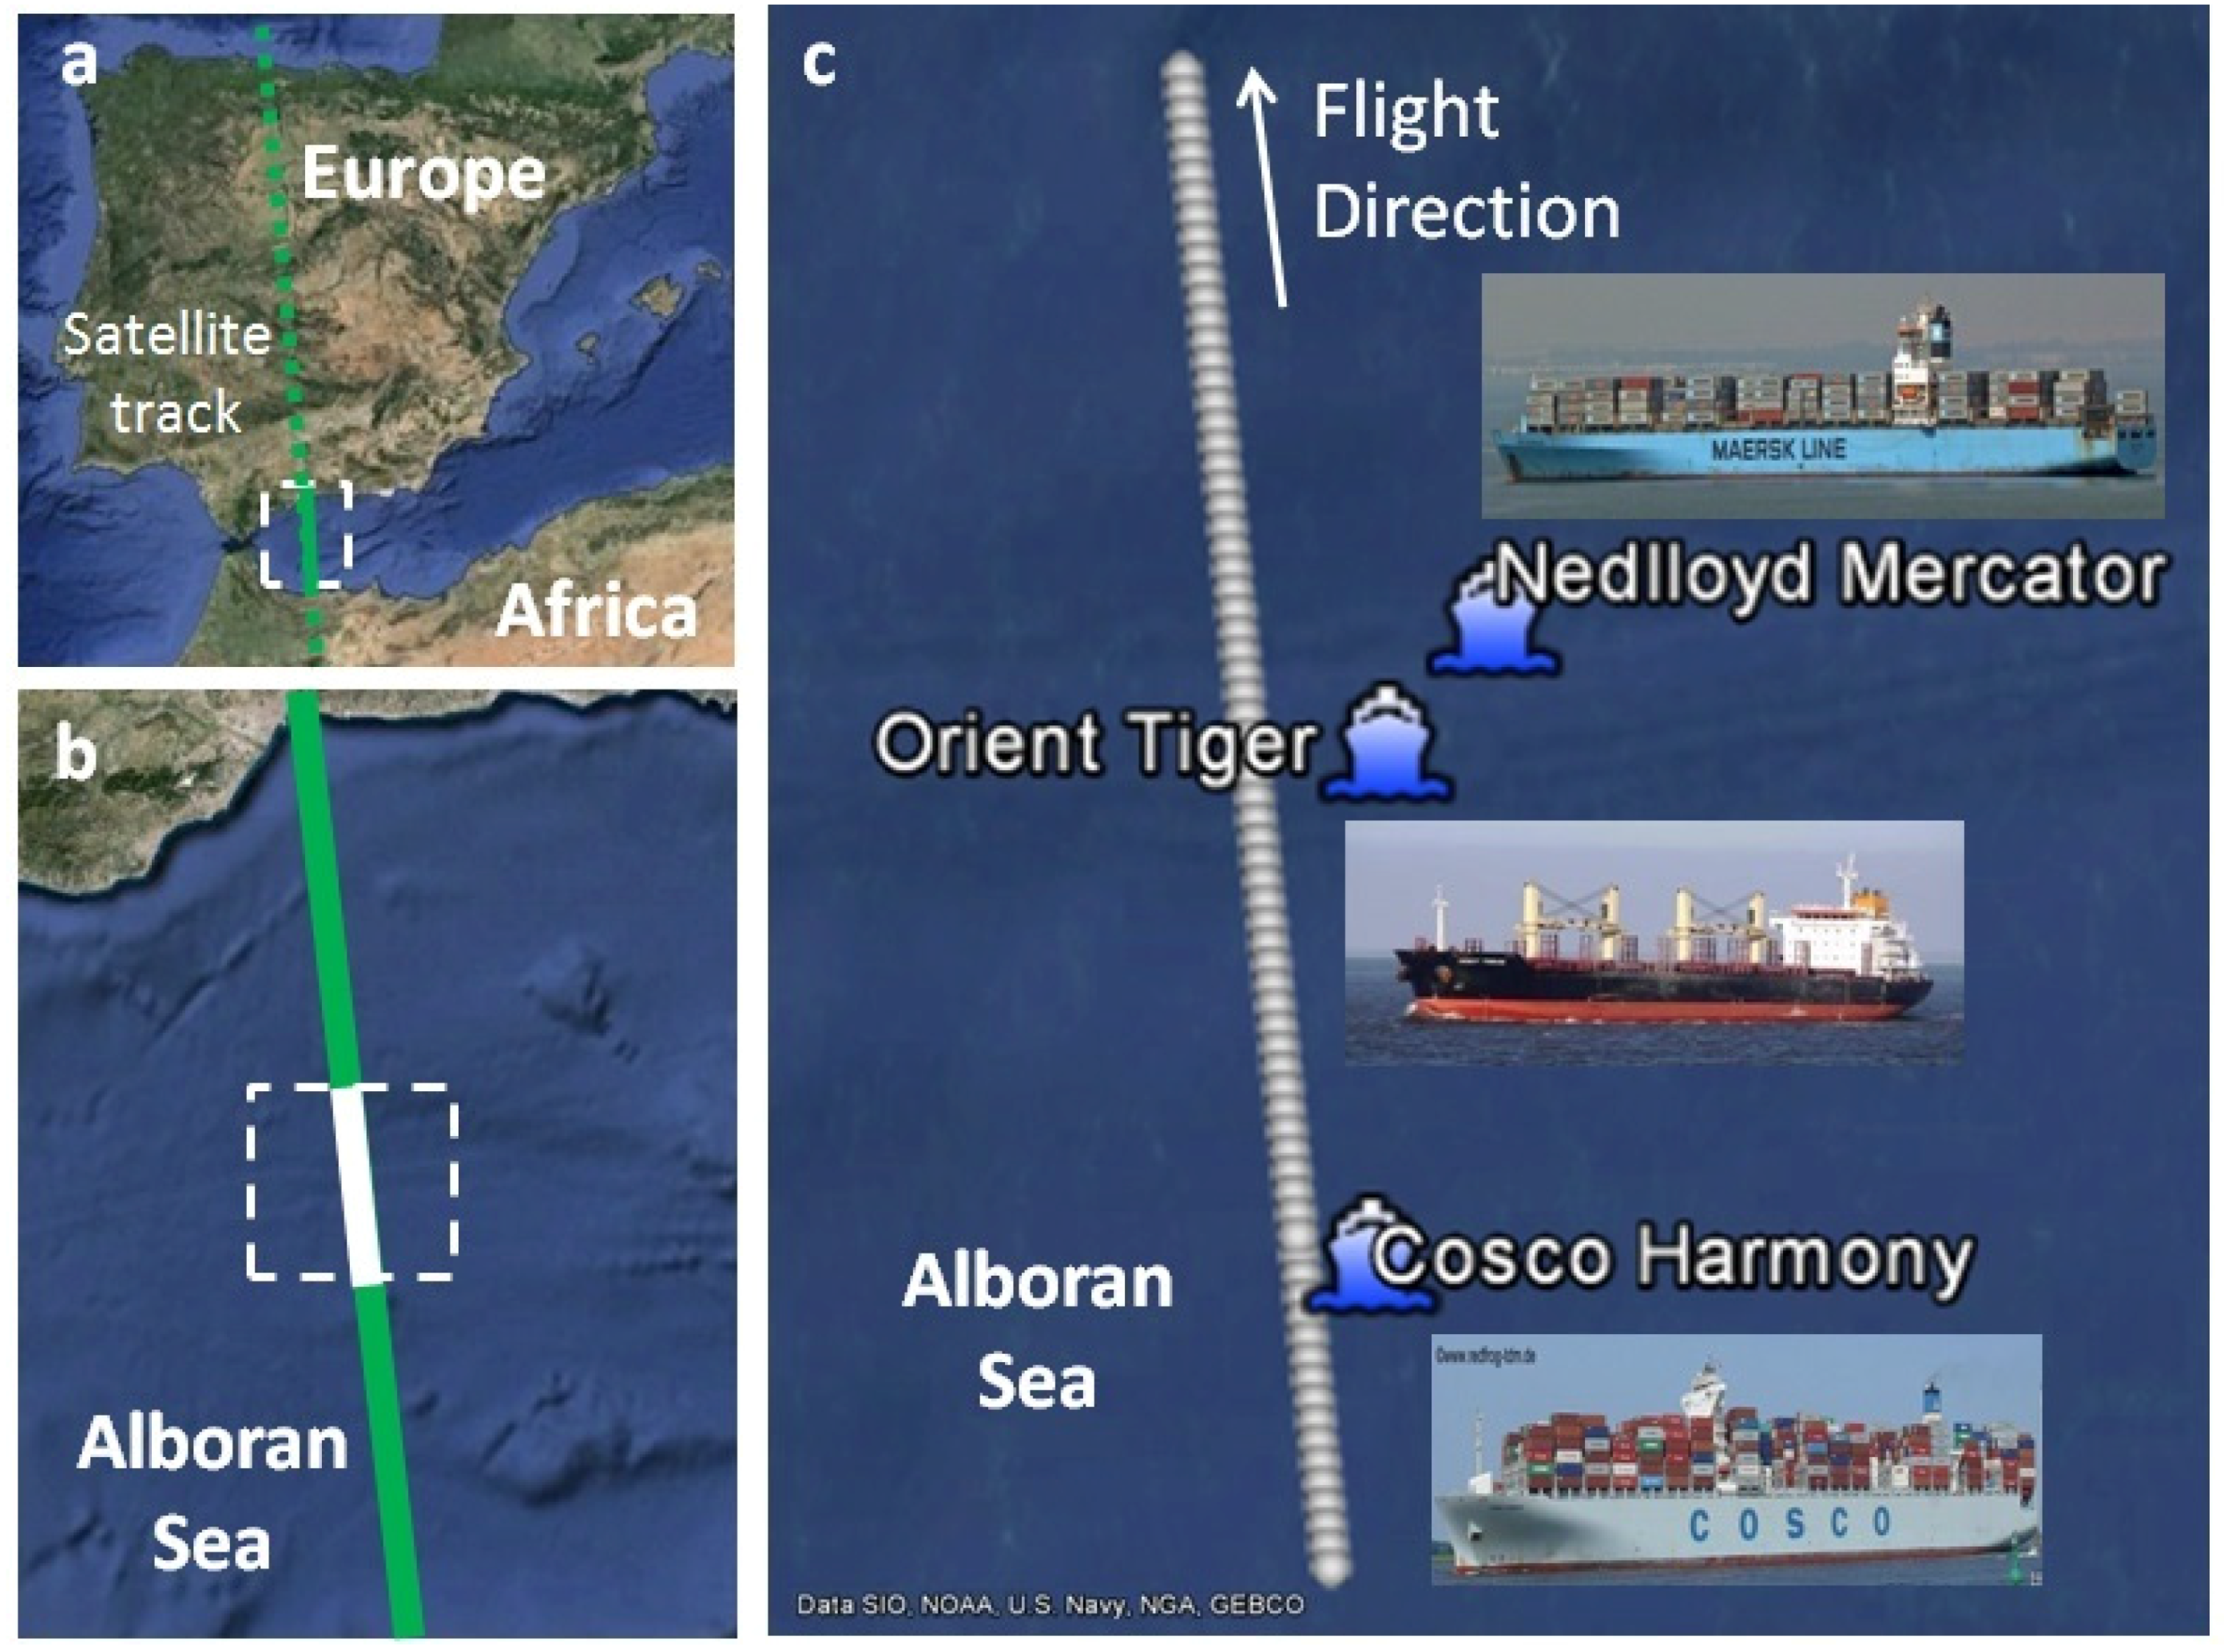
This section presents the CryoSat-2 SIRAL data collected in the study area, the Alboran Sea in the Western Mediterranean Sea between Africa and Europe (
Figure 1). The Strait of Gibraltar lies at the western end of the Alboran Sea, and connects the Mediterranean Sea and the Atlantic Ocean. This is one of the world’s major sea routes with extremely dense maritime traffic. The radar altimeter installed on the CryoSat-2 operates in SAR mode in the Alboran Sea and this presents a good opportunity for testing the capabilities of SAR altimetry in the detection of non-ocean targets. To do this, we exploited the GPOD (Grid Processing On-Demand) and SARvatore (SAR versatile altimetric toolkit for ocean research and exploitation) [
17], which is based on the re-processing of SAR data in coastal zones. GPOD allows users to set their own configuration strategy for the data processing [
18].
In SAR Mode, the CryoSat-2 altimeter transmits a burst of pulses with an interval of only 50 microseconds between each pulse; this is different from conventional radar altimeters, where the interval between pulses is about 500 microseconds. The backscattered echoes are thus correlated, and by treating the whole burst of pulses in one operation, the data processor can separate the echo into 64 strips (Doppler beams) arranged across the track by exploiting the slight frequency shifts (caused by the Doppler effect) in the forward- and aft-looking parts of the beam. Each contiguous Doppler beam is about 250 m wide in the along-track direction and the interval between bursts corresponds to the satellite moving forward by 250 m each time. The strips laid down by successive bursts can, therefore, be superimposed on each other and averaged to reduce noise. A full description of the CryoSat-2 measurements in SAR mode and its geometry is available in [
18,
19,
20,
21].
We analyze the Level-1b waveforms, which are obtained from GPOD according to the following processing steps. First, a Hamming Weighting Window is applied on the SAR burst data in the along-track direction in order to reduce aliasing in the main-lobes of the received signal due to the effect of side-lobe ambiguities. Second, beam-forming is applied to mitigate the effect of highly variable surfaces in the Doppler beam formation. Third, zero-padding is applied to the digital samples before the range Fourier transform so as to reduce the inadequate sampling of the waveform leading edge in low wave height conditions [
19]. Finally, waveforms are visualized with 512 range bins at a range resolution of 0.234 m [
20]. This processing allows an improved along-track resolution of about 250–300 m (Doppler-limited footprint) leaving unchanged the across-track resolution to the pulse-limited footprint width (around 1500 m) [
21].
We inspected all the CryoSat-2 tracks crossing the study area during the time period for which AIS historical data were available, with the objective of identifying satellite passages with multiple ships in the proximity of the satellite route, according to the independent positioning system used (AIS).
2.2. AIS Data
We used AIS data to determine the position of relevant ships at the time of SIRAL measurements, in the time interval from 30 min before to 30 min after crossing the satellite track. By resorting to the playback option available at [
22], where the ships’ positions were given every 10 min, the trajectories were reconstructed and the position of each of the nearby ships at the precise time of the satellite passage was estimated.
This test-case focuses on the satellite passage matching the dates of available AIS historical data, on a specific date (8 August 2012) and UTC time (11:55 a.m.), which corresponded to a northward track over the Alboran Sea. This is an interesting case-study to see the possible effect of multiple ships close to the satellite track. We present the analysis for a portion of the ground track segment of 73 consecutive waveforms located far enough from the coast in order to avoid land contamination effects.
The focus of our analysis is on ships located at a maximum perpendicular distance of 7 km on either side of the track. This distance corresponds to the radius of the beam-limited footprint for the CryoSat-2 radar altimeter [
21]. In accordance with this criterion, we identified three ships sufficiently close to the CryoSat-2 track segment (
Figure 1). Information on these three ships is reported in
Table 1; the name, type, length and beam of the ship are recovered from the freely available database at [
23]. The positions of the ships reported in
Table 1 are interpolated at the exact time of the radar measurements by using the AIS positions at 11:50:00 (5 min before the SAR observation) and 12:00:00 (5 min after SAR observations) UTC time. The courses of the ships were obtained by analyzing their trajectories considering ±30 min from the time of the radar measurement.
3. Methodology
3.1. Anomaly Index Parameter
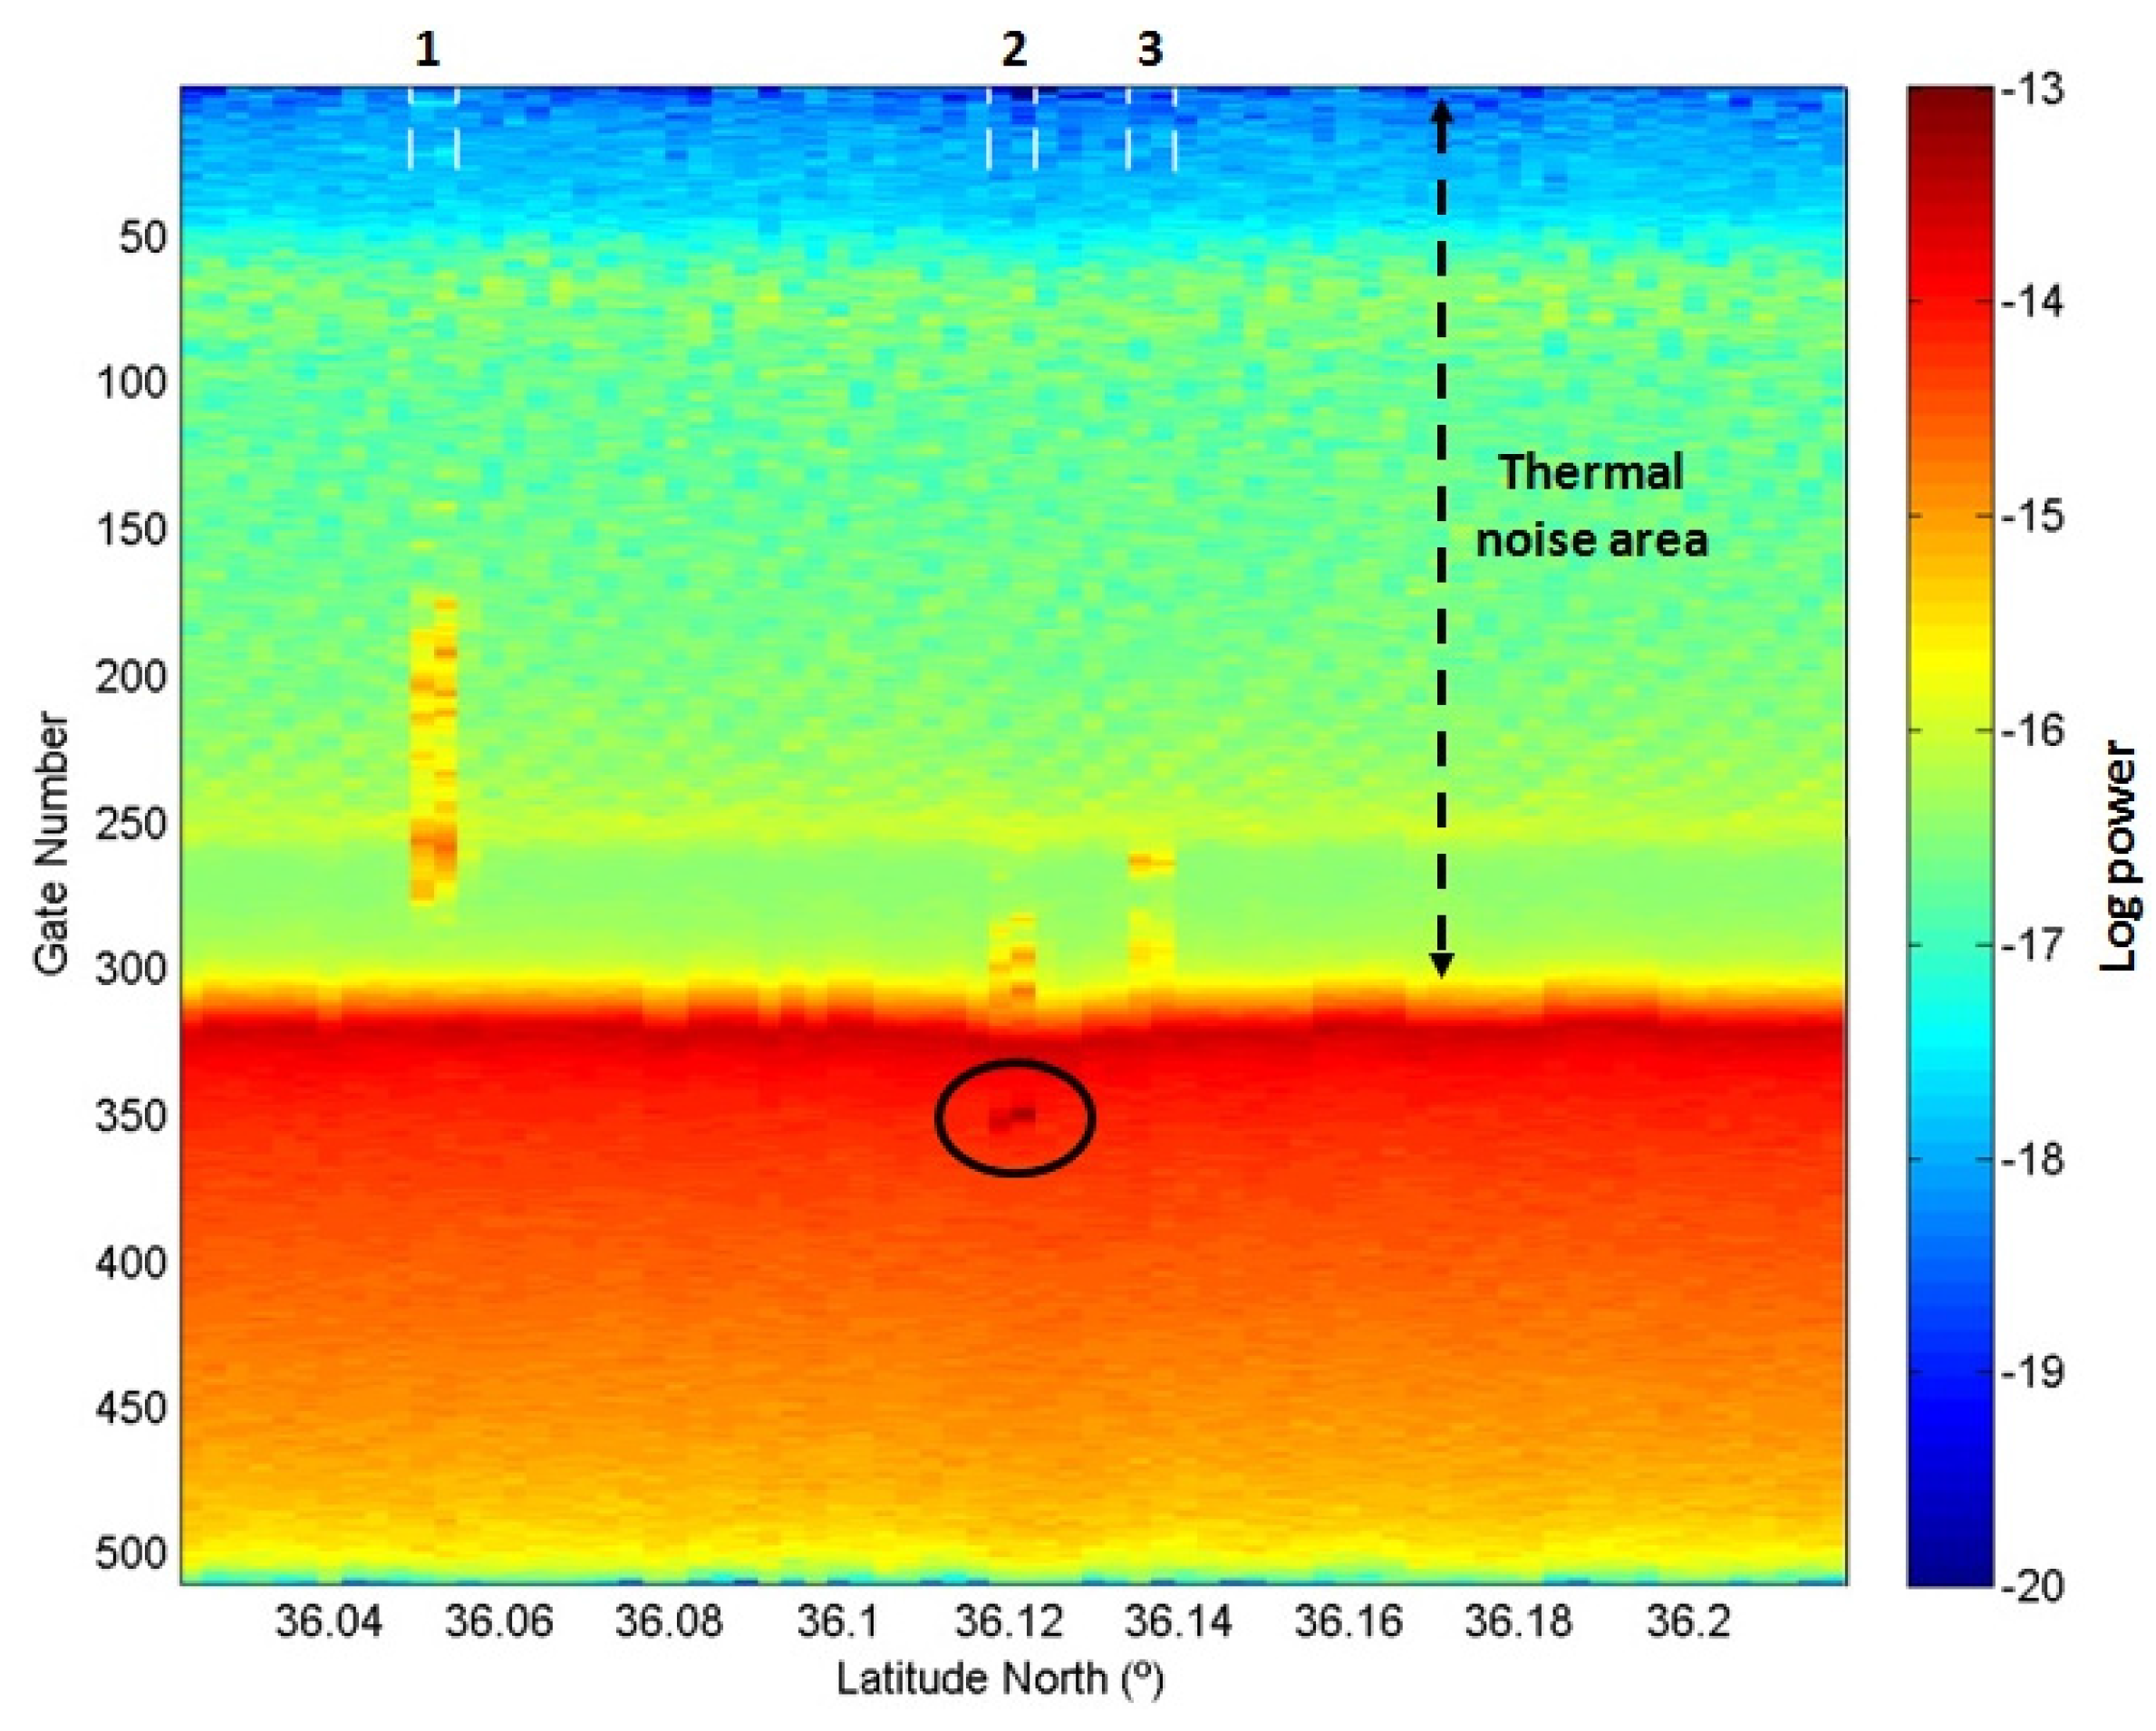
Figure 2 illustrates the collected radargram for the track segment shown in
Figure 1c. As mentioned, the number of gates is 512 with a height resolution (
h_res) per bin of 0.234 m [
20]. The effect of the ships is evident when plotting the power of the received signal in a log10 scale. We observe anomalous signals on few waveforms corresponding to positions close to the location of ships retrieved by the AIS. In particular, three structures are clearly identified in the thermal noise of the sensor (
Figure 2) and a strong return also spans the trailing edge of the water echoes at latitude 36.12°N (structure 2). This last return is indicative of the existence of an off-nadir scatterer characterized by a significant radar cross-section.
As mentioned, Tournadre [
12] analyzed the perturbations falling in the thermal noise region of conventional altimeter waveforms (TOPEX/Poseidon and Jason-1). The effect of ships and beacons in the footprint of the radar antenna was clearly seen in the form of along-track hyperbolic signatures in the thermal noise region. The same hyperbolic features were also observed with Envisat RA-2, where a tomographic approach was deployed in order to perform the focusing of these hyperbolas [
24].
Differently, in the CryoSat-2 Delay/Doppler SAR waveforms (
Figure 2), the signature reflecting the presence of the ships (and any other potential scatterer) reduces to a single spotted region due to the SAR processing applied in order to obtain the Level-1b data. This is an important difference with respect to conventional radar altimetry and has not reported before. During the range compression a Fast Fourier Transform is applied to the Doppler beam waveforms in the stack generated in the previous steps of the SAR processing. Before the range compression, a zero-padding is applied, avoiding aliasing of the signal. The multi-looking step consists of the multi-looking (Doppler shift) of the stack of the co-located and range-compressed Doppler beams (looks) [
19]. The looks of the stack are incoherently summed in the along-track direction reducing the speckle/thermal noise. This corresponds to an unfocused SAR compression [
15]. Thus, the SAR processing includes coherent processing (range compression) followed by incoherent averaging (multi-looking) [
20]. The signal associated with the non-ocean scatterers (ships) analyzed in this test-case might be of the same order of magnitude as the speckle noise in most of the waveforms; thus, they might be knocked down in the processing described. This is in agreement with a previous analysis of non-ocean targets detection using CryoSat-2 data [
25]. The authors analyzed the signature of an iceberg in the thermal noise region using Full Bit Rate (FBR) waveforms; they observed a parabola after processing the FBR data in low-resolution mode (also known as conventional altimeter waveforms) and a bright spot when the same signals were processed in SAR mode.
Multiple scatterers are clearly grouped in structures as described in
Figure 2, spanning a range of bins that is potentially conveying information about the geometrical features of the targets detected. Geometric properties such as these, which are embedded in the received waveforms, may be useful for reducing detection ambiguities. In particular, it is possible to analyze the compatibility between the characteristics of the detected structures and certain geometric features of the ships that were present in the scenario at the time of the satellite pass (see
Table 1). A discussion of this important aspect will be presented in the next section.
In this context, it is important to define a consistent and repeatable method for identifying anomalous signals, after the merely visual individuation performed in the representation domain, as shown in
Figure 2. Thus, we introduce a metric to assess the degree of anomaly of each acquired waveform, in terms of its distance from a reference one. Each waveform (in its vectorial representation) consists of 512 range bins, where each bin corresponds to a single component of the vector space, and can be associated with a scalar quantity that we designate the Anomaly Index Parameter (AIP):
where WF
i,k is the generic waveform notation, for the i-th waveform and k-th bin. 512 is the number of range bins.
is the centroid of the whole dataset expressed as:
where N is the number of signals. The AIP is, thus, defined as the L2 (
i.e., Euclidean) distance from each waveform in its vectorial representation to the centroid of the whole dataset. Before measuring the L2 distance, waveforms are aligned in the time domain according to the lag of their maximum cross-correlation with an “average waveform”. In particular, the centroid can be seen as an “average waveform”, built as a vector where each element (range bin) is the mean of the corresponding elements of all the collected signals, put in vectorial form. Therefore, for each waveform where anomalous signals are not present, the “anomaly index” is low, whereas the presence of anomalous signals entails a significantly higher “anomaly index” score.
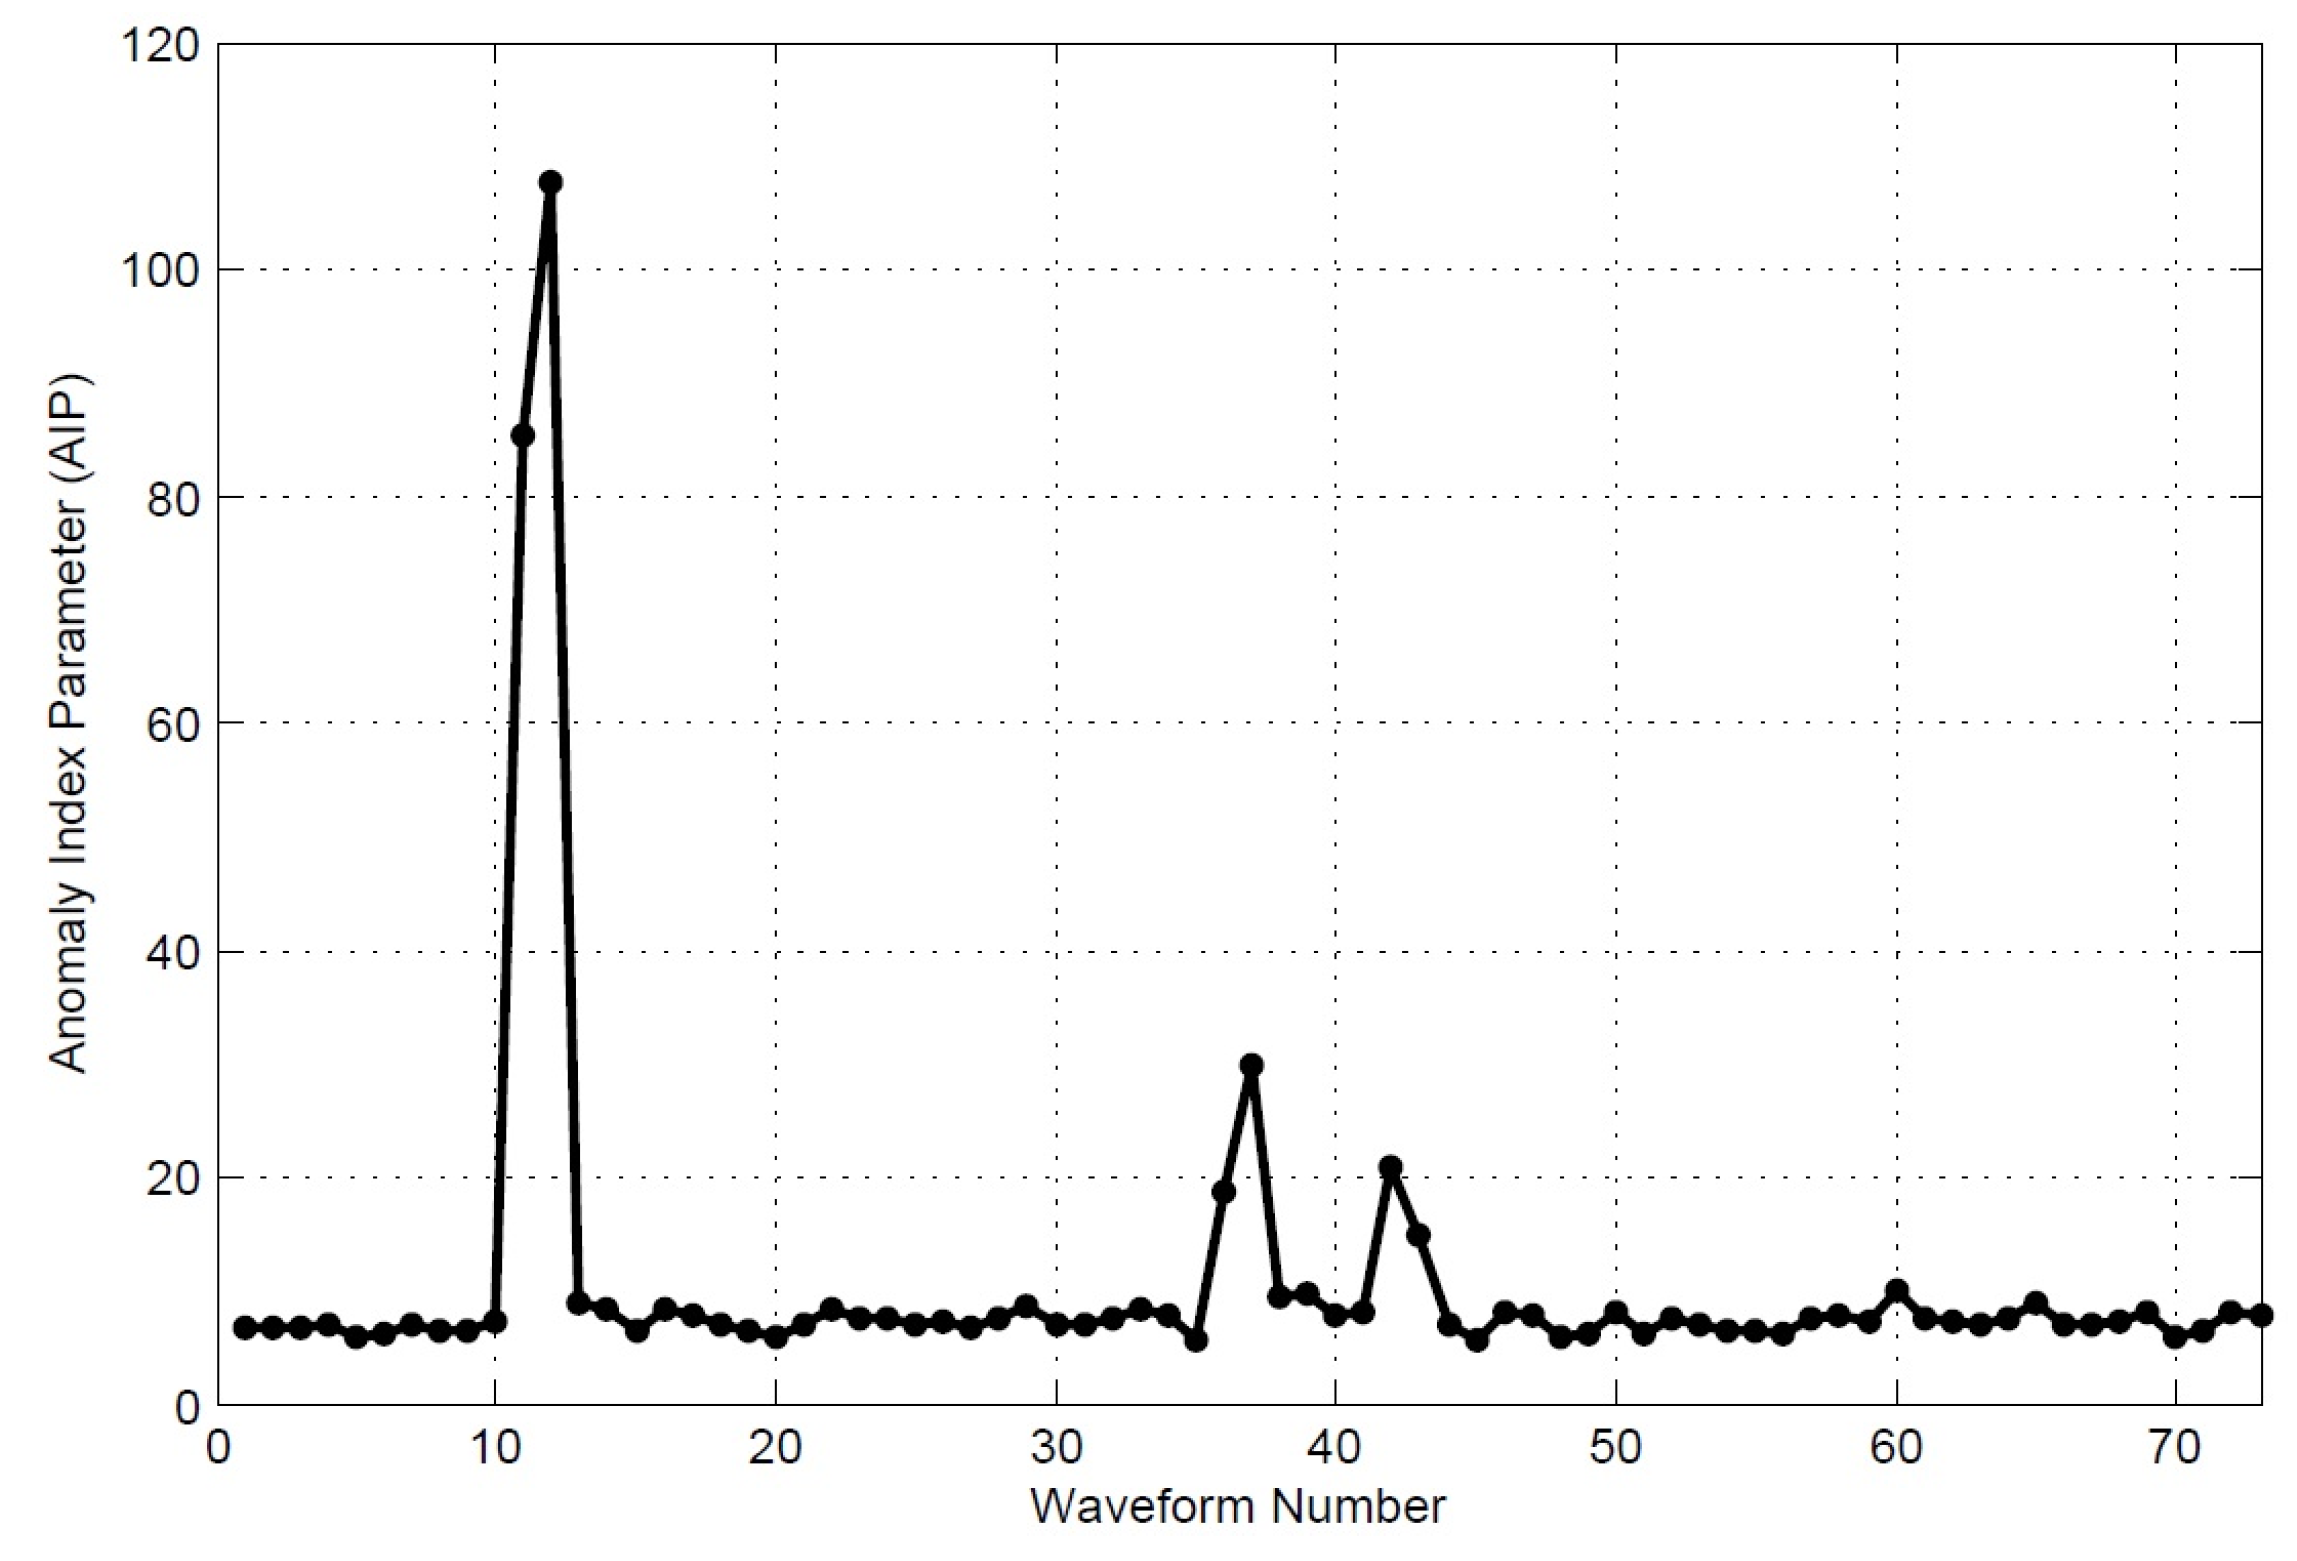
Figure 3 depicts the AIP for the 73 waveforms of our case study. The AIP can also be projected directly onto the satellite track, so as to understand its relationship with the location of potential targets in the area. This approach permits a straightforward representation of the collected waveforms in terms of distance from an expected behavior, directly linked with the position of such “anomalies”.
Figure 4 shows such projection with a colour assignment representing the AIP score in the log scale. As expected, the three very high values of AIP seen in
Figure 3 correspond to the three structures observed in
Figure 2 in the radargram domain, but, more interestingly, their projections onto the satellite track shown in
Figure 4 are in the proximity of the known vessels as located by the AIS.
3.2. Analysis of the Geometric Characteristics of the Structures Detected
The individuated structures are further analyzed. We focus on the compatibility between the anomalies observed in the radargram and the ships located in the proximity of the along-track positions, according to the AIS data. The AIP-based analysis identified three concentrated anomalies (whose projections are shown in
Figure 4), while the radargram in
Figure 2 also presents three clear structures, all of them concentrated in two consecutive waveforms as is also the case for the AIP, with no appreciable effect on the adjacent waveforms. We estimate the “apparent height” of these structures according to the following expression:
where
gateFirst represents the bin number where the first range bin with a non-ocean (anomalous) reflection is individuated. The quantity
gateLast corresponds to the last bin chosen between: (i) the waveform peak (
i.e., at the maximum backscatter from the water surface); and (ii) the last bin identified as anomalous. This procedure is adopted because eventual off-nadir scatterers close to the sea surface generally exhibit an echo that is masked by the ocean backscatter; however, this happens with exceptions, as shown in
Figure 2, structure 2. Thus, eventually appreciable non-ocean signals in the trailing edge of the typical water echo can be taken into account. In addition,
gateFirst and
gateLast may be located either in the noise region or in the trailing edge of the ocean waveform, depending on the geometric characteristics of the observed target, as will be discussed later.
Equation (3) is used to estimate the structure’s apparent height above sea-level (
app_h), by considering the height resolution (
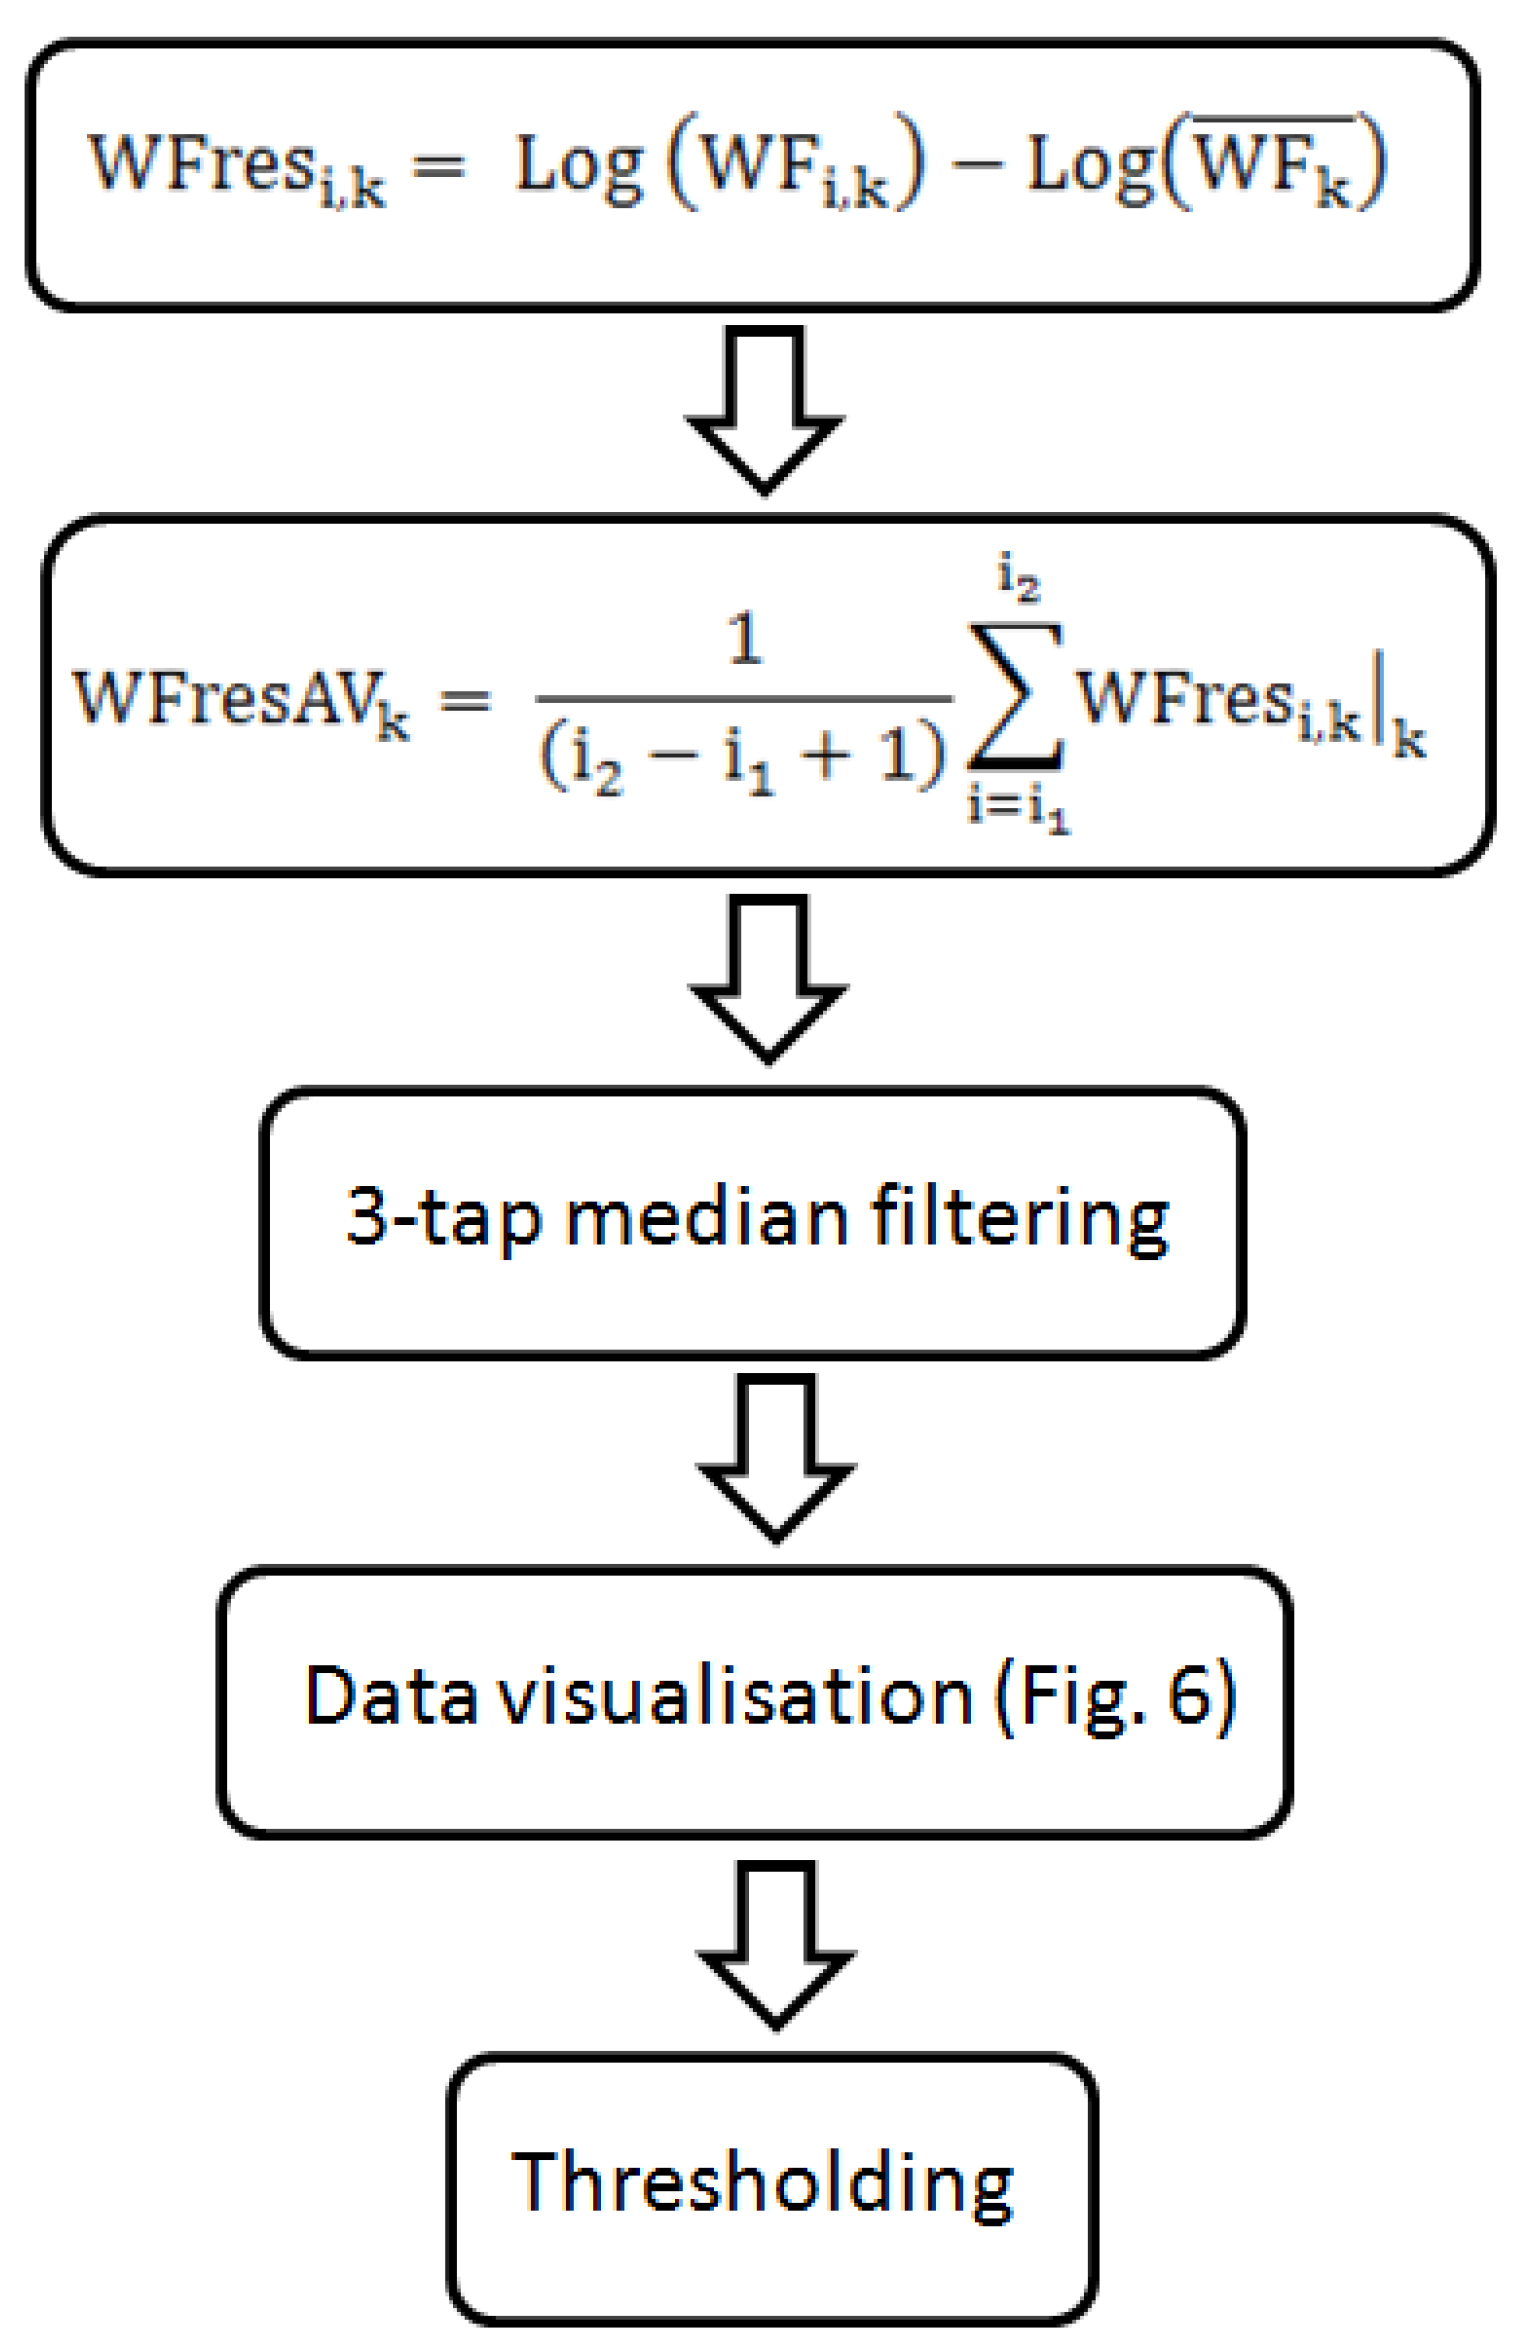
h_res) of the radar altimeter (0.234 m). The procedure for the assessment of the interval of gates identified as non-ocean reflectors is illustrated in the flow diagram provided as
Figure 5. The object of this procedure is to facilitate the representation of data for estimating the physical bounds of the detected targets. Signals are firstly converted to a log10 scale and the difference between each waveform (WF
i,k for the i-th waveform and k-th bin in
Figure 5) and a reference waveform (
) is computed, in order to analyze the resulting residual (WFres
i,k). The reference waveform is calculated as an average along the track segment, according to Equation (2). This is done under the assumption of homogeneity of the waveform shapes in open ocean conditions, where the echoes are expected to be coming mostly from the water surface. Then, a mean log10-power anomaly is computed by averaging the residuals of adjacent anomalous waveforms (WFresAV
k), as discussed in the previous section. A median filter is then applied to smooth the signal before thresholding. A three-taps filter is used, in order to suppress merely the isolated spikes. Finally, a threshold equal to twice the standard deviation is applied to the averaged and filtered residuals, and the first and last bins with above-threshold values are used to delimit the range of bins corresponding to the apparent height of the identified structure.
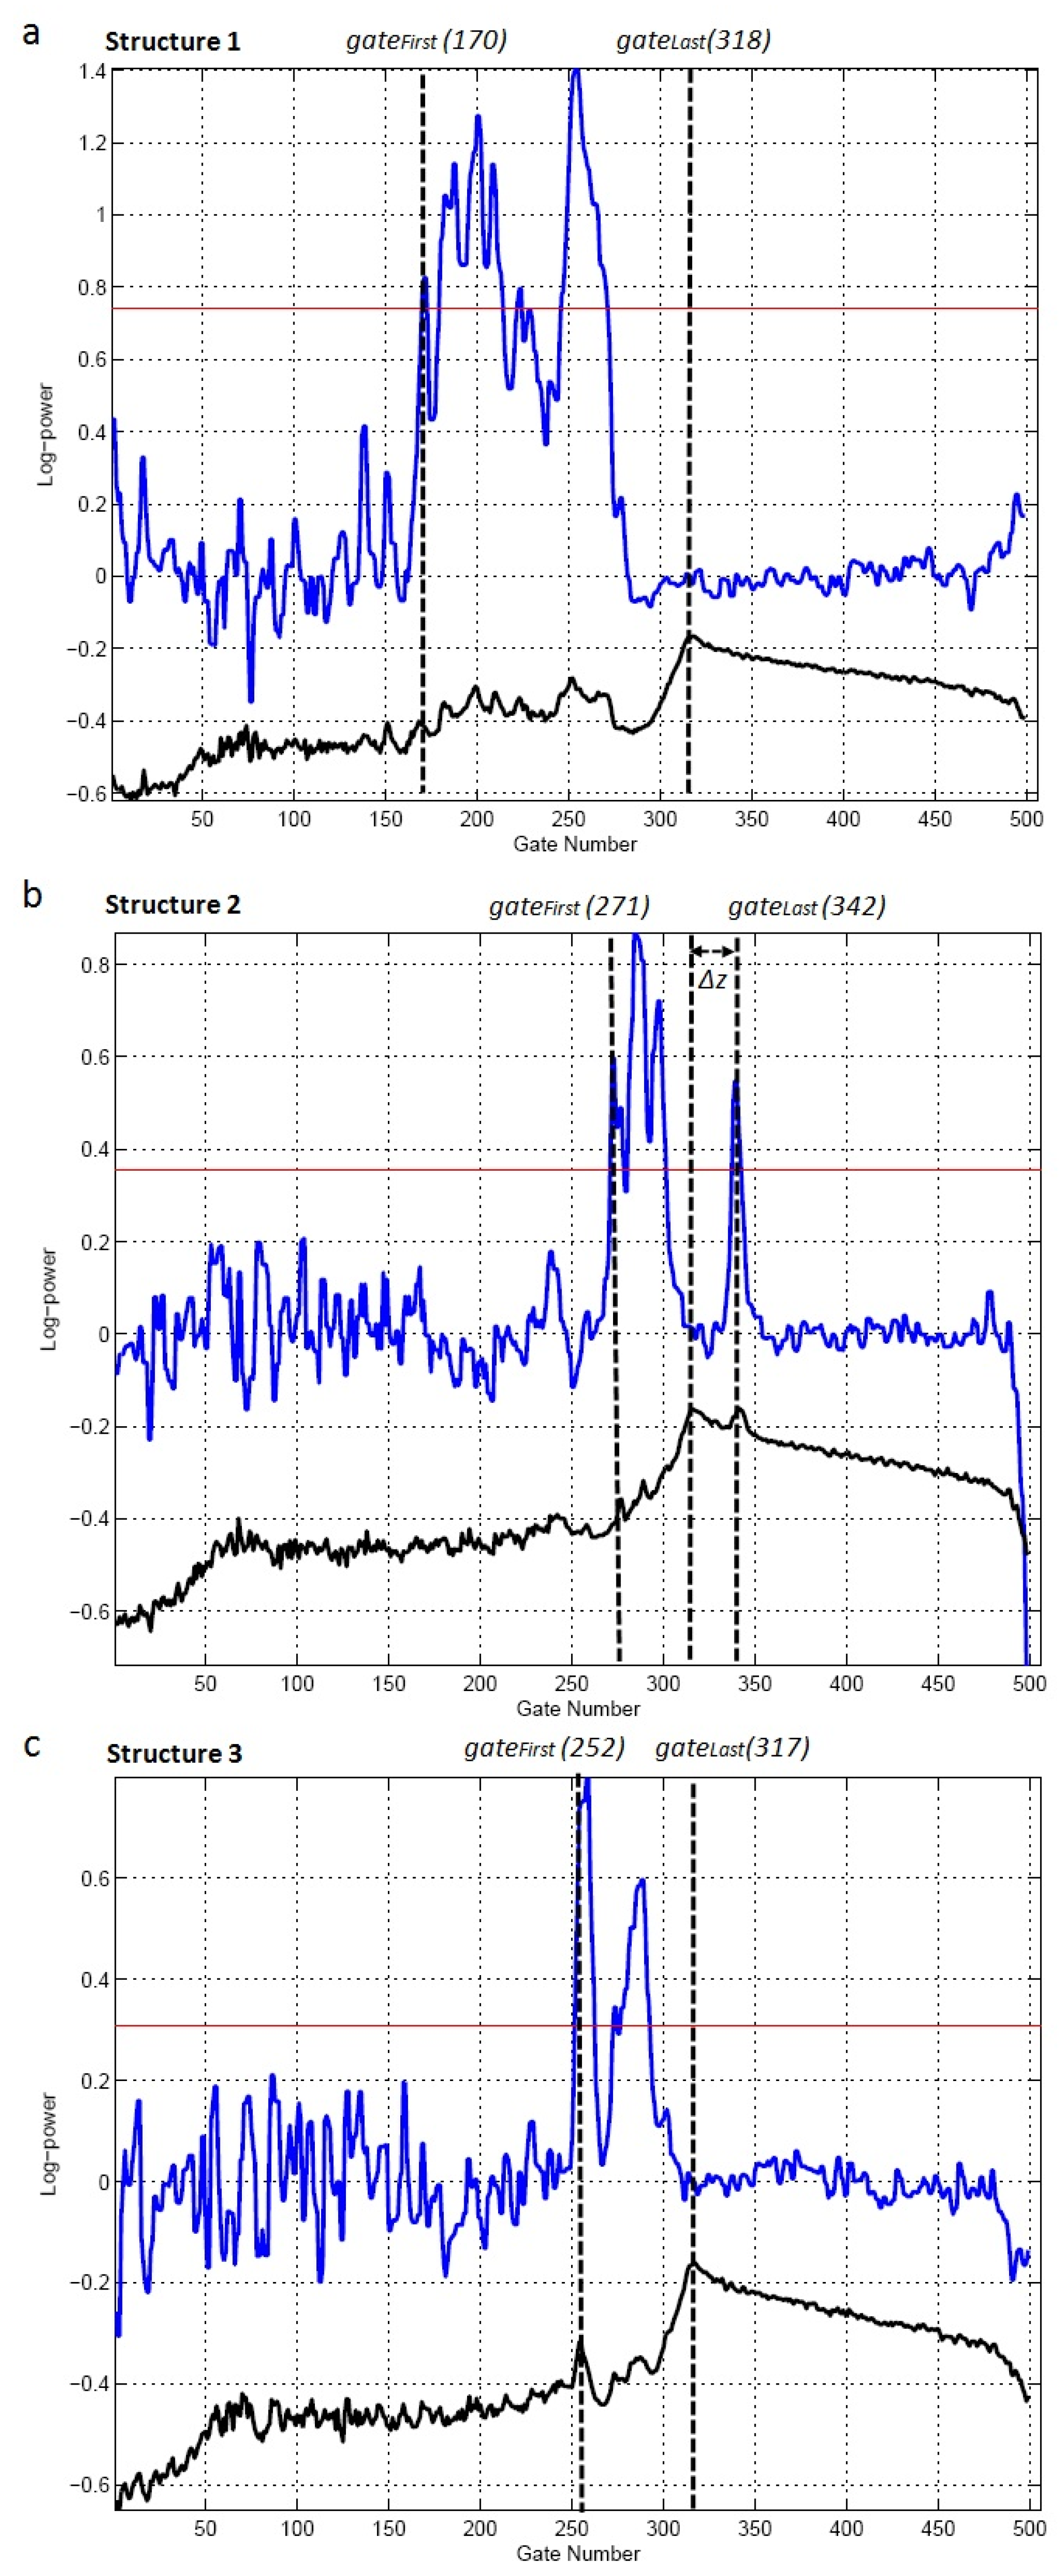
Figure 6 shows the resulting residuals for the waveforms corresponding to structures 1 (
Figure 6a), 2 (
Figure 6b), and 3 (
Figure 6c). The individuated values for
gateFirst and
gateLast in Equation (3) are shown together with the original waveforms in log10 scale. These values have been used for the geometric considerations discussed in the next sub-section.
The apparent heights (
app_h) of the three targets, computed according to Equation (3), are the following:
Structure 1: 34.6 m, taking 148 bins between gateFirst and gateLast (after averaging waveforms 11 and 12);
Structure 2: 16.6 m, for 71 bins between gateFirst and gateLast (after averaging waveforms 36 and 37). Here, gateLast is clearly located in the trailing edge area;
Structure 3: 15.2 m, which corresponds to 65 bins (after averaging waveforms 42 and 43).
4. Results
In this section we assess the compatibility between the information retrieved from the waveforms and the actual scenario, with particular regard to geometrical aspects, such as the location and height of the ships.
The first AIP anomaly is observed at about 36.05°N, corresponding to waveforms numbered 11 and 12. The Cosco Harmony ship has a height of the upper tier of containers, with respect to the sea level, of around 34 m; this is very close to the apparent height (34.6 m) calculated in
Section 3.2.
The analysis of structure 2 is more complex. The anomaly is centered at 36.12°N (waveforms 36 and 37). The maximum signal in the trailing edge (observable both in the radargram in
Figure 2 and in
Figure 6b) clearly indicates the presence of an off-nadir scatterer with a strong radar cross-section. Thus, we analyze the compatibility of this signal with either of the other two ships located inside the CryoSat-2 footprint: the Orient Tiger and the Lloyd Mercator.
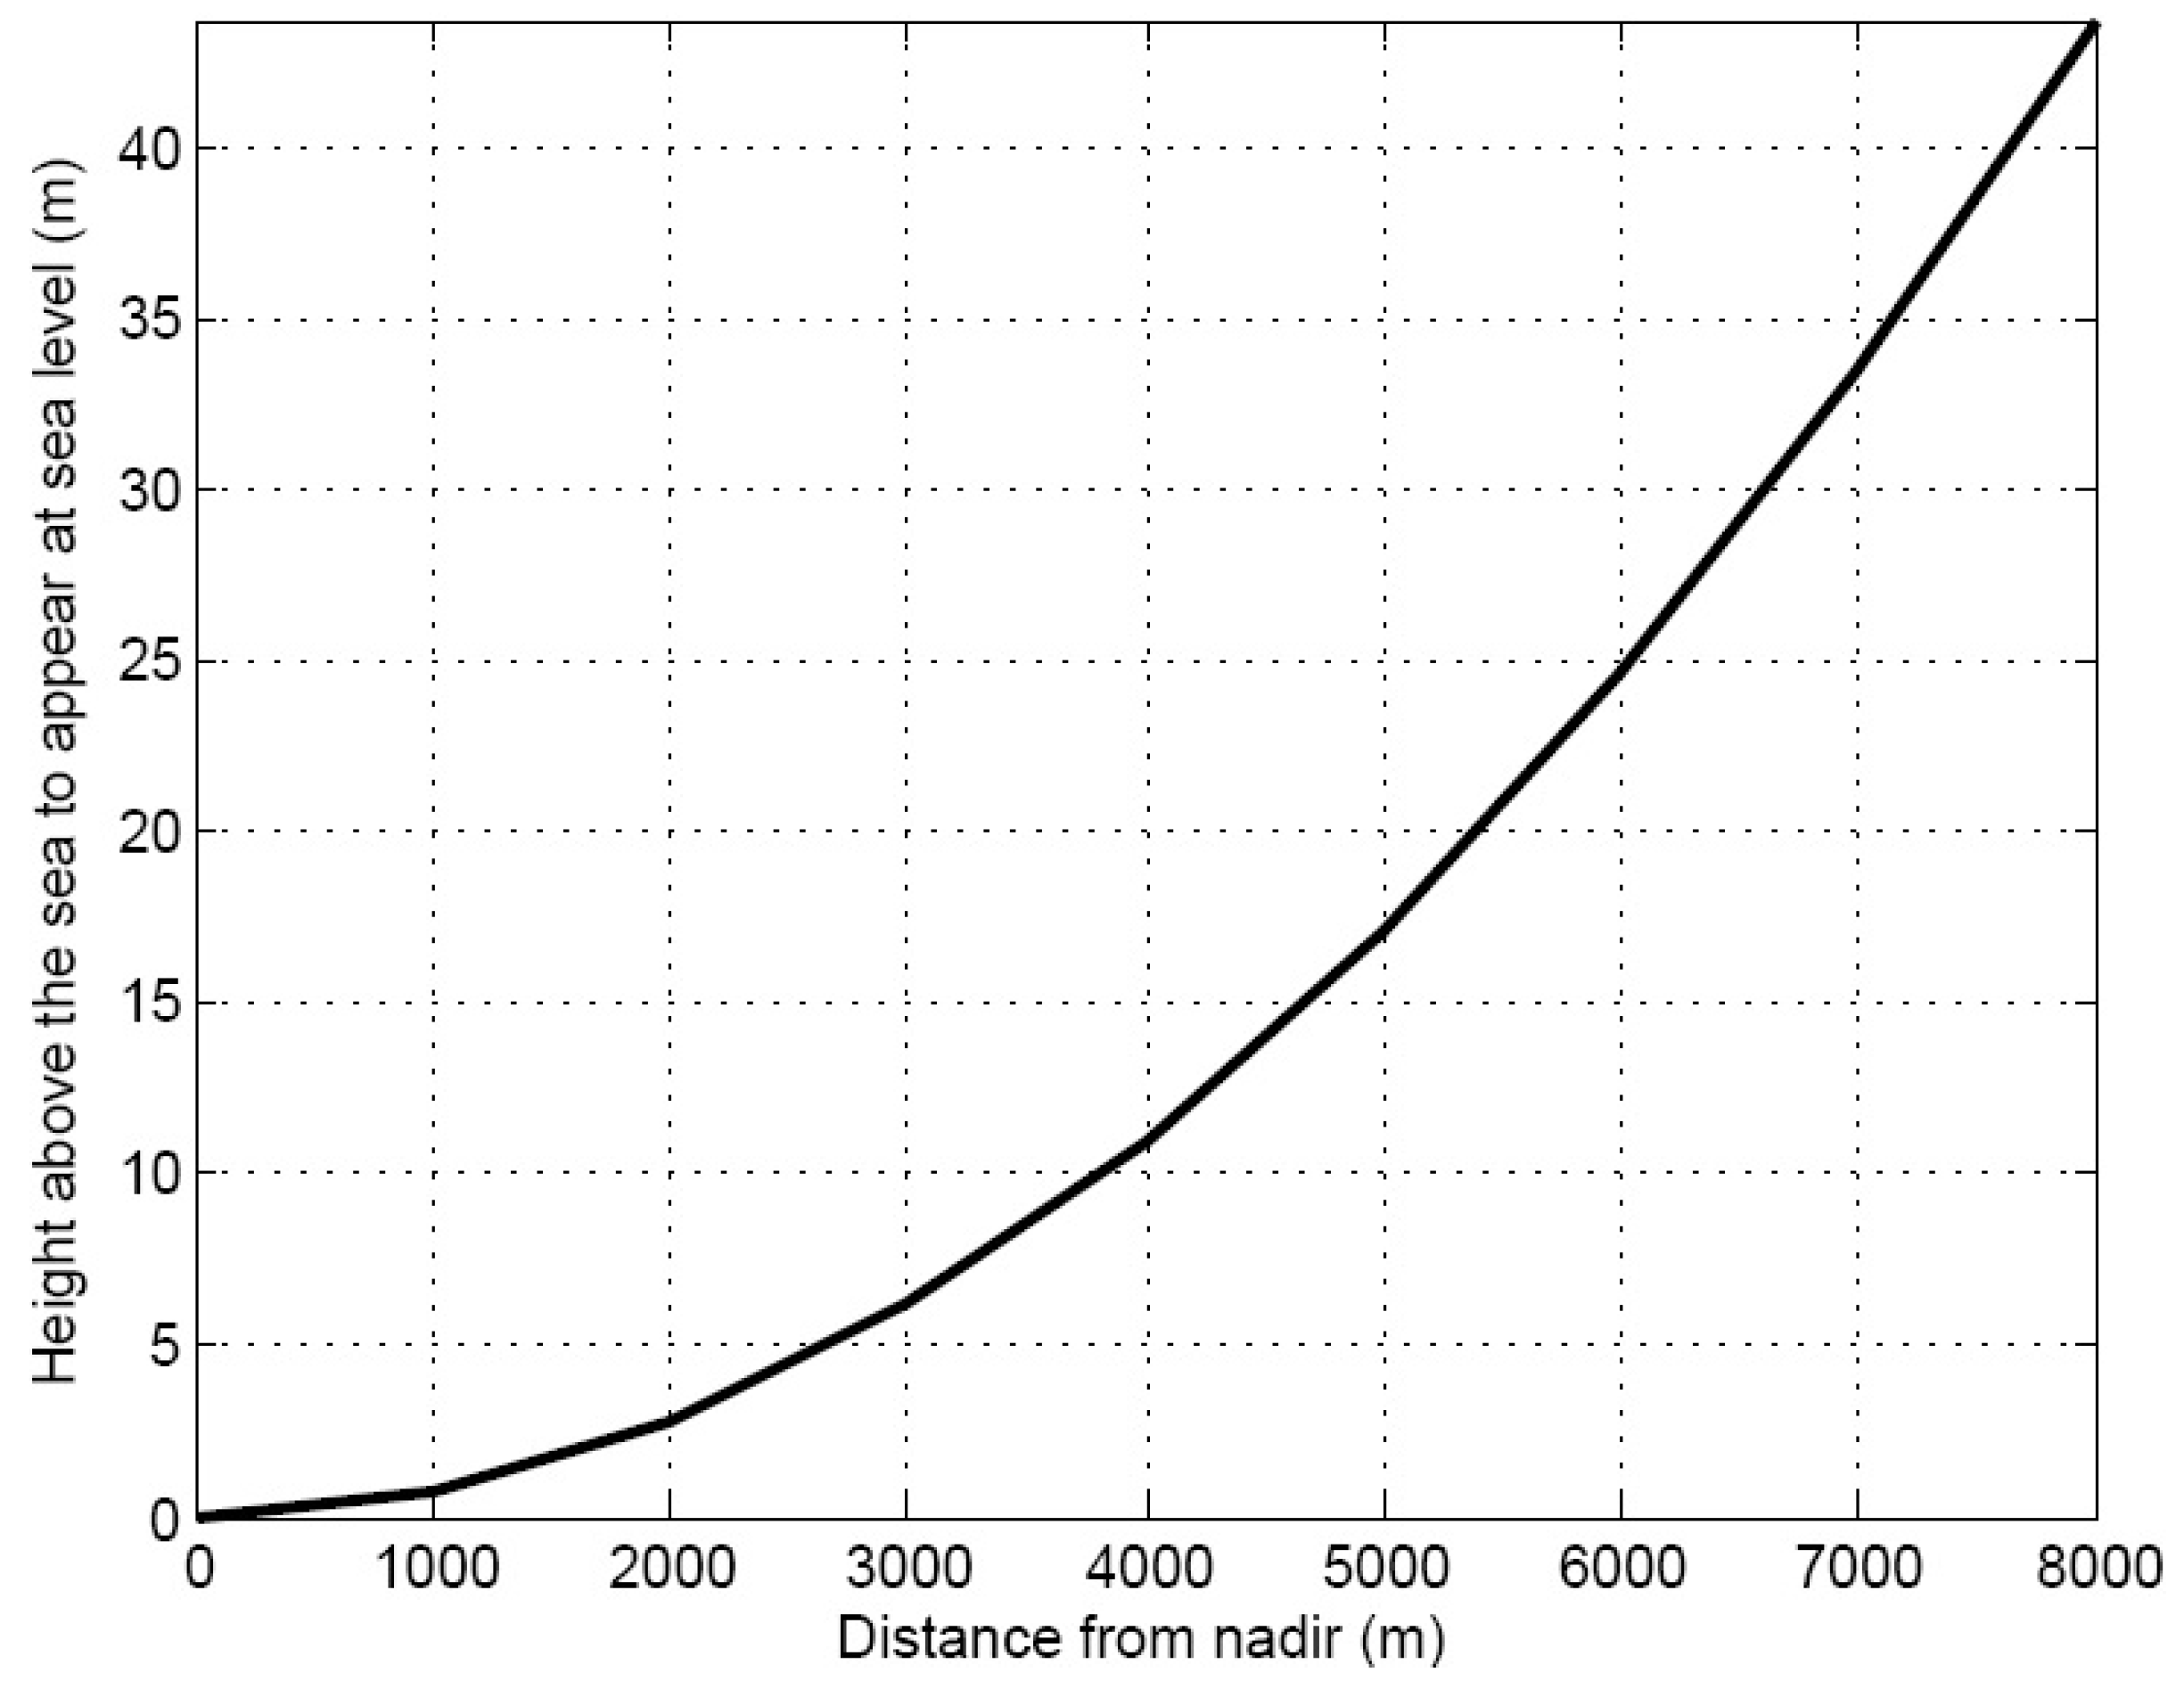
To do this, we estimated the relationship between the distance from nadir and the height of an eventual scatterer, in order to be seen at the sea-water surface interface. Following simple geometric considerations this height can be obtained as follows:
where
H is the
range at nadir (~730 km for CryoSat-2) [
21] and
d is the distance of the object from nadir.
Figure 7 shows the relationship between
d and
Δz,
i.e., the physical height of a scatterer having distance
d from nadir, which generates a simultaneous echo to the water at nadir.
The height (
Δz) obtained from the maximum of the leading edge of waveform 37 to the peak observed in the trailing edge is about 6 m (corresponding to 26 gates, see
Figure 6b). This height indicates how off-nadir an object should be at a certain height
Δz to appear at sea level. Following Equation (4), this height implies a distance from nadir of about 2.9 km. However, the distance between the Orient Tiger and the projection of CryoSat-2 position corresponding to waveform 37 is only 1.7 km. Thus, from a geometric point of view, this ship cannot be the structure responsible for the non-ocean signal observed in the waveforms 36 and 37. The Lloyd Mercator is at a distance of about 4 km from the position of waveform 37. This would give a height of 27.6 m: 16.6 m (
app_h) plus 11 m (
Δz), which is an excellent match with the average height of the top of the container level of the Lloyd Mercator (estimated at 27 m). In this particular case the ambiguity is resolved; thus, the second structure observed can be assigned to the Lloyd Mercator, rather than to the Orient Tiger which is nearer to the track.
With regard to the third structure corresponding to waveforms 42 and 43 in the AIP analysis, at approximately 36.135°N, we analyzed the compatibility with the closest ships. The Orient Tiger is located at a distance of 2.6 km. This gives a height of 20.0 m: 15.2 m (app_h) plus 4.8 m (Δz). This makes the effect of the ship’s bridge (21 m) very compatible with the observed signal. The Nedlloyd Mercator is at a distance of about 3.6 km, giving a Δz of 9 m and a resulting height of 24.2 m. The height of the upper tier of containers with respect to the sea level (~27 m at full load) makes this ship also compatible with the observed signal. Thus, this target might contain returns from both ships at the same time.
5. Discussion
The potential of satellite radar altimetry for the production of ship location databases, as well as global maps of ship traffic density, has been indicated in previous literature. Certain characteristics of the new SAR altimetry missions offer the prospect of enhancing the information that can be obtained from these radar observations. Previous studies have focused on estimating the number (probability) of non-target detections by processing conventional altimeter waveforms. We propose going further towards this objective by processing CryoSat-2 SAR mode waveforms. Our method includes the possibility of estimating the height of a detected ship. In this framework, CryoSat-2 data represent a first and very attractive opportunity for a preliminary understanding of the new possibilities offered by SAR altimetry. The methodology proposed in this work and its encouraging results will contribute to research in this direction.
The method proposed here detects non-ocean targets emerging from the sea. This is a limitation for the specific purpose of ship detection, as other types of scatterer, such as small islands or small icebergs, would be detectable. More analysis is needed in order to characterize the effect of these kinds of objects on SAR altimeter waveforms. This would contribute to the improvement of the proposed methodology by minimizing the number of detections not related to ships. An evaluation of the performance of the proposed approach in terms of false alarm rate, detection, and missing data will require the analysis of a large number of cases. Another limitation, not due to the approach but to the observational modality, is that the shape of the structure detected cannot be inferred as a two-dimensional image, like for imaging sensors. The revisit time of CryoSat-2 (369 days with a 30-day sub-cycle) might also limit its capability for ship detection, particularly for near real-time purposes.
6. Conclusions
This paper presents for the first time a study in which SAR (also known as Delay-Doppler) altimetry is employed with the object of identifying and geometrically characterizing ship targets. Radargrams obtained after unfocused SAR compression are used to detect non-ocean scatterers in the form of bright spots clustered along a few successive received waveforms; this is significantly different from conventional altimetry whereby these targets are characterized by hyperbolic features in the thermal noise region of the received signals. The anomalies observed in the received echoes due to the presence of ships are, thus, concentrated in a small number of adjacent waveforms, giving advantages for the ability to discriminate potential targets. In particular, this work investigates the possibility of defining a useful metric for the automatic detection and separation of ship targets, and the feasibility of extracting information additional to the mere presence of targets, of potential use for characterizing the ships detected.
In this paper we also describe an experimental case study involving the detection and characterization of ships cruising near a CryoSat-2 track in the Alboran Sea, where the sensor operates in SAR mode. Despite the relatively complex scenario, three structures are well identified by a suitably defined metric (which we have named the “anomaly index parameter”). Validation against AIS data shows that such structures are compatible with the presence of three ships at the time of CryoSat-2 passage. In addition, it has been possible to make an estimation of the height of each ship from the radargrams obtained after unfocused SAR compression. In this experimental case study the estimated heights are consistent with the information about the particular ships available in relevant databases. The possibility of resolving ambiguities among multiple apparent targets is also discussed, and proved to be feasible within the constraints imposed by the symmetrical geometry of these nadir-pointed radars.
The data archive of CryoSat-2 mission spans more than five years, covering specific areas (mostly coastal) in SAR mode, thus offering interesting possibilities for experimentation for observational purposes outside the original aim of the mission, such as the one presented here. In the context of ship traffic monitoring, the Sentinel-3 mission constellation will soon be operative and will provide full global SAR coverage, giving the prospect of improved global statistics in the future, by taking advantage of the methodology proposed in this paper. Another relevant aspect that makes this research attractive is the free and open availability of such data. This methodology might serve as a complement to the ship detection techniques based on other remote sensing (SAR/optical imagery) and ground truth (AIS, LRIT, and VMS) databases.
Acknowledgments
This work has been partially supported by the ALCOVA Project (reference: CTM2012-37839) funded by the Spanish Ministerio de Economía y Competitividad and FEDER-ERDF (European Regional Development Fund). The authors also thank the ESA for providing the CryoSat-2 SIRAL SARvatore GPOD data. We also would like to thank Salvatore Dinardo from SERCO-ESA for his technical support in the use of the GPOD service.
Author Contributions
All the authors listed contributed equally to the work presented in this paper.
Conflicts of Interest
The authors declare no conflict of interest. The founding sponsors had no role in the design of the study, in the collection, analyses or interpretation of data, in the writing of the manuscript, nor in the decision to publish the results.
Abbreviations
The following abbreviations are used in this article:
| AIP | Anomaly Index Parameter |
| AIS | Automatic Identification System |
| ESA | European Space Agency |
| GPOD | Grid Processing On-Demand |
| LRIT | Long Range Identification and Tracking |
| SAR | Synthetic Aperture Radar |
| SIRAL | Synthetic Interferometric Radar Altimeter |
| SNR | Signal-to-Noise ratio |
| VMS | Vessel Monitoring System |
References
- World Ocean Review. Maritime Highways of Global Trade, in World Ocean Review. Available online: http://worldoceanreview.com/ (accessed on 10 September 2015).
- Kaluza, P.; Kölz, A.; Gastner, M.T.; Blasius, B. The complex network of global cargo ship movements. J. R. Soc. Interface 2010, 7, 1093–1103. [Google Scholar] [CrossRef] [PubMed]
- Marine Managment Organisation. Mapping UK Shipping Density and Routes from AIS; MMO Project No: 1066; ISBN 978 1-909452-26-8. Marine Managment Organisation: Newcastle, UK, 2014. [Google Scholar]
- Greidanus, H.; Marlene, A.M.; Torkild, E.T.; Barbas, T. Ship Traffic Distributions and Statistics in the Gulf of Guinea and off West Africa; JRC Report N. 87225; Joint Research Centre: Ispra, Italy, 2013. [Google Scholar]
- Lambert, G.I.; Jennings, S.; Hiddink, J.; Hintzen, N.T.; Hinz, H.; Kaiser, M.J.; Murray, L.G. Implications of using alternate methods of Vessel Monitoring System (VMS) data analysis to describe fishing activities and impacts. ICES J. Mar. Sci. 2012, 69, 682–693. [Google Scholar] [CrossRef]
- Crisp, D.J. The State-of-the-Art in Ship Detection in Synthetic Aperture Radar Imagery. Defence Science and Technology Organization (DSTO), 2004. Available online: http://dspace.dsto.defence.gov.au/dspace/bitstream/1947/3354/1/DSTO-RR-0272%20PR.pdf (accessed on 20 January 2016). [Google Scholar]
- Vachon, P.W.; English, R.A.; Wolfe, J. Validation of RADARSAT-1 vessel signatures with AISLive data. Can. J. Remote Sens. 2007, 33, 23–26. [Google Scholar] [CrossRef]
- Corbane, C.; Najman, L.; Pecoul, E.; Demagistri, L.; Petit, M. A complete processing chain for ship detection using optical satellite imagery. Int. J. Remote Sens. 2010, 31, 5837–5854. [Google Scholar] [CrossRef]
- An, W.; Xie, C.; Yuan, X. An improved iterative censoring scheme for CFAR ship detection with SAR imagery. IEEE Trans. Geosci. Remote Sens. 2014, 52, 4585–4595. [Google Scholar]
- Wang, C.; Jiang, S.; Zhang, H.; Wu, F.; Zhang, B. Ship detection for high-resolution SAR images based on feature analysis. IEEE Geosci. Remote Sens. Lett. 2014, 11, 119–123. [Google Scholar] [CrossRef]
- Yang, G.; Li, B.; Ji, S.; Gao, F.; Xu, Q. Ship detection from optical satellite images based on sea surface analysis. IEEE Geosci. Remote Sens. Lett. 2014, 11, 641–645. [Google Scholar] [CrossRef]
- Tournadre, J. Signatures of lighthouses, ships, and small islands in altimeter waveforms. J. Atmos. Ocean. Technol. 2007, 24, 1143–1149. [Google Scholar] [CrossRef]
- Tournadre, J. Anthropogenic pressure on the open ocean. The growth of ship traffic revealed by altimeter data analysis. Geophys. Res. Lett. 2014, 41, 7924–7932. [Google Scholar] [CrossRef]
- Raney, R.K. The delay/Doppler radar altimeter. IEEE Trans. Geosci. Remote Sens. 1998, 36, 1578–1588. [Google Scholar] [CrossRef]
- Cotton, P.D. SAMOSA State of Art Assessment Report; European Space Agency: Paris, France, 2008. [Google Scholar]
- Abulaitijiang, A.; Andersen, O.B.; Stenseng, L. Coastal sea level from inland CryoSat-2 interferometric SAR altimetry. Geophys. Res. Lett. 2015, 42, 1841–1847. [Google Scholar] [CrossRef]
- Grid Processing On-Demand. Available online: https://gpod.eo.esa.int (accessed on 9 September 2015).
- Dinardo, S. Guidelines for the SAR (Delay-Doppler) L1b Processing; European Space Agency: Paris, France, 2013. [Google Scholar]
- Smith, W.H.F.; Scharroo, R. Waveform aliasing in satellite radar altimetry. IEEE Trans. Geosci. Remote Sens. 2015, 53, 1671–1682. [Google Scholar] [CrossRef]
- ESRIN-ESA. CryoSat Product Handbook; European Space Agency: Paris, France, 2012. [Google Scholar]
- Scagliola, M. CryoSat Footprints; SAR-CRY2-TEN-6331; European Space Agency: Paris, France, 2013. [Google Scholar]
- Guardian Rescue. Available online: http://www.guardianrescue.co.uk/link-to-ship-finder-ais.php (accessed on 11 September 2015).
- Marine Traffic. Available online: http://www.marinetraffic.com (accessed on 1 September 2015).
- Scozzari, A.; Gómez-Enri, J.; Vignudelli, S.; Soldovieri, F. Understanding target-like signals in coastal altimetry: Experimentation of a tomographic imaging technique. Geophys. Res. Lett. 2012, 39. [Google Scholar] [CrossRef]
- Tournadre, J.; Boy, F.; Dinardo, S. Detection of ships and icebergs using Delay Doppler altimetry. In Proceedings of the Sentinel-3 for Science Workshop, Venice, Italy, 2–5 June 2015.
© 2016 by the authors; licensee MDPI, Basel, Switzerland. This article is an open access article distributed under the terms and conditions of the Creative Commons by Attribution (CC-BY) license (http://creativecommons.org/licenses/by/4.0/).


 ,
, 


