A New Method for the Estimation of Broadband Apparent Albedo Using Hyperspectral Airborne Hemispherical Directional Reflectance Factor Values
Abstract
:1. Introduction
2. Materials and Methods
2.1. Theory
2.2. Study Area
2.3. Field Data
2.4. Airborne Data
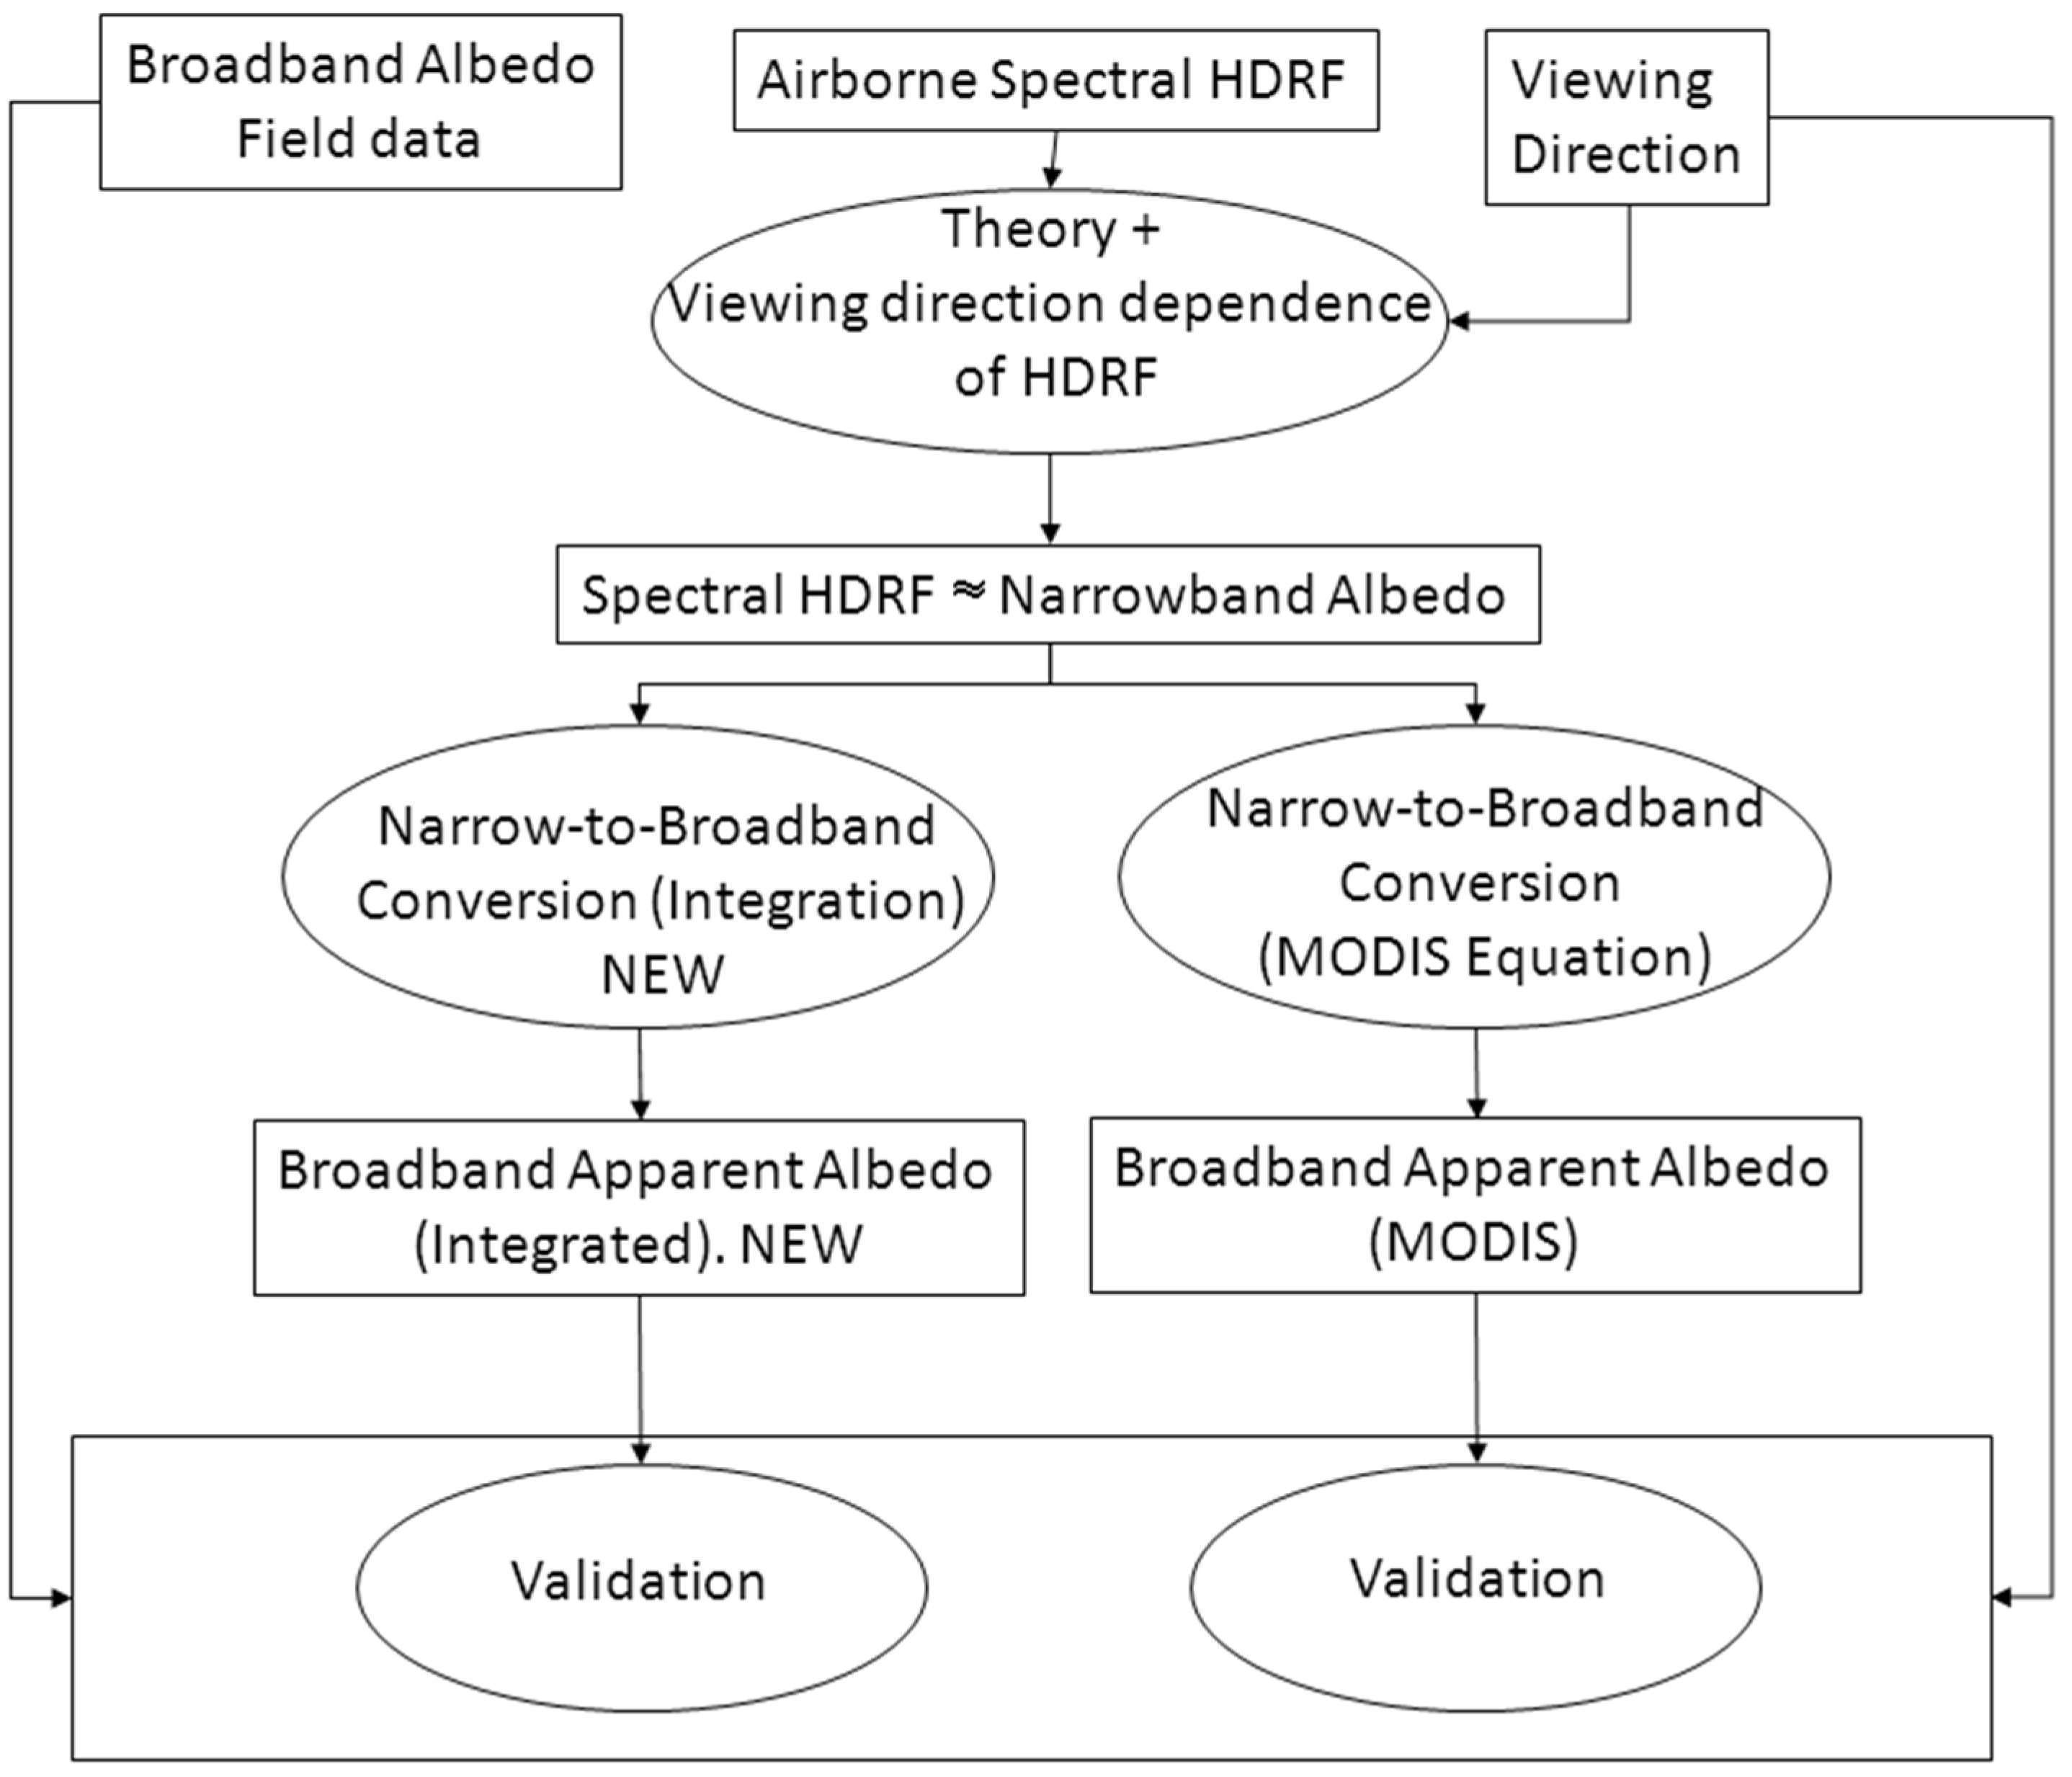
2.5. Narrow to Broadband Albedo Conversion
- (1)
- Integrating the spectral HDRF using Equation (10). The resultant albedo is denoted as the Integrated Albedo from now on.
- (2)
- Using the MODIS broadband apparent albedo equation [5] (Equation (2)). The resultant albedo is denoted as the MODIS Albedo from now on.
3. Results and Discussion
3.1. Field Broadband Albedo
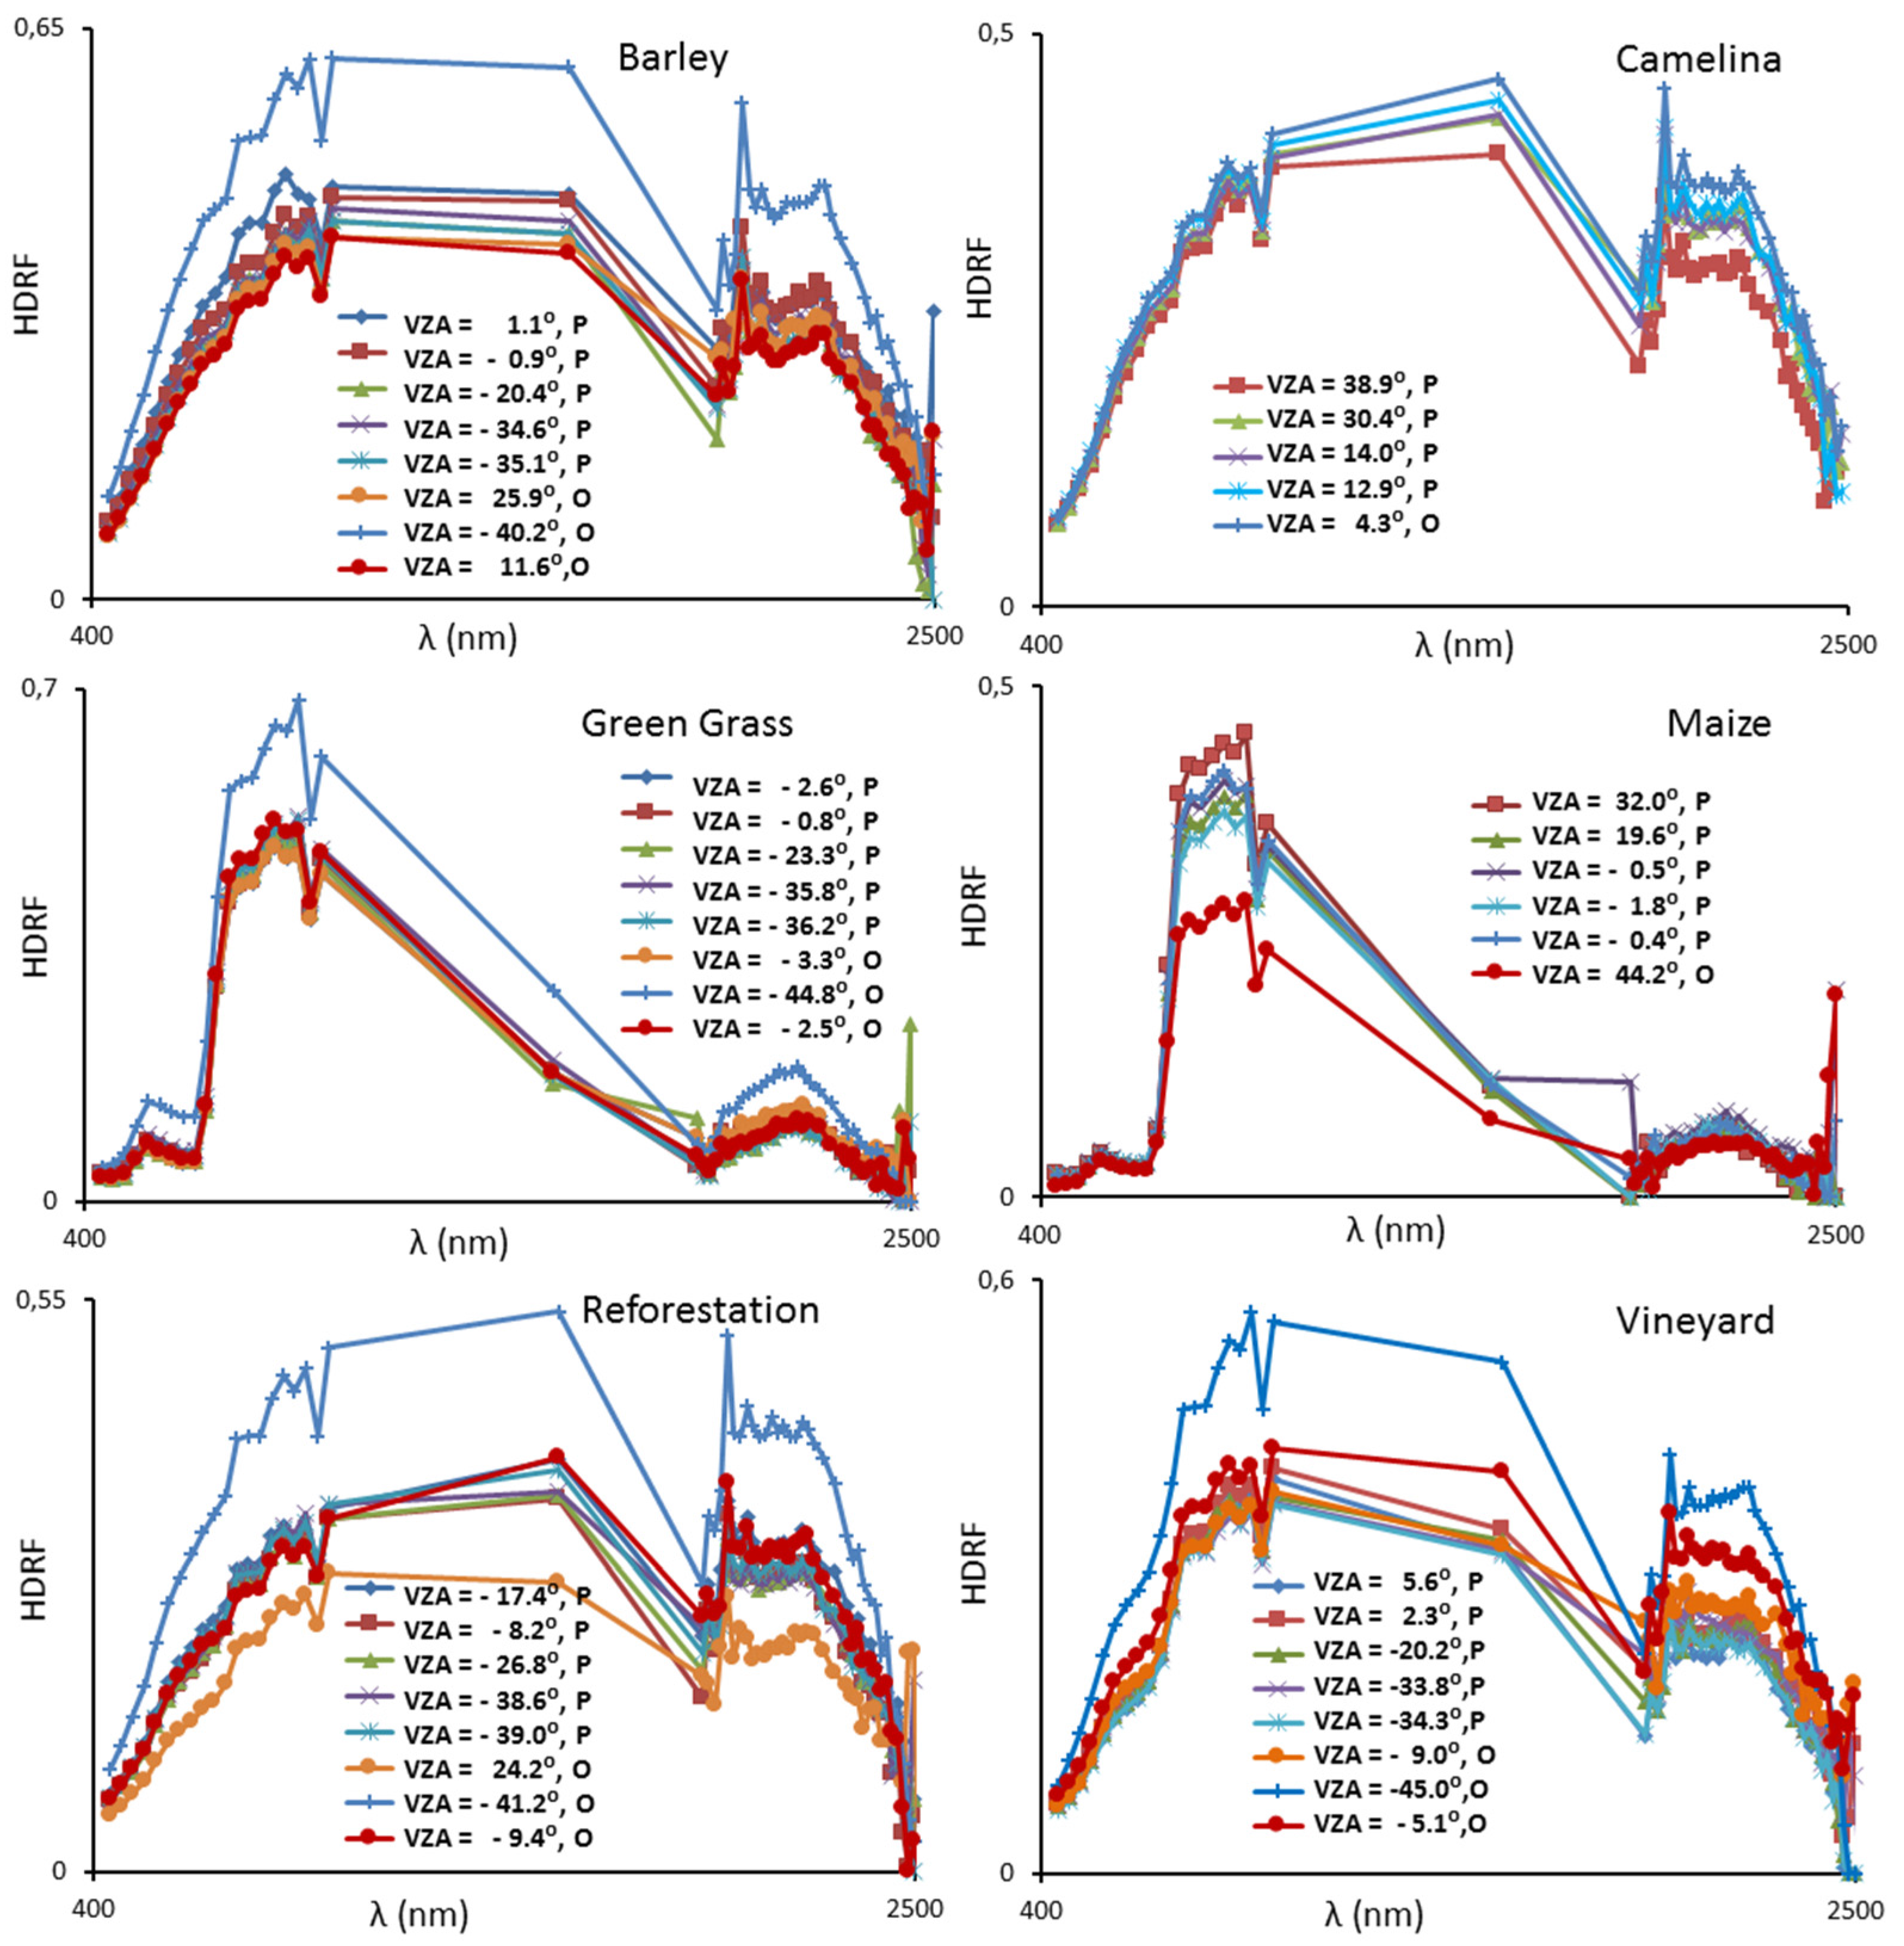
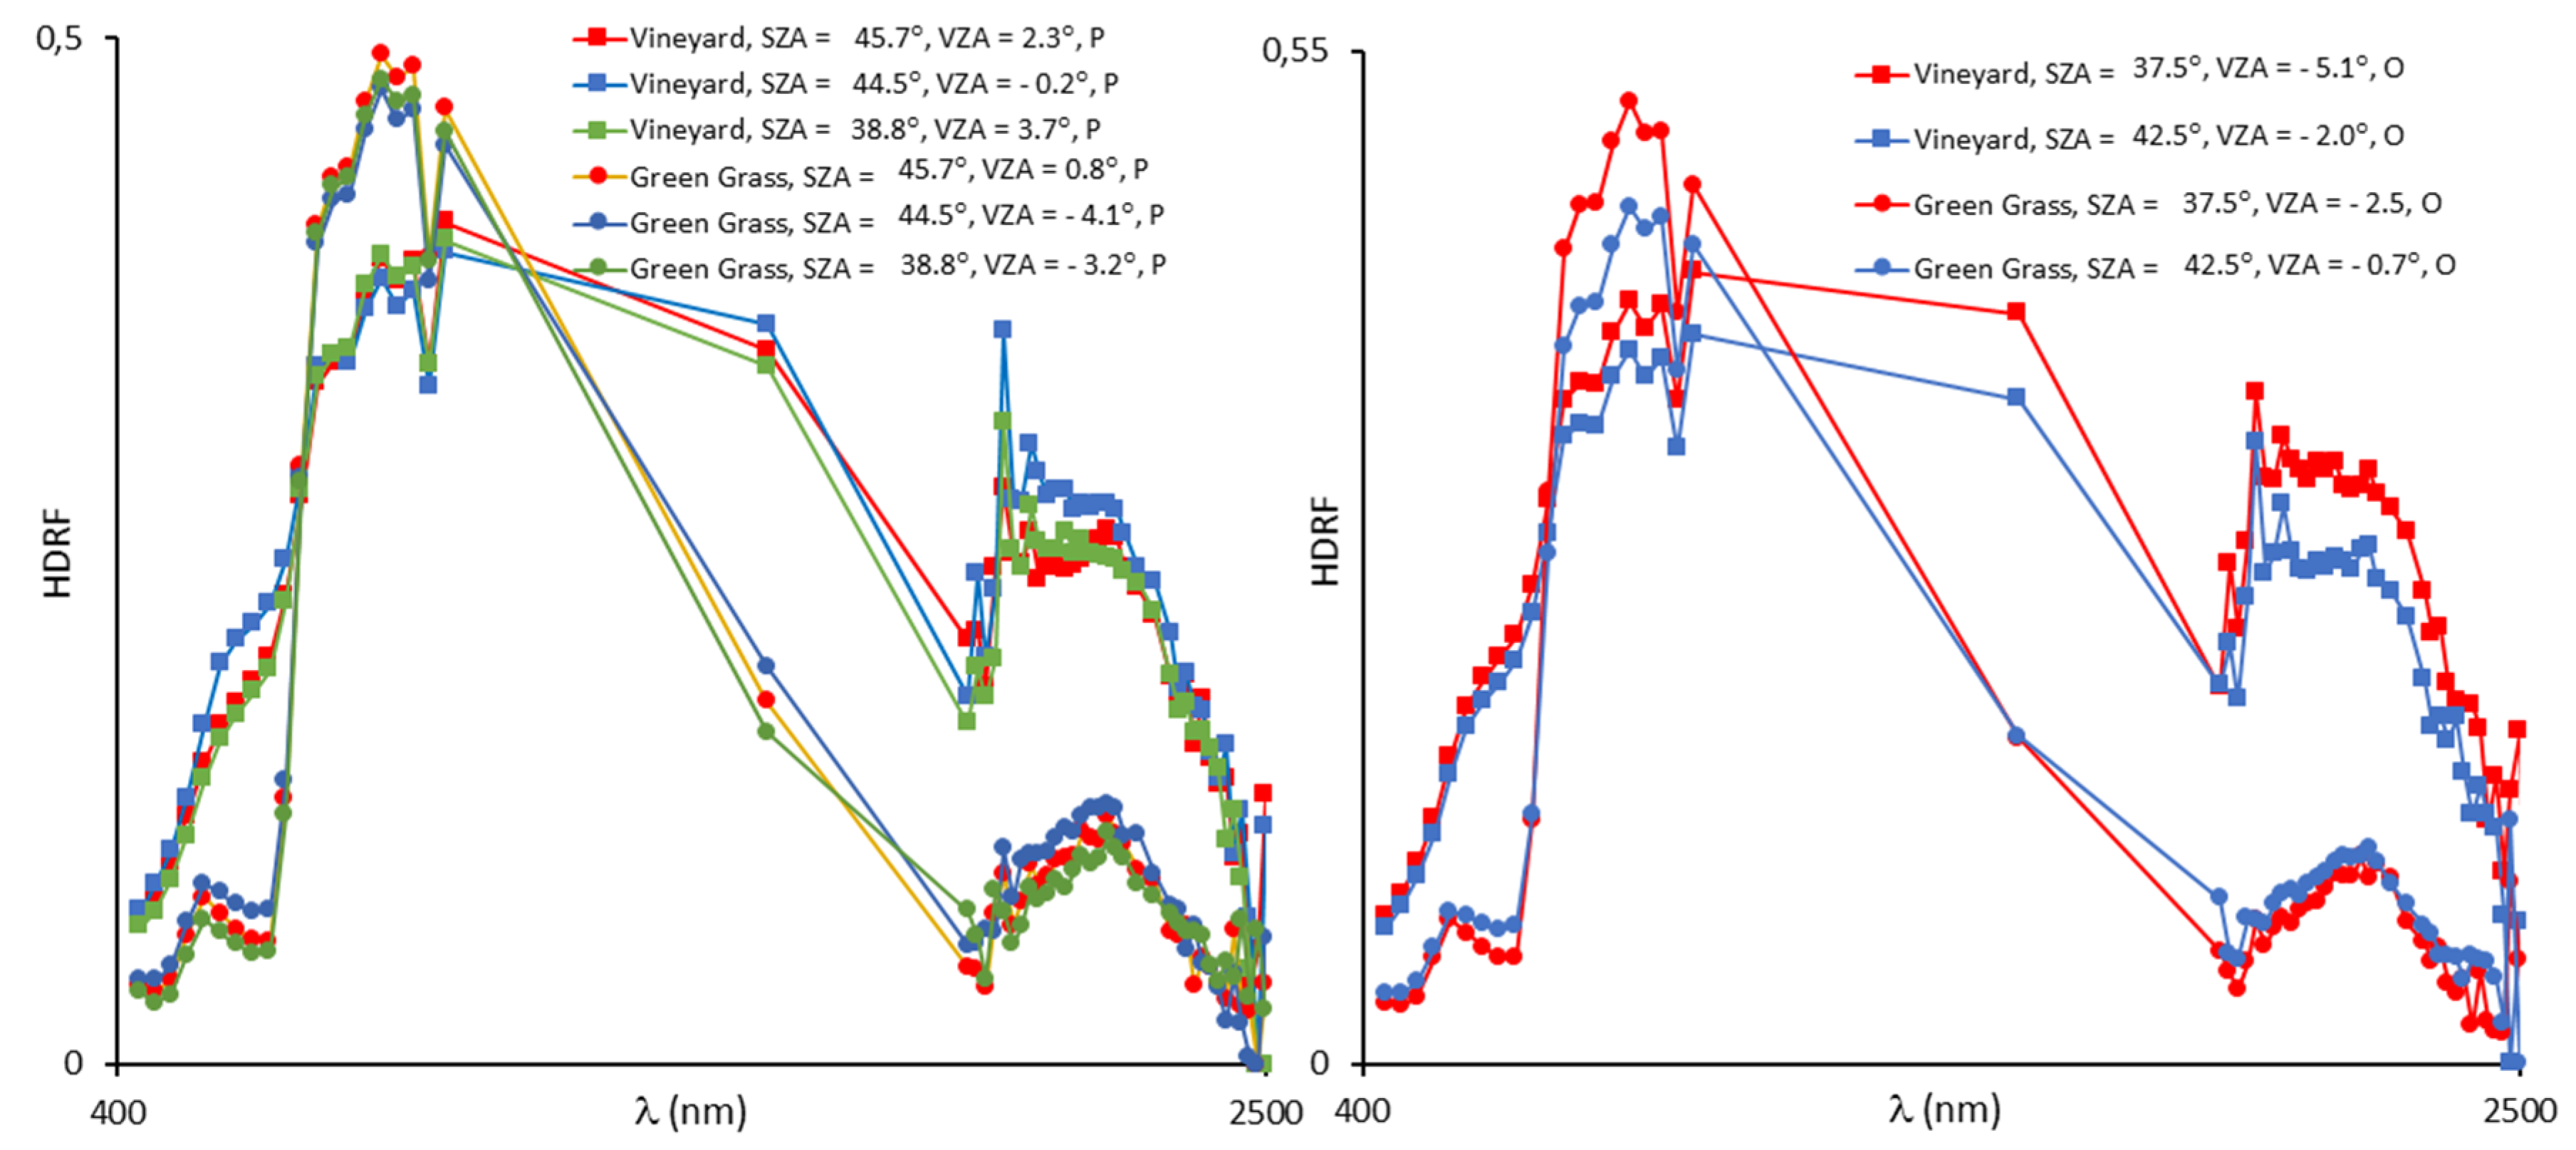
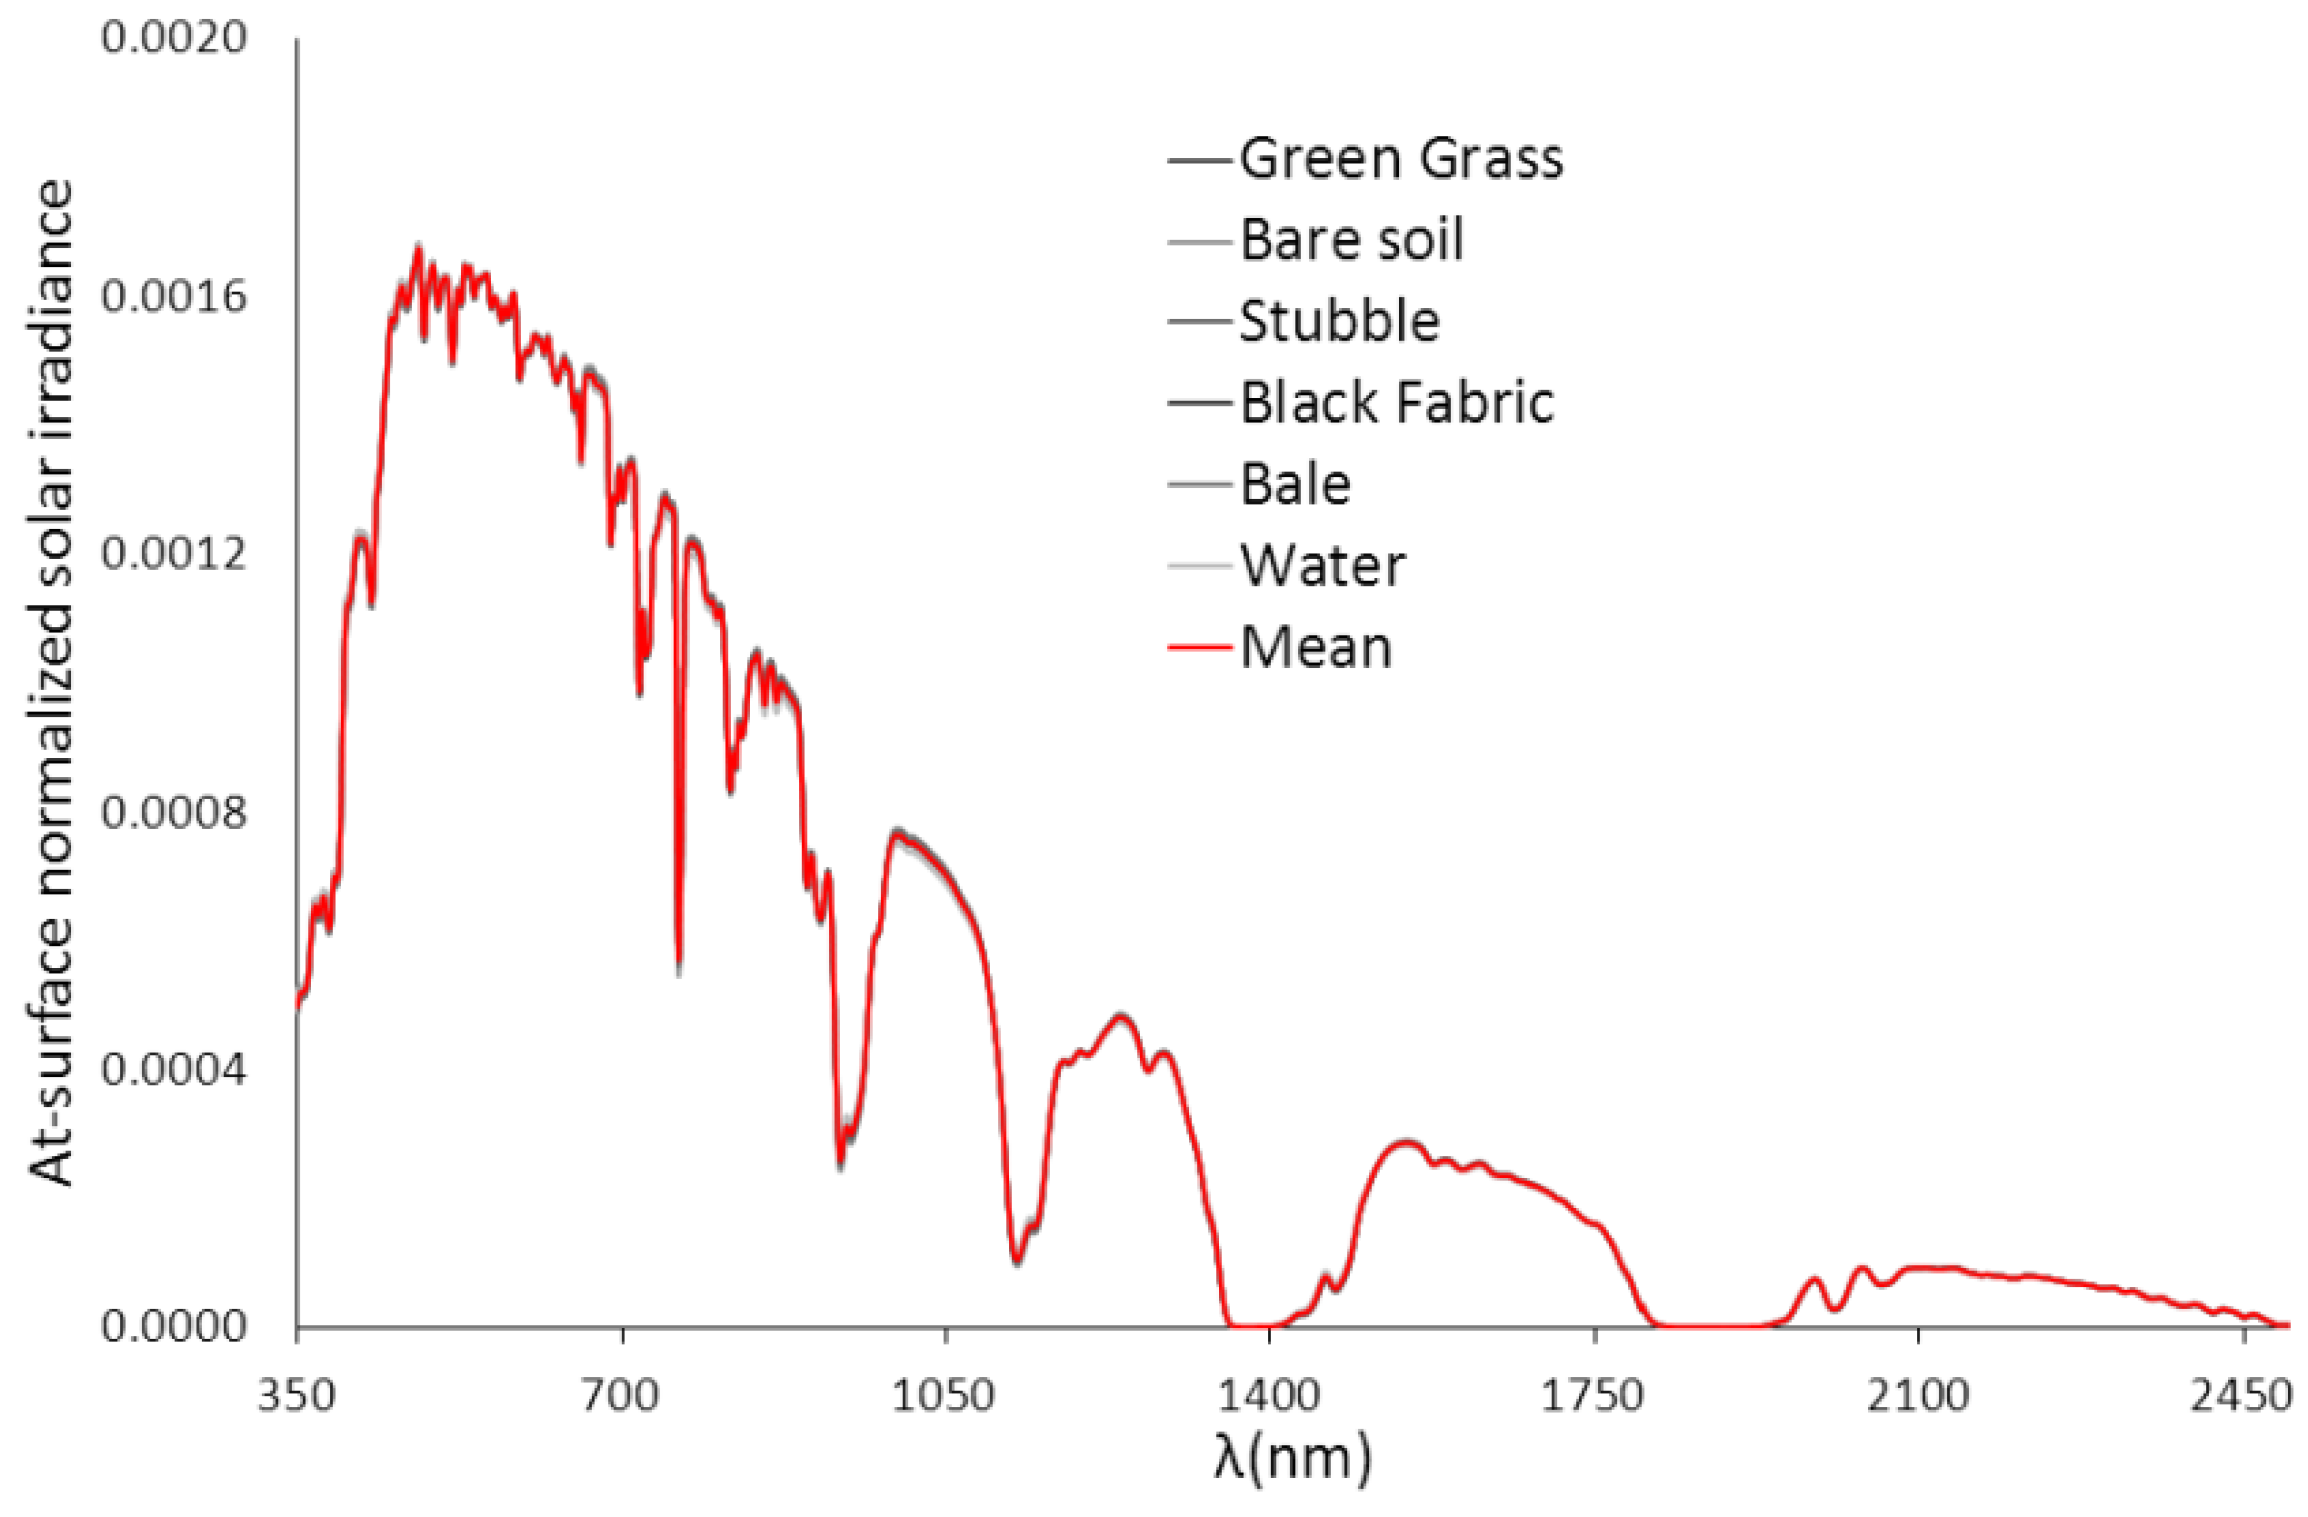
3.2. Airborne Broadband Albedo
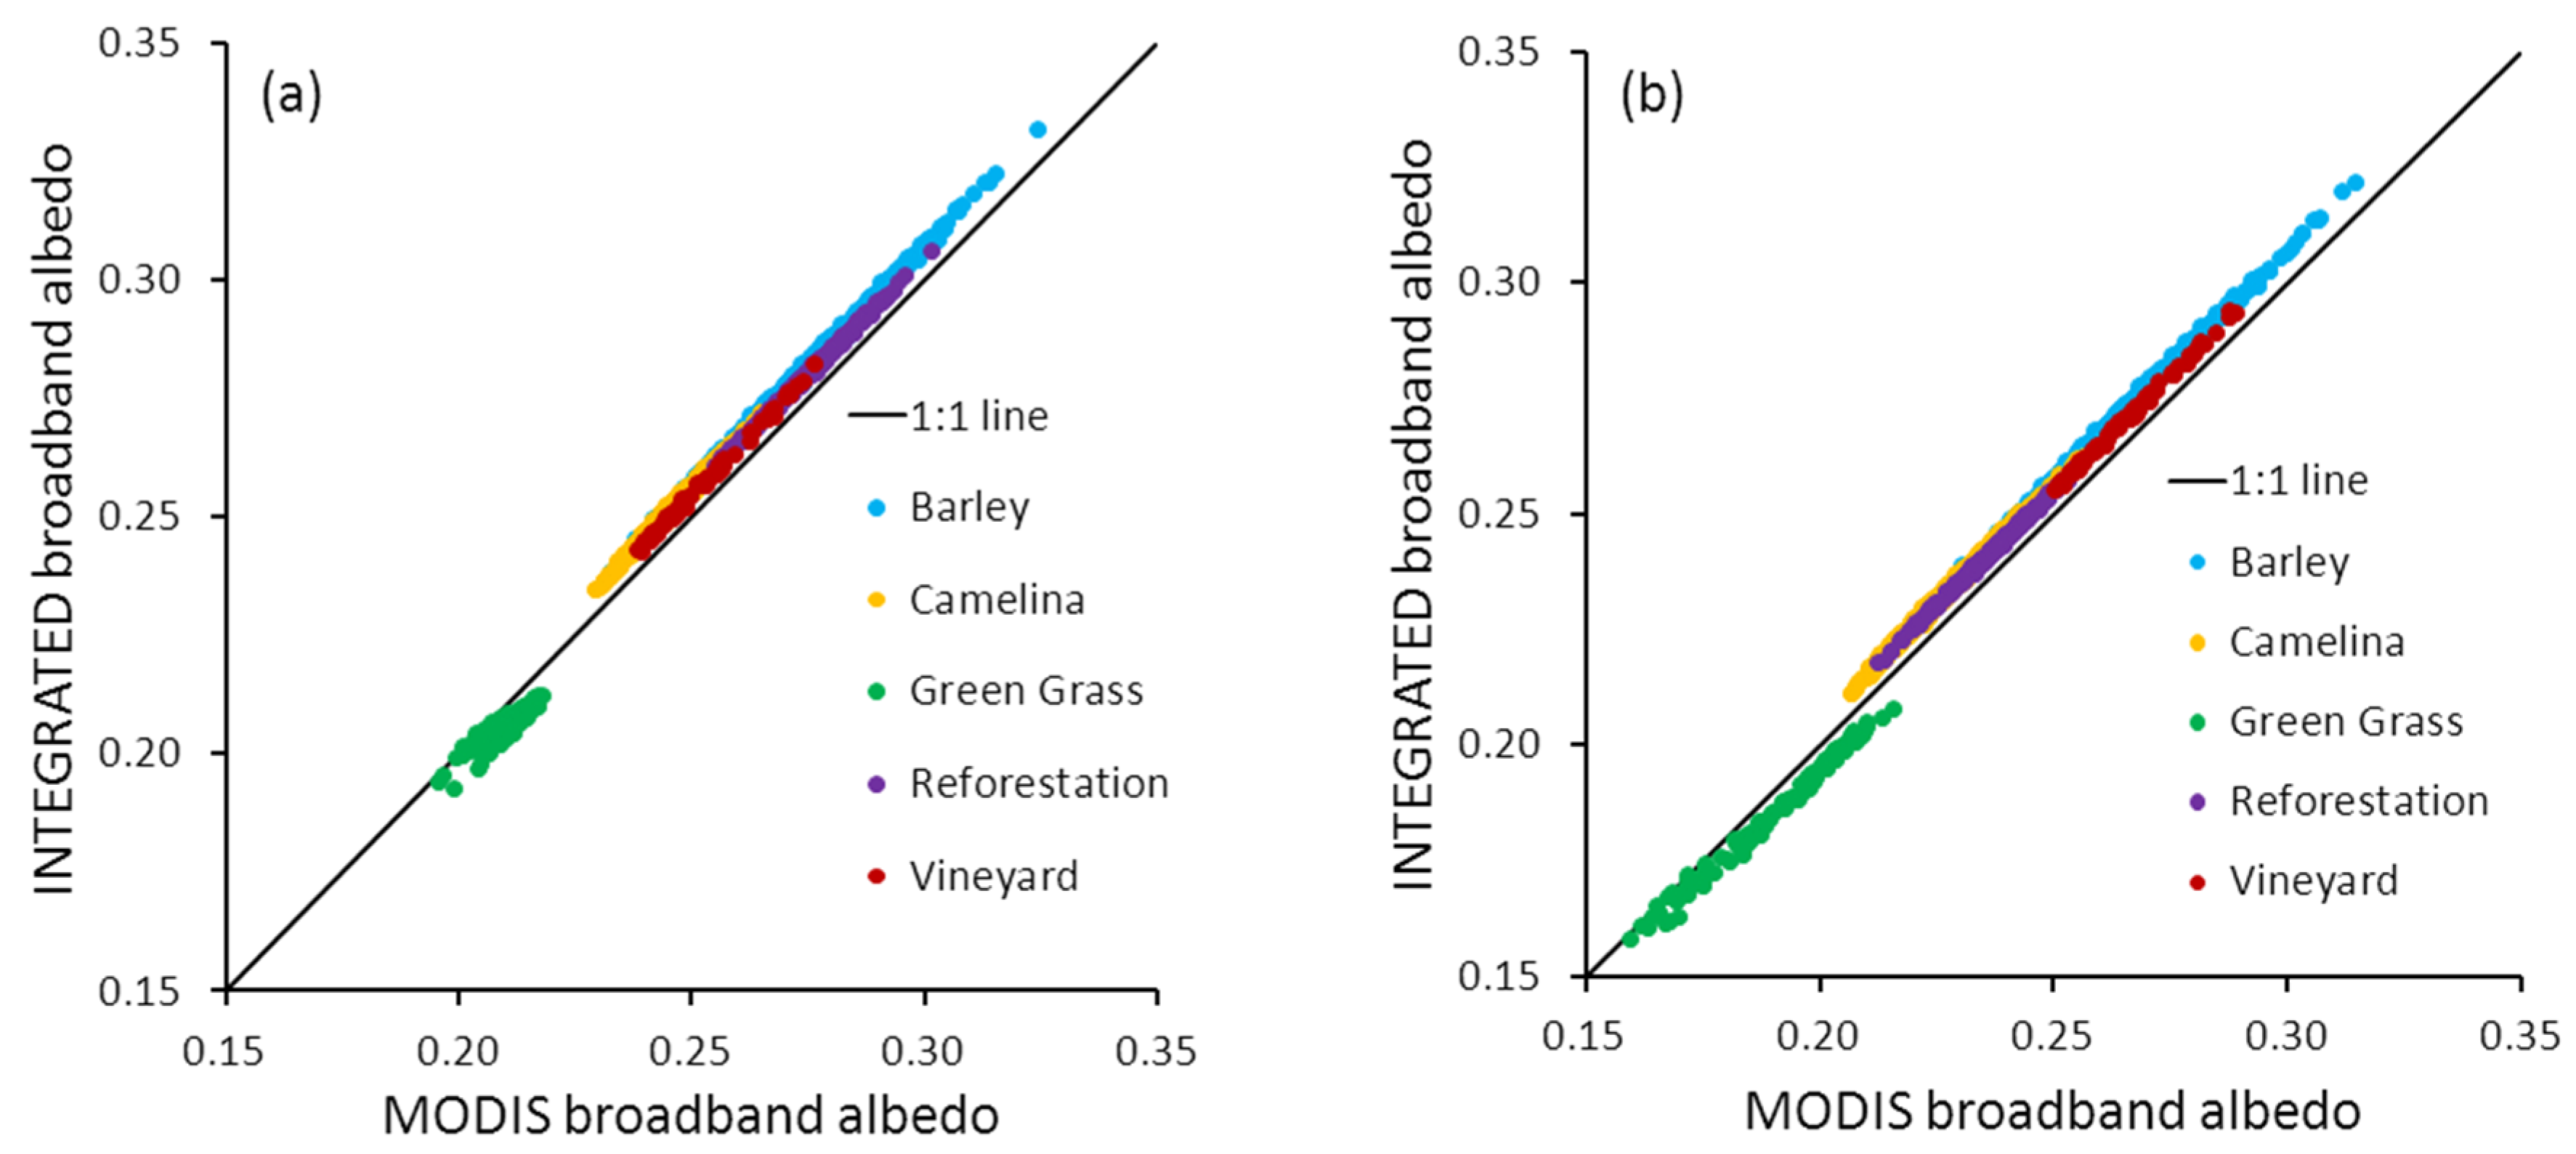
3.3. Validation
4. Conclusions
Acknowledgments
Author Contributions
Conflicts of Interest
References
- Norman, J.M.; Kustas, W.P.; Humes, K.S. Source approach for estimating soil and vegetation energy fluxes in observations of directional radiometric surface temperature. Agric. For. Meteorol. 1995, 77, 263–293. [Google Scholar] [CrossRef]
- Allen, R.G.; Tasumi, M.; Trezza, R. Satellite-based energy balance for mapping evapotranspiration with internalized calibration (metric)—Model. J. Irrig. Drain. Eng. 2007, 133, 380–394. [Google Scholar] [CrossRef]
- Zhang, X.; Liang, S.; Wang, K.; Li, L.; Gui, S. Analysis of global land surface shortwave broadband albedo from multiple data sources. IEEE J. Sel. Top. Appl. Earth Observ. Remote Sens. 2010, 3, 296–305. [Google Scholar] [CrossRef]
- Zhang, Y.C.; Rossow, W.B.; Lacis, A.A. Calculation of surface and top of atmosphere radiative fluxes from physical quantities based on ISCCP data sets 1. Method and sensitivity to input data uncertainties. J. Geophys. Res. 1995, 100, 1149–1165. [Google Scholar] [CrossRef]
- Myhre, G.; Myhre, A. Uncertainties in radiative forcing due to surface albedo changes caused by land-use changes. J. Clim. 2003, 16, 1511–1524. [Google Scholar] [CrossRef]
- Sellers, P.J.; Meeson, B.W.; Hall, F.G.; Asrar, G.; Murphy, R.E.; Schiffer, R.A.; Bretherton, F.P.; Dickinson, R.E.; Ellingson, R.G.; Field, C.B.; et al. Remote sensing of the land surface for studies of global change: Models—Algorithms—Experiments. Remote Sens. Environ. 1995, 51, 3–26. [Google Scholar] [CrossRef]
- Mattar, C.; Franch, B.; Sobrino, J.A.; Corbari, C.; Jimenez-Munoz, J.C.; Olivera-Guerra, L.; Skokovic, D.; Soria, G.; Oltra-Carrio, R.; Julien, Y.; et al. Impacts of the broadband albedo on actual evapotranspiration estimated by S-SEBI model over an agricultural area. Remote Sens. Environ. 2014, 147, 23–42. [Google Scholar] [CrossRef]
- Timmermans, W.J.; Kustas, W.P.; Anderson, M.C.; French, A.N. An intercomparison of the surface energy balance algorithm for land (SEBAL) and the two-source energy balance (TSEB) modeling schemes. Remote Sens. Environ. 2007, 108, 369–384. [Google Scholar] [CrossRef]
- Gonzalez-Dugo, M.P.; Neale, C.M.U.; Mateos, L.; Kustas, W.P.; Prueger, J.H.; Anderson, M.C.; Li, F. A comparison of operational remote sensing-based models for estimating crop evapotranspiration. Agric. For. Meteorol. 2009, 149, 1843–1853. [Google Scholar] [CrossRef]
- Bastiaanssen, W.G.M.; Menenti, M.; Feddes, R.A.; Holtslag, A.A.M. A remote sensing surface energy balance algorithm for land (SEBAL)-1. Formulation. J. Hydrol. 1998, 212, 198–212. [Google Scholar] [CrossRef]
- Roerink, G.J.; Su, Z.; Menenti, M. S-sebi: A simple remote sensing algorithm to estimate the surface energy balance. Phys. Chem. Earth Part B Hydrol. Oceans Atmos. 2000, 25, 147–157. [Google Scholar] [CrossRef]
- Colaizzi, P.D.; Kustas, W.P.; Anderson, M.C.; Agam, N.; Tolk, J.A.; Evett, S.R.; Howell, T.A.; Gowda, P.H.; O’Shaughnessy, S.A. Two-source energy balance model estimates of evapotranspiration using component and composite surface temperatures. Adv. Water Resour. 2012, 50, 134–151. [Google Scholar] [CrossRef]
- Tasumi, M.; Allen, R.G.; Trezza, R. At-surface reflectance and albedo from satellite for operational calculation of land surface energy balance. J. Hydrol. Eng. 2008, 13, 51–63. [Google Scholar] [CrossRef]
- Qu, Y.; Liang, S.; Liu, Q.; He, T.; Liu, S.; Li, X. Mapping surface broadband albedo from satellite observations: A review of literatures on algorithms and products. Remote Sens. 2015, 7, 990–1020. [Google Scholar] [CrossRef]
- Liang, S. Narrowband to broadband conversions of land surface albedo I algorithms. Remote Sens. Environ. 2000, 76, 213–238. [Google Scholar] [CrossRef]
- Sobrino, J.A.; Franch, B.; Oltra-Carrió, R.; Vermote, E.F.; Fedele, E. Evaluation of the MODIS albedo product over a heterogeneous agricultural area. Int. J. Remote Sens. 2013, 34, 5530–5540. [Google Scholar] [CrossRef]
- Schaaf, C.B.; Gao, F.; Strahler, A.H.; Lucht, W.; Li, X.; Tsang, T.; Strugnell, N.C.; Zhang, X.; Jin, Y.; Muller, J.P.; et al. First operational BRDF, albedo nadir reflectance products from MODIS. Remote Sens. Environ. 2002, 83, 135–148. [Google Scholar] [CrossRef]
- Liang, S.; Strahler, A.H.; Walthall, C. Retrieval of land surface albedo from satellite observations: A simulation study. J. Appl. Meteorol. 1999, 38, 712–725. [Google Scholar] [CrossRef]
- He, T.; Liang, S.; Wang, D.; Shi, Q.; Tao, X. Estimation of high-resolution land surface shortwave albedo from AVIRIS data. IEEE J. Sel. Top. Appl. Earth Observ. Remote Sens. 2014, 7, 4919–4928. [Google Scholar] [CrossRef]
- Disney, M.; Lewis, P.; Thackrah, G.; Quaife, T.; Barnsley, M. Comparison of MODIS broadband albedo over an agricultural site with ground measurements and values derived from earth observation data at a range of spatial scales. Int. J. Remote Sens. 2004, 25, 5297–5317. [Google Scholar] [CrossRef]
- Kuusk, A. The angular distribution of reflectance and vegetation indices in barley and clover canopies. Remote Sens. Environ. 1991, 37, 143–151. [Google Scholar] [CrossRef]
- Camacho de Coca, F.; Gilabert, M.A.; Meliá, J. Bidirectional reflectance Factor Analysis from Field Radiometry and Hymap Data; European Space Agency: Paris, France, 2001; p. 163. [Google Scholar]
- Gao, F.; Schaaf, C.B.; Strahler, A.H.; Jin, Y.; Li, X. Detecting vegetation structure using a kernel-based BRDF model. Remote Sens. Environ. 2003, 86, 198–205. [Google Scholar] [CrossRef]
- Weyermann, J.; Damm, A.; Kneubuhler, M.; Schaepman, M.E. Correction of reflectance anisotropy effects of vegetation on airborne spectroscopy data and derived products. IEEE Trans. Geosci. Remote Sens. 2014, 52, 616–627. [Google Scholar] [CrossRef]
- Román, M.O.; Gatebe, C.K.; Schaaf, C.B.; Poudyal, R.; Wang, Z.; King, M.D. Variability in surface BRDF at different spatial scales (30 m–500 m) over a mixed agricultural landscape as retrieved from airborne and satellite spectral measurements. Remote Sens. Environ. 2011, 115, 2184–2203. [Google Scholar] [CrossRef]
- Strahler, A.H.; Lucht, W.; Schaaf, C.B.; Tsang, T.; Gao, F.; Li, X.; Muller, J.-P.; Lewis, P.; Barnsley, M.J. Modis brdf/albedo Product: Algorithm Theoretical Basis Document Version 5.0; NASA EOS-MODIS: Greenbelt, MD, USA, 1999. [Google Scholar]
- Cescatti, A.; Marcolla, B.; Santhana Vannan, S.K.; Pan, J.Y.; Román, M.O.; Yang, X.; Ciais, P.; Cook, R.B.; Law, B.E.; Matteucci, G.; et al. Intercomparison of MODIS albedo retrievals and in situ measurements across the global fluxnet network. Remote Sens. Environ. 2012, 121, 323–334. [Google Scholar] [CrossRef]
- Roman, M.O.; Gatebe, C.K.; Shuai, Y.; Wang, Z.; Gao, F.; Masek, J.G.; He, T.; Liang, S.; Schaaf, C.B. Use of in situ and airborne multiangle data to assess MODIS- and Landsat-based estimates of directional reflectance and albedo. IEEE Trans. Geosci. Remote Sens. 2013, 51, 1393–1404. [Google Scholar] [CrossRef]
- Richter, R.; Schläpfer, D. Atmospheric/Topographic Correction for Satellite Imagery—Atcor 2/3 User Guide Report No. Dlr-ib 565-02/14; DLR/ReSe: Wessling, Germany, 2014; p. 240. [Google Scholar]
- Schaepman-Strub, G.; Schaepman, M.E.; Painter, T.H.; Dangel, S.; Martonchik, J.V. Reflectance quantities in optical remote sensing-definitions and case studies. Remote Sens. Environ. 2006, 103, 27–42. [Google Scholar] [CrossRef]
- Martonchik, J.V.; Bruegge, C.J.; Strahler, A.H. A review of reflectance nomenclature used in remote sensing. Remote Sens. Rev. 2000, 19, 9–20. [Google Scholar] [CrossRef]
- Nicodemus, F.E.; Richmond, J.C.; Hsia, J.J.; Ginsberg, I.W.; Limperis, T. Geometrical Considerations and Nomenclature for Reflectance; National Bureau of Standards, US Department of Commerce: Washington, DC, USA, 1977.
- Mousivand, A.; Verhoef, W.; Menenti, M.; Gorte, B. Modeling top of atmosphere radiance over heterogeneous non-Lambertian rugged terrain. Remote Sens. 2015, 7, 8019–8044. [Google Scholar] [CrossRef]
- Timmermans, W.; van der Tol, C.; Timmermans, J.; Ucer, M.; Chen, X.; Alonso, L.; Moreno, J.; Carrara, A.; Lopez, R.; de la Cruz Tercero, F.; et al. An overview of the regional experiments for land-atmosphere exchanges 2012 (reflex 2012) campaign. Acta Geophys. 2014, 63, 1–20. [Google Scholar] [CrossRef] [Green Version]
- Andreu Méndez, A. Water Monitoring in Vegetation Covers through Multi-Scale Energy Balance Moddelling Using Time Series of Remotely Sensed Data; University of Córdoba: Córdoba, Spain, 2014. [Google Scholar]
- Campbell Scientific, I. Cnr1 Net Radiometer Instruction Manual; Logan: Logan, UT, USA, 2011; p. 4. [Google Scholar]
- Yang, F.; Mitchell, K.; Hou, Y.T.; Dai, Y.; Zeng, X.; Wang, Z.; Liang, X.Z. Dependence of land surface albedo on solar zenith angle: Observations and model parameterization. J. Appl. Meteorol. Climatol. 2008, 47, 2963–2982. [Google Scholar] [CrossRef]
- Dickinson, R.E. Land surface processes and climate-surface albedos and energy balance. In Advances in Geophysics; Saltzman, B., Ed.; Academic Press: New York, NY, USA, 1983; Volume 25, pp. 305–353. [Google Scholar]
- Briegleb, B.P. Delta-eddington approximation for solar radiation in the NCAR community climate model. J. Geophys. Res. 1992, 97, 7603–7612. [Google Scholar] [CrossRef]
- Roujean, J.L.; Leroy, M.; Deschamps, P.Y. A bidirectional reflectance model of the Earth's surface for the correction of remote sensing data. J. Geophys. Res. 1992, 97, 20455–20468. [Google Scholar] [CrossRef]
- De Miguel, E.; Jiménez, M.; Pérez, I.; de la Cámara, Ó.G.; Muñoz, F.; Gómez-Sánchez, J.A. AHS and CASI processing for the REFLEX remote sensing campaign: Methods and results. Acta Geophys. 2015, 63, 1485–1498. [Google Scholar] [CrossRef]
- Calleja, J.F.; Hellmann, C.; Mendiguren, G.; Punalekar, S.; Peón, J.; MacArthur, A.; Alonso, L. Relating hyperspectral airborne data to ground measurements in a complex and discontinuous canopy. Acta Geophys. 2015, 63, 1499–1515. [Google Scholar] [CrossRef]
- Dubayah, R. Estimating net solar radiation using Landsat thematic mapper and digital elevation data. Water Resour. Res. 1992, 28, 2469–2484. [Google Scholar] [CrossRef]
- Duguay, C.R.; Le Drew, E.F. Estimating surface reflectance and albedo from Landsat-5 thematic mapper over rugged terrain. Photogramm. Eng. Remote Sens. 1992, 58, 551–558. [Google Scholar]
- Liang, S.; Shuey, C.J.; Russ, A.L.; Fang, H.; Chen, M.; Walthall, C.L.; Daughtry, C.S.T.; Hunt, R., Jr. Narrowband to broadband conversions of land surface albedo: II. Validation. Remote Sens. Environ. 2003, 84, 25–41. [Google Scholar] [CrossRef]
- Michalsky, J.J.; Hodges, G.B. Field measured spectral albedo-four years of data from the western U.S. Prairie. J. Geophys. Res. 2013, 118, 813–825. [Google Scholar] [CrossRef]
- Peltoniemi, J.I.; Manninen, T.; Suomalainen, J.; Hakala, T.; Puttonen, E.; Riihelä, A. Land surface albedos computed from BRF measurements with a study of conversion formulae. Remote Sens. 2010, 2, 1918–1940. [Google Scholar] [CrossRef]
- Hou, Y.-T.; Moorthi, S.; Campana, K.A. Parameterization of Solar Radiation Transfer in the Ncep Models; NCEP Office Note; U.S. Department of Commerce: Camp Springs, MD, USA, 2002; p. 34.
- Wang, Z.; Zeng, X.; Barlage, M. Moderate resolution imaging spectroradiometer bidirectional reflectance distribution function-based albedo parameterization for weather and climate models. J. Geophys. Res. 2007, 112. [Google Scholar] [CrossRef]
- Liang, X.Z.; Xu, M.; Gao, W.; Kunkel, K.; Slusser, J.; Dai, Y.; Min, Q.; Houser, P.R.; Rodell, M.; Schaaf, C.B.; et al. Development of land surface albedo parameterization based on moderate resolution imaging spectroradiometer (MODIS) data. J. Geophys. Res. 2005, 110. [Google Scholar] [CrossRef]
- NOAA Solar Calculator. Available online: http://www.esrl.noaa.gov/gmd/grad/solcalc/ (accessed on 6 November 2015).
- Ma, W.; Ma, Y.; Li, M.; Hu, Z.; Zhong, L.; Su, Z.; Ishikawa, H.; Wang, J. Estimating surface fluxes over the north tibetan plateau area with ASTER imagery. Hydrol. Earth Syst. Sci. 2009, 13, 57–67. [Google Scholar] [CrossRef]
- Ruhoff, A.L.; Paz, A.R.; Collischonn, W.; Aragao, L.E.O.C.; Rocha, H.R.; Malhi, Y.S. A MODIS-based energy balance to estimate evapotranspiration for clear-sky days in Brazilian tropical savannas. Remote Sens. 2012, 4, 703–725. [Google Scholar] [CrossRef]
- Samani, Z.; Bawazir, S.A.; Bleiweiss, M.; Skaggs, R.; Tran, V.D. Estimating daily net radiation over vegetation canopy through remote sensing and climatic data. J. Irrig. Drain. Eng. 2007, 133, 291–297. [Google Scholar] [CrossRef]
- Timmermans, W.J.; Jiménez-Muñoz, J.C.; Hidalgo, V.; Richter, K.; Sobrino, J.A.; D’Urso, G.; Satalino, G.; Mattia, F.; de Lathauwer, E.; Pauwels, V.R.N. Estimation of the spatially distributed surface energy budget for AgriSAR 2006, Part I: Remote sensing model intercomparison. IEEE J. Sel. Top. Appl. Earth Observ. Remote Sens. 2011, 4, 465–481. [Google Scholar] [CrossRef]
- Rees, W.G. Physical Principles of Remote Sensing, 2nd ed.; Cambridge University Press: Cambridge, UK, 2001. [Google Scholar]
- Roesch, A.; Schaaf, C.; Gao, F. Use of moderate-resolution imaging spectroradiometer bidirectional reflectance distribution function products to enhance simulated surface albedos. J. Geophys. Res. 2004, 109. [Google Scholar] [CrossRef]
- Liu, J.; Schaaf, C.; Strahler, A.; Jiao, Z.; Shuai, Y.; Zhang, Q.; Roman, M.; Augustine, J.A.; Dutton, E.G. Validation of moderate resolution imaging spectroradiometer (MODIS) albedo retrieval algorithm: Dependence of albedo on solar zenith angle. J. Geophys. Res. 2009, 114. [Google Scholar] [CrossRef]
- Liang, S.; Fang, H.; Chen, M.; Shuey, C.J.; Walthall, C.; Daughtry, C.; Morisette, J.; Schaaf, C.; Strahler, A. Validating MODIS land surface reflectance and albedo products: Methods and preliminary results. Remote Sens. Environ. 2002, 83, 149–162. [Google Scholar] [CrossRef]
- Jacob, F.; Olioso, A.; Weiss, M.; Baret, F.; Hautecoeur, O. Mapping short-wave albedo of agricultural surfaces using airborne polder data. Remote Sens. Environ. 2002, 80, 36–46. [Google Scholar] [CrossRef]
- Jin, Y.; Schaaf, C.B.; Woodcock, C.E.; Gao, F.; Li, X.; Strahler, A.H.; Lucht, W.; Liang, S. Consistency of MODIS surface bidirectional reflectance distribution function and albedo retrievals: 2. Validation. J. Geophys. Res. 2003, 108. [Google Scholar] [CrossRef]
- Augustine, J.A.; DeLuisi, J.J.; Long, C.N. Surfrad—A national surface radiation budget network for atmospheric research. Bull. Am. Meteorol. Soc. 2000, 81, 2341–2357. [Google Scholar] [CrossRef]
- Stokes, G.M.; Schwartz, S.E. The atmospheric radiation measurement (ARM) program: Programmatic background and design of the cloud and radiation test bed. Bull. Am. Meteorol. Soc. 1994, 75, 1201–1221. [Google Scholar] [CrossRef]
- Wang, K.; Liang, S.; Schaaf, C.L.; Strahler, A.H. Evaluation of moderate resolution imaging spectroradiometer land surface visible and shortwave albedo products at fluxnet sites. J. Geophys. Res. 2010, 115. [Google Scholar] [CrossRef]
- Baldocchi, D.; Falge, E.; Gu, L.; Olson, R.; Hollinger, D.; Running, S.; Anthoni, P.; Bernhofer, C.; Davis, K.; Evans, R.; et al. Fluxnet: A new tool to study the temporal and spatial variability of ecosystem-scale carbon dioxide, water vapor, and energy flux densities. Bull. Am. Meteorol. Soc. 2001, 82, 2415–2434. [Google Scholar] [CrossRef]
- McFarlane, S.A.; Gaustad, K.L.; Mlawer, E.J.; Long, C.N.; Delamere, J. Development of a high spectral resolution surface albedo product for the ARM southern great plains central facility. Atmos. Meas. Tech. 2011, 4, 1713–1733. [Google Scholar] [CrossRef]
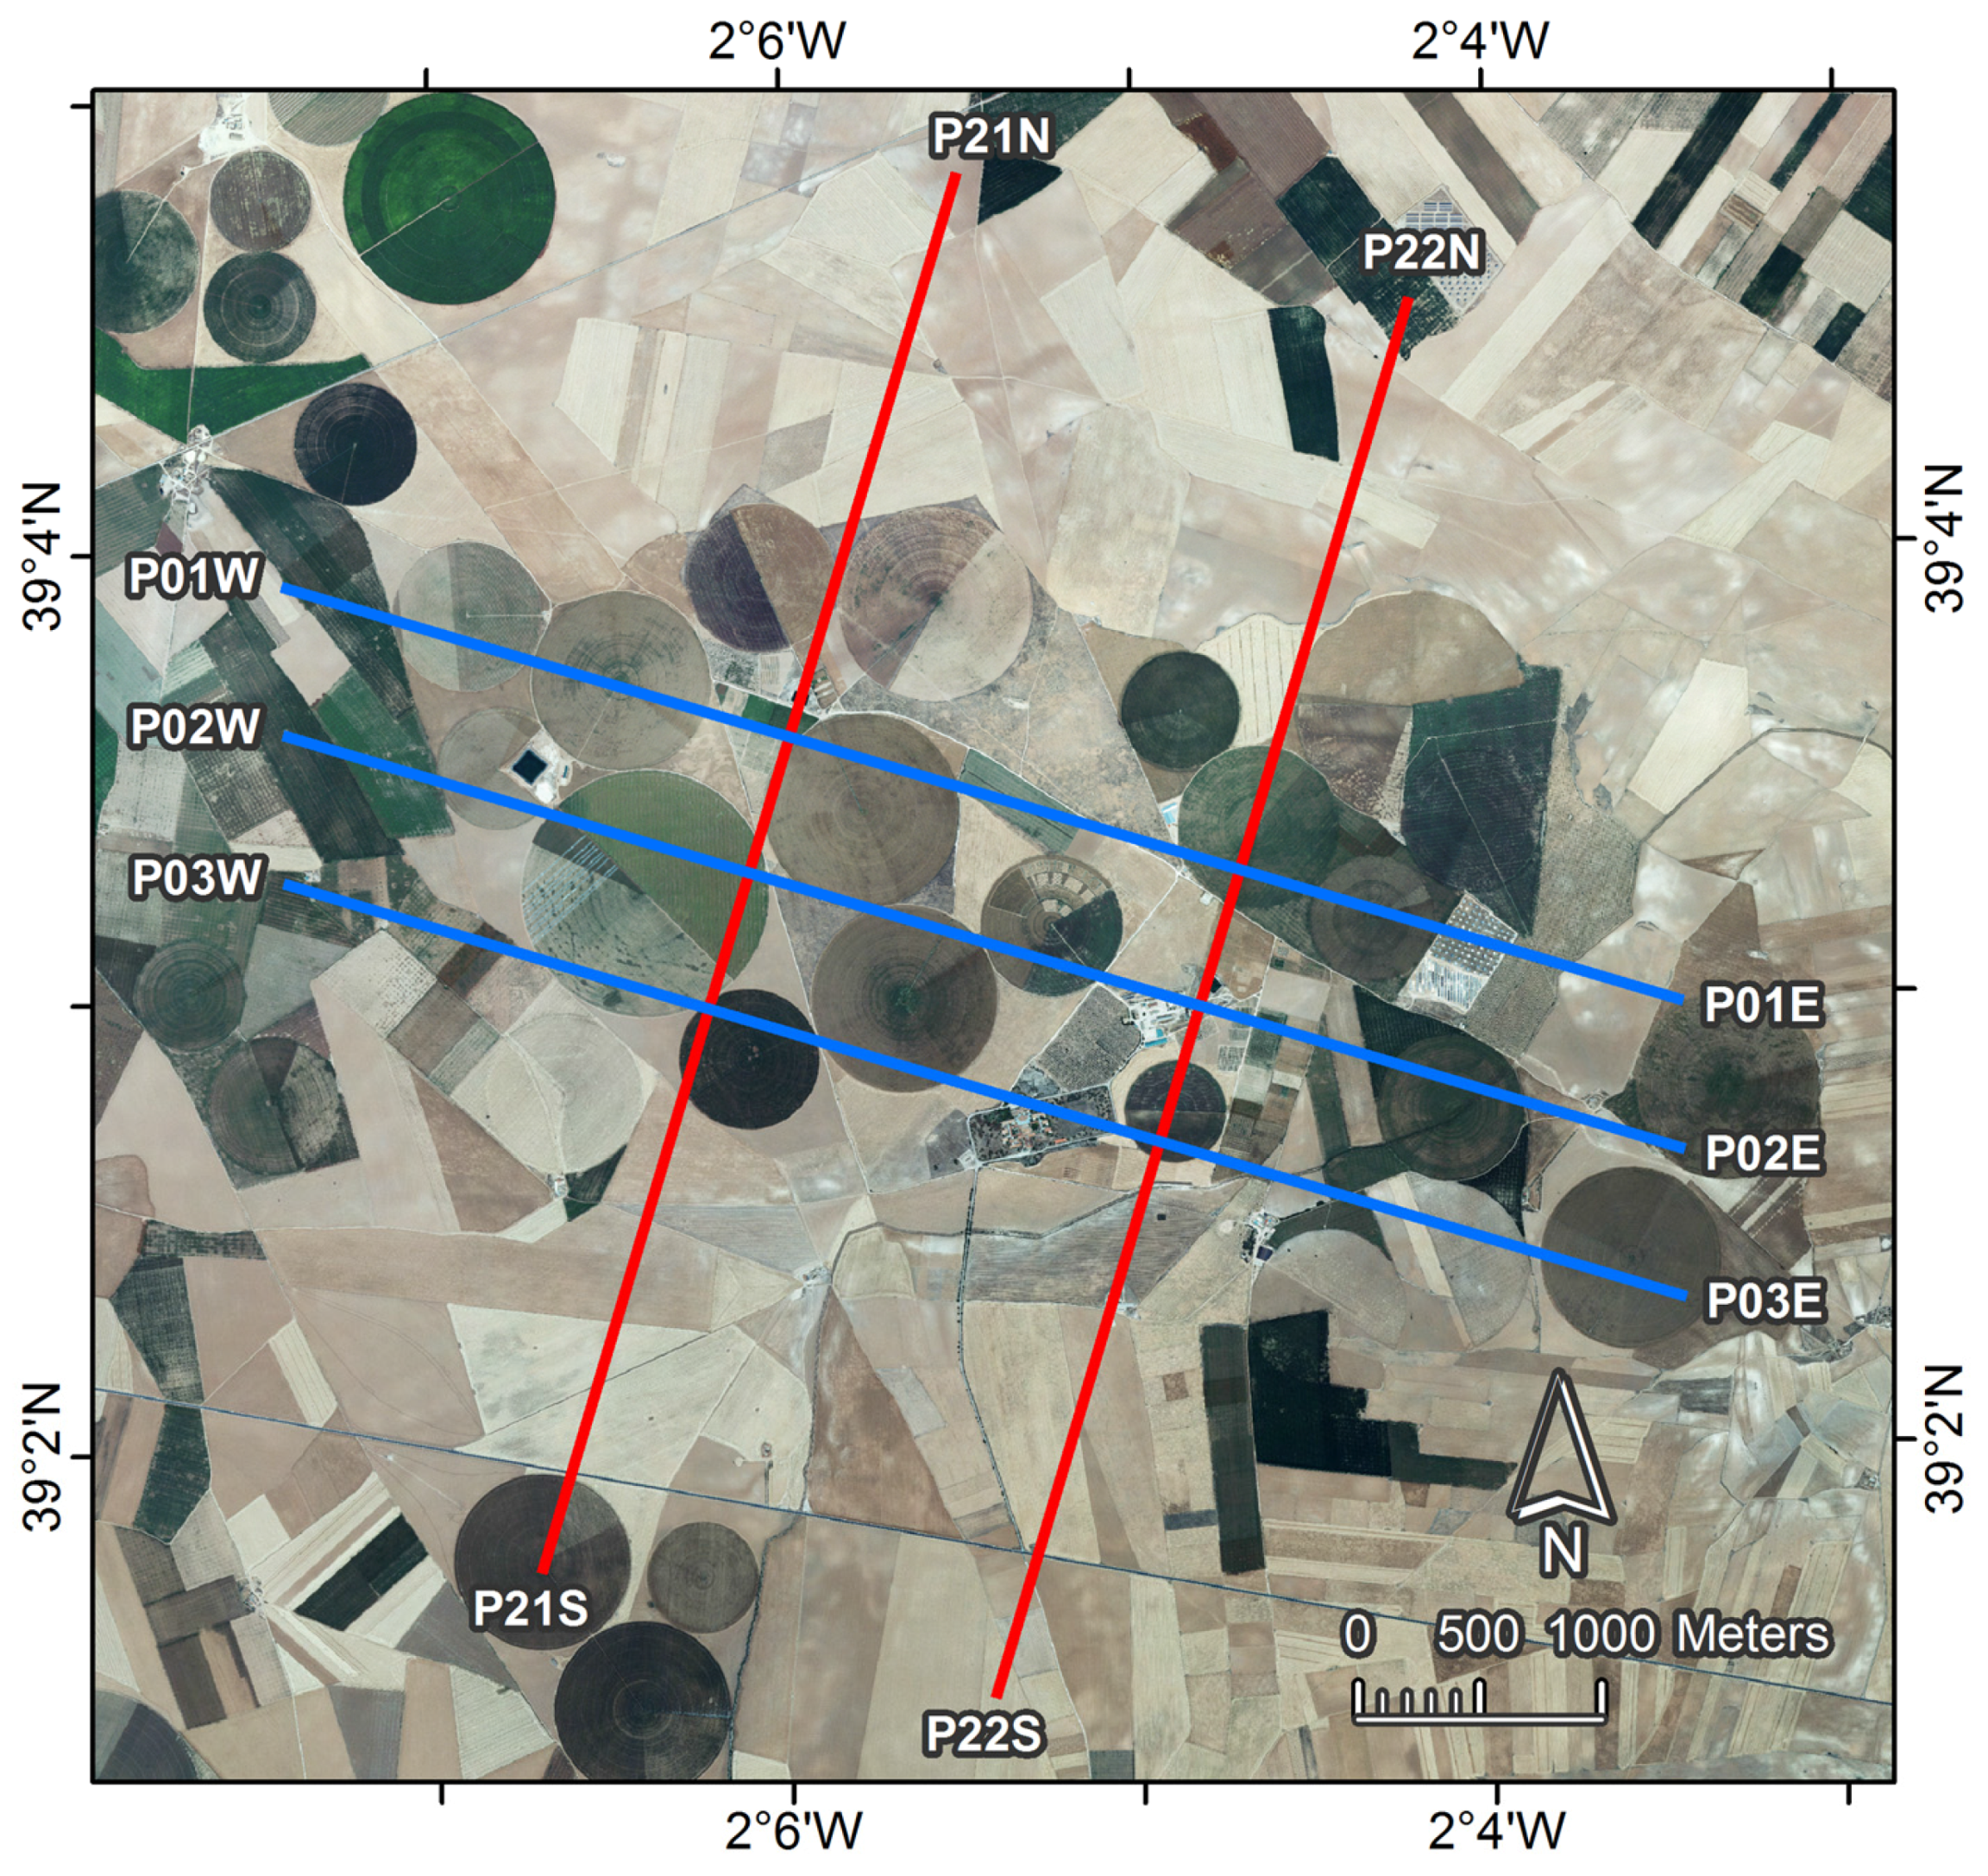
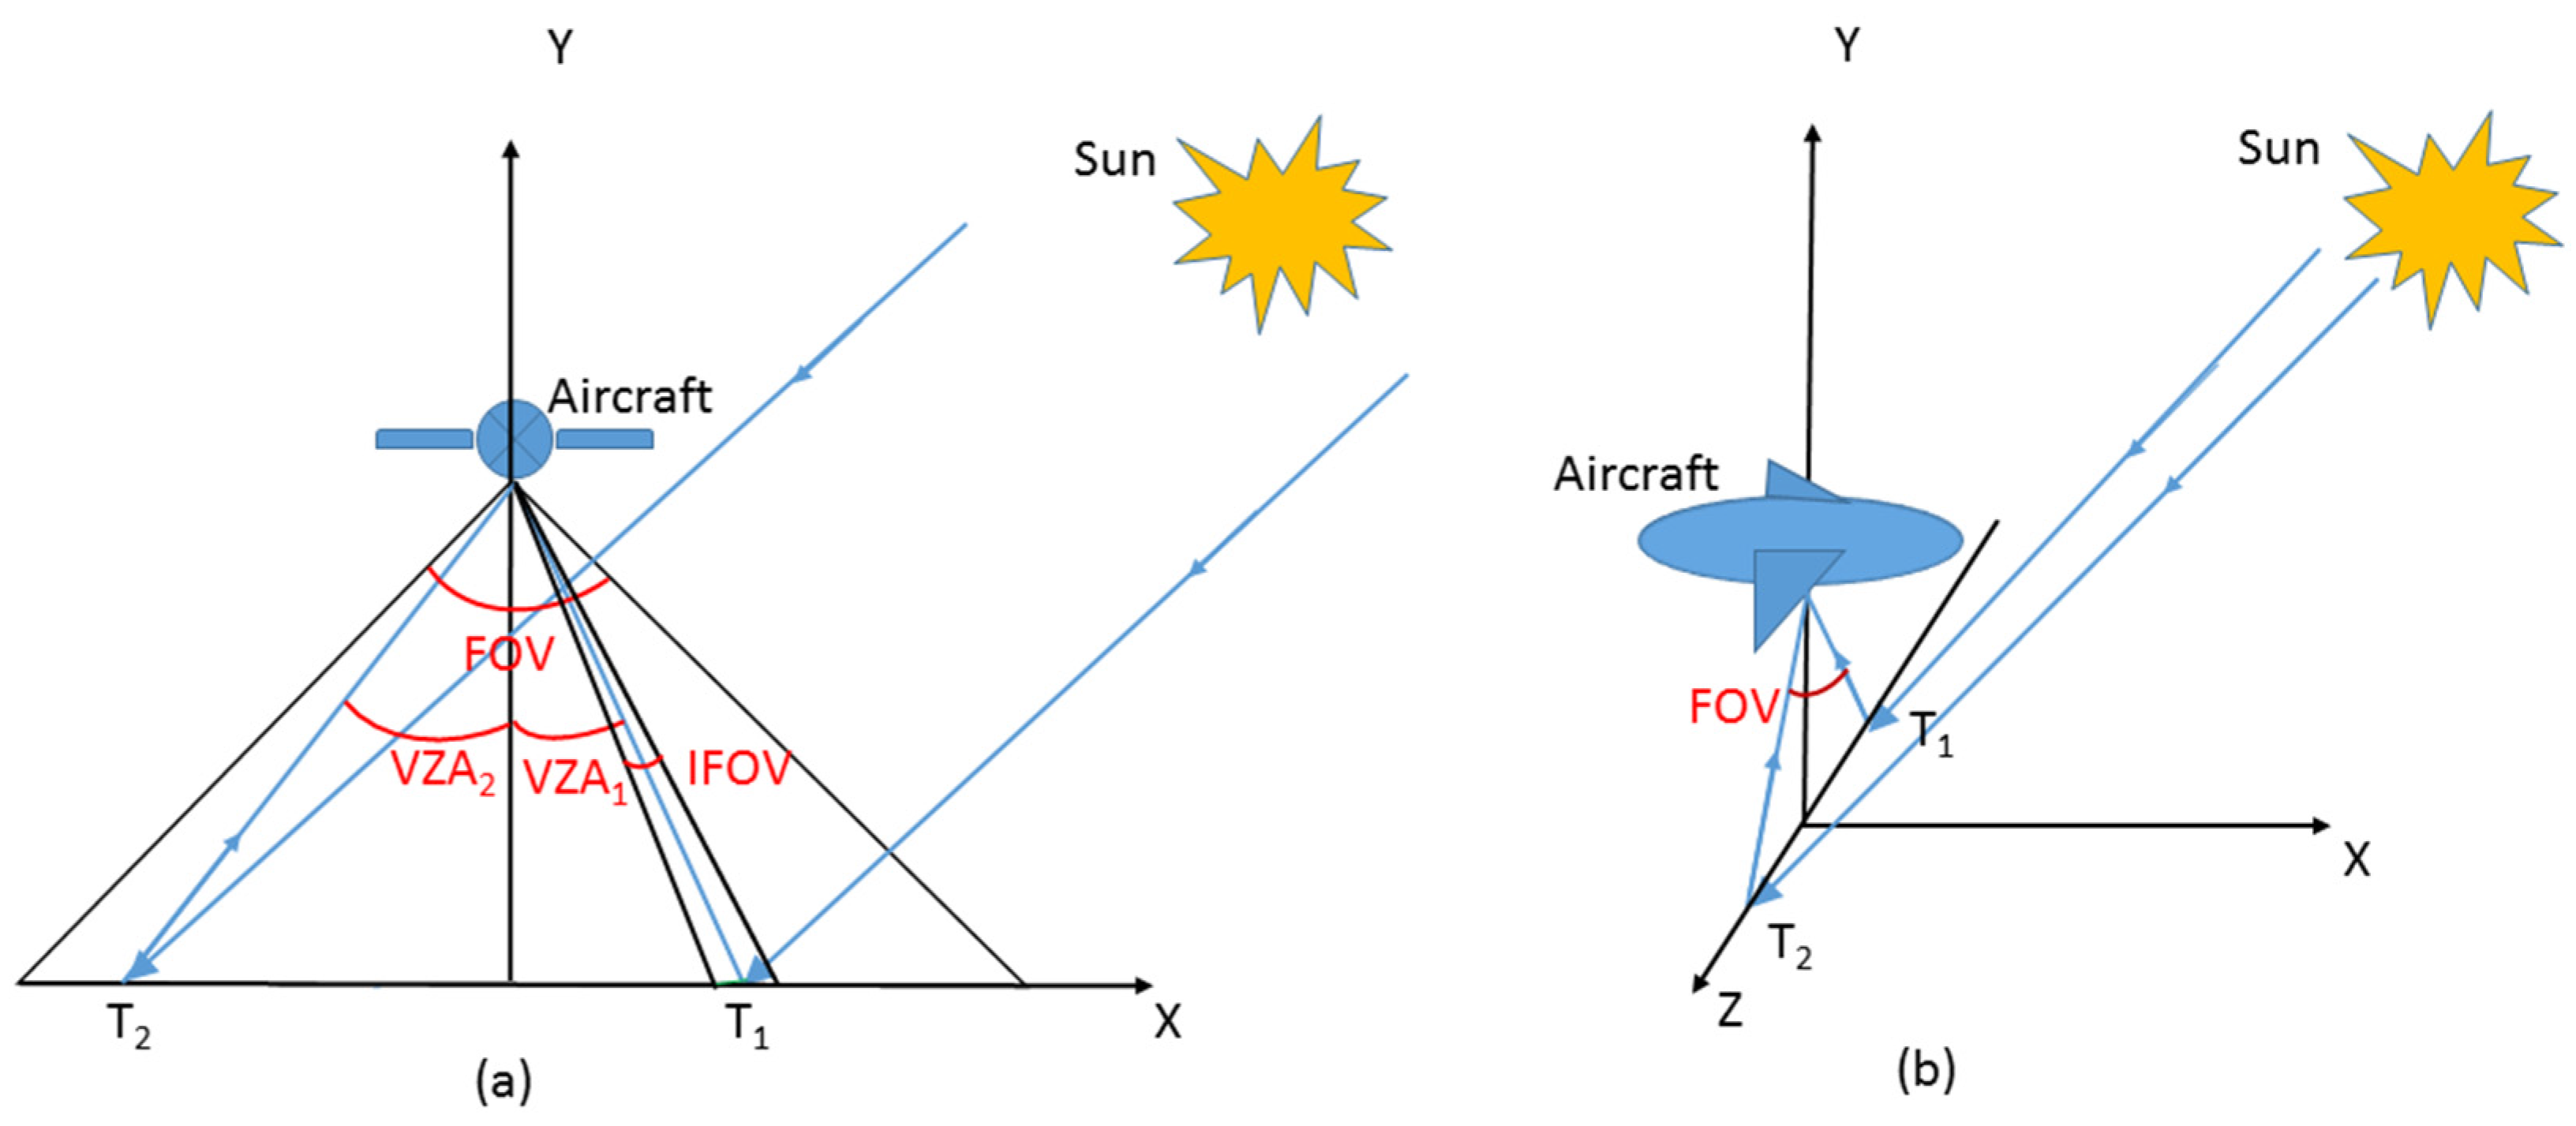

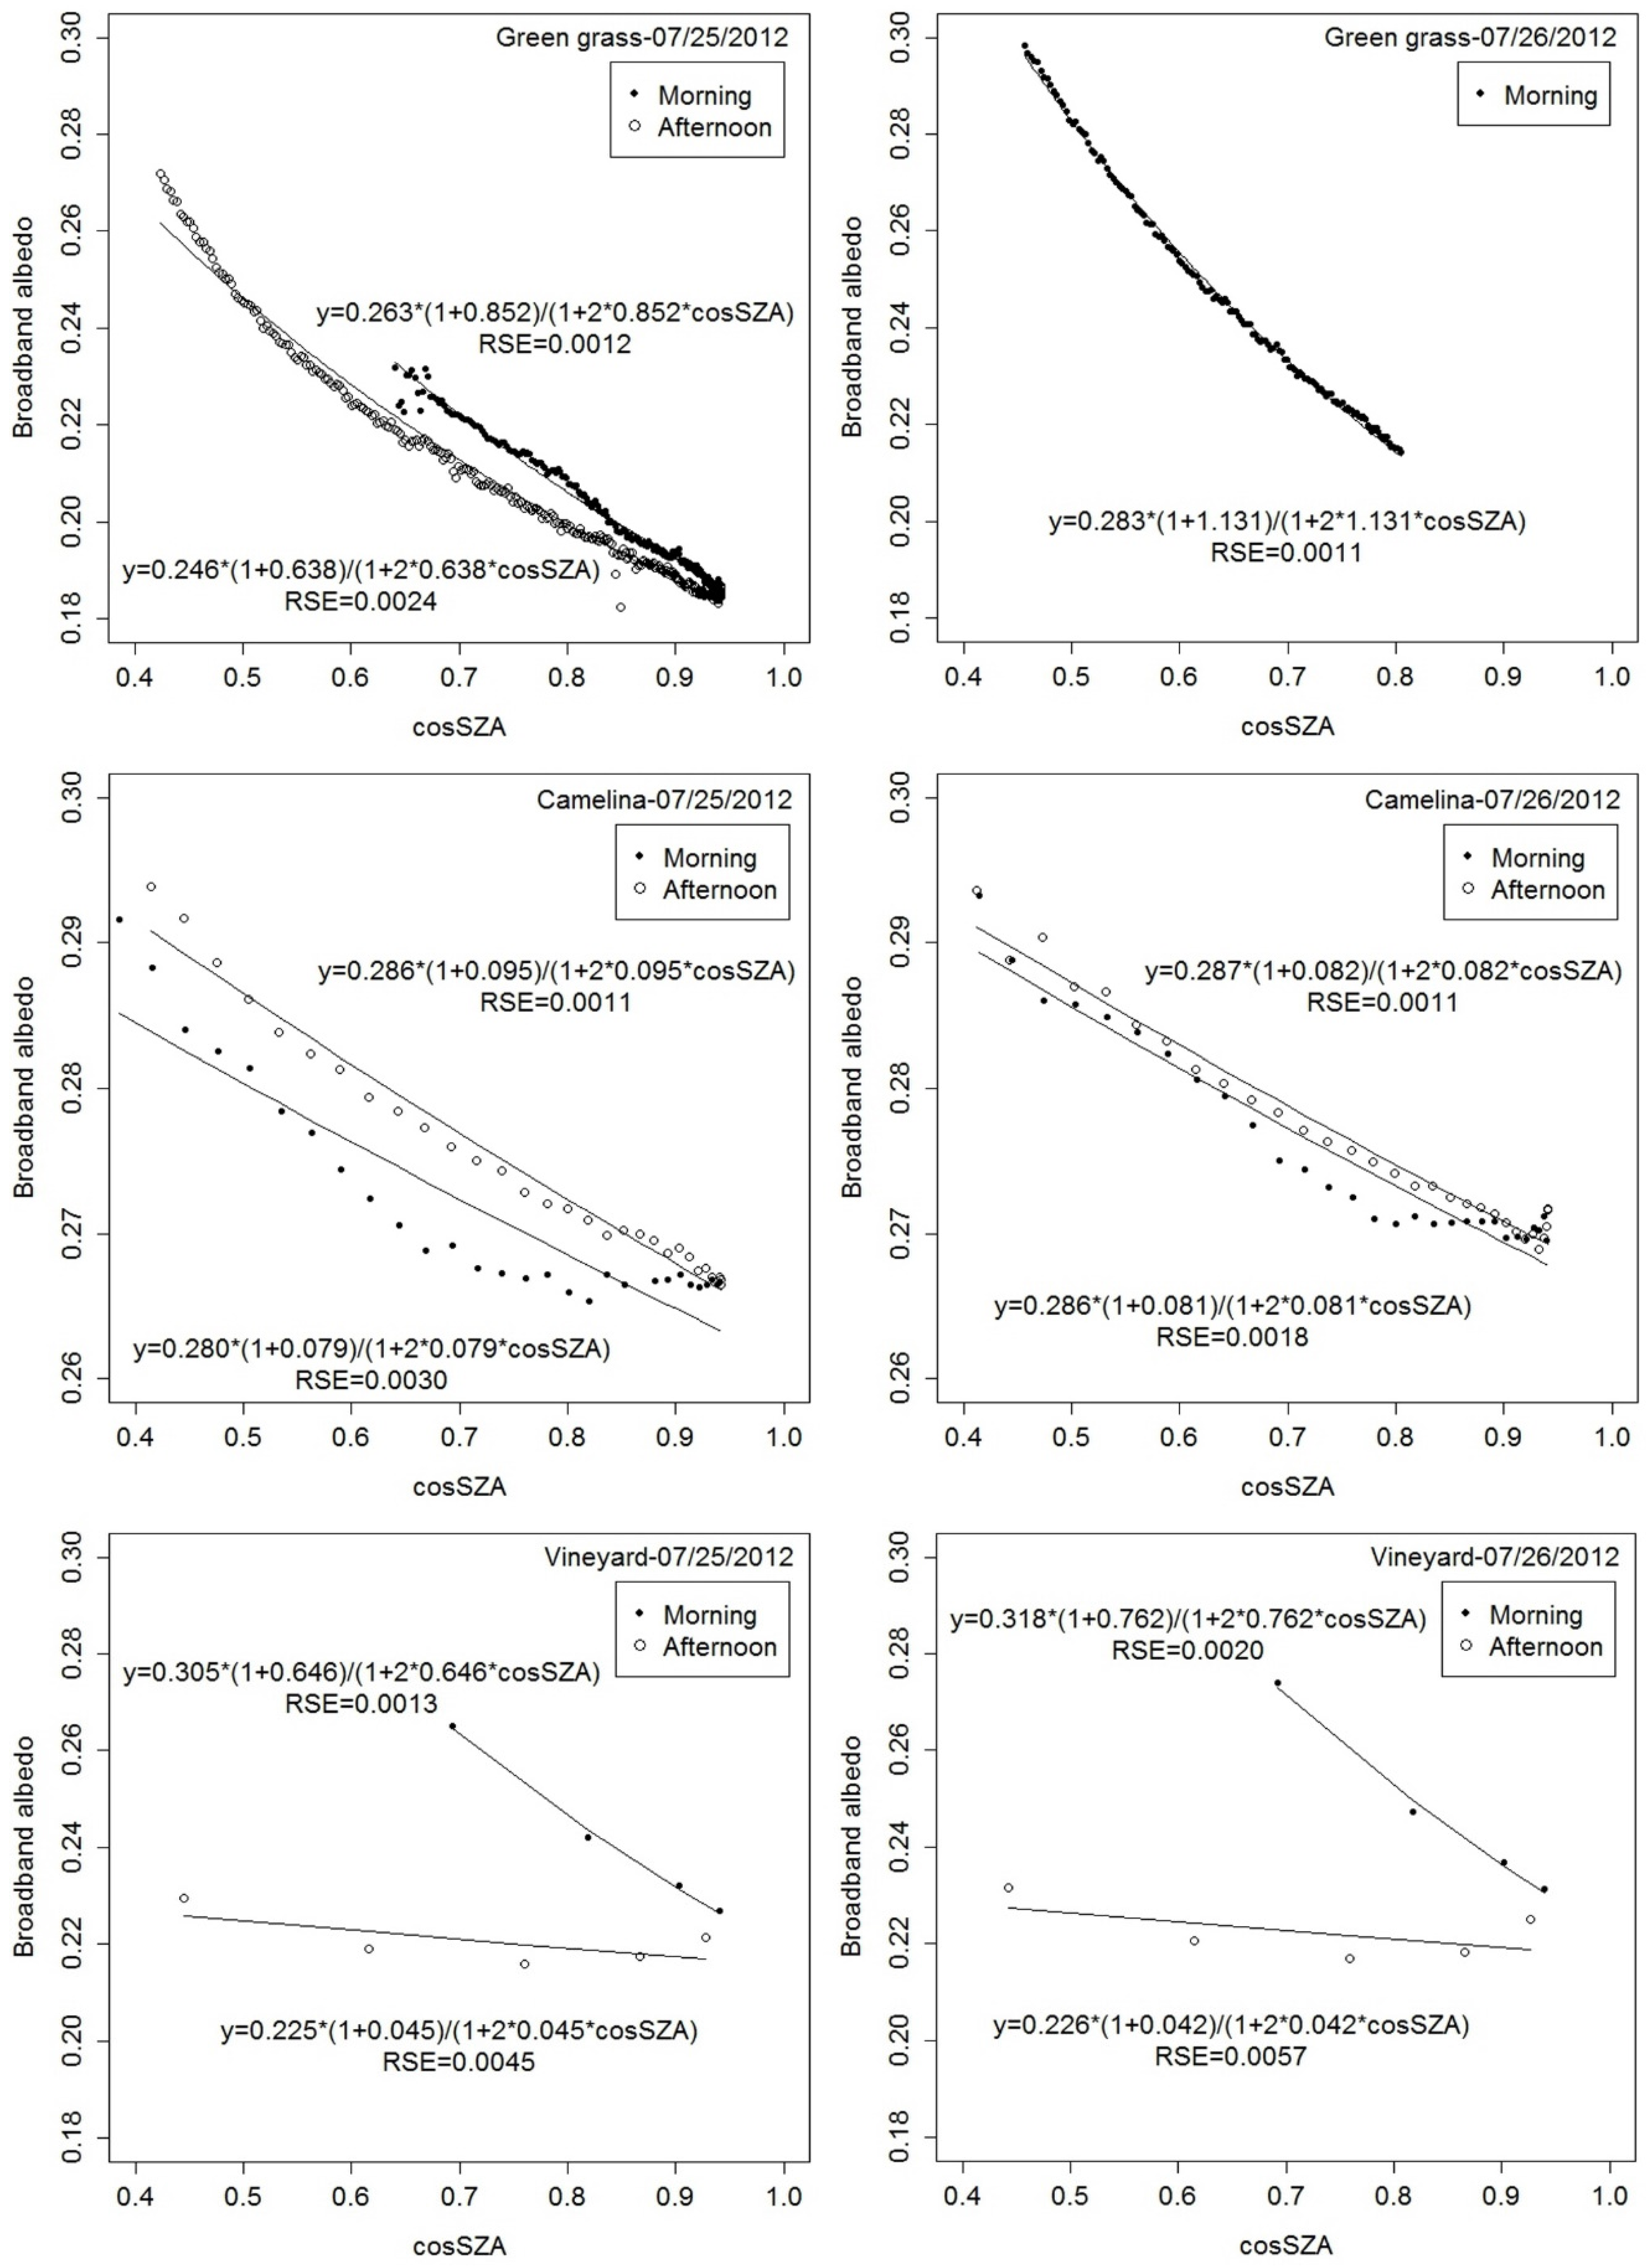
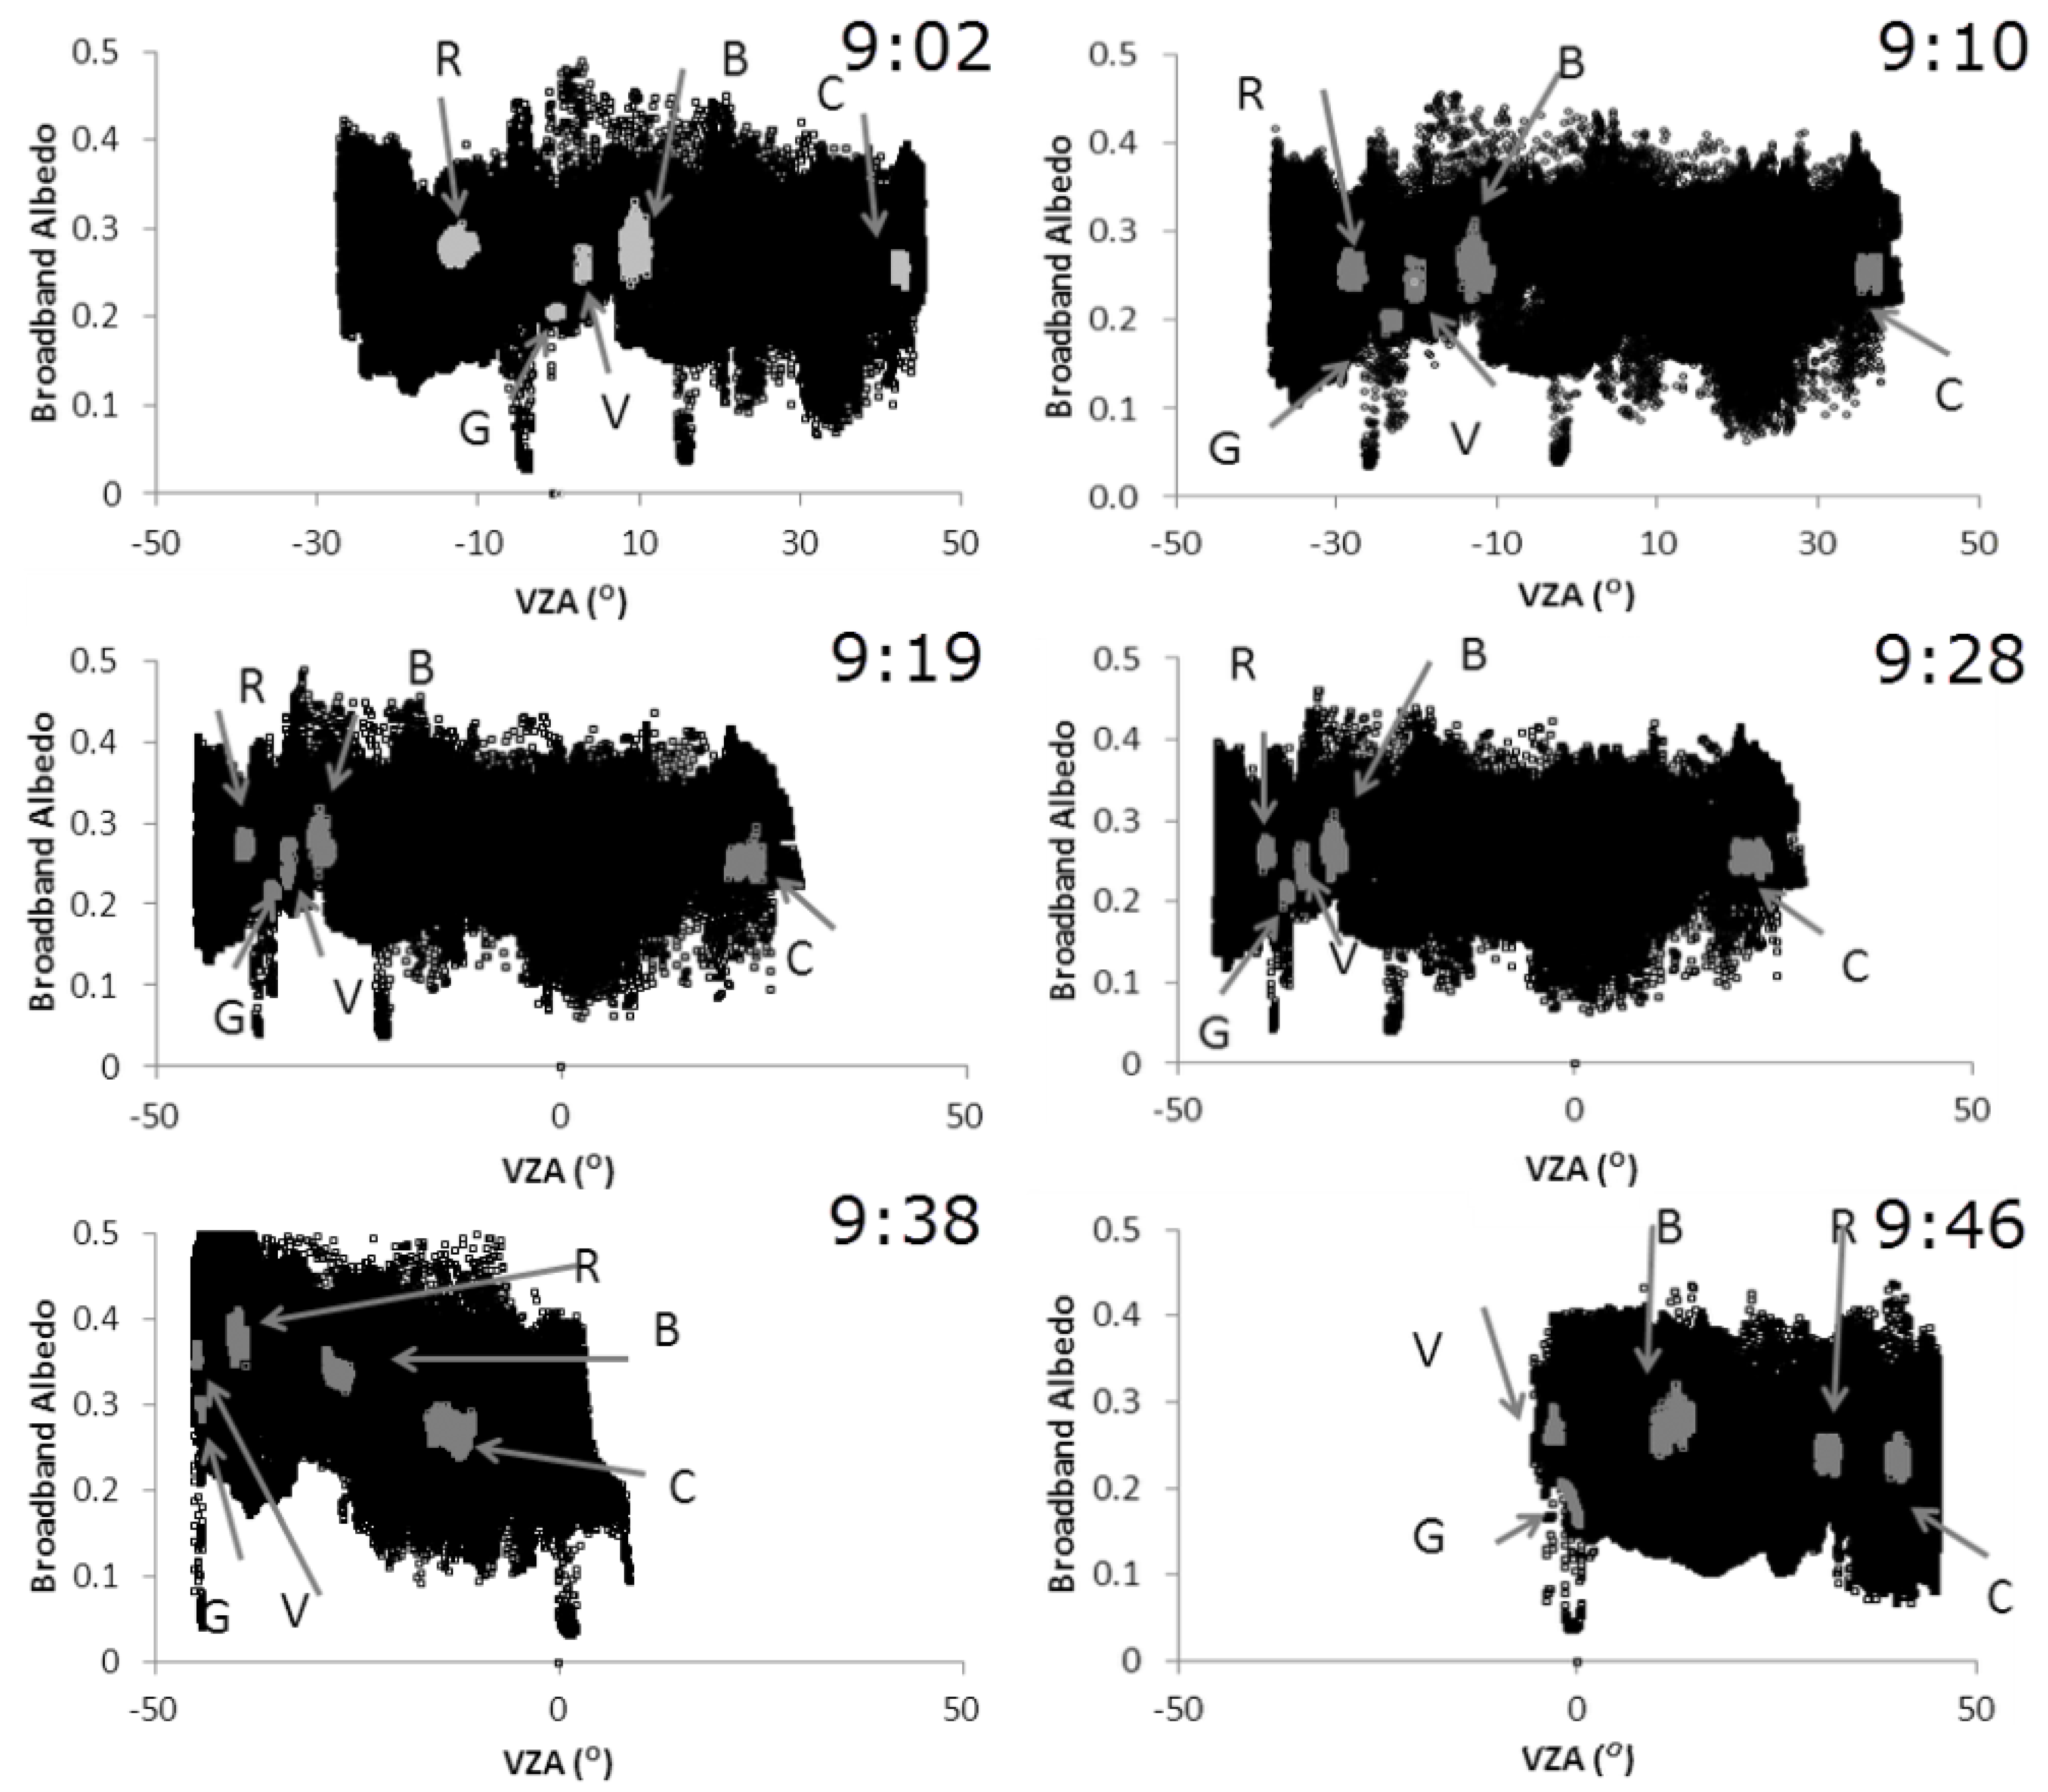
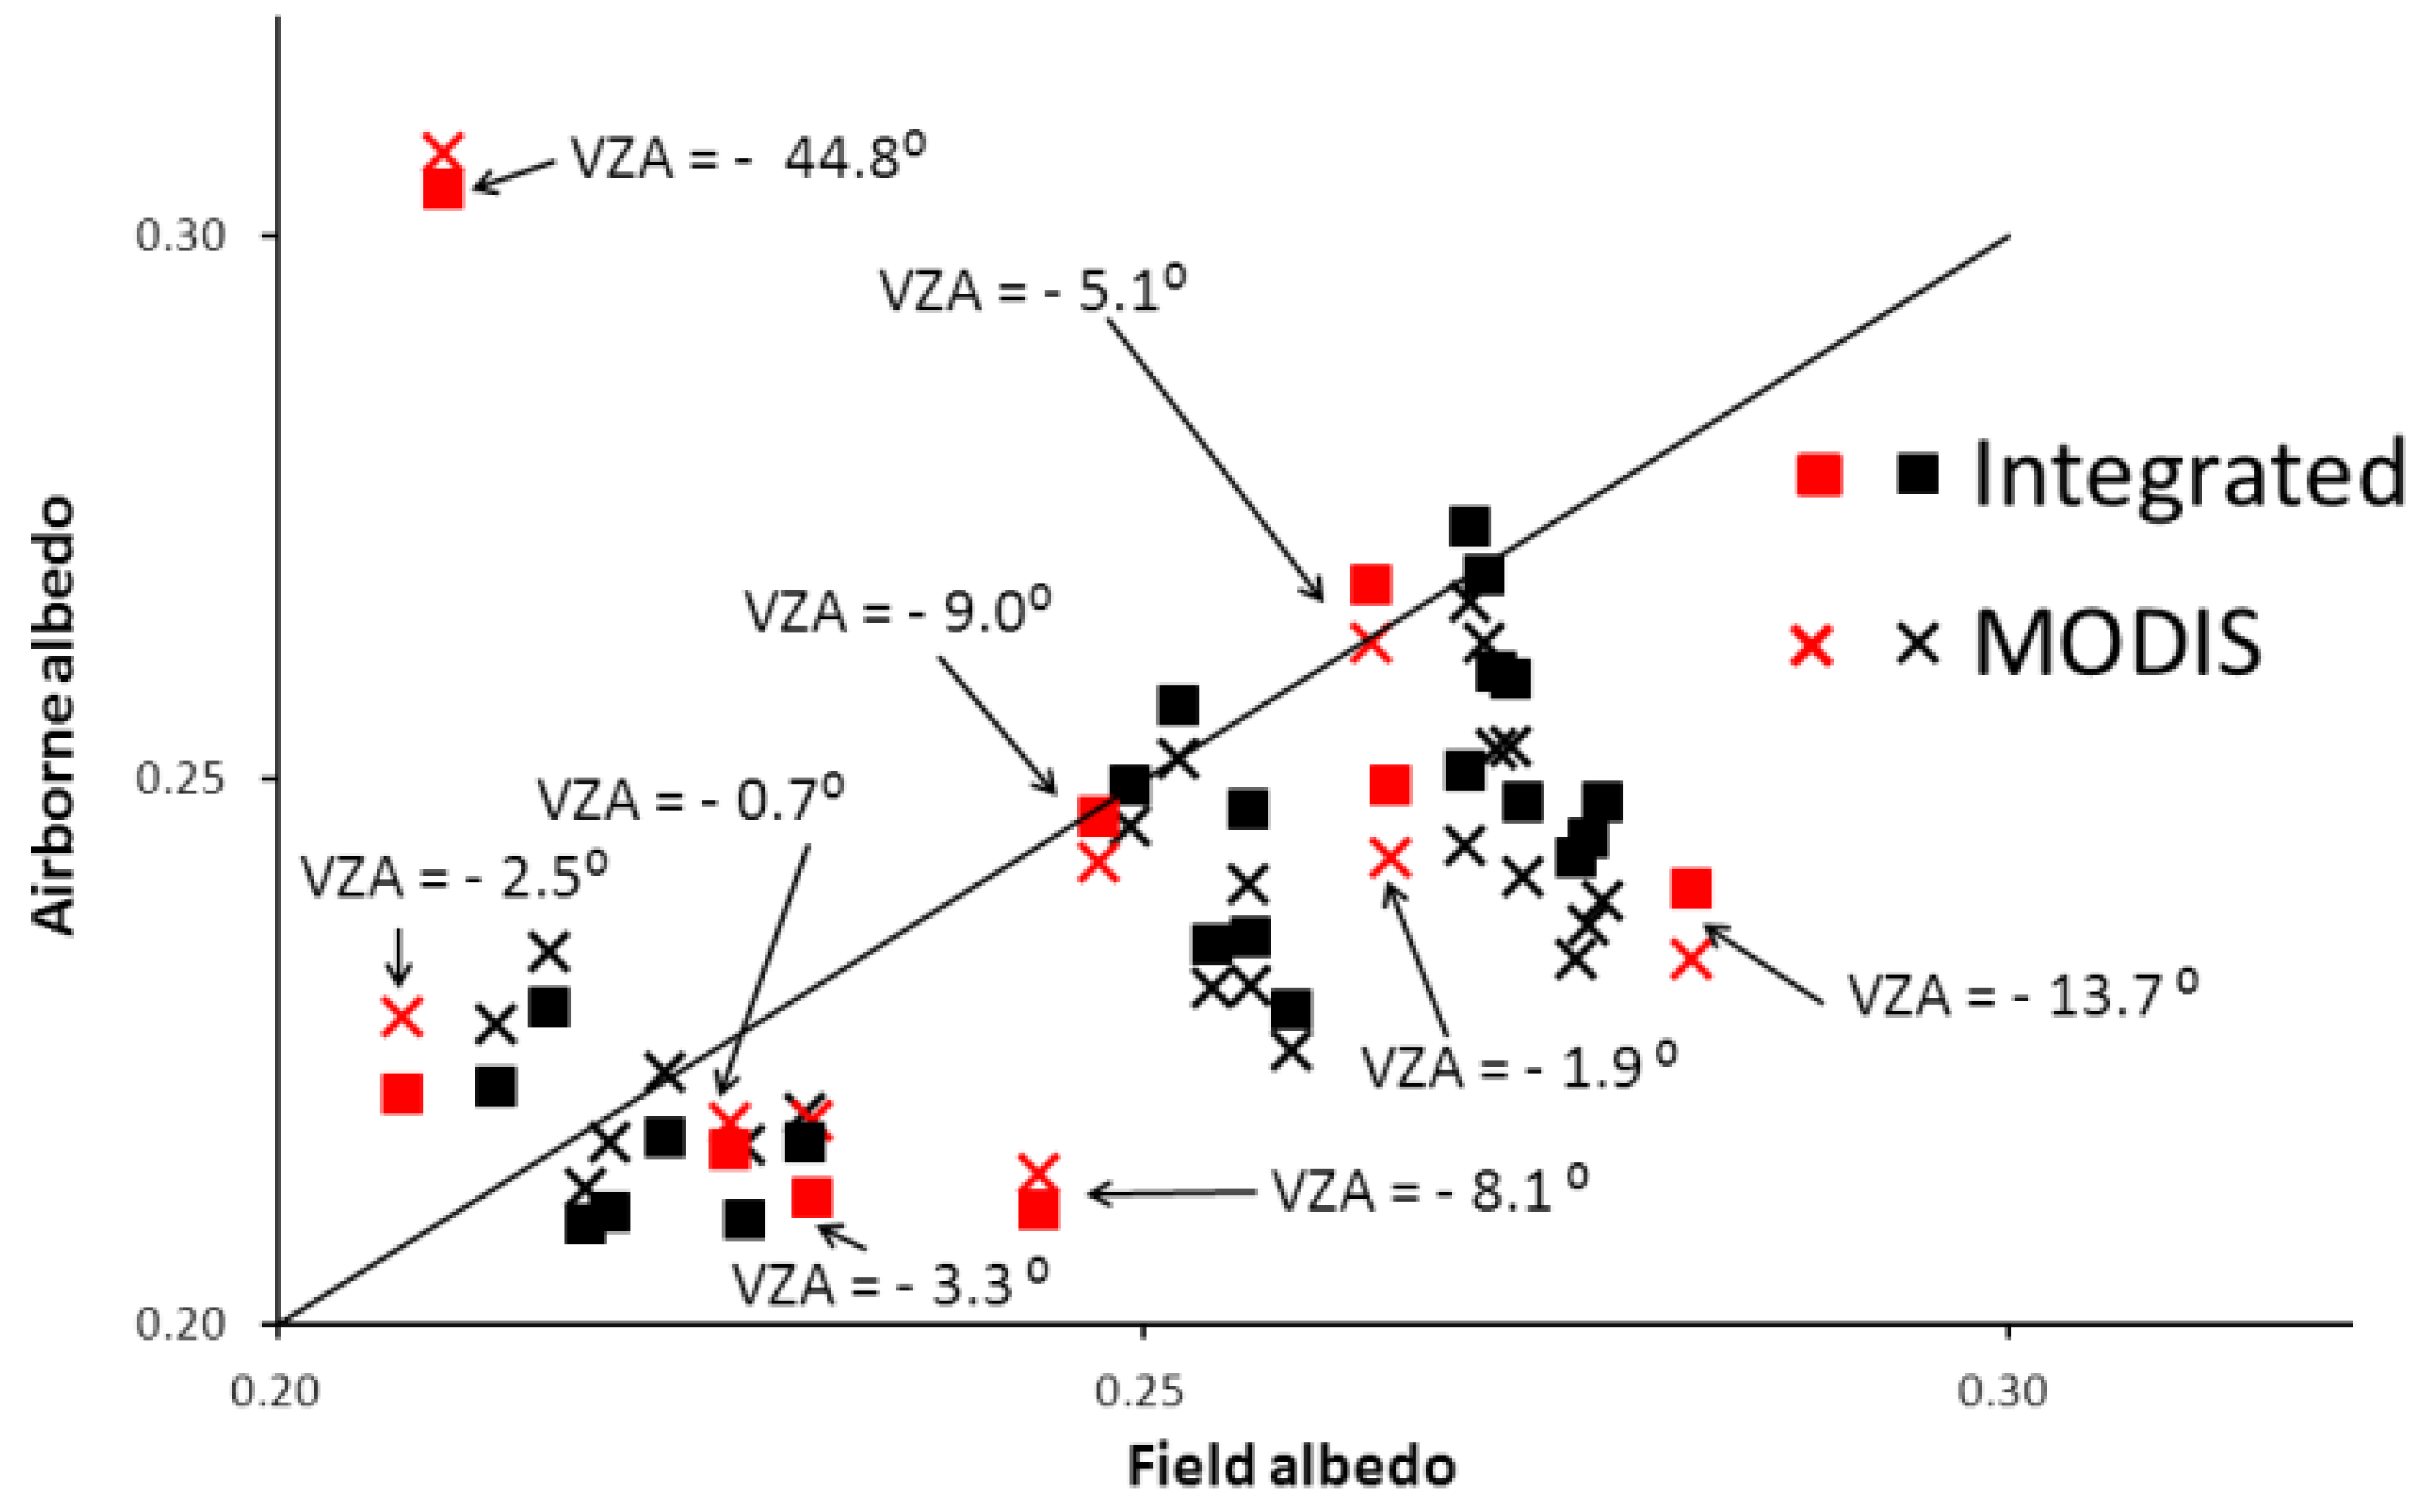
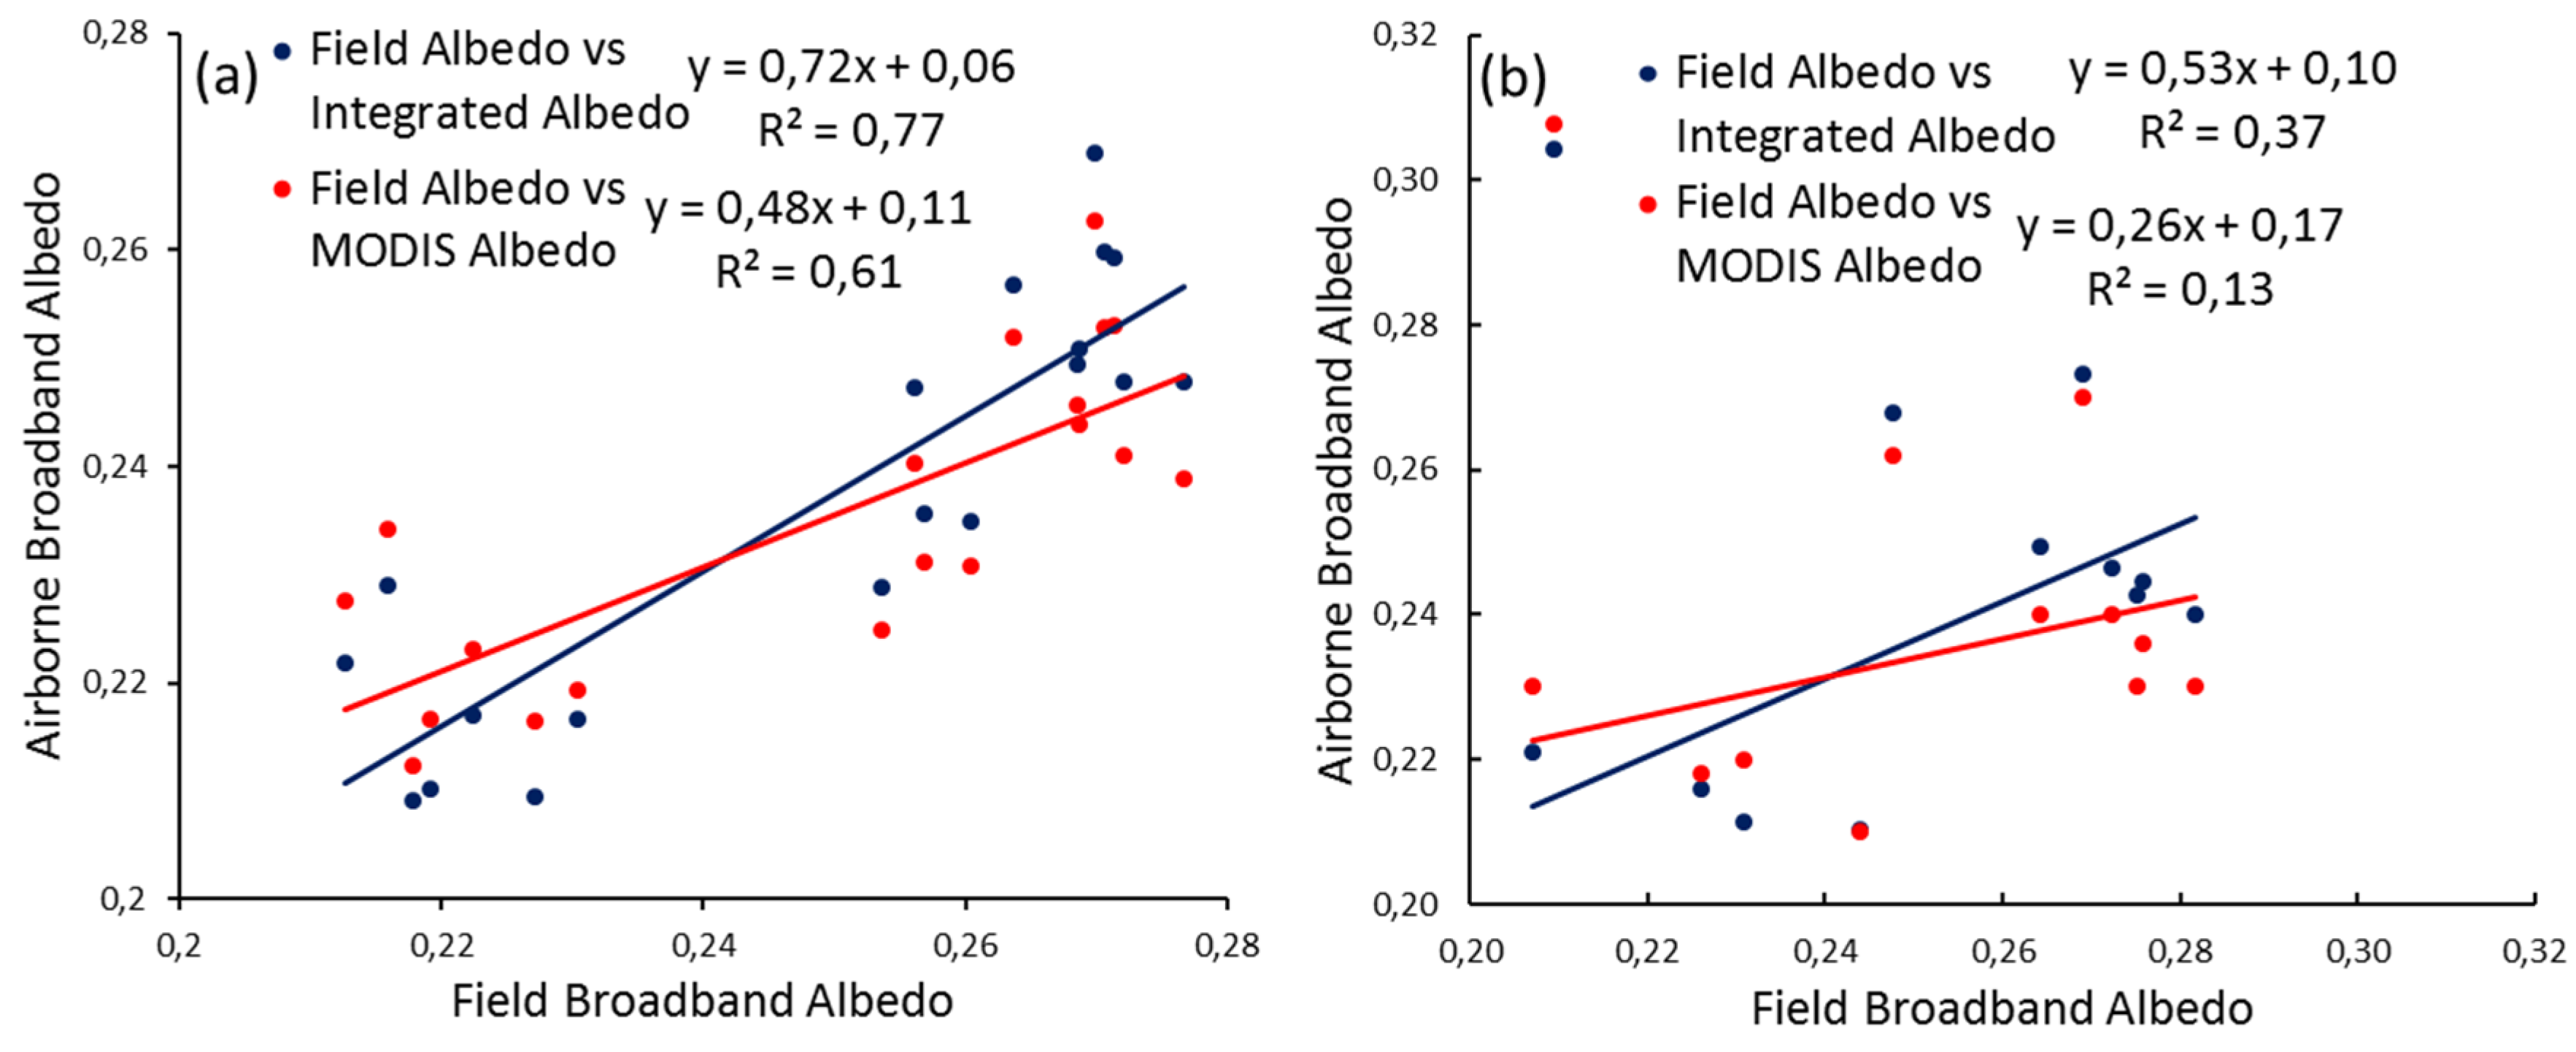
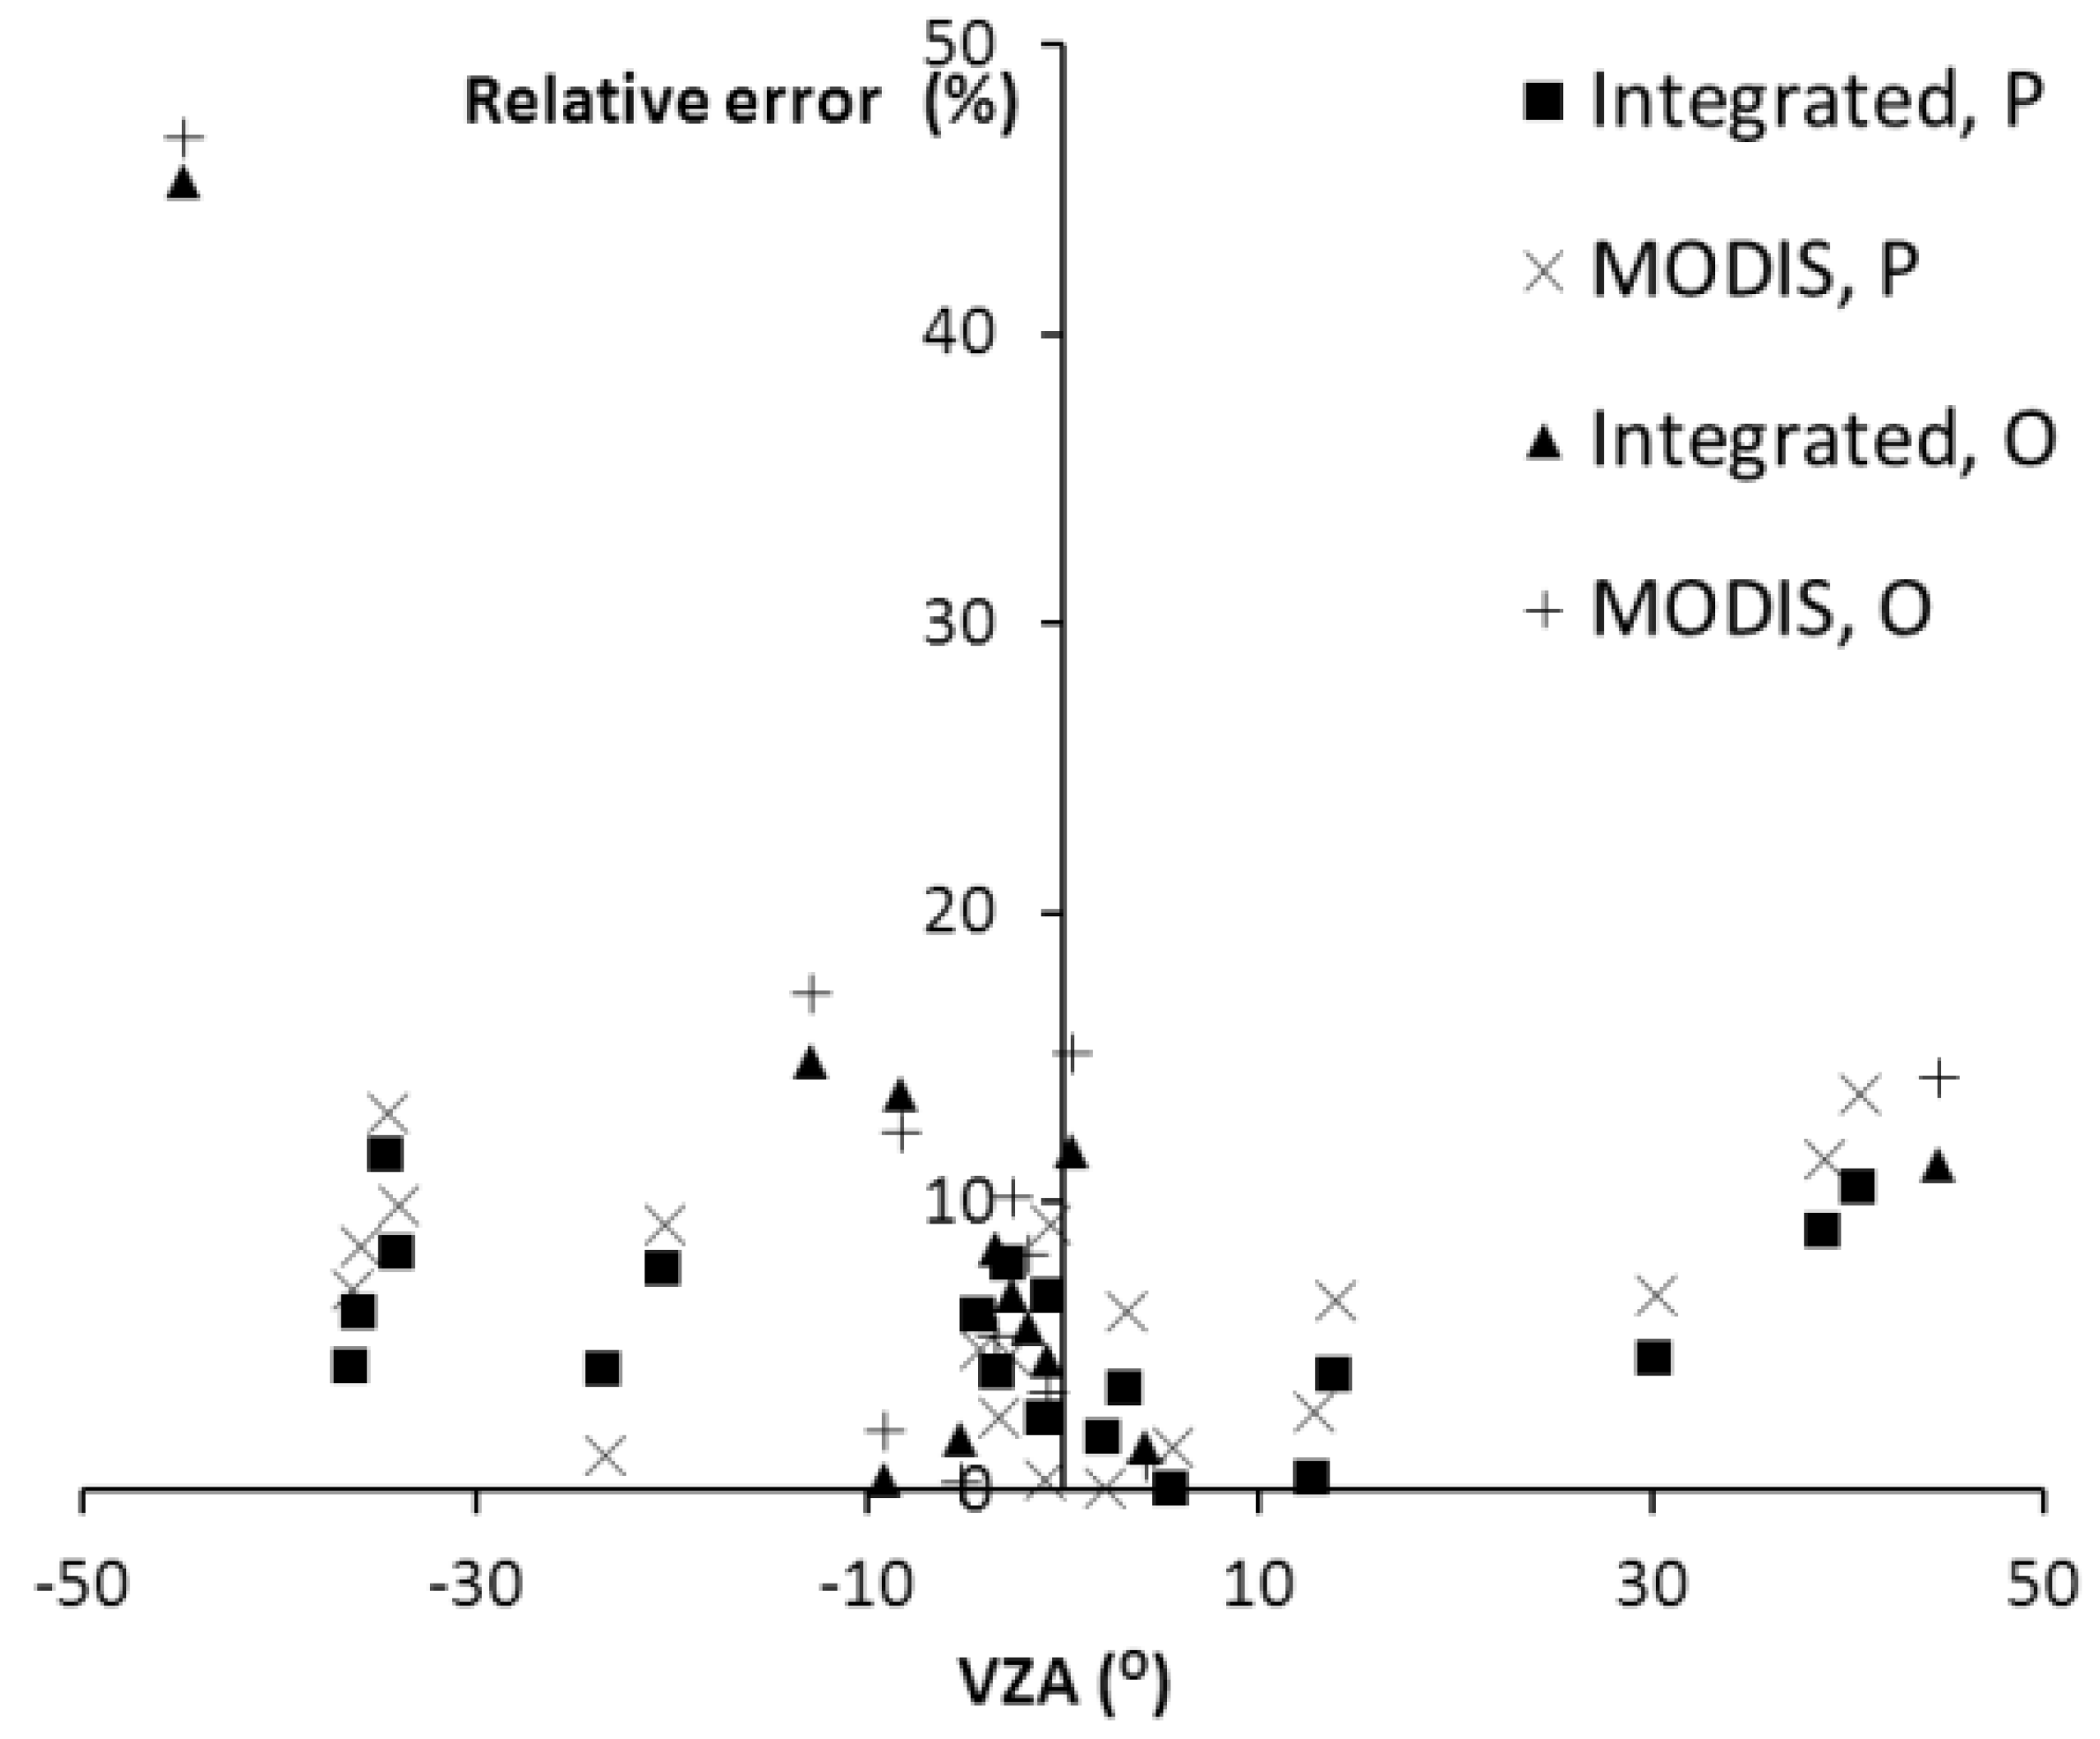
| 25 July 2012 | 26 July 2012 | ||||||
|---|---|---|---|---|---|---|---|
| Time (UTC) | Altitude (m) | PS (m) | Flight Line | Time (UTC) | Altitude (m) | PS (m) | Flight Line |
| 8:43 | 1000 | 3 | O | 8:43 | 1000 | 3 | O |
| 8:51 | 1000 | 3 | P | 9:09 | 2000 | 5 | P |
| 9:02 | 2000 | 5 | P | 9:19 | 2000 | 5 | O |
| 9:10 | 2000 | 5 | P | 9:27 | 2000 | 5 | O |
| 9:19 | 2000 | 5 | P | 9:40 | 1000 | 3 | P |
| 9:28 | 2000 | 5 | P | ||||
| 9:38 | 2000 | 5 | O | ||||
| 9:46 | 2000 | 5 | O | ||||
| Camelina Field | Green Grass | Vineyard | ||||
|---|---|---|---|---|---|---|
| a | d | a | d | a | d | |
| 25 July 2012 morning | 0.280 | 0.079 | 0.263 | 0.852 | 0.305 | 0.646 |
| 25 July 2012 afternoon | 0.286 | 0.095 | 0.246 | 0.638 | 0.225 | 0.045 |
| 26 July 2012 morning | 0.286 | 0.081 | 0.283 | 1.131 | 0.318 | 0.762 |
| 26 July 2012 afternoon | 0.287 | 0.082 | - | - | 0.226 | 0.042 |
| 25 July 2012 | 26 July 2012 | ||||||
|---|---|---|---|---|---|---|---|
| Albedo | |||||||
| Time (UTC) | Camelina | Green Grass | Vineyard | Time (UTC) | Camelina | Green Grass | Vineyard |
| 8:43 | 0.2739 | 0.2308 | 0.2724 | 8:43 | 0.2793 | 0.2439 | 0.2818 |
| 8:51 | 0.2731 | 0.2271 | 0.2686 | 9:09 | 0.2767 | 0.2305 | 0.2687 |
| 9:02 | 0.2721 | 0.2224 | 0.2637 | 9:19 | 0.2758 | 0.2261 | 0.2643 |
| 9:10 | 0.2714 | 0.2192 | 0.2604 | 9:27 | 0.2751 | 0.2228 | 0.2611 |
| 9:19 | 0.2706 | 0.2159 | 0.2569 | 9:40 | 0.2741 | 0.2179 | 0.2562 |
| 9:28 | 0.2698 | 0.2127 | 0.2536 | ||||
| 9:38 | 0.2691 | 0.2095 | 0.2502 | ||||
| 9:46 | 0.2685 | 0.2071 | 0.2477 | ||||
| C | λ (nm) | Δλ (nm) | ωc | c | λ (nm) | Δλ (nm) | ωc | c | λ (nm) | Δλ (nm) | ωc |
|---|---|---|---|---|---|---|---|---|---|---|---|
| 1 | 443 | 28 | 0.100242 | 22 | 1924 | 13 | 0.000334 | 42 | 2242 | 13 | 0.001423 |
| 2 | 471 | 28 | 0.044019 | 22 * | 1924 | 13 | 0. | 43 | 2266 | 13 | 0.001316 |
| 3 | 500 | 28 | 0.047204 | 23 | 1940 | 13 | 0.000066 | 43 * | 2266 | 13 | 0.001854 |
| 4 | 530 | 28 | 0.049027 | 23 * | 1940 | 13 | 0. | 44 | 2281 | 13 | 0.001059 |
| 5 | 560 | 28 | 0.045990 | 24 | 1957 | 13 | 0.000239 | 44 * | 2281 | 13 | 0. |
| 6 | 591 | 28 | 0.045939 | 24 * | 1957 | 13 | 0.000336 | 45 | 2296 | 13 | 0.000916 |
| 7 | 620 | 28 | 0.045241 | 25 | 1973 | 13 | 0.000890 | 45 * | 2296 | 13 | 0.001869 |
| 8 | 650 | 28 | 0.042322 | 26 | 1989 | 13 | 0.001025 | 46 | 2311 | 13 | 0.000840 |
| 9 | 679 | 28 | 0.042243 | 27 | 2006 | 13 | 0.000522 | 46 * | 2311 | 13 | 0. |
| 10 | 709 | 28 | 0.036630 | 28 | 2022 | 13 | 0.000874 | 47 | 2326 | 13 | 0.000831 |
| 11 | 738 | 28 | 0.035416 | 29 | 2038 | 13 | 0.001432 | 47 * | 2326 | 13 | 0.001239 |
| 12 | 767 | 28 | 0.033026 | 30 | 2054 | 13 | 0.001118 | 48 | 2341 | 13 | 0.000739 |
| 13 | 796 | 28 | 0.033552 | 31 | 2071 | 13 | 0.001168 | 49 | 2355 | 13 | 0.000666 |
| 14 | 826 | 28 | 0.027413 | 32 | 2086 | 13 | 0.001456 | 50 | 2370 | 13 | 0.000547 |
| 15 | 856 | 28 | 0.031069 | 33 | 2102 | 13 | 0.00150 | 51 | 2385 | 13 | 0.000462 |
| 16 | 885 | 28 | 0.027597 | 34 | 2118 | 13 | 0.001482 | 52 | 2399 | 13 | 0.000509 |
| 17 | 914 | 28 | 0.019751 | 35 | 2134 | 13 | 0.001499 | 53 | 2413 | 13 | 0.000345 |
| 18 | 943 | 28 | 0.009165 | 36 | 2150 | 13 | 0.001417 | 54 | 2428 | 13 | 0.000394 |
| 19 | 973 | 28 | 0.016382 | 37 | 2165 | 13 | 0.001250 | 55 | 2442 | 13 | 0.000290 |
| 20 | 1001 | 28 | 0.165395 | 38 | 2181 | 13 | 0.001302 | 56 | 2456 | 13 | 0.000245 |
| 21 | 1590 | 159 | 0.070316 | 39 | 2196 | 13 | 0.001170 | 57 | 2471 | 13 | 0.000182 |
| 21 * | 1590 | 159 | 0.070619 | 40 | 2212 | 13 | 0.001193 | 58 | 2484 | 13 | 0.000061 |
| 41 | 2227 | 13 | 0.001269 | 59 | 2499 | 13 | 0.000020 |
| Camelina Field | Green Grass | Vineyard | ||||
|---|---|---|---|---|---|---|
| Date | Integrated | MODIS | Integrated | MODIS | Integrated | MODIS |
| 25 July 2012 | 0.013 | 0.018 | 0.013 (0.03) | 0.013 (0.04) | 0.016 | 0.018 |
| 26 July 2012 | 0.018 | 0.02 | 0.009 | 0.008 | 0.012 | 0.015 |
| RMSE | |||
|---|---|---|---|
| Flights Parallel to the SPP | Flights Orthogonal to the SPP | ||
| Integrated Albedo | MODIS Albedo | Integrated Albedo | MODIS Albedo |
| 0.009 | 0.011 | 0.017 (0.03) | 0.03 (0.04) |
© 2016 by the authors; licensee MDPI, Basel, Switzerland. This article is an open access article distributed under the terms and conditions of the Creative Commons by Attribution (CC-BY) license (http://creativecommons.org/licenses/by/4.0/).
Share and Cite
Calleja, J.F.; Recondo, C.; Peón, J.; Fernández, S.; De la Cruz, F.; González-Piqueras, J. A New Method for the Estimation of Broadband Apparent Albedo Using Hyperspectral Airborne Hemispherical Directional Reflectance Factor Values. Remote Sens. 2016, 8, 183. https://doi.org/10.3390/rs8030183
Calleja JF, Recondo C, Peón J, Fernández S, De la Cruz F, González-Piqueras J. A New Method for the Estimation of Broadband Apparent Albedo Using Hyperspectral Airborne Hemispherical Directional Reflectance Factor Values. Remote Sensing. 2016; 8(3):183. https://doi.org/10.3390/rs8030183
Chicago/Turabian StyleCalleja, Javier F., Carmen Recondo, Juanjo Peón, Susana Fernández, Fernando De la Cruz, and José González-Piqueras. 2016. "A New Method for the Estimation of Broadband Apparent Albedo Using Hyperspectral Airborne Hemispherical Directional Reflectance Factor Values" Remote Sensing 8, no. 3: 183. https://doi.org/10.3390/rs8030183
APA StyleCalleja, J. F., Recondo, C., Peón, J., Fernández, S., De la Cruz, F., & González-Piqueras, J. (2016). A New Method for the Estimation of Broadband Apparent Albedo Using Hyperspectral Airborne Hemispherical Directional Reflectance Factor Values. Remote Sensing, 8(3), 183. https://doi.org/10.3390/rs8030183


