Article

GPD+ Wet Tropospheric Corrections for CryoSat-2 and GFO Altimetry Missions

by
M. Joana Fernandes
1,2,* and
Clara Lázaro
1,2
1
Faculdade de Ciências, Universidade do Porto, Porto 4169-007, Portugal
2
Centro Interdisciplinar de Investigação Marinha e Ambiental (CIIMAR/CIMAR), Universidade do Porto, Porto 4050-123, Portugal
*
Author to whom correspondence should be addressed.
Remote Sens. 2016, 8(10), 851; https://doi.org/10.3390/rs8100851
Submission received: 31 August 2016 / Revised: 28 September 2016 / Accepted: 11 October 2016 / Published: 16 October 2016

Abstract

:
Due to its large space-time variability, the wet tropospheric correction (WTC) is still considered a significant error source in satellite altimetry. This paper presents the GNSS (Global Navigation Satellite Systems) derived Path Delay Plus (GPD+), the most recent algorithm developed at the University of Porto to retrieve improved WTC for radar altimeter missions. The GPD+ are WTC estimated by space-time objective analysis, by combining all available observations in the vicinity of the point: valid measurements from the on-board microwave radiometer (MWR), from GNSS coastal and island stations and from scanning imaging MWR on board various remote sensing missions. The GPD+ corrections are available both for missions which do not possess an on-board microwave radiometer such as CryoSat-2 (CS-2) and for all missions which carry this sensor, by addressing the various error sources inherent to the MWR-derived WTC. To ensure long-term stability of the corrections, the large set of radiometers used in this study have been calibrated with respect to the Special Sensor Microwave Imager (SSM/I) and the SSM/I Sounder (SSM/IS). The application of the algorithm to CS-2 and Geosat Follow-on (GFO), as representative altimetric missions without and with a MWR aboard the respective spacecraft, is described. Results show that, for both missions, the new WTC significantly reduces the sea level anomaly (SLA) variance with respect to the model-based corrections. For GFO, the new WTC also leads to a large reduction in SLA variance with respect to the MWR-derived WTC, recovering a large number of observations in the coastal and polar regions and full sets of tracks and several cycles when MWR measurements are missing or invalid. Overall, the algorithm allows the recovery of a significant number of measurements, ensuring the continuity and consistency of the correction in the open-ocean/coastal transition zone and at high latitudes.

Graphical Abstract

1. Introduction

Due to its all-weather, day and night measurement capability, satellite radar altimetry plays a major role in the study of, e.g., ocean circulation and sea level change at global and regional scales. At present, the nearly 24-year altimetric record is long enough, e.g., to characterise the long-term sea level variability at inter-annual time scales.
The retrieval of altimeter sea surface heights (SSH) above a reference ellipsoid with centimetric accuracy requires the knowledge of all terms involved in the altimeter measurement system with the same level of accuracy [1]: satellite orbit from precise orbit determination (POD); altimeter range between the satellite and the sea surface corrected for instrumental effects, from appropriate tracking of the radar echo; all required range and geophysical corrections. The range corrections account for the impacts of the troposphere (dry and wet components), the ionosphere and the sea state (sea state bias) on the radar signal. The geophysical corrections account for geophysical phenomena which must be removed from the measurements to separate them from the signals of interest: dynamic atmospheric correction and tides (solid earth, ocean, load and pole tides). An evaluation of the most recent altimetry corrections on the quality of the sea level record, performed in the framework of the Sea Level Climate Change Initiative (SL_cci) project, can be found in [2]. Amid these corrections, the path delay induced by the presence of water vapour and liquid water in the troposphere, or wet tropospheric correction (WTC), is still a significant error source. With an absolute value less than 50 cm, it has a large spatio-temporal variability, making its accurate modelling a difficult task.
In spite of the continuous progress in the modelling of this effect by means of numerical weather models (NWM) (e.g., [3,4]), the accuracy of present NWM-derived WTC is still not good enough for most altimetry applications such as sea level variation or small scale ocean circulation. Indeed, an accurate enough modelling of this effect can only be achieved through actual observations of the atmospheric water vapour content at the time and location of the altimetric measurements. For this purpose, dedicated near-nadir looking, single measurement, multi-frequency microwave radiometers have been incorporated in the radar altimeter missions launched after the 1990s.
Primarily designed to measure and monitor the changing thickness of ice in polar regions, CryoSat-2 (CS-2) does not carry an on-board MWR, being the baseline wet tropospheric correction applied to the radar altimeter data a model-based one, provided by the European Centre for Medium-Range Weather Forecasts (ECMWF) Operational model. The loss of Envisat in April 2012 increased the interest on CS-2 data for applications beyond the primary objectives of the mission, including studies over oceans and inland waters. The more stringent accuracy requirements imposed by studies such as global-scale ocean and coastal studies, drove a need to develop an improved wet tropospheric correction for CS-2, e.g., [5].
In the last years, the University of Porto (UPorto) have been developing methods for improving the WTC retrieval, not only for missions which do not possess an on-board microwave radiometer such as CryoSat-2, but also for all missions with on-board MWR, by addressing the various error sources inherent to the MWR-derived WTC present in these products, namely the land, ice and rain contamination in the MWR measurements. The methods developed at UPorto are based on data combination through space-time objective analysis (OA) of various wet path delay sources, including WTC from Global Navigation Satellite Systems (GNSS), from MWR and, more recently, from scanning imaging MWR (SI-MWR) on-board various remote sensing missions.
The GNSS-derived Path Delay (GPD) algorithm was first developed in the scope of the European Space Agency (ESA) project COASTALT (Development of radar altimetry data processing in the oceanic coastal zone) [6], and applied, just as a coastal algorithm, in the SW European region for the whole Envisat data, aiming at removing the land effects in the MWR-derived WTC [7]. The GPD WTCs are optimal estimates using valid on-board MWR observations and GNSS-derived WTC from coastal and island stations.
The method was later extended, in the scope of the SL_cci project [2,8] to the global data sets of the reference (TOPEX/Poseidon, Jason-1, Jason-2) and ESA (ERS-1, ERS-2, Envisat) missions [9]. In parallel, methods for improving the WTC for missions such as CryoSat-2, by exploiting data from SI-MWR have been developed by [10] and [11], the latter in the scope of the CryoSat Plus for Oceans (CP4O) project [5].
This paper presents the most recent version of the GPD algorithm, designated GPD Plus (GPD+) and its application to CryoSat-2 and Geosat Follow-on (GFO) as representative examples of altimetric missions without and with an on-board MWR, respectively. Compared to previous versions the main features of the GPD+ WTC are: (i) incorporation of additional datasets from a set of 19 SI-MWR; (ii) inter-calibration of all radiometers with respect to the Special Sensor Microwave Imager (SSM/I) and SSMI/I Sounder (SSM/IS) on board the Defense Meteorological Satellite Program (DMSP) satellite series as reference; (iii) improved criteria for detecting valid/invalid MWR values.
Section 2 presents the GPD+ algorithm, including the respective OA Implementation, datasets used and sensor calibration. Section 3 describes the implementation of GPD+ for CryoSat-2 and GFO. Finally, Section 4 summarizes the main achievements and conclusions of this study.

2. The GPD+ Algorithm

2.1. OA Implementation

The core of the GPD+ algorithm is based on a linear space-time objective analysis (OA) technique [12]. The statistical technique interpolates the wet path delay values at each altimeter ground-track point with invalid MWR measurements from the nearby (in space and time) observations. It updates a first guess value known a priori at each location and epoch and provides a quantification of the mapping error associated with each estimate.
Hence, the GPD+ are wet path delays based on: (i) WTC from the on-board MWR measurements whenever they exist and are valid; (ii) new WTC values estimated by data combination of all available observations in the vicinity of the estimation point, whenever the previous are considered invalid.
The underlying method, firstly developed for coastal altimetry, has been described in [7,9]. Here only the main features are described, with emphasis on the new features introduced in the most recent implementation. Further details of the OA method can be found in [12].
The estimate of the WTC field at each along-track point P, F(P), is given by a “first guess”, FG(P), plus a weighted average of the set of N WTC anomalies X i a n o , i = 1 , , N , Equation (1), obtained by subtracting FG from the N WTC observations X i , Equation (2), within given space and time search radiuses around point P:
F ( P ) = F G ( P ) + i = 1 N W i   X i a n o
X i a n o = X i F G ( P )
The weights W i are estimated from the statistical properties of the WTC field, Equation (3):
W i = k = 1 N C k   A i k 1
where C k is the covariance between the estimation point P and the nearby measurement point k, k = 1, …, N, and A i k 1 is the inverse of the variance-covariance matrix of the WTC observations. Each covariance is normalized by dividing by the variance of the WTC field at the estimation point P, so that correlations instead of covariances are used.
In practice, the covariance between each pair of points separated by a distance r and time difference   Δ t is computed from a correlation function. Consequently, the spatial and temporal variability of the WTC field is taken into account by the correlation function. In the absence of the knowledge of an empirical covariance model of the background field, the correlation function F(r,Δt) can take the form of a product of two stationary Gaussian decays [13,14], i.e.,
F ( r , Δ t ) = F r ( r ) × F Δ t ( Δ t ) = e ( r D ) 2 × e ( Δ t T ) 2
where r is the distance and Δt is the time interval between acquisition of each pair of points, and D and T are the spatial and temporal correlation scales, respectively.
In the sequel, the implementation of the method requires the knowledge of the following quantities:
  • First guess of WTC;
  • Variance of the WTC field;
  • White noise associated with each WTC data set (required to compute the diagonal elements of the variance-covariance matrix A i k );
  • Parameters defining the correlation function: space and time correlation scales;
  • Space and time search radii.
For the first guess, WTC derived from a numerical weather model are adopted, being also the estimated values in the absence of observations. At present, the best NWM for estimating the WTC are the ECMWF Operational model [3] or the ECMWF ReAnalysis (ERA) Interim model [4], provided as global grids at 0.125° × 0.125° (or better) and 0.75° × 0.75° spatial sampling, respectively, and 6-h intervals. The first model is not uniform, having undergone several updates. For this reason, ERA Interim is the best model for the whole altimeter era, while ECMWF Operational is the most accurate model after 2004 [15,16]. In the sequel, in the estimation of the first guess, ERA Interim is used for GFO while for CryoSat-2 the ECMWF Operational model is adopted.
The variance of the WTC field was estimated from a 2-year dataset of the ECMWF Operational model (2013–2014) at 0.125° × 0.125° and 6-h intervals.
For the white noise associated to each data type, the value of 0.5 cm was adopted for both GNSS and MWR [7,9]. The white noise associated to each SI-MWR was computed based on the standard deviation of the differences between each sensor and the values of the MWR on board the reference altimetric missions (TOPEX/Poseidon, Jason-1, Jason-2) at matching points. These values are in the range of 0.8 cm (for Windsat, AMSR-E, AMSR-2 and GMI) to 1.1 cm (for NOAA-15 and MetOp-B), c.f. Section 2.3.
The space correlation scales were determined from a set of ECMWF Operational model grids at 0.125° × 0.125°, well distributed over the year 2013. The computations were performed for a grid of points centred on 2° × 2° “boxes”. For each of these central points, analyses were made on boxes of 2° × ∆λ°, where ∆λ = min (2°/ cos φ , 2°), where φ and λ stand for latitude and longitude, respectively. This warrants that all analyses are made on boxes of approximately the same size. For each box, the correlation between all pairs of points separated by a distance R, for classes of R spaced by 10 km, were determined. The set (R, corr(R)) forms the correlation table for each box. The corresponding correlation scale D is obtained by either fitting a Gaussian function to the correlation table or by computing the value of R corresponding to a correlation equal to 1/e. Both approaches give similar results and the resulting spatial correlation scales are within 40 to 93 km (Figure 1). For the temporal correlation scales the value of 100 min quoted by [17] was adopted.
The data used for each WTC estimation are the WTC values from all data sets within the spatial and temporal influence regions, centred at the location and instant of the altimeter measurement at which the estimation is required; those ranges should equal the spatial and temporal correlation scales. However, since the period of most SI-MWR missions is in the range 100–105 min, the temporal influence region has been enlarged to 110 min for the SI-MWR dataset.
For algorithm efficiency, a maximum number of 15 observations of each type (GNSS, MWR and SI-MWR) were used, those with the largest statistical weights, according to their distance and time difference with respect to the point for which the correction is being estimated.

2.2. Dataset Description

The GPD algorithm was designed to compute the WTC at ocean measurements. Initially, the computation was restricted to coastal areas, where a set of GNSS inland stations can be found. In the present implementation, an estimate is obtained either: (i) for every ocean point along the altimeter ground track for which the WTC computed from MWR measurements has been considered invalid (in the case of satellites with an on-board MWR, such as GFO); or (ii) for all points, for satellites which do not carry any on-board MWR (such as CryoSat-2). In this way, the algorithm can be applied to any altimeter mission.
In the estimation of the new WTC values the following data types are used:
  • valid WTC observations from the on-board MWR, when available as for GFO;
  • zenith wet delays (ZWD), WTC equivalent, from GNSS;
  • WTC derived from scanning imaging microwave radiometers.

2.2.1. WTC from on-Board MWR

In this study, in addition to the data from CryoSat-2 and GFO, altimeter and MWR data from the three satellite altimetry reference missions (TOPEX/Poseidon, Jason-1 and Jason-2) have been used in the inter-calibration procedure of all radiometers involved in the GPD+ estimations. All altimeter data used in this study, in the validation tasks presented in section 3, have been extracted from the Radar Altimeter Database System (RADS) [18].
The baseline MWR datasets used in this study for the various missions are as follows:
  • GFO—Water Vapour Radiometer (WVR) dataset, available in RADS, the most recent version of this product [18];
  • TOPEX/Poseidon—Topex Microwave Radiometer (TMR) replacement product [19] available in RADS;
  • Jason-1—Jason-1 Microwave Radiometer (JMR) product present in the recently released Geophysical Data Records Version E (GDR-E) available from the Physical Oceanography Distributive Active Archive Center (PODAAC), enhanced near the coast [20];
  • Jason-2—Advanced Microwave Radiometer (AMR) GDR-D product, already enhanced near the coast, available in RADS [20].
For altimetric missions carrying a microwave radiometer, the WTC derived from this sensor constitutes the baseline information for the GPD+ algorithm. Whenever an MWR-derived WTC is considered valid, the algorithm adopts the respective values, while a new estimate is obtained for each invalid point.
The criteria for discriminating valid/invalid measurements play a major role in algorithm performance. The validity of an MWR measurement is set by an MWR rejection flag (flag_MWR_rej) according to the following criteria:
  • flag_MWR_rej = 1—if the rad_surf_type flag is 1, usually related with land contamination, but also with instrument problems;
  • flag_MWR_rej = 2—if the measurement was acquired at a distance from the coast less than a given threshold, e.g., 30 km for GFO and TOPEX/Poseidon; 20 km for Jason-1 and 15 km for Jason-2;
  • flag_MWR_rej = 3—if the ice_flag is 1, indicating ice contamination. More generally, an invalid point located in the latitude bands |ϕ| > 45° may be flagged as ice even if this is not the actual cause of invalidity;
  • flag_MWR_rej = 4—based on statistical parameters, including median filters, function of the differences between MWR and model WTC, not only at the same measurements but also at neighbouring points (related with ice, land, rain or outlier detection);
  • flag_MWR_rej = 5—if the MWR WTC is ≥0.0 m or <−0.5 m, usually associated with rain or ice contamination, or instrument failure.
An observation may be invalid due to more than one cause. For example, it may be located near the coast, contaminated by ice and outside limits. In this case, the algorithm attributes to the point the first cause of invalidity, according to the order by which the criteria are applied: (i) radiometer land flag; (ii) ice flag; (iii) noise or outside limits; (iv) distance from coast less than a given threshold. The reason for applying the “distance from coast” at the end is to be able to test different thresholds and assess the actual land impact in each satellite.
Wet path delays from valid MWR measurements at the nearby locations around the point of estimation are selected. Due to the time difference between adjacent satellite tracks, in practice only points from a single track are used, the track to which the point of estimation belongs.

2.2.2. GNSS-Derived WTC

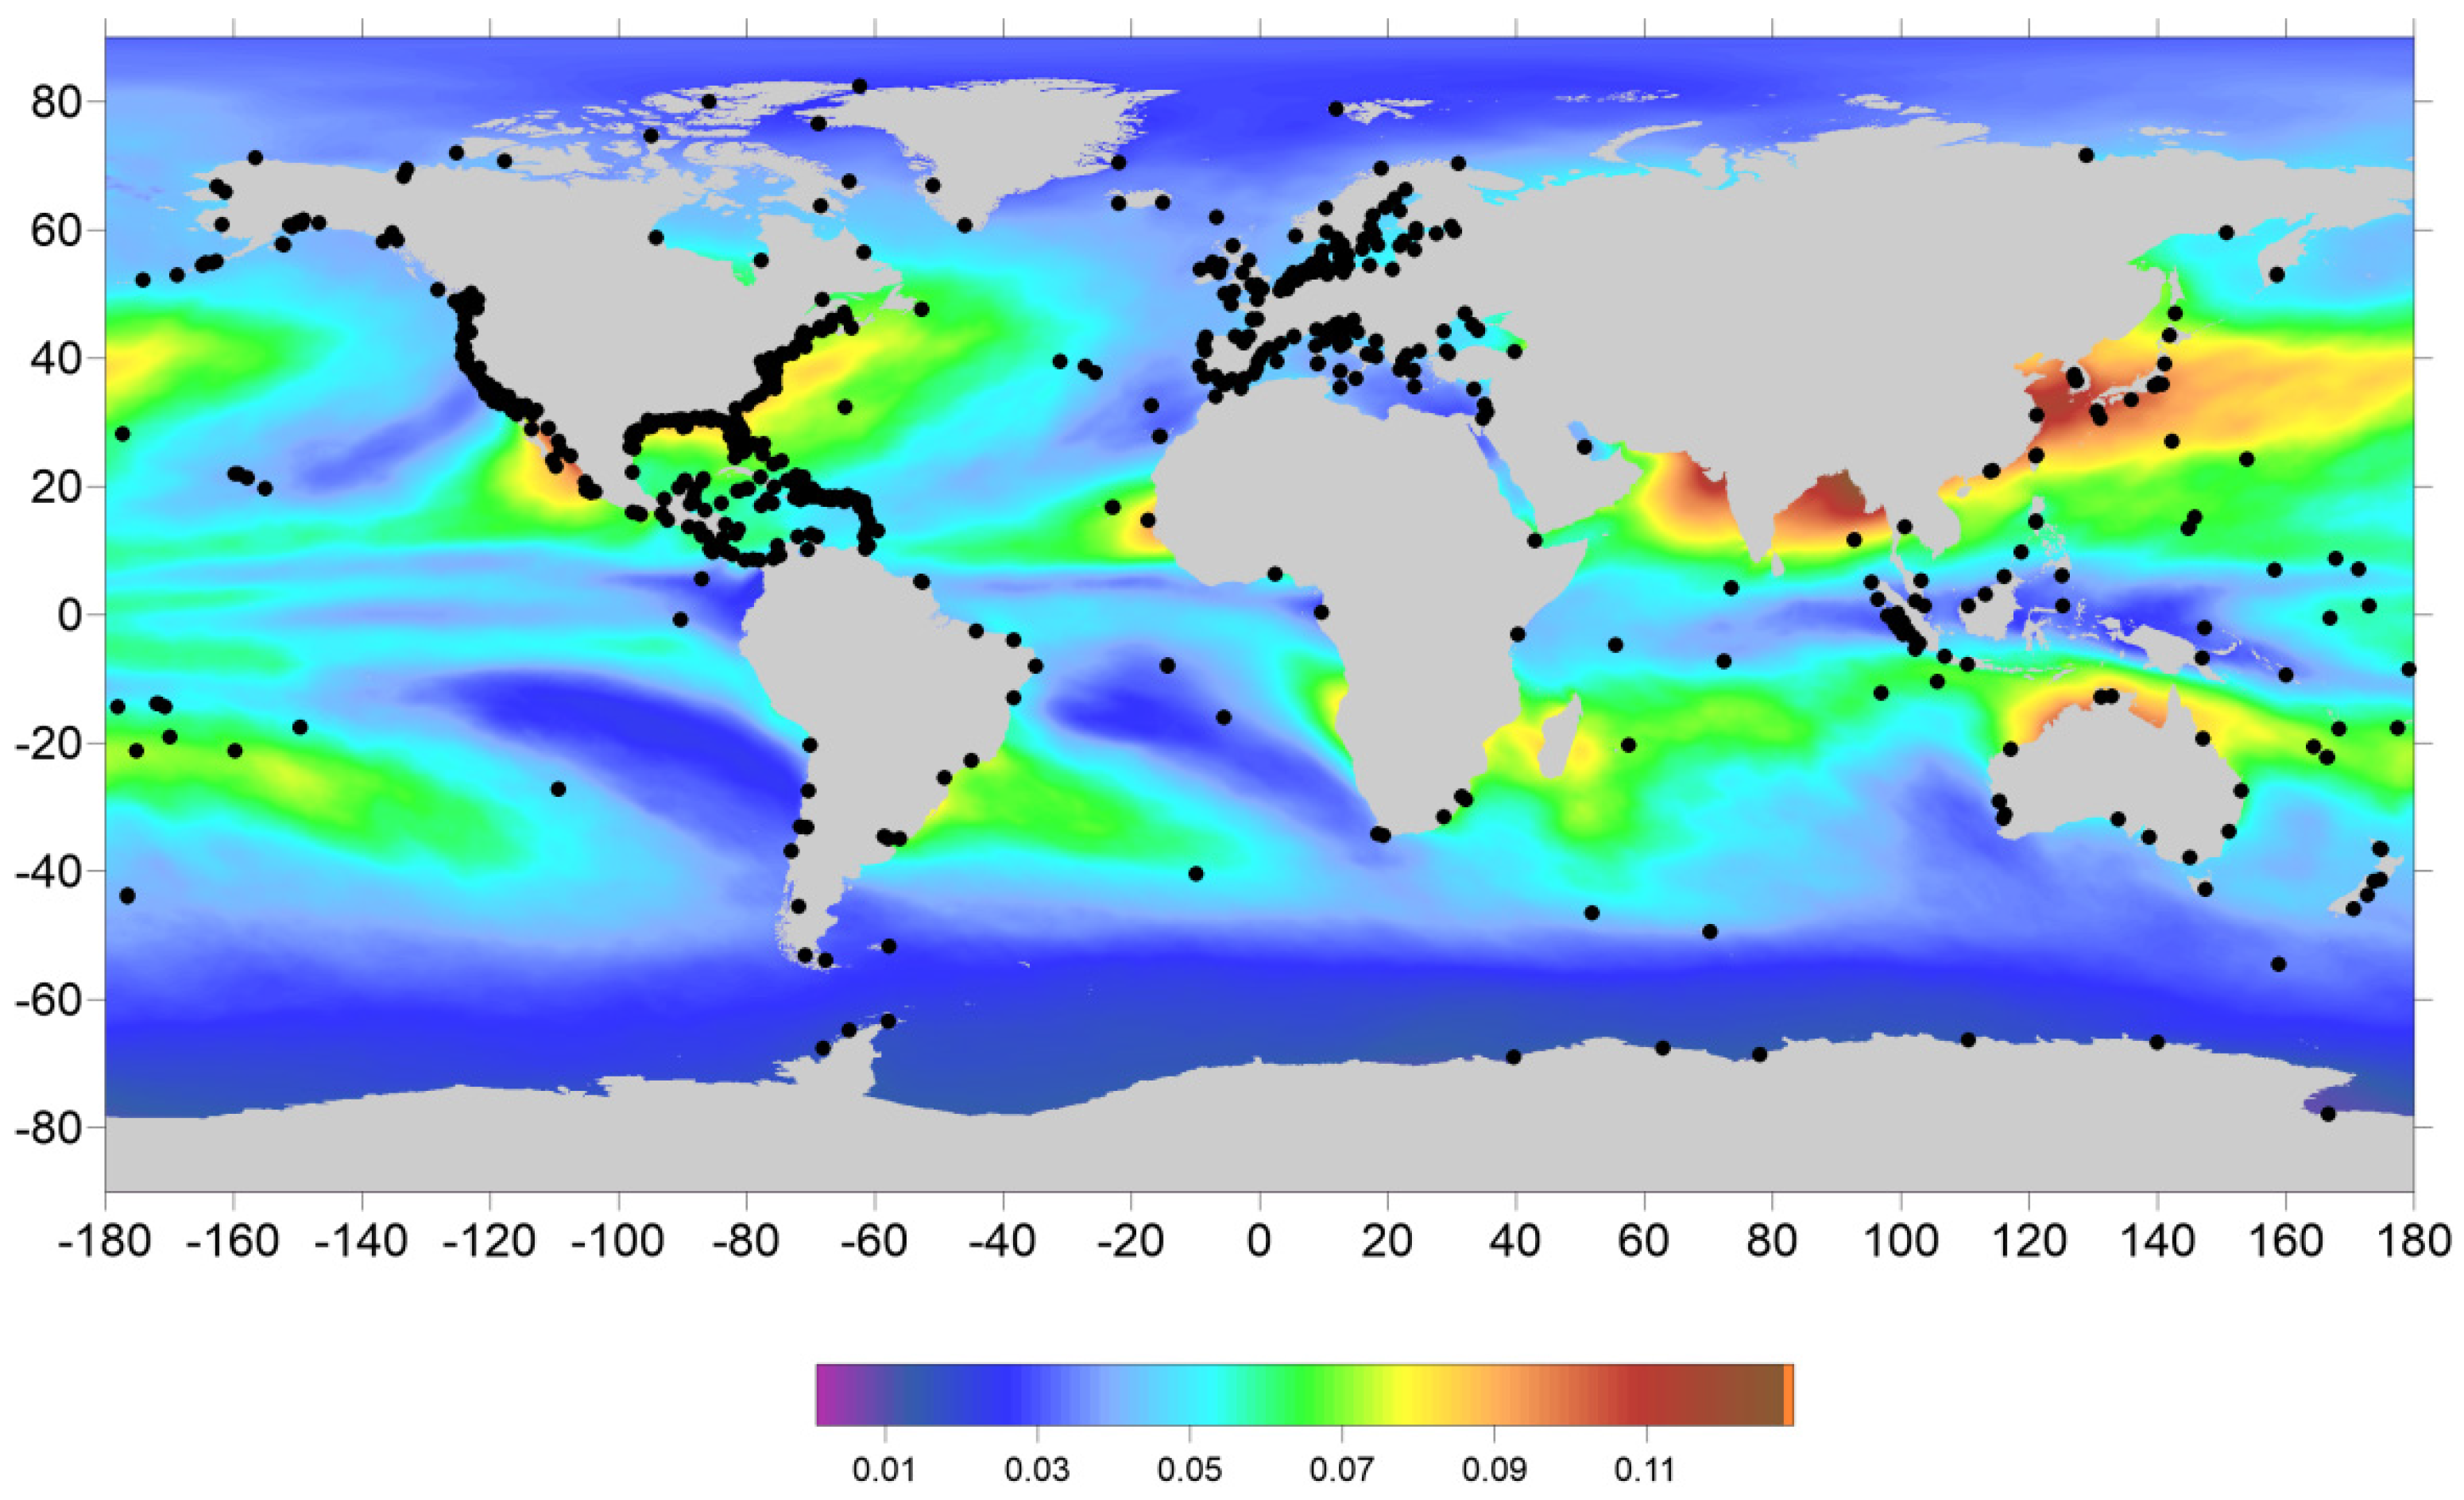
GNSS data from more than 800 stations have been used (Figure 2). These include zenith total delays (ZTD) computed at UPorto and ZTDs available online at a set of stations from IGS (International GNSS Service), EPN (EUREF Permanent Network), SuomiNet and from the German Bight provided by the Technische Universität Darmstadt in the scope of the SL_cci project. Only stations up to 100 km from the coast and with an orthometric height < 1000 m were considered. The first condition aims at selecting only coastal stations; the second is due to the fact that the expression for the height dependence of the WTC by [21], used to reduce the ZWD from station height to sea level, is valid only up to 1000 m.
The quantity estimated at each GNSS station is the total tropospheric correction at station level. The quantity used in coastal altimetry is the ZWD at sea level. The latter is obtained from the ZTD at station level by computing the dry correction or zenith hydrostatic delay (ZHD) from the ERA Interim Sea Level Pressure (SLP) field using the Saastamoinen model [22] and reducing ZHD and ZWD fields to sea level using the procedure by [21], with the modifications introduced by [23].

2.2.3. Total Column Water Vapour (TCWV) from SI-MWR

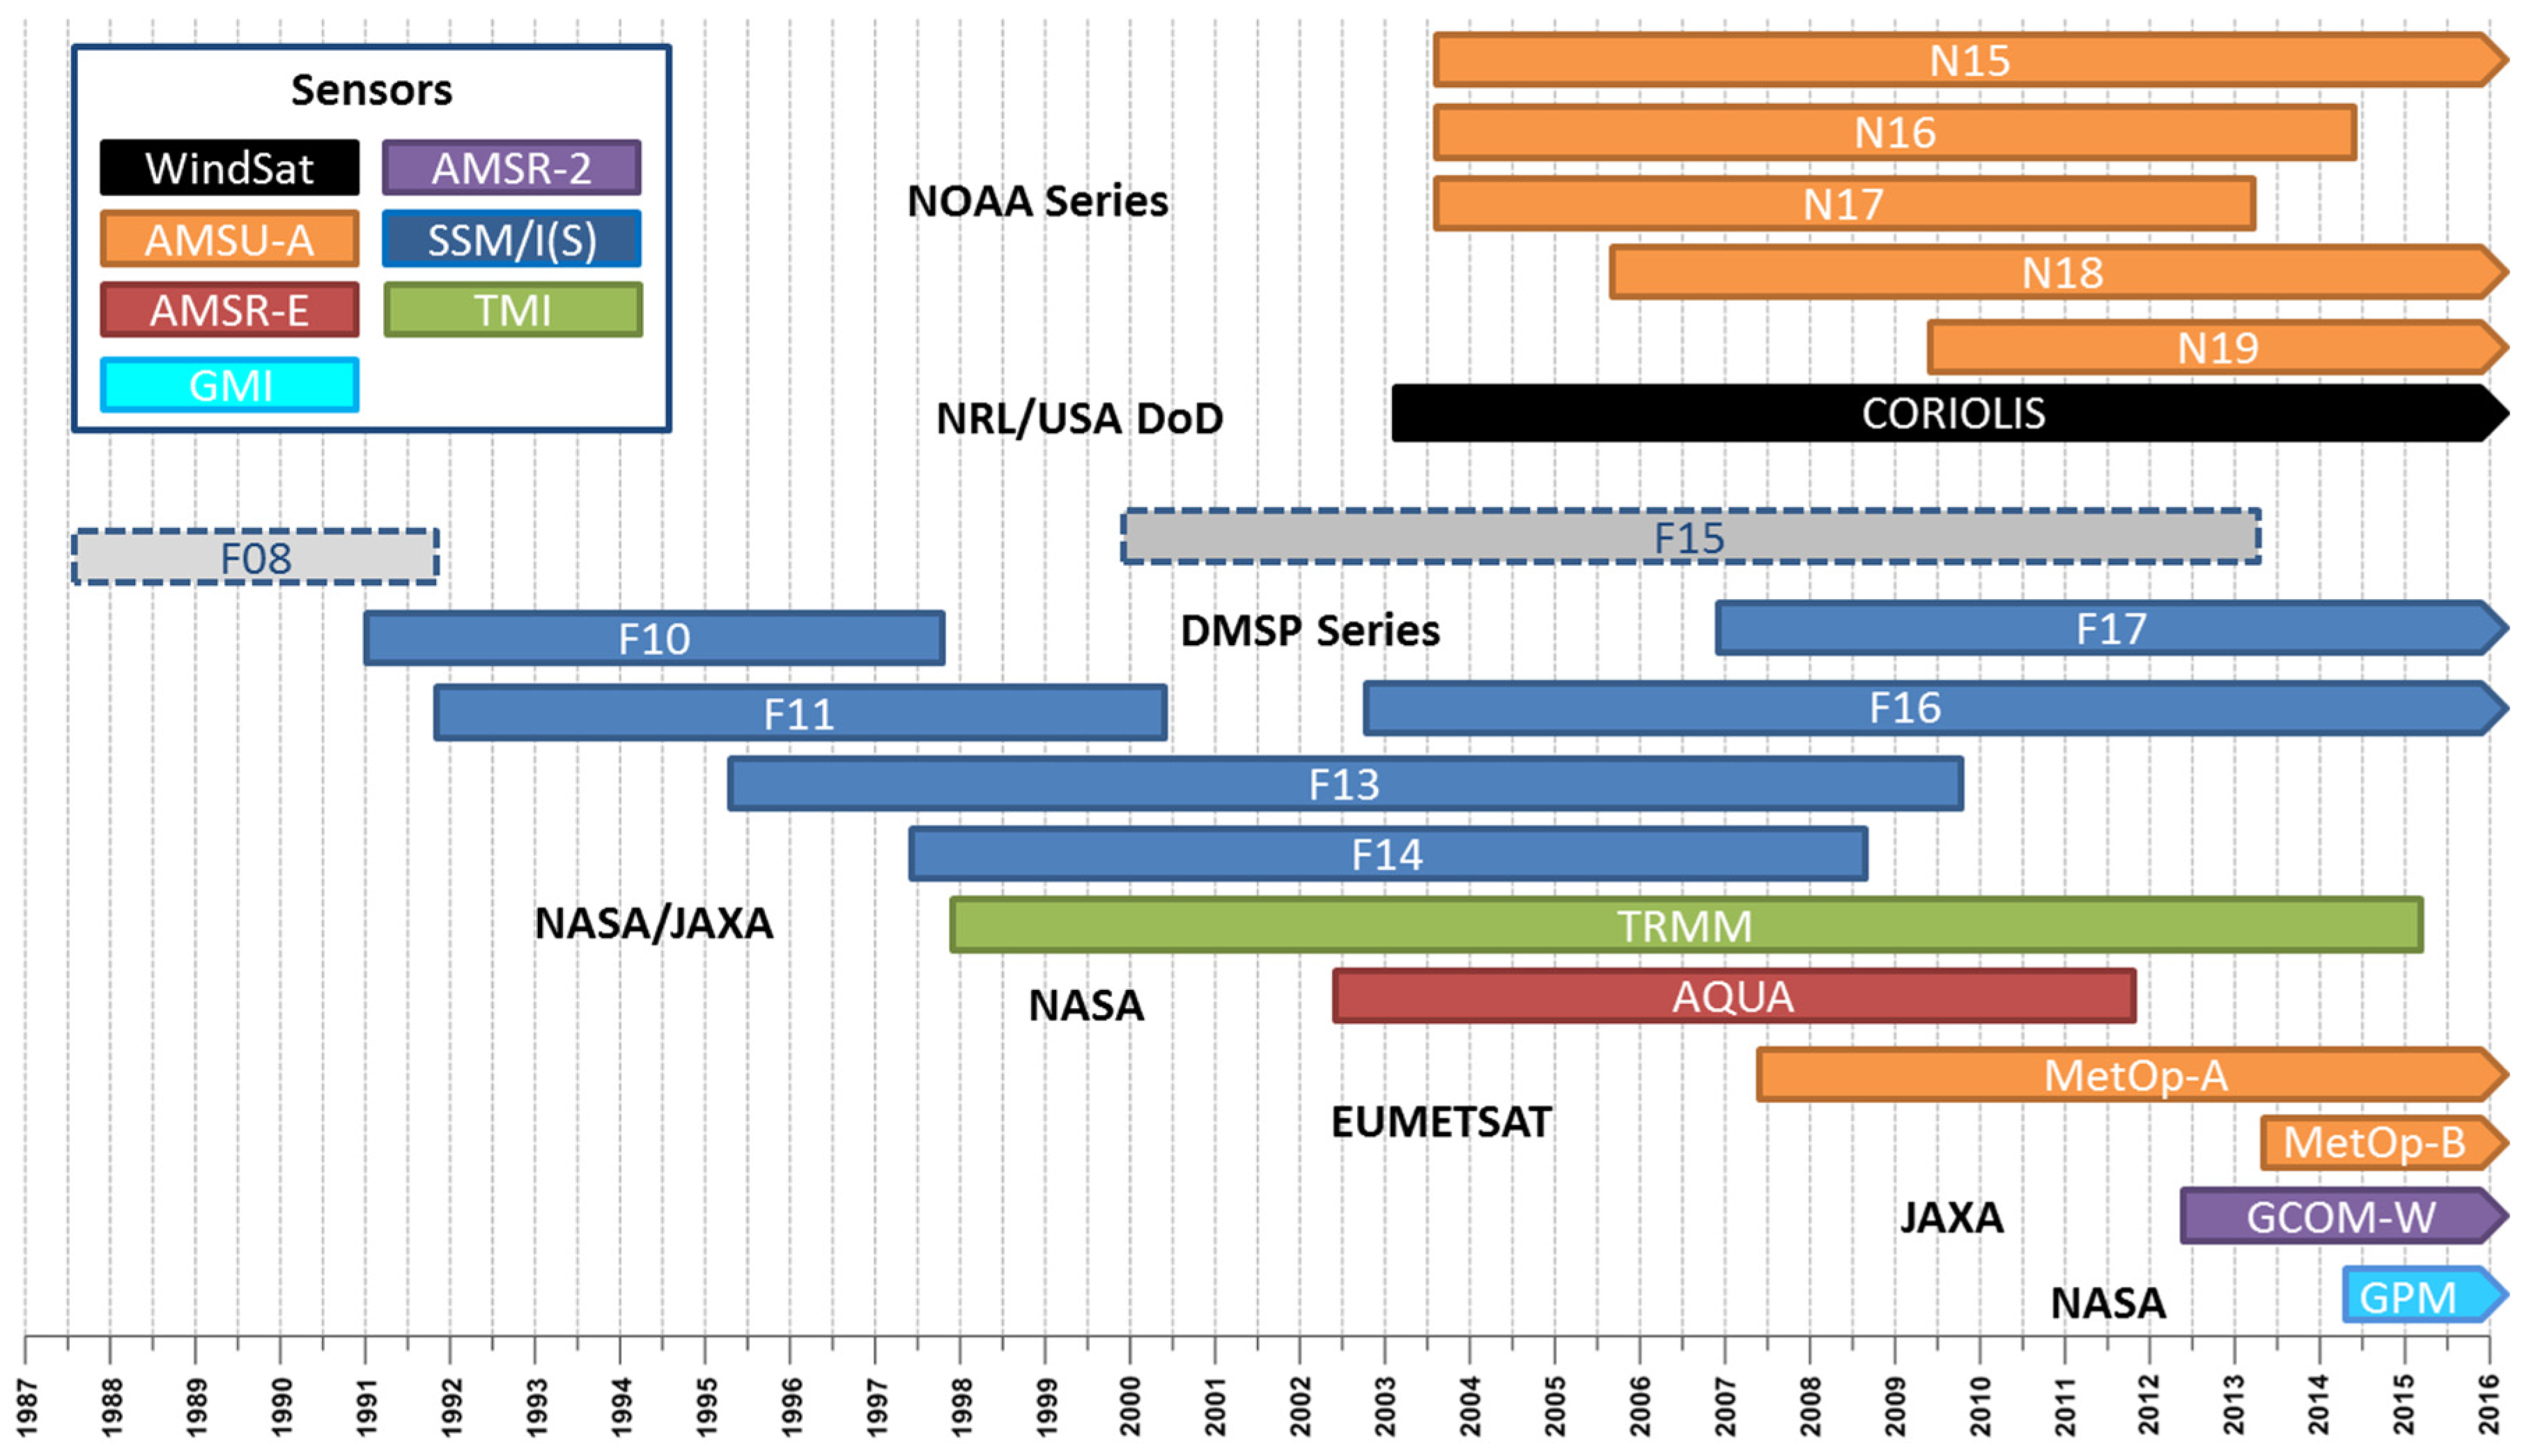
Water vapour products from a set of 19 scanning imaging radiometers on board various remote sensing satellites have been used (Figure 3), available from two main sources: NOAA Comprehensive Large Array-Data Stewardship System (CLASS) and Remote Sensing Systems (RSS). Most of these datasets have been described in [11], only the most relevant and updated information being presented here.
The main characteristics of the two datasets are (see Table 1):
  • AMSU-A Level-2 swath products are available, in HDF-EOS2 format, from NOAA CLASS [26] as Microwave Surface and Precipitation Products System (MSPPS) Orbital Global Data products (MSPPS_ORB) for NOAA-15, -16, -17, -18, -19, MetOp-A and MetOp-B.
  • Remote Sensing Systems [27] provides gridded products, in binary format, for the following sensors: AMSR-E (AQUA), AMSR-E (GCOM-W1), WindSat (Coriolis), TMI (TRMM), GMI (GPM), SSM/I (DMSP satellites F08, F10, F13, F14, F15) and SSM/IS (F16, F17). Two 0.25° × 0.25° global grids per day are provided for each sensor, one containing the ascending and the other the descending passes. According to RSS information, after August 2006, F15 products are affected by RADCAL beacon interference. For this reason and due to the instabilities shown in this study, F15 data are not being used in the WTC estimations.
As described in [11], the WTC has been computed from these TCWV products using the expression by [10], deduced from temperature and humidity profiles from ECMWF model fields:
W T C   =   ( a 0   +   a 1 W V   +   a 2 W V 2   +   a 3 W V 3 )   W V   ×   10 2
with a 0 = 6.8544, a 1 = −0.4377, a 2 = 0.0714 and a 3 = −0.0038. In Equation (5), WV is in centimetres, as provided in the TCWV products, and WTC results in metres.

2.2.4. Tropospheric Delays from the ECMWF

For deriving model-based WTC, ECMWF Operational model has been used for the most recent missions (Jason-2, CryoSat-2) while ERA Interim has been adopted for the remaining missions.
ECMWF provides global 0.125° × 0.125° (Operational model) or 0.75° × 0.75° (ERA Interim) grids of several atmospheric parameters every 6 h [3,4]. In the scope of this study, the atmospheric fields of three single-level parameters of the two aforementioned models have been used:
  • sea level pressure (SLP);
  • surface temperature (2-m temperature, 2T);
  • integrated water vapour (Total Column Water Vapour, TCWV).
These parameters are used both in the ZWD processing described above and to compute a model-derived WTC for each altimeter along-track position by space-time interpolation from the two closest grids, 6-h apart. These model-derived WTC are used as first guess in the OA estimation and as adopted GPD+ values in the absence of observations.

2.3. Sensor Calibration

For studies such as sea level variation, the long-term stability of all terms involved in the computation of the altimeter-derived sea level anomaly (SLA) is of particular relevance. The recent requirements state that these terms, including the WTC, should be known to better than 0.3 mm/year [2].
In this context, to ensure consistency and the long term stability of the WTC, the large set of radiometers used in the GPD+ estimations have been inter-calibrated, using the set of SSM/I and SSM/IS on board the DMSP satellite series (F10, F11, F13, F14, F16 and F17) as reference, due to their well-known stability and independent calibration [25]. This procedure replaces the adopted in [11], where Jason-2 had been used as reference mission for the period of CryoSat-2. The adoption of SSM/I and SSM/IS as reference ensures a consistent inter-calibration of all altimeter missions, from TOPEX/Poseidon and ERS-1 until present.
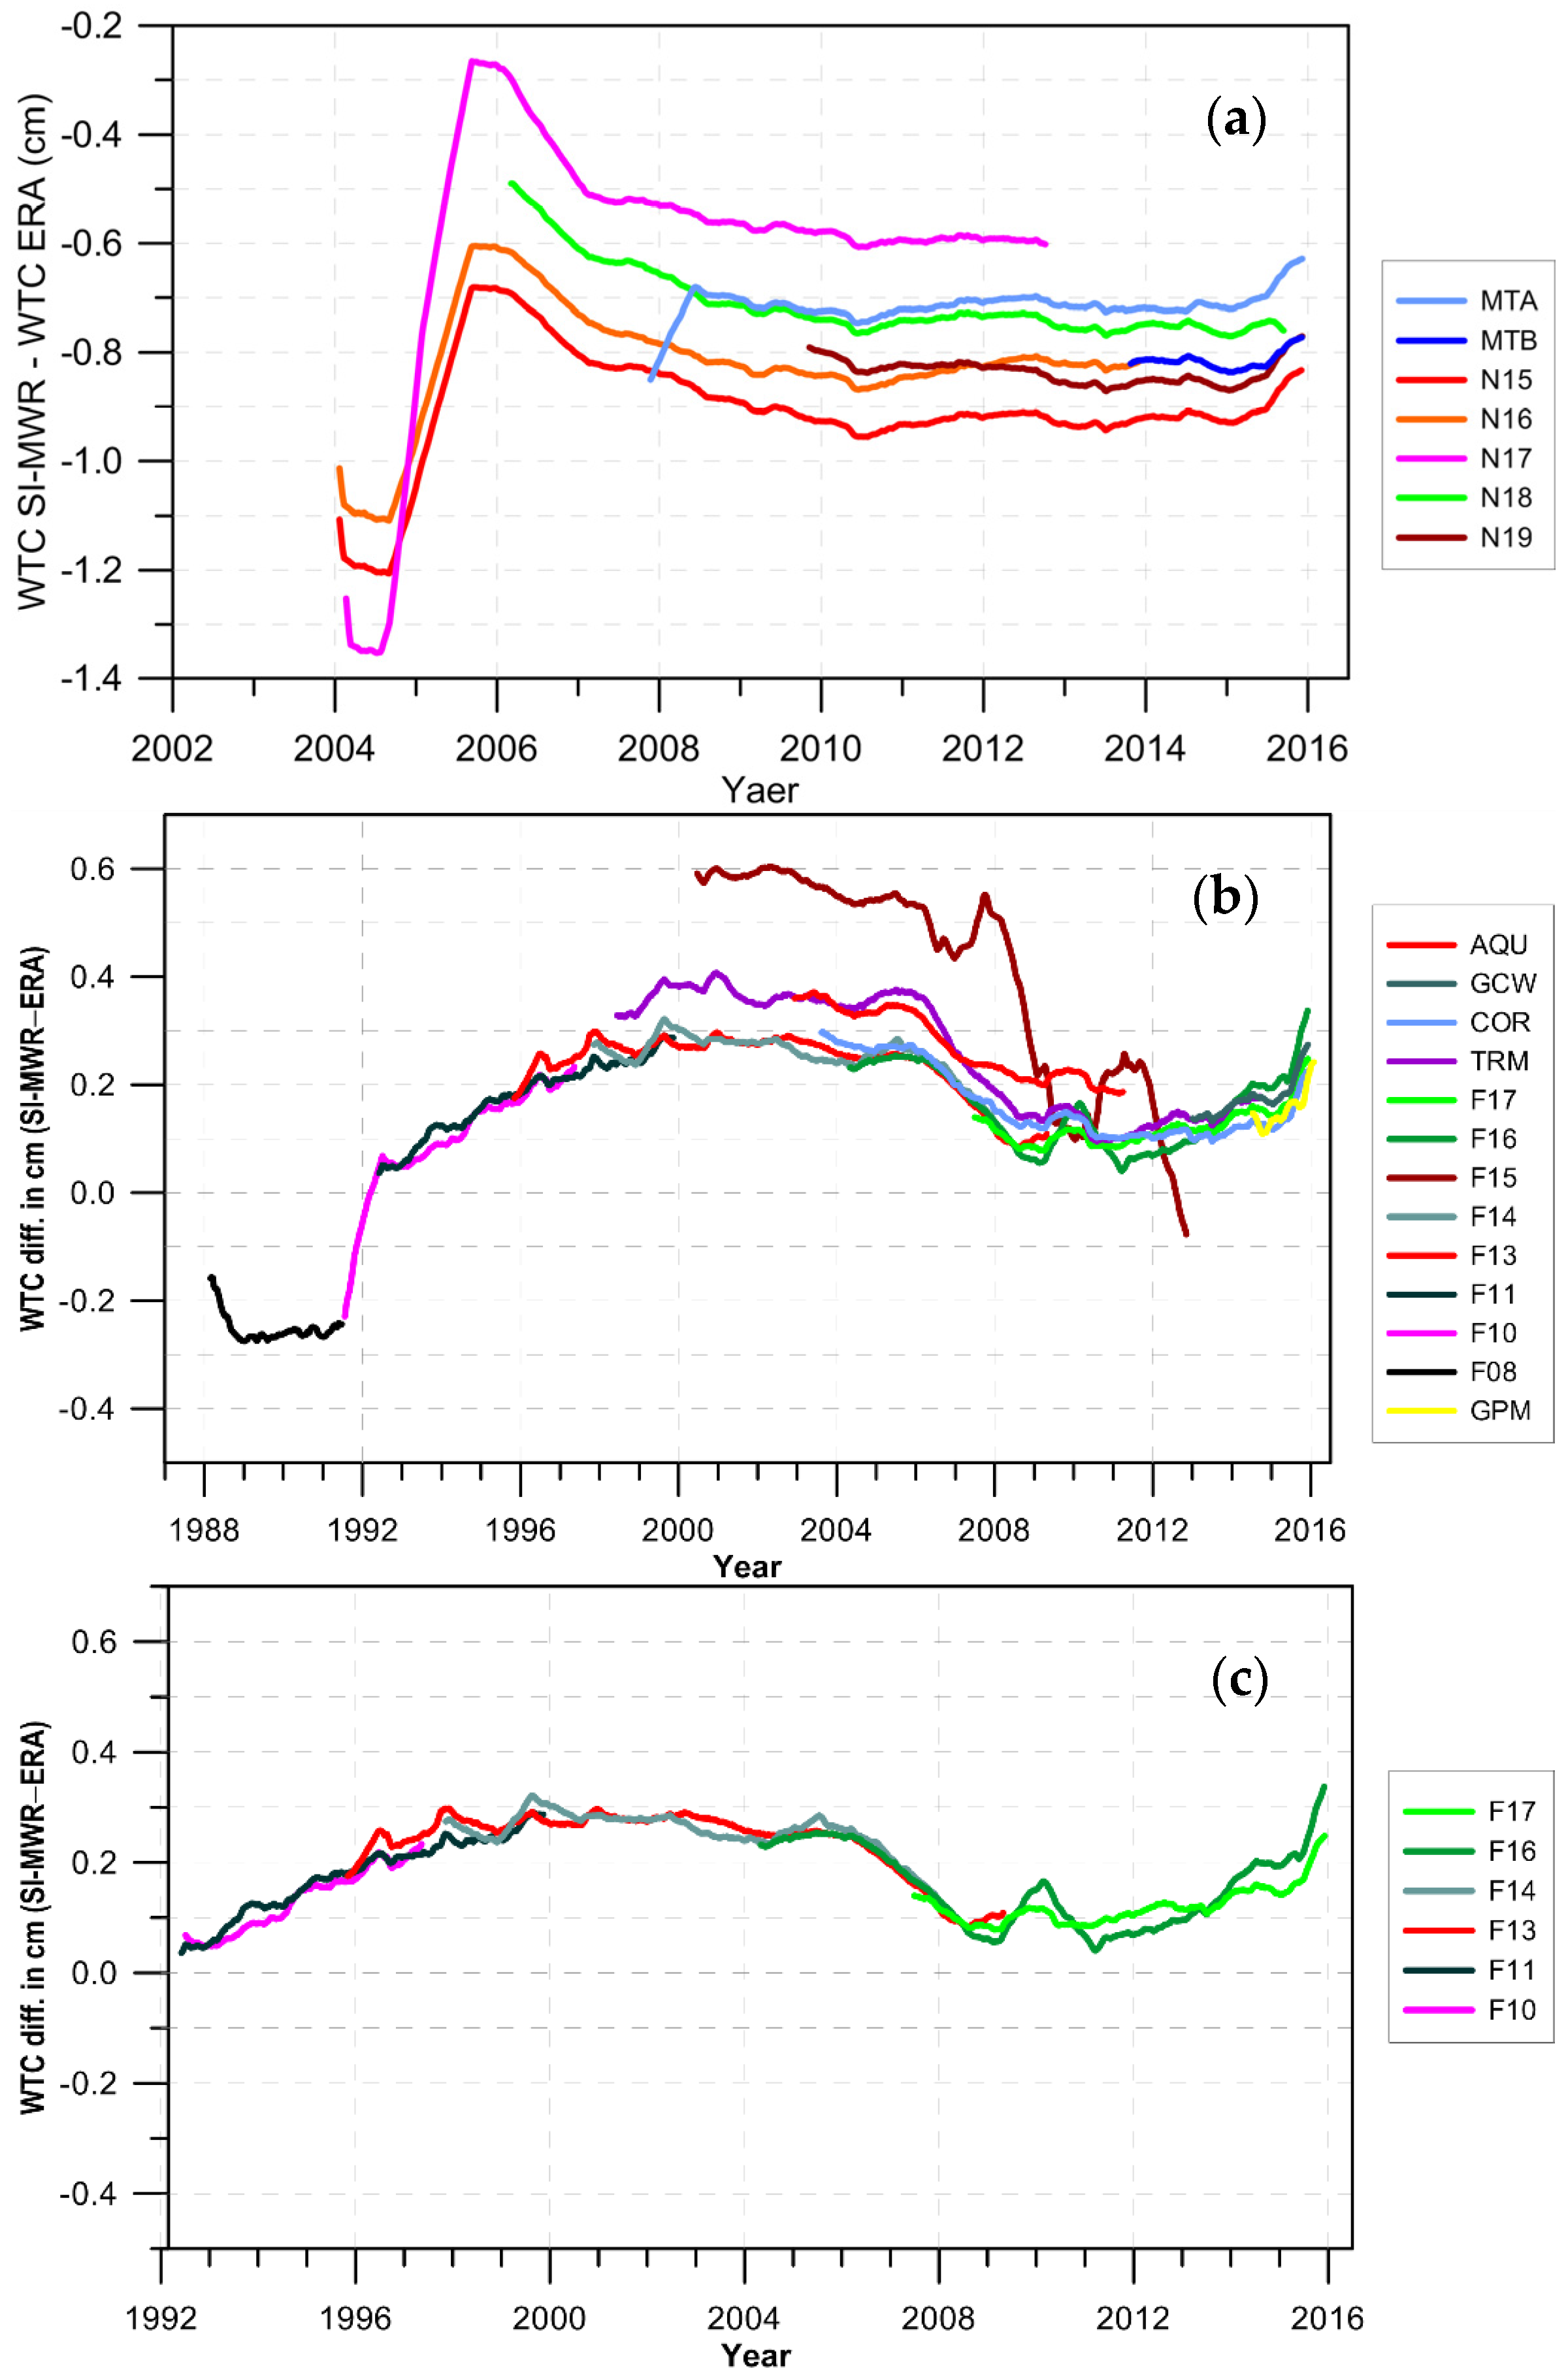
Prior to the calibration procedure, the differences between each SI-MWR-derived WTC and ERA-derived WTC, collocated in space and time with each SI-MWR measurement point, were analysed. This allowed the identification of instabilities leading to the rejection of F15 data, rejection of MetOp-A before 2008 and rejection of N15, N16 and N17 before 2005.7 (Figure 4).
The calibration was then performed in three steps:
  • Step 1—TOPEX/Poseidon (TP), Jason-1 (J1) and Jason-2 (J2) were calibrated against the SSM/I and SSM/IS sensors on board the “FXX” satellite series;
  • Step 2—GFO was calibrated against previously calibrated TP, J1, J2;
  • Step 3—remaining SI-MWR were calibrated against previously calibrated TP, J1, J2.
The adjustment model uses three parameters: offset (a), scale factor (b) and linear trend (c):
Y = a + b X + c ( T T 0 ) , T 0 = 1992
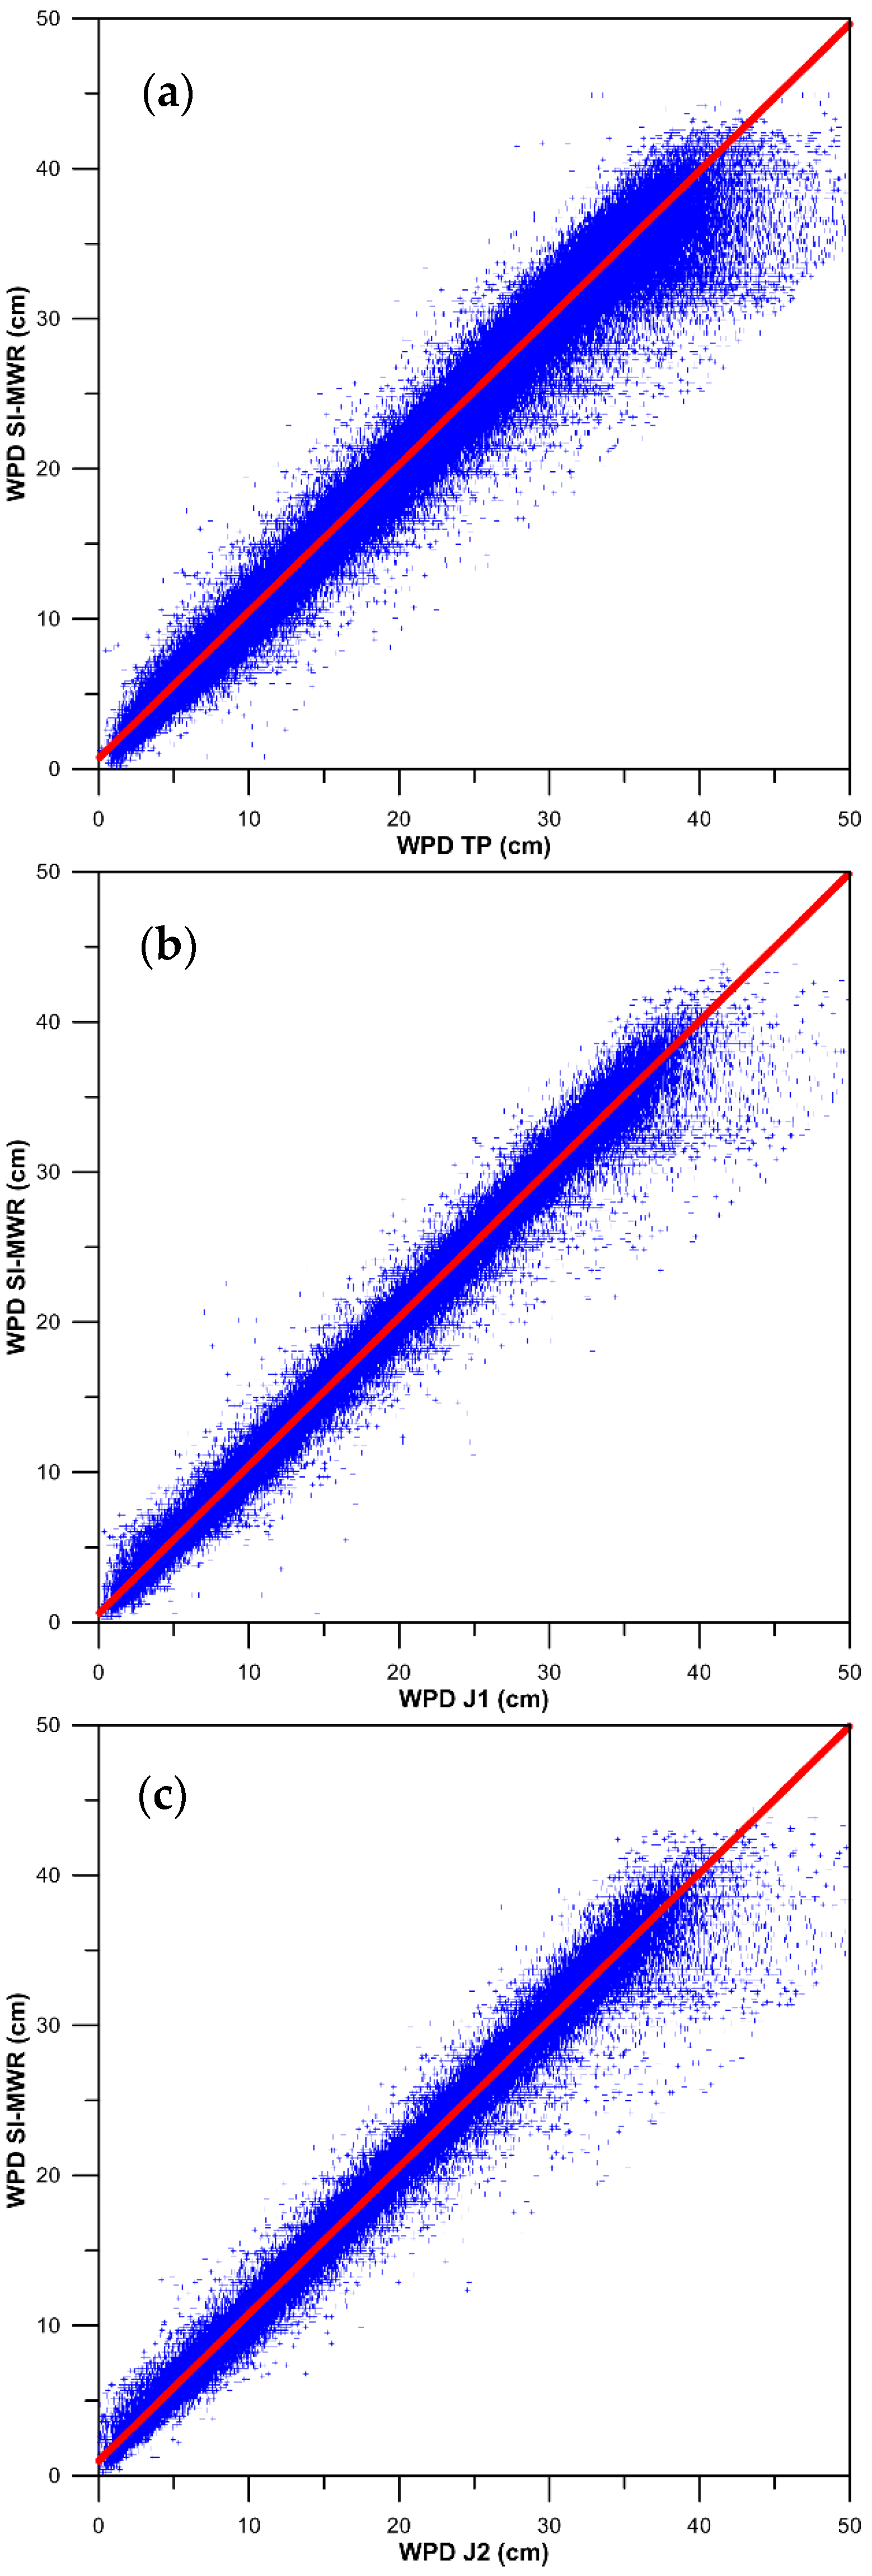
In Step 1, match points between each SSM/I and SSM/IS sensors and each MWR on board the reference altimetric mission(s) (TP, J1, and J2) operating simultaneously were calculated. Only points with time difference ∆T < 45 min and distance ∆D < 50 km were considered [11]. The WTC data from each reference altimetric mission were then adjusted to the WTC data from SSM/I and SMM/IS set of sensors (Figure 5 and Figure 6).
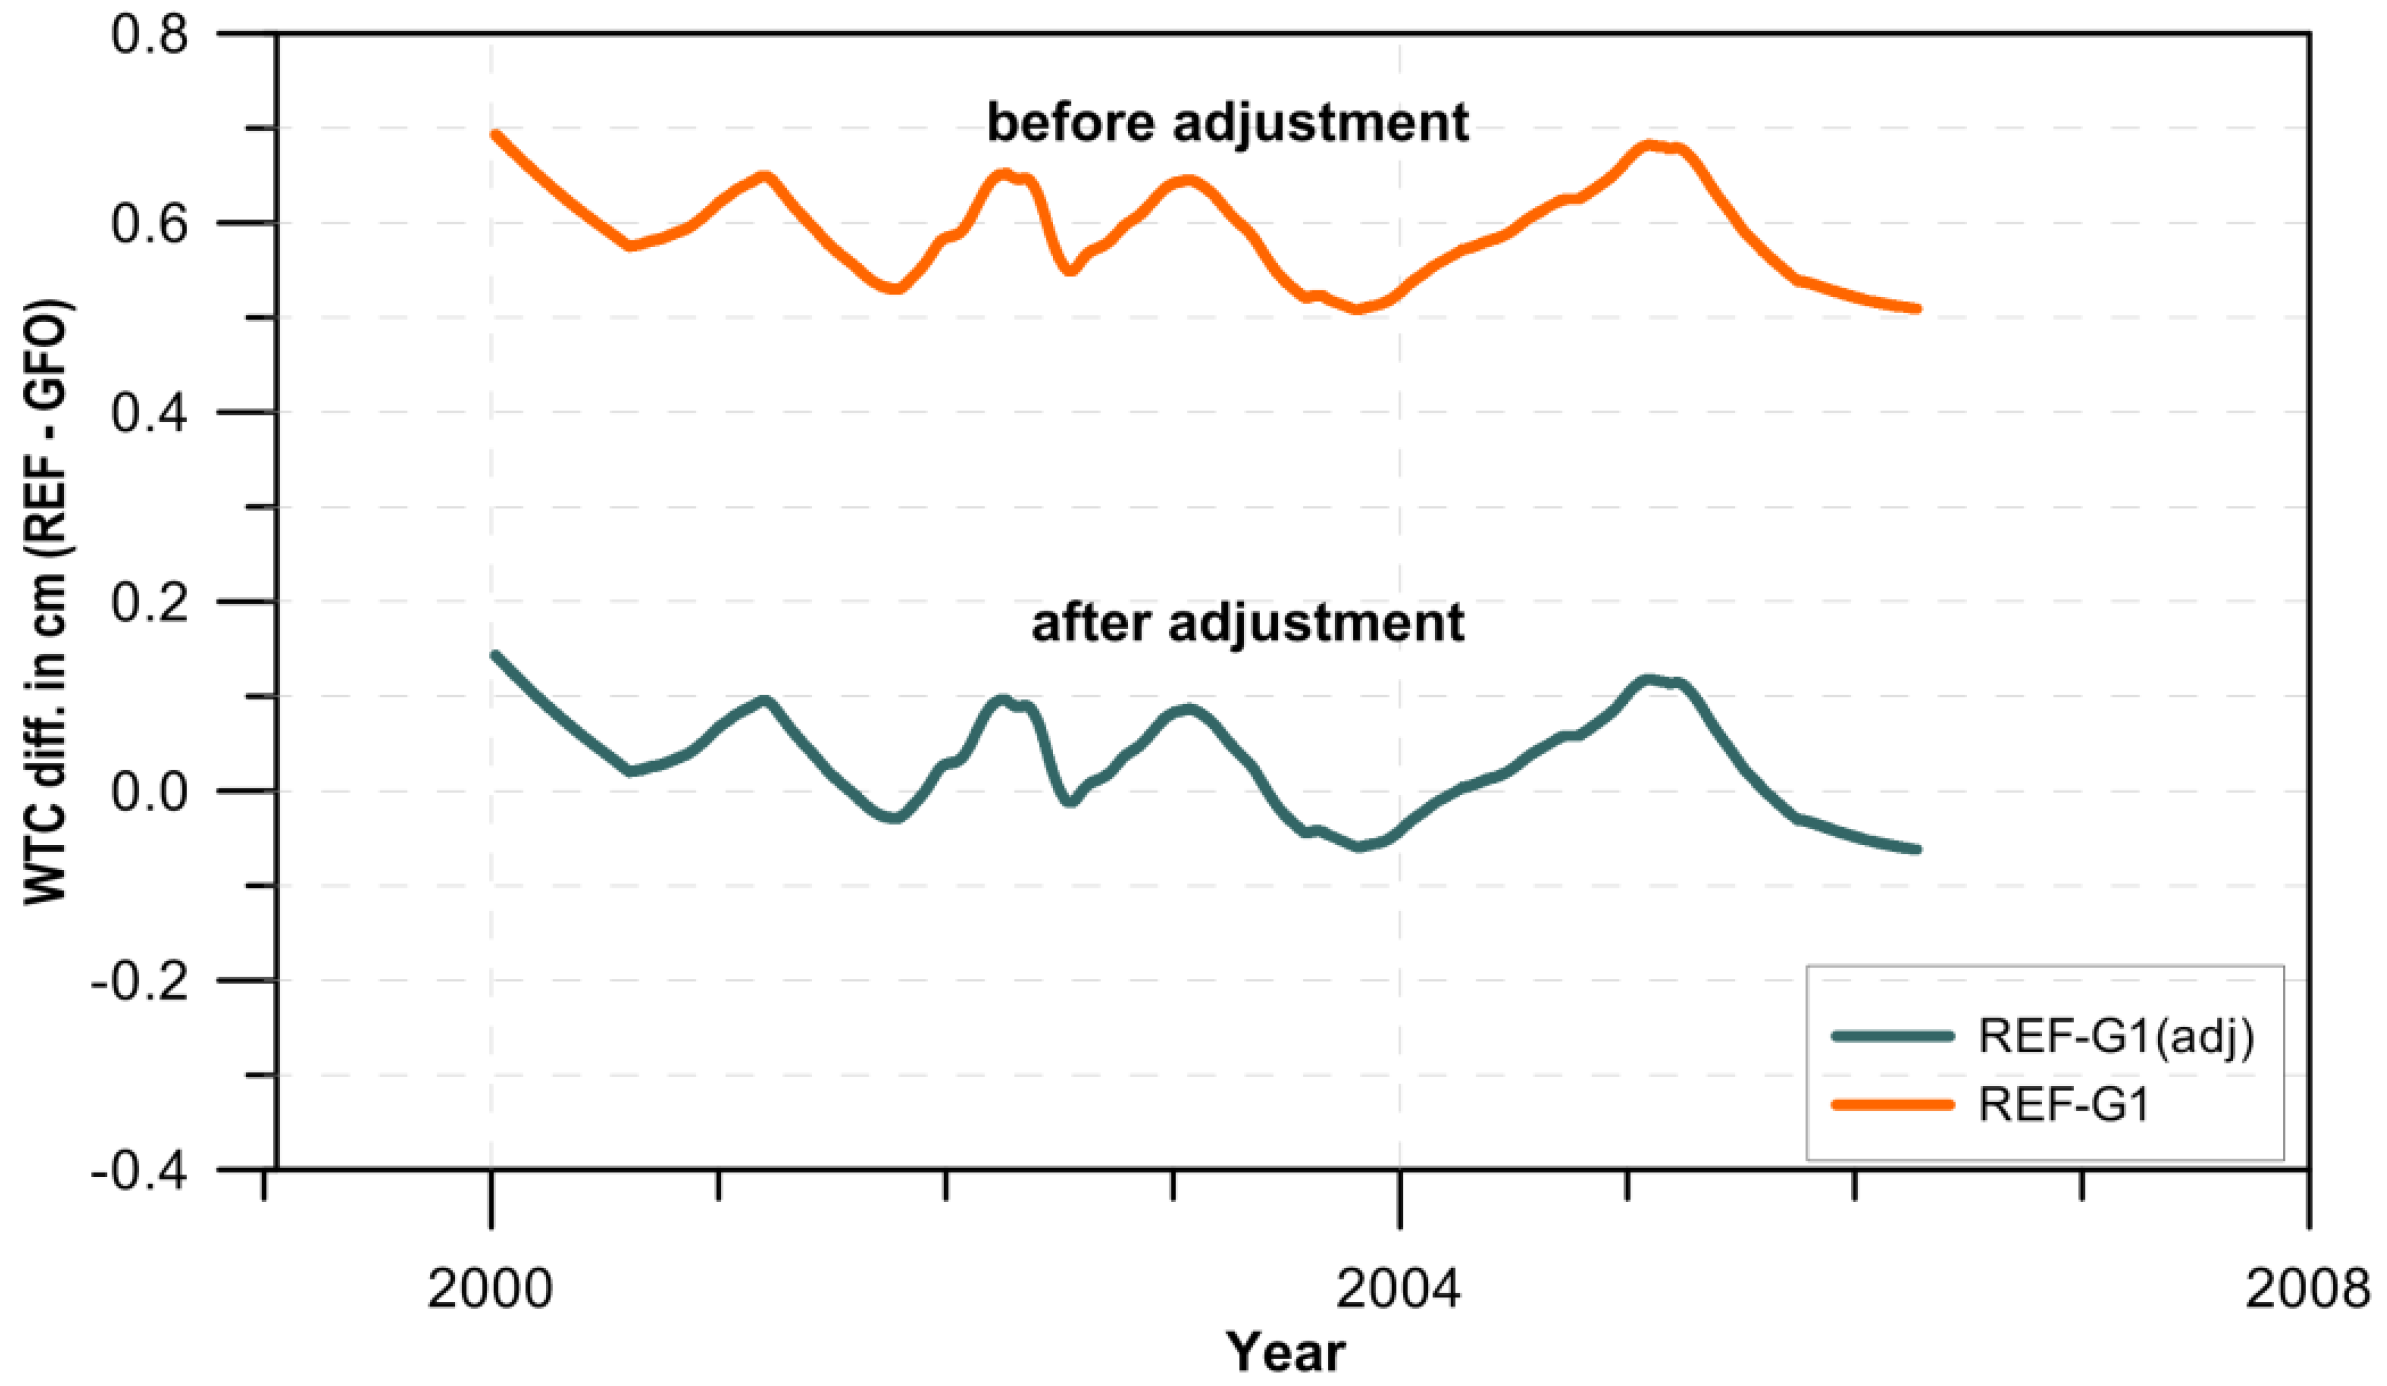
In Step 2, the WTC from GFO was calibrated against the WTC from the reference missions (TP, J1, J2) by minimizing the WTC differences at crossovers, between the reference missions and GFO. Only crossovers with time differences less than 180 min have been considered. This value was found to be the best compromise between the number of crossovers and the minimum time interval (Figure 7 and Figure 8).
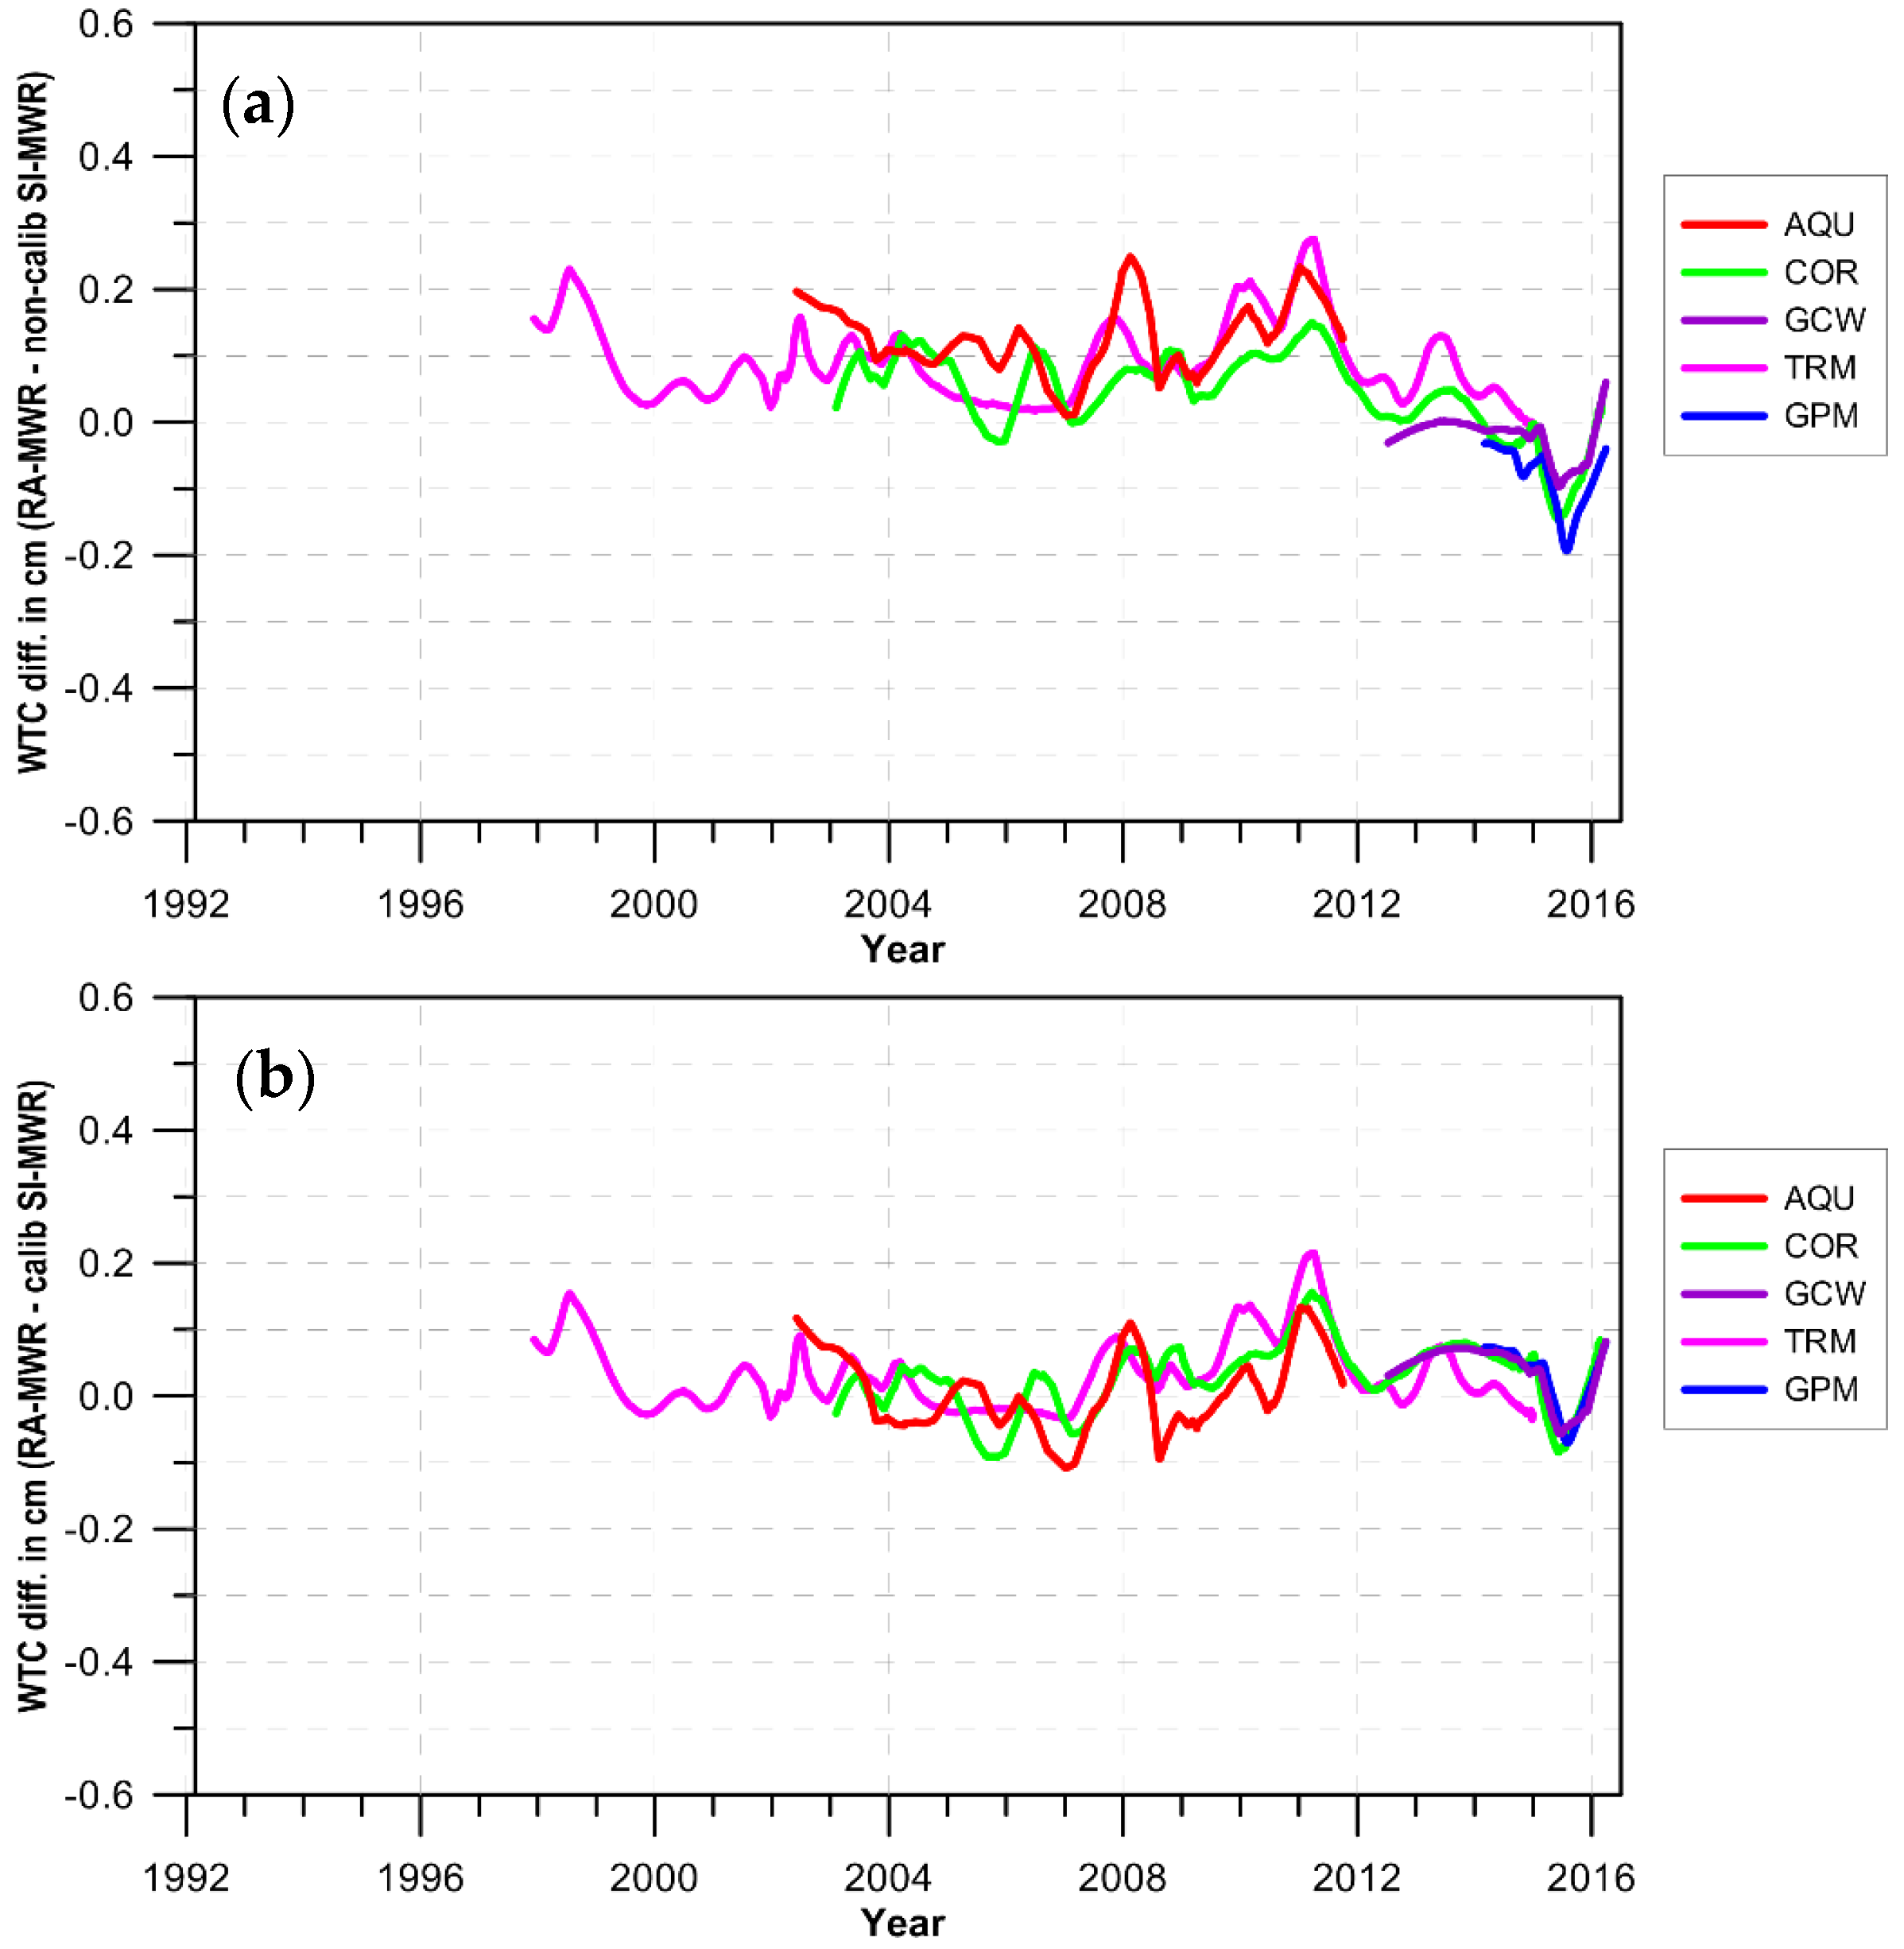
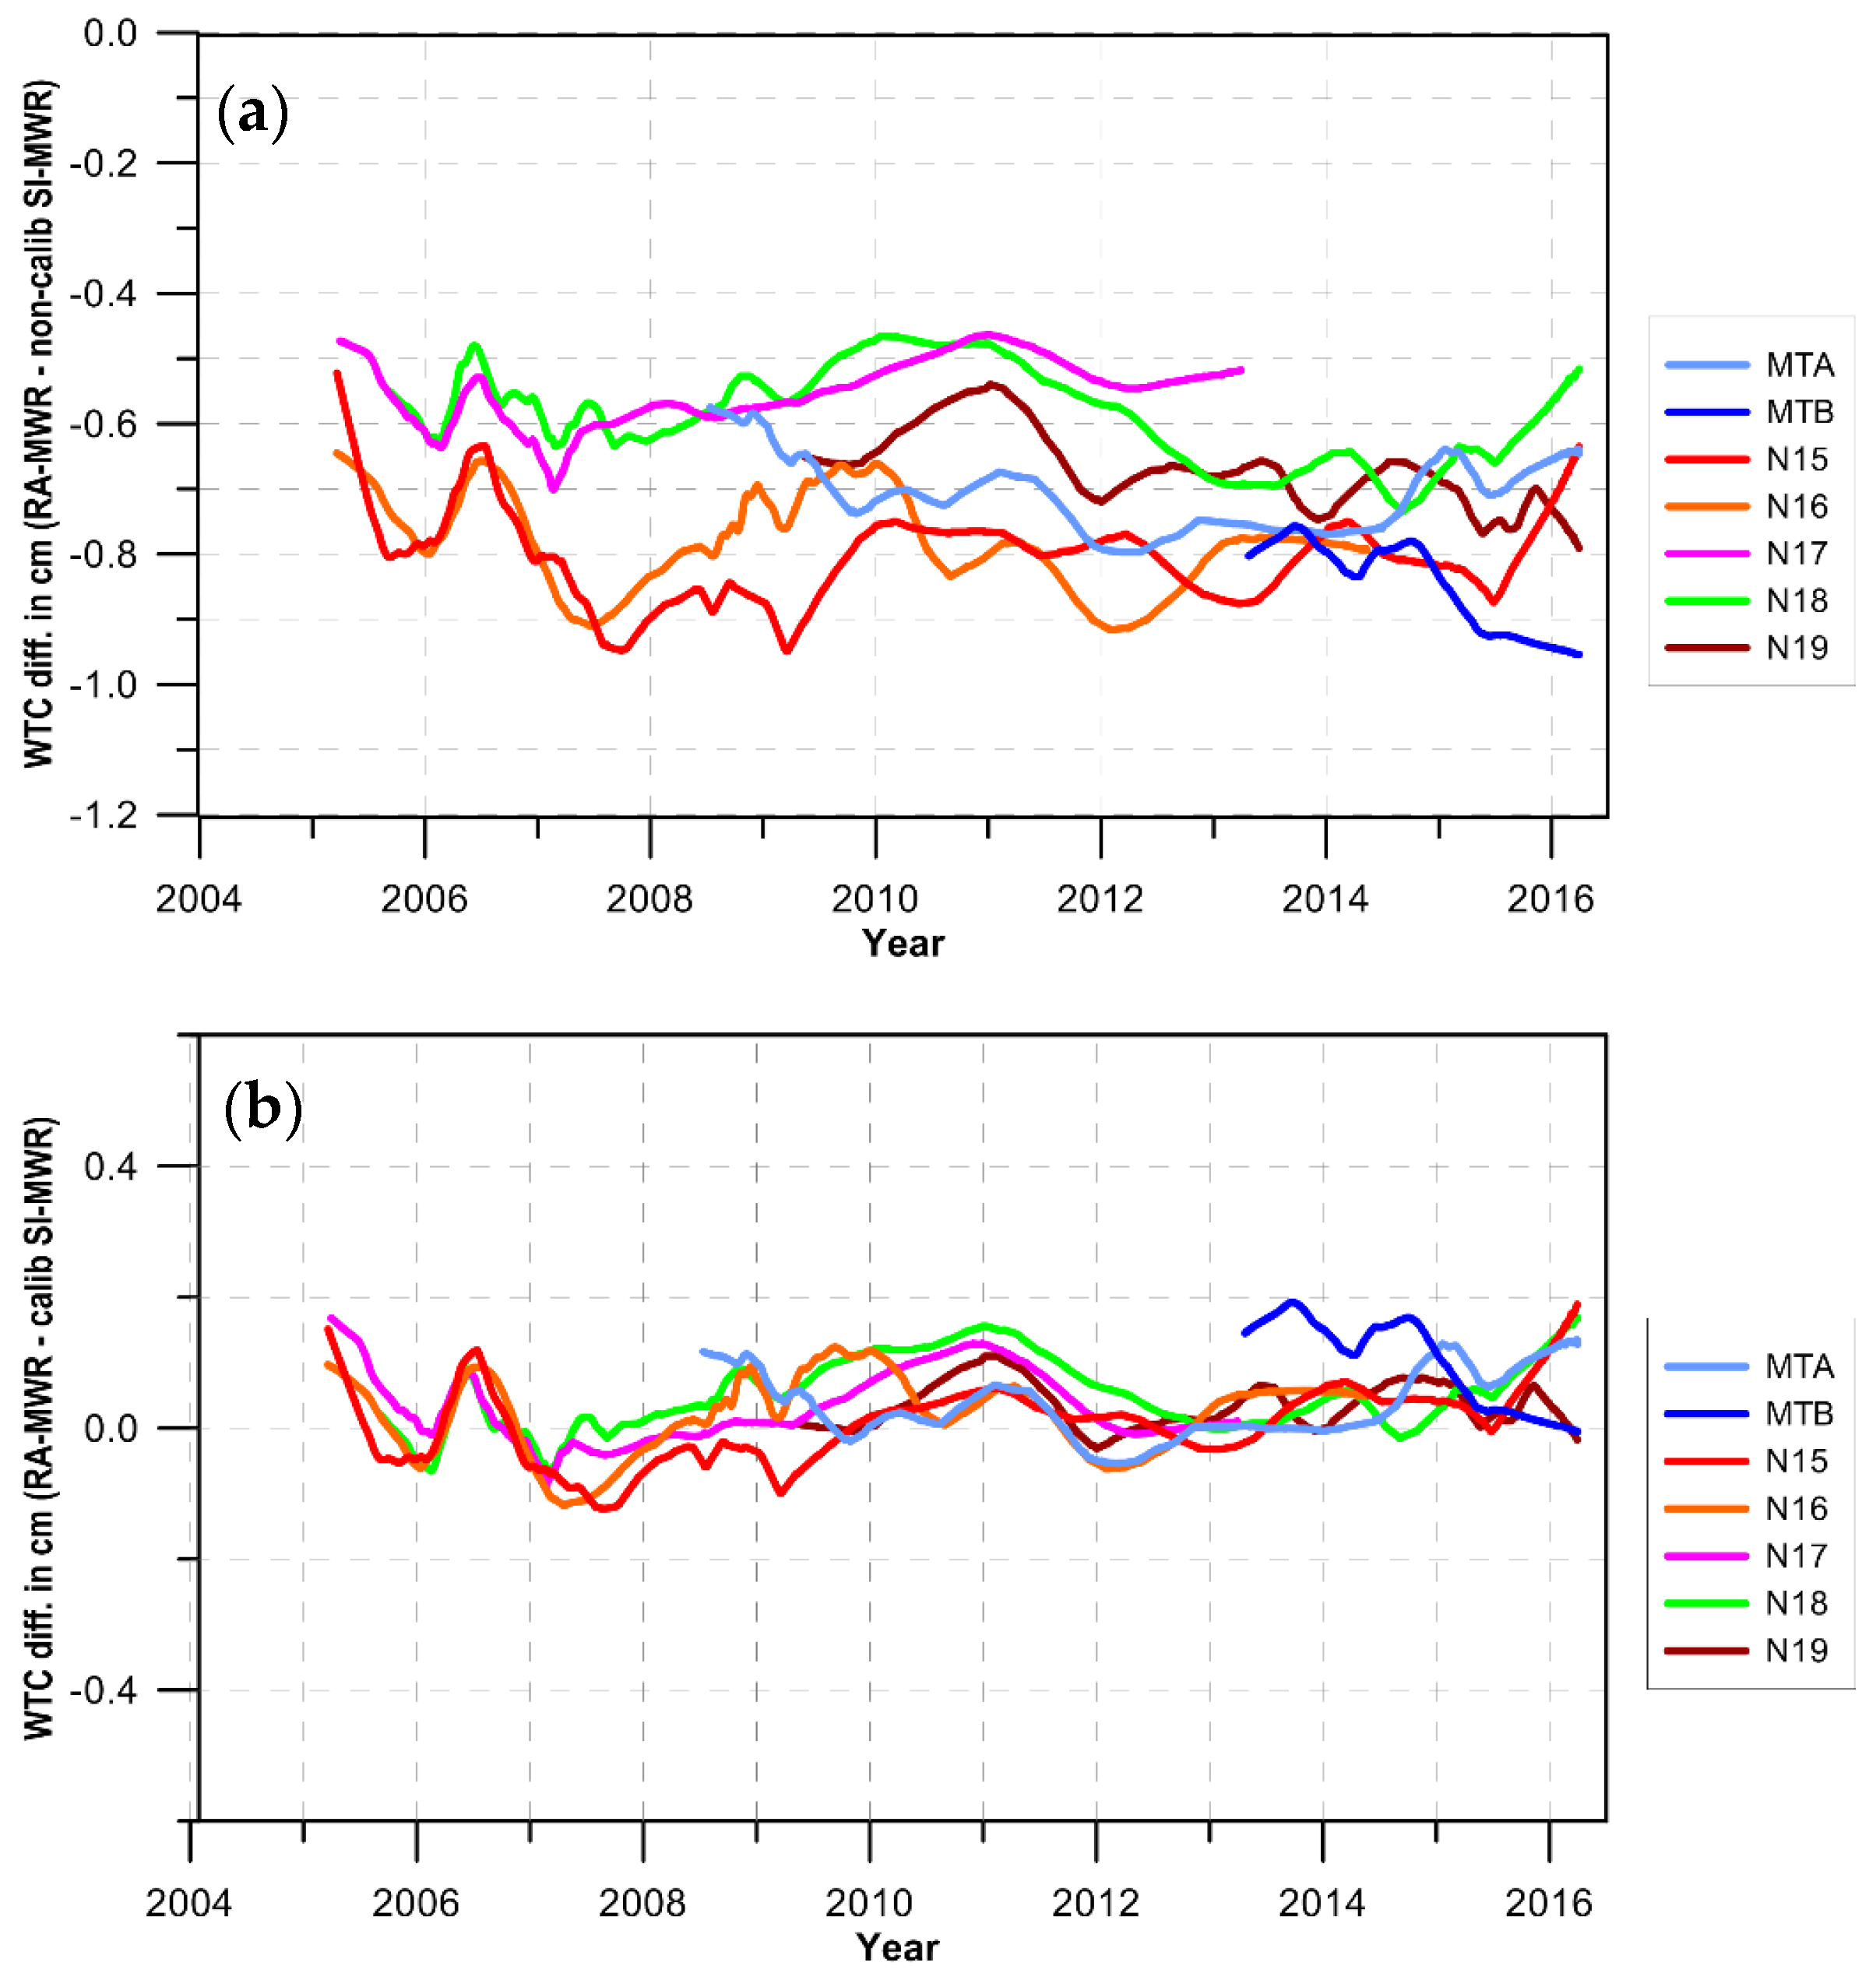
In Step 3, the WTC from all remaining SI-MWR (except the SSM/I and SSM/IS FXX series) sensors were adjusted to the WTC from the altimetric reference missions (Figure 9, Figure 10 and Figure 11). Results are presented in Figure 5, Figure 6, Figure 7, Figure 8, Figure 9, Figure 10 and Figure 11 and Table 2.
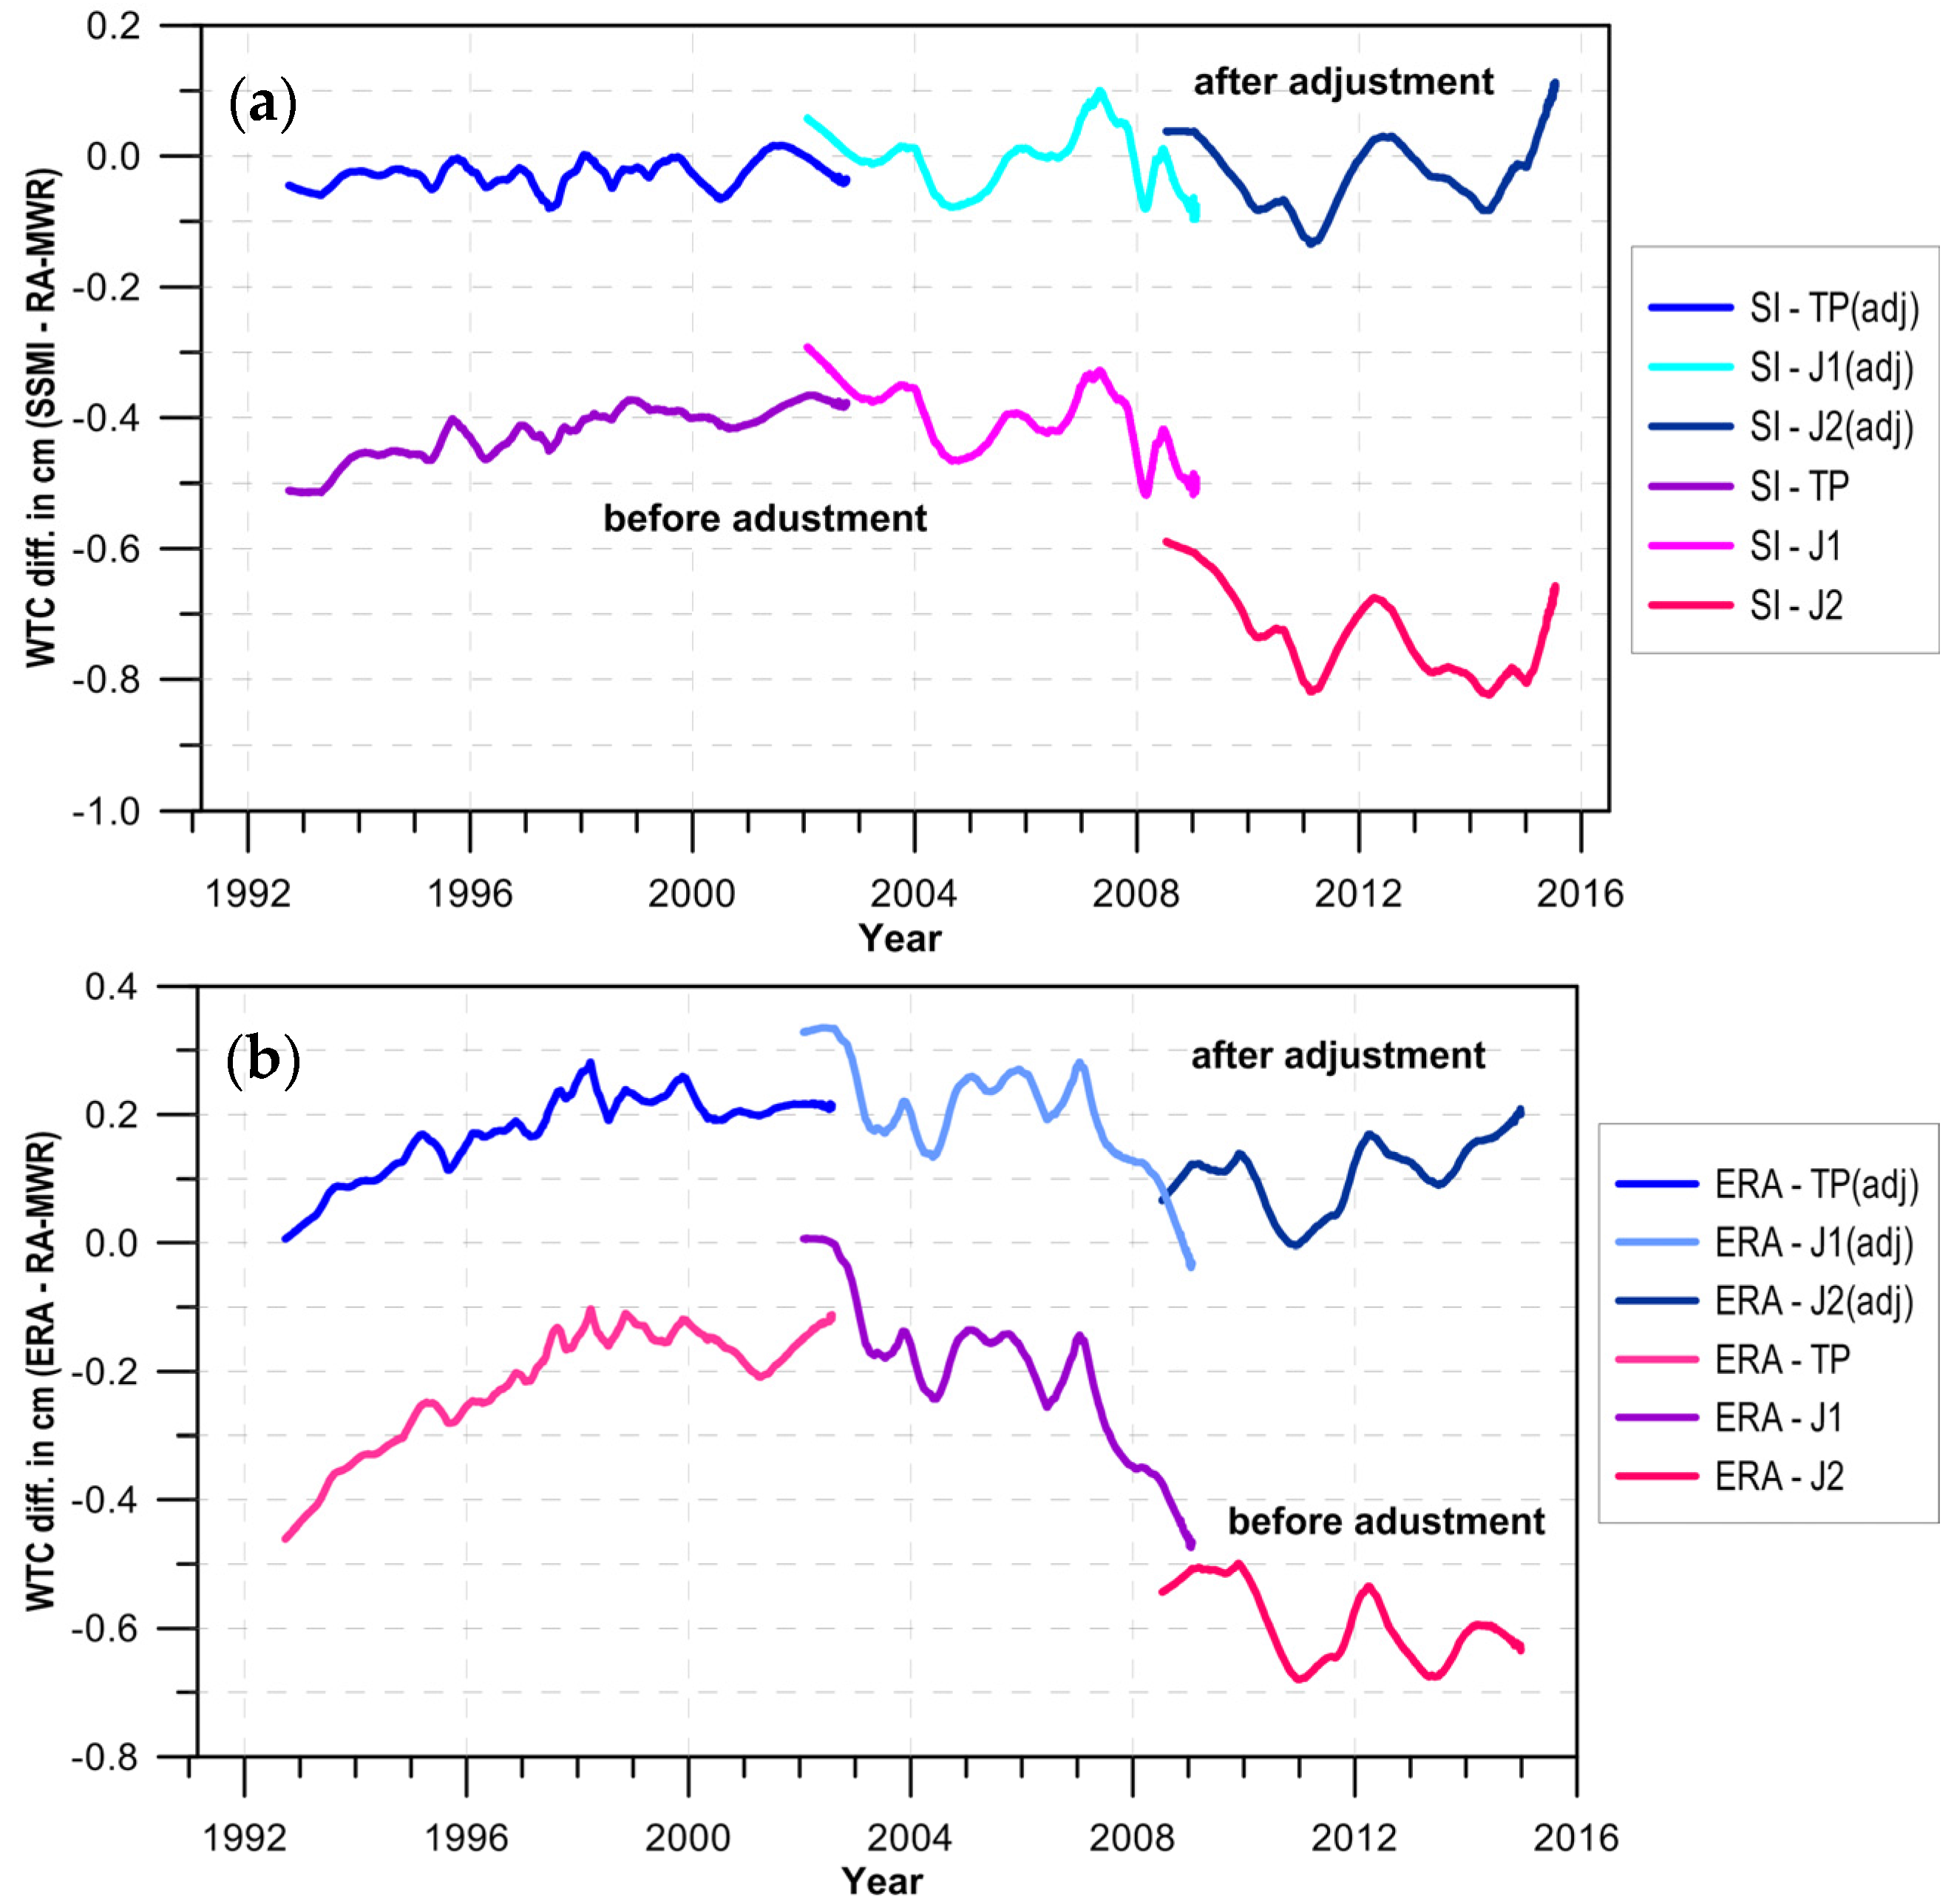
For the reference altimetric missions the offsets are in the range of −0.8 to −0.5 cm, the scale factors in the range of 0.98 to 0.99 and the trends in the range of −0.18 to 0.15 mm/year. Although small, these values have an impact in both the global and sea level trends [28]. Figure 5 shows that the three reference missions have similar scatter plots with respect to the SSM/I and SSM/IS dataset. The measurements from all MWR aboard the reference altimetric missions show larger dispersion of values in comparison to those from the reference SI-MWR. Figure 6 illustrates the effect of the inter-calibration of the reference altimetric missions in the long-term WTC signal measured by these missions. The bottom panel of this figure shows that the time series of the differences between ERA and TP, J1, J2 before calibration evidences a clear curve, still present but less pronounced in the corresponding differences after calibration. This curve, already mentioned by authors such as [11] and [15], is believed to be due to changes in the assimilation scheme used in ERA Interim [4].
For GFO, values of 0.47 cm, 0.99 and 0.01 mm/year were found for the offset, scale factor and linear trend, respectively. Apart from the offset, still small, these parameters indicate that GFO is a stable radiometer, well aligned with the SSM/I and SSM/IS sensors.
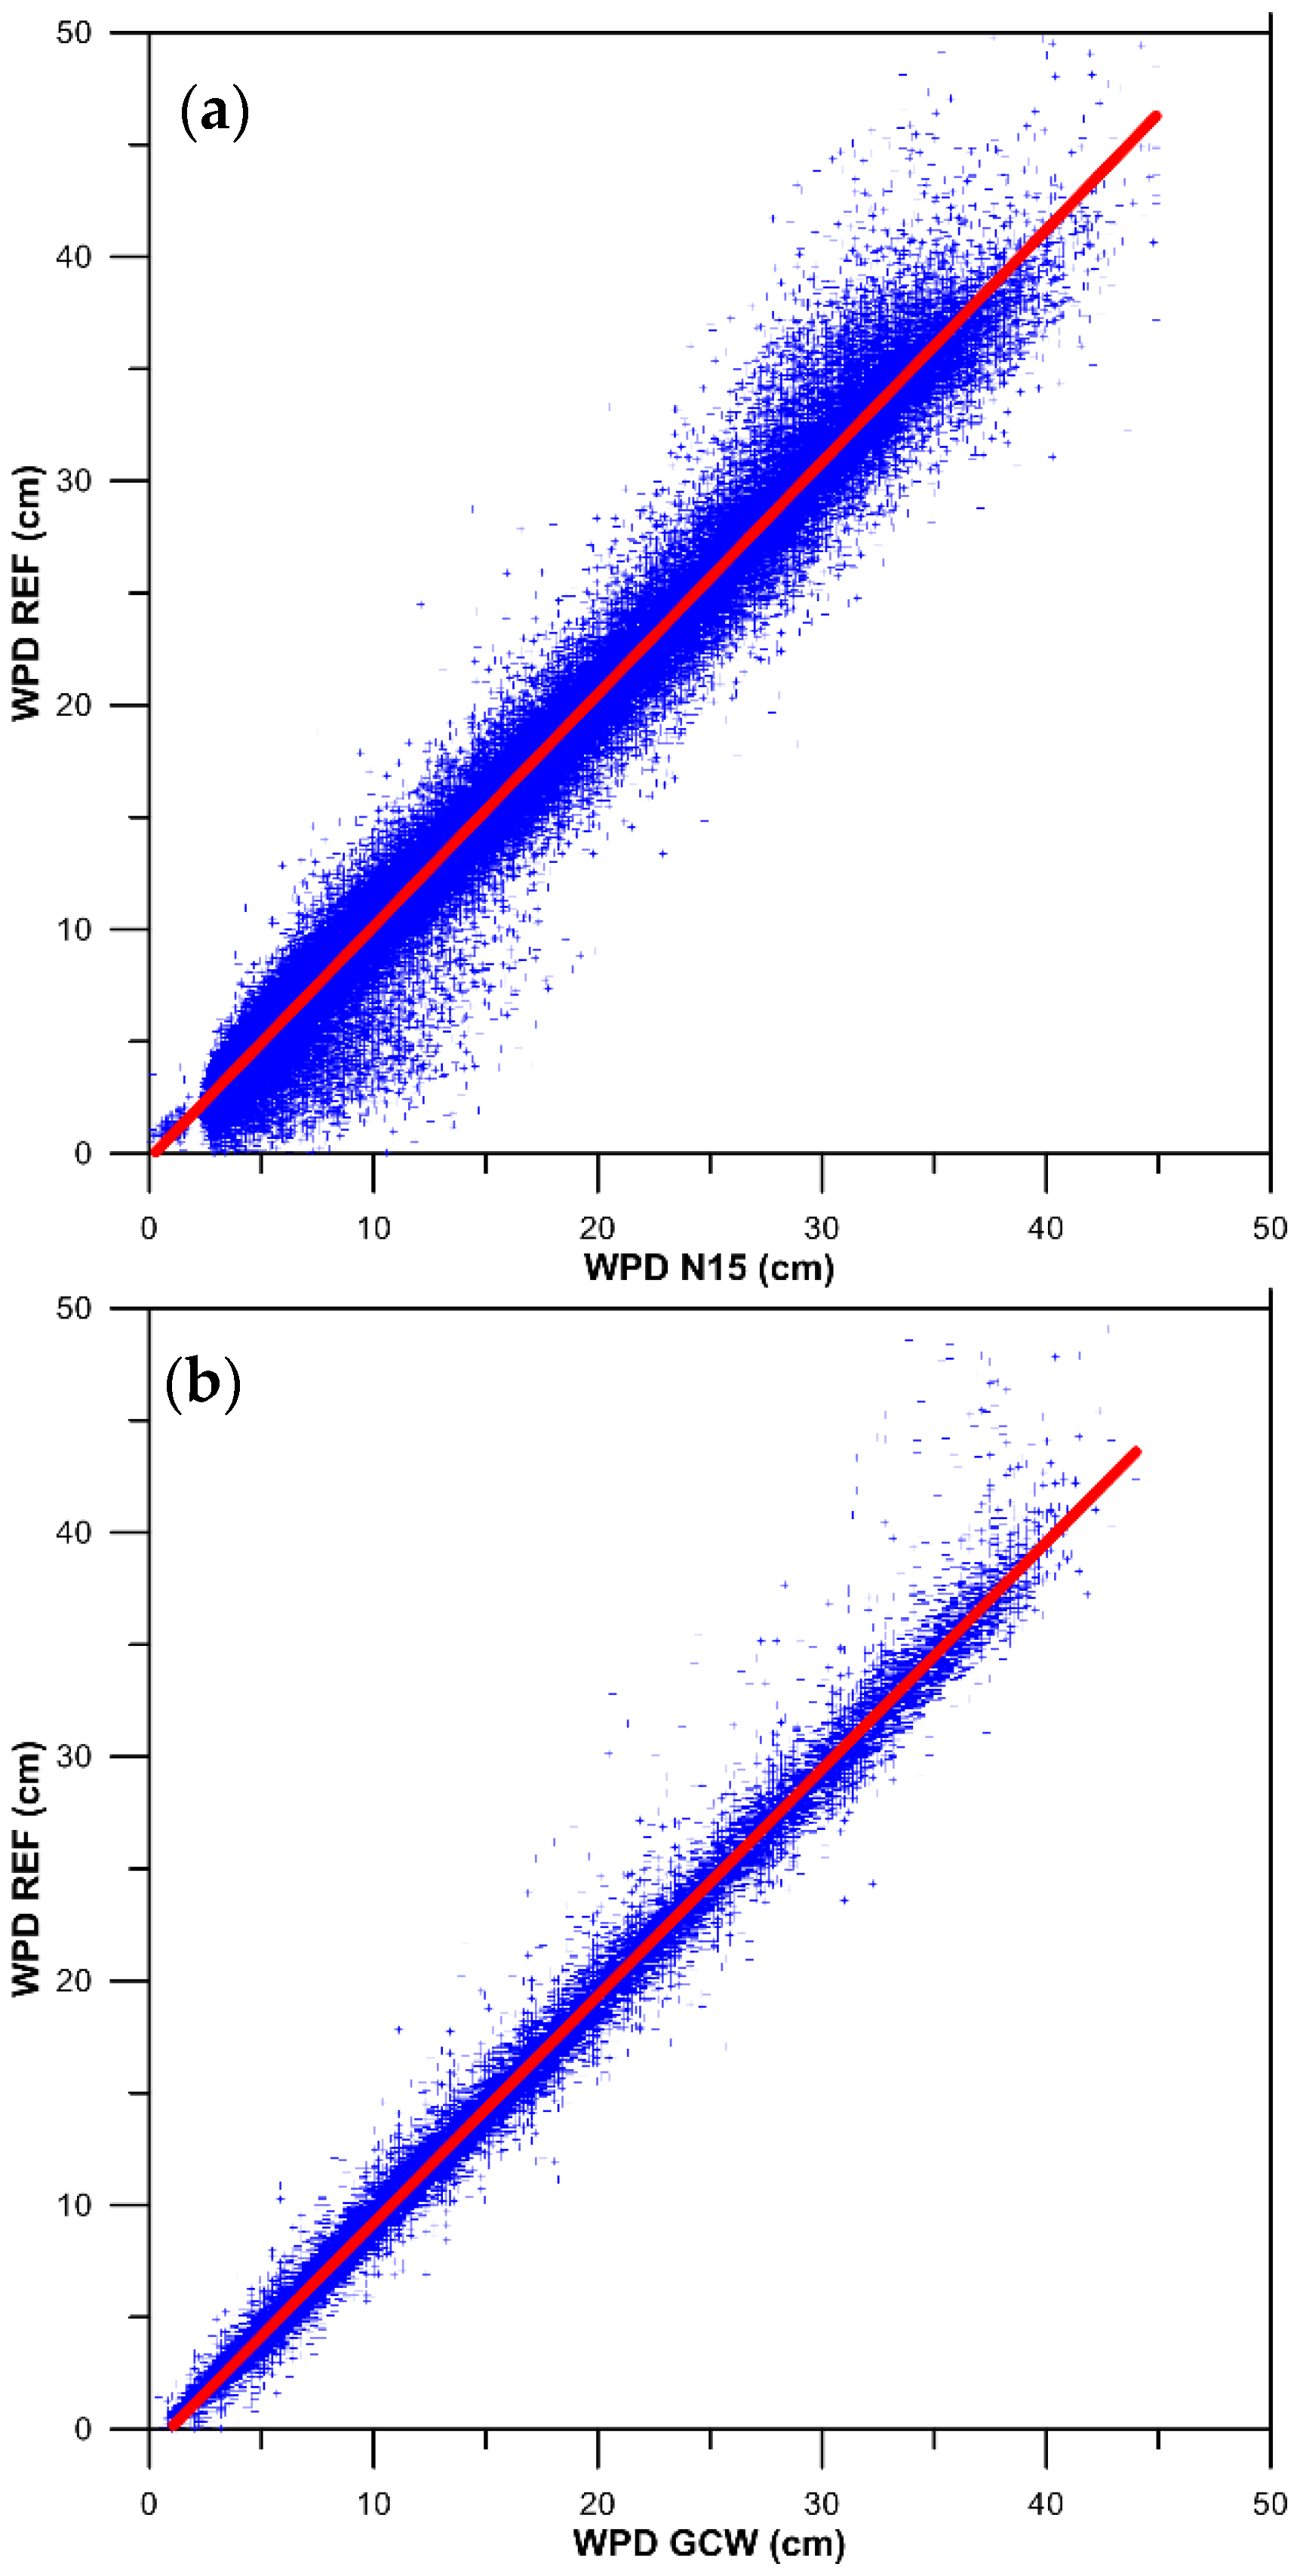
For the remaining SI-MWR, the offsets are in the range of −1.0 to 0.0 cm, the scale factors in the range of 0.99 to 1.02 and the trends in the range of −0.25 to 0.10 mm/year. Although these parameters are generally small, they have an effect in the global sea level variation mainly at decadal time scales and in the regional mean sea level. In general, the AMSU-A sensors evidence larger calibration parameters and RMS of fit to the reference altimetric missions compared, e.g., to WindSat, AMSR-E or GMI (see Figure 9, Figure 10 and Figure 11). Figure 9 illustrates the better performance of AMSR-like radiometers vs. AMSU-like sensors.

3. GPD+ WTC for CryoSat-2 and GFO

The GPD+ algorithm has been implemented globally and applied to the main altimetric missions. This section describes its application to CryoSat-2 and Geosat Follow-On. The application to the reference missions, the ESA 35-day missions and SARAL/Altika is presented in [28].

3.1. CryoSat-2

The lack of a microwave radiometer on CryoSAt-2 motivated the exploitation of the wet path delays available from the set of SI-MWR sensors and its inclusion in the WTC estimations for this satellite [10] and in the WTC estimations at UPorto [11].
This section presents the application of the GPD+ algorithm to CryoSat-2, from the beginning of the mission until April 2016, sub-cycles 04 to 78. For validation purposes, the correction was also computed for Jason-2, for the period coincident to that of CryoSat-2, i.e., for cycles 74 onwards. Results for J2 allow the comparison of the GPD+ correction to that from AMR (Advanced Microwave Radiometer) deployed on J2. Note that, although the typical GPD+ WTC for J2 also incorporates AMR data, for this evaluation a correction was computed using only external observations (GNSS and SI-MWR), in the same fashion as the CS-2 correction, thus being independent from AMR.
For satellites such as CryoSat-2, the algorithm estimates a new WTC for every along-track point, taking full advantage of the existing third party observations. For the period of the CS-2 mission, data from over 800 GNSS stations (Figure 2), the average number of contemporary stations is about 400, continuously increasing with time, and from 14 SI-MWR are available for the WTC computation: 7 AMSU-A aboard MetOp-A, MetOp-B, NOAA-15, NOAA-16, NOAA-17, NOAA-18, NOAA-19; AMSR-E on AQUA; AMSR-2 on GCOM-W1; 2 SSM/IS on F16, F17; WindSat on Coriolis, TMI on TRMM and GMI on GPM (see Table 1 and Figure 3, also from [11]). These SI-MWR provide images which allow the spatial coverage of 70%–100% of CS-2 data if a temporal search radius of 110 min is allowed.
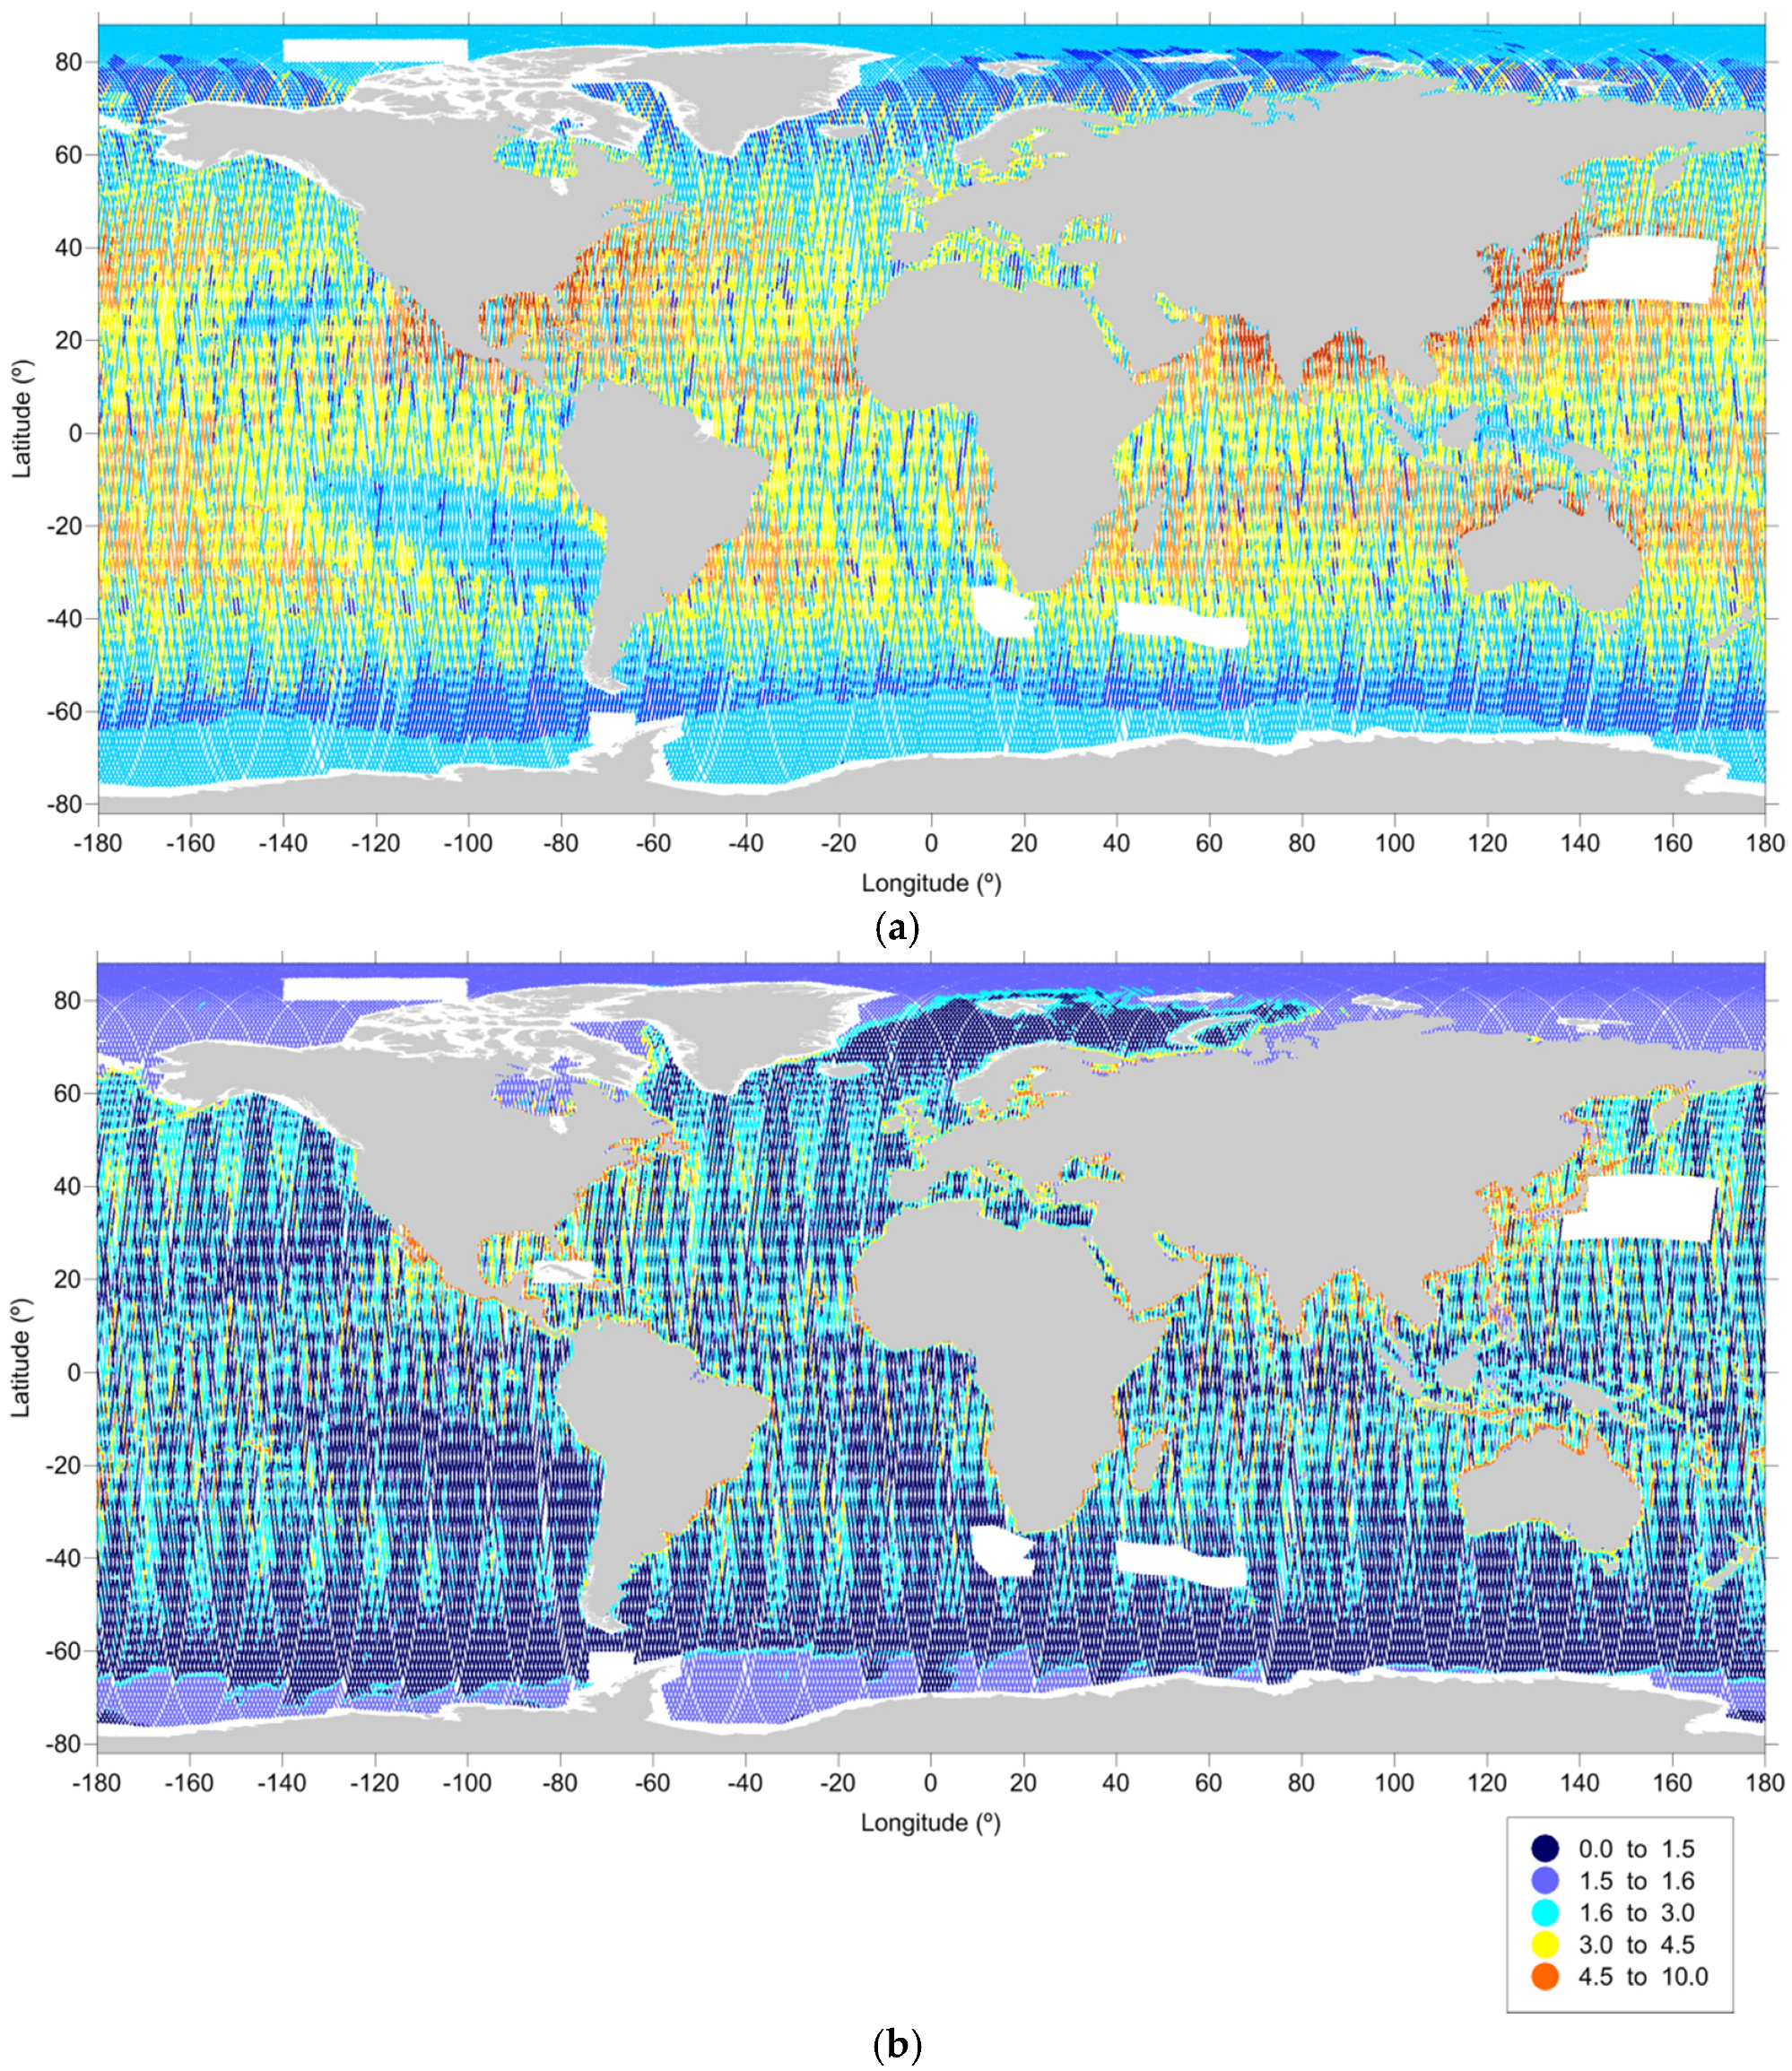
The spatial coverage of the various datasets for CS-2 sub-cycles 31 and 35 is shown in Figure 12, demonstrating that the coverage provided by the SI-MWR sensors varies with time. It has been shown by [11] that, since most SI-MWR are in sun-synchronous orbits, this spatial coverage varies with time with a period of 241.3 days, the period of the CryoSat-2 orbit with respect to the Sun. Consequently, the accuracy of the derived GPD+ WTC for CryoSat-2 also varies with the same periodicity. Besides the estimation of the WTC, the OA also provides the associated formal error, as illustrated in Figure 13 for CS-2 sub-cycles 31 and 35. The formal error of the GPD+ estimations is relatively small for cycles with near 100% coverage as is the case of sub-cycle 35, with the majority of the points with errors less than 2 cm. For sub-cycles such as 31, the coverage decreases to 70%–80%, increasing the percentage of points with formal error larger than 3 cm.
The assessment of the corrections has been performed by means of a set of statistical analyses of sea level anomalies (SLA) variance: SLA along-track variance differences: weighted mean values per cycle (weights function of the co-sine of latitude) and at collocated points, function of distance from coast and function of latitude; SLA analysis at cross-overs (weighted mean cycle values and spatial pattern).
Firstly, SLA datasets are derived, for each sub-cycle, using the two different WTC under comparison. Then, in the first case, the difference between the weighted variance of each SLA dataset, computed using all along-track points, is estimated for each cycle. For the analysis of the SLA variance difference function of distance from coast and of latitude, the variance of co-located along-track SLA measurements for a given period, and using each WTC, is computed in intervals (or bins) of latitude or distance from coast and then the differences considered. In the second case, crossovers are first estimated using the two SLA datasets, the variances of the SLA differences at crossovers are computed in regular latitude × longitude grids (4° × 4°) and subtracted.
The validation analysis has been performed using RADS data. RADS provides CryoSat-2 data for all Low Resolution Mode (LRM) points and most regions where the satellite is acquiring data in the SAR mode. In addition, as for all other satellites, RADS provides a large and harmonized set of orbits, mean sea surfaces, range and geophysical corrections, associated validation flags, and the “reference frame offset” (required to align all missions when multi-mission data are required) [18].
For validation purposes, two GPD+ versions have been computed for J2: (i) usual GPD+ WTC, using all data types (AMR, SI-MWR and GNSS); (ii) GPD+ WTC without using AMR, solely based on third party data (SI-MWR and GNSS). In both cases, ECMWF Operational model is used as first guess and adopted values in the absence of observations.
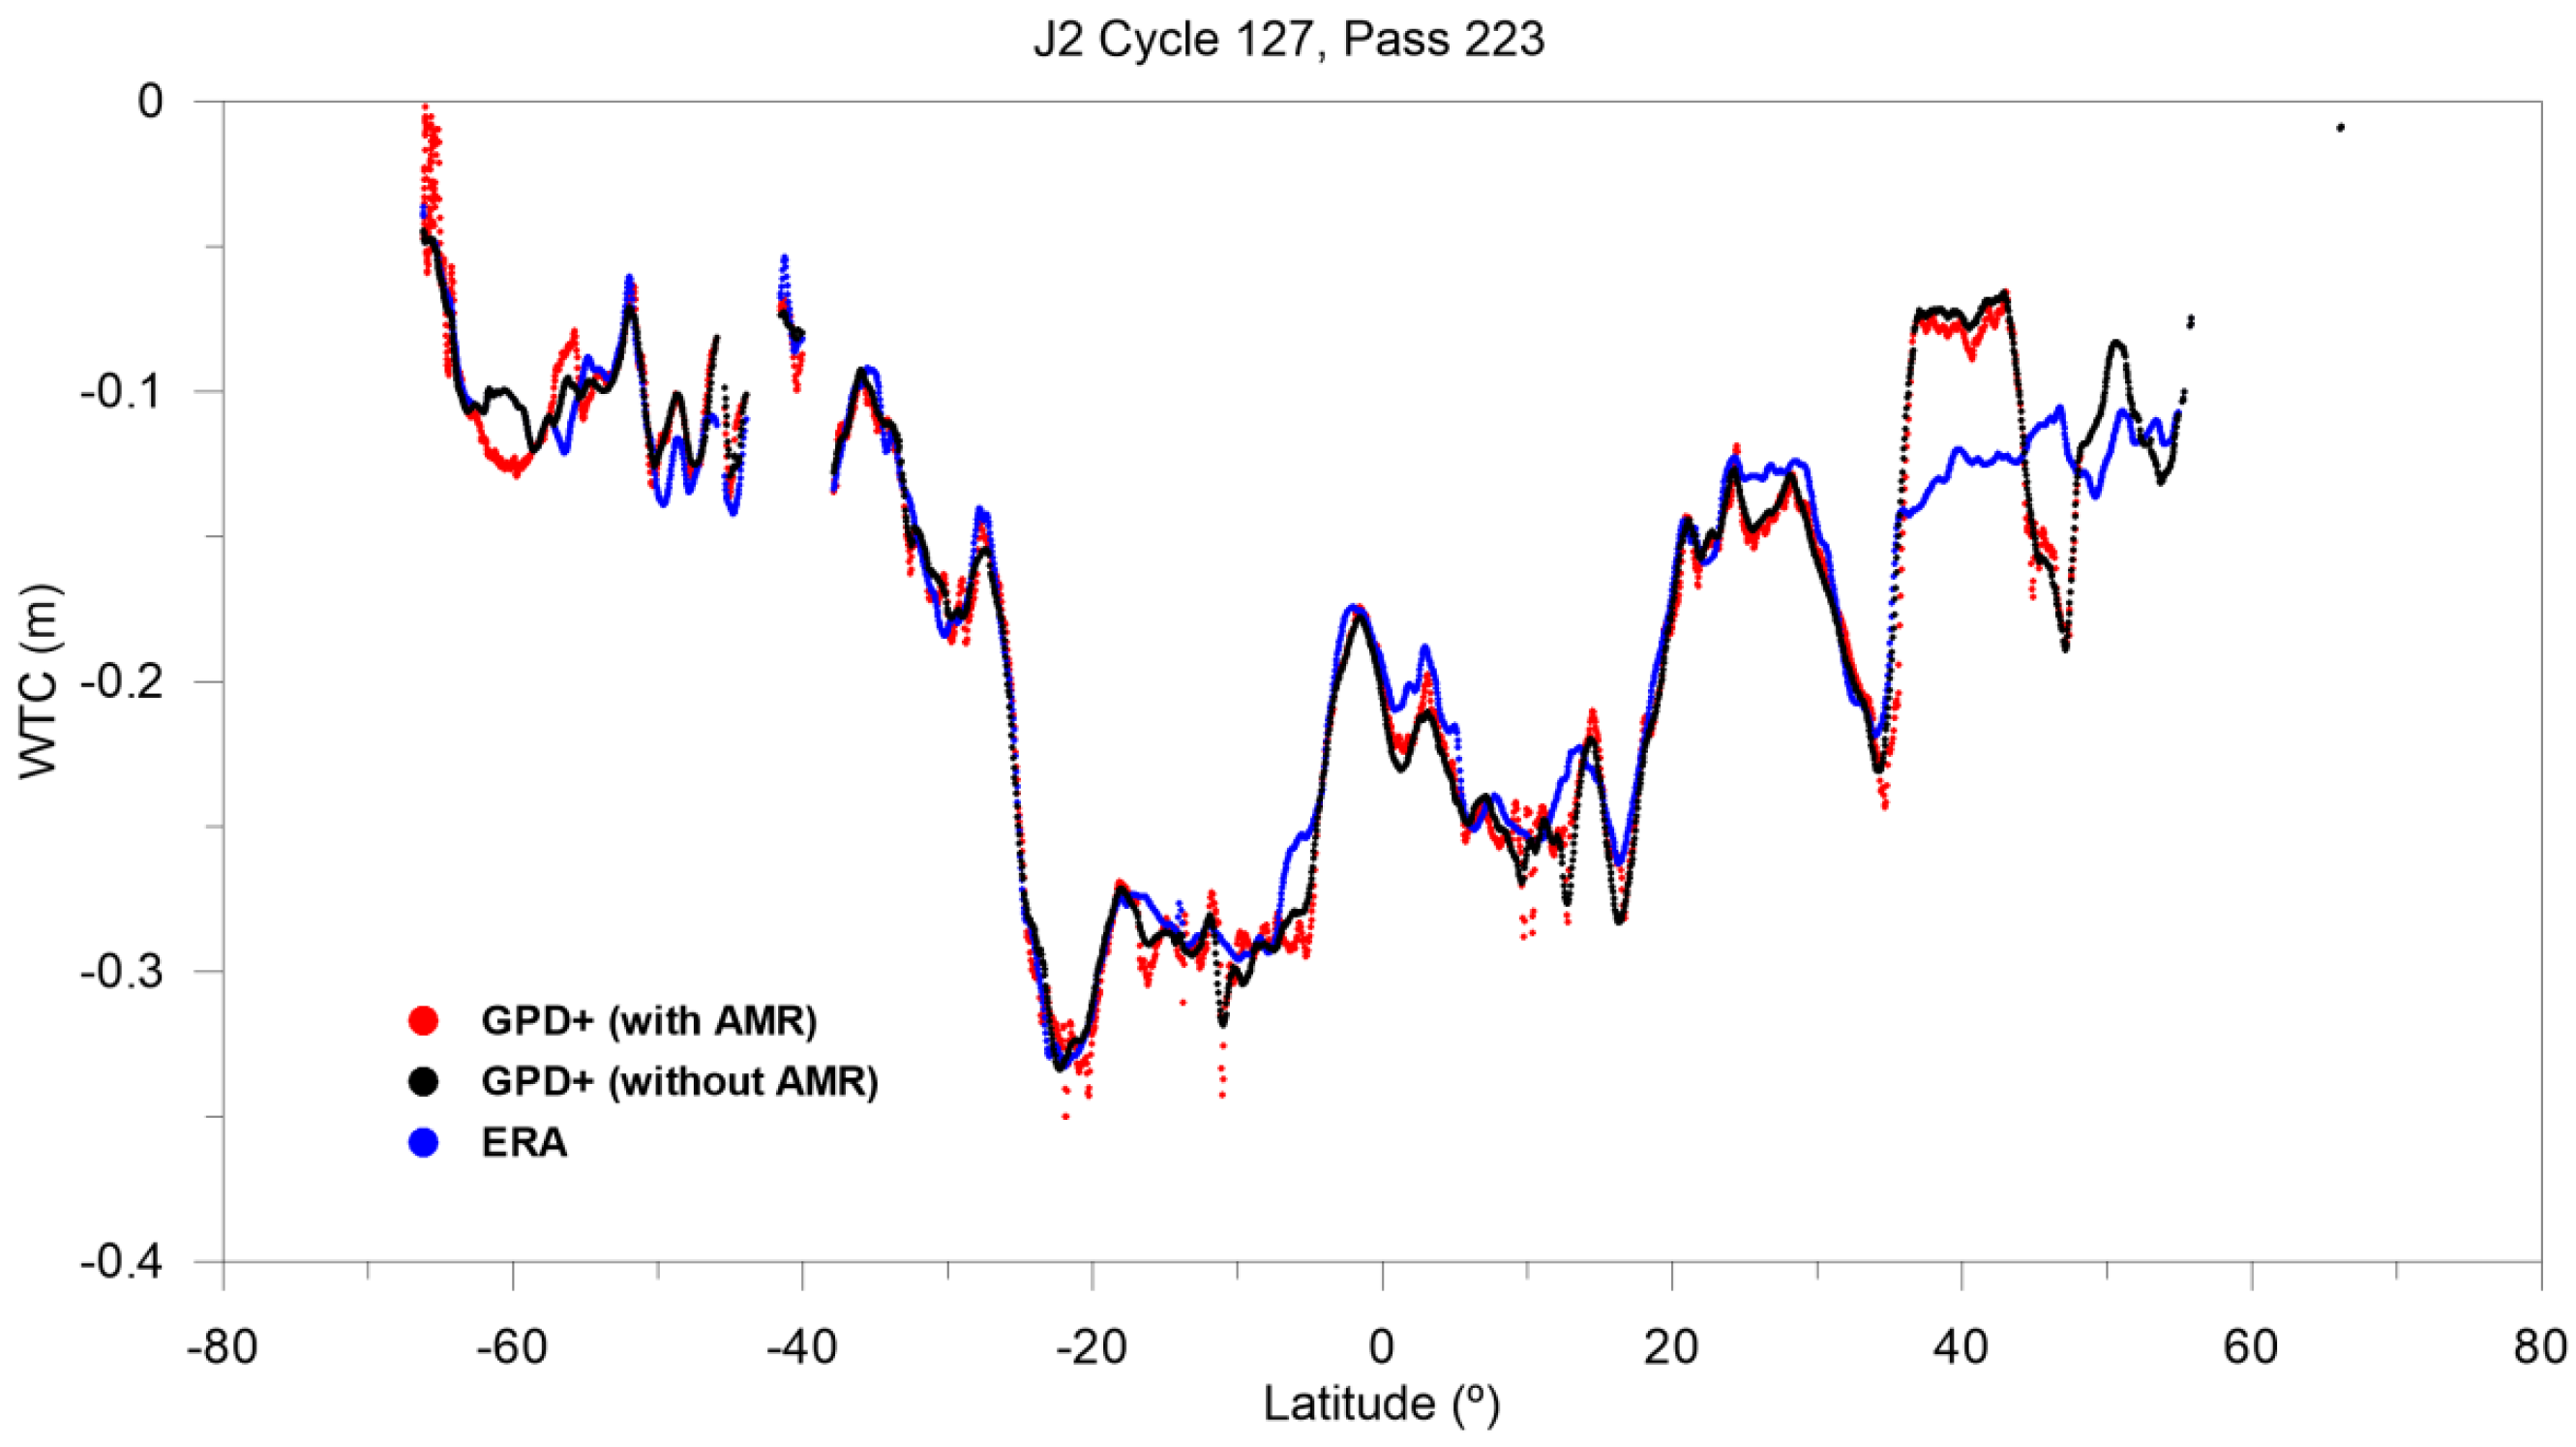
Figure 14 illustrates the two GPD+ versions for J2 cycle 127, pass 223. The striking feature of this figure is how well the GPD+ version without AMR (in black) captures the signal present in AMR (in red) between latitudes 35°–45°N, which is not present in the ECMWF model (in blue).
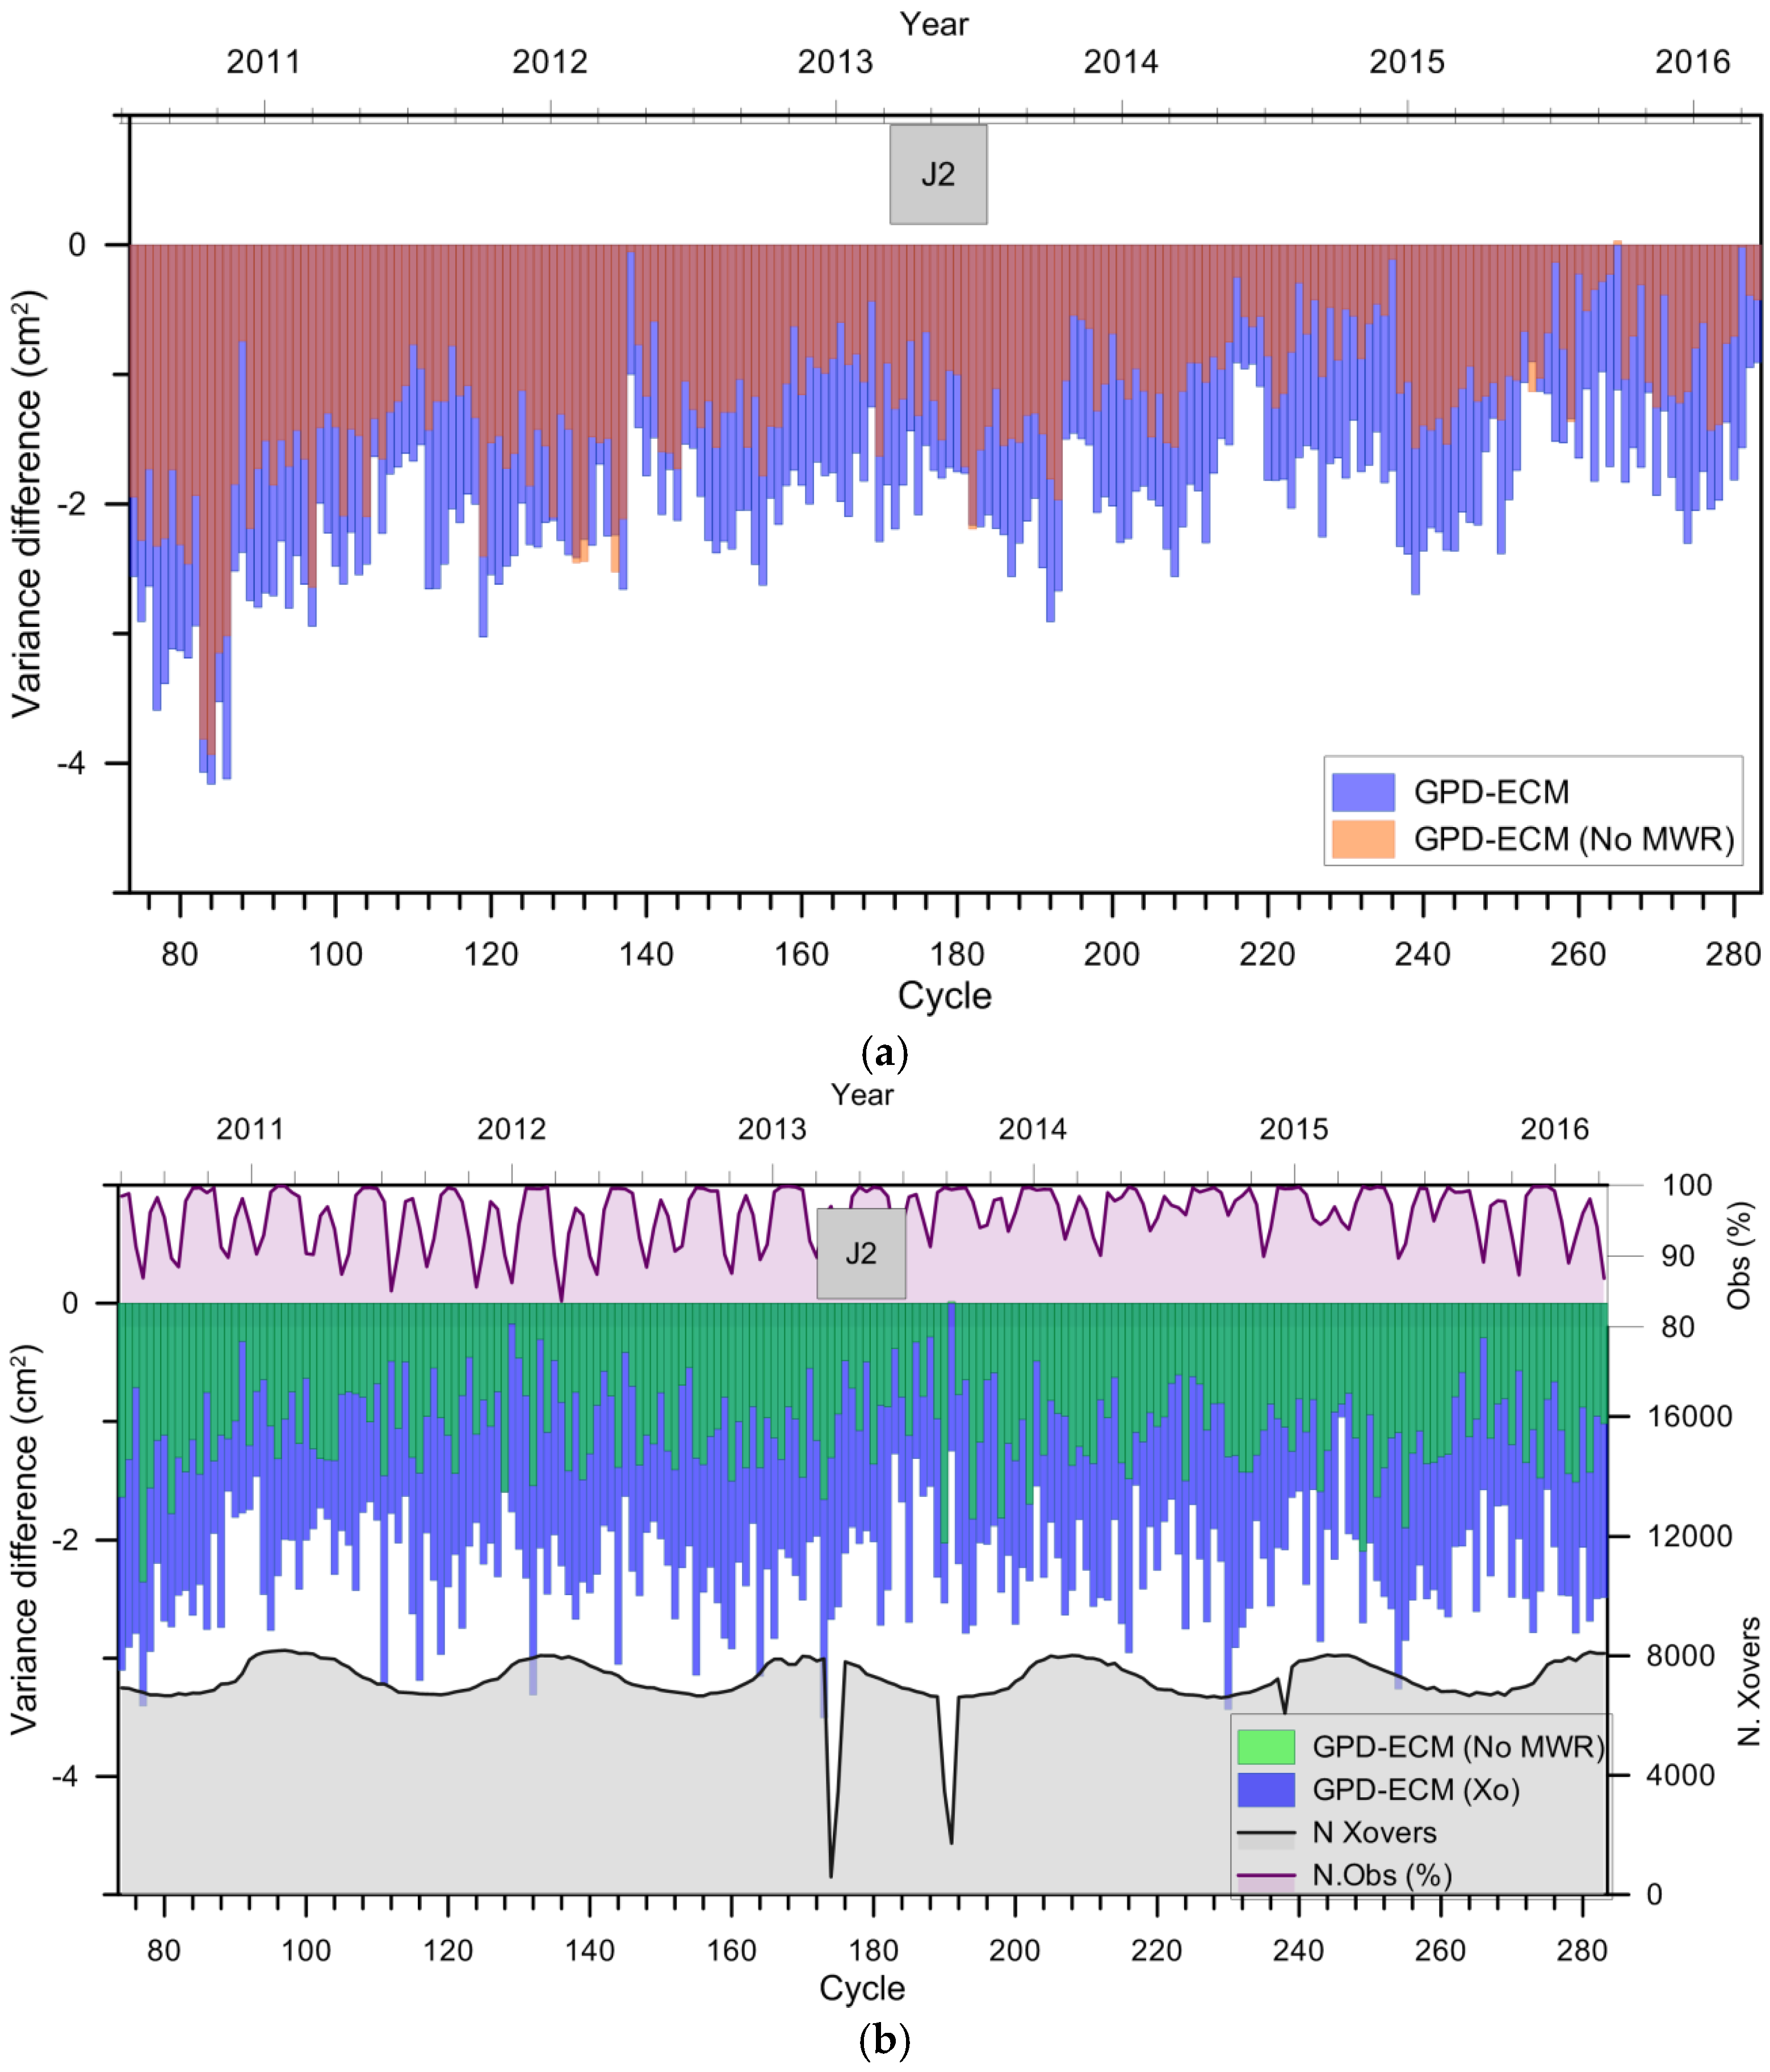
Figure 15 shows the variance differences between SLA datasets computed using both GPD+ WTC versions and the WTC from ECMWF Operational model, both along track (top panel) and at crossovers (bottom panel). Results show that although the correction that incorporates AMR provides the best results in terms of SLA variance reduction with respect to the ECMWF Operational model, the GPD+ version without AMR consistently reduces the SLA variance with respect to the model by about 1 to 2 cm2. This improvement varies from cycle to cycle, with some dependence on the data coverage.
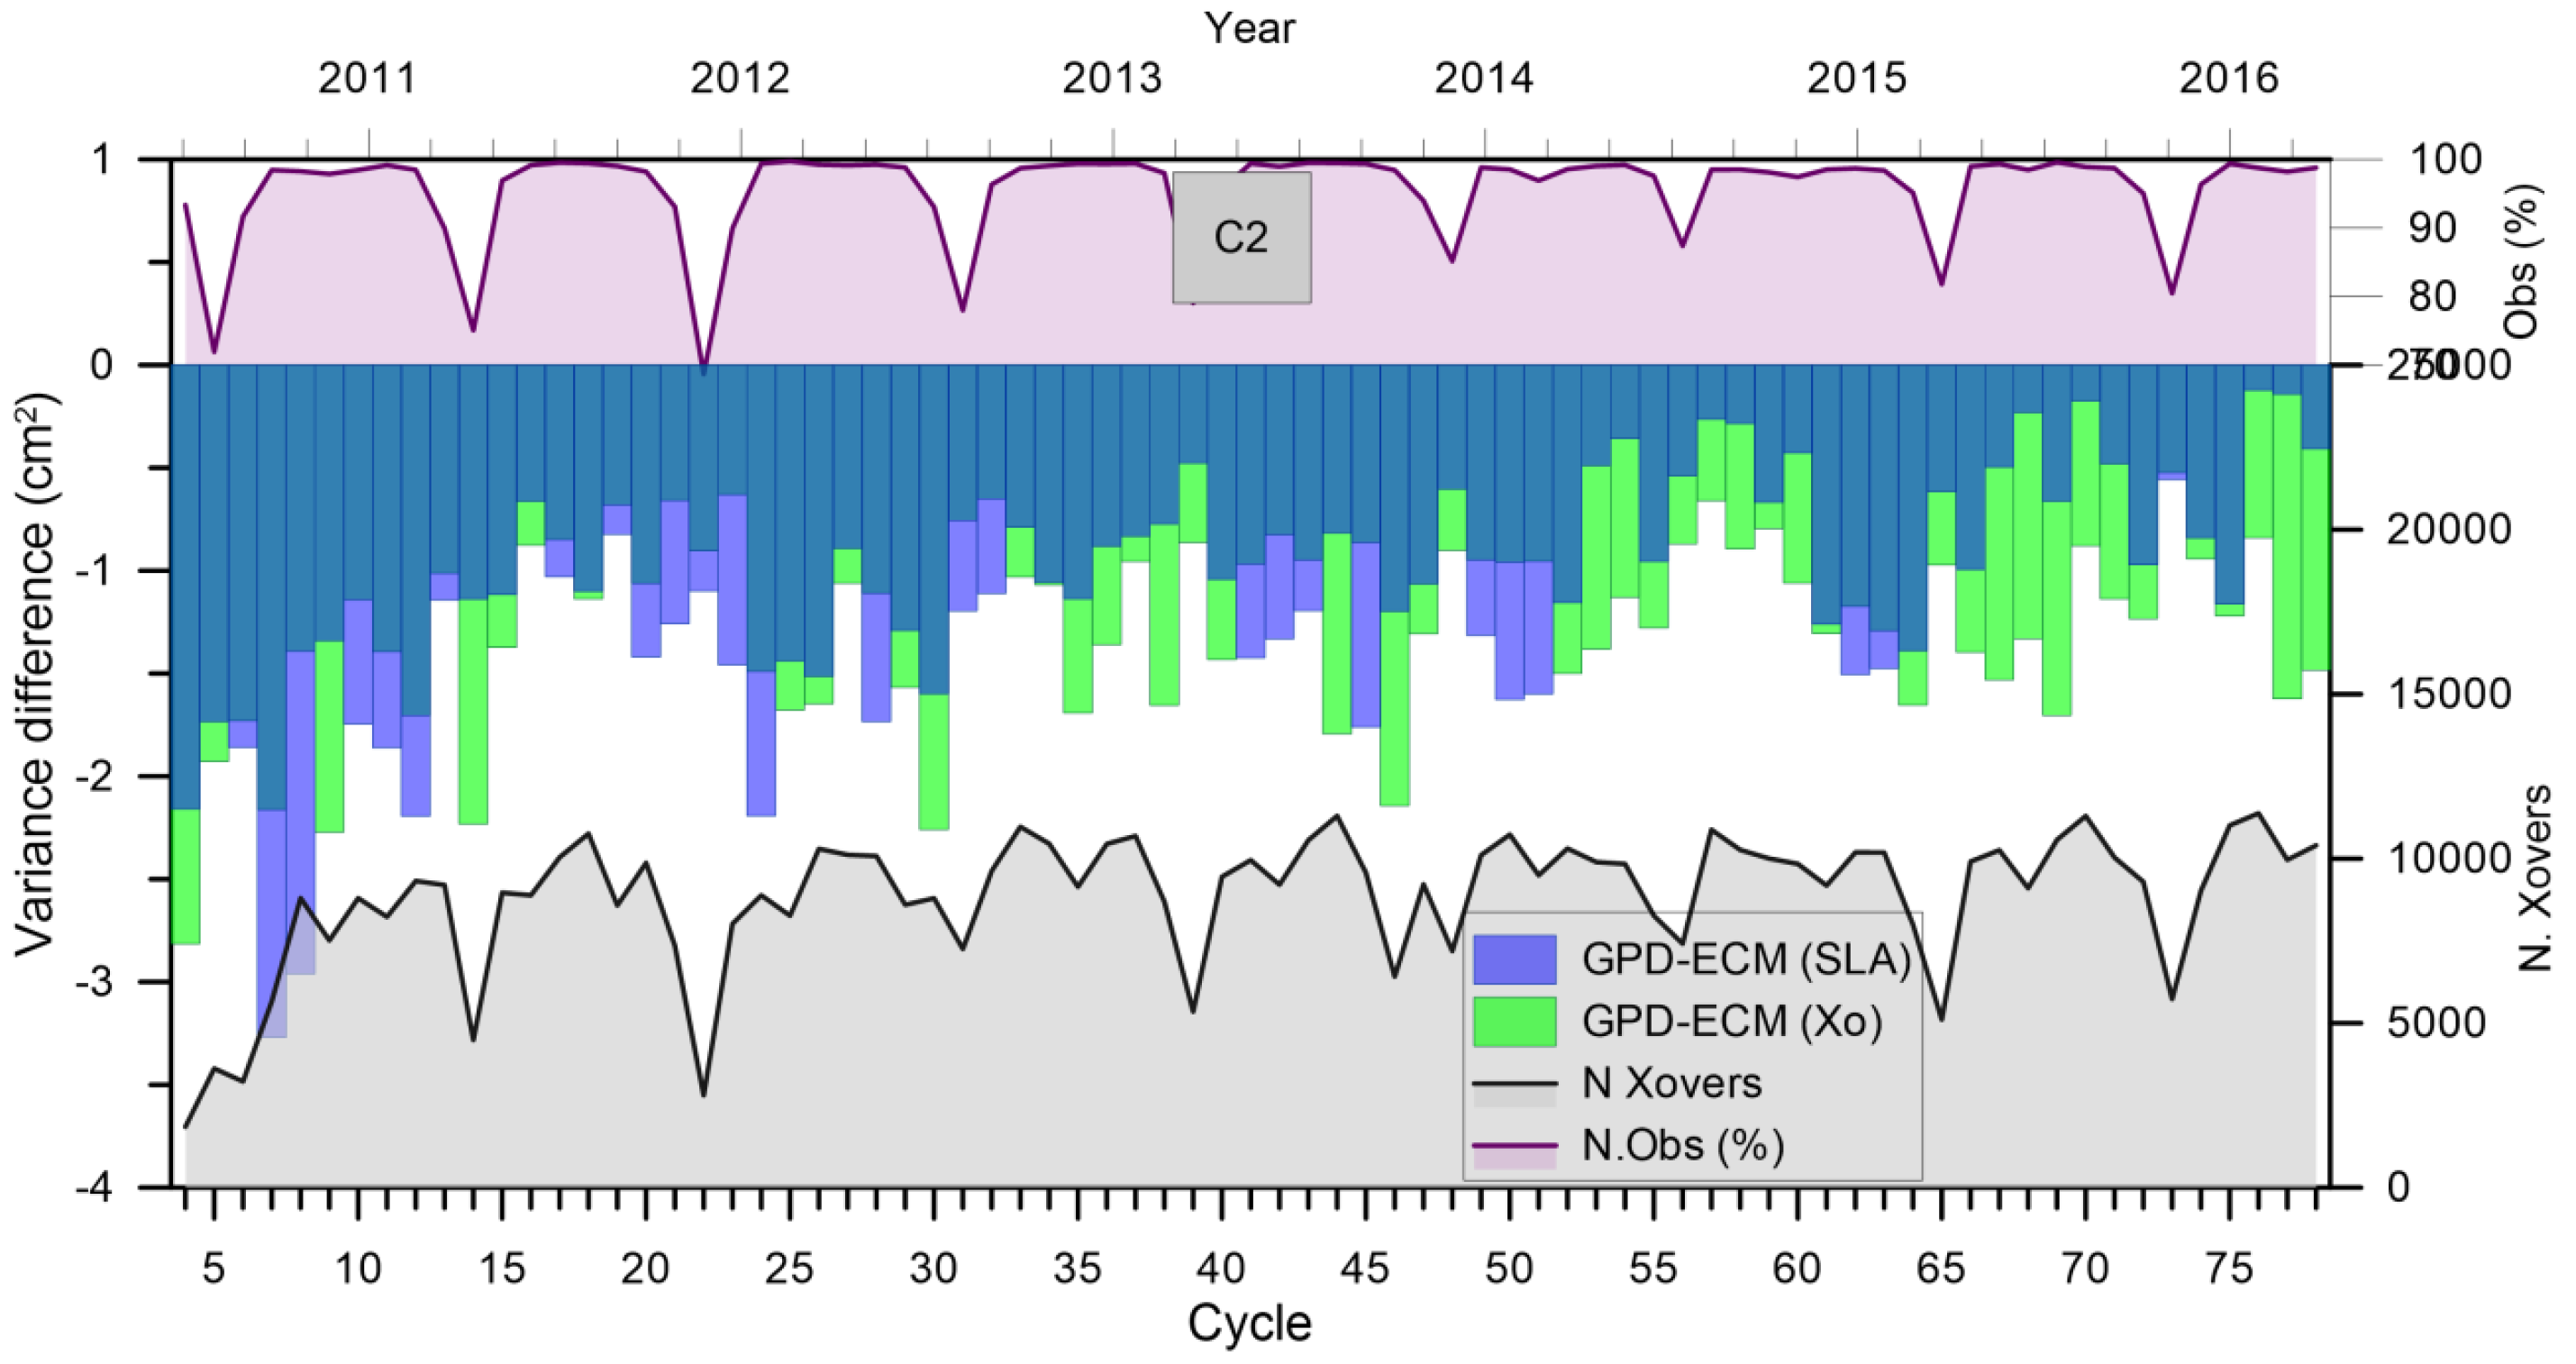
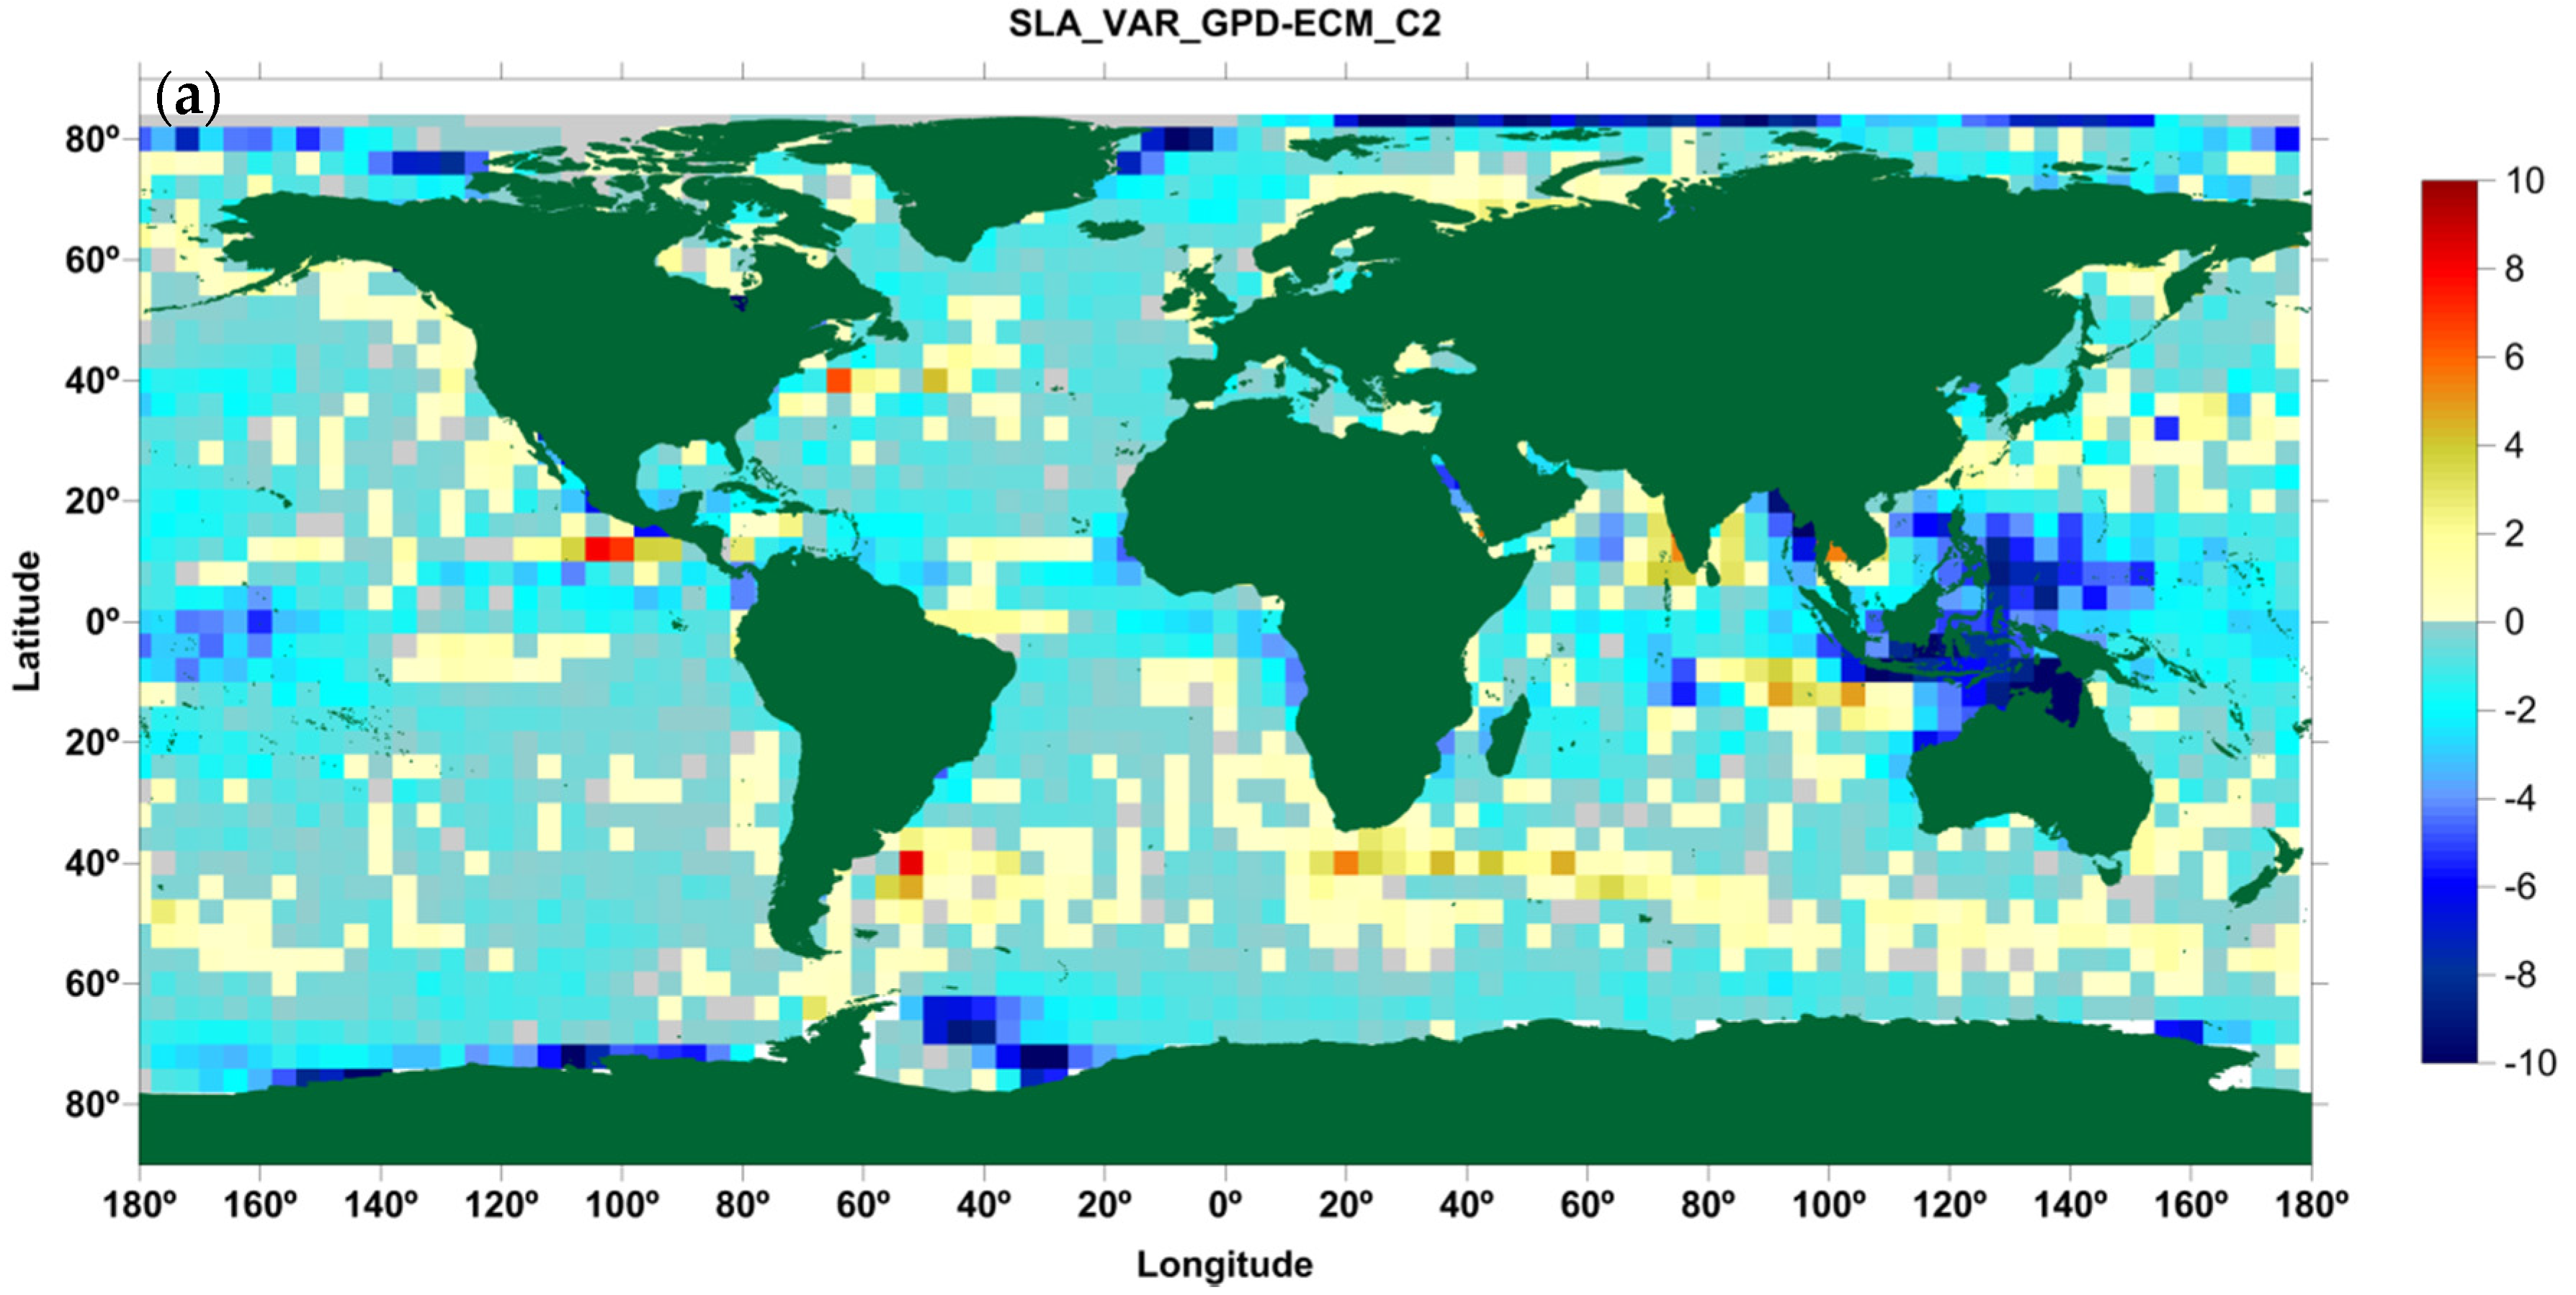
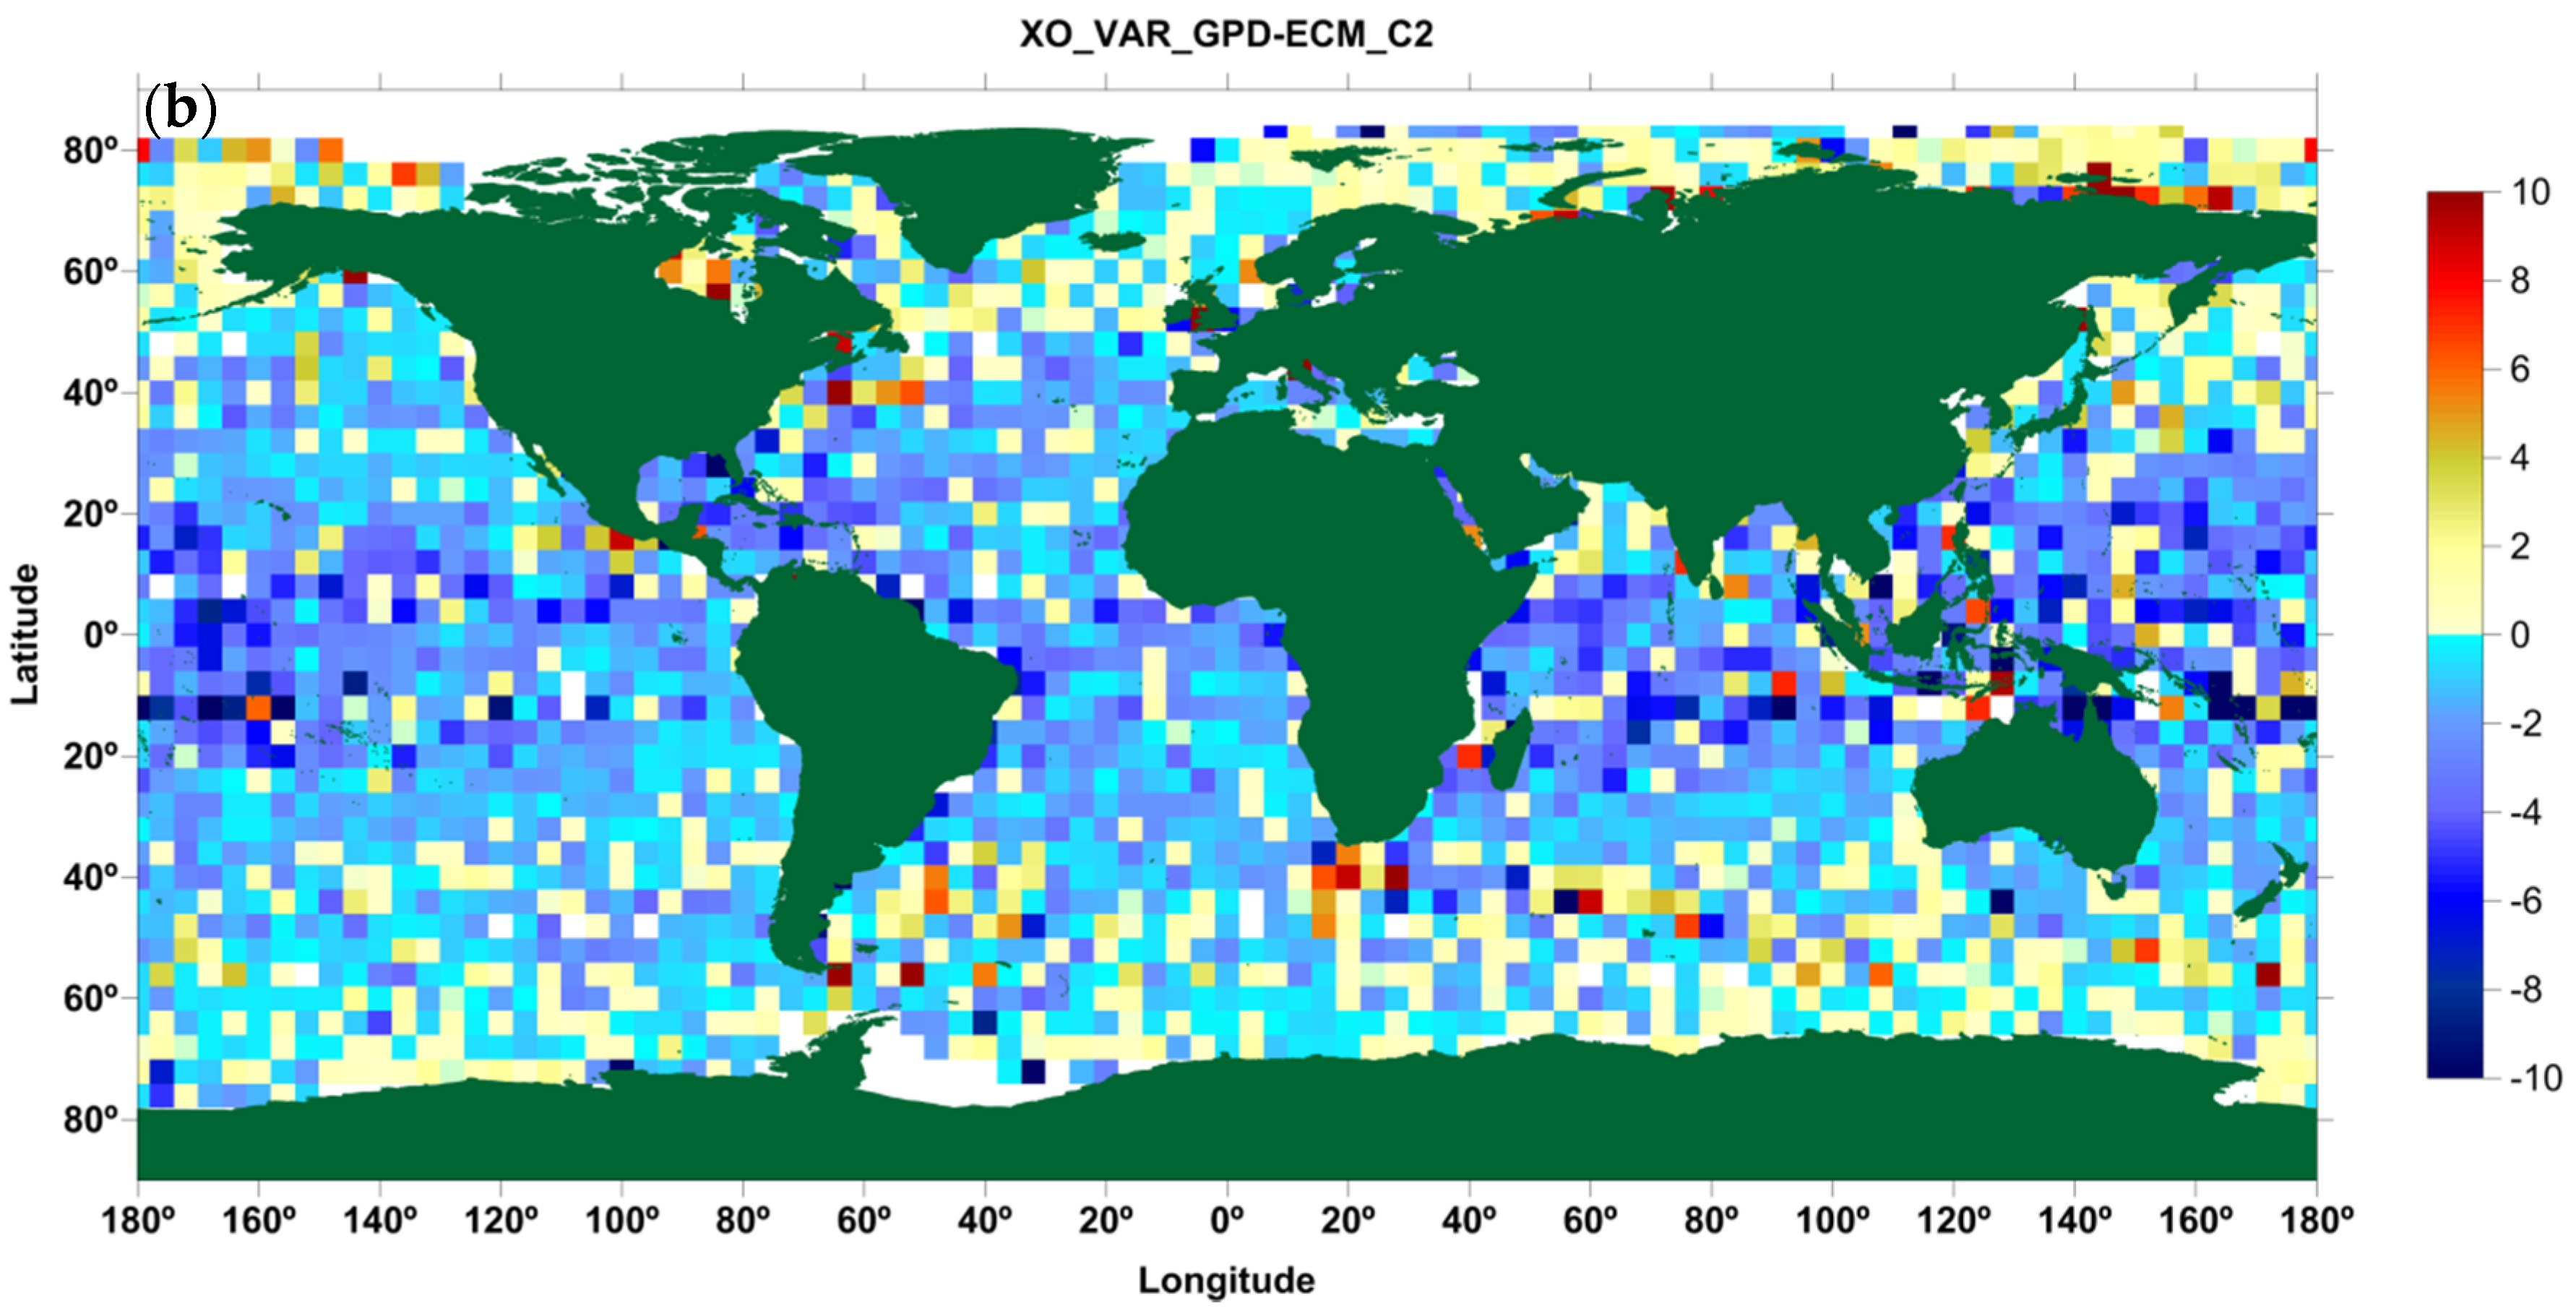
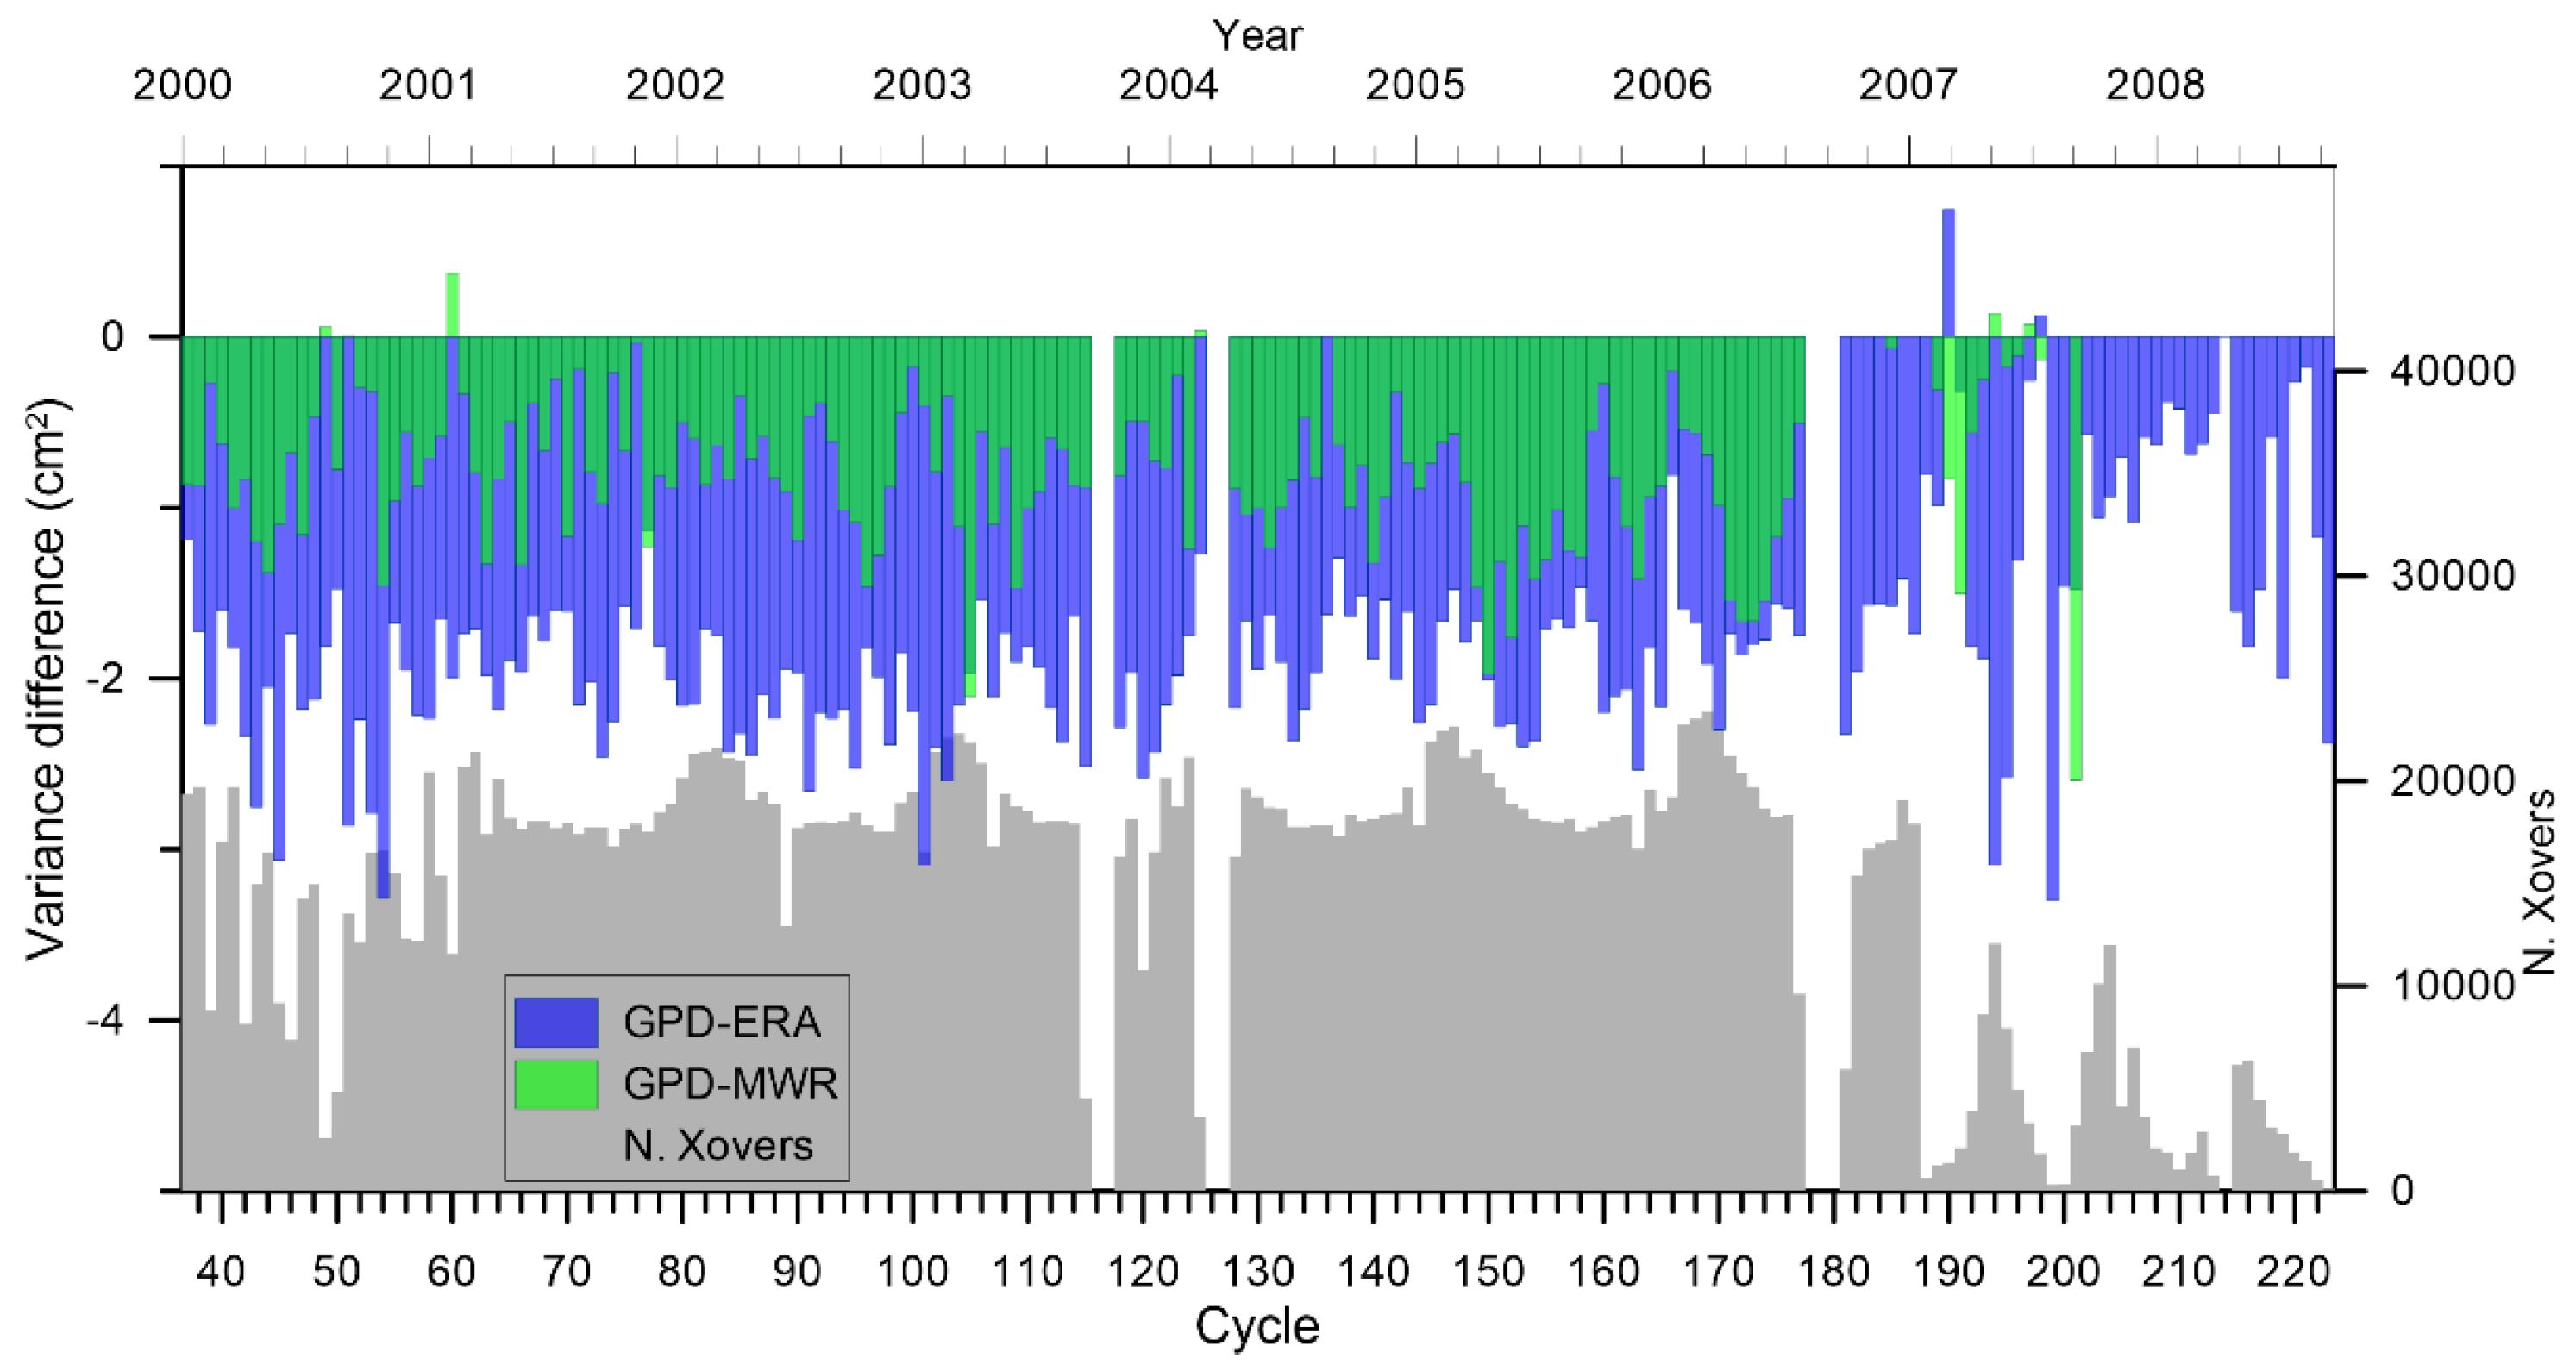
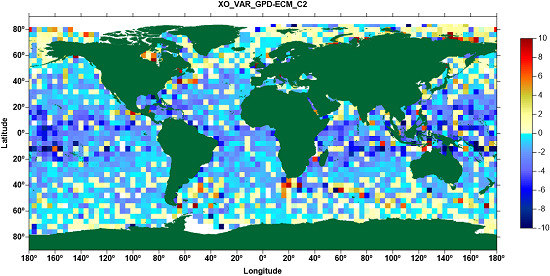
Figure 16, Figure 17 and Figure 18 show the results for the CS-2 SLA variance analysis. In terms of the global analysis for each cycle presented in Figure 16, results for CS-2 are very similar to those for J2, i.e., the GPD+ algorithm consistently reduces the SLA variance with respect to the model by about 1 to 2 cm2. This improvement varies from cycle to cycle, mainly depending on the SI-MWR and GNSS data coverage. Figure 18 shows the spatial pattern of SLA variance difference with respect to ECMWF Operational model, both along-track and at crossovers. These two complementary diagnostics, particularly the latter, indicate a clear SLA variance reduction in most regions. Finally, Figure 17 evidences that the GPD+ WTC is a clear improvement with respect to the baseline WTC, both in the polar regions and in the coastal zones.

3.2. Geosat Follow-on

The GPD+ WTC for GFO has been generated globally as described in Section 2. The dataset comprises the period from 2000.0 to 2008.7, i.e., cycles 37 to 223, as available in RADS, with some gaps within this period due to missing cycles (116 to 117, 126 to 127 and 178 to 180).
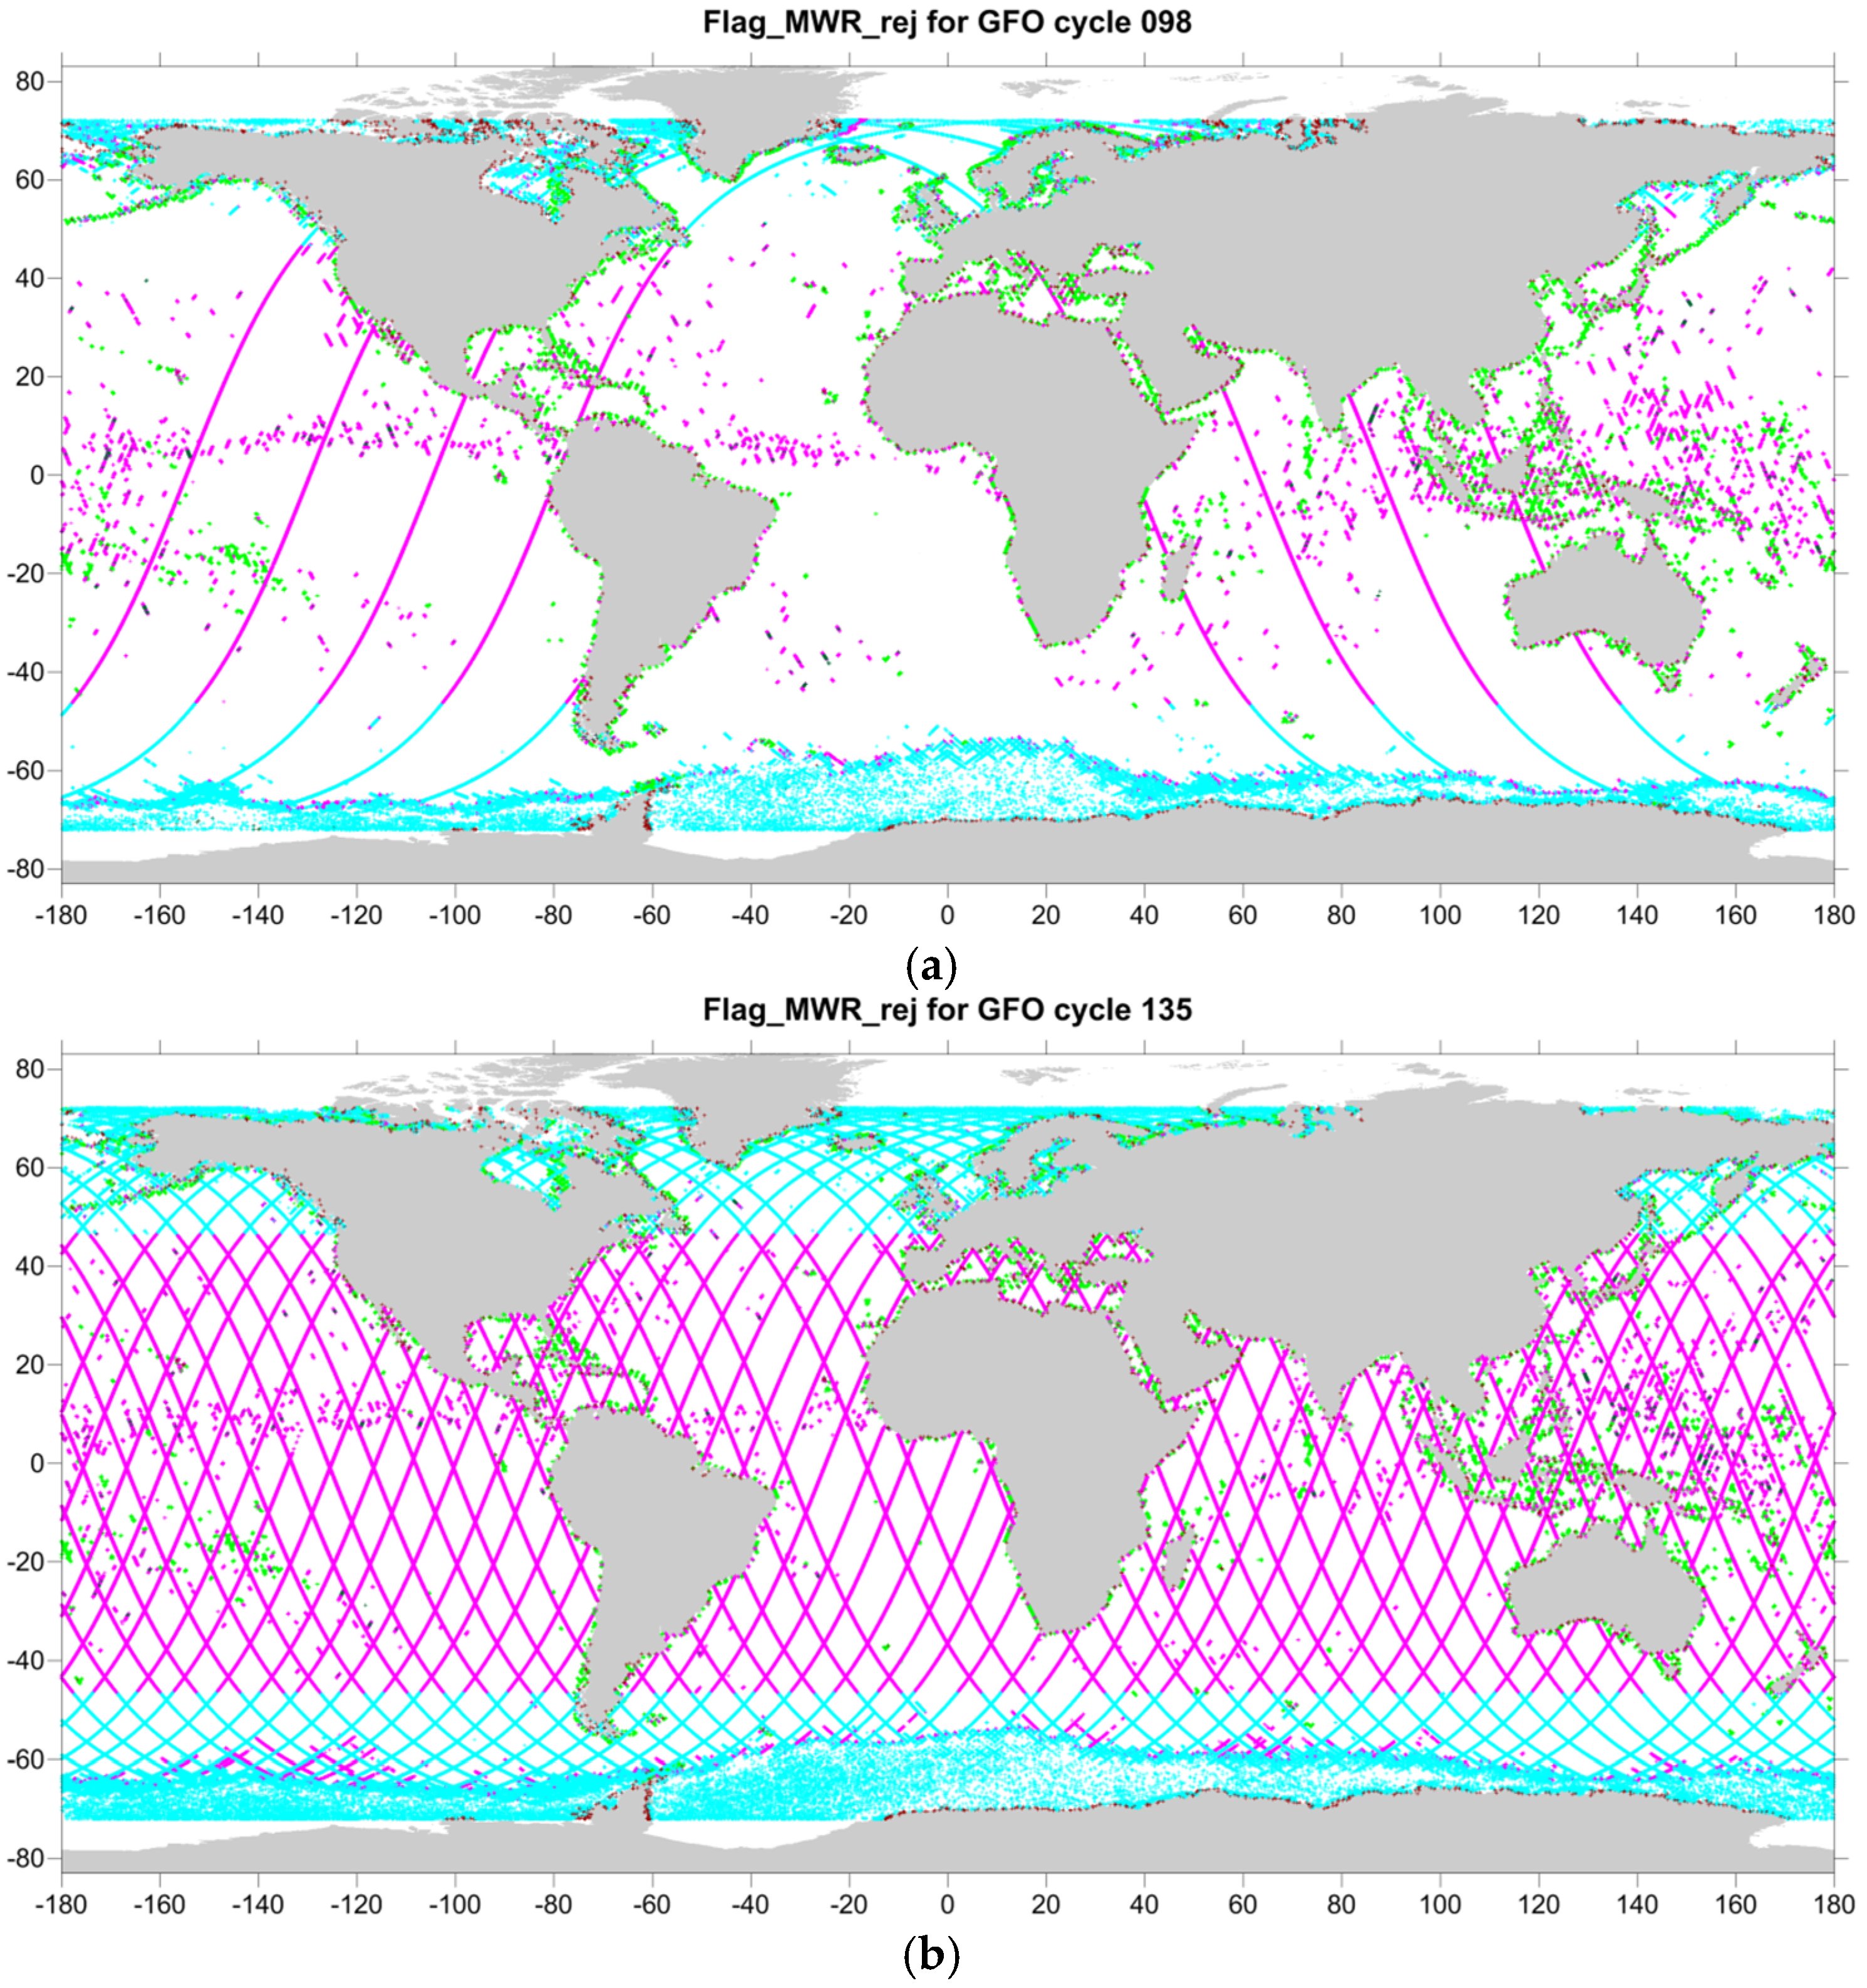
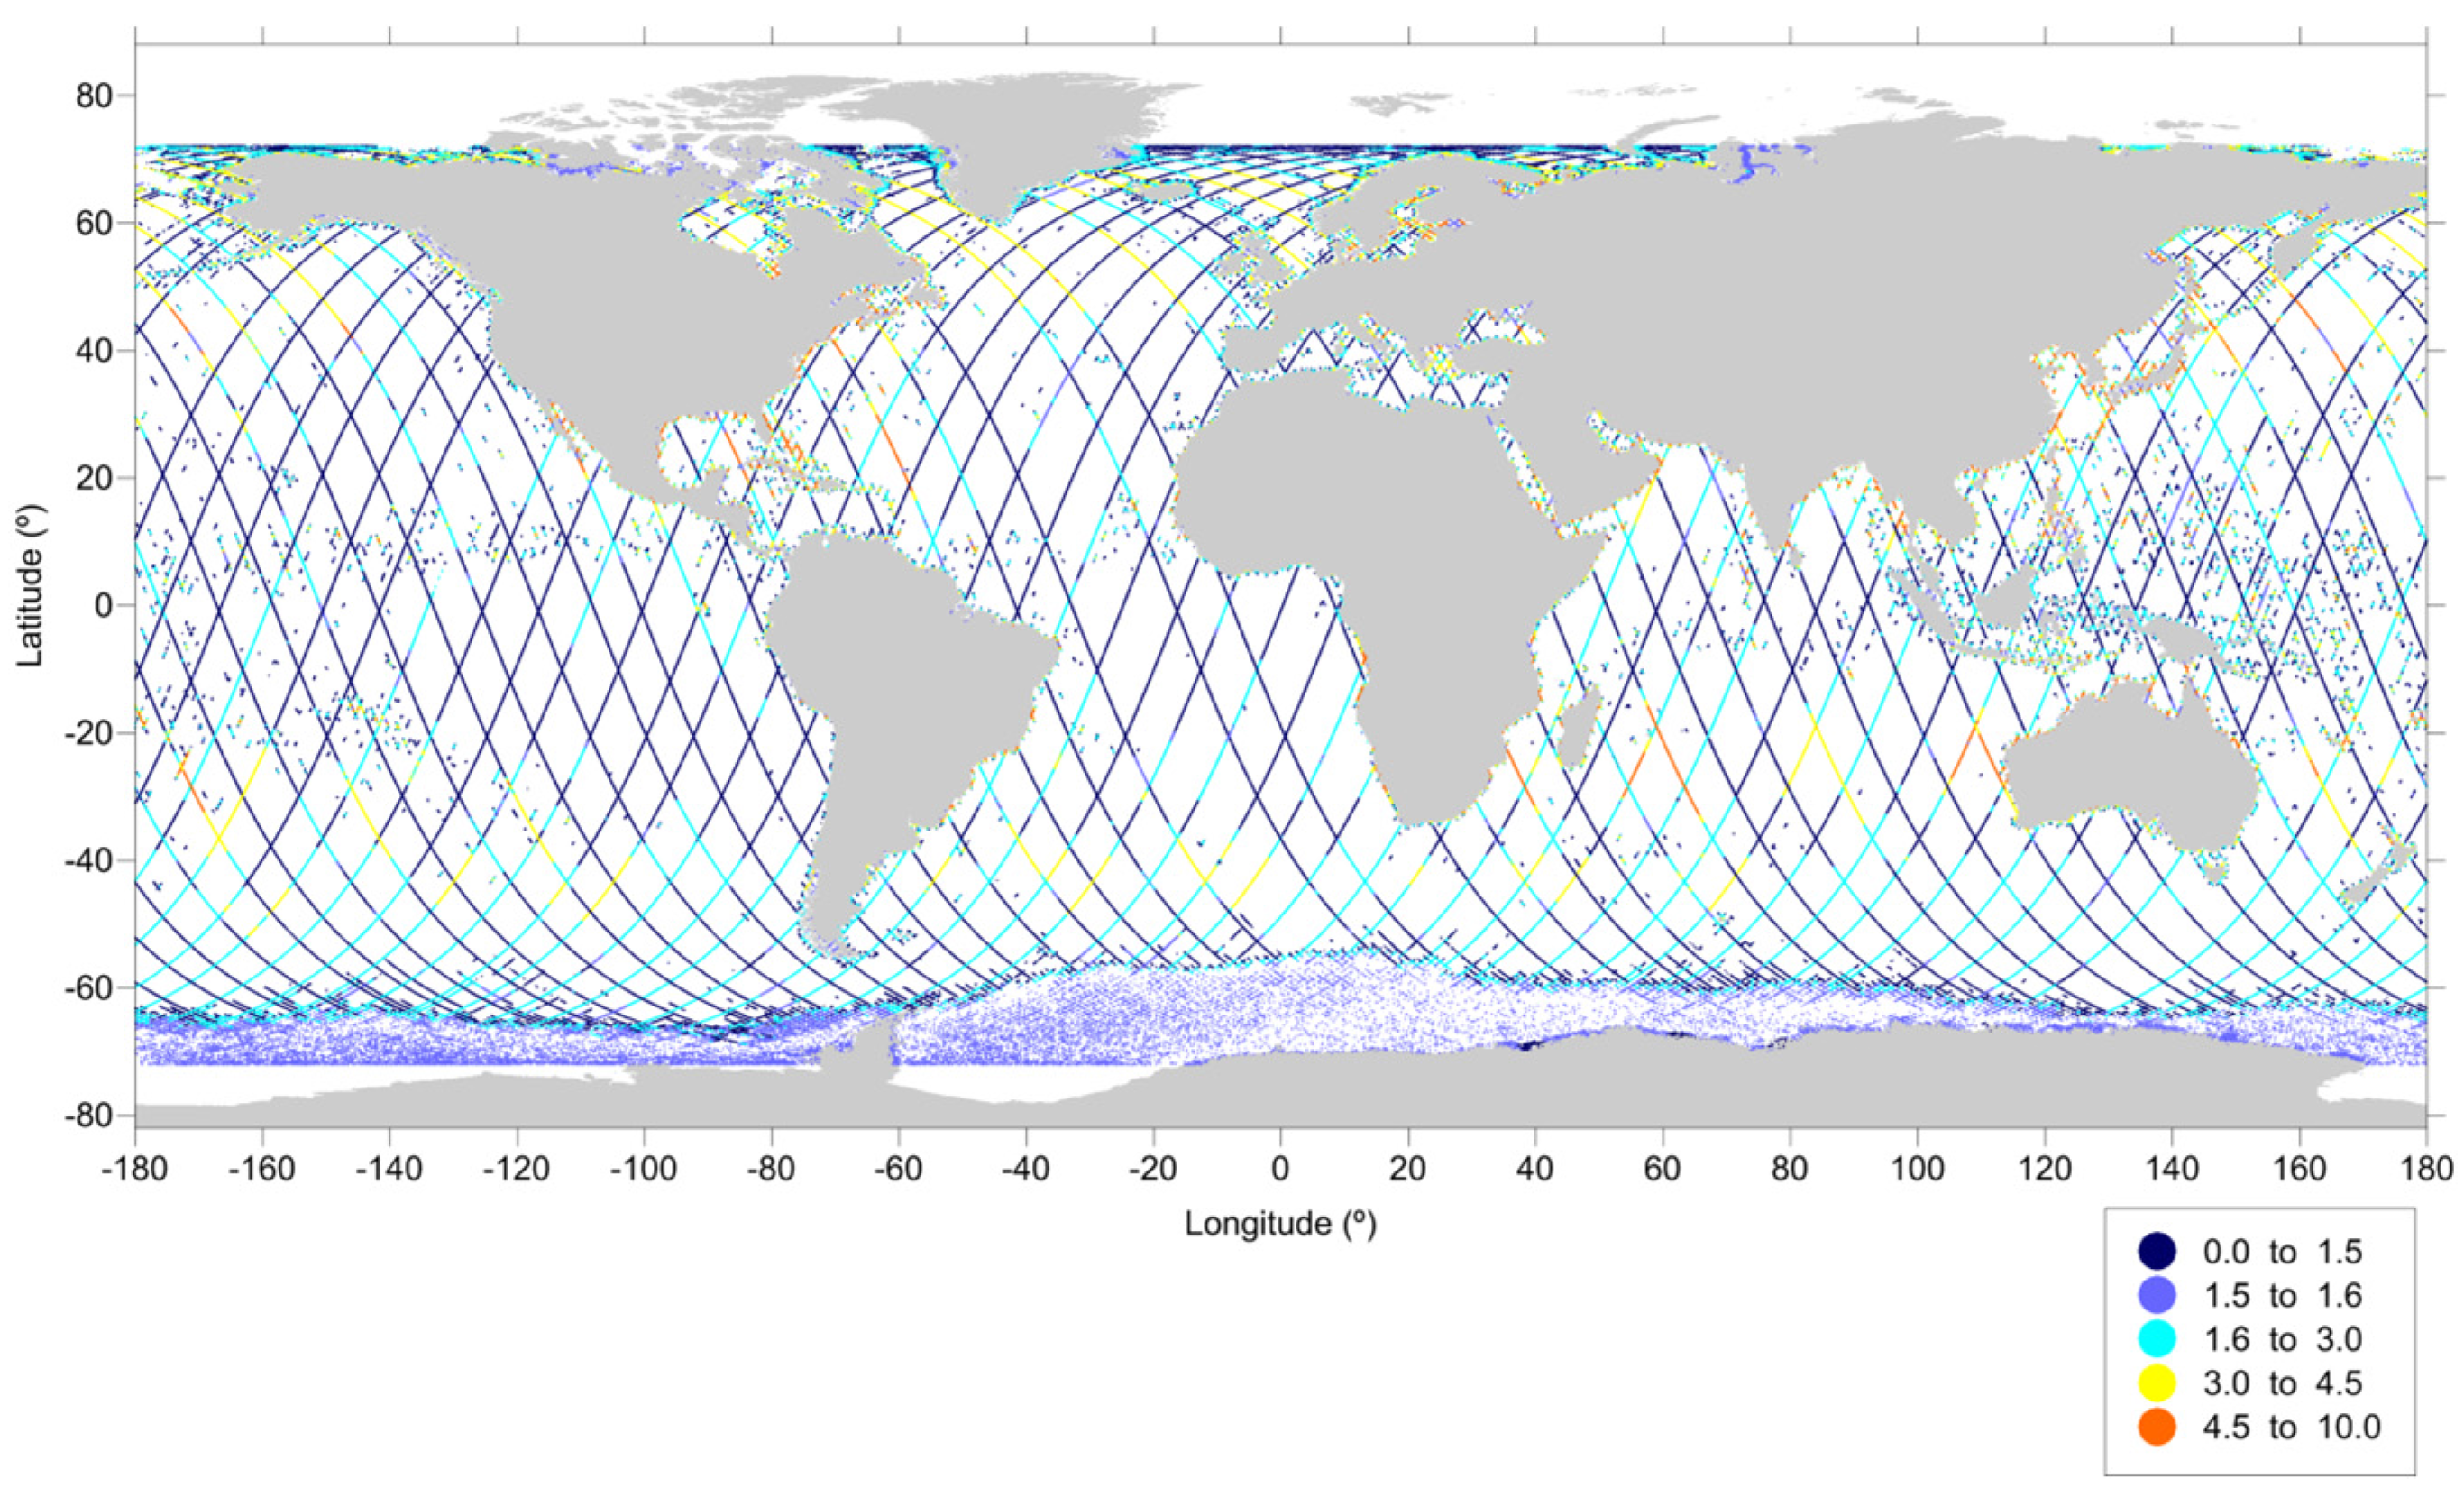
Figure 19 illustrates the along-track points for which flag_MWR_rej is not zero i.e., the points where new values of the wet tropospheric correction are to be estimated using the GPD+ methodology, for GFO cycles 98 and 138. In addition to ocean points, the first land point of each track is also selected to help the interpolation of the WTC to higher data rates, provided it is within 50 km from the coastline (brown points in Figure 2). This figure demonstrates the global coverage of the GPD+ algorithm, including open-ocean, high latitudes and coastal zones.
While for cycle 98 the GPD+ estimates are computed mainly for along-track points with WTC measurements contaminated by land (light green), ice (blue), and rain contamination (scattered pink points) mainly in the 20°S–20°N latitudinal band, with only four complete orbits with invalid WTC (also shown in pink) probably due to instrument malfunctioning, for cycle 135 the GPD+ algorithm computes WTC estimates for nearly 25% of the total along-track data. The majority of these GPD+ estimates are computed for along-track points with invalid MWR-derived WTC values due to instrument malfunctioning/manoeuvres, emphasising one of the advantages of the methodology. For GFO cycle 136, for example, the GPD+ estimates are computed for ~99.7% of the along-track points.
Figure 20 shows, for this last example, the formal error associated with the GPD+ WTC calculated for GFO cycle 135, provided by the objective analysis scheme. It can be seen that the majority of the GPD+ estimates have a relatively small associated formal error, with values less than 2 cm.
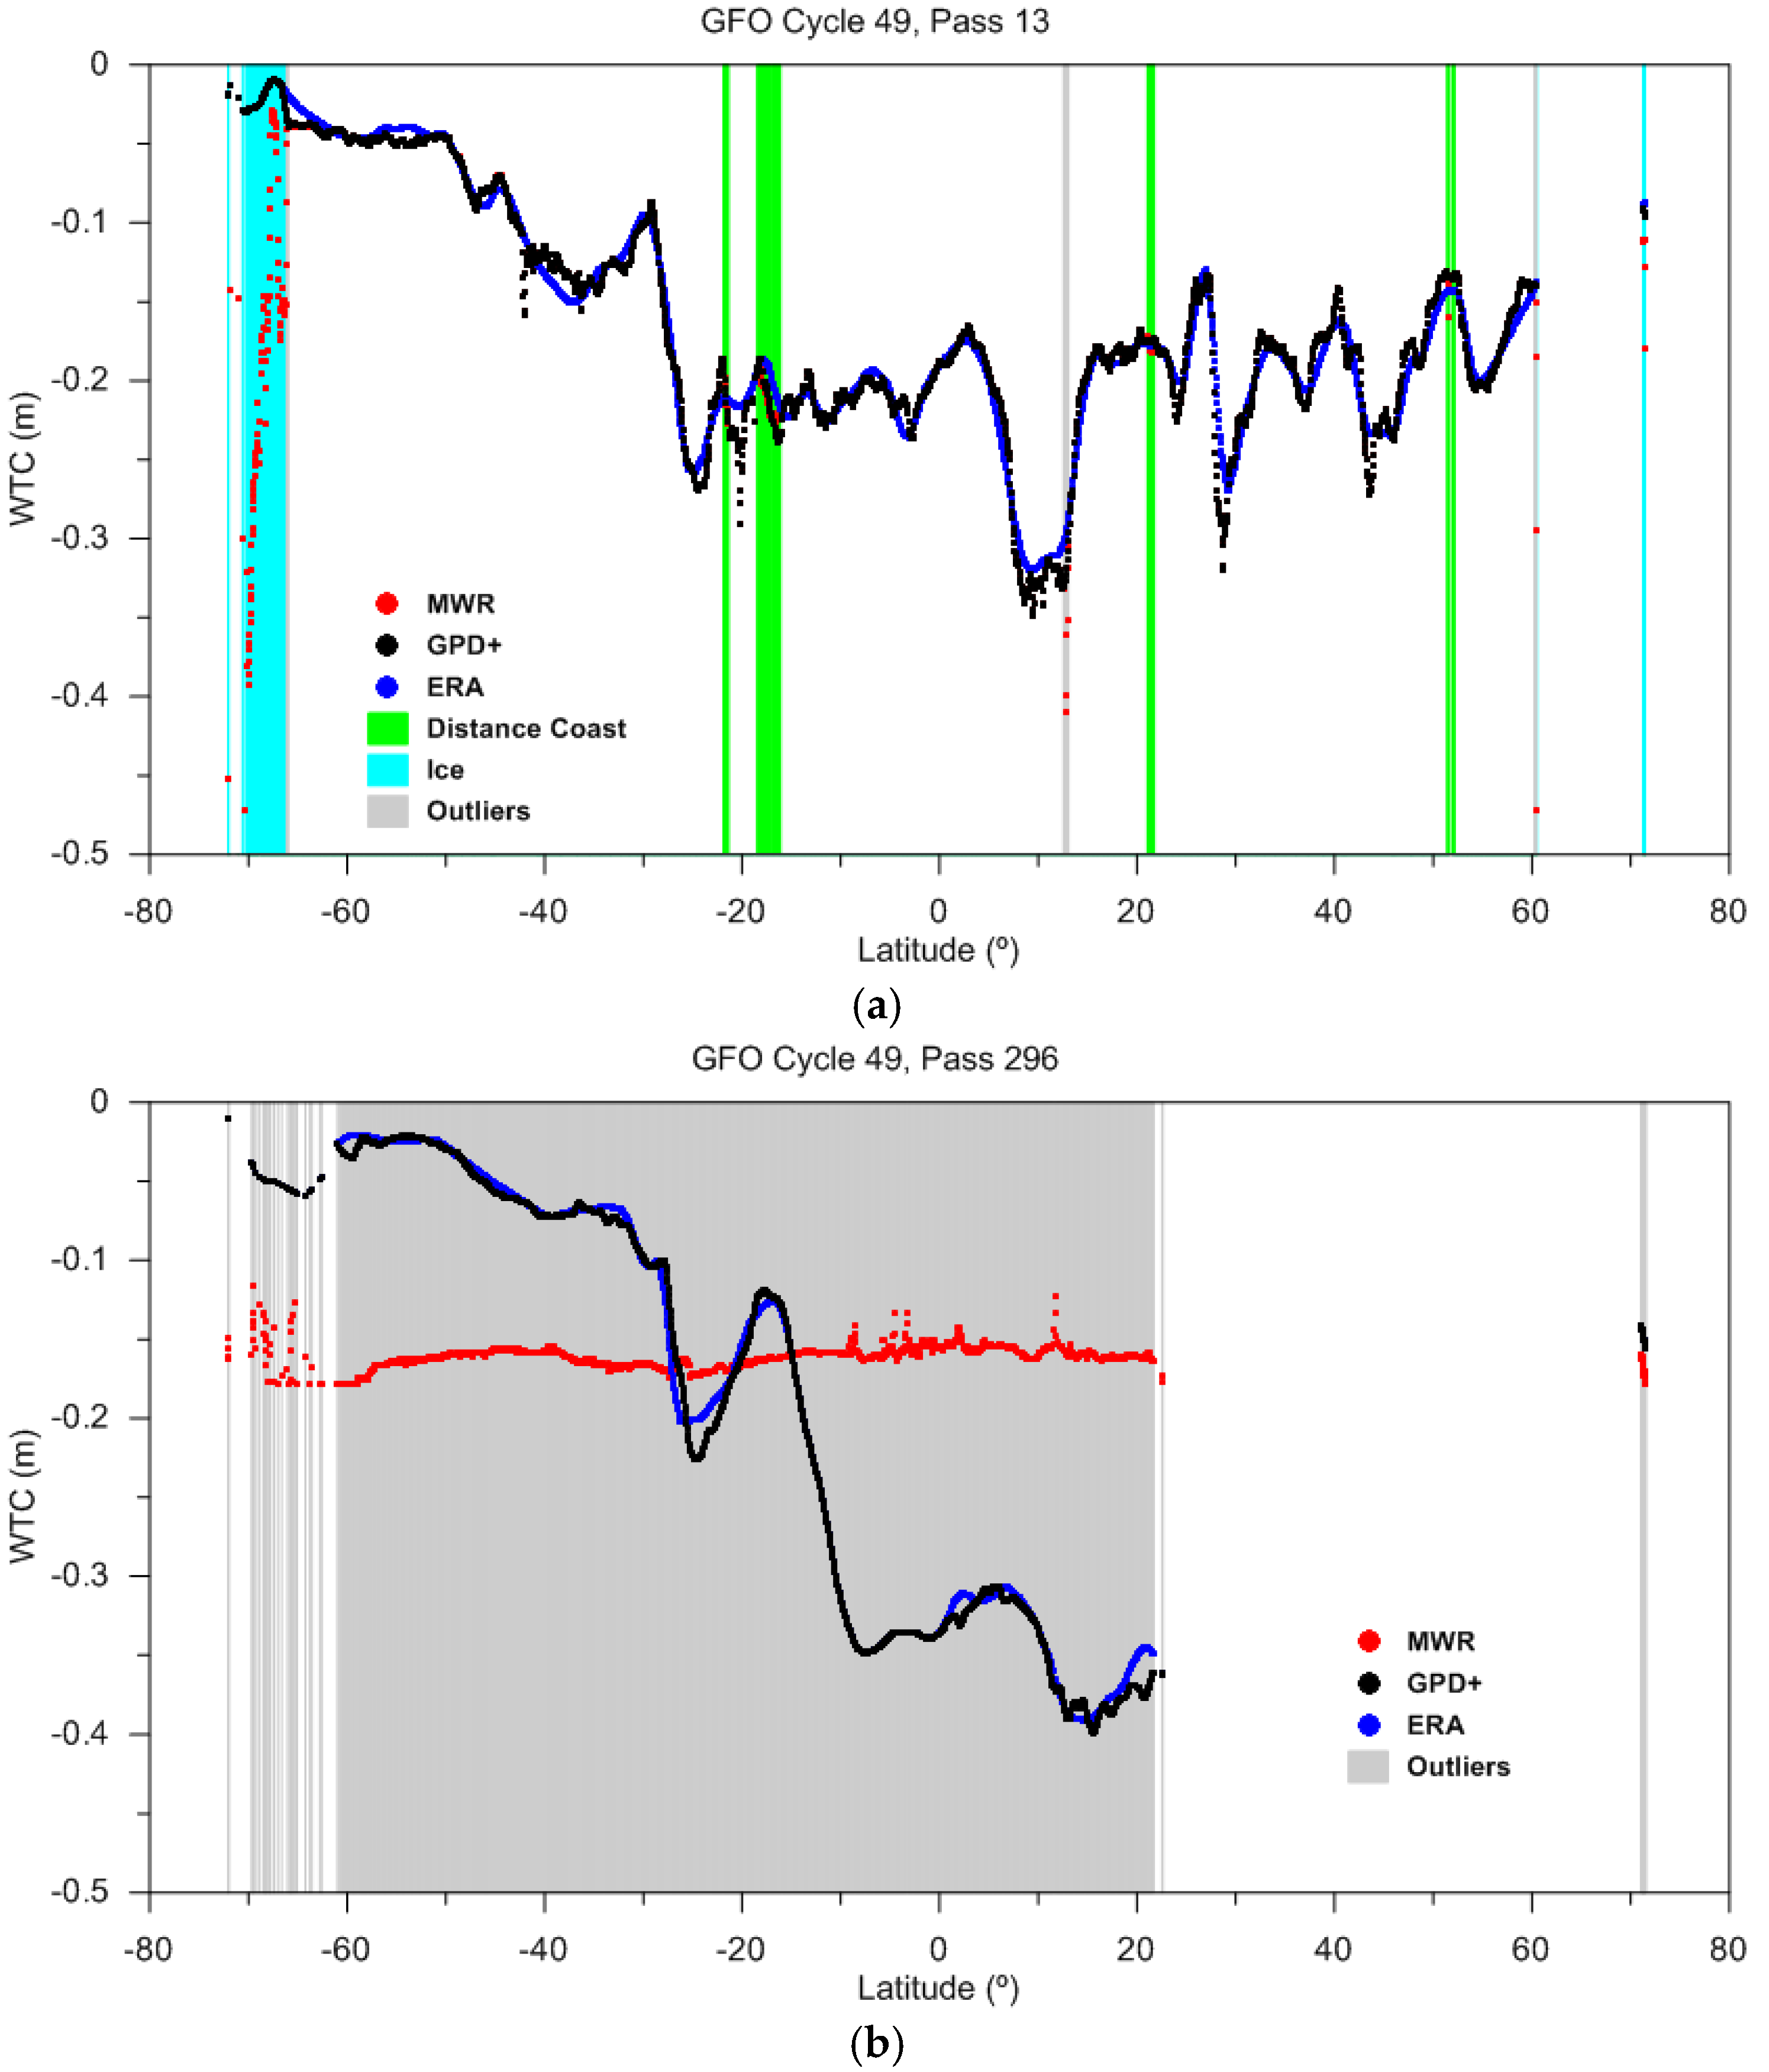
Figure 21 and Figure 22 show examples of the along-track GPD+ WTC calculated for Geosat Follow-On. In both figures, the GPD+ WTC is shown in black, the ERA-derived WTC in blue and the MWR-derived WTC in red. The colour bars indicate MWR measurements flagged as invalid due, for example, to ice contamination (cyan) or to land proximity (distance from coast less than 30 km, light green) or rejected by outlier detection criteria or with the MWR WTC outside limits (outside the range −0.5 m–0.0 m) (grey).
Top panel of Figure 21 shows the results for pass 13, cycle 49, for which no MWR anomaly has been detected and all invalid MWR-derived WTC values have been correctly flagged. Bottom panel shows the results for pass 296, for which an anomalous MWR-derived WTC is observed. This anomaly is seen from pass 292 to 441 and these anomalous measurements are detected by the rejection criteria implemented in the GPD+ methodology. Therefore, this anomaly does not affect the GPD+ WTC, which for this period is based on SI-MWR and GNSS observations.
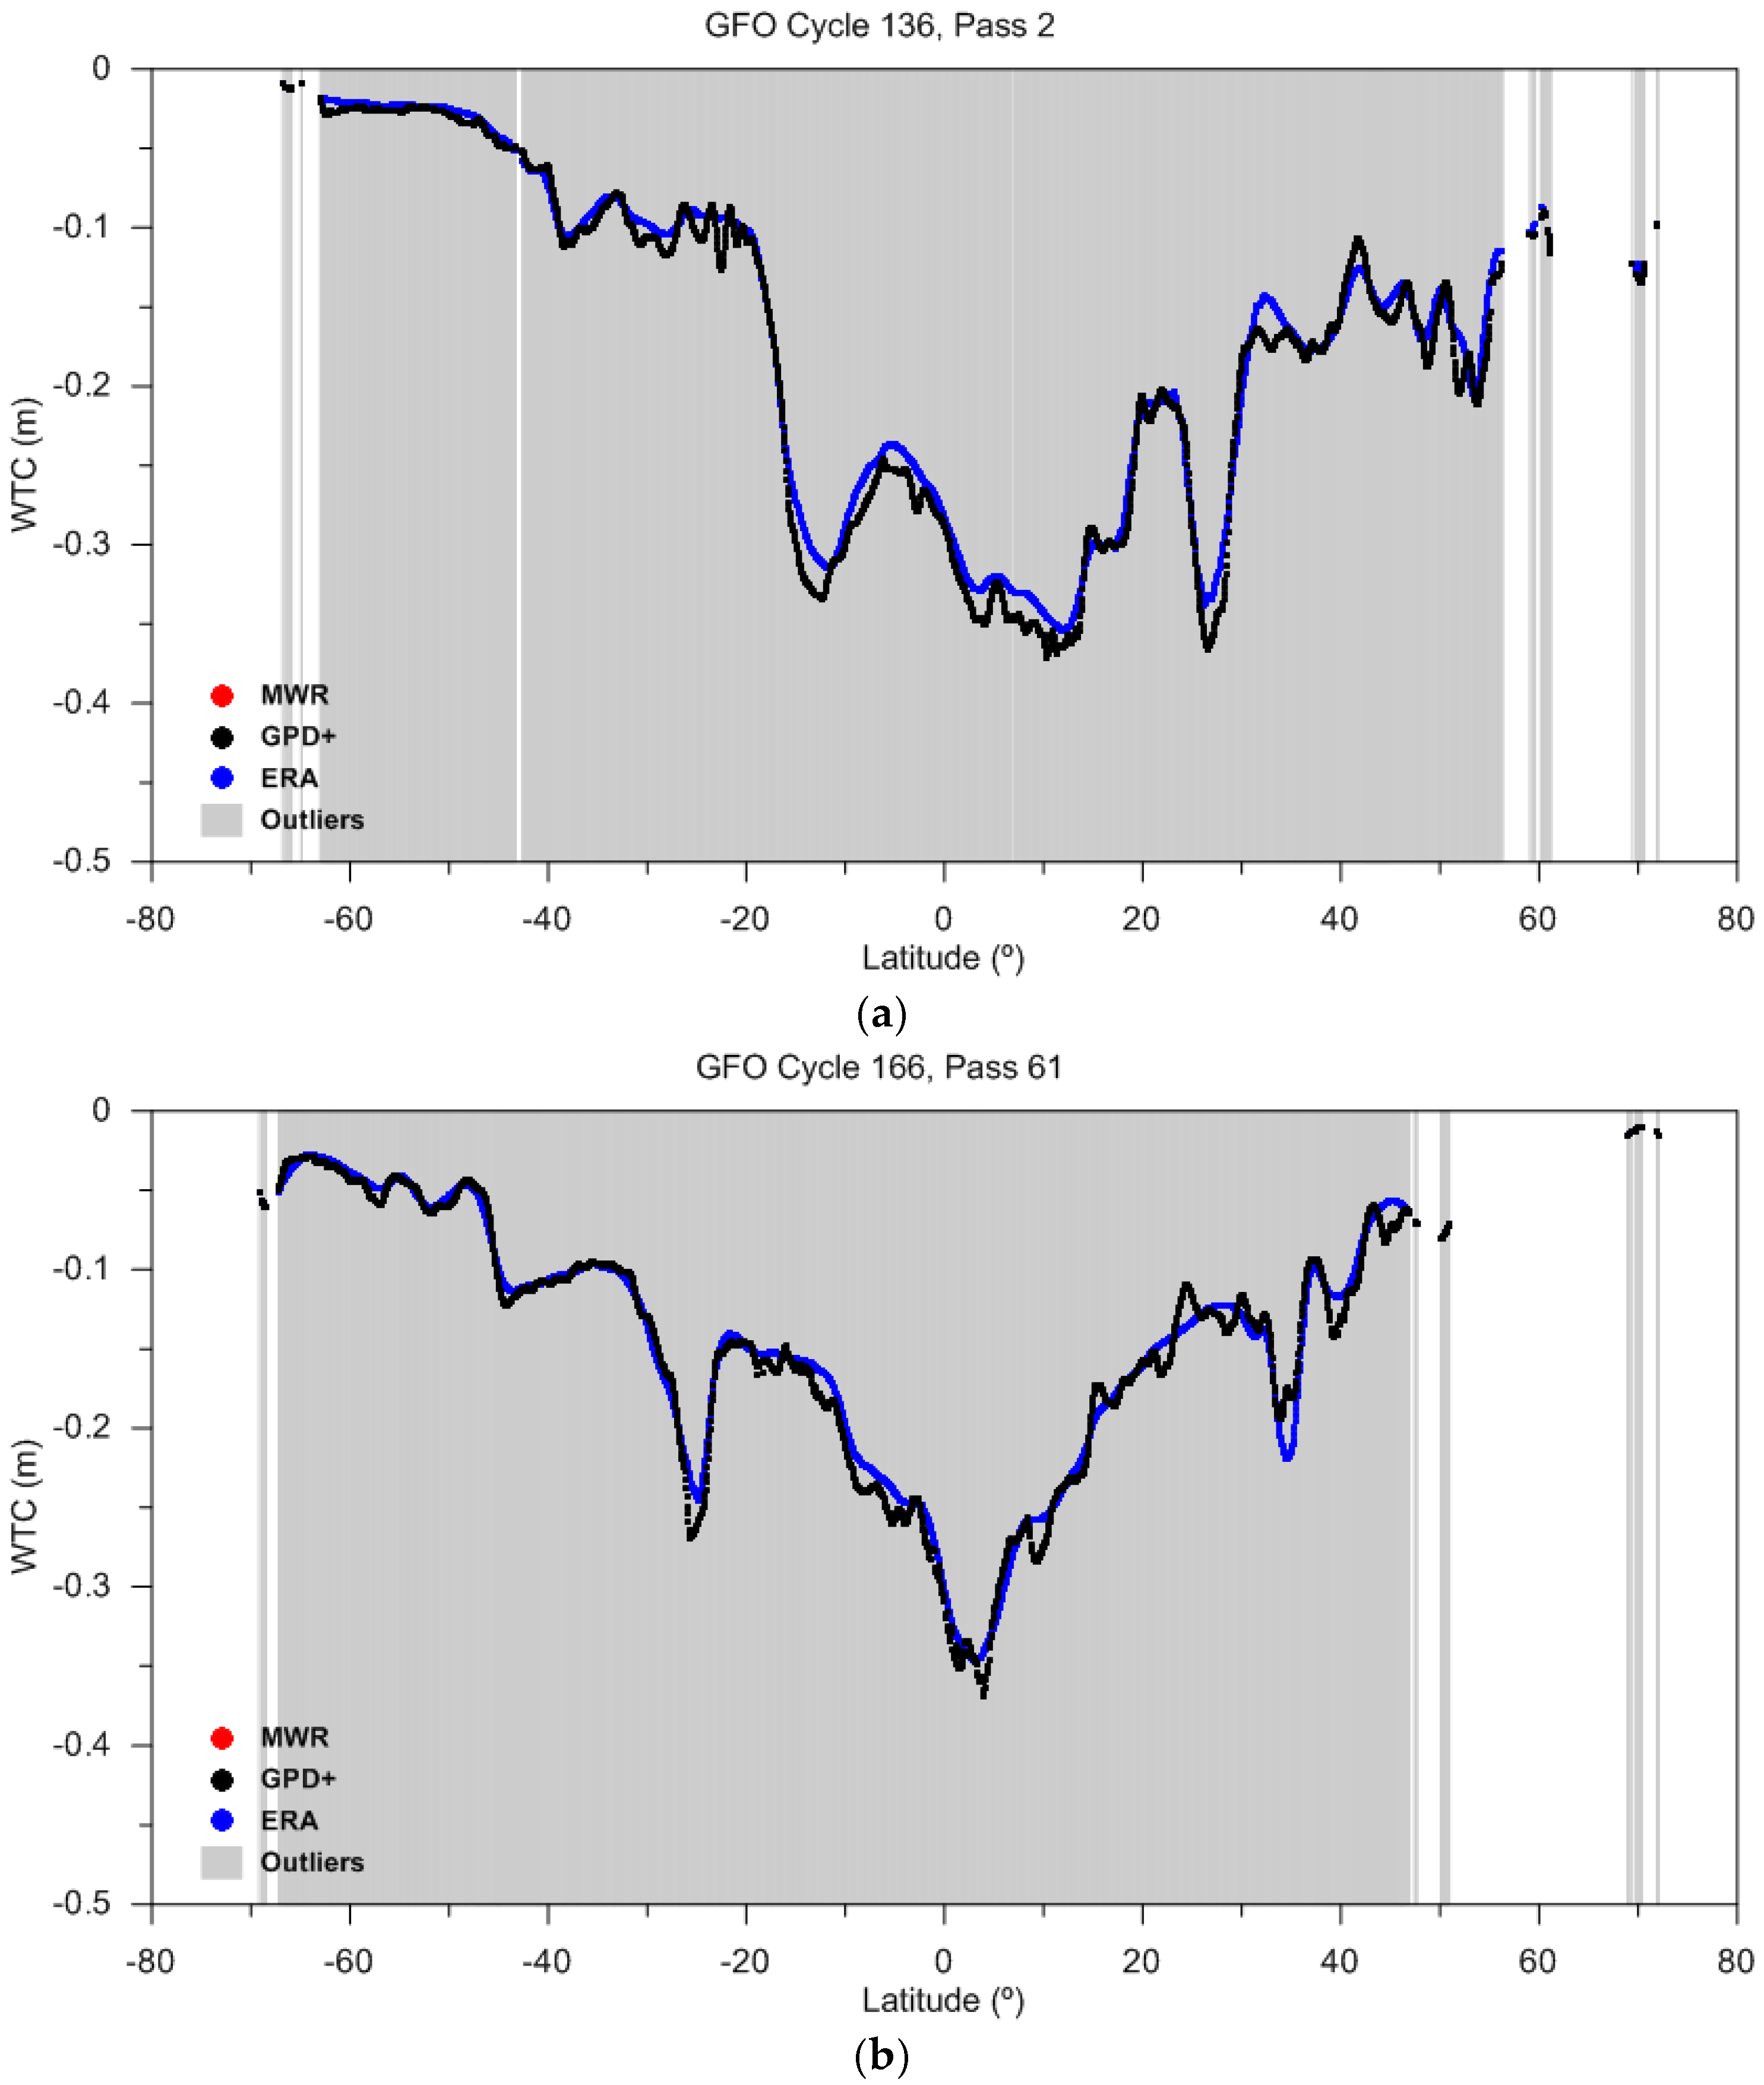
Figure 22 shows the along-track GFO GPD+ WTC for pass 2 of cycle 136 (top plot) and pass 61 of cycle 166 (bottom plot). For both these cycles, the MWR-derived WTC is unavailable (and has been set to a positive value), and thus the GPD+ WTC is solely computed from observations from SI-MWR and from GNSS stations. While behaving similarly to the ERA-derived WTC, it can be concluded that the GPD+ WTC, when compared to the latter, is able to model signals of smaller spatial scales. The MWR-derived is unavailable for certain periods of time (c.f. Figure 23), the largest being, approximately, the last year of the mission corresponding to cycles 202 to 223 (September 2007 to August 2008). The absence of measurements in the last years of the mission is due to the fact that, since the power system began to fail, the MWR had to be switched off and only the altimeter could remain powered on. During these periods, GPD+ performs better than ERA-derived WTC. The evaluation of the GPD+ correction is based on the analysis of sea level anomaly variance, shown in Figure 23, Figure 24, Figure 25, Figure 26 and Figure 27.
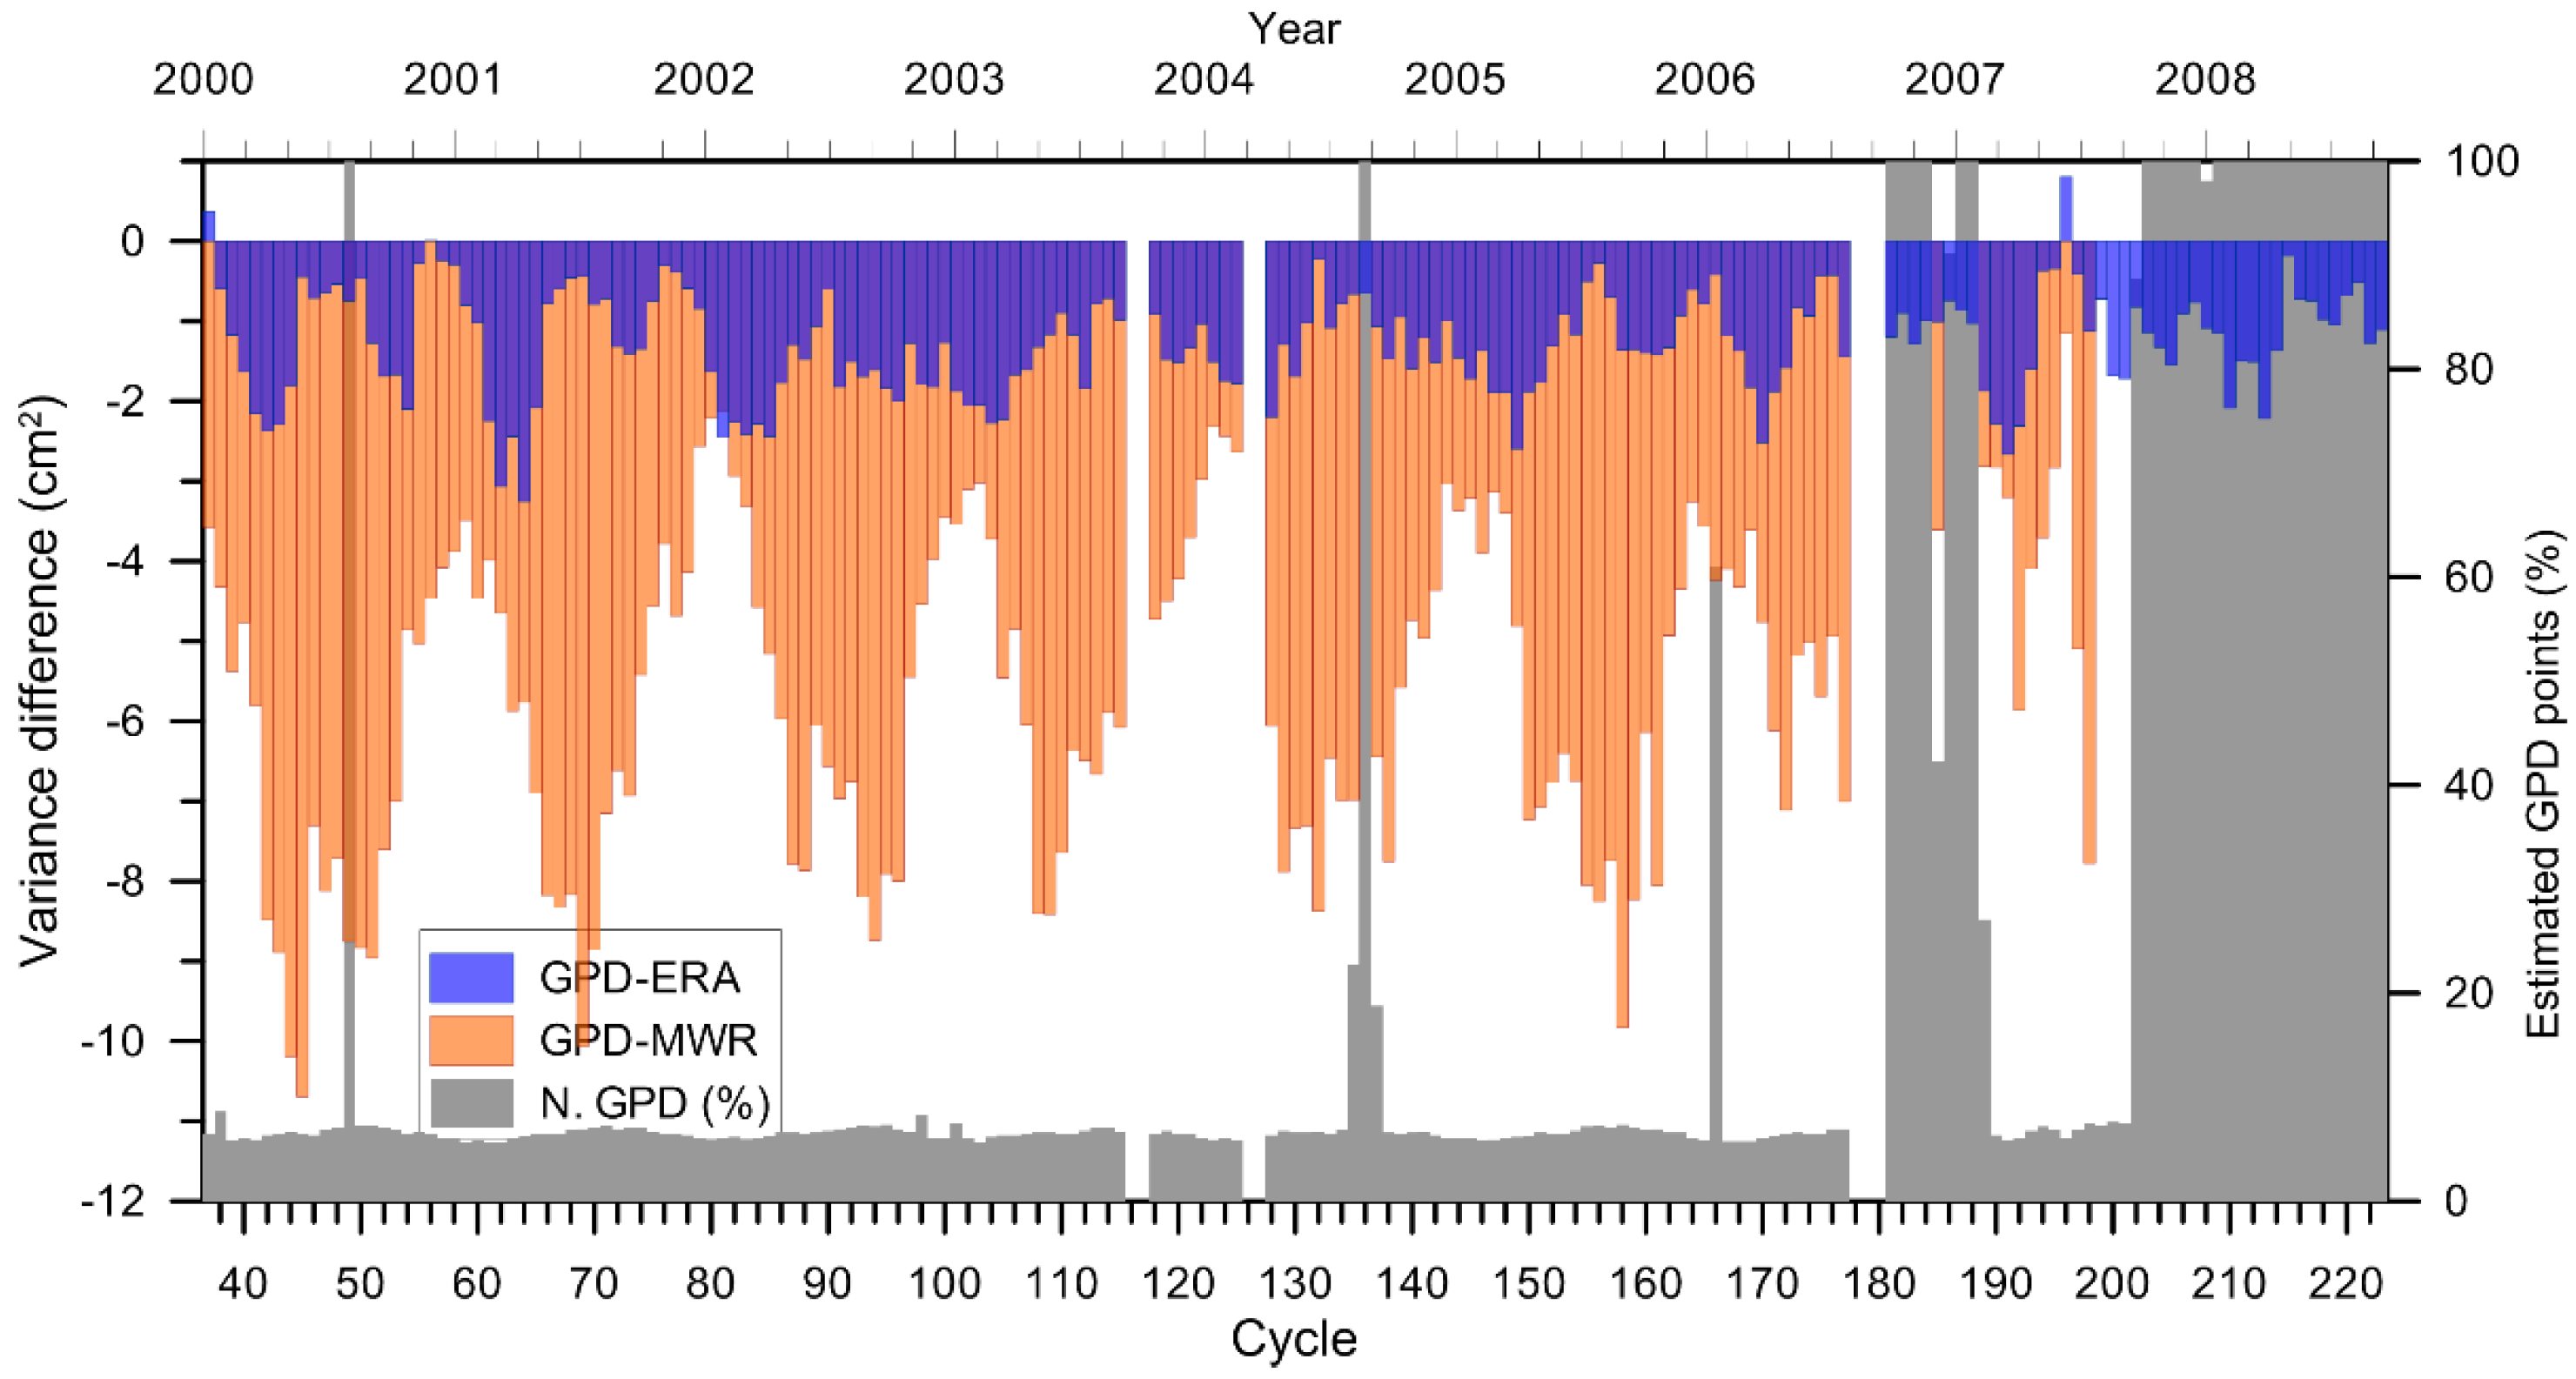
Figure 23 and Figure 24 illustrate the performance of the GPD+ for GFO, in comparison with the WVR and ERA. Figure 23 shows the temporal evolution of SLA variance difference between GPD+ and Water Vapour Radiometer (WVR) WTC, in orange, and between GPD+ and ERA-derived WTC, in blue, over the period of analysis of the GFO mission. The results show that GPD+ WTC reduces the SLA variance, in general, up to roughly 10 square centimetres, when compared to the WVR-derived WTC, except for those periods when the WVR WTC is unavailable or anomalous (e.g., from mid-2006 onwards), where the decrease in variance can reach very large values but these large numbers are not significant since, during these periods, the comparison cannot be performed. The results show that GPD+ reduces the variance up to 2–3 square centimetres when compared to the ERA-derived WTC. Although not so perceptible as for the CS-2 case, the GPD+ improvement for GFO varies from cycle to cycle and depends on the data coverage.
It should be noticed that the decrease in variance with respect to the on-board WVR is mainly caused by the strong land and ice contaminations in the coastal and polar regions, respectively. Apart from the periods with malfunctions reported above, the performance of the WVR in the open-ocean is quite good as shown by Figure 25, where it can be observed that when considering only valid ocean points according to the GPD+ selection criteria, the WVR reduces the SLA variance, particularly at crossovers, by about 2 cm2. Again, it should be emphasised that the advantage of the GPD is its ability to recover the observations for a cycle-dependent percentage of points in the range 6–100, which otherwise would not be available.
Also shown in Figure 23 is the percentage of along-track points for which a GPD+ value has been estimated by the methodology, highlighting the periods for which the WVR-derived WTC is questionable.
Figure 24 shows the results for the SLA variance analysis at crossovers. The temporal evolution of the weighted SLA variance differences at crossovers between GPD+ and ERA-derived WTC is shown in blue, whereas those between GPD+ and WVR-derived WTC are shown in green, for the whole GFO period. The global results for GFO are very similar to those shown before for CS-2, i.e., the GPD+ algorithm consistently reduces the SLA variance with respect to the model by 2 cm2. Figure 24 also shows that the variance of the SLA dataset calculated with GPD+ WTC is reduced when compared to that of the SLA dataset calculated with the WVR-derived WTC by ~1 cm2, from the beginning of the mission to mid-2002, the differences increasing with time after this period.
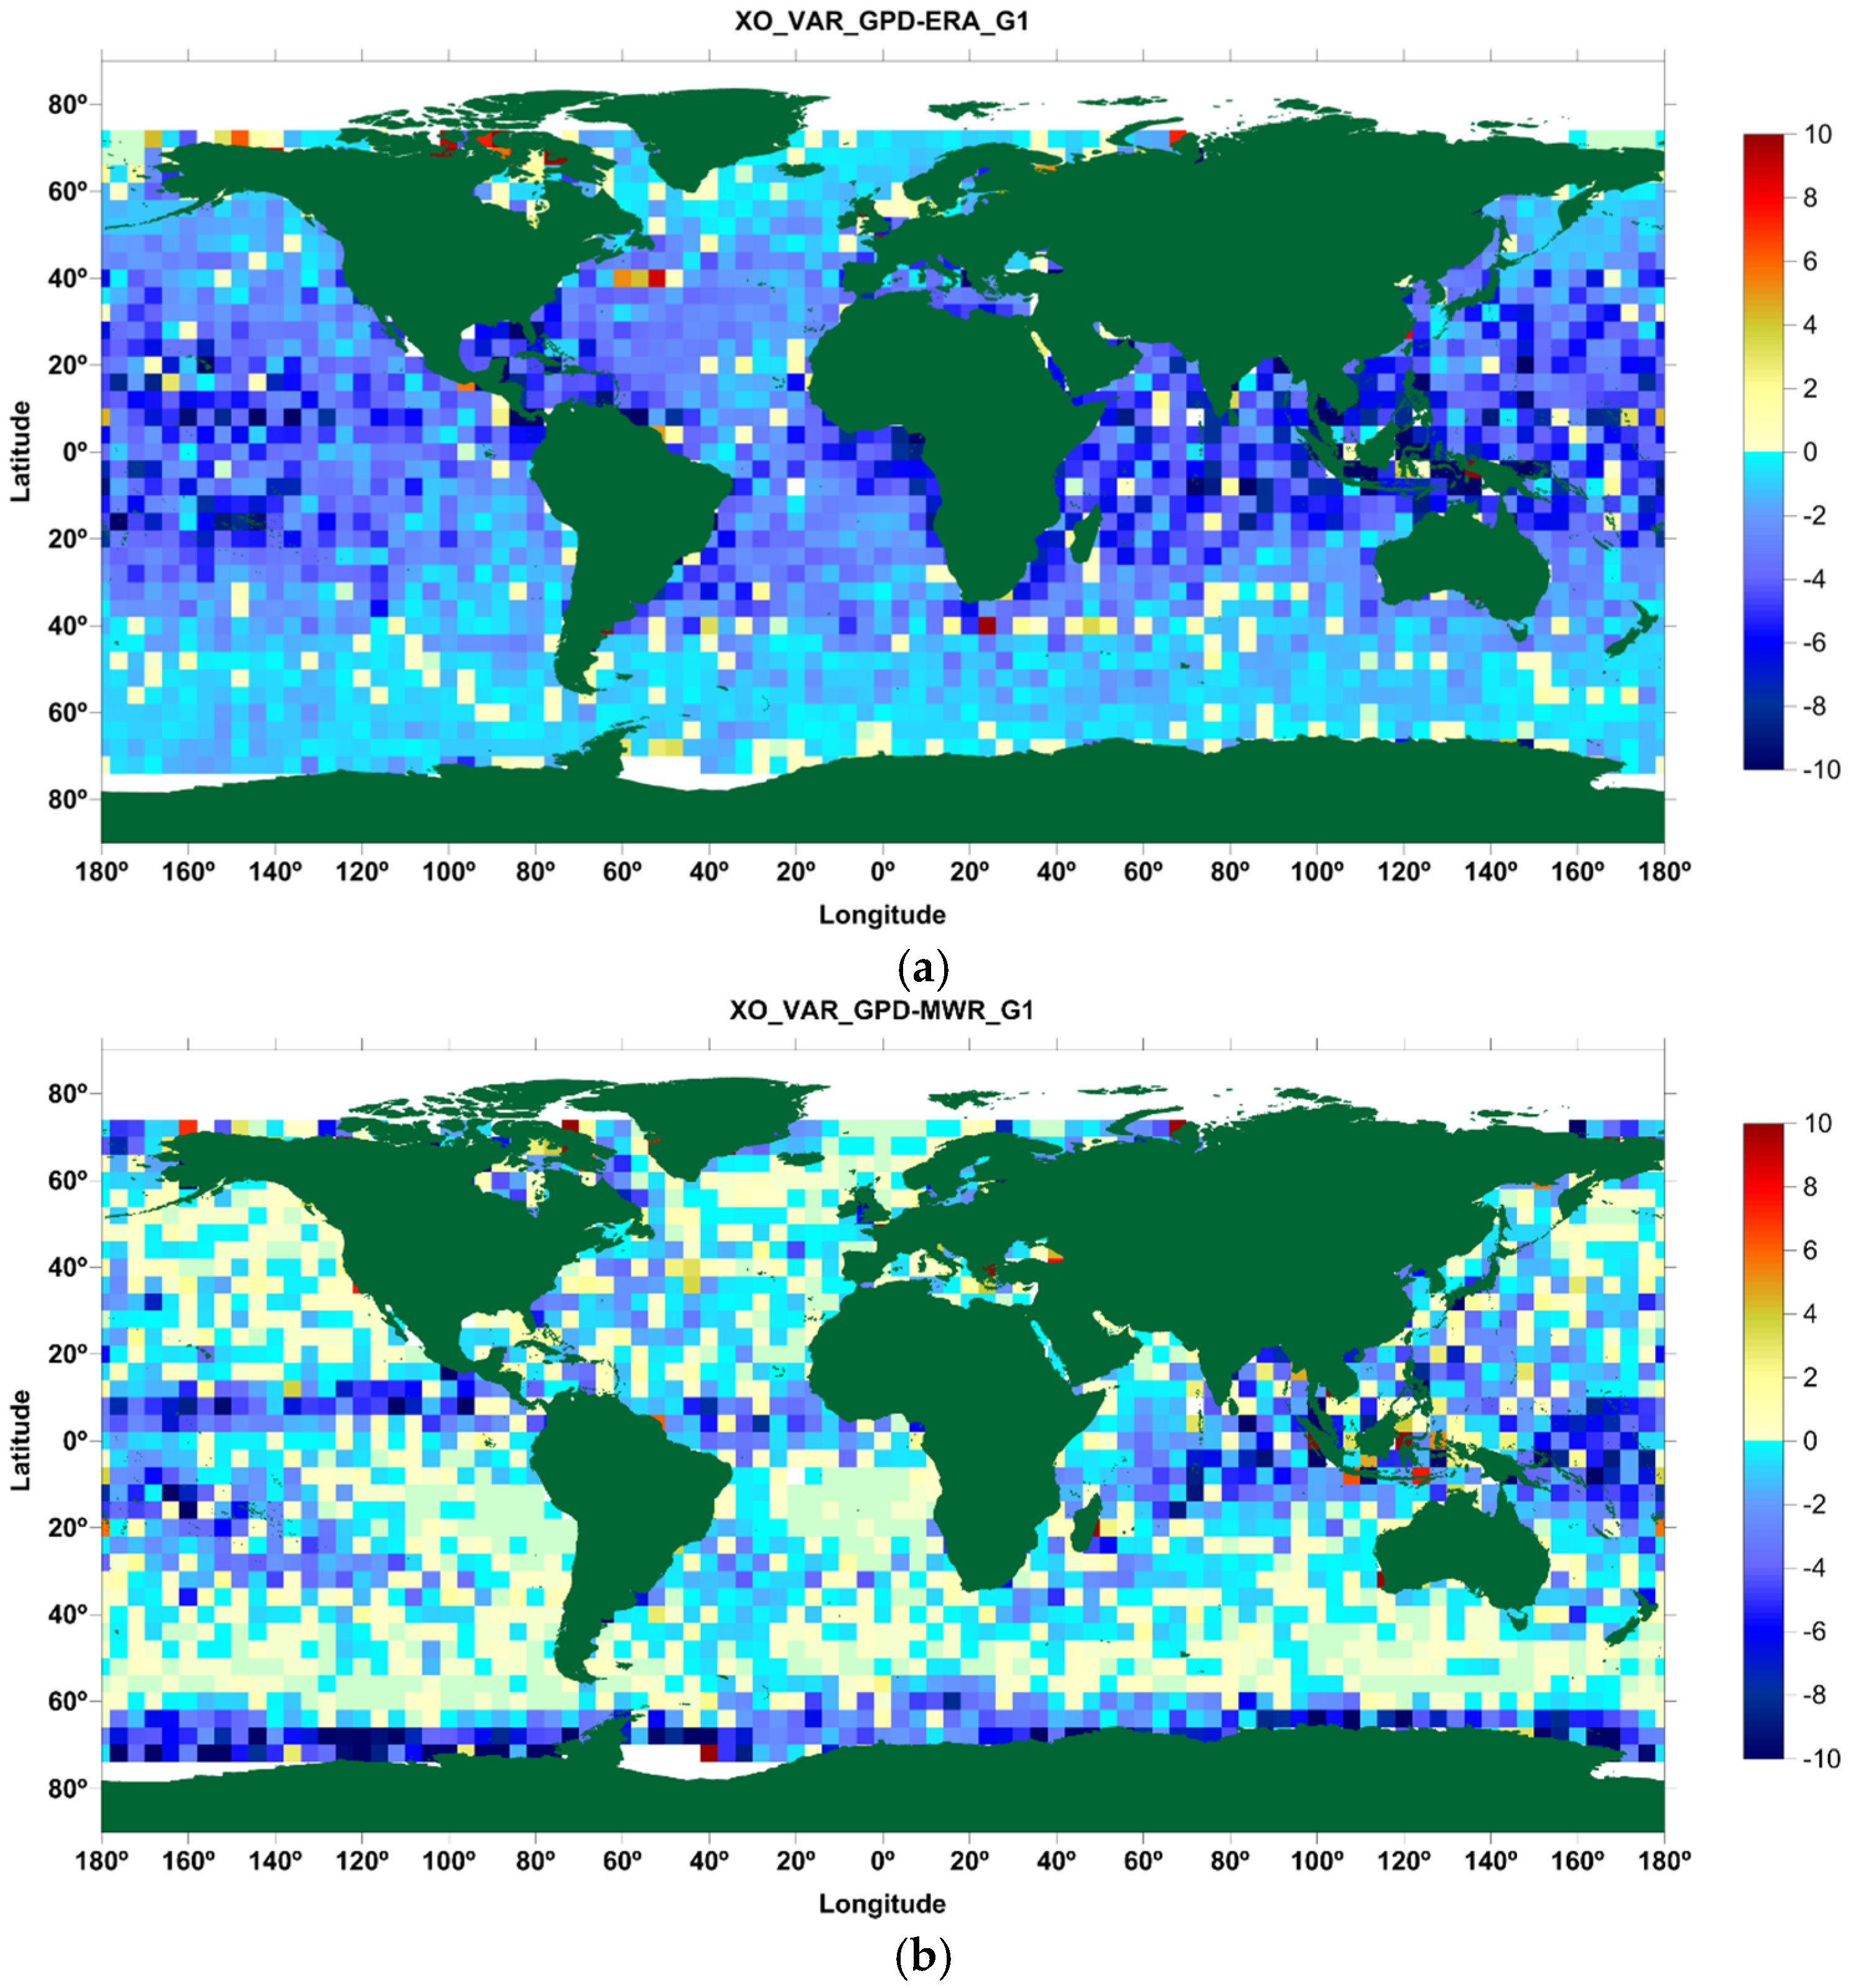
Figure 26 shows the global distribution of the weighted variance differences of SLA datasets, calculated at crossover points, derived with the GPD+ and model WTCs (top panel), and between GPD+ and WVR-derived WTC (bottom panel). Both plots show that the SLA variance decreases globally, particularly in the mid-latitude regions, when the GPD+ WTC is considered. A variance increase is observed solely over the paths of the most energetic ocean currents (e.g., Gulf Stream and Agulhas Current) and in the polar regions. Finally, Figure 27 evidences that the GPD+ WTC is a clear improvement with respect to the baseline WTC, both in the polar regions and in the coastal zones.

4. Discussion and Conclusions

This paper presents the most recent developments regarding the algorithms for retrieving improved wet tropospheric corrections for various altimeter missions, developed at the University of Porto. The latest version of this algorithm, the GPD+, has been described as well as its successful application to CryoSat-2 and Geosat Follow-On. After adequate tuning, the algorithm is applicable to any other altimetric mission with or without an on-board microwave radiometer. In [28] the corresponding GPD+ corrections for TOPEX/Poseidon, Jason-1, Jason-2, ERS-1, ERS-2, Envisat and SARAL/AltiKa are revisited.
The initial aim of this algorithm was to provide the wet tropospheric correction in the coastal zone, where the MWR measurements become invalid due to land contamination in the brightness temperatures of the various channels. In the present implementation, the WTC is provided globally for all altimeter ocean measurements.
The baseline information for the GPD+ corrections are the WTC values from the microwave radiometer (when available) on board the same spacecraft, collocated in space and time with the altimeter measurements. Whenever an MWR measurement is considered valid, the GPD+ correction equals the MWR-based wet path delay. For every ocean point along the altimeter ground track for which the MWR-based WTC has been considered invalid according to a set of criteria, a new GPD+ estimate is obtained along with its associated error. These include not only coastal points, but also open-ocean, including high latitude regions. Therefore, apart from land contamination, rain and ice contamination in the MWR-based WTC are also spotted and corrected.
The present algorithm fully exploits the available data sets of WTC observations, both from valid on-board MWR (whenever available as for GFO) and third party data sources from SI-MWR and GNSS. To ensure the long-term stability of the corrections, the full set of radiometers used in the WTC computations have been calibrated with respect to the SSM/I and SSM/IS set of sensors, due to their well-known stability and independent calibration. This ensures the temporal consistency of the WTC between the various missions. Sensor calibration reveals that overall the various radiometers are relatively well aligned with respect to the SSM/I and SSM/IS dataset. In spite of the fact that the calibration parameters are small, in particular those for the altimeter reference missions (TOPEX/Poseidon, Jason-1 and Jason-2), they have an impact on the global sea level at inter-decadal time-scales and on the regional sea level (not shown).
In addition to the inter-calibration with respect to SSM/I and SSM/IS, the new features of the GPD+ corrections with respect to previous versions include: (i) incorporation of additional datasets from a set of 19 SI-MWR; (ii) new grid of spatial correlation scales; (iii) improved criteria for detecting valid/invalid MWR values; (iv) adoption of ECMWF Operational model for computing the first guess of the most recent missions such as CryoSat-2 and Jason-2; (v) adoption of ERA Interim to compute the first guess for older missions such as GFO.
Since CryoSat-2 does not carry any on board microwave radiometer, a WTC solely based on third party observations (SI-MWR and GNSS) and on the ECMWF Operational model has been generated. For validation purposes, a similar correction has been computed for Jason-2 and compared to the normal GPD+ WTC, generated using all available observations, including valid AMR measurements. Results show that the GPD+ for CryoSat-2 consistently reduces the SLA variance with respect to the baseline model WTC by 1–2 cm2. The dataset with the largest impact on the CS-2 correction is the SI-MWR set of sensors. The main limitation on the use of SI-MWR data is the fact that they are not collocated in time and space to the altimeter measurement, thus leading to a lower accuracy when compared to WTC derived from the on-board MWR, as demonstrated for Jason-2. In addition, the data coverage is not uniform, leading to time variable accuracy.
Except for TRMM and GPM, all spacecraft holding the SI-MWR sensors fly on sun-synchronous orbits. The space-time coverage of this set of SI-MWR images with respect to CS-2 repeats every 241.3 days, the time that takes an ascending/descending CS-2 pass to be in phase with an ascending/descending pass of each sun-synchronous satellite. For comparison, the space-time coverage of the set of SI-MWR images with respect to GFO satellite repeats every 171.3 days. In spite of that, for periods of good data coverage the results are remarkable and the overall improvement with respect to ECMWF Operational model is evident.
GFO is an illustrative example of a mission possessing an on-board MWR, to which the GPD+ has been successfully applied. Although the WVR deployed on GFO is a stable and accurate radiometer, it evidenced several failures during the satellite lifetime as shown in Figure 22. Results show that the new WTC successfully recovers the invalid WVR measurements in the coastal and polar regions, leading to a significant reduction in the SLA variance in these regions. It also allows the recovery of the large periods for which the WVR is invalid or inexistent. As for CS-2, during these periods the GPD+ WTC fully exploits the use of external observations (GNSS and SI-MWR).
Overall, the algorithm allows the recovery of a significant number of measurements, ensuring the continuity and consistency of the correction in the open-ocean/coastal transition zone and also at high latitudes.
Regarding the use of GNSS data to compute the WTC, the main limitation is the sparseness of the GNSS stations. In spite of that, this is a very valuable dataset, where available, with clear impact on coastal regions, of major importance in coastal altimetry.
Future developments include the extension of the GPD+ algorithm to the recently launched Jason-3 and Sentinel-3 missions.

Acknowledgments

This work is funded by ESA, in the scope of the Sea Level project of the Climate Change Initiative (CCI) and under the project Sensor Performance, Product and Algorithms (SPPA) Maintenance and Operations of The Earth Observation Payload Data System - CN5.

Author Contributions

Both authors contributed to the conception of the paper, data processing, analysis and discussion, writing of the manuscript and its overall editing and revision.

Conflicts of Interest

The authors declare no conflict of interest.

Abbreviations

The following abbreviations are used in this manuscript:
AMRAdvanced Microwave Radiometer
CLASSComprehensive Large Array-Data Stewardship System
CP4OCryoSat Plus for Oceans
CS-2CryoSat-2
DMSPDefense Meteorological Satellite Program
ECMWFEuropean Centre for Medium-Range Weather Forecasts
EPNEUREF Permanent Network
ERAECMWF ReAnalysis
ESAEuropean Space Agency
GDRGeophysical Data Records
GFOGeosat Follow-On
GNSSGlobal Navigation Satellite Systems
GPD+GNSS-derived Path Delay Plus
IGSInternational GNSS Service
J1Jason-1
J2Jason-2
JMRJason-1 Microwave Radiometer
LRMLoe Resolution Mode
MWRMicroWave Radiometer
NWMNumerical Weather Models
OAObjective Analysis
PODPrecise Orbit Determination
PODAACPhysical Oceanography Distributive Active Archive Center
RADSRadar Altimeter Database System
RSSRemote Sensing Systems
SI-MWRScanning Imaging MWR
SL_cciSea Level Climate Change Initiative
SLASea Level Anomaly
SLPSea Level Pressure
SSHSea Surface Height
SSM/ISpecial Sensor Microwave Imager
SSM/ISSpecial Sensor Microwave Imager Sounder
T/PTOPEX/Poseidon
TCWVTotal Column Water Vapour
TMRTopex Microwave Radiometer
UPortoUniversity of Porto
WTCWet Ttropospheric Correction
WVRWater Vapour Radiometer
ZHDZenith Hydrostatic Delay
ZTDZenith Total Delays
ZWDZenith Wet Delay

References

  1. Chelton, D.B.; Ries, J.C.; Haines, B.J.; Fu, L.L.; Callahan, P.S. Satellite altimetry. In Satellite Altimetry and Earth Sciences: A Handbook of Techniques and Applications; Fu, L.L., Cazenave, A., Eds.; Academic Press: San Diego, CA, USA, 2001. [Google Scholar]
  2. Ablain, M.; Cazenave, A.; Larnicol, G.; Balmaseda, M.; Cipollini, P.; Faugere, Y.; Fernandes, M.J.; Henry, O.; Johannessen, J.A.; Knudsen, P.; et al. Improved sea level record over the satellite altimetry era (1993–2010) from the Climate Change Initiative project. Ocean Sci. 2015, 11, 67–82. [Google Scholar] [CrossRef] [Green Version]
  3. Miller, M.; Buizza, R.; Haseler, J.; Hortal, M.; Janssen, P.; Untch, A. Increased resolution in the ECMWF deterministic and ensemble prediction systems. In ECMWF Newsletter; ECMWF: Reading, UK, 2010. [Google Scholar]
  4. Dee, D.P.; Uppala, S.M.; Simmons, A.J.; Berrisford, P.; Poli, P.; Kobayashi, S.; Andrae, U.; Balmaseda, M.A.; Balsamo, G.; Bauer, P.; et al. The ERA-Interim reanalysis: Configuration and performance of the data assimilation system. Q. J. R. Meteorol. Soc. 2011, 137, 553–597. [Google Scholar] [CrossRef]
  5. Cotton, D.; Benveniste, J.; Clarizia, M.-P.; Roca, M.; Gommenginger, C.; Naeije, M.; Labroue, S.; Picot, N.; Fernandes, J.; Andersen, O.; et al. CryoSat plus for oceans: An ESA Project for CryoSat-2 data exploitation over ocean. In Proceedings of the EGU General Assembly, Vienna, Austria, 27 April–2 May 2013.
  6. Vignudelli, S.; Cipollini, P.; Gommenginger, C.; Snaith, H.M.; Coelho, H.; Fernandes, J.; Gomez-Enri, J.; Martin-Puig, C.; Woodworth, P.; Dinardo, S.; et al. The COASTALT project: Towards an operational use of satellite altimetry in the coastal zone. In Proceedings of the OCEANS 2009 MTS/IEEE Biloxi Conference, Biloxi, MS, USA, 26–29 October 2009.
  7. Fernandes, M.J.; Lazaro, C.; Nunes, A.L.; Pires, N.; Bastos, L.; Mendes, V.B. GNSS-derived path delay: An approach to compute the wet tropospheric correction for coastal altimetry. IEEE Geosci. Remote Sens. Lett. 2010, 7, 596–600. [Google Scholar] [CrossRef]
  8. Larnicol, G.; Cazenave, A.; Faugère, Y.; Ablain, M.; Johannessen, J.; Stammer, D.; Timms, G.; Knudsen, P.; Cipolini, P.; Roca, M.; et al. ESA sea level climate change initiative. In Proceedings of the 20 Years of Progress in Radar Altimetry Symposium, Venice, Italy, 24–29 September 2012.
  9. Fernandes, M.J.; Lazaro, C.; Ablain, M.; Pires, N. Improved wet path delays for all ESA and reference altimetric missions. Remote Sens. Environ. 2015, 169, 50–74. [Google Scholar] [CrossRef]
  10. Stum, J.; Sicard, P.; Carrere, L.; Lambin, J. Using objective analysis of scanning radiometer measurements to compute the water vapor path delay for altimetry. IEEE Trans. Geosci. Remote Sens. 2011, 49, 3211–3224. [Google Scholar] [CrossRef]
  11. Fernandes, M.J.; Nunes, A.L.; Lazaro, C. Analysis and inter-calibration of wet path delay datasets to compute the wet tropospheric correction for CryoSat-2 over ocean. Remote Sens. 2013, 5, 4977–5005. [Google Scholar] [CrossRef]
  12. Bretherton, F.P.; Davis, R.E.; Fandry, C.B. A technique for objective analysis and design of oceanographic experiment applied to MODE-73. Deep-Sea Res. 1976, 23, 559–582. [Google Scholar] [CrossRef]
  13. Schüler, J. On Ground-Based GPS Tropospheric Delay Estimation; Universität der Bundeswehr: München, Germany, 2001. [Google Scholar]
  14. Leeuwenburgh, O. Covariance modelling for merging of multi-sensor ocean surface data. In Methods and Applications of Inversion; Hansen, P.C., Jacobsen, B.H., Mosegaard, K., Eds.; Springer: Heidelberg, Germany, 2000; pp. 203–216. [Google Scholar]
  15. Legeais, J.F.; Ablain, M.; Thao, S. Evaluation of wet troposphere path delays from atmospheric reanalyses and radiometers and their impact on the altimeter sea level. Ocean Sci. 2014, 10, 893–905. [Google Scholar] [CrossRef]
  16. Fernandes, M.J.; Lazaro, C.; Nunes, A.L.; Scharroo, R. Atmospheric corrections for altimetry studies over inland water. Remote Sens. 2014, 6, 4952–4997. [Google Scholar] [CrossRef]
  17. Bosser, P.; Bock, O.; Pelon, J.; Thom, C. An improved mean-gravity model for GPS hydrostatic delay calibration. IEEE Geosci. Remote Sens. Lett. 2007, 4, 3–7. [Google Scholar] [CrossRef]
  18. Scharroo, R.; Leuliette, E.W.; Lillibridge, J.L.; Byrne, D.; Naeije, M.C.; Mitchum, G.T. RADS: Consistent multi-mission products. In Proceedings of the 20 Years of Progress in Radar Altimetry Symposium, Venice, Italy, 20–28 September 2012.
  19. Brown, S. Topex Microwave Radiometer Replacement. Available online: http://podaac.jpl.nasa.gov/dataset/TOPEX_L2_OST_TMR_Replacement (accessed on 16 October 2016).
  20. Brown, S. A novel near-land radiometer wet path-delay retrieval algorithm: Application to the Jason-2/OSTM advanced microwave radiometer. IEEE Trans. Geosci. Remote Sens. 2010, 48, 1986–1992. [Google Scholar] [CrossRef]
  21. Kouba, J. Implementation and testing of the gridded Vienna Mapping Function 1 (VMF1). J. Geod. 2008, 82, 193–205. [Google Scholar] [CrossRef]
  22. Davis, J.L.; Herring, T.A.; Shapiro, I.I.; Rogers, A.E.E.; Elgered, G. Geodesy by radio interferometry—Effects of atmospheric modeling errors on estimates of baseline length. Radio Sci. 1985, 20, 1593–1607. [Google Scholar] [CrossRef]
  23. Fernandes, M.J.; Pires, N.; Lazaro, C.; Nunes, A.L. Tropospheric delays from GNSS for application in coastal altimetry. Adv. Space Res. 2013, 51, 1352–1368. [Google Scholar] [CrossRef]
  24. Wentz, F.J. A well-calibrated ocean algorithm for special sensor microwave/imager. J. Geophys. Res. Oceans 1997, 102, 8703–8718. [Google Scholar] [CrossRef]
  25. Wentz, F.J. SSM/I Version-7 Calibration Report; 011012; Remote Sensing Systems: Santa Rosa, CA, USA, 2013. [Google Scholar]
  26. NOAA. Comprehensive Large Array-data Stewardship System (CLASS). Available online: http://www.class.ngdc.noaa.gov (accessed on 16 October 2016).
  27. Remote Sensing Systems (RSS). In Remote Sensing Systems. Available online: http://www.ssmi.com/ssmi/ssmi_browse.html (accessed on 16 October 2016).
  28. Fernandes, M.J.; Lázaro, C. GPD+ wet tropospheric corrections - impacts on mean sea level. IEEE Trans. Geosc. Remote Sens. 2016. Submitting. [Google Scholar]
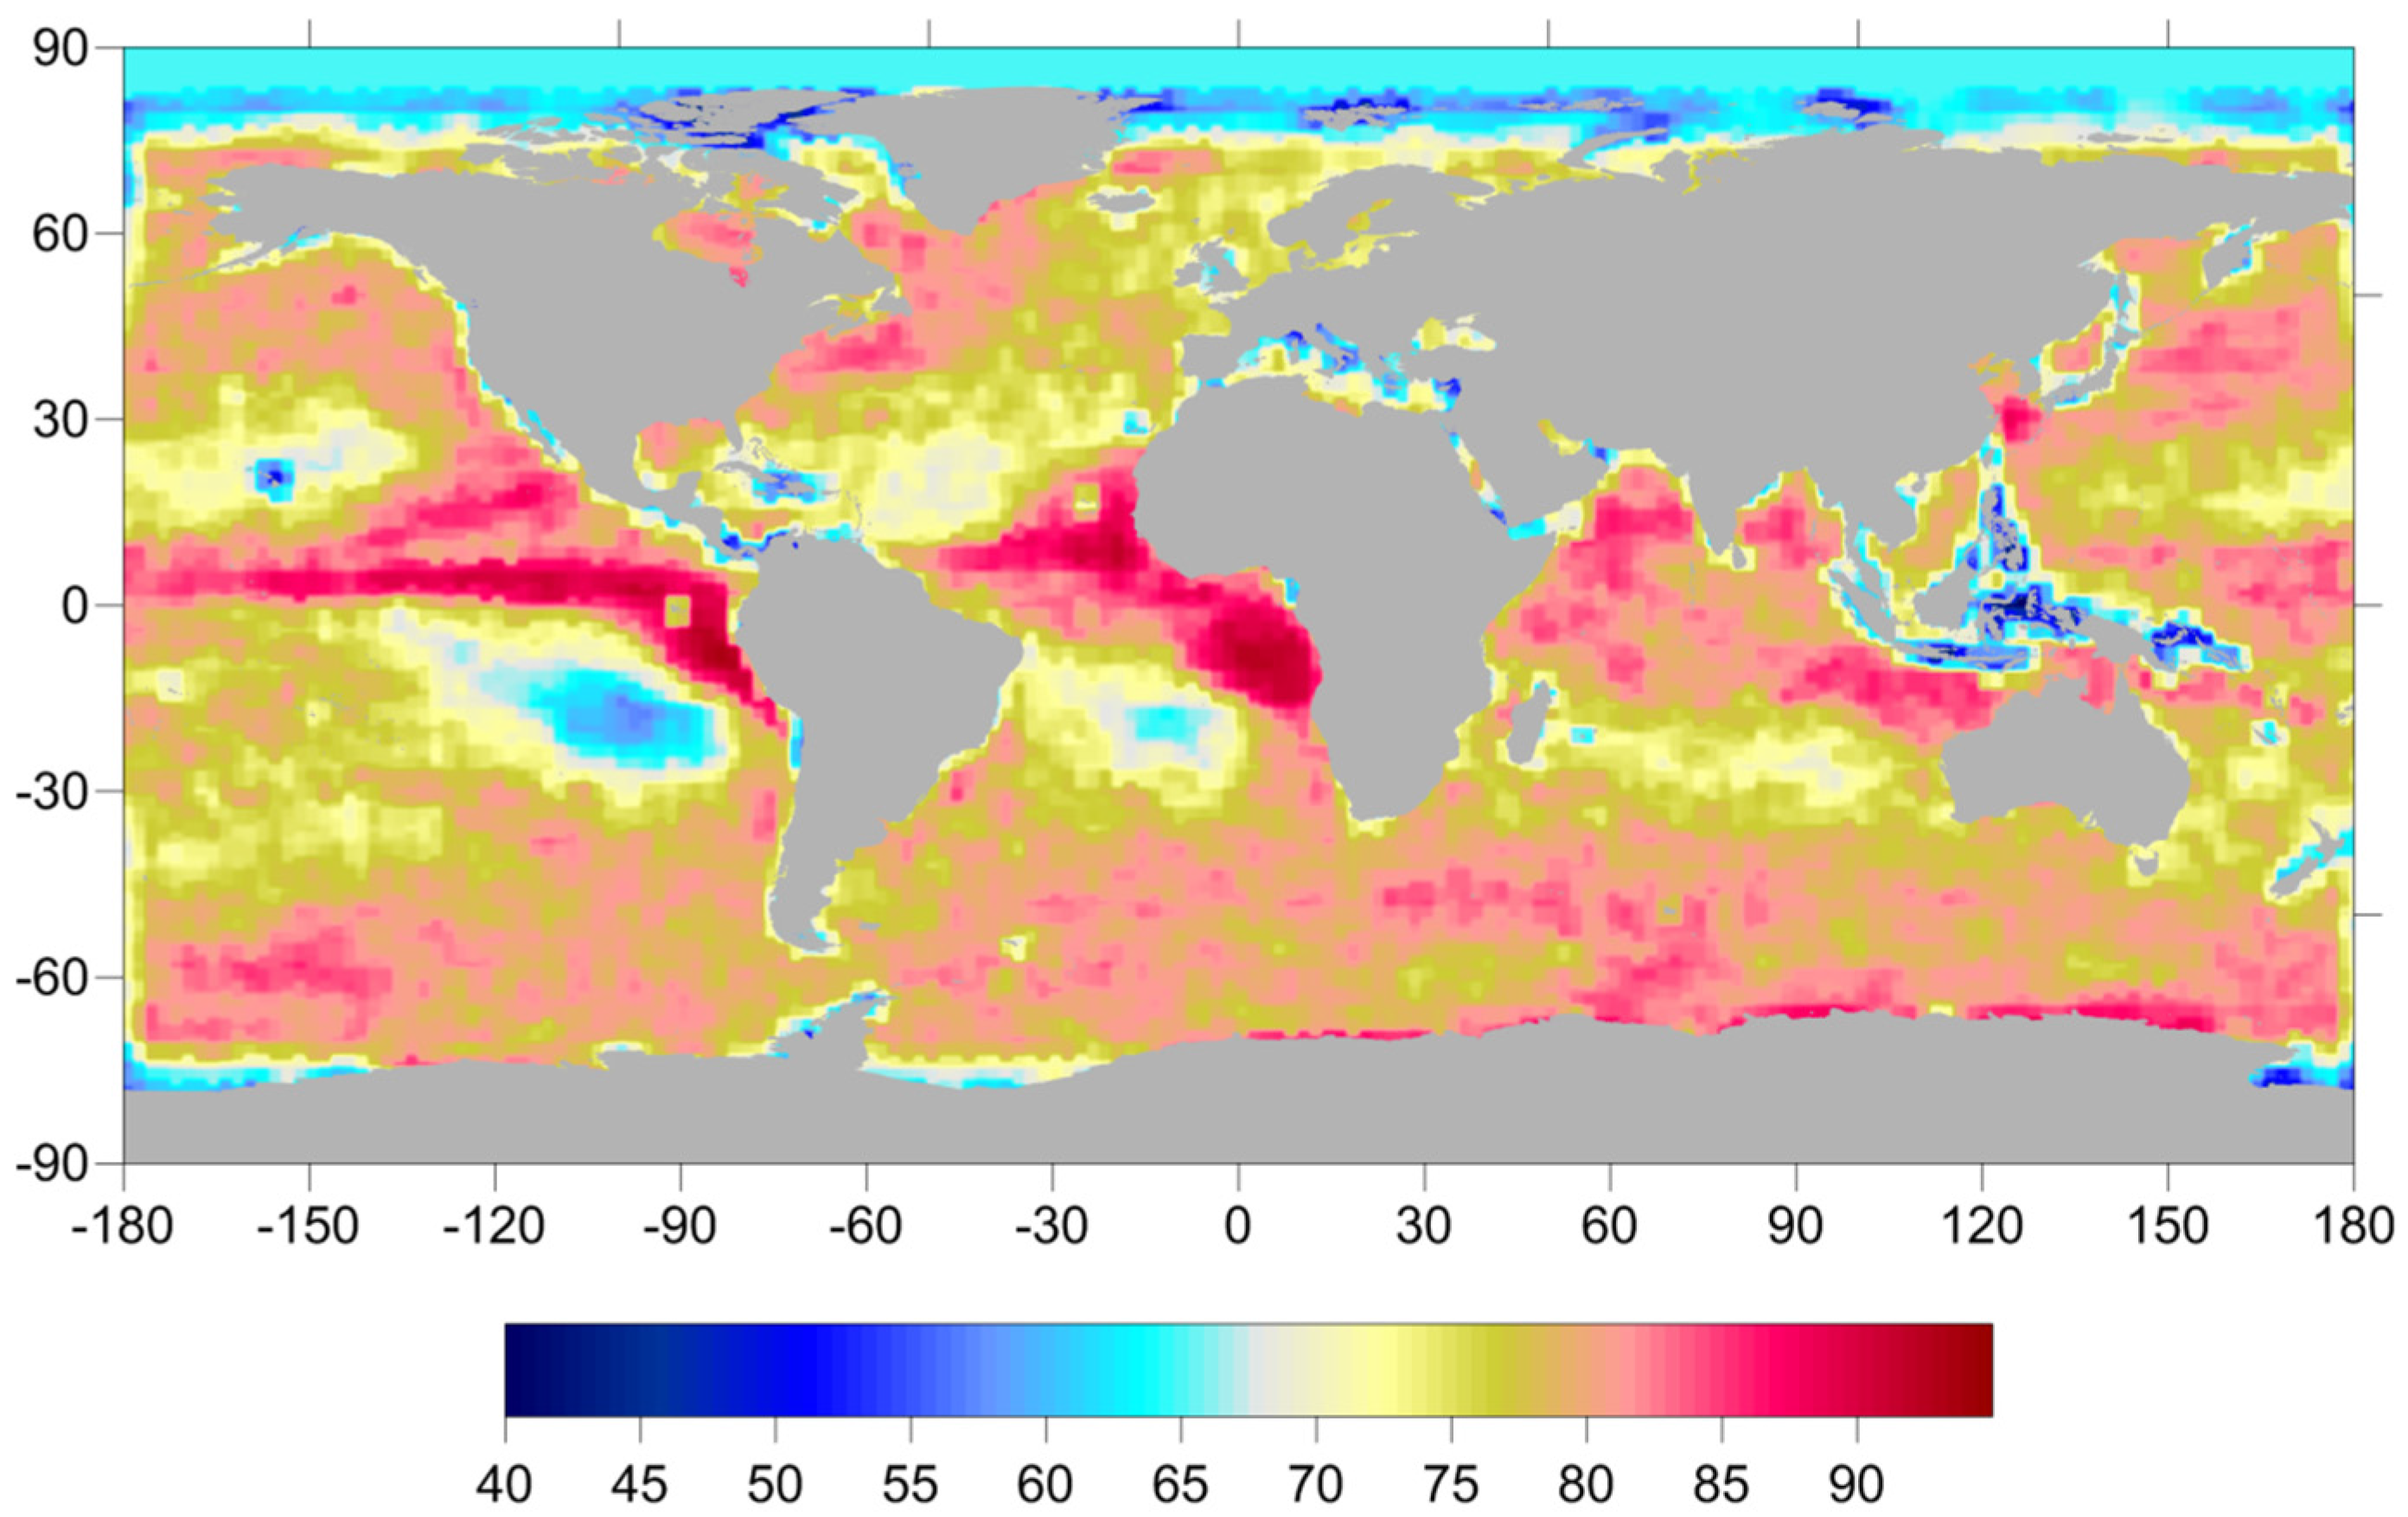
Figure 1. Spatial correlation scales (in km) for the wet tropospheric correction (WTC) as determined from a set of European Centre for Medium-Range Weather Forecasts (ECMWF) Operational model grids at 0.125° × 0.125°, well distributed over the year 2013.
Remotesensing 08 00851 g001
Figure 2. Location of GNSS stations used in the GPD+ estimations. The background picture is the map of the standard error of the wet tropospheric correction, in metres, computed from two years of ECMWF model fields.
Remotesensing 08 00851 g002
Figure 3. Set of SI-MWR sensors used in the GPD+ estimations (DMSP-F15 (see Table 1) was not used due to its instable behaviour [24,25]).
Remotesensing 08 00851 g003
Figure 4. (a) Time evolution of the differences in WTC (cm) from AMSU-A and from ECMWF ReAnalysis (ERA) Interim; (b) Corresponding differences from SI-MWR sensors (SSM/I-SSM/IS, TMI (TRM), AMSR-E (AQU), AMSR-2 (GCW), WindSat (COR), GMI (GPM)) and from ERA Interim; (c) Corresponding differences from the SSM/I-SSM/IS sensors and from ERA Interim for the altimeter era (1992-present).
Remotesensing 08 00851 g004
Figure 5. Wet path delay (symmetric of WTC) from SSM/I and SSM/IS versus the corresponding values from the MWR on board the reference missions: TOPEX/Poseidon (TP) (a); J1 (b); and J2 (c). The red straight lines represent the linear fit to each dataset.
Remotesensing 08 00851 g005
Figure 6. (a) Time evolution of the differences in WTC (cm) from SSM/I, SSM/IS and from MWR on board satellite altimetry reference missions, before and after calibration; (b) Corresponding differences in WTC (cm) from ERA Interim and from MWR on board satellite altimetry reference missions.
Remotesensing 08 00851 g006
Figure 7. Wet path delay (symmetric of WTC) from the reference altimetric missions vs. the corresponding values from GFO WVR. The solid red line represents the linear fit of these datasets.
Remotesensing 08 00851 g007
Figure 8. Time evolution of the differences between the WTC (cm) derived from MWR on board altimetric reference missions and from GFO WVR, before and after calibration.
Remotesensing 08 00851 g008
Figure 9. Wet path delay (symmetric of WTC) from the reference altimetric missions vs. the corresponding values from NOAA-15/AMSU-A (a); and from GCW/AMSR-2 (b). The red lines represent the linear fit of these datasets.
Remotesensing 08 00851 g009
Figure 10. Time evolution of the differences between the WTC (cm) derived from MWR on board altimetric reference missions and from AMSR-E (AQU), AMSR-2 (GCW), TMI (TRM), WindSat (COR), and from GMI (GPM) before (a); and after (b) calibration.
Remotesensing 08 00851 g010
Figure 11. Time evolution of the differences between the WTC (cm) derived from MWR on board altimetric reference missions and from AMSU-A before (a); and after (b) calibration.
Remotesensing 08 00851 g011
Figure 12. Spatial coverage of the various datasets for CS-2 sub-cycles 31 (a); and 35 (b). The red triangles represent the location of the Global Navigation Satellite Systems (GNSS) stations. The black dots indicate points where there are no SI-MWR measurements available for the estimations, either because they do not exist or because they are too far away in space or time.
Remotesensing 08 00851 g012
Figure 13. Formal error (in cm) of the GPD wet tropospheric correction for CryoSat-2 sub-cycles 31 (a); and 35 (b).
Remotesensing 08 00851 g013
Figure 14. WTC for Jason-2, cycle 127 pass 223: GPD+ version using AMR (red), GPD+ version without AMR (black) and ECMWF Operational model (blue).
Remotesensing 08 00851 g014
Figure 15. (a) Temporal evolution of weighted along-track SLA variance differences between each GPD+ version (with AMR in blue and without AMR in orange) and the corresponding values from ECMWF Operational model over the period of J2 cycles 74 to 273; (b) Corresponding variance differences at crossovers. “N. Xovers” represents the number of crossovers per cycle. “Obs (%)” represents, for each cycle, the percentage of points with available observations for the GPD+ WTC estimation.
Remotesensing 08 00851 g015
Figure 16. Temporal evolution of weighted sea level anomaly (SLA) variance differences along-track (blue) and at crossovers (green) between GPD+ and ECMWF Operational model over the period of CS-2 sub-cycles 04 to 78 (RADS convention). “N. Xovers” represents the number of crossovers per sub-cycle. “Obs (%)” represents, for each sub-cycle, the percentage of points with available observations for the GPD+ WTC estimation.
Remotesensing 08 00851 g016
Figure 17. Variance differences of SLA versus latitude (a) and distance from coast (b) between GPD and ECMWF Operational model over the period of CS-2 sub-cycles 04 to 78 (RADS convention). In the right panel, the orange and blue plots represent the results for the whole range of latitudes and for the latitude band |ϕ| < 50°, respectively.
Remotesensing 08 00851 g017
Figure 18. Weighted along-track SLA variance differences (a); and weighted SLA variance differences at crossovers (b) between GPD and ECMWF Operational model over the period of CS-2 sub-cycles 04 to 78 (RADS convention).
Remotesensing 08 00851 g018aRemotesensing 08 00851 g018b
Figure 19. Location of along-track points selected for the GPD+ computation (points with flag_MWR_rej ≠ 0) for GFO cycles 98 (a); and 135 (b). Brown: land points near the coast; dark green: points with radiometer land flag set to 1; light green: points with distance from coast less than 30 km; blue: points contaminated by ice or outside limits if located at latitudes |ϕ| > 45°; pink: points rejected by outlier detection criteria or with the MWR WTC outside limits (see text for details). It should be noted that for the tracks for which all points are rejected, the algorithm attributes the ice rejection criterion to all points in the latitude bands |ϕ| > 45°, while indeed all points in the track are outside limits.
Remotesensing 08 00851 g019
Figure 20. Formal error (in cm) of the GPD+ wet tropospheric correction for GFO cycle 135.
Remotesensing 08 00851 g020
Figure 21. Comparison of the along-track WTC for GFO cycle 49, passes 13 (a); and pass 296 (b) the GPD+ WTC is shown in black, while MWR- and ERA-derived WTC are shown in red and blue, respectively. Colour bars indicate MWR WTC values flagged as invalid due to ice contamination (cyan) or due to land proximity (distance from coast less than 30 km, light green) and rejected by outlier detection criteria or with the MWR WTC outside limits (grey).
Remotesensing 08 00851 g021
Figure 22. Along-track GFO GPD+ WTC for pass 2 of cycle 136 (a); and pass 61 of cycle 166 (b). For both these cycles, the MWR-derived WTC is unavailable and has been set to a positive value, and therefore is not shown within the chosen y-axis limits.
Remotesensing 08 00851 g022
Figure 23. Temporal evolution of weighted along-track SLA variance differences between GPD+ and ERA (blue) and between GPD+ and on-board MWR (orange) for GFO cycles 37 to 223. “Estimated GPD points (%)” represents, for each cycle, the percentage of points with a new GPD+ estimate. In the differences with respect to WVR, the cycles with the largest differences, most of them with 100% of points with invalid MWR-derived WTC, are not shown.
Remotesensing 08 00851 g023
Figure 24. Temporal evolution of weighted SLA variance differences at crossovers between GPD+ and ERA (blue) and between GPD+ and on-board MWR (green) for GFO cycles 37 to 223. “N. Xovers” represents the number of crossovers per cycle. In the differences with respect to the WVR-derived WTC, the cycles with the largest differences, occurring after cycle 180, are not shown.
Remotesensing 08 00851 g024
Figure 25. Temporal evolution of weighted SLA variance differences along-track (green) and at crossovers (blue) between GPD+ and ERA Interim over the period of GFO sub-cycles 37 to 223. “N. Xovers” represents the number of crossovers per cycle. Only points with valid WVR measurements, according to the GPD+ validity criteria, have been used in this comparison.
Remotesensing 08 00851 g025
Figure 26. Spatial distribution of the weighted SLA variance differences at crossovers between GPD+ and ERA (a); and between GPD+ and WVR-derived WTC (b) over the period corresponding to GFO cycles 37 to 223. In the differences with respect to MWR, observations outside limits and those from the cycles with the largest differences have not been considered.
Remotesensing 08 00851 g026
Figure 27. Variance differences of SLA versus latitude (a); and distance from coast (b) between GPD+ and ERA (blue) and between GPD+ and WVR-derived WTC (orange) over the period of GFO cycles 37 to 223. Note the two different scales in the right panel. In the calculation of the differences with respect to WVR-derived WTC, the cycles with the largest differences have not been considered.
Remotesensing 08 00851 g027
Table 1. Main orbital characteristics (compared with those of CryoSat-2 and Geosat Follow-on (GFO)) of the satellites with scanning microwave radiometer (MWR) images of Total Column Water Vapour (TCWV) available for this study. Grey-shaded rows refer to gridded products and the remaining to swath products.
SatelliteSensorHeight (km)Inclination (°)Period (min)Sun-Synch. OrbitData Availability for Cryosat-2
CryoSat-2-71792.093.2Nosince April 2010
GFOWVR800108.0100.0NoFebruary 1998–September 2002
DMSP-F08SSM/I85698.8102.1YesJune 1987–December 1991
DMSP-F10SSM/I78598.8100.5YesDecember 1990–November 1997
DMSP-F11SSM/I86098.8101.9YesNovember 1991–May 2000
DMSP-F13SSM/I85098.8102.0YesMarch 1995–November 2009
DMSP-F14SSM/I85298.8102.0YesMay 1997–August 2008
DMSP-F15SSM/I85098.8102.0YesDecember 1999–May 2013
DMSP-F16SSM/IS84598.9101.8Yessince October 2003
DMSP-F17SSM/IS85098.8102.0Yessince December 2006
NOAA-15AMSU-A80798.5101.1Yessince July 2003
NOAA-16AMSU-A84999.0102.1YesJuly 2003–June 2014
NOAA-17AMSU-A81098.7101.2YesJuly 2003–April 2013
NOAA-18AMSU-A85498.7102.1Yessince August 2005
NOAA-19AMSU-A87098.7102.1Yessince May 2009
MetOp-AAMSU-A81798.7101.4Yessince May 2007
MetOp-BAMSU-A81798.7101.4Yessince April 2013
AQUAAMSR-E70598.099.0YesMay 2002–October 2011
GCOM-W1AMSR-270098.298.0Yessince May 2012
TRMMTMI40235.093.0NoDecember 1997–March 2015
CoriolisWindSat83098.8101.6Yessince February 2003
GPMGMI40765.093.0Nosince March 2014
Table 2. Calibration parameters (scale factor, offset and linear trend) of the WTC for each sensor with respect to the adopted reference and RMS of the differences between these datasets after calibration. Reference missions adjusted to FXX are highlighted in grey; GFO adjusted to TOPEX/Poseidon (TP), Jason-1 (J1) and Jason-2 (J2) is highlighted in blue; SI-MWR sensors highlighted in red have been adjusted to TP, J1 and J2.
SatelliteOffsetScale Factor (cm)Trend (mm/Year)RMS after Adjustment (cm)
TP−0.80530.97810.15000.913
J1−0.50850.9872−0.04920.838
J2−0.62460.9798−0.17750.922
GFO0.47110.99320.01531.096
NOAA-15−0.45231.0173−0.09061.125
NOAA-16−0.51161.0122−0.09631.007
NOAA-17−0.92490.98800.10270.979
NOAA-18−0.32751.0109−0.11111.019
NOAA-19−0.11601.0100−0.25241.012
MetOp-A−0.52711.0017−0.10521.007
MetOp B−1.00081.0006-1.110
AQUA−0.06130.99090.01490.812
GCOM-W1−0.14110.9917-0.719
Coriolis0.03400.9899−0.09680.779
TRMM0.02040.9964−0.02351.001
GPM−0.26220.9875-0.771