Article

Spatially-Explicit Testing of a General Aboveground Carbon Density Estimation Model in a Western Amazonian Forest Using Airborne LiDAR

by
Patricio Xavier Molina
1,2,*,
Gregory P. Asner
3,
Mercedes Farjas Abadía
2,
Juan Carlos Ojeda Manrique
2,
Luis Alberto Sánchez Diez
2 and
Renato Valencia
4
1
Gestión de Investigación y Desarrollo, Instituto Geográfico Militar, Seniergues E4-676 y Gral, Telmo Paz y Miño, El Dorado 170403, Quito, Ecuador
2
Technical University of Madrid (UPM), C/Ramiro de Maeztu, 7, Madrid 28040, Spain
3
Department of Global Ecology, Carnegie Institution for Science, 260 Panama Street, Stanford, CA 94305, USA
4
Laboratorio de Ecología de Plantas, Escuela de Ciencias Biológicas, Pontificia Universidad Católica del Ecuador, Apartado 17-01-2184, Quito, Ecuador
*
Author to whom correspondence should be addressed.
Remote Sens. 2016, 8(1), 9; https://doi.org/10.3390/rs8010009
Submission received: 24 September 2015 / Revised: 20 November 2015 / Accepted: 15 December 2015 / Published: 23 December 2015

Abstract

:
Mapping aboveground carbon density in tropical forests can support CO2 emission monitoring and provide benefits for national resource management. Although LiDAR technology has been shown to be useful for assessing carbon density patterns, the accuracy and generality of calibrations of LiDAR-based aboveground carbon density (ACD) predictions with those obtained from field inventory techniques should be intensified in order to advance tropical forest carbon mapping. Here we present results from the application of a general ACD estimation model applied with small-footprint LiDAR data and field-based estimates of a 50-ha forest plot in Ecuador’s Yasuní National Park. Subplots used for calibration and validation of the general LiDAR equation were selected based on analysis of topographic position and spatial distribution of aboveground carbon stocks. The results showed that stratification of plot locations based on topography can improve the calibration and application of ACD estimation using airborne LiDAR (R2 = 0.94, RMSE = 5.81 Mg·C·ha−1, BIAS = 0.59). These results strongly suggest that a general LiDAR-based approach can be used for mapping aboveground carbon stocks in western lowland Amazonian forests.

Graphical Abstract

1. Introduction

Tropical forests are important carbon and biodiversity reserves, and characterizing the spatial distribution of their aboveground carbon density (ACD; units of Mg of carbon per hectare or Mg·C·ha−1) is a prerequisite for understanding the spatial and temporal dynamics of the terrestrial carbon cycle. Accurate estimations of ACD and any changes in carbon stocks due to human activities are required in order to reduce emissions from deforestation and forest degradation (REDD+), and so contribute to the efforts being made to mitigate climate change [1]. Tropical forests hold large stores of carbon, yet uncertainty remains regarding their precise contribution to the global carbon cycle and how it is distributed in space and time [2,3]. In the last ten years, estimating carbon capture reserves in tropical forests has evolved from activities based mainly on inventories carried out in the field [4] to approaches based on airborne and spaceborne remote sensing [5,6,7,8,9].
Modern forest ecology and management applications require accurate maps so that their dynamics, biodiversity and carbon content can be tracked through time, especially in ecologically fragile and/or inaccessible regions, as is the case of many tropical forests. Several studies on estimating ACD have been carried out using different approaches [10,11,12]. The most widely used LiDAR-based approaches to ACD prediction are based on regression models that combine LiDAR metrics with field estimations of carbon stocks in forest plots. The derived model is then used to assess ACD across larger geographic areas. In the last five years, studies to estimate ACD in tropical forests have been performed using a plot-aggregate allometric approach [13,14,15].
The plot-aggregate allometry approach [16,17] for estimating ACD from airborne LiDAR has provided estimates that are comparable in predictive power to locally-calibrated models. This approach is based on a simplified general model showing that dry tree biomass, and its carbon content, roughly ~48% of dry biomass by weight [18], can be estimated from LiDAR-derived top-of-canopy height (TCH), basal area and wood density information. This approach has the potential to reduce the time required to calibrate airborne LiDAR data; however, it requires testing in new regions.
Although broad-scale mapping is based primarily on remote sensing data, the accuracy of resulting forest carbon stock estimates depends critically on the quality of field measurements and calibration procedures [19]. A careful quantification of local spatial variability and spatial structure in ACD should be useful for remote sensing calibration efforts. Reported errors associated with LiDAR-based carbon maps range from 17 to more than 40 Mg·C·ha−1 (RMSE) in the tropics [20]. These errors apply to the calibration step (i.e., the ability of LiDAR to predict the carbon density of a set of field inventory plots as assessed by a regression model), and not necessarily to carbon maps produced by such regression.
The size of field plots is an important design parameter in forest inventory using LiDAR, as it has the potential to either reduce or inflate the impact of edge effects [21] and co-registration error on ACD estimates [22]. Disagreement in protocol between LiDAR and field observations—namely the effects of bisecting tree crowns in LiDAR data versus calling a tree “in” or “out” of the plot in field data—decreases to a manageable level when field plots reach 1 ha in size [20]. The spatial variability in ACD is large for standard plot sizes (e.g., 0.1, 0.25, 1 ha), averaging 46.3% for replicate 0.1 ha subplots within a single large plot, and 16.6% for 1 ha subplots [19]. Furthermore, large parcels are needed for dynamic forest studies in order to include all the important populations of most of the species present, especially in tropical forests [23]. Errors in estimating forest structural attributes tend to decline and highest coefficient of determination (R2) values are reached by combining large plot sizes [21] and high density LiDAR data [24]. A review of studies published on estimating ACD using LiDAR [25] concludes that there is an uncertainty level between airborne and field-based ACD estimates of around 10% when plot size is approximately 1 ha. Plot sizes of around 1 ha are usually considered to give sufficiently accurate results in forest biomass estimation [26].
Marvin et al. [27] found that an average sample size of 44 plots of 1 ha in the lowland Peruvian Amazon are needed to reliably (i.e., a probability of 0.9) estimate ACD to within 90% of the actual landscape-scale (102–104 ha) mean value. The results obtained in [19] show the importance of keeping the topography in mind, and suggest that sampling should be stratified by topographic position (e.g., ridges, valleys and slopes), especially when the estimations involve a terrain-based approach.
The accuracy of carbon stock estimations also depends on reliable allometric models being available in order to estimate AGB from forest inventories [28,29,30]. Estimating biomass in tropical forests is limited by the available information on the allometry of tropical tree species. When it turns out to be impossible to obtain allometric relationships for a specific area of interest, pre-existing allometric equations are normally used. Due to the large number of studies in which these relationships are documented [31], it is important to identify the most suitable equations [32].
The objective of this study was to calibrate and evaluate the use of a general LiDAR-based approach for estimating ACD in a western lowland Amazonian forest of Ecuador, where little work has been undertaken in the past. We used geo-statistical modeling techniques and LiDAR-derived topographic features to locate plots for fitting and validating the general ACD estimation model.

2. Data and Methods

2.1. Study Area

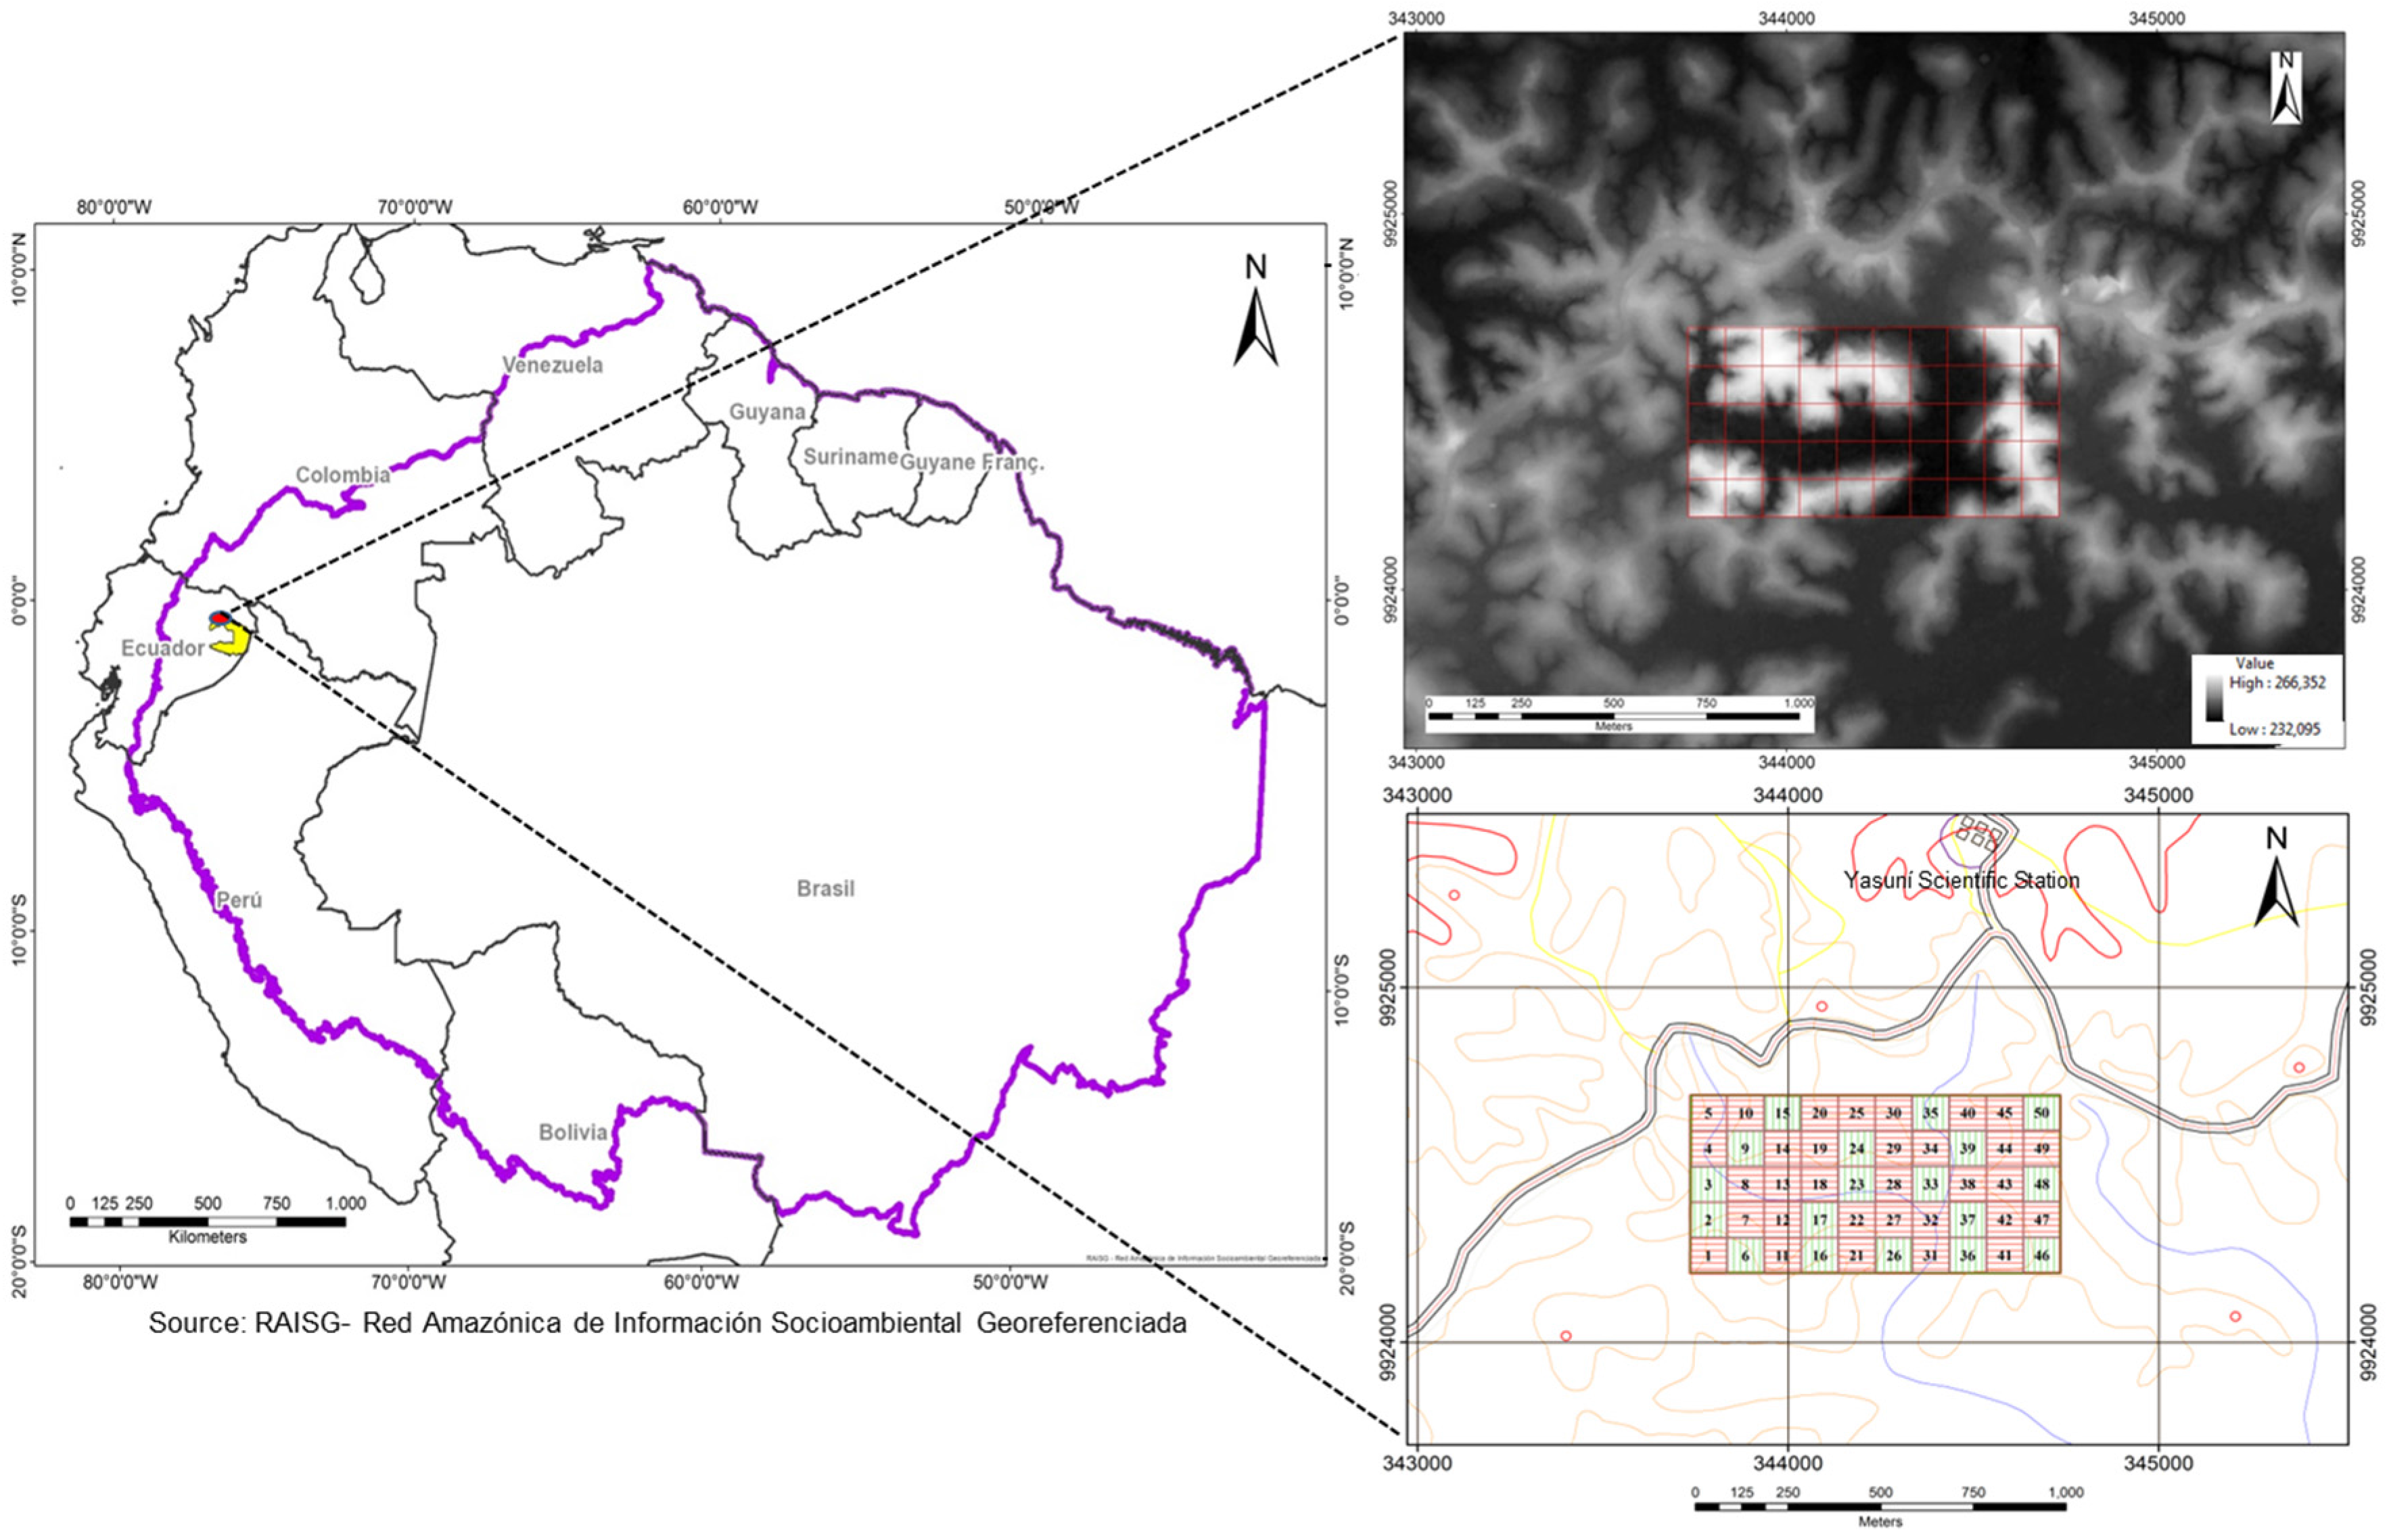
The study area is located at 0°41′S and 76°24′W, to the south of the Tiputini River, in the Yasuní National Park (PNY) of Ecuador (Figure 1). This park contains a high concentration of western lowland Amazonian species, making it one of the highest biodiversity regions in the world [33]. Due to its wealth of natural life, in 1995 the Catholic University of Ecuador, together with the Smithsonian Tropical Research Institute and the University of Aarhus, selected an area of 50 ha in the northwest of the Yasuní National Park to study the distribution and dynamics of species. The first census of the west 25 ha showed that 1104 species were coexisting in this area [34], which represent more species of trees than in North America. The Yasuní plot is part of a global network of 61 large permanent plots associated to the Center for Tropical Forest Science (CTFS) [35].
Figure 1. (Left) Location of the study area (red point) within the Yasuní National Park (in yellow) in the western Amazonian Basin. (Upper right) Digital Terrain Model of the 50-ha forest plot (centered rectangle). (Lower right) A regular grid system of 1-ha subplots used for calibration (red) and validation (green) of the airborne LiDAR model for aboveground carbon density estimation.
Remotesensing 08 00009 g001
The plot is 50 ha in size, with an average topographic gradient of 13%, and an elevation range of 215–249 m above sea level. The study area is crossed by a valley that divides it into three groups of small hills. The southwest portion of the plot contains a 0.48-ha patch of secondary forest corresponding to a heliport, abandoned around 1987, during oil exploration. The plot contains two types of characteristic and dominant topographical environments: valleys and ridges. The valleys include several small permanent streams and swamps associated with a depression to the east of the study area. A swampy area, topographically recessed, contains water throughout the year. Both the northern and southern boundaries consist of low ridges with some steep-sided gullies. The lowest zones between the ridges contain grey and brown sedimentary deposits. Most of the soil in the Yasuní National Park is classified as Ultisol, but the swamps and floodplains are dominated by Histosols, which are prone to flooding [36]. The plot is located in lowland evergreen forest of the western Amazon region.

2.2. Field Data

2.2.1. The Forest Census Data

The first forest census was carried out from 1995 to 1997 in the west 25 ha of the plot, and after that, several censuses were carried out in different portions of the 50-ha plot. Trees were measured and tagged following a standard method used by the global network of large forest plots [37]. In the first census, all trees ≥1 cm were measured, and 1104 morphospecies were identified among 152,353 individuals. Several species of understory treelets in the genera Matisia and Rinorea dominated the forest, while important canopy species were Iriartea deltoidea and Eschweilera coriacea. The swampy area occupying 1 ha in the eastern half of the plot is most notably different. The palm Mauritia flexuosa (Palmae), a Sapium sp. (Euphorbiaceae), and several species of Piper (Piperaceae) are found only in the swamp [36,37,38]. The canopy is 15–30 m tall, and some emergent trees reach 40–50 m in height.
The first complete forest census of the 50-ha plot was conducted from 2002 to 2006. Detailed information on taxonomic and ecological characteristics of tree species in the 50-ha plot can be found in [39]. For this study, measures of stem diameters at breast height (D) for all individuals in the 50-ha plot and wood density data (wood specific gravity) were used to compute ACD. Wood density data were taken from the literature or obtained from direct measurements in and around the plot. Tree height was unavailable in these censuses.

2.2.2. Field-Based Aboveground Biomass Estimation

It has often argued that local allometric equations should be constructed in as many sites and for as many species as possible. However, the extreme diversity of the species in Yasuní National Park prevents the allometry of specific species being developed, so that generalist relationships are usually applied. We estimated AGB using a new allometric model [30] shown in Equation (1), which is used in cases in which tree height is not known and includes variables such as trunk diameter, wood density, and the bioclimatic stress variable (E). The value of the E parameter for Yasuní National Park is −0.0228121.
A G B i = exp [ 1.803 0.976 E + 0.976 ln ( ρ ) + 2.673 ln ( D ) 0.0299 [ ln ( D ) ] 2 ]
where D represents trunk diameter at breast height in cm, and ρ is wood density of each tree in g·cm−3. The quantity of AGB (in Mg·ha−1) of all trees in the entire plot was calculated from the data obtained in the census. Within each 1-ha subplot, AGB was calculated by summing AGB estimates for all trees whose stems were located within the subplot and expressing this on a per ha-basis (Equation (2)). A summary of the field plot characteristic is presented in Table 1.
A G B S U B P L O T = i = 1 n A G B i
Table 1. Characteristics of 1-ha field plots.
CharacteristicRangeMean
N a (ha−1)4680–74306012.68
D b (cm)1–18519.30
BA c (m2·ha−1)25.38–39.7832.84
AGB d (Mg·ha−1)161.47–339.39250.25
a number of trees; b diameter at breast height (1.3 m); c basal area; d aboveground biomass.

2.2.3. Georeferencing of the Field Plots

Any errors in identification or imprecision of the estimated variables are often attributed to discrepancies between the information on the reference plots obtained on the ground and that obtained from LiDAR [22,40]. To avoid such discrepancies, a planimetric survey was carried out to precisely locate the coordinates of the plot’s corners, and to correlate the data obtained from the forest census with that obtained from the airborne LiDAR system. The Horizontal Reference System used in the survey was the Geocentric Reference System for the Americas (SIRGAS–ECUADOR) [41], which is compatible with GNSS satellite positioning system. Four geodetic survey markers using GNSS technology and formed the baselines for the planimetric survey. Observations were made from the Y-NPF geodetic survey marker, which belongs to Ecuador’s GPS RENAGE network. The coordinates of the geodetic survey markers were fixed by the static phase differential GPS positioning method using TRIMBLE R8 dual frequency receivers which can measure baselines up to 200 km long with an accuracy of ±0.005 m + 1.0 ppm. Horizontal precision was set at <0.050 m + 1.0 ppm, and vertical precision at <0.100 m + 1.0 ppm. The basic geodetic network was then used to carry out the observations required to calculate the coordinates of the four corners of the plot (Table 2) using a TRIMBLE S3 total station with a precision of 2′′.
Table 2. Coordinates of the four corners of the plot (UTM 18S).
Plot CornerEast (m)North (m)Precision (m)Ellipsoidal. Elev.
NW343,737.7949,924,696.4110.050249.31
SW343,735.0239,924,196.0860.050252.79
NE344,733.9589,924,695.2360.050244.89
SE344,734.0859,924,195.1800.050252.07

2.3. LiDAR Data

2.3.1. Data Collection

The LiDAR data were acquired in May 2014 from a Cessna 172 Skyhawk aircraft, which can cover a large area at low altitudes and low speeds. The LiDAR sensor used in the airborne platform was an Optech ALTM Gemini. Flight data and configurations are given below in Table 3:
Table 3. Flight data and LiDAR configuration.
Flight DataLiDAR Configuration
Height above ground (m)781.25Pulse frequency repetition (Khz)166
Distance between lines of flight (m)203.89Scanning frequency (Hz)40
Overlapping50%Scan angle /FOV±15
Speed (m/s)56.6Nominal density of pulses per m25.08
Flight lines16Sweep width (m)407.78
Number of returnsUp to 4
Laser beam divergence (mrad) (IFOV)0.8
Space between points (m)0.24
Density of points per m219.4

2.3.2. LiDAR Data Processing

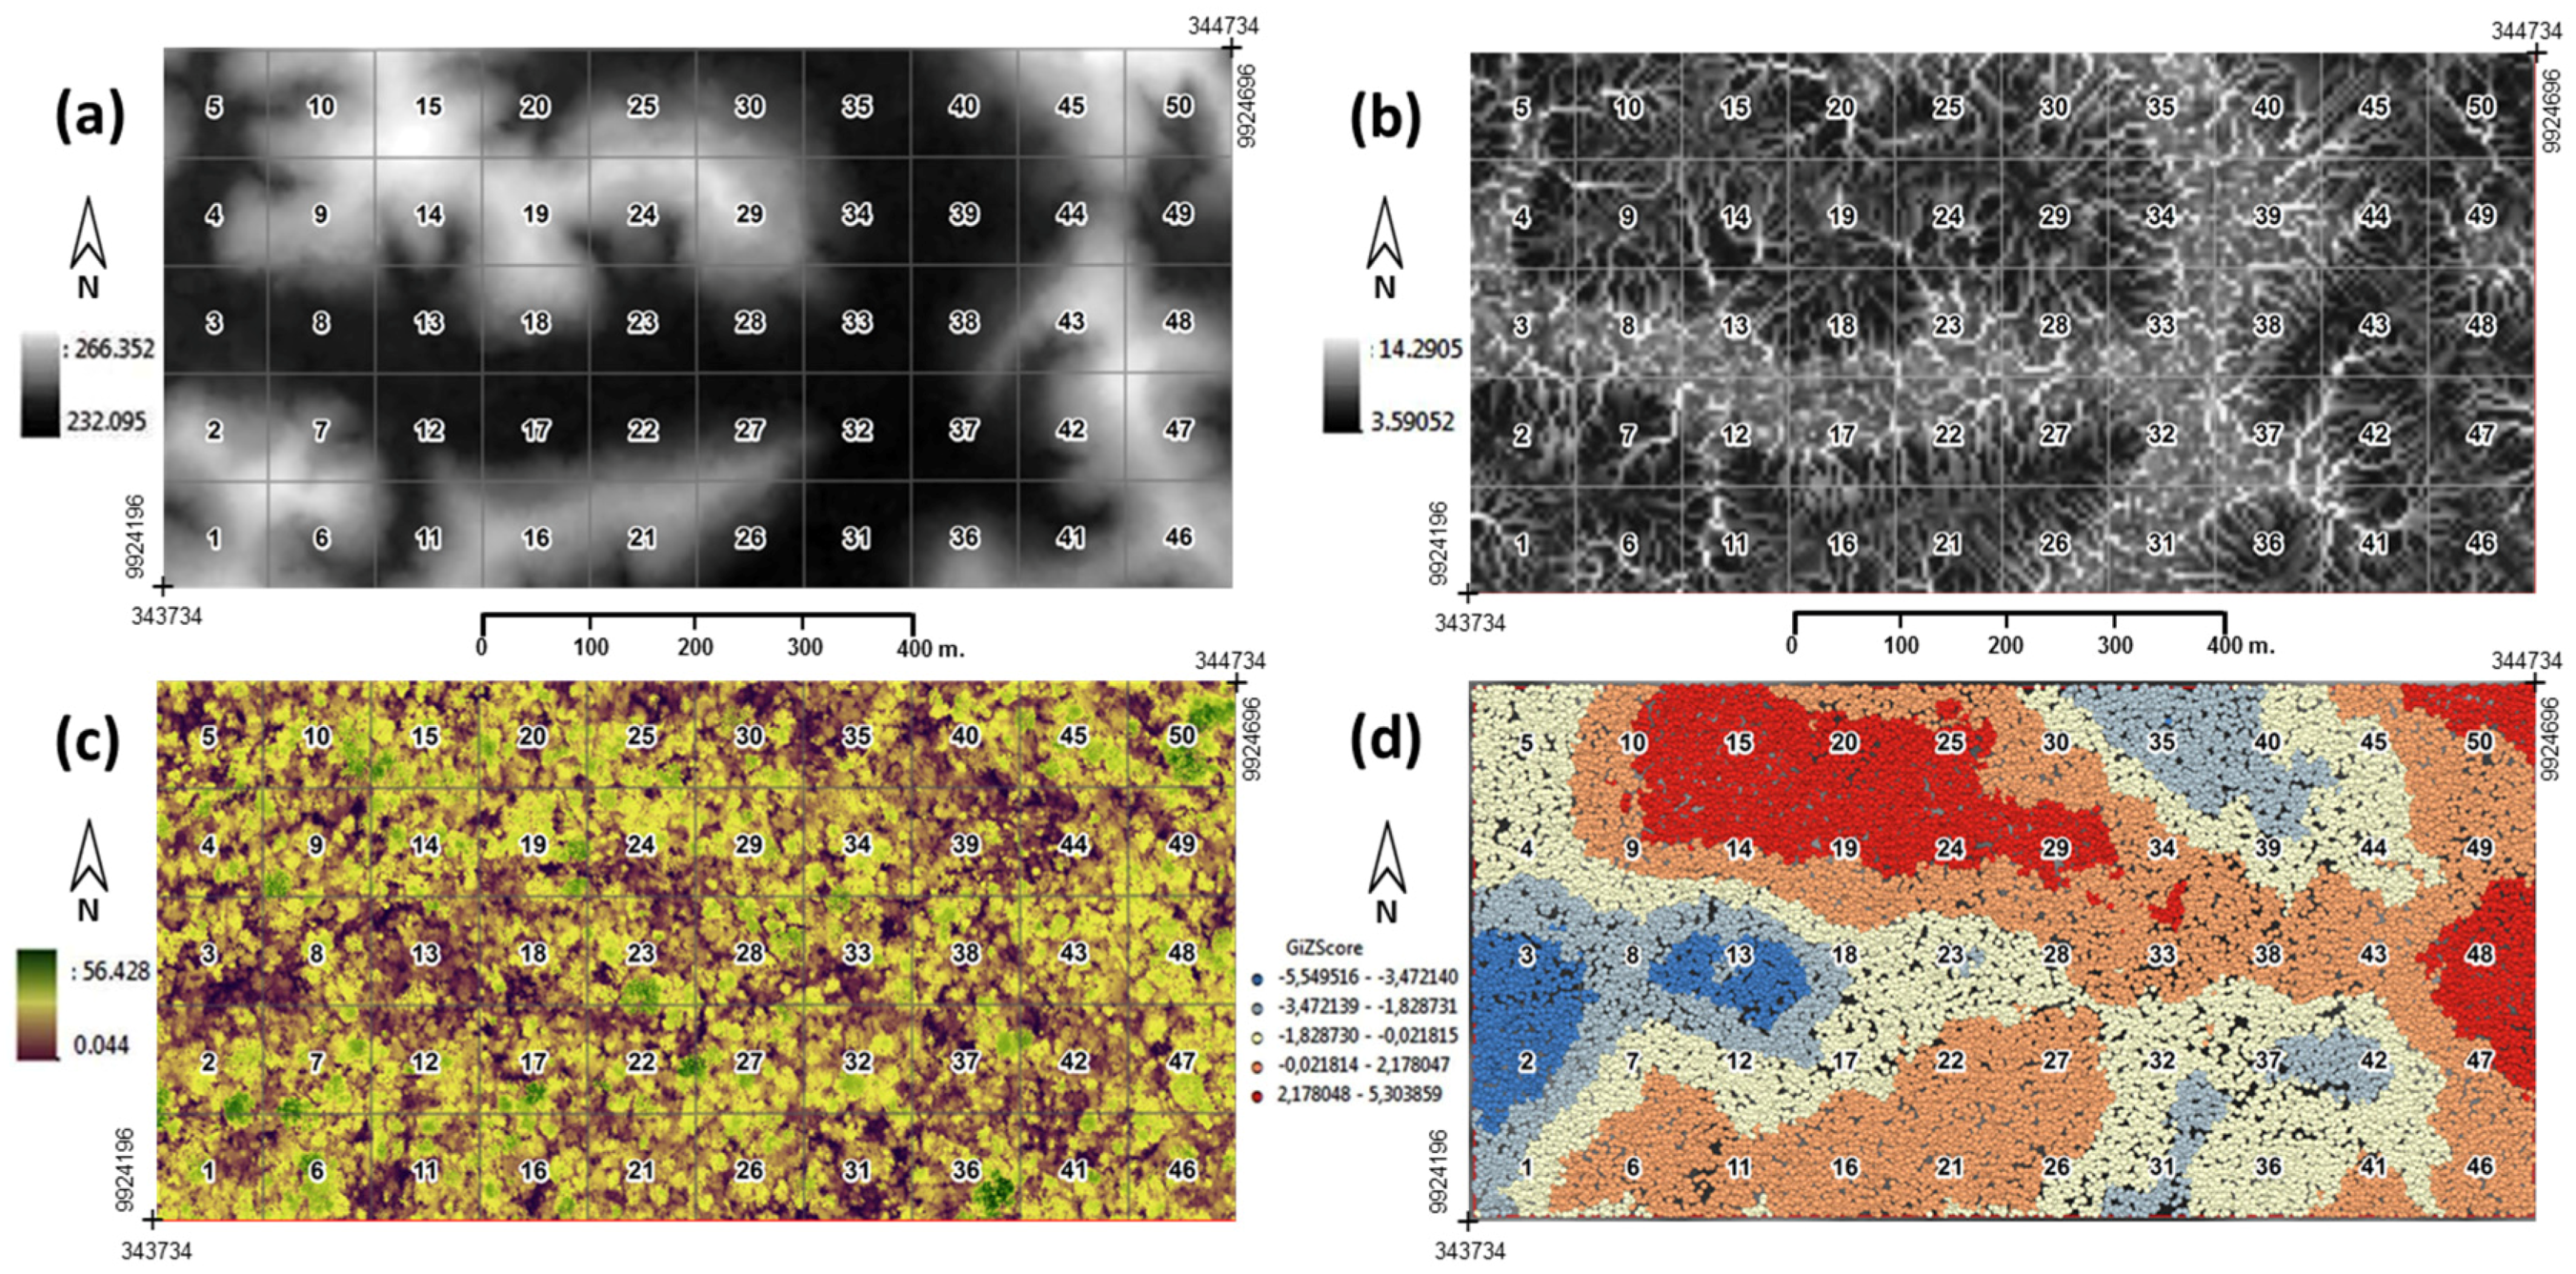
Estimating the tree canopy height using LiDAR data relies on an accurate representation of the ground surface in a Digital Terrain Model (DTM). Any errors in the DTM will propagate and affect the accuracy of the derived vegetation metrics [26,42,43] and canopy height models (CHM) [44,45]. The DTM (Figure 2a) was obtained by applying the procedure described in [17]. The vertical accuracy of the DTM was assessed using GNSS measurements for georeferencing the 50-ha plot. The LiDAR data were normalized at ground level and gridded into 1-ha subplots using LAStools [46].
The canopy height model (CHM) (Figure 2c) was obtained as the difference between the digital surface model (DSM) and the DTM [47]. In each 1-ha subplot, the average of all 0.5 m CHM pixels was used to estimate mean subplot top-of-canopy height (TCH).
Figure 2. Variables used to select subplots for fitting and validating the general model. (a) Digital Terrain Model at 5 m spatial resolution; (b) Compound Topographic Index at 5 m spatial resolution; (c) Canopy Height Model at 0.5 m spatial resolution; and (d) Hot Spot Analysis of ACD distribution.
Remotesensing 08 00009 g002

2.4. Data Analysis

2.4.1. Selection of Subplots for Fitting and Validating the General Model

LiDAR is capable of characterizing both terrain and vegetation structure. However, LiDAR-based DTM variables have been rarely used to plan plot locations in ACD calibration schemes. In the present study, when selecting the subplots for fitting and validating the model, we considered the spatial distribution of ACD and topographic position (e.g., valleys, ridges and slopes) in the 50-ha plot. The 1-ha subplot size was necessary to encompass substantial populations of most tree species in the community.
The sample design was a regular grid of 1-ha subplots, allowing us to capture spatial variation in ACD and forest structure throughout the study area. The X, Y coordinates of the southwest corner obtained in the planimetric survey were used as the starting point, so that the subplots and all trees whose stems were located within the subplots were geo-referenced. Subplots were numbered from 1 to 50 starting from the lower left-hand corner.
The DTM was used to calculate a topographic wetness index using the Compound Topographic Index (CTI) tool [48] in ArcGIS 10.1 (ESRI, Redlands, CA, USA: Environmental Systems Research Institute) (Figure 2b). The CTI is a function of both the slope and the upstream contributing area per unit width orthogonal to the flow direction [49]. Higher CTI values represent water accumulation (potential wetland formation), and lower CTI values represent dryness or steep places where water would not likely accumulate based on topography [50]. Zonal Statistics for each 1-ha subplot was summarized using Spatial Analyst tools for DTM and CTI. Pearson’s correlation coefficient was calculated to analyze relationships between field-ACD and mean elevation (r = 0.6794) and mean CTI (r = −0.5902) in each 1-ha subplots. The Hot Spot Analysis tool (Getis-Ord Gi * statistic) in spatial statistics tools in ArcGIS, were used to locate the patterns of biomass distribution in the plot (Figure 2d). This tool identifies clusters or statistically significant spatial clusters of high values (hot spots) and low values (cold spots) that provide important insights into the underlying processes that produce spatial patterns. An incremental spatial autocorrelation tool was used to test for spatial autocorrelation within distance bands, measuring the intensity of spatial clustering for each distance.
The sampling was then stratified by topographic position: valley, slope and ridges. These three topographic positions were defined after evaluating DTM and CTI zonal statistics in each 1 ha subplot. A valley was defined as all 1-ha subplots with mean elevation <239.10 m and mean CTI >6.60. The ridge was defined as all 1-ha subplots with mean elevation >248.20 m and mean CTI <6.12. The remaining 1-ha subplots were defined as slope (Table 4).
Table 4. Summary Statistics for the LiDAR plot 1-ha grid of study area.
Topographic PositionNumber of PlotsMean (SD)
LiDAR TCHBasal AreaWood DensityAGBfield
(m)(m2·ha−1)(g·cm−3)(Mg·ha−1)
Valley1820.60 (1.8)24.37 (2.5)0.557 (0.01)198.24 (29.5)
Ridge1623.50 (1.1)29.90 (2.6)0.574 (0.01)265.39 (33.3)
Slope1521.47 (1.9)27.41 (3.1)0.563 (0.01)228.30 (37.06)
RSF122.74 30.760.471 199.40
RSF = Ridge with remnant of secondary forest; TCH = Top of canopy height.
We selected 66% of the sample for the fitting of the model (32 subplots) and 34% for validating the model (18 subplots) using random sampling in every topographic position (Figure 1). Subplot #2, which contained secondary forest (0.48 ha), was used for model validation. In the data exploratory analysis, two atypical subplots were identified (36, 50) as having the largest trees in the area. Both subplots presented the highest values of coefficient of variation in elevation and variance. These were left out of the fitting process but were included for model validation. Only trees with a diameter at breast height (dbh) of ≥10 cm were considered when fitting the model. Previous study on AGB estimation by habitats in 25-ha of the plot, reported that trees <10 cm dbh contributes ~5% in ridge and ~7% in valley of total AGB [51].

2.4.2. LiDAR Model Application

The most widely used LiDAR-based approaches to ACD prediction are based on regression models that correlate LiDAR metrics with field estimations of biomass in forest plots. The models are obtained from a statistical analysis to ensure consistency, mathematical rigor and predictive power. We used the plot-aggregate allometric approach [17] (Equation (3)).
A C D = a T C H b 1 B A b 2 W D B A b 3
where ACD is the AGB obtained from Equation (2) and multiplied by 0.48, TCH is the top of canopy height obtained by LiDAR, BA is the basal area (i.e., cross-sectional area of all stems), estimated using individual tree diameter and WDBA is basal area-weighted wood density taken from the literature or obtained from direct measurements in and around the plot. Equation (3) was fitted using multiple linear regression on ln-transformed subplot level data for ACD, TCH, BA and WDBA at 1-ha subplots in the form:
ln ( A C D ) = ln a + b 1 ln ( T C H ) + b 2 ln ( B A ) + b 3 ln ( W D B A )
Model fitting and diagnostics were performed with R Commander Software [52]. After fitting the model we assessed the following issues [53]: (i) normal residuals; (ii) homoscedastity (constant variance); (iii) linear relationship; (iv) presence of atypical observations; and (v) absence of colinearity. The model estimated satisfies all the conditions. A rigorous model validation process requires that the results be verified with a sample different from the one used to build it. We therefore validated the model by applying 18 subplots selected for this purpose.

3. Results

We back-transformed the final model, since we were interested in the ACD parameter per hectare and not its natural logarithm. The model was multiplied by a correction factor (CF) to account for the back-transformation of the regression error [54]. The correction factor is given by CF = e MSE/ 2 where MSE is the mean square error of the regression model. In this case it is equal to 1.00044. The equation thus became (Equation (5)):
A C D = 2.15813 * T C H 0.14015 B A 1.2292 W D 0.9839
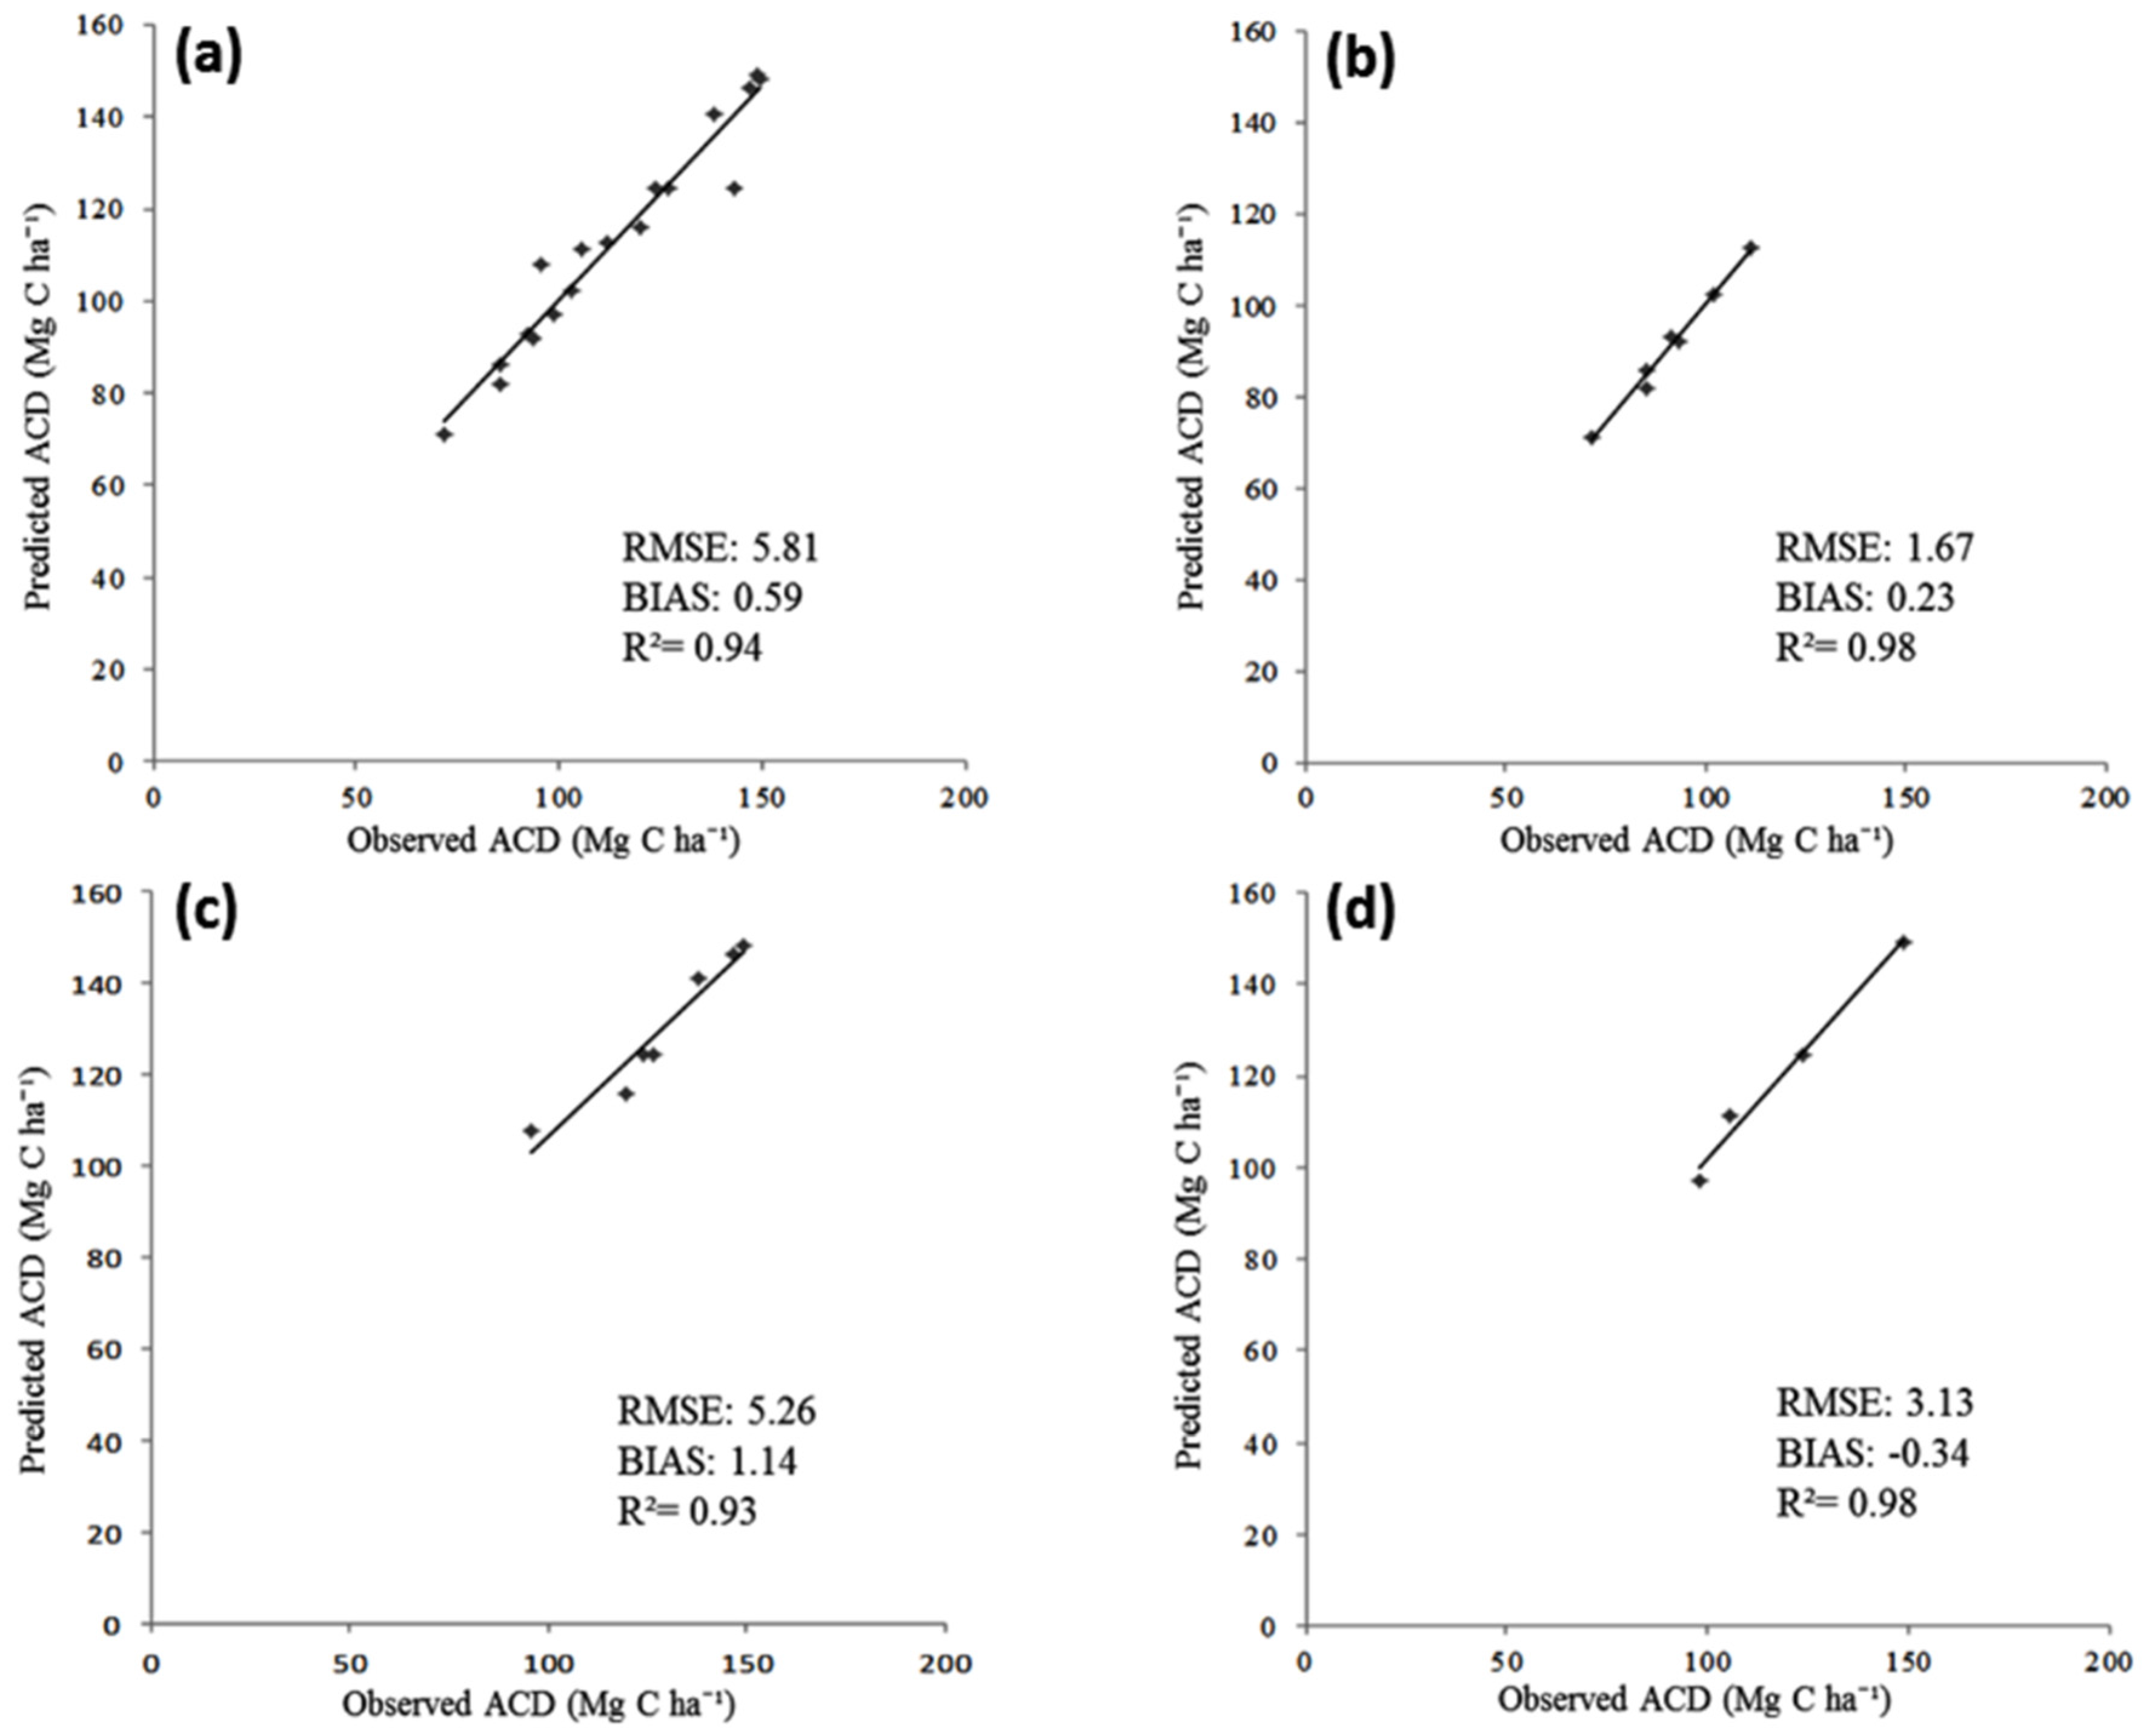
When we applied the resulting model (Equation (5)) to the validation plots, we obtained the results as shown in Figure 3. The LiDAR-based ACD equation accurately and precisely predicted field plot-based ACD in eighteen plots (Figure 3a). The low bias (0.59 Mg·C·ha−1) and RMSE (5.81 Mg·C·ha−1), along with an adjusted R2 of 0.94, validates the use of plot-aggregate allometric approach for estimating ACD in the study area. The final model was spatially sensitive to ACD variation in valley, ridge and slope areas (Figure 3b–d), which were the main habitats in the zone.
Figure 3. (a) Validation of the general ACD model in eighteen independently 1-ha plots. The performance of the general model is shown for topographic position at (b) valley; (c) ridge including plot with remnant of secondary forest; and (d) slope. RMSE = root mean squared error, BIAS = mean errors.
Remotesensing 08 00009 g003
Our results strongly suggest that the spatial arrangement of forest carbon stocks, based on topographic location, influences the accuracy of estimates of ACD in western lowland Amazonian mature forest achieving an overall accuracy of 5% at 1-ha resolution (RMSE = 5.81 Mg·C·ha−1 relative to forest carbon density of ~120 Mg·C·ha−1). The model validation for ACD estimation in ridge positions (Figure 3c) indicated higher bias and RMSE compared with the other topographic positions because these areas include the plot with remnant of secondary forest. Secondary forest growth is higher than adjacent mature forest on ridges where the growth is minimal [51], affecting the estimation of the model due to the time lag between field census and the LiDAR survey (RMSE = 2.33, bias = 0.74 and R2 = 0.97 without secondary forest).
For the fitting of the model, only trees with stem diameter ≥10 cm (34,567) were included for the field-based AGB estimation (11,438.68 Mg). However, total AGB estimations (12,512.59 Mg) were made for all the individuals (297,777) with diameter ≥1 cm in the entire 50-ha plot. Results show that 11.6% of all the trees in the 50-ha plot contribute approximately 91% of total ACD, while vegetation with diameters <10 cm provide 9% of the total. We also found that ACD differ by up to 100% for a vertical variation of only 30 m. The variation in ACD (78–163 Mg·C·ha−1) in a small elevation range suggests a strong influence of topographic position and confirms that topography should be taken into account in the forest inventory sampling design.

4. Discussion

Whether from a forest management or conservation perspective, it is important to establish a robust and confident methodology for estimating carbon stocks in tropical forest. The present study calibrated and evaluated ACD estimations by means of linear regression, considering the size and location of the plots in topographic positions used for fitting the general model.
We selected a regular grid of 1-ha subplots based on an underlying assumption that field plots (ca. 1 ha scale) are an unbiased sample of the landscape (ca. 102- to 104 -ha scale) [28,55], and previous findings of diminishing uncertainties between field-based and LiDAR-based estimates at this resolution [20]. The 1-ha grid scheme and the horizontal precision of the 50-ha plot corners (0.050 m) helped to reduce co-registration errors related to misalignment between field subplots and LiDAR data, as well as plot-edge effects. There is a tendency for errors to decrease in biomass estimates with increasing plot size, because large plots reduce the likelihood of plot-edge effects, which occur when the canopy of trees are found along the plot boundary [21]. Edge effects are likely more pronounced in less dense stands and where plot sizes are smaller [56]. The accuracy of plot-aggregate allometry used in this study appears to increase when averaging over more vegetation in larger plots since larger plots minimize the edge effects related to uncertainty in including or excluding a tree in the field survey. In the LiDAR calibration phase, use of small plots will always lead to inflated scatter and thus increased RMSE between LiDAR TCH (or any metric) and field-estimated ACD [17]. Although implementing larger plot sizes increase the costs and time needed for field sampling, large plots results in models with better performance, increase the accuracy of ACD predictions and reduce the variation in ALS-derived metrics [43].
The time lag between the forest census and LiDAR acquisition will also introduce errors in the final model. On the western 25 ha, Valencia et al. [51] examined aboveground biomass flux in different habitats and across diameter classes using data from two censuses separated by an average time interval of 6.3 years. They found that the forest lost small stems (4.6%), gained large trees (2.6%), and gained biomass (0.7%). The change in AGB stock was due entirely to this upward shift in size leading to more canopy trees and fewer saplings after just six year. Across habitats, the biggest increment in biomass was in the secondary forest patch (3.4% y−1), whereas mature forest on ridges and valleys had small increases (0.10% and 0.09% y−1, respectively). Relative to the difference between habitats, the 6 year change in AGB stock was almost trivial. The one exception was the increase in large trees in the secondary forest. The forest increased its standing biomass, but far less than the average reported for other Amazonian forest (i.e., 0.30 vs. 0.98 Mg−1·y−1). Similarly, change in basal area in the three previous censuses (1997, 2002, 2009) was negligible and accounted for maximum 1% (32.94, 32.90, 33.25 m2·ha−1, respectively). This can change in abnormal time periods but is very unlikely that it changes in aseasonal forest like Yasuni. Even in extreme years, like 2010, such a change did not showed a huge impact on large trees, judging by a subsampled check in the forest dynamics we carried out in year 2012 (<2% change in basal area). From these results we infer that the change in ACD stocks due to the time lag between the field census and the LiDAR survey are minimal.
Field-based ACD estimations were calculated using an improved allometric model [30]. This pantropical model (Equation (1)) is used for estimating ACD in the absence of height measurements and incorporates wood density, trunk diameter, and a variable called E. Equation (1) shows that information on wood density (as inferred from the taxonomic determination of the tree), trunk diameter, and the variable E (as inferred from the geolocation of the plot) is sufficient to provide a robust ACD estimate [30]. However, to minimize bias, the development of locally derived diameter-height relationships is advised whenever possible. Our estimations showed that the ridge and valley of the Yasuni forest are remarkably different in ACD (Table 1); the difference is due almost entirely to a higher number of very large trees on the ridge, and to a lesser extent from higher density wood on the ridge. The results obtained confirm the estimates made by Valencia et al. [39], particularly the differences in AGB between valley and ridge.
To explore patterns of ACD distribution within the 50-ha plot, hot-spot analysis was performed. in which spatial patterns of high ACD (hot spots) and low ACD (cold spots) were identified. As expected, subplots with high ACD were located in the ridge while the lowest ACD were founded in valley containing swamps (Figure 2d). Spatial autocorrelation was calculated using Moran’s index (<0.01), every 100 m to a distance of 500 m. ACD is less spatially clustered at 300 m (z-score = 3.479; p-value = 0.0005 and variance = 0). The compound topographic index (CTI), often referred to as the steady-state wetness index, is a quantification of catenary landscape position [57]. CTI is a useful indicator of ACD because it combines contextual and site information via the upslope catchment area and slope, respectively. Moore et al. [49] showed that the CTI is correlated with several soil attributes such as silt percentage, organic matter content, phosphorus and A horizon depth in the soil surface of a small toposequence. Kanagaraj et al. [58] found that CTI, slope and elevation were important drivers of species assemblage in the Barro Colorado Island plot. In our study, mean CTI at 1-ha subplot was correlated with field ACD estimations (r = −0.59); therefore, it was used as a variable together with mean elevation (r = 0.67) to allocate plots for the model calibration.
The high R2 values reached can be attributed to the influence of 1-ha plot size and LiDAR density points (~20 m−2) [24]. Although an analysis of LiDAR density and its influence on the estimation of ACD was not made in this study, a recent study by Leitold et al. [42] in tropical forest of Brazil, with complex topography (ranging from 100 m to 1100 m a.s.l.), reported errors of 80–125 Mg·ha−1 in predicted aboveground biomass for LiDAR return densities below 4 m−2. The canopy heights calculated from reduced density LiDAR data declined as data density decreased due to a systematic effect of pulse density in the construction of digital terrain model (DTM) attributed to the algorithm used to classify ground points. The study requires some caution when using generalized ACD models based on a single LiDAR metric (e.g., TCH), as in our case study, especially at low LiDAR return densities. Yet increasing point density mitigates the problem of accurate canopy height and DTM generation. In contrast to the study made by Leitold et al. [42], Hansen et al. [43], showed that canopy metrics derived from sparse laser pulse density data can be used for ACD estimation in a tropical forest in Tanzania. Reducing the laser pulse density from 8 to 0.25 pulses m−2 increased the variation in the DTMs and canopy metrics. However, the replication effects, expressed by the reliability ratio, were not important at pulse densities of >0.5 pulses m−2. In our study, using the four corners of the 50-ha plot, the mean difference in elevation between DTM and GNSS observations (−0.722 m) indicated a slight underestimate from LiDAR-derived terrain elevations in the study area. These results suggest that more research should be conducted to evaluate the influence of LiDAR point density on DTM generation and canopy metrics especially in tropical forests.
The calibration and validation accuracy of the model may depend on the number and size of the field plots available for analysis. For the calibration of the general approach used in this study, Asner et al. [17] reported an adj-R2 = 0.86 and RMSE = 13.2 Mg·C·ha−1 using a network of 754 field inventory plots distributed across a wide range of tropical vegetation types, climates and successional states. Here, our local model considering topographic location yielded an adj-R2 = 0.94 and RMSE = 5.81 Mg·C·ha−1 using 32 field plots of 1-ha for fitting the model and 18 field plots for validating the model. Given that all plots used for fitting and validating the local model were partitioned from a single large plot, our results should be interpreted with caution. It is important to recognize that having larger plots fully mapped and partitioned subplots, representing the host landscape, may lead to a more robust understanding of calibration uncertainties. We tested the general approach by acquiring the LiDAR model of top-of-canopy height, and combining them with spatially explicit estimates of basal area and wood density in the study area. However this approach allows for regional assessments of basal area and WDBA to replace exhaustive tree-specific measurements. In the simplest form, this approach used a single stocking coefficient (the ratio of BA to TCH) and a single wood density constant for each broad tropical region based on the literature. To apply the general model in a new region, exhaustive inventory would not be needed. Instead, spatially-explicit point-based estimates of BA (by relascope or prism method) and WDBA (by recording dominant species) could be collected within the coverage of a LiDAR TCH dataset. By regressing BA and WDBA onto TCH and substituting these regressions into the general model, regionally-tailored predictions could be generated.

5. Conclusions

A combination of LiDAR-derived topographic features (DTM and CTI), geo-statistical modeling techniques and plots tactically located and representative of the landscape, provide a consistent approach to calibrate a general LiDAR-based ACD model to a western Amazonian forest. In this study we assessed the errors in applying this calibration (i.e., the ability of LiDAR to predict the carbon density of a set of field inventory plots as assessed by the regression model), and not comparing to field-based methods. Fifty subplots of 1 ha were used to estimate and validate the general LiDAR-based ACD model, with uncertainty values of 5.81 Mg·C·ha−1 and a bias of 0.59 Mg·C·ha−1, along with an adjusted R2 of 0.94 indicates that the plot-aggregate allometric approach can be used to accurately estimate carbon stocks in the study area. The results showed that spatial stratification by topographic position may reduce bias in model calibration. The study also identified issues for further research related to the influence of pulse density and plot size to reliably estimate the metrics used to predict forest biomass in tropical forest.

Acknowledgments

Funding for this study was provided by the Secretariat for Higher Education, Science, Technology and Innovation of the Republic of Ecuador (SENESCYT). The Forest Dynamics Plot of Yasuní National Park has been made possible through the generous support of the US National Science Foundation, the Andrew W. Mellon Foundation, the Pontifical Catholic University of Ecuador, the Smithsonian Tropical Research Institute, and the University of Airbus of Denmark. The Yasuní Forest Dynamics Plot is part of the Center for Tropical Forest Science, a global network of large-scale demographic tree plots. The Principal Investigator of the Yasuni Forest Dynamics Plot is R. Valencia. We thank N. Vaughn of the Carnegie Airborne Observatory for assistance and advice with LiDAR data processing, and three anonymous reviewers for comments on a previous version of this manuscript. G.P. Asner was supported by the John D. and Catherine T. MacArthur Foundation. We gratefully acknowledge the support of Instituto Geografico Militar del Ecuador for LiDAR data collection. The Ecuadorian Ministerio del Ambiente granted permission for our work in Yasuní National Park.

Author Contributions

Patricio Xavier Molina, Mercedes Farjas Abadia and Gregory P. Asner conceived and designed the research. Juan Carlos Ojeda Manrique, Luis Alberto Sánchez Diez and Renato Valencia analyzed the data and revised the manuscript. Patricio Xavier Molina, Mercedes Farjas Abadía and Gregory P. Asner wrote the manuscript.

Conflicts of Interest

The authors declare no conflict of interest.

References

  1. Angelsen, A.; Wertz-kanounnikoff, S.; Redd, W. Moving Ahead with REDD Issues, Options and Implications; Angelsen, A., Ed.; Center for International Forestry Research (CIFOR): Bogor, Indonesia, 2008. [Google Scholar]
  2. Chave, J.; Andalo, C.; Brown, S.; Cairns, M.A.; Chambers, J.Q.; Eamus, D.; Fölster, H.; Fromard, F.; Higuchi, N.; Kira, T.; et al. Tree allometry and improved estimation of carbon stocks and balance in tropical forests. Oecologia 2005, 145, 87–99. [Google Scholar] [CrossRef] [PubMed]
  3. Mitchard, E.T.A.; Feldpausch, T.R.; Brienen, R.J.W.; Lopez-Gonzalez, G.; Monteagudo, A.; Baker, T.R.; Lewis, S.L.; Lloyd, J.; Quesada, C.A.; Gloor, M.; et al. Markedly divergent estimates of Amazon forest carbon density from ground plots and satellites. Glob. Ecol. Biogeogr. 2014, 23, 935–946. [Google Scholar] [CrossRef] [PubMed]
  4. Malhi, Y.; Wood, D.; Baker, T.R.; Wright, J.; Phillips, O.L.; Cochrane, T.; Meir, P.; Chave, J.; Almeida, S.; Arroyo, L.; et al. The regional variation of aboveground live biomass in old-growth Amazonian forests. Glob. Chang. Biol. 2006, 12, 1107–1138. [Google Scholar] [CrossRef]
  5. Asner, G.P.; Powell, G.V.N.; Mascaro, J.; Knapp, D.E.; Clark, J.K.; Jacobson, J.; Kennedy-Bowdoin, T.; Balaji, A.; Paez-Acosta, G.; Victoria, E.; et al. High-resolution forest carbon stocks and emissions in the Amazon. Proc. Natl. Acad. Sci. USA 2010, 107, 16738–16742. [Google Scholar] [CrossRef] [PubMed]
  6. Saatchi, S.; Houghton, R.A.; Dos Santos Alvalá, R.C.; Soares, J.V.; Yu, Y. Distribution of aboveground live biomass in the Amazon basin. Glob. Chang. Biol. 2007, 13, 816–837. [Google Scholar] [CrossRef]
  7. Saatchi, S.S.; Harris, N.L.; Brown, S.; Lefsky, M.; Mitchard, E.T.; Salas, W.; Zutta, B.R.; Buermann, W.; Lewis, S.L.; Hagen, S.; et al. Benchmark map of forest carbon stocks in tropical regions across three continents. Proc. Natl. Acad. Sci. USA 2011, 108, 9899–9904. [Google Scholar] [CrossRef] [PubMed]
  8. Lefsky, M.A.; Cohen, W.B.; Harding, D.J.; Parker, G.G.; Acker, S.A.; Thomas Gower, S. LiDAR remote sensing of above-ground biomass in three biomes. Glob. Ecol. Biogeogr. 2002, 2, 393–399. [Google Scholar] [CrossRef]
  9. Baccini, A.; Asner, G.P. Improving pantropical forest carbon maps with airborne LiDAR sampling. Carbon Manag. 2013, 4, 591–600. [Google Scholar] [CrossRef]
  10. Hyyppä, J.; Hyyppä, H.; Leckie, D.; Gougeon, F.; Yu, X.; Maltamo, M. Review of methods of small footprint airborne laser scanning for extracting forest inventory data in boreal forests. Int. J. Remote Sens. 2008, 29, 1339–1366. [Google Scholar] [CrossRef]
  11. Petrokofsky, G.; Kanamaru, H.; Achard, F.; Goetz, S.J.; Joosten, H.; Holmgren, P.; Lehtonen, A.; Menton, M.C.; Pullin, A.S.; Wattenbach, M. Comparison of methods for measuring and assessing carbon stocks and carbon stock changes in terrestrial carbon pools. How do the accuracy and precision of current methods compare? A systematic review protocol. Environ. Evid. 2012, 1, 6. [Google Scholar] [CrossRef] [Green Version]
  12. Mascaro, J.; Asner, G.P.; Knapp, D.E.; Kennedy-Bowdoin, T.; Martin, R.E.; Anderson, C.; Higgins, M.; Chadwick, K.D. A tale of two “Forests”: Random Forest machine learning aids tropical Forest carbon mapping. PLoS ONE 2014, 9, 12–16. [Google Scholar] [CrossRef] [PubMed]
  13. Asner, G.P.; Mascaro, J.; Anderson, C.; Knapp, D.E.; Martin, R.E.; Kennedy-Bowdoin, T.; van Breugel, M.; Davies, S.; Hall, J.S.; Muller-Landau, H.C.; et al. High-fidelity national carbon mapping for resource management and REDD+. Carbon Balance Manag. 2013, 8, 7. [Google Scholar] [CrossRef] [PubMed]
  14. Asner, G.P.; Clark, J.K.; Mascaro, J.; Galindo García, G.A.; Chadwick, K.D.; Navarrete Encinales, D.A.; Paez-Acosta, G.; Cabrera Montenegro, E.; Kennedy-Bowdoin, T.; Duque, Á.; et al. High-resolution mapping of forest carbon stocks in the Colombian Amazon. Biogeosciences 2012, 9, 2683–2696. [Google Scholar] [CrossRef]
  15. Taylor, P.; Asner, G.; Dahlin, K.; Anderson, C.; Knapp, D.; Martin, R.; Mascaro, J.; Chazdon, R.; Cole, R.; Wanek, W.; et al. Landscape-Scale controls on aboveground forest carbon Stocks on the Osa Peninsula, Costa Rica. PLoS ONE 2015, 10, 1–18. [Google Scholar] [CrossRef] [PubMed]
  16. Asner, G.P.; Mascaro, J.; Muller-Landau, H.C.; Vieilledent, G.; Vaudry, R.; Rasamoelina, M.; Hall, J.S.; van Breugel, M. A universal airborne LiDAR approach for tropical forest carbon mapping. Oecologia 2012, 168, 1147–1160. [Google Scholar] [CrossRef] [PubMed]
  17. Asner, G.P.; Mascaro, J. Mapping tropical forest carbon: Calibrating plot estimates to a simple LiDAR metric. Remote Sens. Environ. 2014, 140, 614–624. [Google Scholar] [CrossRef]
  18. Martin, A.R.; Thomas, S.C. A reassessment of carbon content in tropical trees. PLoS ONE 2011, 6, e23533. [Google Scholar] [CrossRef] [PubMed]
  19. Réjou-Méchain, M.; Muller-Landau, H.C.; Detto, M.; Thomas, S.C.; le Toan, T.; Saatchi, S.S.; Barreto-Silva, J.S.; Bourg, N.A.; Bunyavejchewin, S.; Butt, N.; et al. Local spatial structure of forest biomass and its consequences for remote sensing of carbon stocks. Biogeosciences 2014, 11, 6827–6840. [Google Scholar] [CrossRef] [Green Version]
  20. Mascaro, J.; Detto, M.; Asner, G.P.; Muller-Landau, H.C. Evaluating uncertainty in mapping forest carbon with airborne LiDAR. Remote Sens. Environ. 2011, 115, 3770–3774. [Google Scholar] [CrossRef]
  21. Hernández-Stefanoni, J.; Dupuy, J.; Johnson, K.; Birdsey, R.; Tun-Dzul, F.; Peduzzi, A.; Caamal-Sosa, J.; Sánchez-Santos, G.; López-Merlín, D. Improving species diversity and biomass estimates of tropical dry forests using airborne LiDAR. Remote Sens. 2014, 6, 4741–4763. [Google Scholar] [CrossRef]
  22. Frazer, G.; Magnussen, S.; Wulder, M.A.; Niemann, K.O. Simulated impact of sample plot size and co-registration error on the accuracy and uncertainty of LiDAR-derived estimates of forest stand biomass. Remote Sens. Environ. 2011, 115, 636–649. [Google Scholar] [CrossRef]
  23. Condit, R.; Ashton, P.S.; Baker, P.; Bunyavejchewin, S.; Gunatilleke, S.; Gunatilleke, N.; Hubbell, S.P.; Foster, R.B.; Itoh, A.; LaFrankie, J.V.; et al. Spatial patterns in the distribution of tropical tree species. Science 2000, 288, 1414–1418. [Google Scholar] [CrossRef] [PubMed]
  24. Ruiz, L.A.; Hermosilla, T.; Mauro, F.; Godino, M. Analysis of the influence of plot size and LiDAR density on forest structure attribute estimates. Forests 2014, 5, 936–951. [Google Scholar] [CrossRef]
  25. Zolkos, S.; Goetz, S.; Dubayah, R. A meta-analysis of terrestrial aboveground biomass estimation using LiDAR remote sensing. Remote Sens. Environ. 2013, 128, 289–298. [Google Scholar] [CrossRef]
  26. Meyer, V.; Saatchi, S.S.; Chave, J.; Dalling, J.W.; Bohlman, S.; Fricker, G.A.; Robinson, C.; Neumann, M.; Hubbell, S. Detecting tropical forest biomass dynamics from repeated airborne LiDAR measurements. Biogeosciences 2013, 10, 5421–5438. [Google Scholar] [CrossRef]
  27. Marvin, D.C.; Asner, G.P.; Knapp, D.E.; Anderson, C.B.; Martin, R.E.; Sinca, F.; Tupayachi, R. Amazonian landscapes and the bias in field studies of forest structure and biomass. Proc. Natl. Acad. Sci. USA 2014, 111, E5224–E5232. [Google Scholar] [CrossRef] [PubMed]
  28. Chave, J.; Condit, R.; Aguilar, S.; Hernandez, A.; Lao, S.; Perez, R. Error propagation and scaling for tropical forest biomass estimates. Philos. Trans. R. Soc. B Biol. Sci. 2004, 359, 409–420. [Google Scholar] [CrossRef] [PubMed]
  29. Ngomanda, A.; Engone Obiang, N.L.; Lebamba, J.; Moundounga Mavouroulou, Q.; Gomat, H.; Mankou, G.S.; Loumeto, J.; Midoko Iponga, D.; Kossi Ditsouga, F.; Zinga Koumba, R.; et al. Site-specific versus pantropical allometric equations: Which option to estimate the biomass of a moist central African forest? For. Ecol. Manag. 2014, 312, 1–9. [Google Scholar] [CrossRef]
  30. Chave, J.; Réjou-Méchain, M.; Búrquez, A.; Chidumayo, E.; Colgan, M.S.; Delitti, W.B.C.; Duque, A.; Eid, T.; Fearnside, P.M.; Goodman, R.C.; et al. Improved allometric models to estimate the aboveground biomass of tropical trees. Glob. Chang. Biol. 2014, 1–14. [Google Scholar] [CrossRef] [PubMed]
  31. Feldpausch, T.R.; Lloyd, J.; Lewis, S.L.; Brienen, R.J.W.; Gloor, M.; Monteagudo Mendoza, A.; Lopez-Gonzalez, G.; Banin, L.; Abu Salim, K.; Affum-Baffoe, K.; et al. Tree height integrated into pan-tropical forest biomass estimates. Biogeosciences 2012, 9, 3381–3403. [Google Scholar] [CrossRef] [Green Version]
  32. Picard, N.; Boyemba Bosela, F.; Rossi, V. Reducing the error in biomass estimates strongly depends on model selection. Ann. For. Sci. 2014, 1–13. [Google Scholar] [CrossRef] [Green Version]
  33. Bass, M.S.; Finer, M.; Jenkins, C.N.; Kreft, H.; Cisneros-Heredia, D.F.; McCracken, S.F.; Pitman, N.C.A.; English, P.H.; Swing, K.; Villa, G.; et al. Global conservation significance of Ecuador’s Yasuní National Park. PLoS ONE 2010, 5, e8767. [Google Scholar] [CrossRef] [PubMed]
  34. Valencia, R.; Foster, R.B.; Villa, G.; Condit, R.; Svenning, J.-C.; Hernández, C.; Romoleroux, K.; Losos, E.; Magård, E.; Balslev, H. Tree species distributions and local habitat variation in the Amazon: Large forest plot in eastern Ecuador. J. Ecol. 2004, 92, 214–229. [Google Scholar] [CrossRef]
  35. Anderson-Teixeira, K.J.; Davies, S.J.; Bennett, A.C.; Gonzalez-Akre, E.B.; Muller-Landau, H.C.; Joseph Wright, S.; Abu Salim, K.; Almeyda Zambrano, A.M.; Alonso, A.; Baltzer, J.L.; et al. CTFS-ForestGEO: A worldwide network monitoring forests in an era of global change. Glob. Chang. Biol. 2015, 21, 528–549. [Google Scholar] [CrossRef] [PubMed] [Green Version]
  36. Valencia, R.; Condit, R.; Foster, R.B.; Romoleroux, K.; Villa Munoz, G.; Svenning, J.; Magård, E.; Bass, M.S.; Losos, E.C.; Balslev, H. Yasuní Forest Dynamics Plot, Ecuador. In Tropical Forest Diversity and Dynamism: Findings from a Large-Scale Plot Network; Losos, E.C., Leigh, E.G., Eds.; University of Chicago Press: Chicago, IL, USA, 2004; pp. 609–628. [Google Scholar]
  37. Condit, R. Tropical Forest Census Plots; Springer-Verlag: Berlin, Germany, 1998. [Google Scholar]
  38. Romero-Saltos, H.; Valencia, R.; Macía, M.J. Patrones de distribución y rareza de plantas leñosas en el Parque Nacional Yasuní y la Reserva Étnica Huaorani , Amazonía ecuatoriana. In Evaluación de Recursos Vegetales no Maderables en la Amazonia Noroccidental; Duivenvoorden, J.F., Balslev, H., Cavelier, J., Grandez, C., Tuomisto, H., Valencia, R., Eds.; Universiteit van Amsterdam: Amsterdam, The Netherlands, 2001; pp. 131–162. [Google Scholar]
  39. Romero-Saltos, H.; Hernández, C.; Valencia, R. Diversidad y dinámica de árboles en una parcela de gran escala. In Arboles Emblemáticos de Yasuní, Ecuador; Publicaciones del Herbario QCA, Escuela de Ciencias Biológicas, Pontificia Universidad Católica del Ecuador: Quito, Ecuador, 2014; pp. 14–22. [Google Scholar]
  40. Valbuena, R.; Mauro, F.; Rodriguez-Solano, R.; Manzanera, J.A. Accuracy and precision of GPS receivers under forest canopies in a mountainous environment. Spanish J. Agric. Res. 2010, 8, 1047–1057. [Google Scholar] [CrossRef]
  41. Sistema de Referencia Geocéntrico para las Américas. Available online: http://www.sirgas.org/index.php (accessed on 19 September 2015).
  42. Leitold, V.; Keller, M.; Morton, D.C.; Cook, B.D.; Shimabukuro, Y.E. Airborne LiDAR-based estimates of tropical forest structure in complex terrain: Opportunities and trade-offs for REDD+. Carbon Balance Manag. 2015, 10. [Google Scholar] [CrossRef] [PubMed]
  43. Hansen, E.; Gobakken, T.; Næsset, E. Effects of pulse density on digital terrain models and canopy metrics using airborne laser scanning in a tropical rainforest. Remote Sens. 2015, 7, 8453–8468. [Google Scholar] [CrossRef] [Green Version]
  44. Kennel, P.; Tramon, M.; Barbier, N.; Vincent, G. Canopy height model characteristics derived from airborne laser scanning and its effectiveness in discriminating various tropical moist forest types. Int. J. Remote Sens. 2013, 34, 8917–8935. [Google Scholar] [CrossRef]
  45. Meng, X.; Currit, N.; Zhao, K. Ground filtering algorithms for airborne LiDAR data: A review of critical issues. Remote Sens. 2010, 2, 833–860. [Google Scholar] [CrossRef]
  46. Rapidlasso GmbH. LAStools Rapid LiDAR Processing. Available online: http://rapidlasso.com/ (accessed on 22 September 2015).
  47. Hyyppä, J.; Hyyppä, H.; Litkey, P.; Yu, X.; Haggrén, H.; Rönnholm, P.; Pyysalo, U.; Pitkänen, J.; Maltamo, M. Algorithms and methods of airborne laser-scanning for forest measurements. Int. Arch. Photogramm. Remote Sens. Spat. Inf. Sci. 2004, 36, 82–89. [Google Scholar]
  48. Evans, J.; Oakleaf, J.; Cushman, S.; Theobald, D. An ArcGIS Toolbox for surface Gradient and Geomorphometric Modelling, version 2.0-0. Available online: http://evansmurphy.wix.com/evansspatial (accessed on 2 March 2015).
  49. Moore, I.; Gessler, P.; Nielsen, G.A.; Peterson, G.A. Soil attribute prediction using terrain analysis. Soil Sci. Soc. Am. J. 1993, 57, 443–452. [Google Scholar]
  50. Rampi, L.P.; Knight, J.F.; Pelletier, K.C. Wetland mapping in the Upper Midwest United States. Photogramm. Eng. Remote Sens. 2014, 80, 439–448. [Google Scholar] [CrossRef]
  51. Valencia, R.; Condit, R.; Muller-Landau, H.C.; Hernandez, C.; Navarrete, H. Dissecting biomass dynamics in a large Amazonian forest plot. J. Trop. Ecol. 2009, 25, 473. [Google Scholar] [CrossRef]
  52. Fox, J. The R commander: A basic-statistics graphical user interface to R. J. Stat. Softw. 2005, 14, 1–42. [Google Scholar] [CrossRef]
  53. Peña Sánchez de Rivera, D. Regresión y Diseño de Experimentos; Alianza Editorial: Madrid, Spain, 2002; pp. 459–526. [Google Scholar]
  54. Baskerville, G.L. Use of logarithmic regression in the estimation of plant biomass. Can. J. For. Res. 1972, 49–53. [Google Scholar] [CrossRef]
  55. Muller-Landau, H.; Detto, M.; Chisholm, R.; Hubbell, S.; Condit, R. Detecting and projecting changes in forest biomass from plot data. In Forests and Global Change; Coomes, D., Burslem, D., Simonsen, W., Eds.; Cambridge University Press: Cambridge, UK, 2014; pp. 381–416. [Google Scholar]
  56. Andersen, H.-E.; McGaughey, R.J.; Reutebuch, S.E. Estimating forest canopy fuel parameters using LiDAR data. Remote Sens. Environ. 2005, 94, 441–449. [Google Scholar] [CrossRef]
  57. Gessler, P.E.; Moore, I.D.; McKenzie, N.J.; Ryan, P.J. Soil-landscape modelling and spatial prediction of soil attributes. Int. J. Geogr. Inf. Syst. 1995, 9, 421–432. [Google Scholar] [CrossRef]
  58. Kanagaraj, R.; Wiegand, T.; Comita, L.S.; Huth, A. Tropical tree species assemblages in topographical habitats change in time and with life stage. J. Ecol. 2011, 99, 1441–1452. [Google Scholar] [CrossRef]