Article

Investigation on the Weighted RANSAC Approaches for Building Roof Plane Segmentation from LiDAR Point Clouds

1
State Key Laboratory of Information Engineering in Surveying, Mapping and Remote Sensing, Wuhan University, Wuhan 430072, China
2
Lyles School of Civil Engineering, Purdue University, West Lafayette, IN 47907, USA
3
National-Local Joint Engineering Laboratory of Geo-Spatial Information Technology, Hunan University of Science and Technology, Xiangtan 411201, China
*
Author to whom correspondence should be addressed.
Remote Sens. 2016, 8(1), 5; https://doi.org/10.3390/rs8010005
Submission received: 23 September 2015 / Revised: 9 December 2015 / Accepted: 15 December 2015 / Published: 23 December 2015

Abstract

:
RANdom SAmple Consensus (RANSAC) is a widely adopted method for LiDAR point cloud segmentation because of its robustness to noise and outliers. However, RANSAC has a tendency to generate false segments consisting of points from several nearly coplanar surfaces. To address this problem, we formulate the weighted RANSAC approach for the purpose of point cloud segmentation. In our proposed solution, the hard threshold voting function which considers both the point-plane distance and the normal vector consistency is transformed into a soft threshold voting function based on two weight functions. To improve weighted RANSAC’s ability to distinguish planes, we designed the weight functions according to the difference in the error distribution between the proper and improper plane hypotheses, based on which an outlier suppression ratio was also defined. Using the ratio, a thorough comparison was conducted between these different weight functions to determine the best performing function. The selected weight function was then compared to the existing weighted RANSAC methods, the original RANSAC, and a representative region growing (RG) method. Experiments with two airborne LiDAR datasets of varying densities show that the various weighted methods can improve the segmentation quality differently, but the dedicated designed weight functions can significantly improve the segmentation accuracy and the topology correctness. Moreover, its robustness is much better when compared to the RG method.

Graphical Abstract

1. Introduction

Numerous studies have been conducted in 3D building reconstruction in the past two decades [1,2,3]. According to [4,5], reconstruction methods can be divided into two general categories: data-driven and model-driven. For high density point cloud data or complex roof structures, the task often converges on a data-driven process based on segmentation [2]. According to [6,7], there are three data-driven segmentation techniques: edge-based or region growing (RG), feature clustering, and model fitting.
Segmentation methods based on edge or region information [8,9,10,11,12] are relatively simple and efficient but are error-prone in the presence of outliers and incomplete boundaries. When the transitions between two regions are smooth, finding a complete edge or determining a stop criterion for RG becomes difficult [6]. Techniques using feature clustering for segmentation [6,13,14,15,16,17,18] experience problems in deciding the number of segments; and poor segmentation (over-, under-, no segmentation, or artifacts) can occur when small roof sub-structures exist or tree points close to the building roofs are not completely filtered beforehand. Compared with the above techniques, [7] suggested that model fitting methods can be more efficient and robust in the presence of noise and outliers. RANdom SAmple Consensus (RANSAC) [19] and Hough transform are two well-known algorithms for model fitting. The concept and implementation of the RANSAC method are simple. It simply iterates two steps: generating a hypothesis by random samples and verifying the hypothesis with the remaining data. Given different hypothesis models, RANSAC can detect planes, spheres, cylinders, cones, and tori [20]. Numerous variants have been derived from RANSAC; and a comprehensive review is available in the work of [21]. Those variants (i.e., [22,23,24]) provide the possibility of improving the methods in both robustness and efficiency. Information like point surface normal [4,7] and connectivity [25] also can be incorporated in RANSAC for better results. Moreover, although the RANSAC method is an iterative process, reference [5] suggests that it is faster than the Hough transform.
LiDAR techniques generate ever increasingly high resolution data. This provides the possibility to recognize subtle roof details and rather complex structures; but in the meantime, it brings challenges to current RANSAC-based segmentation methods. A widely concerning problem is the spurious planes that consist of points from different planes or roof surface [4,6,7,26,27]. A detected plane overlapping multiple reference planes or a plane snatching parts of the points from its neighbor planes are frequent occurrences. Their misidentification and incorrect reconstruction may have a crucial effect on the understanding of the building structure (i.e., topology of the building) [28,29]. To address this issue, many additional processes were designed and used in past studies, such as normal vector consistency validation [4,7], connectivity [26], and standard deviation of the point-plane distances. Those processes need careful fine tuning of their parameters in order to achieve the best performance (e.g., reference [30] suggests that the threshold should be in agreement with the segment scale). This is a difficult task and highly relies on prior knowledge of the data and scene as well as the experience of the operators. Therefore, a more accurate fitting method is needed to suppress the spurious planes.
Although no applications were found in building roof segmentation, the M-estimate SAC (MSAC) and the Maximum Likelihood SAC (MLESAC) in [31] provided a potential solution to the spurious planes problem. In these two methods, the contribution of a point to the hypothesis plane is no longer a constant 0 or 1, but rather a loss function (inversed to weight) according to the point-plane distance. Basically, a large distance is assigned to a large loss, and false hypotheses are suppressed because of the larger total loss. However, we argue that their loss functions were not sufficient to distinguish the spurious plans from the correct hypothesis plane for complex roof segmentation problems. Inclusion of other additional factors into the loss function, such as surface normal, would make the methods more adaptive and robust.
This paper implements the idea of loss function into the popular RANSAC method and proposes a weighted RANSAC framework for roof plane segmentation. In the framework of our new method, the hard threshold voting function which considers both the point-plane distance and the normal vector consistence is transformed into a soft threshold voting function based on two weight functions. New weight functions are introduced based on the error distribution between the proper and improper hypothesis planes. Different forms of weights were tested and compared, yielding a recommended weight form.
The remainder of this paper is organized as follows. Section 2 discusses the related work and the modification of the existing weighted RANSAC into the normalized forms. In Section 3, the design of an ideal weight function is discussed, and several different weight functions are proposed and evaluated. Experimental results are presented and analyzed in Section 4, followed by discussion and concluding remarks in Section 5.

2. Background

2.1. RANSAC-based Segmentation

Although the RANSAC-based segmentation methods have several variations, they consist of three steps [4]: preprocessing, RANSAC, and post-processing. The preprocessing step yields the surface normal for each LiDAR point. The roof points can be separated to a planar set and a nonplanar set (if so, the nonplanar points are excluded from the second step and be retrieved in the final step).The second step is a standard implementation of the RANSAC method [14]. It iteratively and randomly samples points to estimate the hypothesis plane and then tests the plane against the remainder of the dataset. A point is taken as an inlier if the point-plane distance and the angle between the point’s normal vector and plane’s normal vector (in [6]) are smaller than the given thresholds. After a certain number of iterations, the shape that possessed the largest percentage of inliers relative to the entire data is extracted. The method detects only one plane at a time from the entire point set. Thus, the process has to be implemented iteratively in a subtractive manner, which means that once a plane is detected, the points belonging to the plane are removed and the algorithm continues on the remainder of the dataset until no satisfactory planes are found. To be fast, the constraints of normal vectors [7,32] and local sampling [4,32] are used to avoid the meaningless hypotheses. A fast and rough clustering (or classification) process can be used to decompose the dataset [7,33]. To be robust, validations on normal vector consistency [4,7], connectivity [26], and standard deviation of point-plane distances are also adopted. The main task of post-processing is to refine the segmentation results, retrieve roof points from unsegmented point sets, find missing planes, and remove false spurious planes [27,32].
For classical RANSAC methods, the plane with the maximum inliers is generated when determining the most probable hypothesis plane M ^ :
M ^ = arg max M { P i U T ( P i , M ) }
where U is the set of remaining points, NU is the number of points in U, and T(Pi) is the inlier indicator:
T ( P i , M ) = { 1 d i < d t a n d θ i < θ t 0 o t h e r w i s e
where di is the point-plane distance, θi is the angle between point Pi’s normal and plane’s normal [7], and dt and θt are the corresponding thresholds.

2.2. Spurious Planes

The problem of spurious planes is a widely discussed common problem that has yet to be resolved in RANSAC-based segmentation. Generally, the planes detected by the RANSAC methods may belong to different planes or roof surfaces. As shown in Figure 1a, suppose that the threshold dt can be well estimated beforehand according to the precision of the point clouds, then a proper segmentation is achieved if the hypothesis planes π1 and π2 receive the largest inlier ratio. However, poorly estimated planes may be detected, such as plane π3 in Figure 1b, whose point count is much larger than that of π1 or π2, thus leading to false segmentation. The RANSAC method extracts planes one after the other from LiDAR points so these mistakes may occur at plane transitions. The situation in Figure 1b can further intensify such competitions as the inaccurate hypothesis tends to generate more supports from roof points.
Figure 1. An example of spurious planes. (a) The well estimated hypothesis planes (π1 and π2); the two green parallel lines are the boundary of the point-to-plane distance threshold; (b) A spurious plane (π3) is generated under the same thresholds; (c) A detail view of (b), where n is the normal vector of the plane π3, and e1 and e2 are the point normal vectors. The d1, d2, θ1, θ2 are the corresponding observed values of point P1 and P2 in Equation (2). θ0 is the angle between π3 and the real roof surface (π0).
Remotesensing 08 00005 g001

2.3. Existing Weighted RANSAC Methods

Instead of using fixed thresholds in the determination of inliers, MSAC and MLESAC [31] use a loss function to count the contribution, which is actually a contribution loss, of the inliers based on the point-to-plane distance. The most probable hypothesis M ^ is determined by minimizing the total loss of hypothesis M :
M ^ = arg min M { P i U L o s s ( d ( P i , M ) ) }
The MSAC adopts bounded loss as follows:
L o s s ( d ) = { d 2 | d | < d t d t 2 o t h e r w i s e
MLESAC utilizes the probability distribution of error by inliers and outliers, models inlier errors as Gaussian distribution and outlier errors as uniform distribution:
L o s s ( d ) = log ( γ 1 2 π σ d exp ( d 2 2 σ d 2 ) + ( 1 γ ) 1 ν )
where γ is the prior probability of being an inlier, which is the inlier ratio in Equation (1), σ is the standard deviation of Gaussian noise (σd = dt/1.96), and ν is a constant which reflects the size of available error space.
For the so-called weighted RANSAC, the loss function is transformed as the normalized weight functions for testing points, having values from 0 to 1, so that different weight functions can be easily compared and further applied to more than one factor (i.e., considering both distance and normal directions). As a result, the loss functions of MSAC and MLESAC are normalized as Equation (6).
w e i g h t ( d ) = l o s s ( + ) l o s s ( d ) l o s s ( + ) l o s s ( 0 )

3. Weighted RANSAC for Point Cloud Segmentation

For the weighted RANSAC methods, the weight value of an inlier reflects its consistency with the hypothesis plane. An ideal weight function is expected to suppress the spurious planes as far as possible without excessively penalizing the proper planes. In this work, the purpose is achieved by comparing the error distribution between the proper and improper hypotheses. In Section 3.1, we discuss the drawback of the existing weighted methods that form the design principle of the ideal weight function. Then, several new weight functions are defined based on the design principle in Section 3.2. In Section 3.3, adding the factor of normal vector errors into the weight functions is considered, and a joint weight function is designed via the multiplication of the two factors (distance and normal vector). Those new weight functions are compared and evaluated in Section 3.4, together with the existing weighted methods.

3.1. Improvements Consideration of the Weighted Function

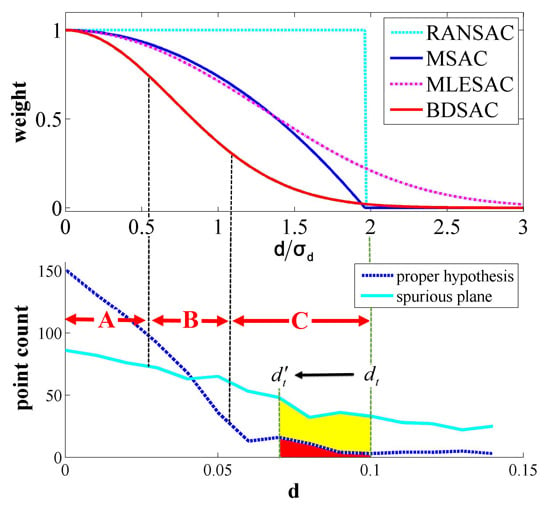
Figure 2 (Bottom) provides examples of the point-to-plane distance distribution for both the proper hypothesis and the spurious plane. To clarify the discussion that follows, the distance range is divided into three regions, namely A, B, and C. Generally, the inliers of a proper-plane tend to focus on the region with a smaller distance, which follows the normal distribution in theory, while the distribution of the distances to a spurious plane tend to be more dispersed. For traditional RANSAC, the spurious planes are detected instead of the proper plane if there are too many points in region C. An intuitive solution to alleviate the problem is simply using a smaller distance threshold, i.e., changing the threshold d t to d t , which reduces the inliers count of the spurious plane (yellow region). However, a too small threshold will decrease the number of inliers (red region) and eventually result in over-segmentation.
Figure 2. Comparison of point-to-plane distance distribution between proper and improper hypotheses. (Top) Plots of the weight functions (dt = 1.96σd, MLESAC: γ = 0.3, ν = 3σd); (Bottom) Examples of distance distribution for the proper hypothesis and the spurious plane. A, B, and C are a rough division of the distance range: A for regions where the proper planes are dominant in the point count, B for regions where the point counts are similar, and C for regions where spurious planes generate more inliers. The red region represents the lost roof points when using a stricter threshold and the yellow region indicates that more points are excluded from the spurious planes than the proper hypothesis. BDSAC is a newly designed weight curve.
Remotesensing 08 00005 g002
Without changing the dt threshold, MSAC and MLESAC suppress the spurious planes by assigning smaller weights to the inliers with larger distances so that the inliers in area C of Figure 2 will contribute less to the evaluation of the hypothesis plane. The inadequacy of MSAC and MLESAC are mainly caused by its slow decrease of the weight curves. Generally, the weighted methods are expected to suppress the spurious plane as far as possible without excessively penalizing the proper planes. Under such consideration, we expect the curve of the weight function to decrease rapidly in area B and gradually with small weight values in area C (i.e., the curve of BDSAC in Figure 2). However, as shown in Figure 2, there are still a great deal of inliers that have large weight values and gradients in area C for MSAC and MLESAC. MSAC has the largest absolute gradient at the threshold boundary, and the MLESAC has a boundary weight value of over 0.2, which limit their suppressing to spurious planes. To overcome the drawbacks of these two methods, we attempted to modify the weight functions, and the improved versions of weight functions are shown in Section 3.2.

3.2. Modified Weight Functions and New Weight Functions

First, the weight functions of RANSAC, MSAC, and MLESAC were modified. Generally, after a hypothesis plane is accepted, it is expected that all the inliers should be excluded to avoid affecting the detection of other planes; while in the plane detection step, it is wished that as fewer outliers included as possible to decrease the possibility of false plane detection and the absence of minor inliers is acceptable. This reminds us to reduce the thresholds used in the weight functions and to keep the threshold unchanged for inlier exclusion. For such an objective, a reduction ratio μ was applied to the distance threshold dt in the weight function. For example, the MSAC with a reduction ratio μ is expressed by (denoted by MSACμ):
w e i g h t μ ( d ) = { 1 ( d μ d t ) 2 | d | < ( μ d t ) 0 o t h e r w i s e
Similarly, the reduction ratio μ also was adopted in classical RANSAC and MLESAC to generate the two modified versions, named RANSACu and MLESACu. RANSACu uses smaller threshold μ d t for inlier determination; and the σd in Equation (5) of MLESACu is reduced to μ d t / 1.96 .
As discussed in Section 3.1, two new weight functions stricter in theory can be designed, whose value is close to 1 in region A, close to 0 in region C, and rapidly decreasing in region B. One weight function is a piecewise-linear function, which linearly decreases in Region B (denote by LDSAC).
w e i g h t ( d ) = { 1 | d | d 1 d 2 | d | d 2 d 1 d 1 < | d | < d 2 0 o t h e r s
where d1 and d2 are the selected thresholds between 0 and dt ( i.e., 0.2dt and 0.7dt in our test).
Another weight function is a smooth curve decreasing along the “bell” curve (denote by BDSAC):
w e i g h t ( d ) = exp ( d 2 σ d 2 )
The curves of the weight functions and the absolute value of their gradients are illustrated in Figure 3. All the weight functions are inversely proportional to the point-to-plane distance d with a range of from 0 to 1, thus the most probable hypothesis plane M ^ is decided similarly with classical RANSAC in Equation (1):
M ^ = arg max M { P i U w e i g h t ( d i ) }
As the value of the weights is generated by simply mapping the value of d/σd into pre-calculated tables, the efficiency of all the methods are similar.
Figure 3. Weight functions of various RANSAC methods: (Left) Plots of the weight functions; (Right) Plots of the absolute value of gradient.
Remotesensing 08 00005 g003

3.3. Joint Weight Function Regarding Angular Difference

The normal vectors of the inliers are generated by neighborhood analysis [6,10] and often have fine consistency for 2.5D roof surfaces. For poor hypotheses, a systematic deviation of the normal vectors (i.e., θ0 in Figure 1c) can exist between the hypotheses plane and the real roof surface. As the normal of the points turns out to be in accord with the real roof surface, this deviation will reflect in most roof points. As a result, the angular difference between the points and the hypothesis plane (θ in Equation (2)) has long been used to evaluate the quality of inliers, either as constant thresholds in [7] or as a normal vector consistency validation in [4]. It is very natural for us to consider adding the angular difference into the weight definition.
Suppose the distribution of angular difference θ is independent with the distance and also obeys the normal distribution with a standard deviation of σθ. Then, the weight of the angular difference can be defined by using the same form as the distance (simply replace d by θ). For instance, the weight functions of BDSAC for angular difference θ can be defined as:
w ( θ ) = exp ( θ 2 σ θ 2 )
Then, the final weight w e i g h t ( d i , θ i ) , considering both the point-to-plane distances and the angular differences, can be defined as the product of the two weights:
w e i g h t ( d i , θ i ) = w ( d i ) w ( θ i )
Similar to Equation (9), the most probable hypothesis plane M ^ is determined by maximizing the total weight of all the hypothesis of M
M ^ = arg max M { P i U w e i g h t ( d i , θ i ) }
To distinguish from methods considering point-to-plane distance only, a subscript of “nv” is added to the methods that take the angular difference into account (e.g., BDSACnv for the improved method of BDSAC).

3.4. Weight Function Evaluation

A proper weight function is expected to suppress the improper hypotheses as much as possible, without excessively penalizing the proper ones. Since the decreasing rates of the total weights for the hypothesis plane under different weight functions are different, an outlier suppression ratio is defined as the evaluation metric here:
r a t i o o s = W t e s t W r e f
where Wref stands for the total weight of the reference plane (the plane fitted by all the inliers), and Wtest is the total weight of the test hypothesis plane.
The test hypothesis planes are randomly generated and manually marked as positive or negative, based on whether a correct segmentation can be generated. For a positive hypothesis, we expect that the ratio of a good weight function is stable, which should be close to 1. For negatives hypotheses, we need the ratio to be as small as possible, and a ratio over 1 indicates that a false hypothesis gains larger weights than the proper ones, leading to false segmentation.
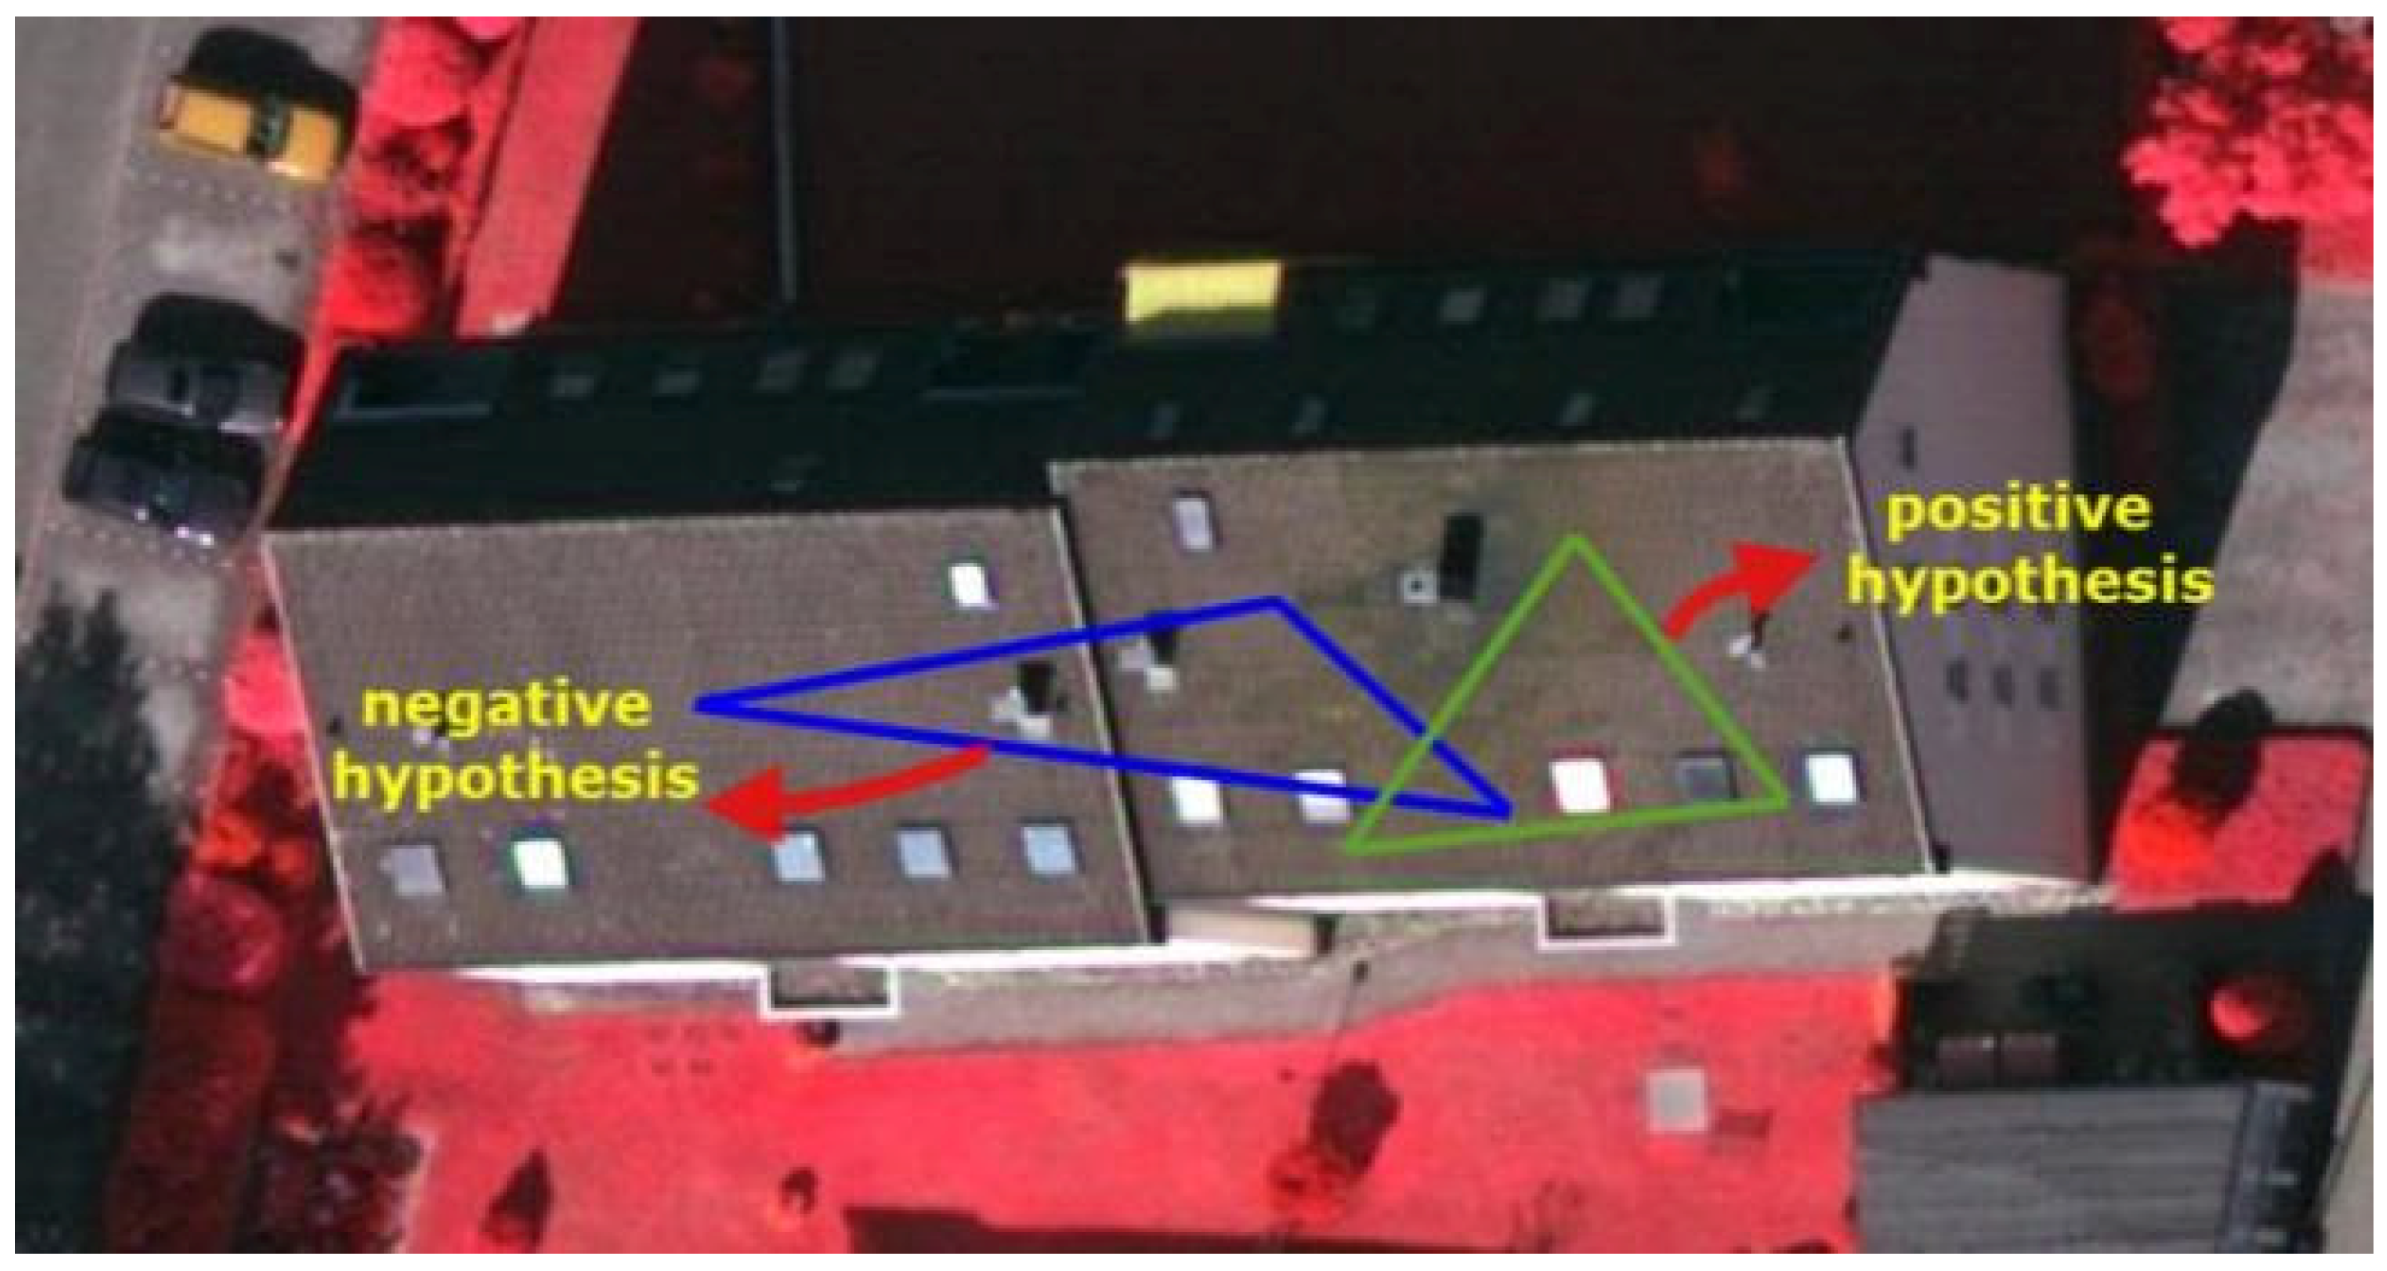
To evaluate the weight functions defined in Section 3.2 and Section 3.3, 10 hypotheses planes are generated from the point cloud of the building in Figure 4, among which three hypotheses are positive and seven hypotheses are negative.
Figure 4. Buildings with both positive and negative hypotheses. The deep blue triangle is a negative hypothesis as it is athwart the two roof planes, and the cyan triangle is a positive hypothesis which can produce a correct segmentation.
Remotesensing 08 00005 g004
The outlier suppression ratios of the 10 hypotheses are shown in Figure 5. As shown in Figure 5a, the ratios of eight methods considering only distances error are compared, and the mean ratio of the 10 hypotheses under different thresholds are illustrated in Figure 5c. As shown in Figure 5b,d, we compare the improvements of the methods after considering both the distance and angular difference in the weight function, corresponding to Figure 5a,c. Several conclusions can be made at this point:
(1)
For all the weighted methods, the evaluation of the positive hypotheses (planes 1, 2, and 3) are stable as the ratios in Figure 5a are close to 1.0 and the ratio reductions in Figure 5b are close to 0. Meanwhile, all the weighted methods can significantly decrease the ratios of the negative hypotheses when compared to RANSAC, but their suppressing ability are different.
(2)
By comparing the results between the modified weight functions and the original functions (i.e., MSAC0.7 and MSAC), it can be concluded that reduction of the inlier threshold can suppress the outliers effectively. The newly designed LDSAC and BDSAC functions have the best performances, which verifies our considerations in Section 3.1.
(3)
From Figure 5c, it can be seen that all the methods can be affected by the threshold in some degree, but the newly designed weighted methods are least influenced.
(4)
Figure 5b,d illustrate the improvements after taking the angular differences into the weight functions. All the weighted methods gain positive effects and the effects are not sensitive to the thresholds.
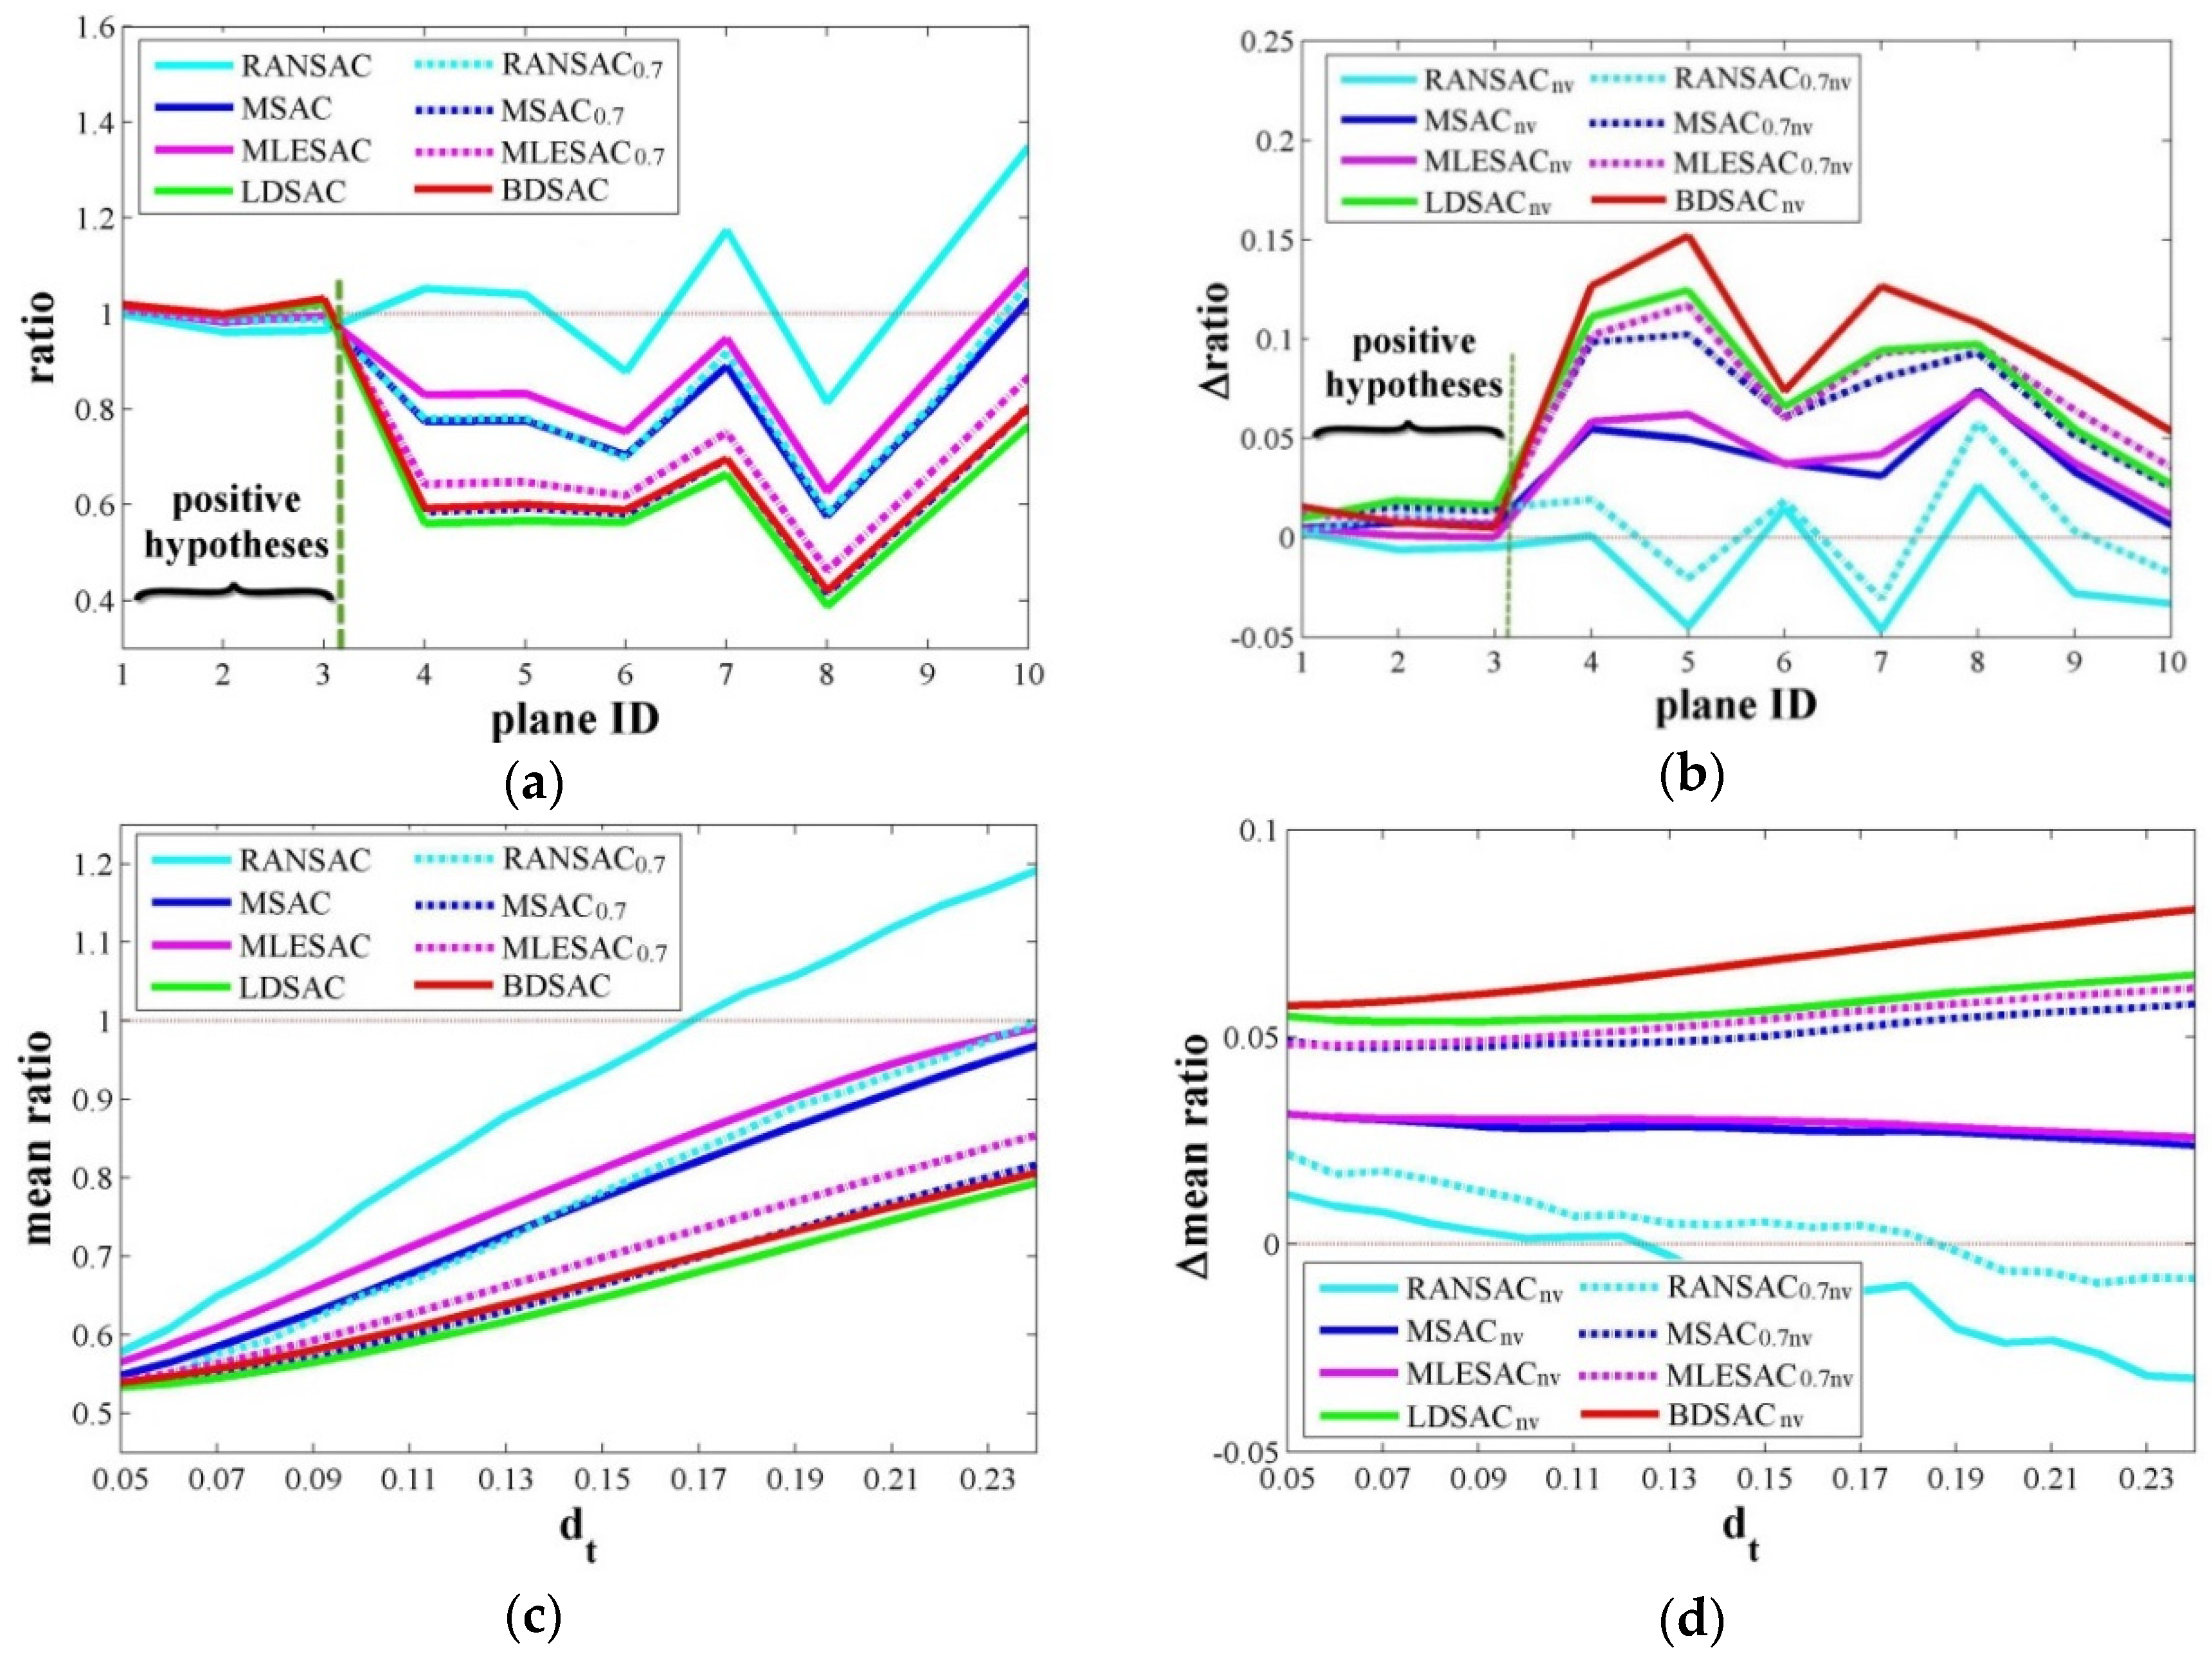
Figure 5. Suppressing ability and threshold sensitivity test. (a) Suppressing ratios for planes under different weight forms; (b) Ratio reductions after considering the angular difference (i.e., the ratio reduction of BDSACnv is the ratio of BDSAC minus the ratio of BDSACnv); (c) Mean ratio of the ten planes under different dt thresholds; (d) Mean ratios reduction after considering the angular difference (the reduction approach is similar to (b)).
Remotesensing 08 00005 g005
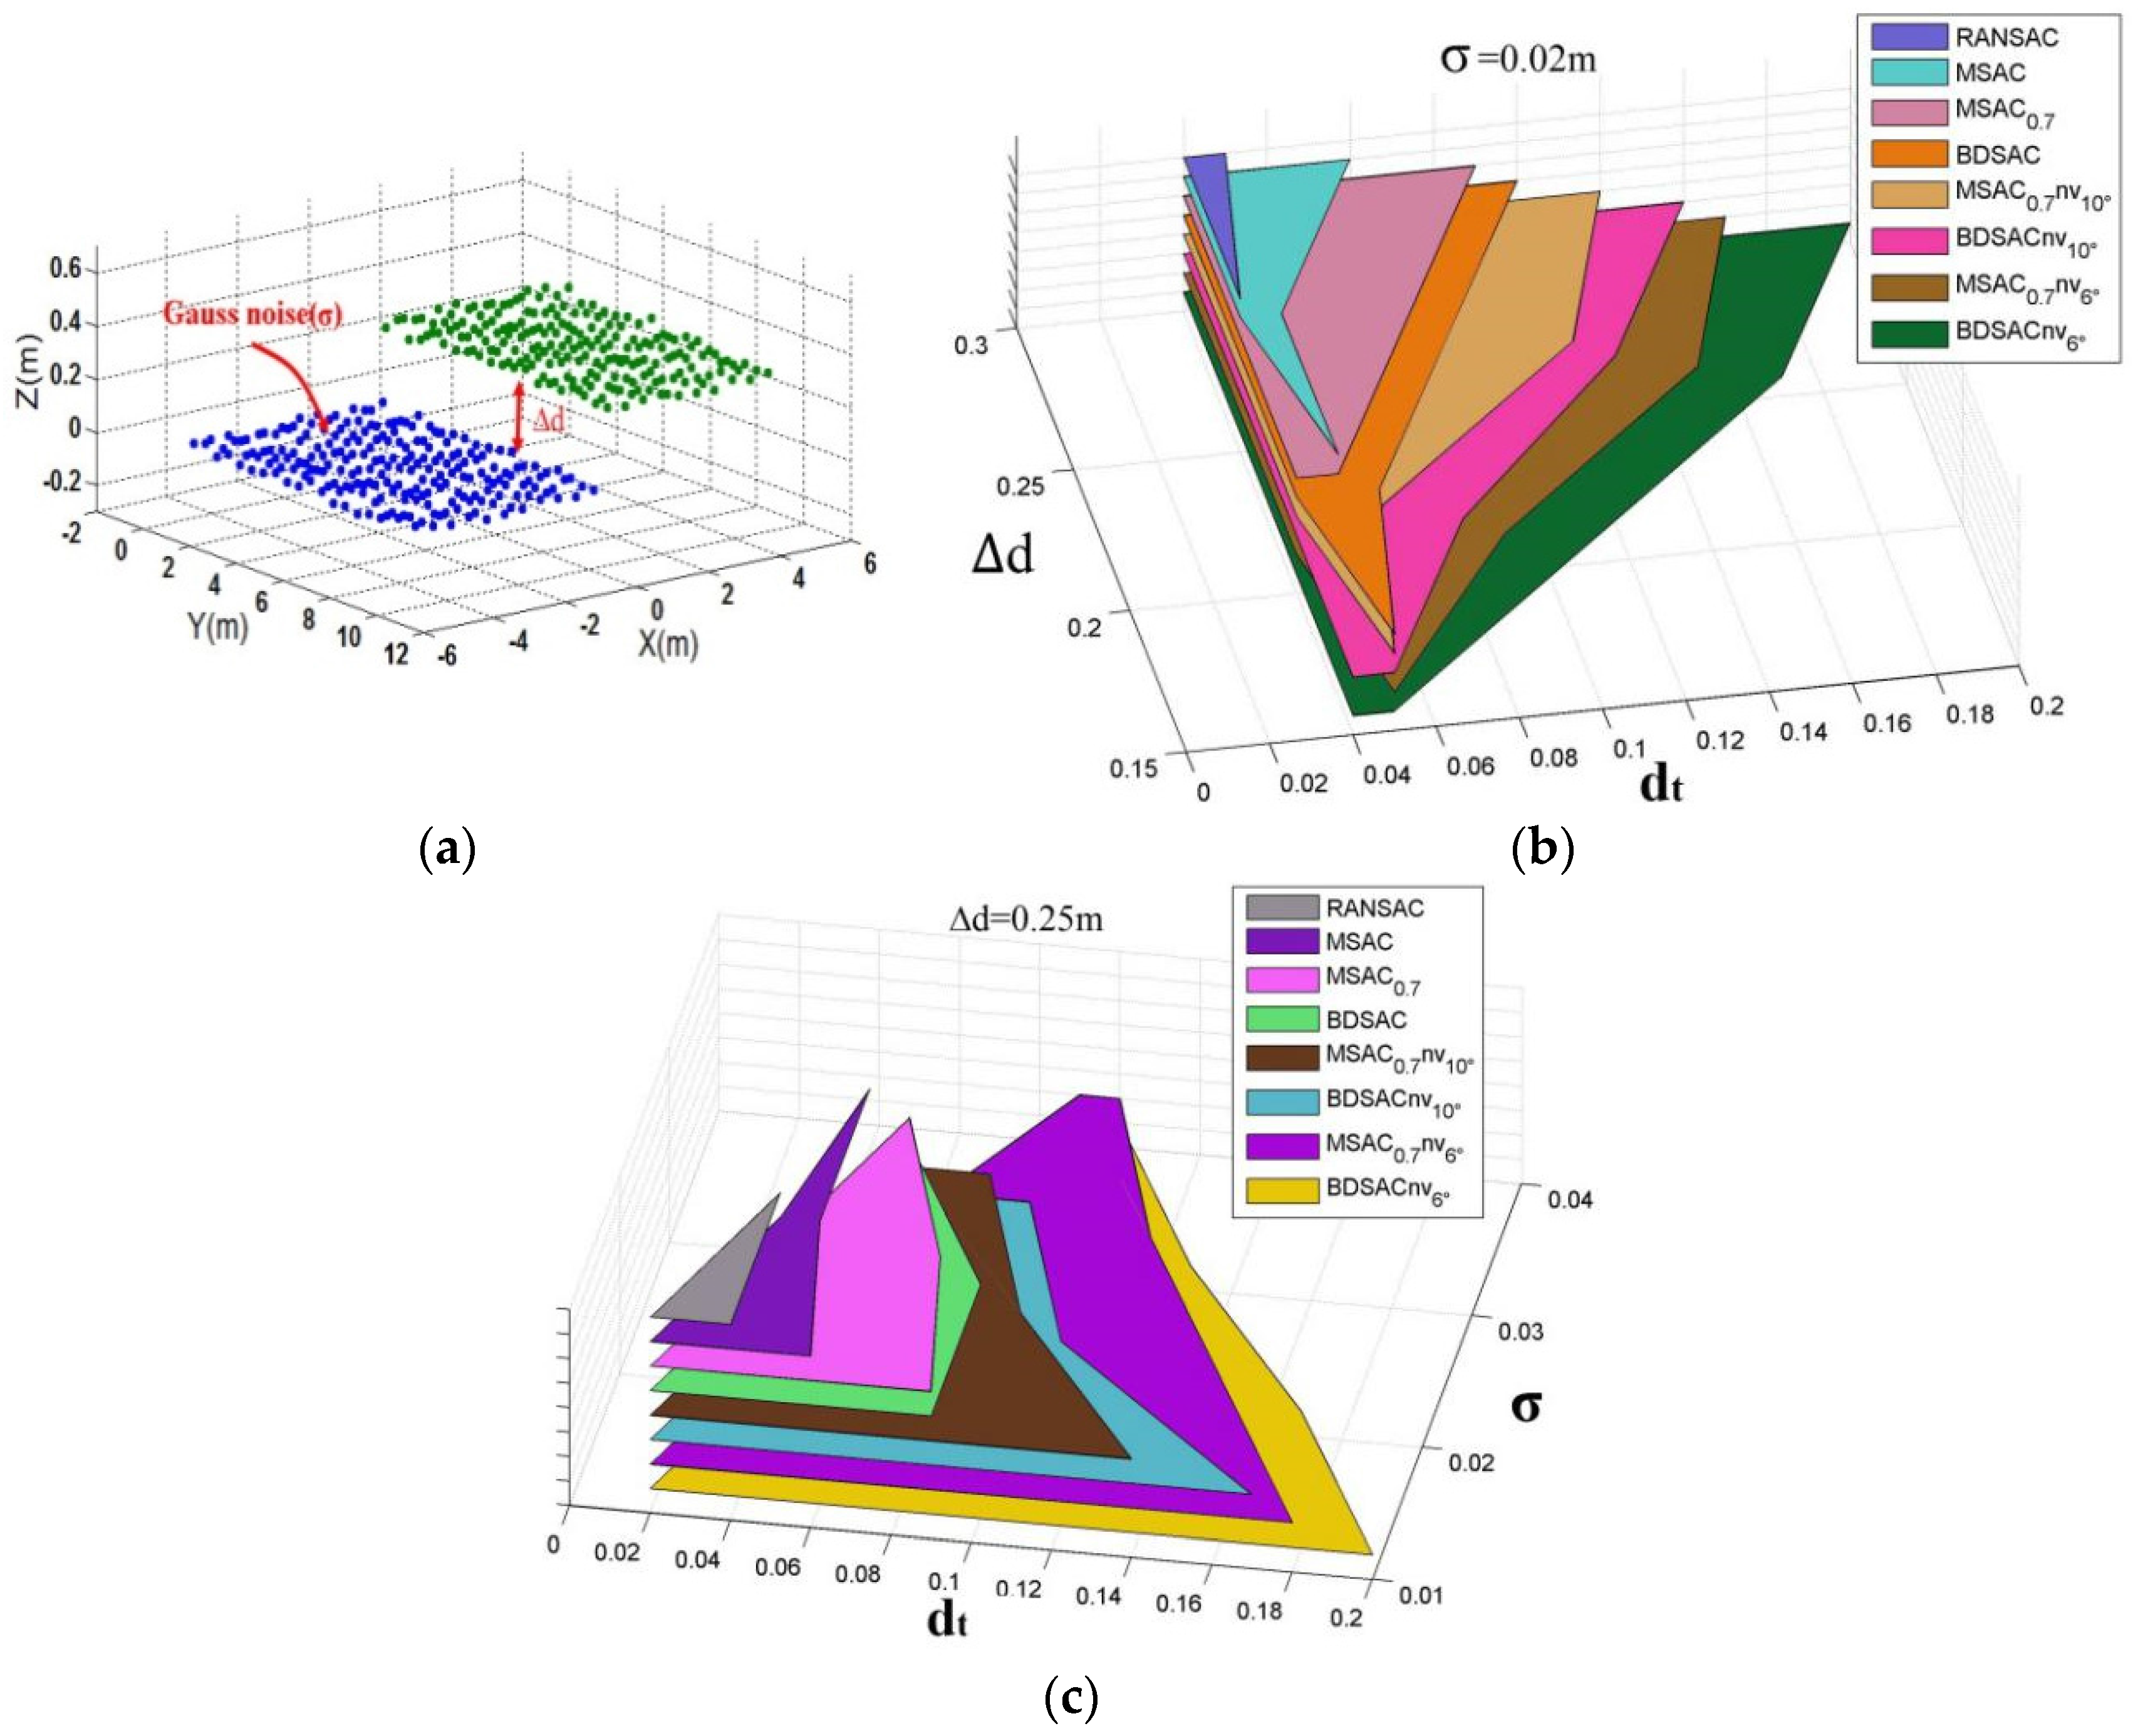
As the performances of the segmentation methods are greatly influenced by the complexity of the input data and the threshold parameters, we simulate the data in Figure 6 to test the robustness of the algorithm on a variety of conditions. The data consists of two adjacent horizontal planes, both 10 m × 5 m with an average point distance is 0.5 m. The height difference between the planes (∆d) and the added Gaussian noise (with a standard deviation of σ) are both changeable. The thresholds dt for the methods are tested from 0.02 m to 0.2 m, every 0.01 m a trail.
The difficulty of segmentation will obviously increase when ∆d decreased or σ increased, which will influence the selection of the dt thresholds. For data with a larger σ, the dt needs to be larger in order to include all the plane inliers; otherwise, over-segmentation may occur. As a result, nearly all the methods fail when dt is smaller than 2σ in Figure 6c (the value need to be even larger in real applications). The value of ∆d reflects the separability of the two planes and stricter thresholds are needed for a successful separation. The setting of thresholds needs to consider both factors and find a proper value between the two limitations, finally forming the acceptable areas for different weighted methods in Figure 6. For classical RANSAC, the results are rather disappointing and a proper threshold is difficult to generate. However, for the weighted methods, as the spurious planes are suppressed, much looser thresholds are allowed which result in larger areas in Figure 6. It also can be seen that both adding new weight forms and considering the angular difference in the weights produce positive effects on the acceptable areas. This decreases the difficulty of threshold selection and allows the possibility of processing more complex data. For instance, when ∆d equals 0.15 m and 0.2 m in Figure 6b or when σ equals 0.03 m and 0.04 m in Figure 6c, the classical RANSAC methods will always fail while our new weighted methods can produce a correct segmentation. Intuitively, a spurious plane that passes through the middle of the two planes will include all the points if dt is larger than ∆d/2 for classical RANSAC and cannot distinguish the two planes well when dt is larger than ∆d/3 in our experiments. In comparison, proper results are produced by BDSACnv even when dt is larger than 2∆d/3.
Figure 6. Data sensitivity test. (a) Simulated data, with changeable ∆d and σ; (b) Segmentation results under different ∆d; (c) Segmentation results under different σ. The colored regions depict the range of dt that can produce a correct segmentation.
Remotesensing 08 00005 g006

4. Experiments and Evaluation

After comparing the effects of different weight functions in suppressing spurious planes and their sensitivity to thresholds and input data, this section presents the stability and robustness segmentation results and the optimal weight recommendations. The various assessment metrics are introduced, and the experiments on various datasets to test the overall performance of the methods are presented.

4.1. Datasets and Fundamental Algorithm

The experiments utilized two datasets. The first dataset was collected in the city of Vaihingen, ISPRS dataset [34] and the other set, which has a higher point density, was collected on the Wuhan University campus, China. In the quantitative tests, the reference data were created manually based on the initial segmentation results and aerial images. Since our segmentation algorithms initiates from the classified building roof points, the points on the ground, walls, and vegetation were filtered beforehand and excluded from the quantitative tests. The results of a RG-based method [11] are also used for comparison purposes.
To evaluate the effects of the weighted methods, a fundamental RANSAC-based segmentation algorithm is needed. Since this paper focuses on the effects of the different weight functions, only a brief introduction to the algorithm implementation is provided here. The main framework of the algorithm follows the work of [4], but we also refer to the work of [7,25] (described in Section 2.1). In the pre-processing stage, the points normal are estimated through the tensor voting algorithm [10], which also divides the points into planar and nonplanar sets. In the second step (standard RANSAC stage), the density-based connectivity clustering is implemented [22] to ensure the spatial connectivity of the detected planes. Some speed-up techniques also are also utilized: a fast and rough connectivity clustering to decompose the integral data [35] (connectivity of the octree cells) and the ND-RANSAC [32] and Local RANSAC [4] to avoid meaningless hypotheses. The post-processing mainly included the following aspects: (1) completion of the roof plane by searching the points from the unsegmented points; (2) clustering of the remaining points set and an extra searching process to detect the lost segments; and (3) to avoid over-segmentation or detecting a plane twice, a region merging process [32] was adopted among the neighbor planes, which required the total weights of the merged plane to be larger than that of either single plane. Some basic specifications for the datasets are provided in Table 1, and the main parameters are shown in Table 2.
Table 1. Properties of the two datasets.
SiteVaihingenWuhan
Acquisition Date22 August 200822 July 2014
Acquisition SystemLeica ALS 50Trimble Harrier 68i
Fly Height500 m1000 m (cross flight)
Point Density~4/m2>15/m2
Table 2. Parameters used in the experiments.
MinPtMinLenAngledtθtNccDccP0NbPt1NbPt2
Vaihingen51 m15°0.15 m10°51.5 m0.99520
Wuhan201 m15°0.20 m10°50.75 m0.991030
MinPt: the minimum number of points for a plane; MinLen: the minimum length of the detected edge. Angle: the angle threshold between the three sample points’ normal and the plane’s normal used in hypothesis generation (ND-RANSAC, see [31]). Ncc (least number of points) and Dcc (searching distance) are the parameters used in the density-based connectivity clustering [24]. P0 is the confidence probability to select the positive hypotheses at least once. NbPt1 and NbPt1 are the two parameters (nearest n points) used in the tensor voting-based method [10] (two rounds of voting).

4.2. Evaluation Metrics

The evaluation metrics consisted of two parts: the object-level evaluation metrics provided in [36] and the quality of the roof ridges detected after segmentation. Completeness (Comp), Correctness (Corr) and Quality in [36] are used to assess the segmentation results:
c o m p = T P T P + F N c o r r = T P T P + F P Q u a l i t y = T P T P + F N + F P
where TP (True Positive) is the number of objects found both in the reference and segmentation, FN (False Negative) is the number of reference objects not found in segmentation, and FP (False Positive) is the number of detected objects not found in the reference. Different from the metrics defined in [37], which are widely adopted for the ISPRS benchmark dataset, the metrics in [36] found the correspondences between the reference and the segmented data by using the “maximum overlap” instead of the “overall coverage”. As they only establish one-to-one correspondences, the TP values in the reference and segmented data are always the same. This can be more convenient for distinguishing the segmentation errors when the relationships of one-to-many, many-to-one, or many-to-many occurred. For example, if one segmented plane corresponds to two reference planes (one-to-many), the two reference planes will all be taken as TPs for the metrics in [37] (fail to detect under-segmentation), while the smaller reference plane will be detected as FN in [36] instead.
Even a small number of incorrectly segmented points sometimes can have a very large influence on the identification of building structures (i.e., false division of roof boundary points can affect the roof topology). Such errors may not be easily detected by the segmentation-based metrics as they only offer a quick assessment at plane level, (i.e., a minimum overlap of 50% with the reference is required to be a TP). Consequently, a result-driven metrics is designed based on whether the segmentation results influences the extraction of roof ridges. The intersection line is calculated using the method and parameters provided in [28]. Considering that the intersections of roofs ridges in corners (i.e., using the close-circle analysis in [38]) may cover up some mistakes in segmentation, only the original ridges are compared in the experiments.
Two ridge-based metrics are utilized in our experiments. One metric is based on the roof topology graph (RTG) which mainly considers the existing ridges between planes. In the above metrics, the one-to-one correspondences among the reference planes and roof planes have been established. A detected ridge is related to two extracted planes and is taken as a TP only when two correspondences between planes can be found and a reference ridge exists between the two planes. The second metric is much stricter and accepts a TP only when the corresponding ridges are similar enough. To achieve such a goal, the similarity between the reference ridges and the test ridges are defined (Figure 7), which consists of three aspects: distance consistence (dc), orientation consistence (oc), and projection consistence (pc):
d c = exp { ( | C C 1 | + | D D 1 | 2 d i s 0 ) 2 } o c = exp { ( α α 0 ) 2 } p c = | A B | | C 1 D 1 | | A B | | C 1 D 1 | = | C 1 B | | A D 1 |
where α 0 and d i s 0 are two previously established values (i.e., 5° and 0.2 m). As the oc, pc and dc are values between 0 and 1, the large the better, the integral consistence is set as the product of the three values:
i c = o c d c p c
Figure 7. Definition of ridge similarity. Line AB: the reference ridge (Ref); line CD: the detected ridge (Test), where C1 and D1 are the corresponding projection points of C and D; and α is the intersect angle.
Remotesensing 08 00005 g007

4.3. Experiments

In this section, the improvements from using the weighted approach experimentally are verified. First, the methods for typical scenes that are error-prone for classical RANSAC are presented. Then, the results for the Vaihingen and Wuhan University datasets are evaluated by the metrics given in Section 4.2.

4.3.1. Local Data

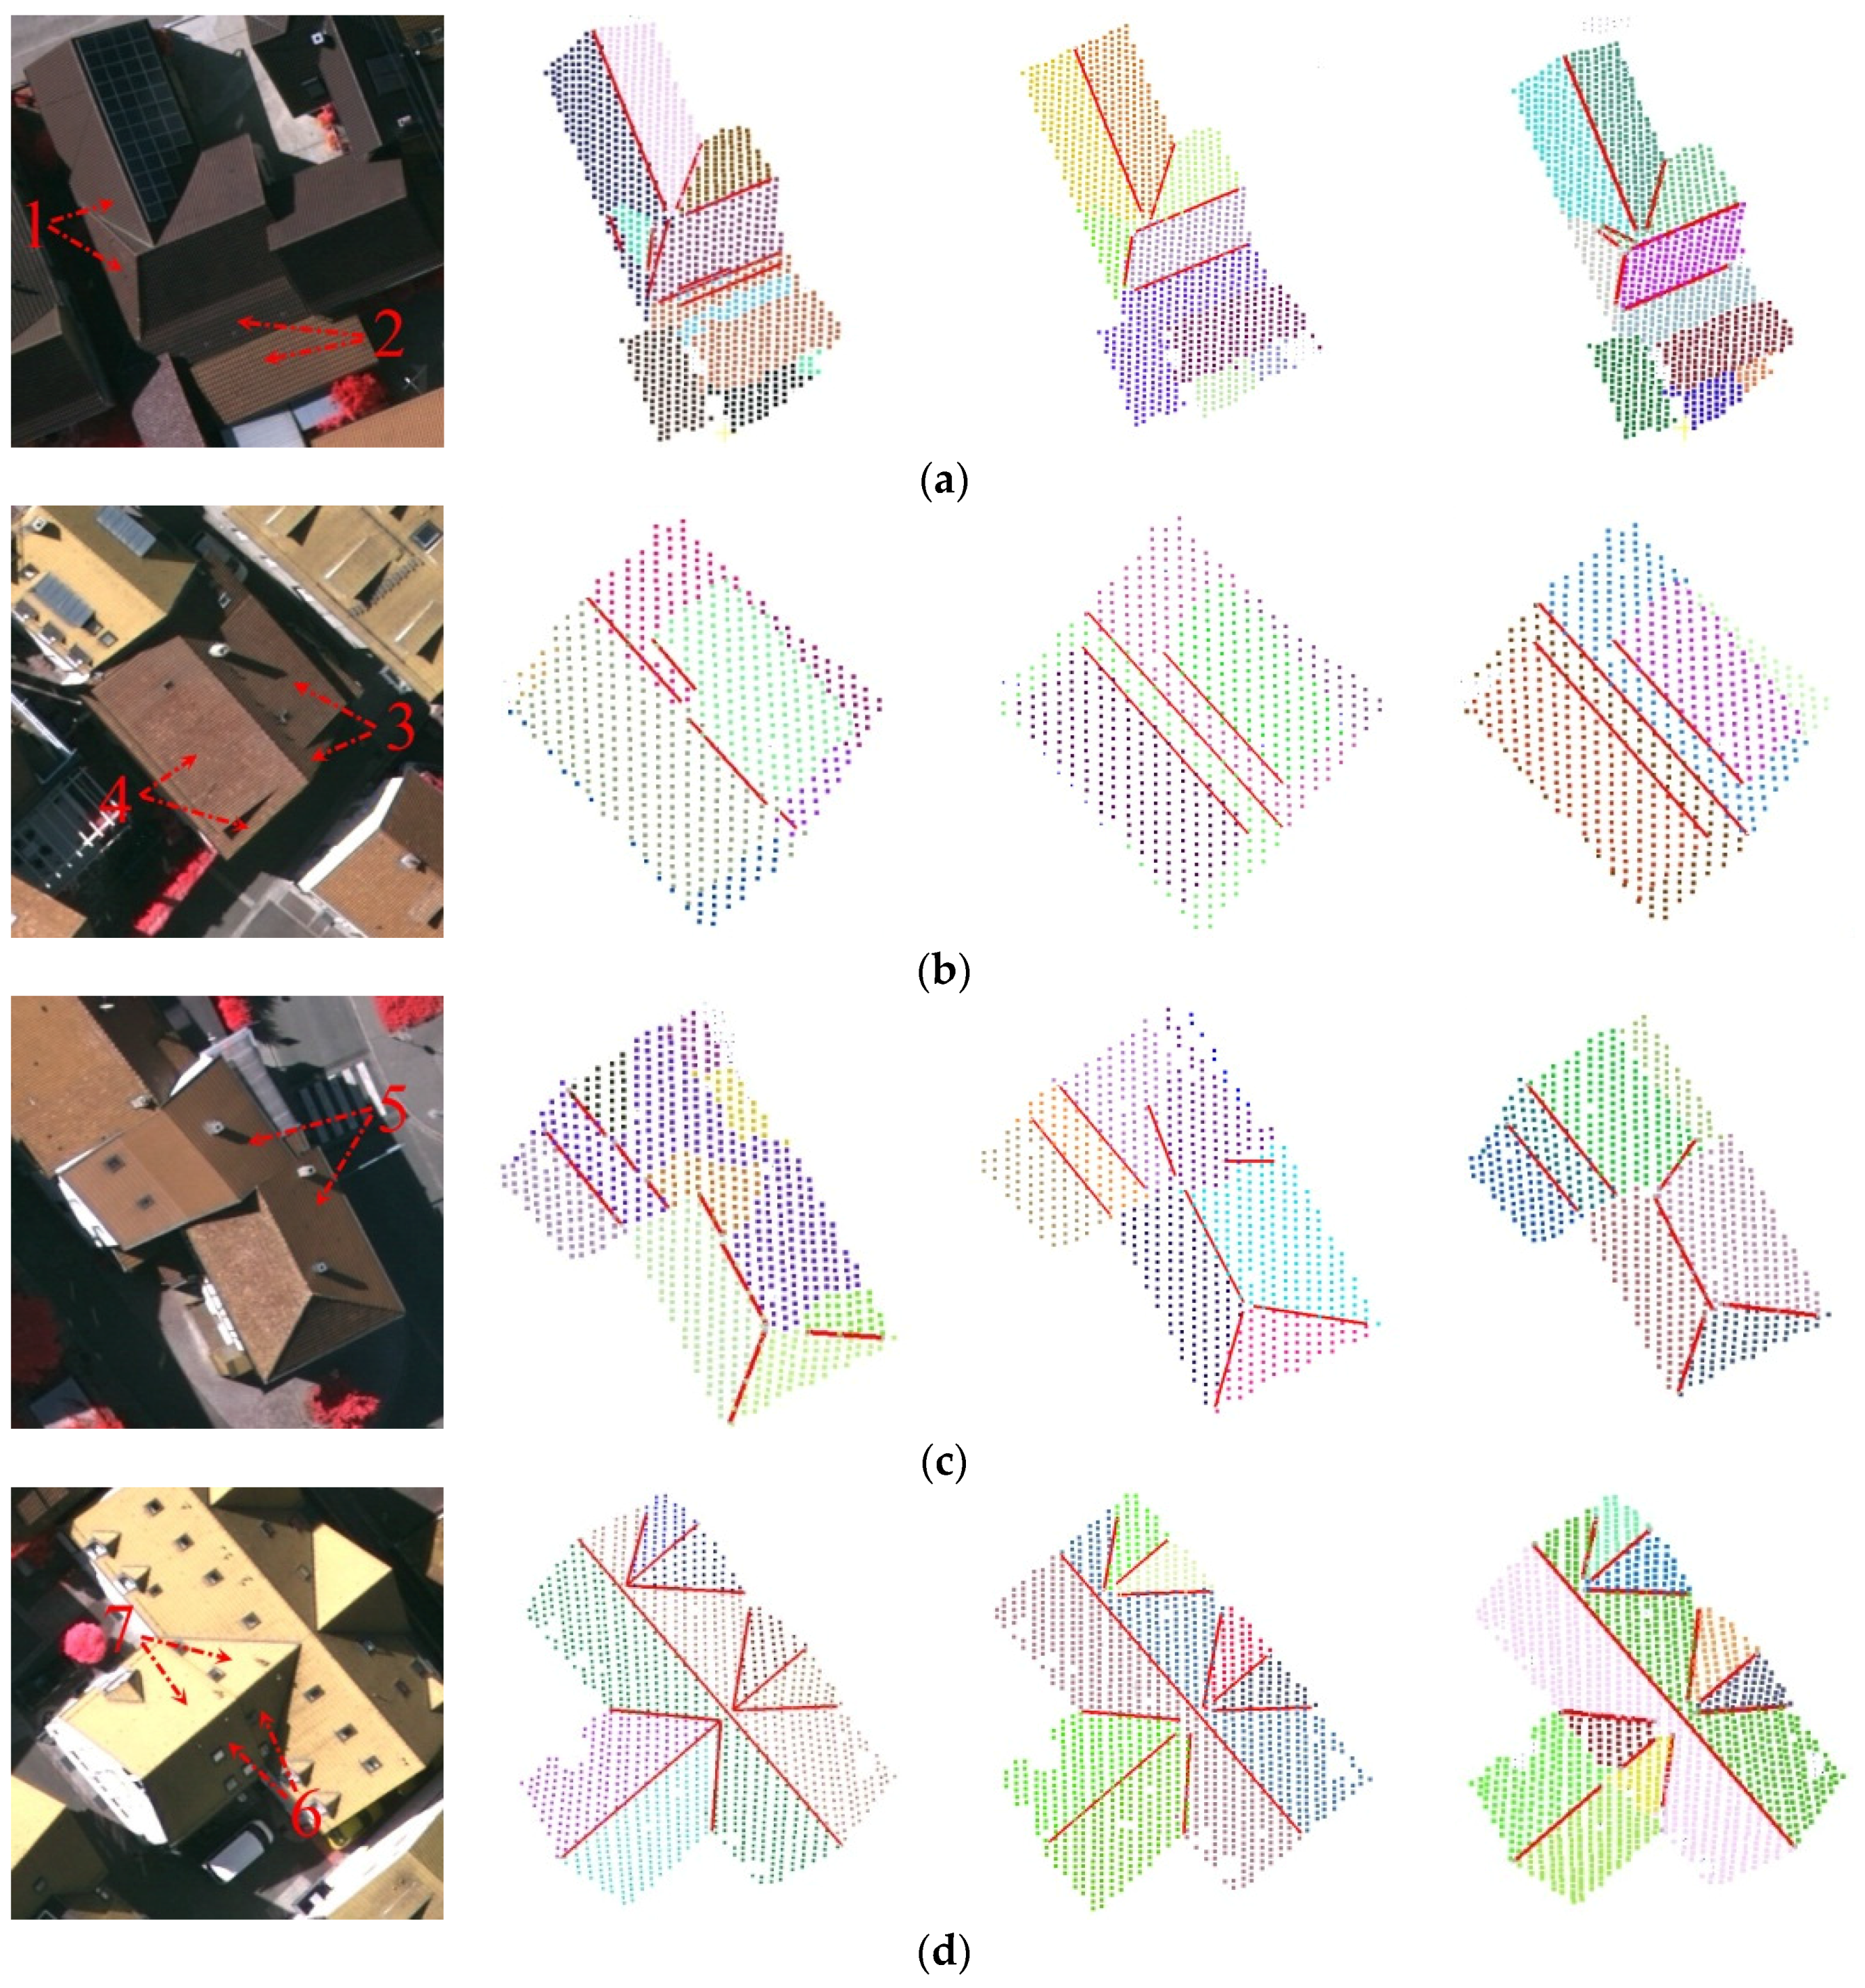
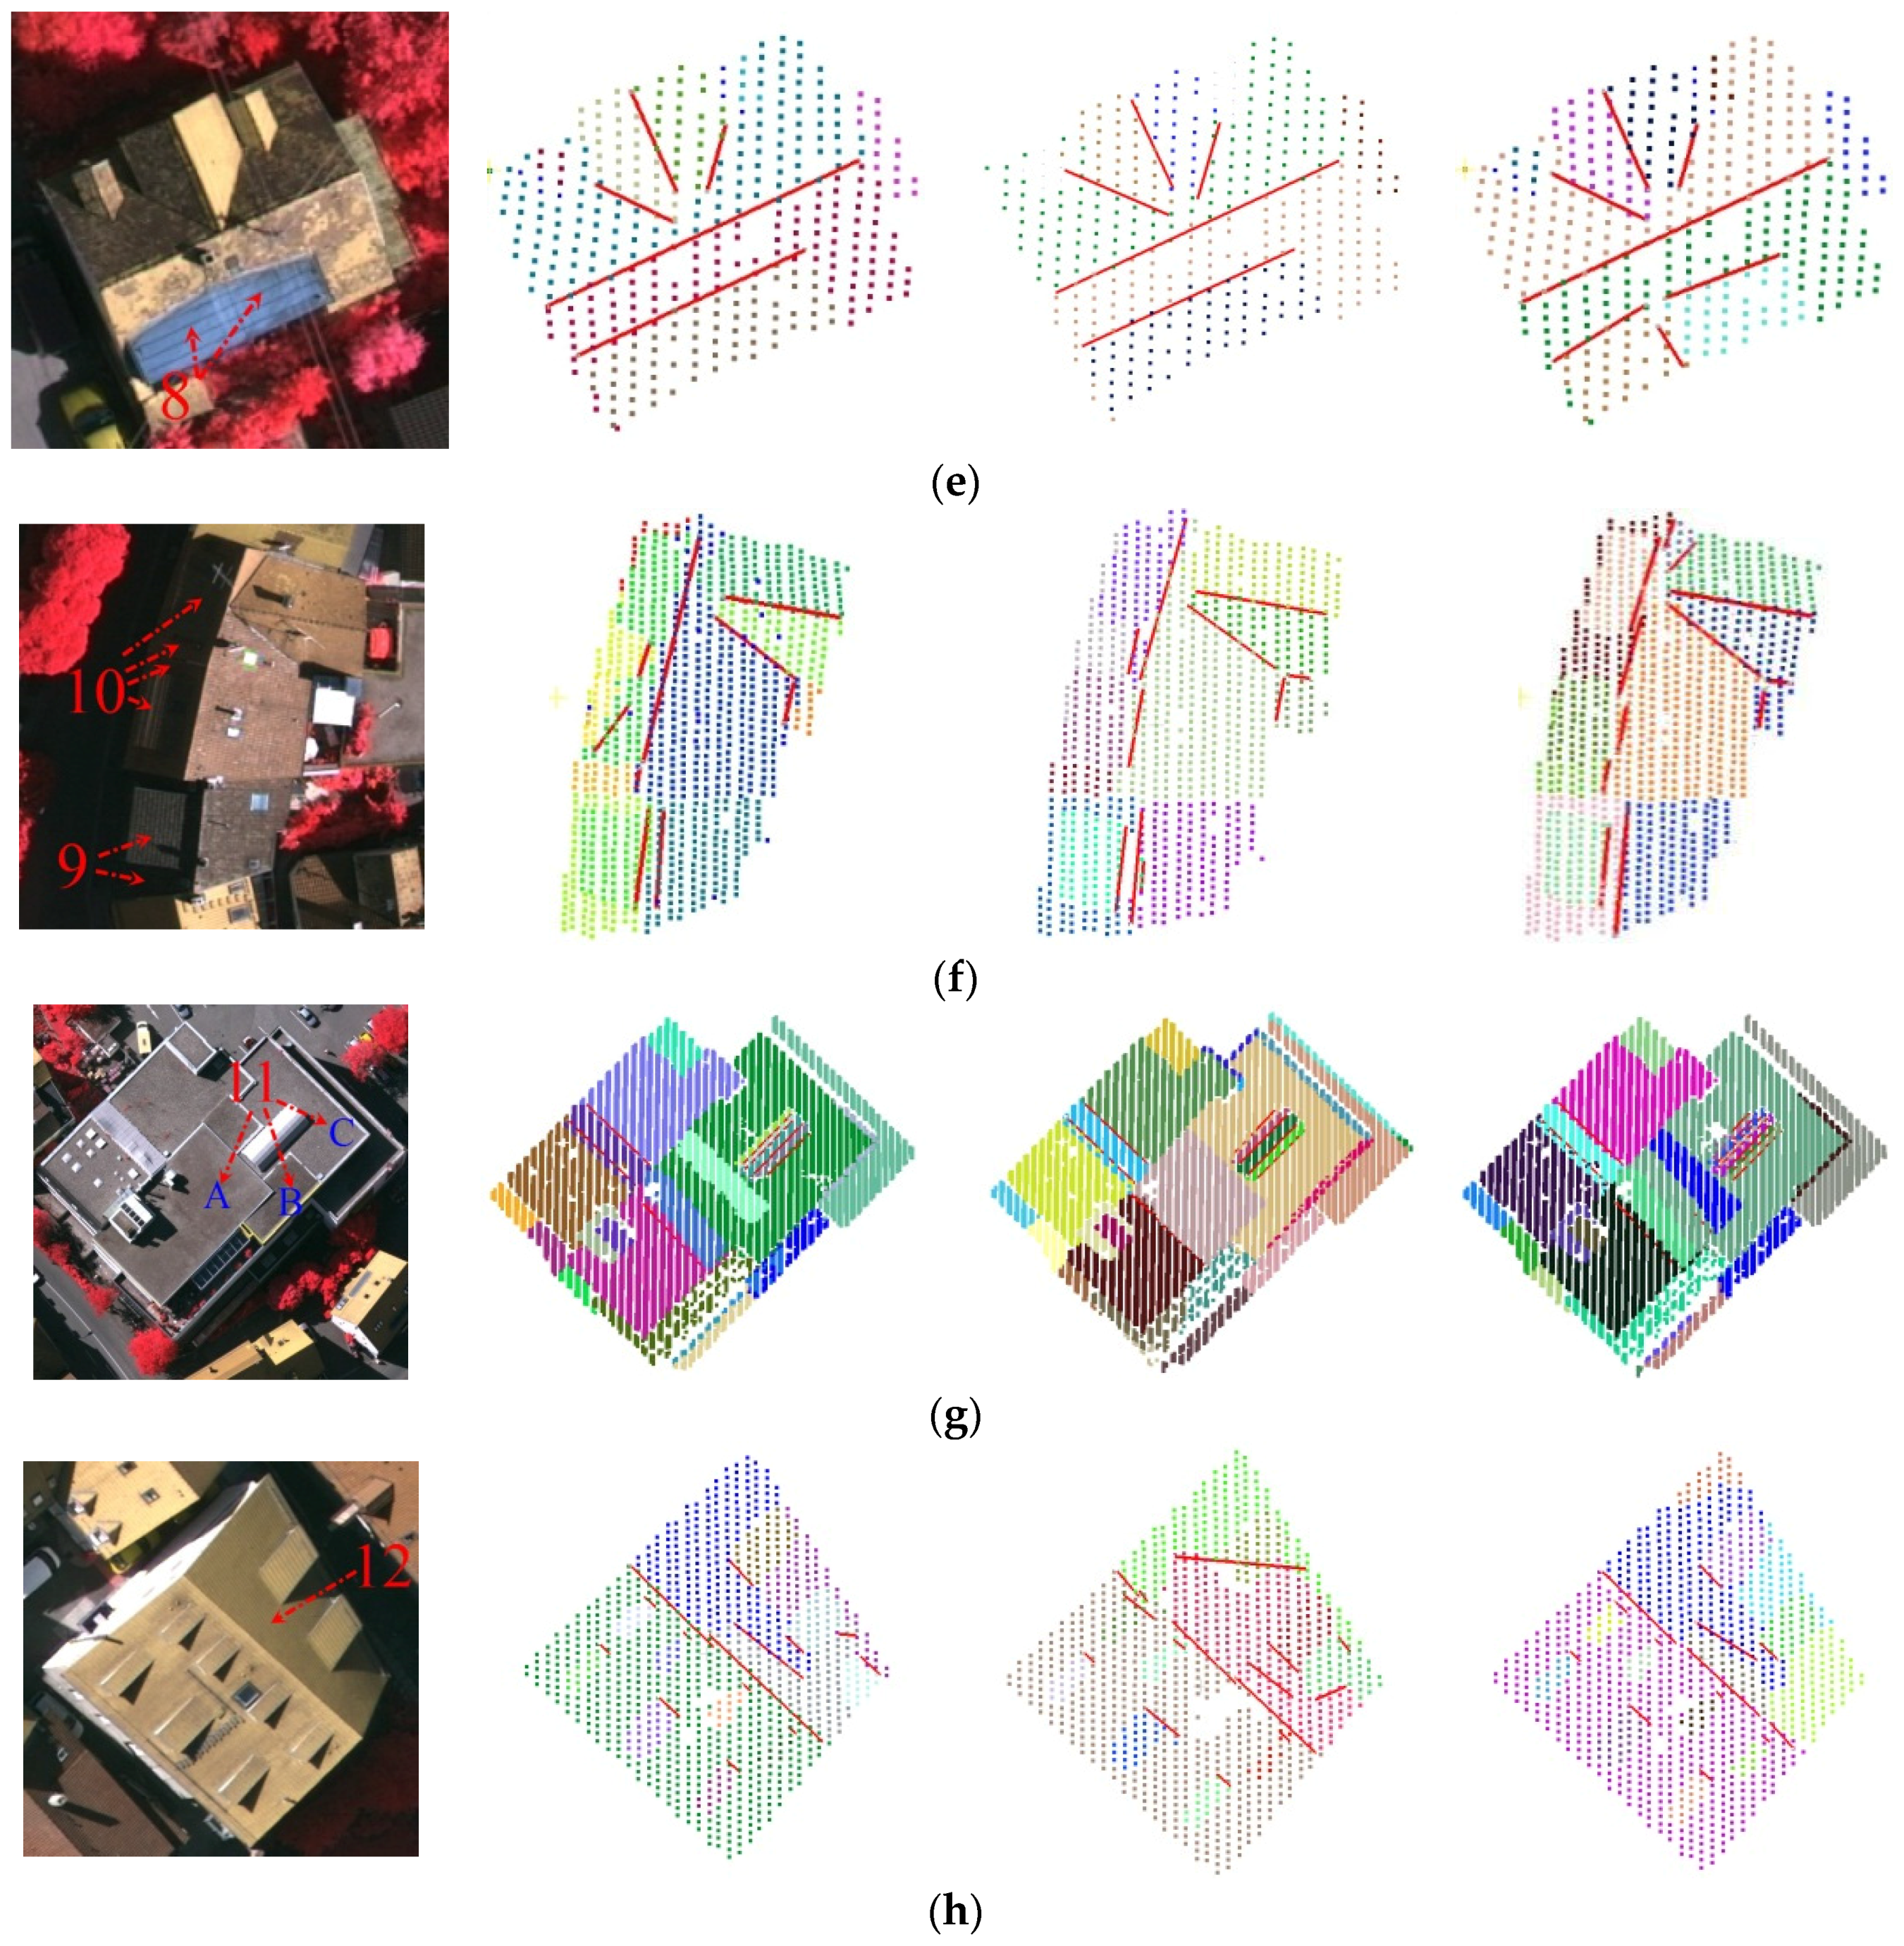
For the RANSAC-based methods, spurious planes that consist of points from several roof surfaces are easily generated when adjacent planes have very similar heights or normal orientations. As shown in Figure 8, we select eight typical buildings (a)–(h) to examine the new weighted methods, with the error-prone regions numbered from 1 to 12. In regions 1–2, 5, and 11, a detected plane is possibly be overlapping multiple reference planes; for regions 3–4 and 9–10, poor segmentation may occur when inaccurate hypothesis planes snatch points from neighbor planes; for regions 6–8, two planes are shown as merged into one; and the roof in region 12 is not complanate, thus the segmented results are likely fragmentized. Due to the limited space, we present only the segmentation results for RANSAC, BDSAC, and RG. The MSAC and MLESAC results are very similar to the conventional RANSAC results and can hardlyable to distinguish the poorly estimated planes. Further discussion will be provided in Figure 9.
Figure 8. Results of segmentation and ridge detection for error-prone buildings. (ah) are eight selected buildings containing error-prone regions. From left to right: reference images, results by classical RANSAC, results by RG, and results by BDSACnv.
Remotesensing 08 00005 g008aRemotesensing 08 00005 g008b
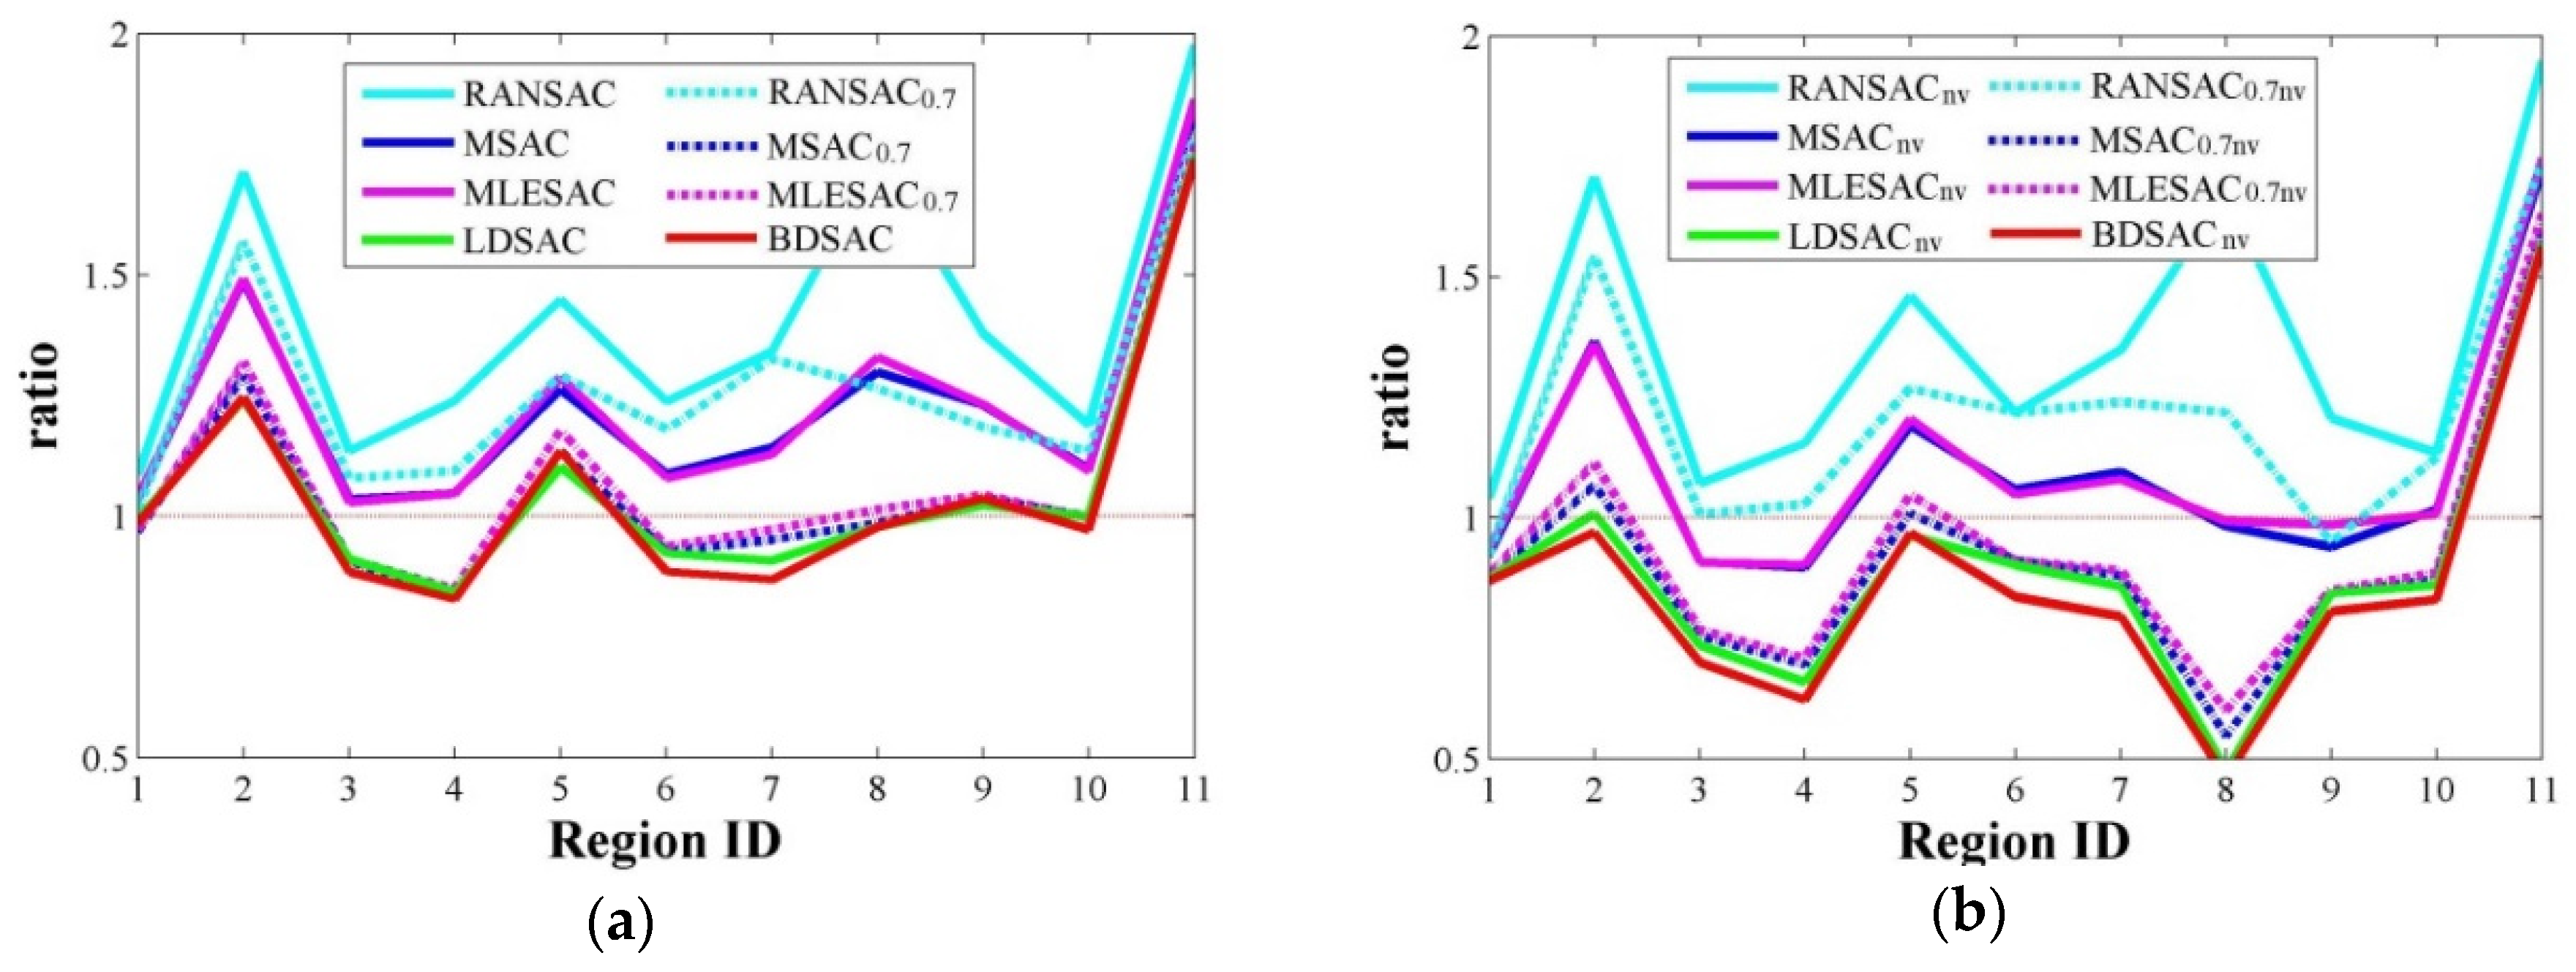
Figure 9. Suppressing ratios comparison. The spurious planes detected by RANSAC in Figure 8 (regions 1–11). (a) Suppressing ratio for methods that only consider point-plane in weight functions; (b) Ratios for methods considering both distance and angular difference.
Remotesensing 08 00005 g009
As shown in Figure 8, our new weighted method significantly improved the segmentation and ridge detection results. In regions 1–9, most of the segmentation errors for the RANSAC method, which are also common for the RG method (regions 5–9), are properly solved. In regions 10–12, all the methods fail to create ideal results. The errors in region 10 are mainly caused by sparse data; and in region 11, the normal difference between planes A and B is about 3°and the height difference between B and C is only about 0.15 m, which are too small to distinguish under the current thresholds. The RG method successfully distinguished roofs A and B while it fail to separate B and C. For region 12, all the methods fail because the origin data is not complanate. As a result, our method, compared to the RG method, is slightly better in region 10 but worse in region 11. The quantitative results in Table 3 support our conclusion. Comparing the results of our method to classical RANSAC, the overall segmentation quality increases from 61.3% to 77.2%, and the two ridge-based metrics also increase from 51.8% to 81.7% and 41.6% to 69.3%. Meanwhile, our results are also better than the RG method by the metrics. It can be seen that for regions like 1–4 and 9–0, the incorrectly classified points may not be significant in point count but had strong influences on the identification of roof topology. Such errors are not distinguished by the segmentation-based metrics (i.e., the three planes in region 9 are considered as TPs). Our ridge based metrics show more reasonable evaluation under such situations as the errors will damage the distinguishing of roof ridges. The metrics based on ridge similarity are stricter than those based simply on RTG and exclude some ambiguous or incomplete ridges, such as the ridges in building (b) in Table 3, and thus are more reasonable in some situations.
Table 3. Quality of segmentation results for data in Figure 8.
IDnPlsnRidgesMethodSegmentationRidges (RTG)Ridges (ic > 0.3)
%Cm%Cr%Qua%Cm%Cr%Qua%Cm%Cr%Qua
a107RANSAC801008071.455.545.557.144.433.3
RG10010010071.410071.471.410071.4
BDSACnv10010010010010010071.410071.4
b53RANSAC8057.15066.750.040.0000
RG100100100100100100100100100
BDSACnv100100100100100100100100100
c75RANSAC85.76051.560.037.530.040.025.018.2
RG85.77566.710071.471.410071.471.4
BDSACnv10010010010083.383.310083.383.3
d1011RANSAC80.010080.090.910090.990.910090.9
RG80.010080.090.910090.990.910090.9
BDSACnv100100100100100100100100100
e97RANSAC88.910088.971.410071.457.18050
RG601006071.410071.457.18050
BDSACnv100100100100100100100100100
f1212RANSAC66.766.75033.350.025.033.35025.0
RG83.390.976.941.755.531.241.755.531.2
BDSACnv91.791.784.691.791.784.666.766.750.0
g235RANSAC69.664.050.010062.562.510062.562.5
RG78.372.060.010071.471.410071.471.4
BDSACnv69.666.751.610050.050.010050.050.0
h1110RANSAC90.971.466.790.064.360.080.057.150.0
RG81.869.260.070.046.738.960.040.031.6
BDSACnv90.966.762.590.069.264.380.061.553.3
sum8760RANSAC78.273.961.371.765.251.861.756.141.6
RG82.883.771.375.073.859.271.770.555.1
BDSACnv89.784.877.296.784.181.786.777.669.3
Figure 9 depicts the performance results of the different weighted methods based on the data in Figure 8, via the outlier suppression ratio (Equation (14)). In each error-prone region, we utilize the largest spurious plane by RANSAC as the test hypothesis plane, whose total weight is Wtest, and the total weight of the largest reference plane in the corresponding region is Wref. Regions 1–11 in Figure 8 are evaluated. Region 12 is omitted because the roof surface is nonplanar.
Although the ratios are smaller for MSAC and MLESAC than for classical RANSAC, all of them are over 1; thus, the two methods will still accept all the spurious planes that result in false segmentation. As a result, simply using MSAC and MLESAC cannot improve the segmentation results. For our new method, both the new weight forms and the weights regarding angular difference have distinct positive effects on the final results. Considering only one factor may fail in some situations, such as regions 4 and 7 for BDSAC and MSACnv. Meanwhile, the extent of the improvements by angular difference in the weights may be different for the planes. For planes with distinct biases in both the distance and normal vectors, such as regions 2 and 8, the suppressing of the total weights can be larger than in other regions. Again, BDSACnv provides the best results. In addition, although our methods fail in region 11, the ratio of the BDSACnv is still smaller than the other weighted methods.

4.3.2. Vaihingen (Germany)

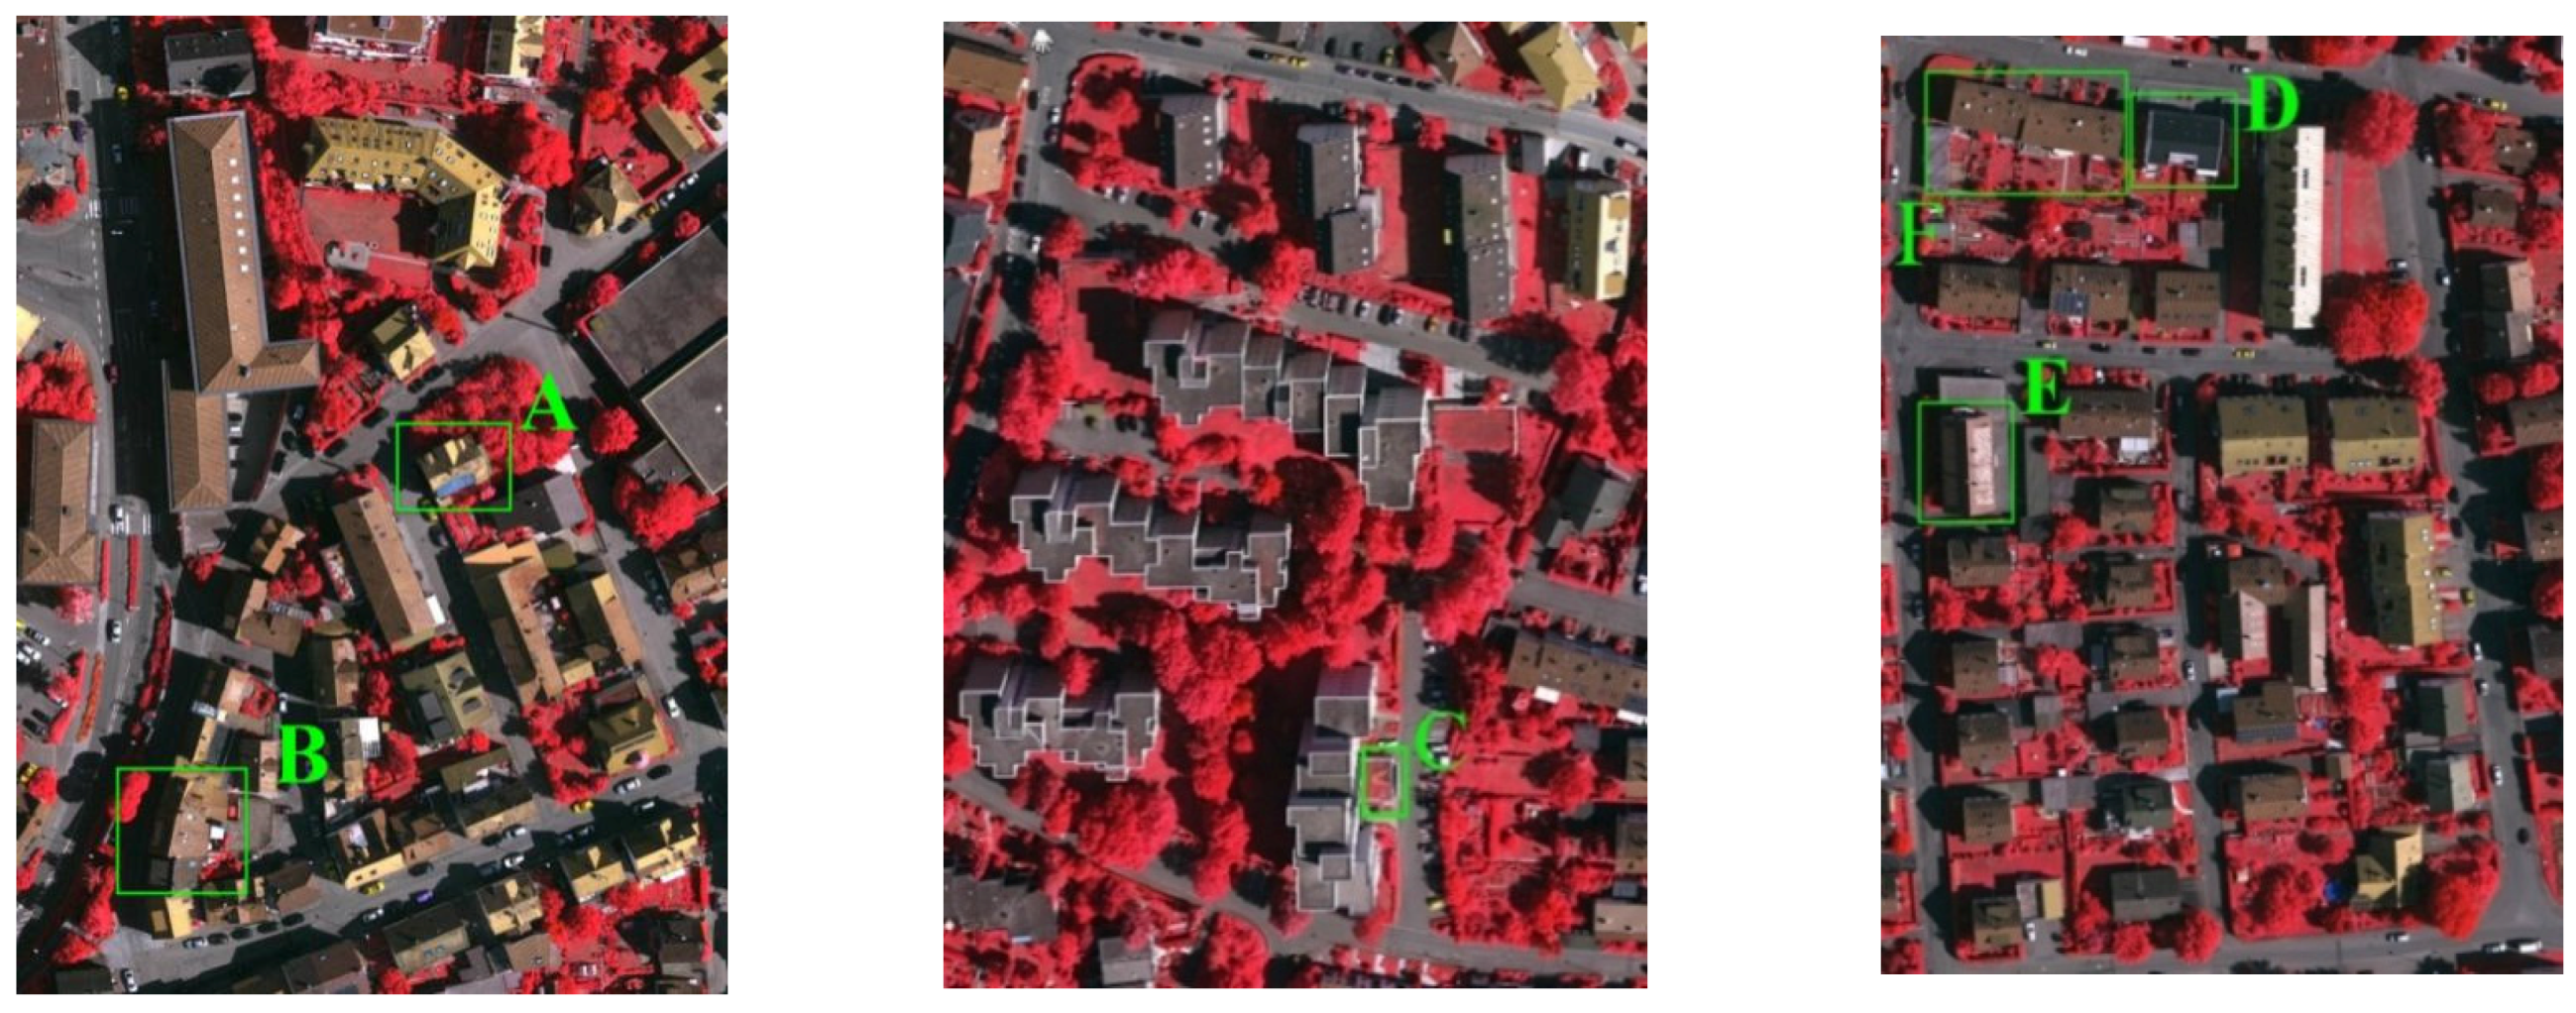
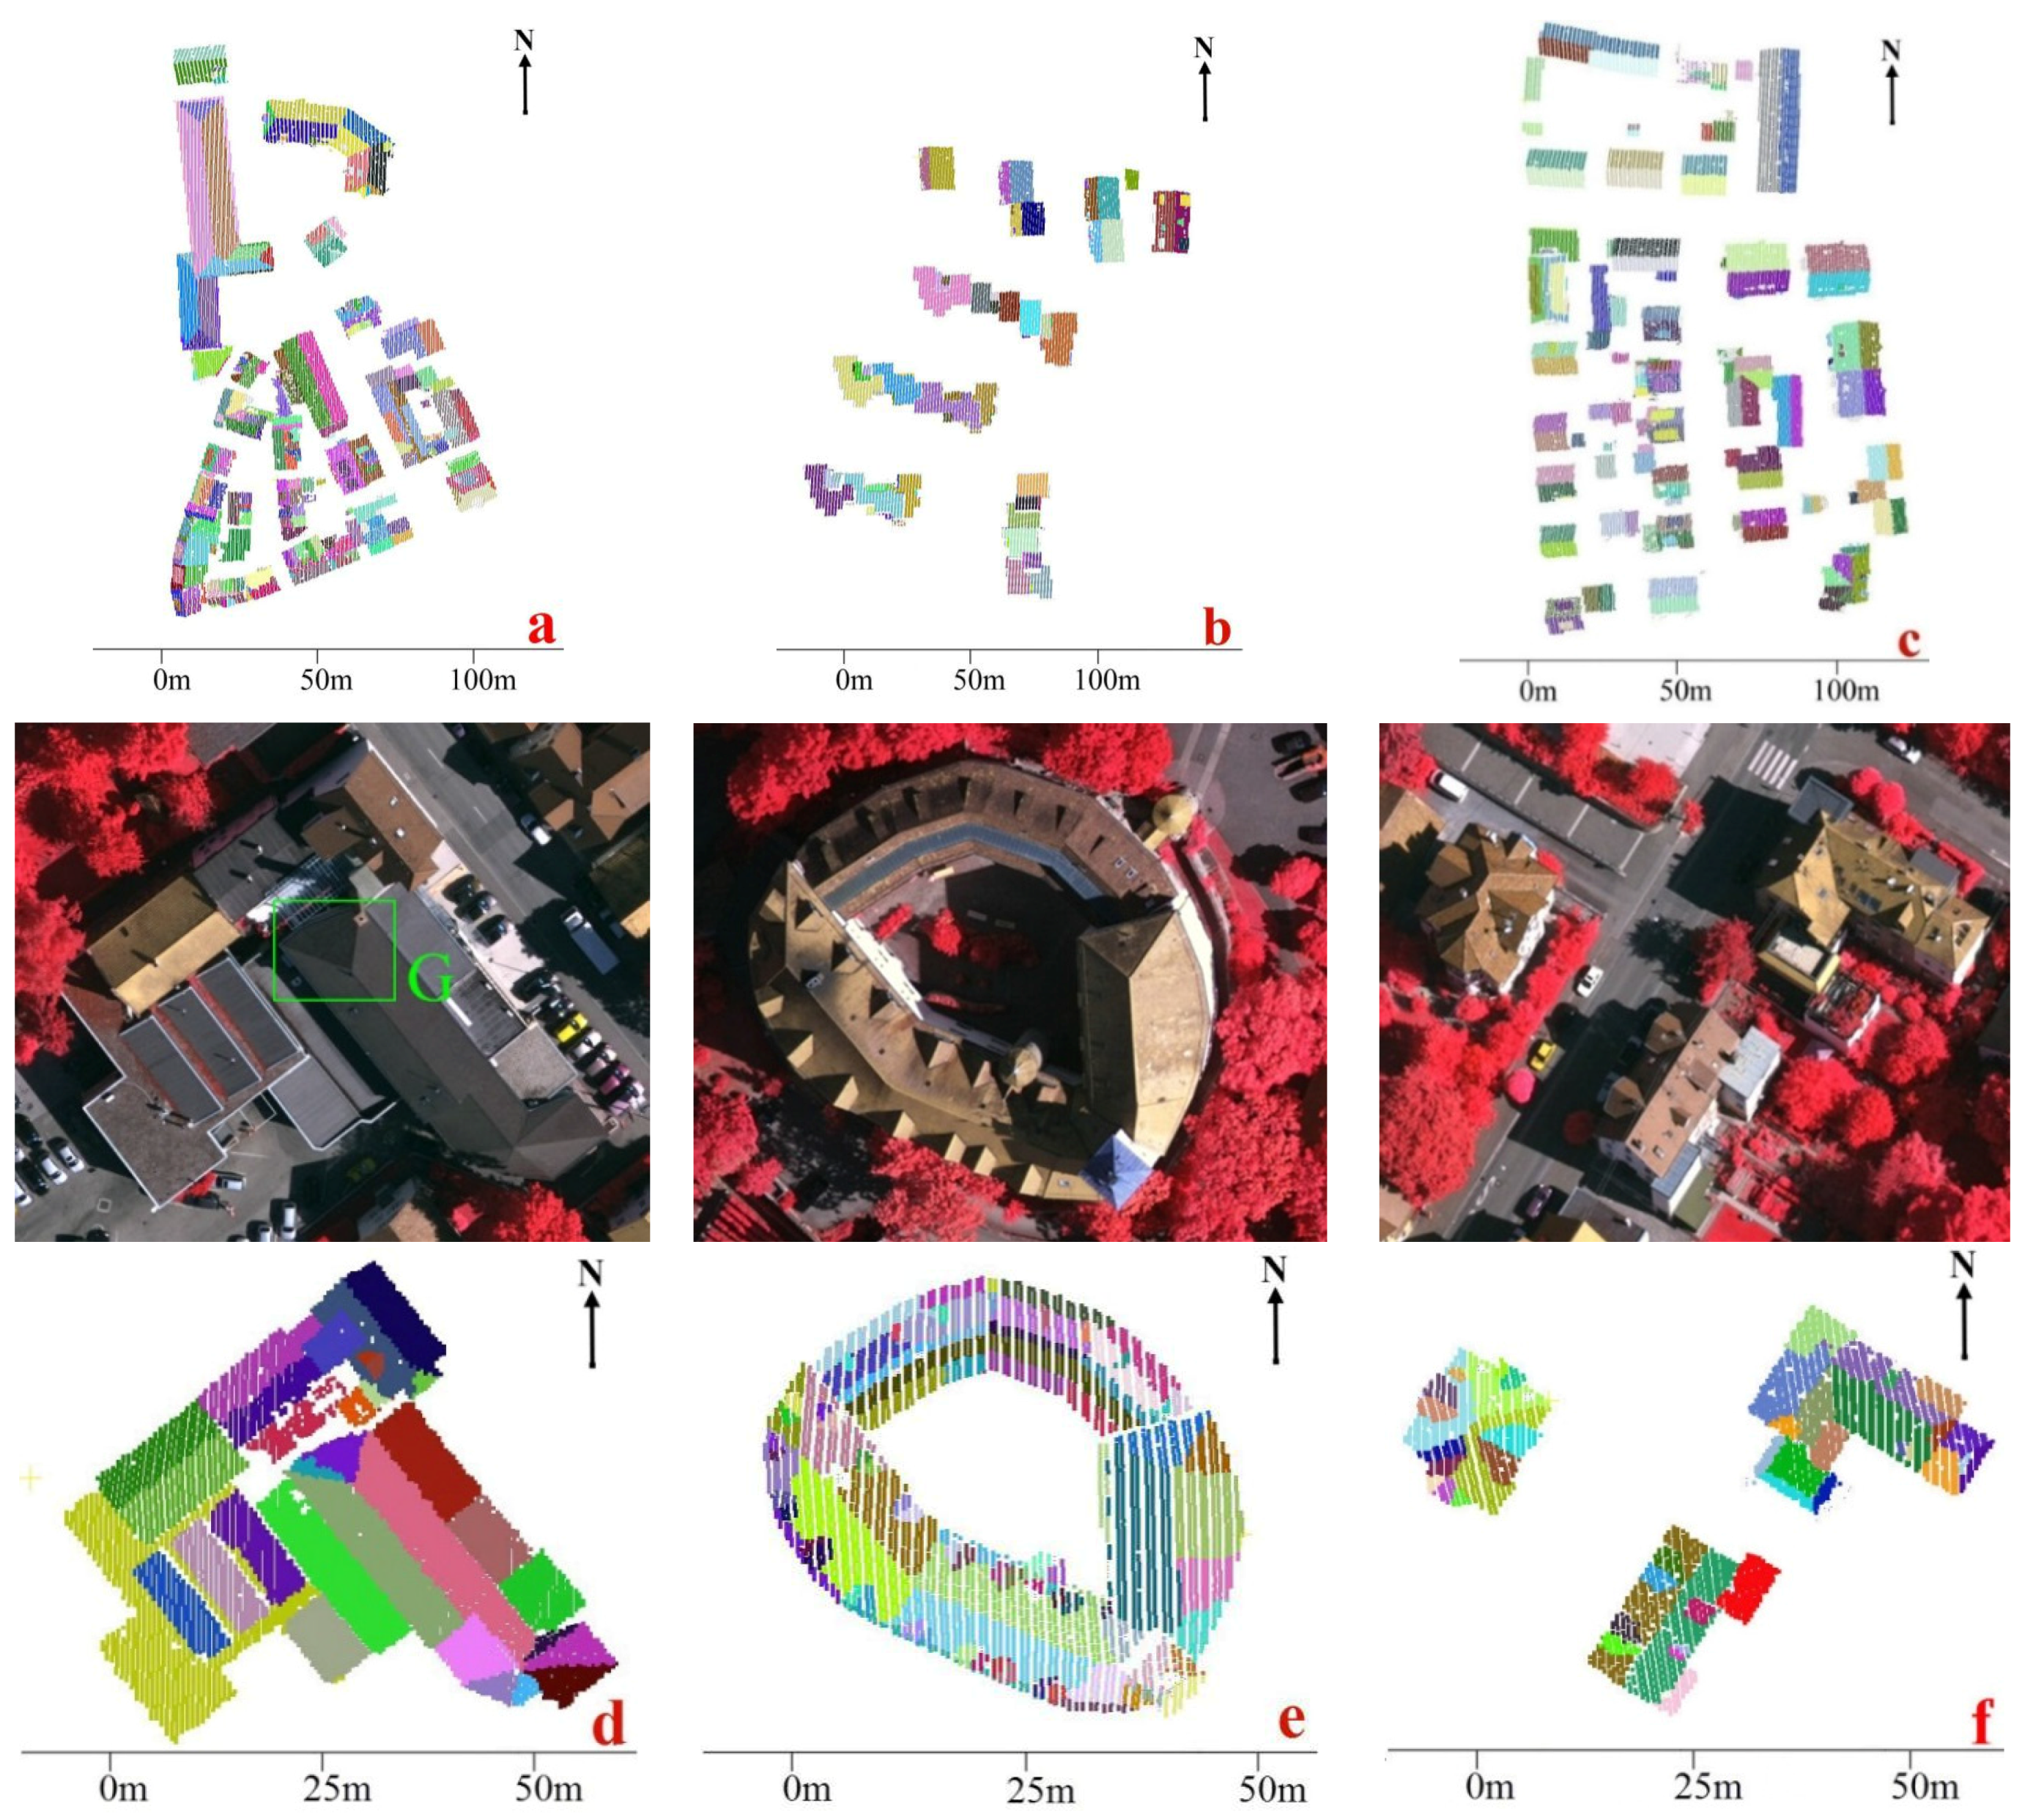
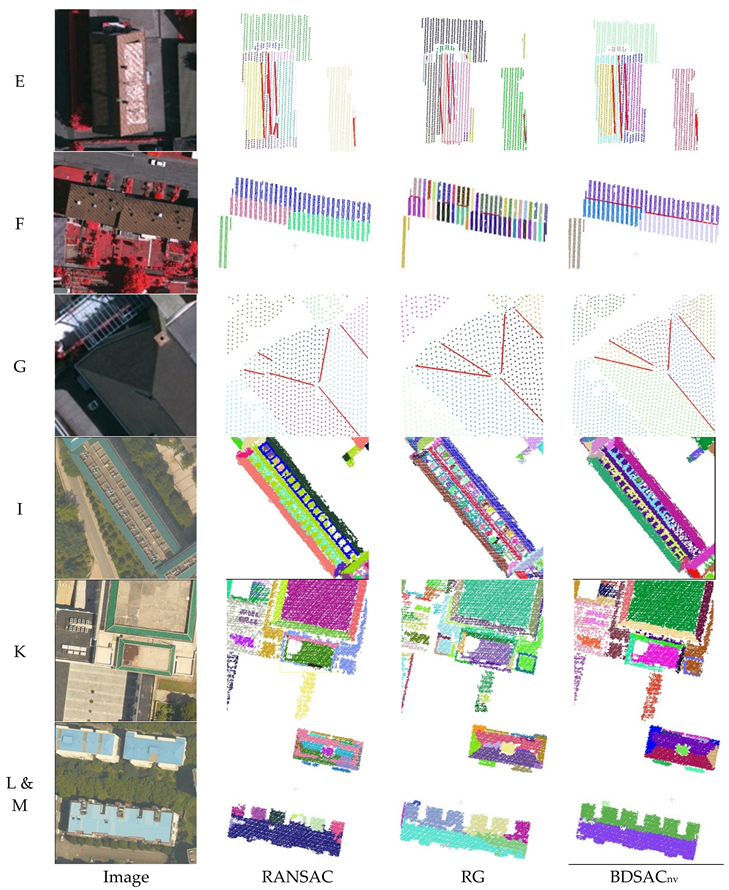
Figure 10 illustrates the segmentation results for the Vaihingen data; specifically, Figure 10a–c are the benchmark data of the “ISPRS Test Project on Urban Classification and 3D Building Reconstruction”, in which A and B have been tested in Figure 8e,f, respectively. Other error-prone regions for the classical methods also are indicated in the Figures. For region E, the situation is similar to Figure 8b,f, where spurious planes overlapping multiple roof planes can be produced. In region G, several planes intersect at the same roof corner, which requires more accurate segmentation methods and neighbor competition in the post-processing to better divide the roof boundary points. Our weighted methods show advantages in those regions as well, as the planes with smaller distance errors are more likely to be accepted. Such differences can be detected by the ridge-based metrics. When the transitions between the neighbor regions are smooth, as shown in E, the RG-based methods may fail. Some of the errors are caused by the processing before roof segmentation; for example, the points in region C are classified as vegetation and parts of the points in region D are lost in the original data. All the methods fail in those regions and the related roof ridges are also lost. For E, F, and G, the segmentation results of the different methods are illustrated in Appendix I for comparison.
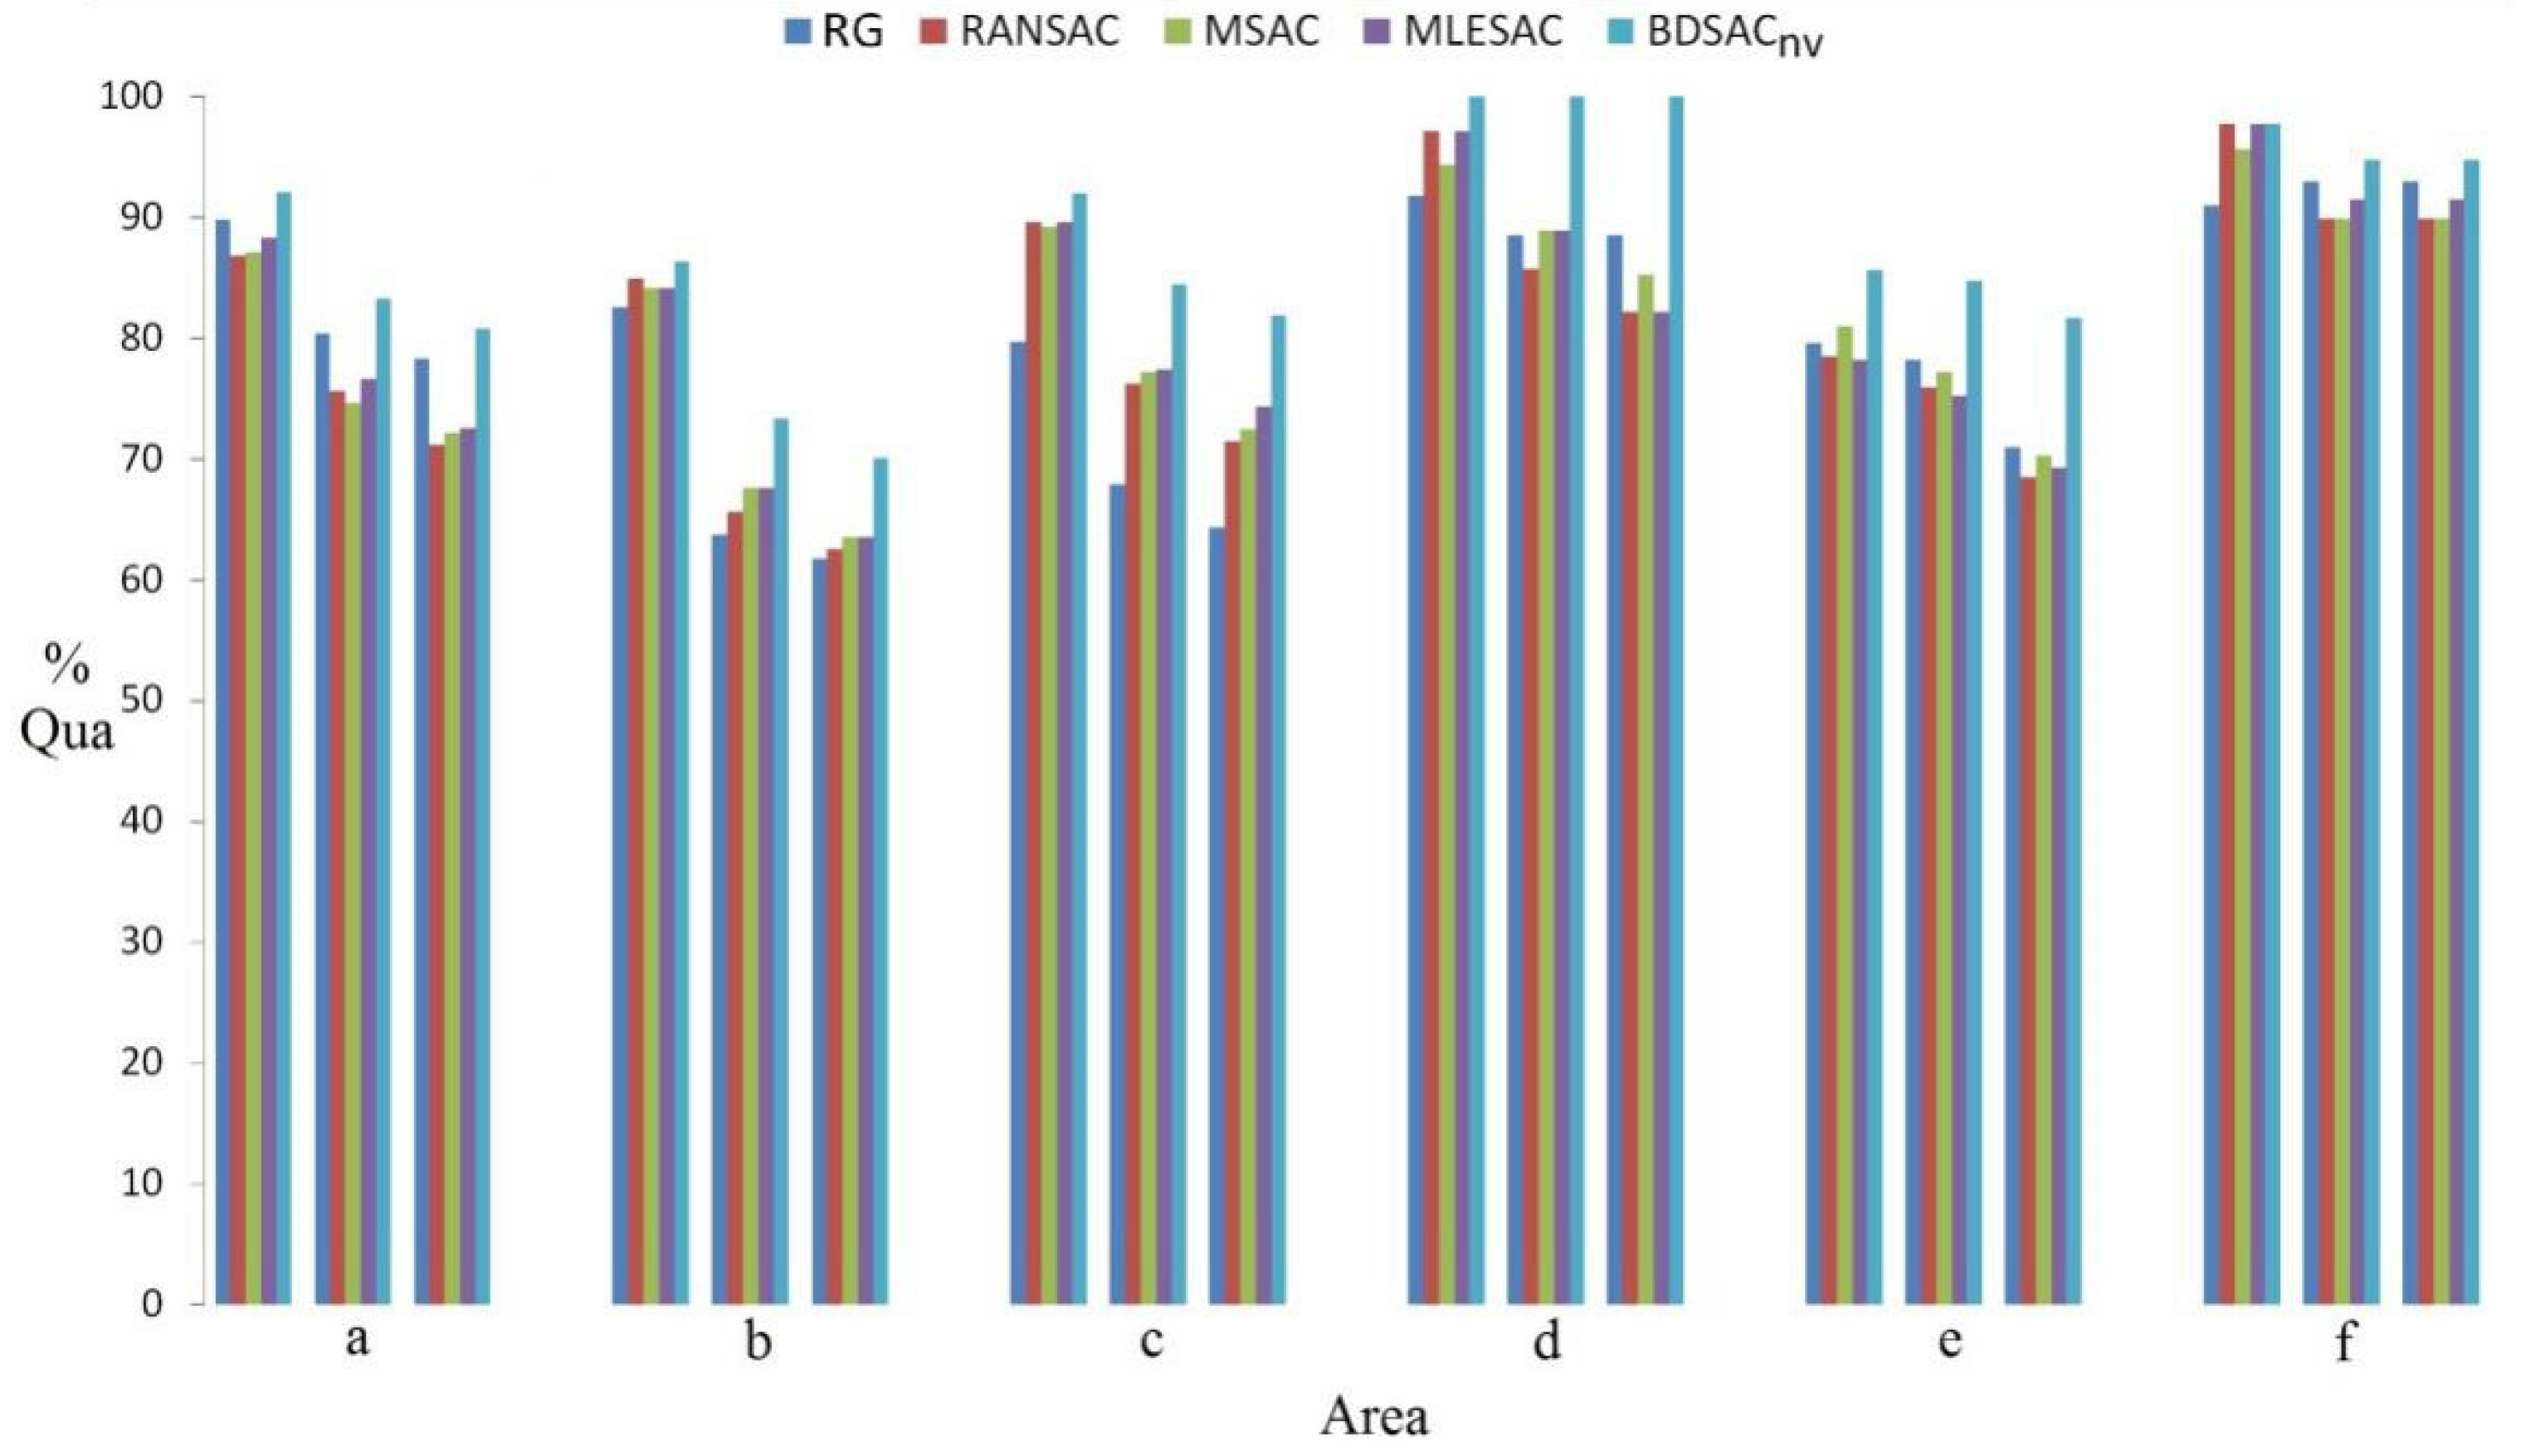
The quantitative results of the Vaihingen data are shown in Figure 11. It can be seen that our BDSACnv method generates significant improvements compared to the traditional methods RANSAC and MSAC. Higher scores are achieved by our methods when using either the segmentation-based metrics or the two ridge-based metrics. The improvements of MSAC and MLESAC to RANSAC are not evident in the test data, and many spurious planes are still detected. It should be noted that some error-prone regions are also difficult for the RG method because regions with small angular or height differences often have very smooth transitions (e.g., B and E). Besides, the RG methods seem to be unstable in a few regions, such as the over-segmentation that unexpectedly occurs in F (see Appendix I).
Figure 10. Segmentation of Vaihingen data. (af) are six selected areas from the data. (top: image, bottom: results of BDSACnv).
Remotesensing 08 00005 g010aRemotesensing 08 00005 g010b
Figure 11. Quantitative results of the Vaihingen data. (af) are the six areas selected in Figure 10. Three metrics are used, from left to right: quality of segmentation and quality of two ridge based metrics.
Remotesensing 08 00005 g011

4.3.3. Wuhan University (China)

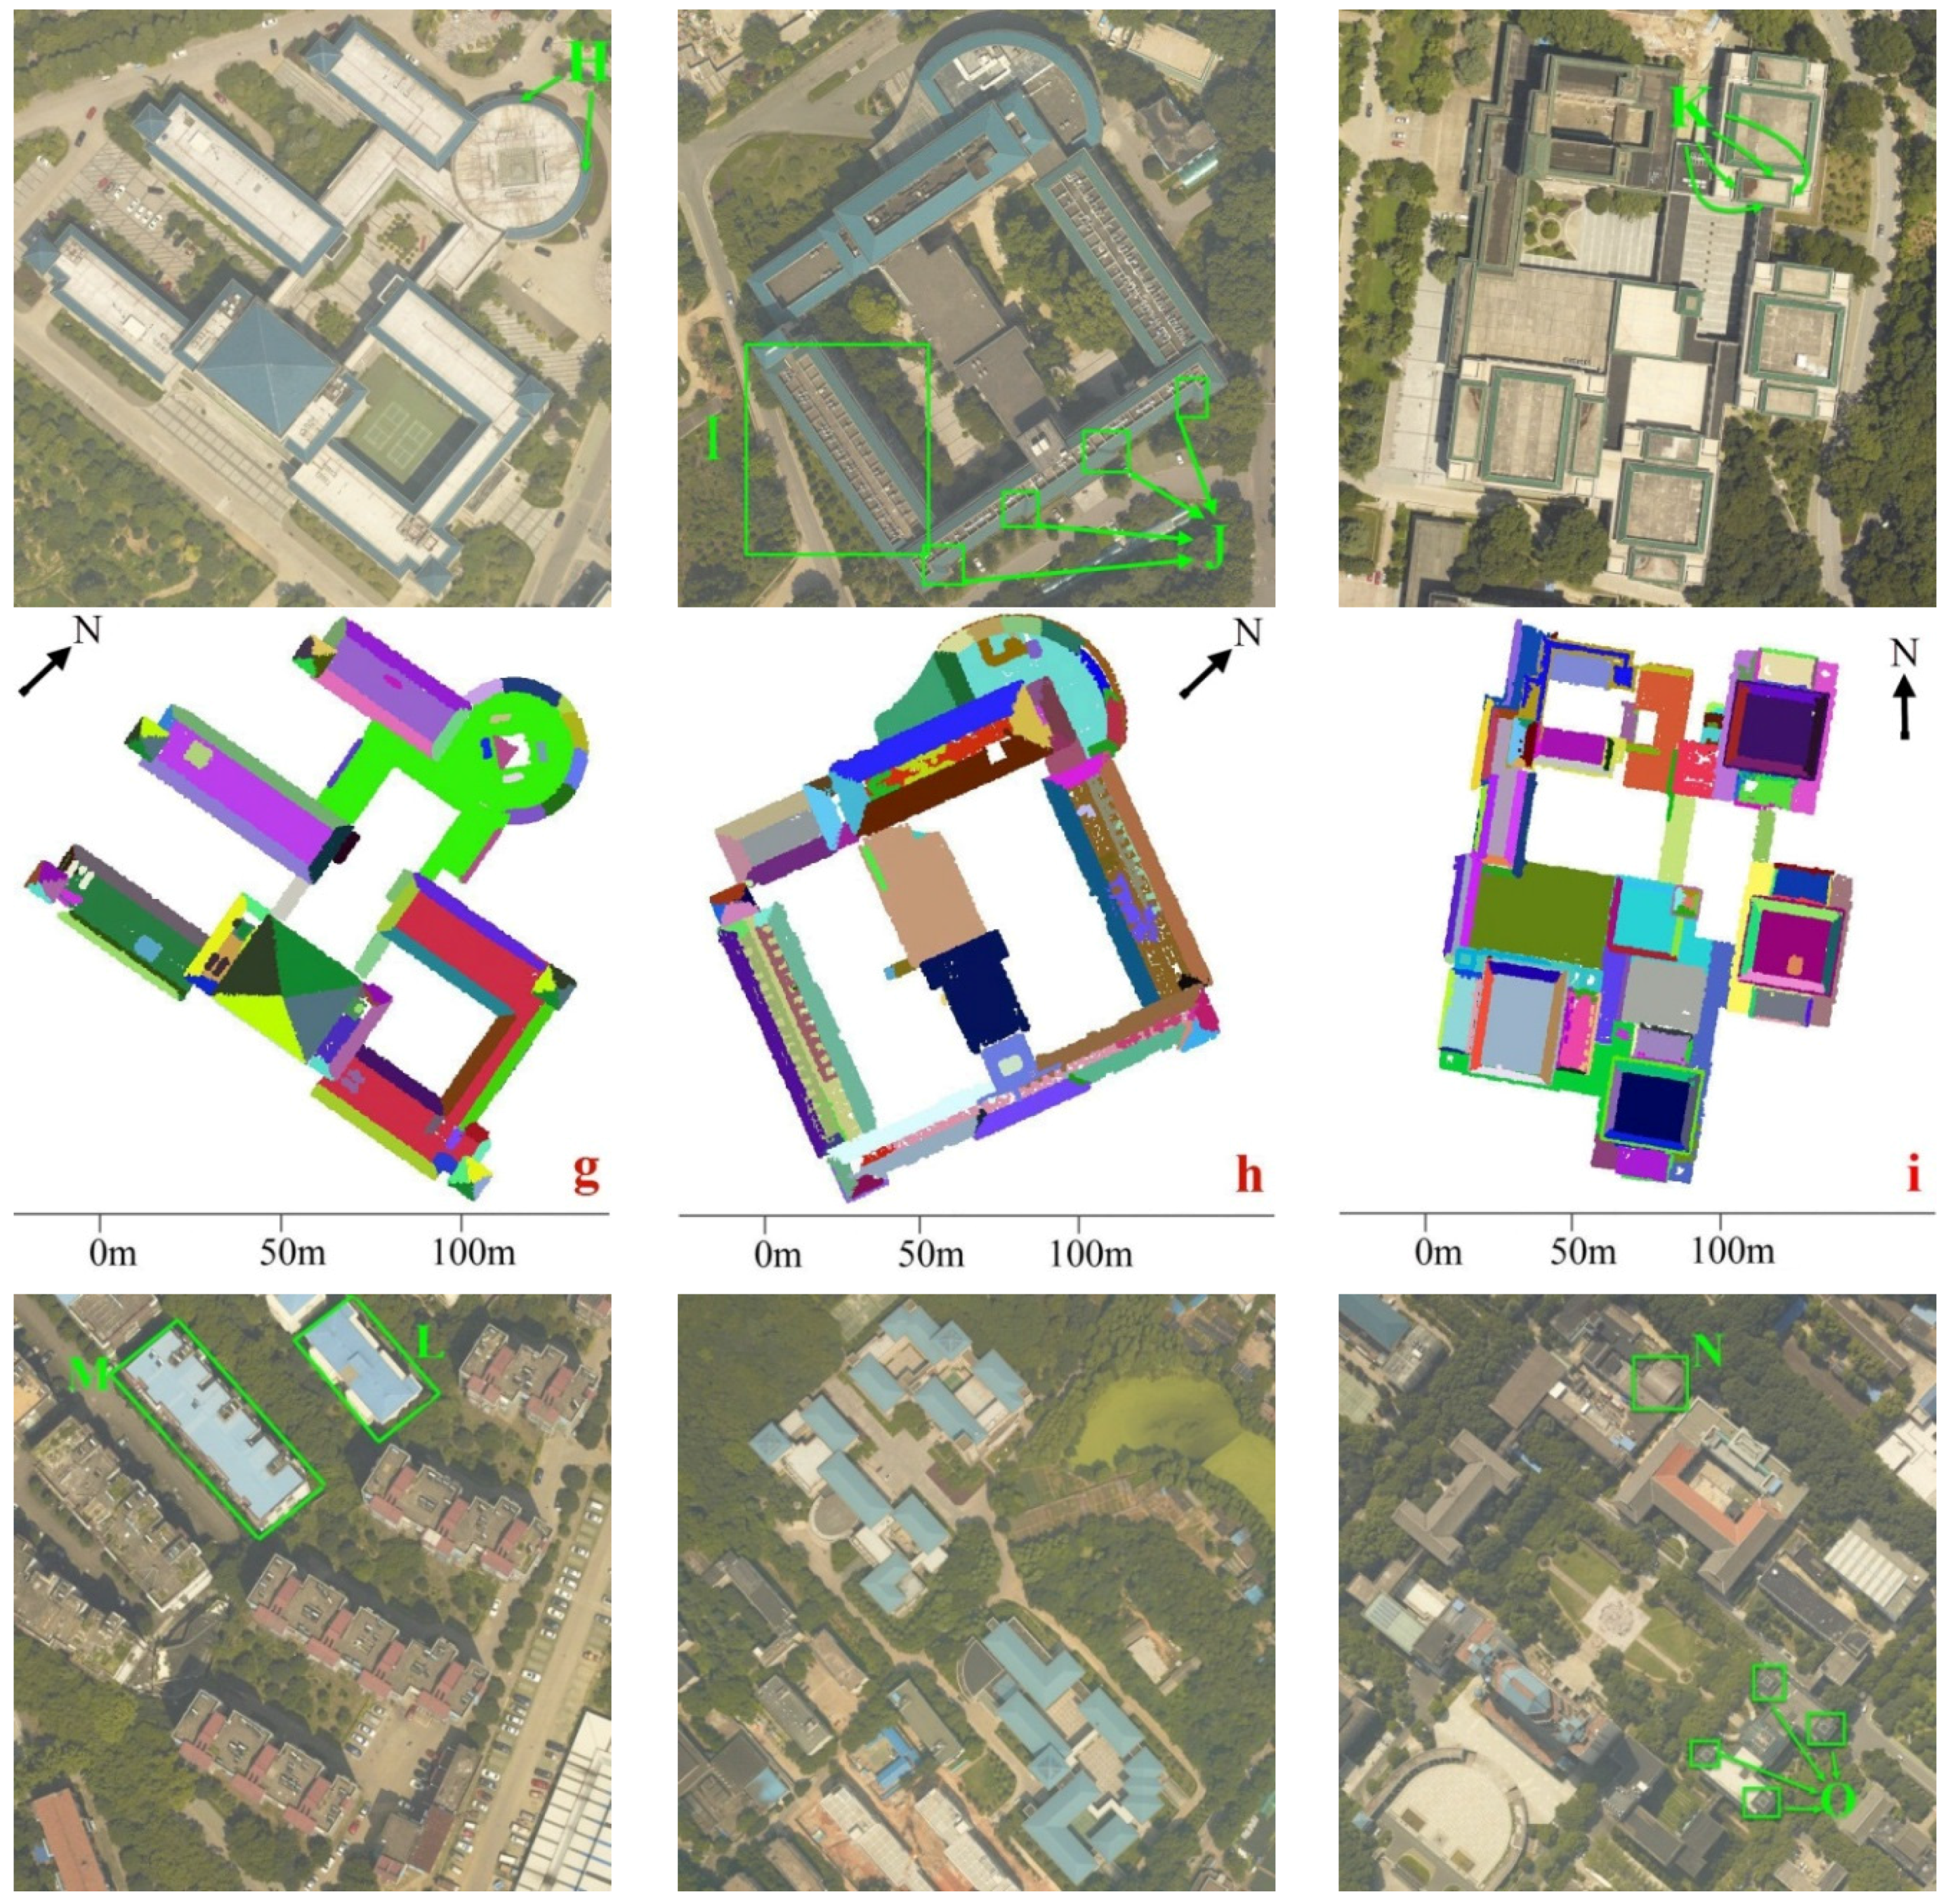
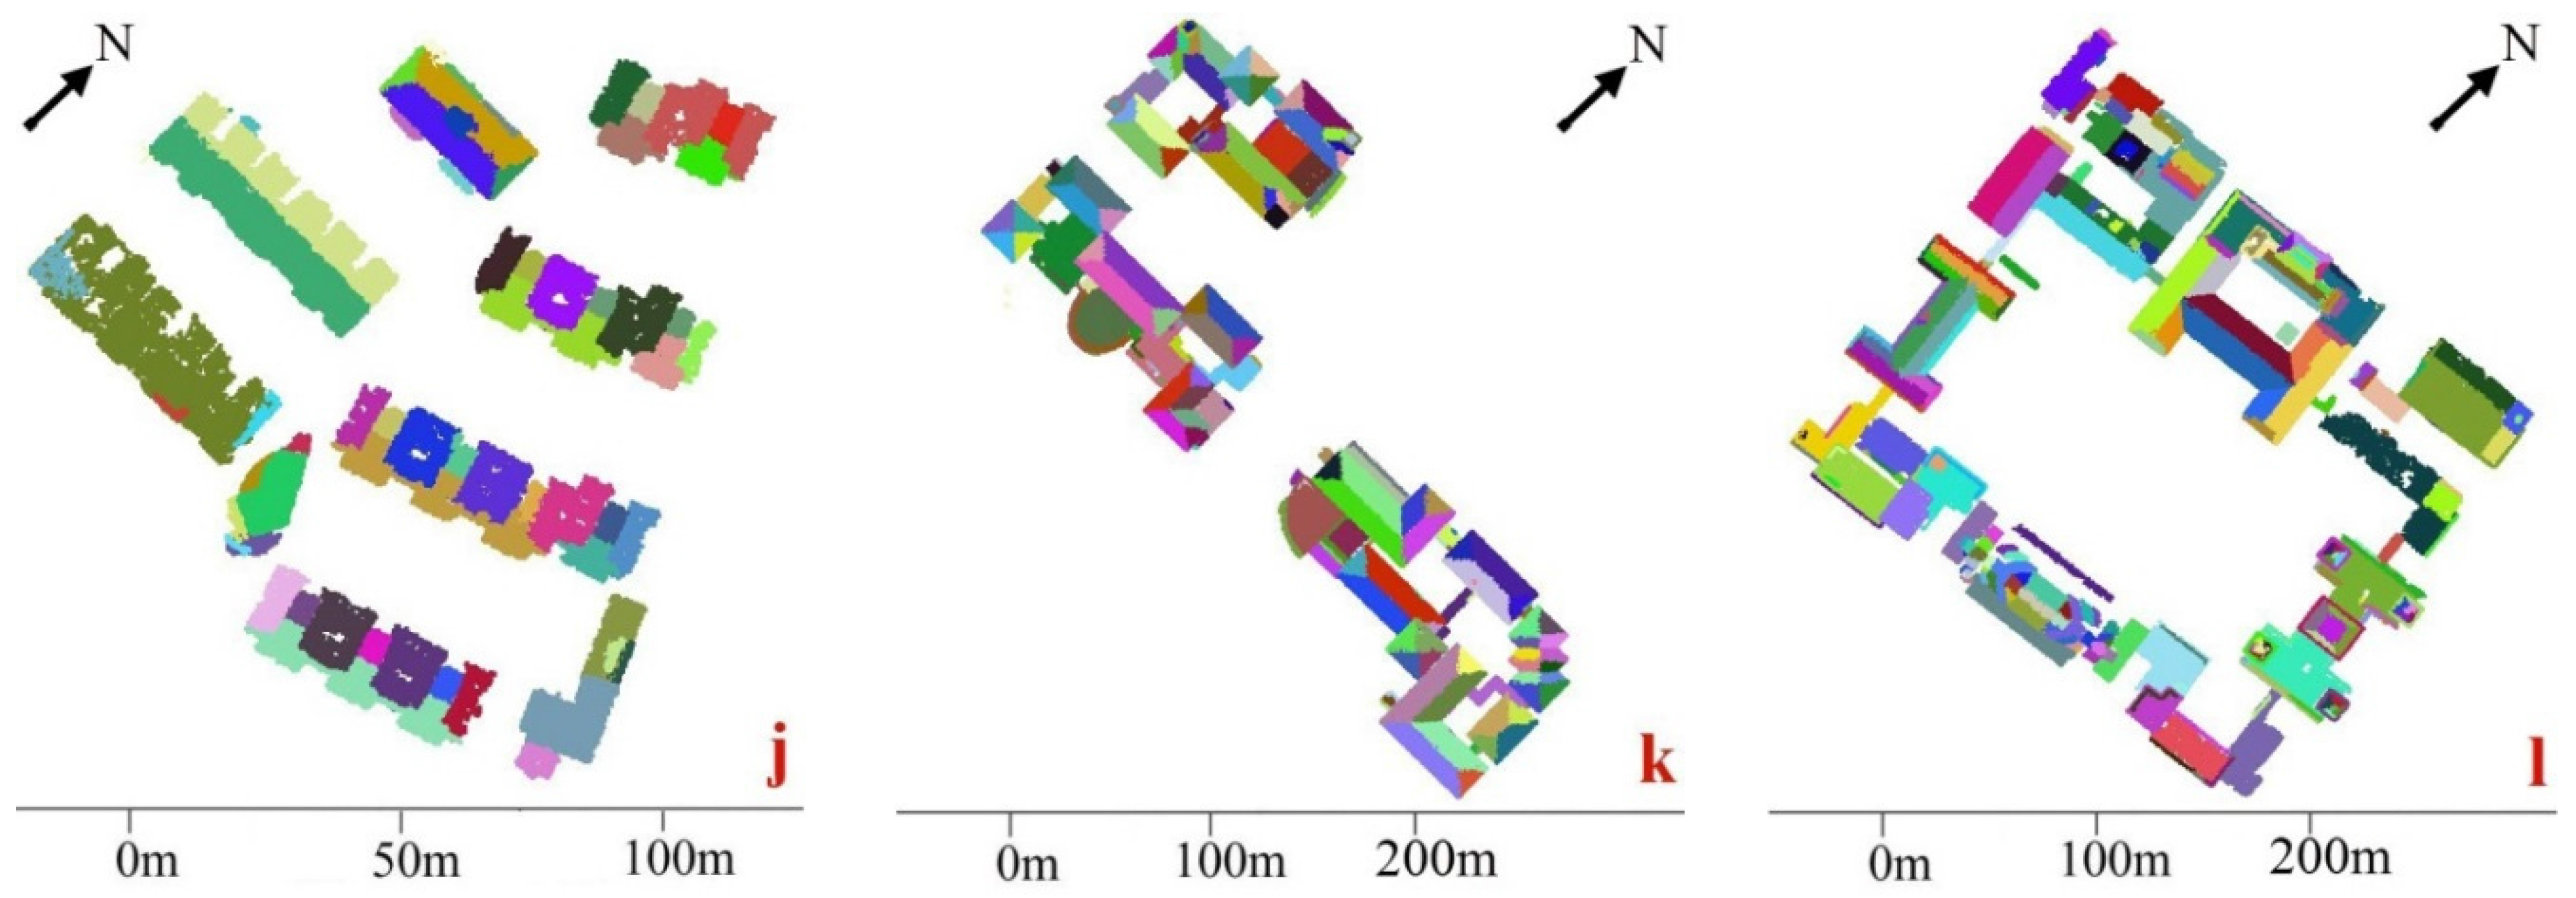
The segmentation results of the Wuhan University data are illustrated in Figure 12. Some error-prone regions are designated. For L and M, spurious planes that overlap multiple roof planes can be produced. For J and O, the small roof planes or short roof ridges may be lost because of small point counts and the competition of roof points from large neighbor planes. In areas (g)–(l), there are many roof details (e.g., Figure 10e), including small windows, eaves, and even guard bars made of glazed tiles, which greatly increase the segmentation difficulties and ultimately results in small plane pieces and short false ridges. In K, a horizontal plane is produced passing through the four planes because the normal errors are not considered in the weight functions. The weighted methods demonstrate great robustness under those situations and therefore significantly improve the segmentation results. Our methods also encounter problems which are unable to resolve. For example, since our weighted methods are not yet adaptable to a curved surface, they divide H and N into several broken pieces. In addition, the RG-based methods fail in I because the points from the upper structure divide the bottom plane into many pieces. The segmentation results for I, K, L and M using different methods are also shown in Appendix I.
Figure 12. Segmentation results of Wuhan University data. (gl) are six selected areas from the data. (top: image, bottom: results of BDSACnv).
Remotesensing 08 00005 g012aRemotesensing 08 00005 g012b
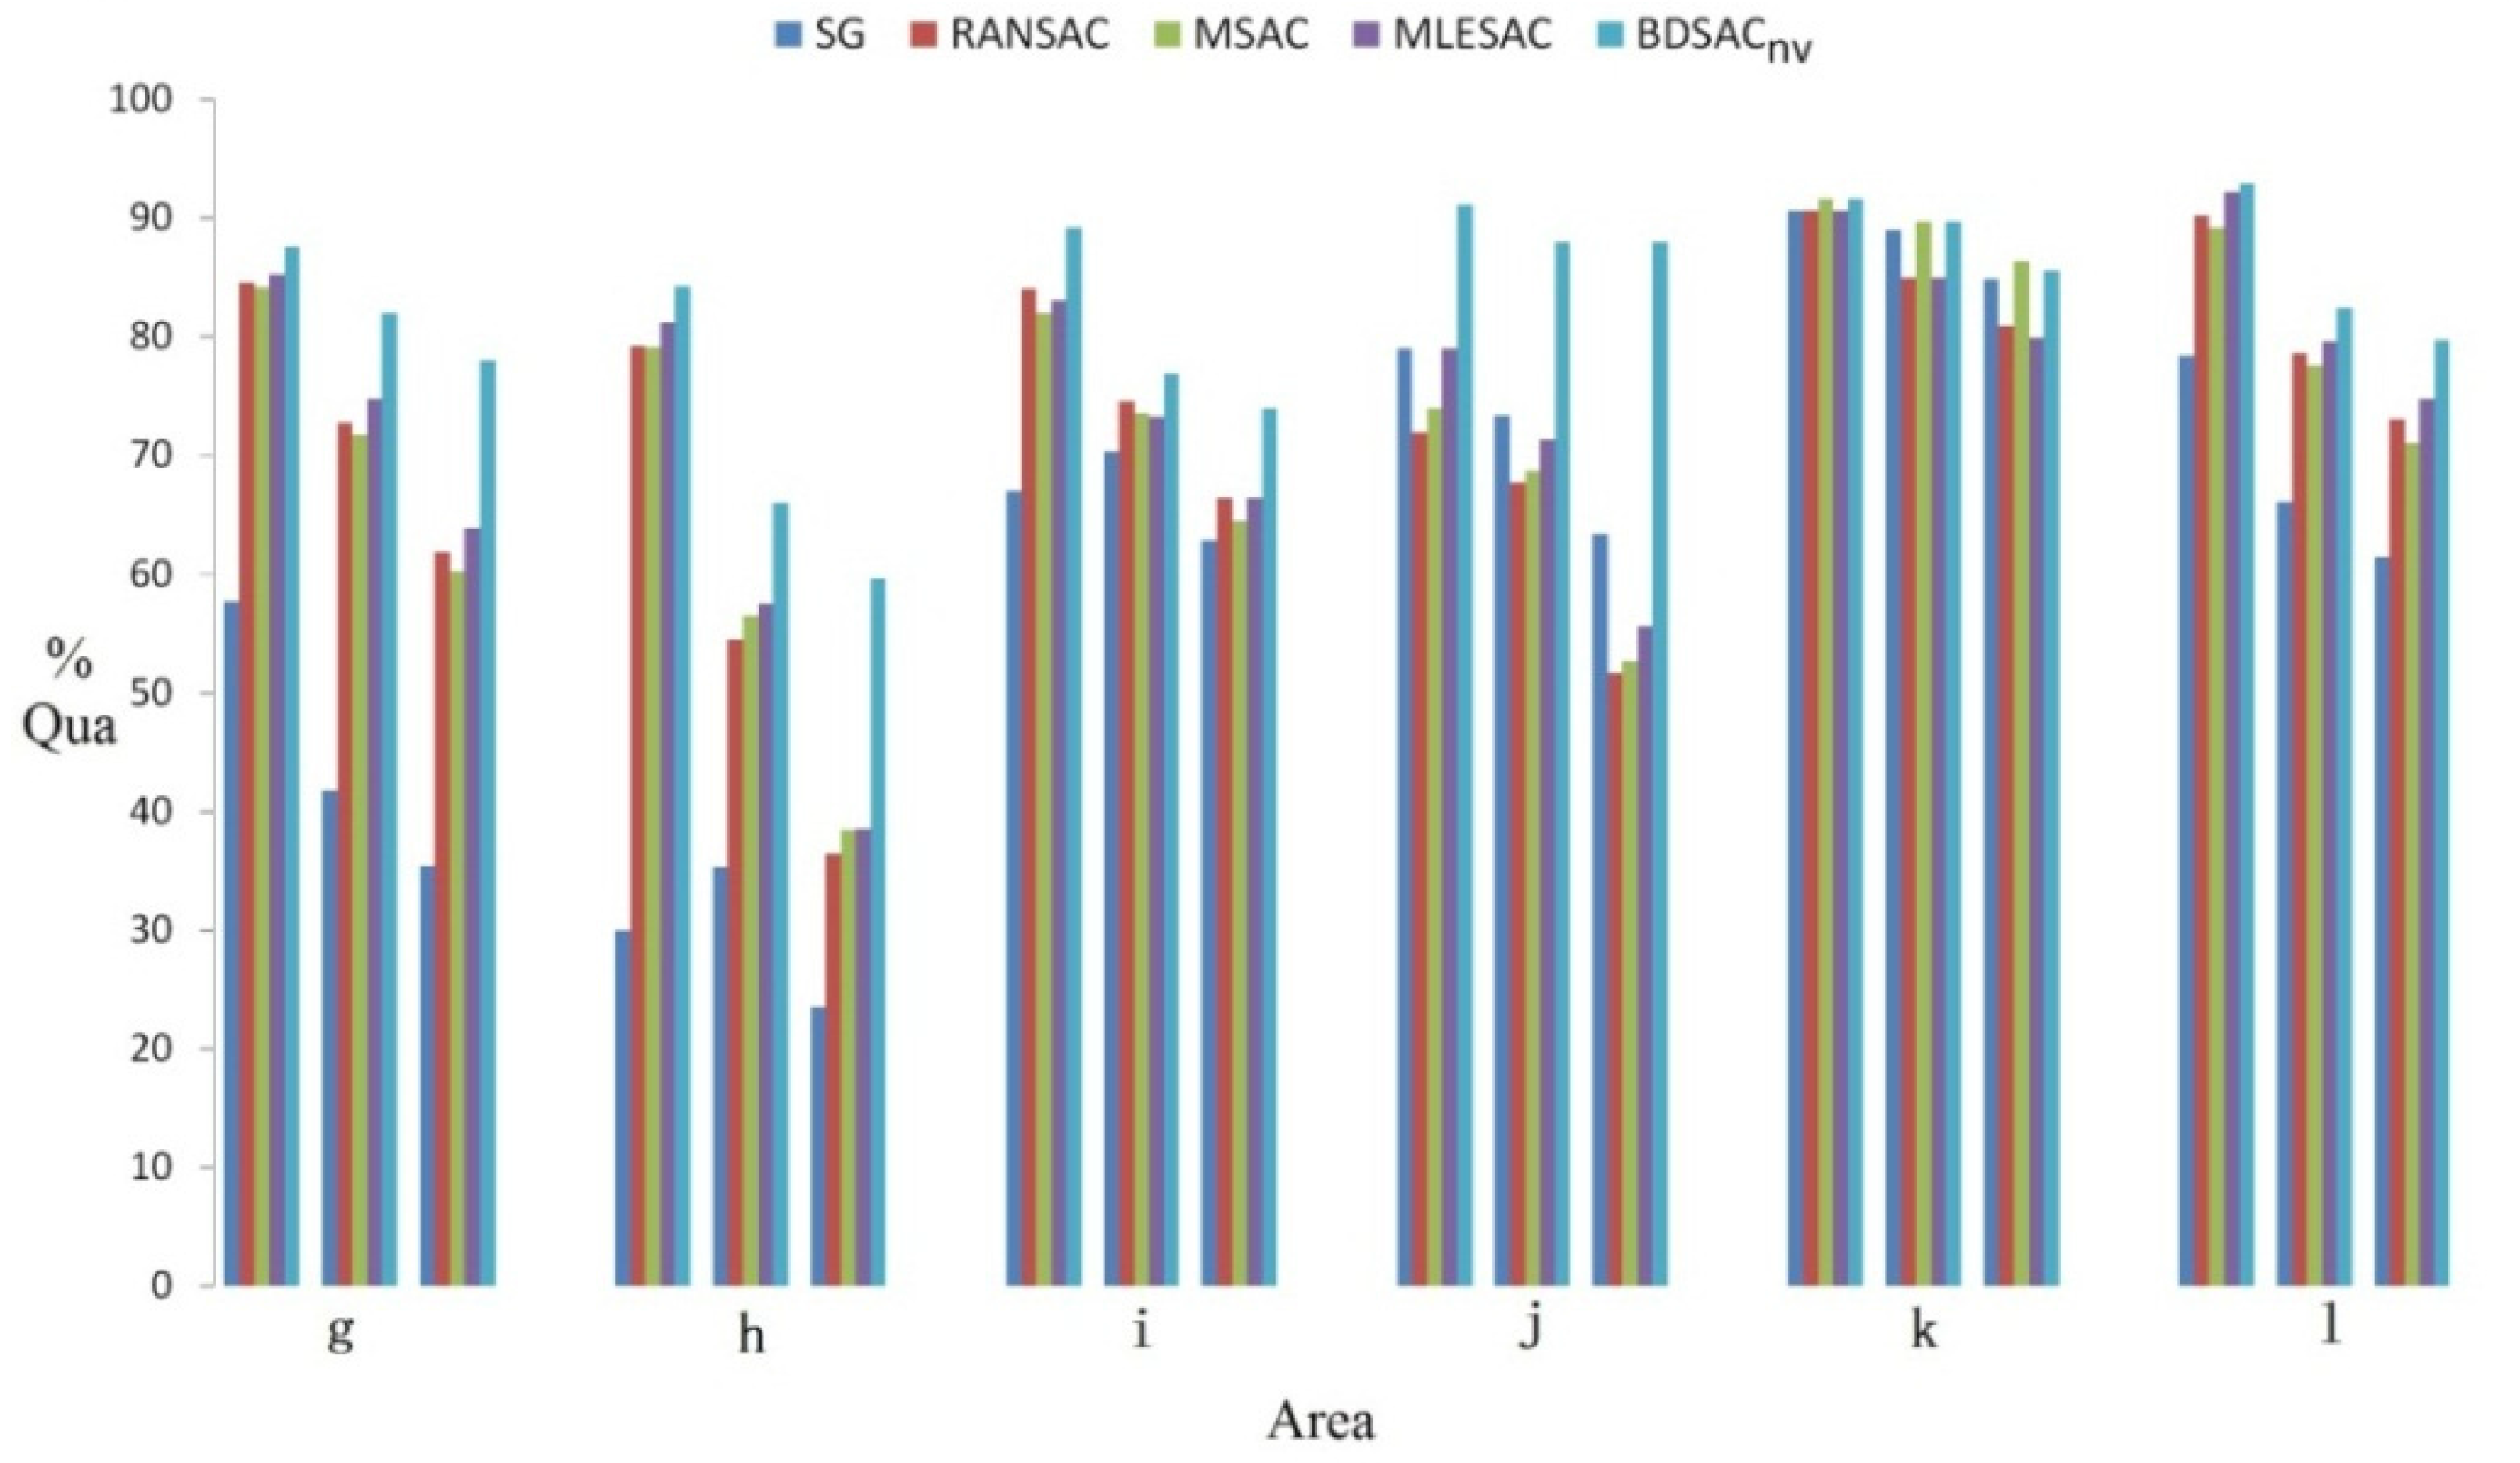
The quantitative results of the Wuhan University data are illustrated in Figure 13. Similar to Figure 11, our method makes significant improvements compared to the other weighted methods. For areas (g) and (h), the RG method’s performance is unsatisfactory because many broken fragments exist. For I in area (h) especially, the bottom planes become numerous broken fragments. The RANSAC-based method can be more robust in those situations. Since the RG method considers the roof slope, it can distinguish very small angular differences, which makes it better than the original RANSAC method results in L and M; and over-segmentation also occurred using RG in L and M. A detailed comparison is available in Appendix I.
Figure 13. Quantitative results of the Wuhan University data. (gl) are the six areas selected in Figure 12. Three metrics are used, from left to right: quality of segmentation and quality of two ridge based metrics.
Remotesensing 08 00005 g013
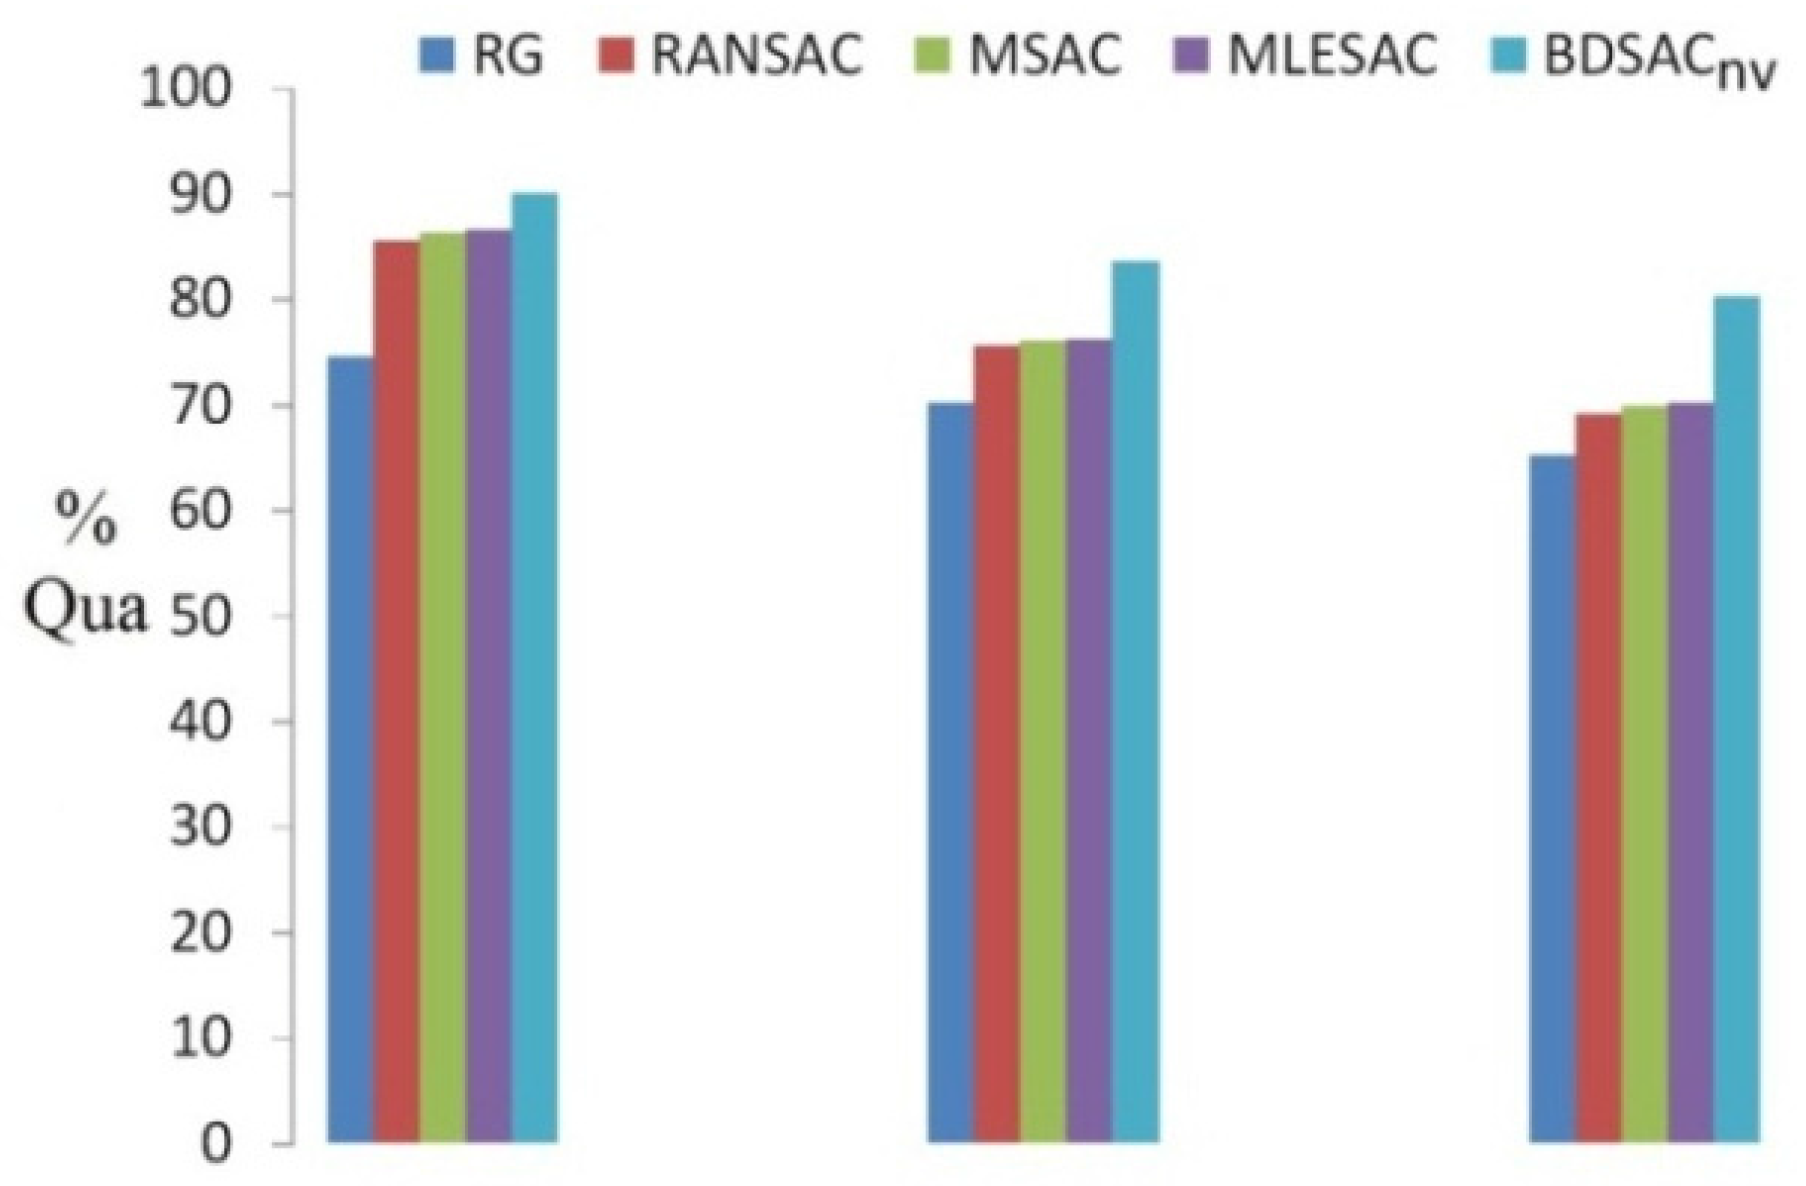
The overall quantitative results are shown in Figure 14, which includes the results of Figure 8, Figure 10 and Figure 12. It can be seen that, while the improvements were not very obvious, the results of MSAC and MLESAC are slightly better than that of RANSAC. Our BDSACnv generate significant improvements compared to both classical RANSAC and the existing weighted methods. Compared to RANSAC, BDSACnv improves the overall segmentation quality from 85.7% to 90.1%, as well as the two ridge-based metrics from 75.9% to 83.6% and 68.9% to 80.2%. The quality of the RG method is lower than the RANSAC-based methods, mainly due to their instability in areas (c), (g) and (h).
Figure 14. Integral quantitative results. Three metrics are used, from left to right: quality of segmentation and quality of two ridge based metrics.
Remotesensing 08 00005 g014

5. Conclusions

A new weighted RANSAC algorithm for roof point cloud segmentation is introduced in this paper, in which the hard threshold voting function considering both the point-plane distance and the normal vector consistence is transformed into a soft threshold voting function based on two weight functions. Our method utilizes a new strategy to design the ideal weight functions based on the error distribution between the proper and improper hypotheses. Several different weight functions are defined using this strategy, and an outlier suppression ratio is put forward to compare the performance of different weight functions. Preliminary experiments comparing the suppression ratios of different weight functions demonstrated that the BDSACnv method is able to effectively suppress the outliers from spurious planes. As a result, we chose BDSACnv for the further experiments and compare its performance with other existing segmentation methods, including original RANSAC, MSAC, MLESAC, and a representative RG method. A set of local data with error-prone regions and two large area datasets of varying densities are used to evaluate the performance of the different methods. The quantitative results of both the segmentation-based metrics and the ridge-based metrics indicated that the different weighted methods improve the segmentation quality differently, but BDSACnv significantly improve the segmentation accuracy and topology correctness. When compared with RANSAC, BDSACnv improved the overall segmentation quality from 85.7% to 90.1%; and the two ridge-based metrics also improved from 75.9% to 83.6% and 68.9% to 80.2%. Moreover, the robustness of BDSACnv is better compared to the RG method. As a result, we believe there is potential for the wide adoption of BDSACnv as an upgrade to or replacement of classical RANSAC in roof plane segmentation.
However, our method has several limitations. First, although the weighted RANSAC approach is robust to parameters, a small amount of post-processing is still needed to avoid false segmentation or artifacts (see Section 4.1). Second, the weight definition of our method requires a robust estimate of point surface normal, which can be problematic for small buildings or when the point density is low with regard to the roof dimensions. Third, the issue of spurious planes is efficiently suppressed by our method but not completely solved; therefore, spurious planes still may occur in extreme conditions (i.e., Figure 8g).
There are also some possible improvement directions for future work. The number of iterations for RANSAC increases rapidly when the inlier ratio decreases, thus a combination of cluster and fitting to decompose the input data step by step could greatly improve the algorithm’s efficiency and robustness. Meanwhile, RANSAC is a one-at-a-time process so adopting the competition approach among neighbor planes could improve the accuracy of segmentation. Finally, only the segmentation of roof planes was considered in this paper, but applying the weighted methods to other roof shapes is possible as the methods mainly are concerned with the procedure of hypothesis verification and do not change the generation of the hypothesis.

Acknowledgments

This work was partially supported by the National Basic Research Program of China under Grant 2012CB719904 as well as the science and technology plan of the Sichuan Bureau of Surveying, Mapping and Geoinformation under Grant of J2014ZC02. The Vaihingen dataset was provided by the German Society for Photogrammetry, Remote Sensing, and Geoinformation (DGPF) [Cramer, 2010]: http://www.ifp.uni-stuttgart.de/dgpf/DKEP-Allg.html. The segmentation results by the RG-based method were provided by Biao Xiong.

Author Contributions

Bo Xu, Wanshou Jiang and Jie Shan contributed to the study design and manuscript writing. Bo Xu and Wanshou Jiang conceived and designed the experiments; Bo Xu performed the experiments; Jing Zhang and Lelin Li contributed to the initial data, the analysis tools and partial codes of the algorithm.

Conflicts of Interest

The authors declare no conflict of interest.

Appendix I

Appendix I Results compare for some regions marked in Figure 10 and Figure 12.
Remotesensing 08 00005 i001

References

  1. Baltsavias, E.P. Object extraction and revision by image analysis using existing geodata and knowledge: Current status and steps towards operational systems. ISPRS J. Photogramm. Remote Sens. 2004, 58, 129–151. [Google Scholar] [CrossRef]
  2. Haala, N.; Kada, M. An update on automatic 3D building reconstruction. ISPRS J. Photogramm. Remote Sens. 2010, 65, 570–580. [Google Scholar] [CrossRef]
  3. Rottensteiner, F.; Sohn, G.; Gerke, M.; Wegner, J.D.; Breitkopf, U.; Jung, J. Results of the ISPRS benchmark on urban object detection and 3D building reconstruction. ISPRS J. Photogramm. Remote Sens. 2014, 93, 256–271. [Google Scholar] [CrossRef]
  4. Chen, D.; Zhang, L.Q.; Li, J.; Liu, R. Urban building roof segmentation from airborne Lidar point clouds. Int. J. Remote Sens. 2012, 33, 6497–6515. [Google Scholar] [CrossRef]
  5. Tarsha-Kurdi, F.; Landes, T.; Grussenmeyer, P.; Koehl, M. Model-driven and data-driven approaches using Lidar data analysis and comparison. In Proceedings of the ISPRS, Workshop, Photogrammetric Image Analysis (PIA07), Munich, Germany, 19–21 September 2007.
  6. Sampath, A.; Shan, J. Segmentation and reconstruction of polyhedral building roofs from aerial Lidar point clouds. IEEE Trans. Geosci. Remote Sens. 2010, 48, 1554–1567. [Google Scholar] [CrossRef]
  7. Awwad, T.M.; Zhu, Q.; Du, Z.; Zhang, Y. An improved segmentation approach for planar surfaces from unconstructed 3D point clouds. Photogramm. Rec. 2010, 25, 5–23. [Google Scholar] [CrossRef]
  8. Fan, T.J.; Medioni, G.; Nevatia, R. Segmented descriptions of 3-D surfaces. IEEE Trans. Rob. Autom. 1987, 3, 527–538. [Google Scholar]
  9. Alharthy, A.; Bethel, J. Detailed building reconstruction from airborne laser data using a moving surface method. Int. Arch. Photogramm. Remote Sens. 2004, 35, 213–218. [Google Scholar]
  10. You, R.J.; Lin, B.C. Building feature extraction from airborne Lidar data based on tensor voting algorithm. Photogramm. Eng. Remote Sens. 2011, 77, 1221–1231. [Google Scholar] [CrossRef]
  11. Vosselman, G. Automated planimetric quality control in high accuracy airborne laser scanning surveys. ISPRS J. Photogramm. Remote Sens. 2012, 74, 90–100. [Google Scholar] [CrossRef]
  12. Lagüela, S.; Díaz-Vilariño, L.; Armesto, J.; Arias, P. Non-destructive approach for the generation and thermal characterization of an as-built BIM. Constr. Build. Mater. 2014, 51, 55–61. [Google Scholar] [CrossRef]
  13. Hoffman, R.; Jain, A.K. Segmentation and classification of range images. IEEE Trans. Pattern Anal. Mach. Intell. 1987, 9, 608–620. [Google Scholar] [CrossRef] [PubMed]
  14. Filin, S. Surface clustering from airborne laser scanning data. Int. Arch. Photogramm. Remote Sens. 2002, 34, 119–124. [Google Scholar]
  15. Filin, S.; Pfeifer, N. Segmentation of airborne laser scanning data using a slope adaptive neighborhood. ISPRS J. Photogramm. Remote Sens. 2006, 60, 71–80. [Google Scholar] [CrossRef]
  16. Biosca, J.M.; Lerma, J.L. Unsupervised robust planar segmentation of terrestrial laser scanner point clouds based on fuzzy clustering methods. ISPRS J. Photogramm. Remote Sens. 2008, 63, 84–98. [Google Scholar] [CrossRef]
  17. Dorninger, P.; Pfeifer, N. A comprehensive automated 3D approach for building extraction, reconstruction, and regularization from airborne laser scanning point clouds. Sensors 2008, 8, 7323–7343. [Google Scholar] [CrossRef]
  18. Awrangjeb, M.; Fraser, C.S. Automatic segmentation of raw Lidar data for extraction of building roofs. Remote Sens. 2014, 6, 3716–3751. [Google Scholar] [CrossRef]
  19. Fischler, M.A.; Bolles, R.C. Random sample consensus—A paradigm for model-fitting with applications to image-analysis and automated cartography. Commun. ACM 1981, 24, 381–395. [Google Scholar] [CrossRef]
  20. Schnabel, R.; Wahl, R.; Klein, R. Efficient RANSAC for point-cloud shape detection. Comput. Graph. Forum 2007, 26, 214–226. [Google Scholar] [CrossRef]
  21. Choi, S.; Kim, T.; Yu, W. Performance evaluation of RANSAC family. In Proceedings of the British Machine Vision Conference, London, UK, 7–10 September 2009.
  22. Frahm, J.-M.; Pollefeys, M. RANSAC for (Quasi-) degenerate data (QDEGSAC). In Proceedings of the IEEE Computer Society Conference on Computer Vision and Pattern Recognition, New York, NY, USA, 17–22 June 2006.
  23. Chum, O.R.; Matas, J.R.I. Matching with PROSAC-progressive sampling consensus. In Proceedings of the IEEE Computer Society Conference on Computer Vision and Pattern Recognition, Miami, FL, USA, 20–25 June 2005.
  24. Chum, O.; Matas, J. Optimal randomized RANSAC. IEEE Trans. Pattern Anal. Mach. Intell. 2008, 30, 1472–1482. [Google Scholar] [CrossRef] [PubMed]
  25. Berkhin, P. A Survey of Clustering Data Mining Techniques; Springer Berlin Heidelberg: New York, NY, USA, 2006. [Google Scholar]
  26. Gallo, O.; Manduchi, R.; Rafii, A. CC-RANSAC: Fitting planes in the presence of multiple surfaces in range data. Pattern Recognit. Lett. 2011, 32, 403–410. [Google Scholar] [CrossRef]
  27. Yan, J.X.; Shan, J.; Jiang, W.S. A global optimization approach to roof segmentation from airborne Lidar point clouds. ISPRS J. Photogramm. Remote Sens. 2014, 94, 183–193. [Google Scholar] [CrossRef]
  28. Xiong, B.; Elberink, S.O.; Vosselman, G. A graph edit dictionary for correcting errors in roof topology graphs reconstructed from point clouds. ISPRS J. Photogramm. Remote Sens. 2014, 93, 227–242. [Google Scholar] [CrossRef]
  29. Elberink, S.O.; Vosselman, G. Building reconstruction by target based graph matching on incomplete laser data: Analysis and limitations. Sensors 2009, 9, 6101–6118. [Google Scholar] [CrossRef] [PubMed]
  30. Hesami, R.; BabHadiashar, A.; HosseinNezhad, R. Range segmentation of large building exteriors: A hierarchical robust approach. Comput. Vis. Image Underst. 2010, 114, 475–490. [Google Scholar] [CrossRef]
  31. Torr, P.H.S.; Zisserman, A. Mlesac: A new robust estimator with application to estimating image geometry. Comput. Vis. Image Underst. 2000, 78, 138–156. [Google Scholar] [CrossRef]
  32. Bretar, F.; Roux, M. Hybrid image segmentation using Lidar 3D planar primitives. In Proceedings of the ISPRS Workshop Laser Scanning, Enschede, The Netherlands, 12–14 September 2005.
  33. López-Fernández, L.; Lagüela, S.; Picón, I.; González-Aguilera, D. Large-scale automatic analysis and classification of roof surfaces for the installation of solar panels using a multi-sensor aerial platform. Remote Sens. 2015, 7, 11226–11248. [Google Scholar] [CrossRef]
  34. Wang, C.; Sha, Y. A designed beta-hairpin forming peptide undergoes a consecutive stepwise process for self-assembly into nanofibrils. Protein Pept. Lett. 2010, 17, 410–415. [Google Scholar] [CrossRef] [PubMed]
  35. Girardeau-Montaut, D. Detection de Changement sur des Données Géométriques 3D. Ph.D. Thesis, Télécom ParisTech, Paris, France, 2006. [Google Scholar]
  36. Awrangjeb, M.; Fraser, C.S. An automatic and threshold-free performance evaluation system for building extraction techniques from airborne Lidar data. IEEE J. Sel. Top. Appl. Earth Observ. Remote Sens. 2014, 7, 4184–4198. [Google Scholar] [CrossRef]
  37. Rutzinger, M.; Rottensteiner, F.; Pfeifer, N. A comparison of evaluation techniques for building extraction from airborne laser scanning. IEEE J. Sel. Top. Appl. Earth Observ. Remote Sens. 2009, 2, 11–20. [Google Scholar] [CrossRef]
  38. Perera, G.S.N.; Maas, H.G. Cycle graph analysis for 3D roof structure modeling: Concepts and performance. ISPRS J. Photogramm. Remote Sens. 2014, 93, 213–226. [Google Scholar] [CrossRef]