
Differentiating among Four Arctic Tundra Plant Communities at Ivotuk, Alaska Using Field Spectroscopy


Abstract
:
1. Introduction
2. Materials and Methods
2.1. Arctic Change
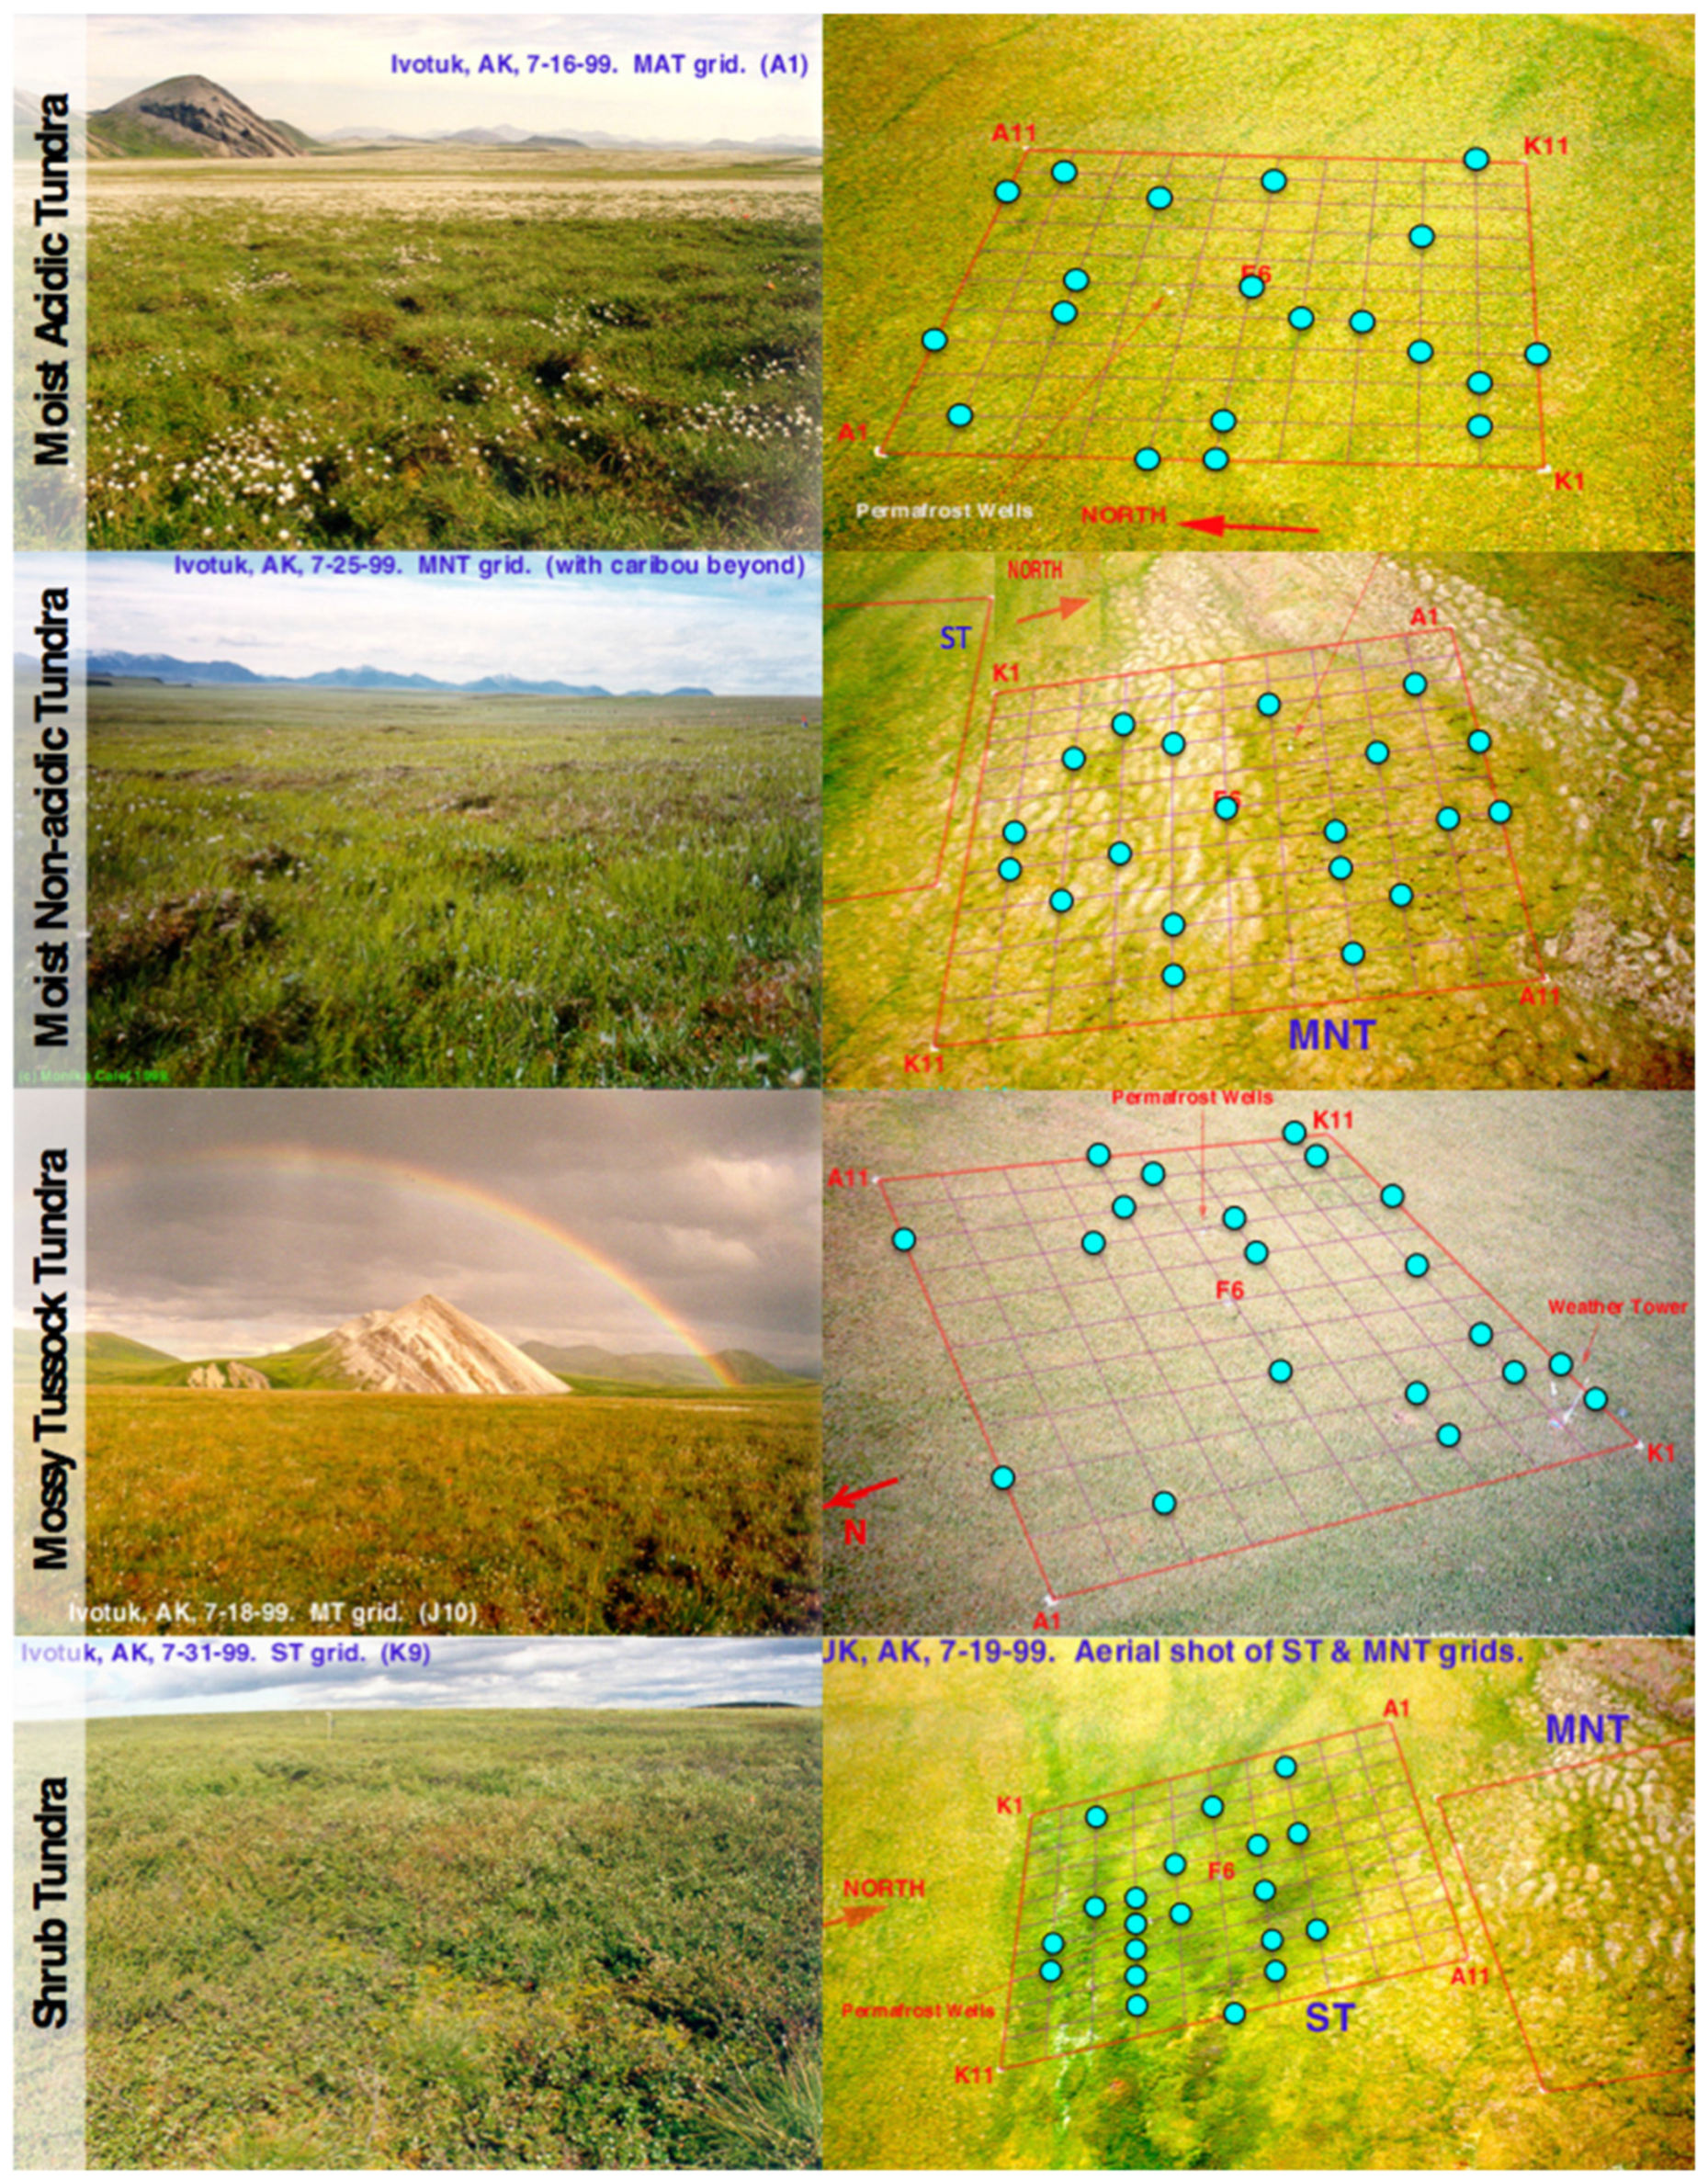
2.2. Vegetation Types throughout the North Slope of Alaska
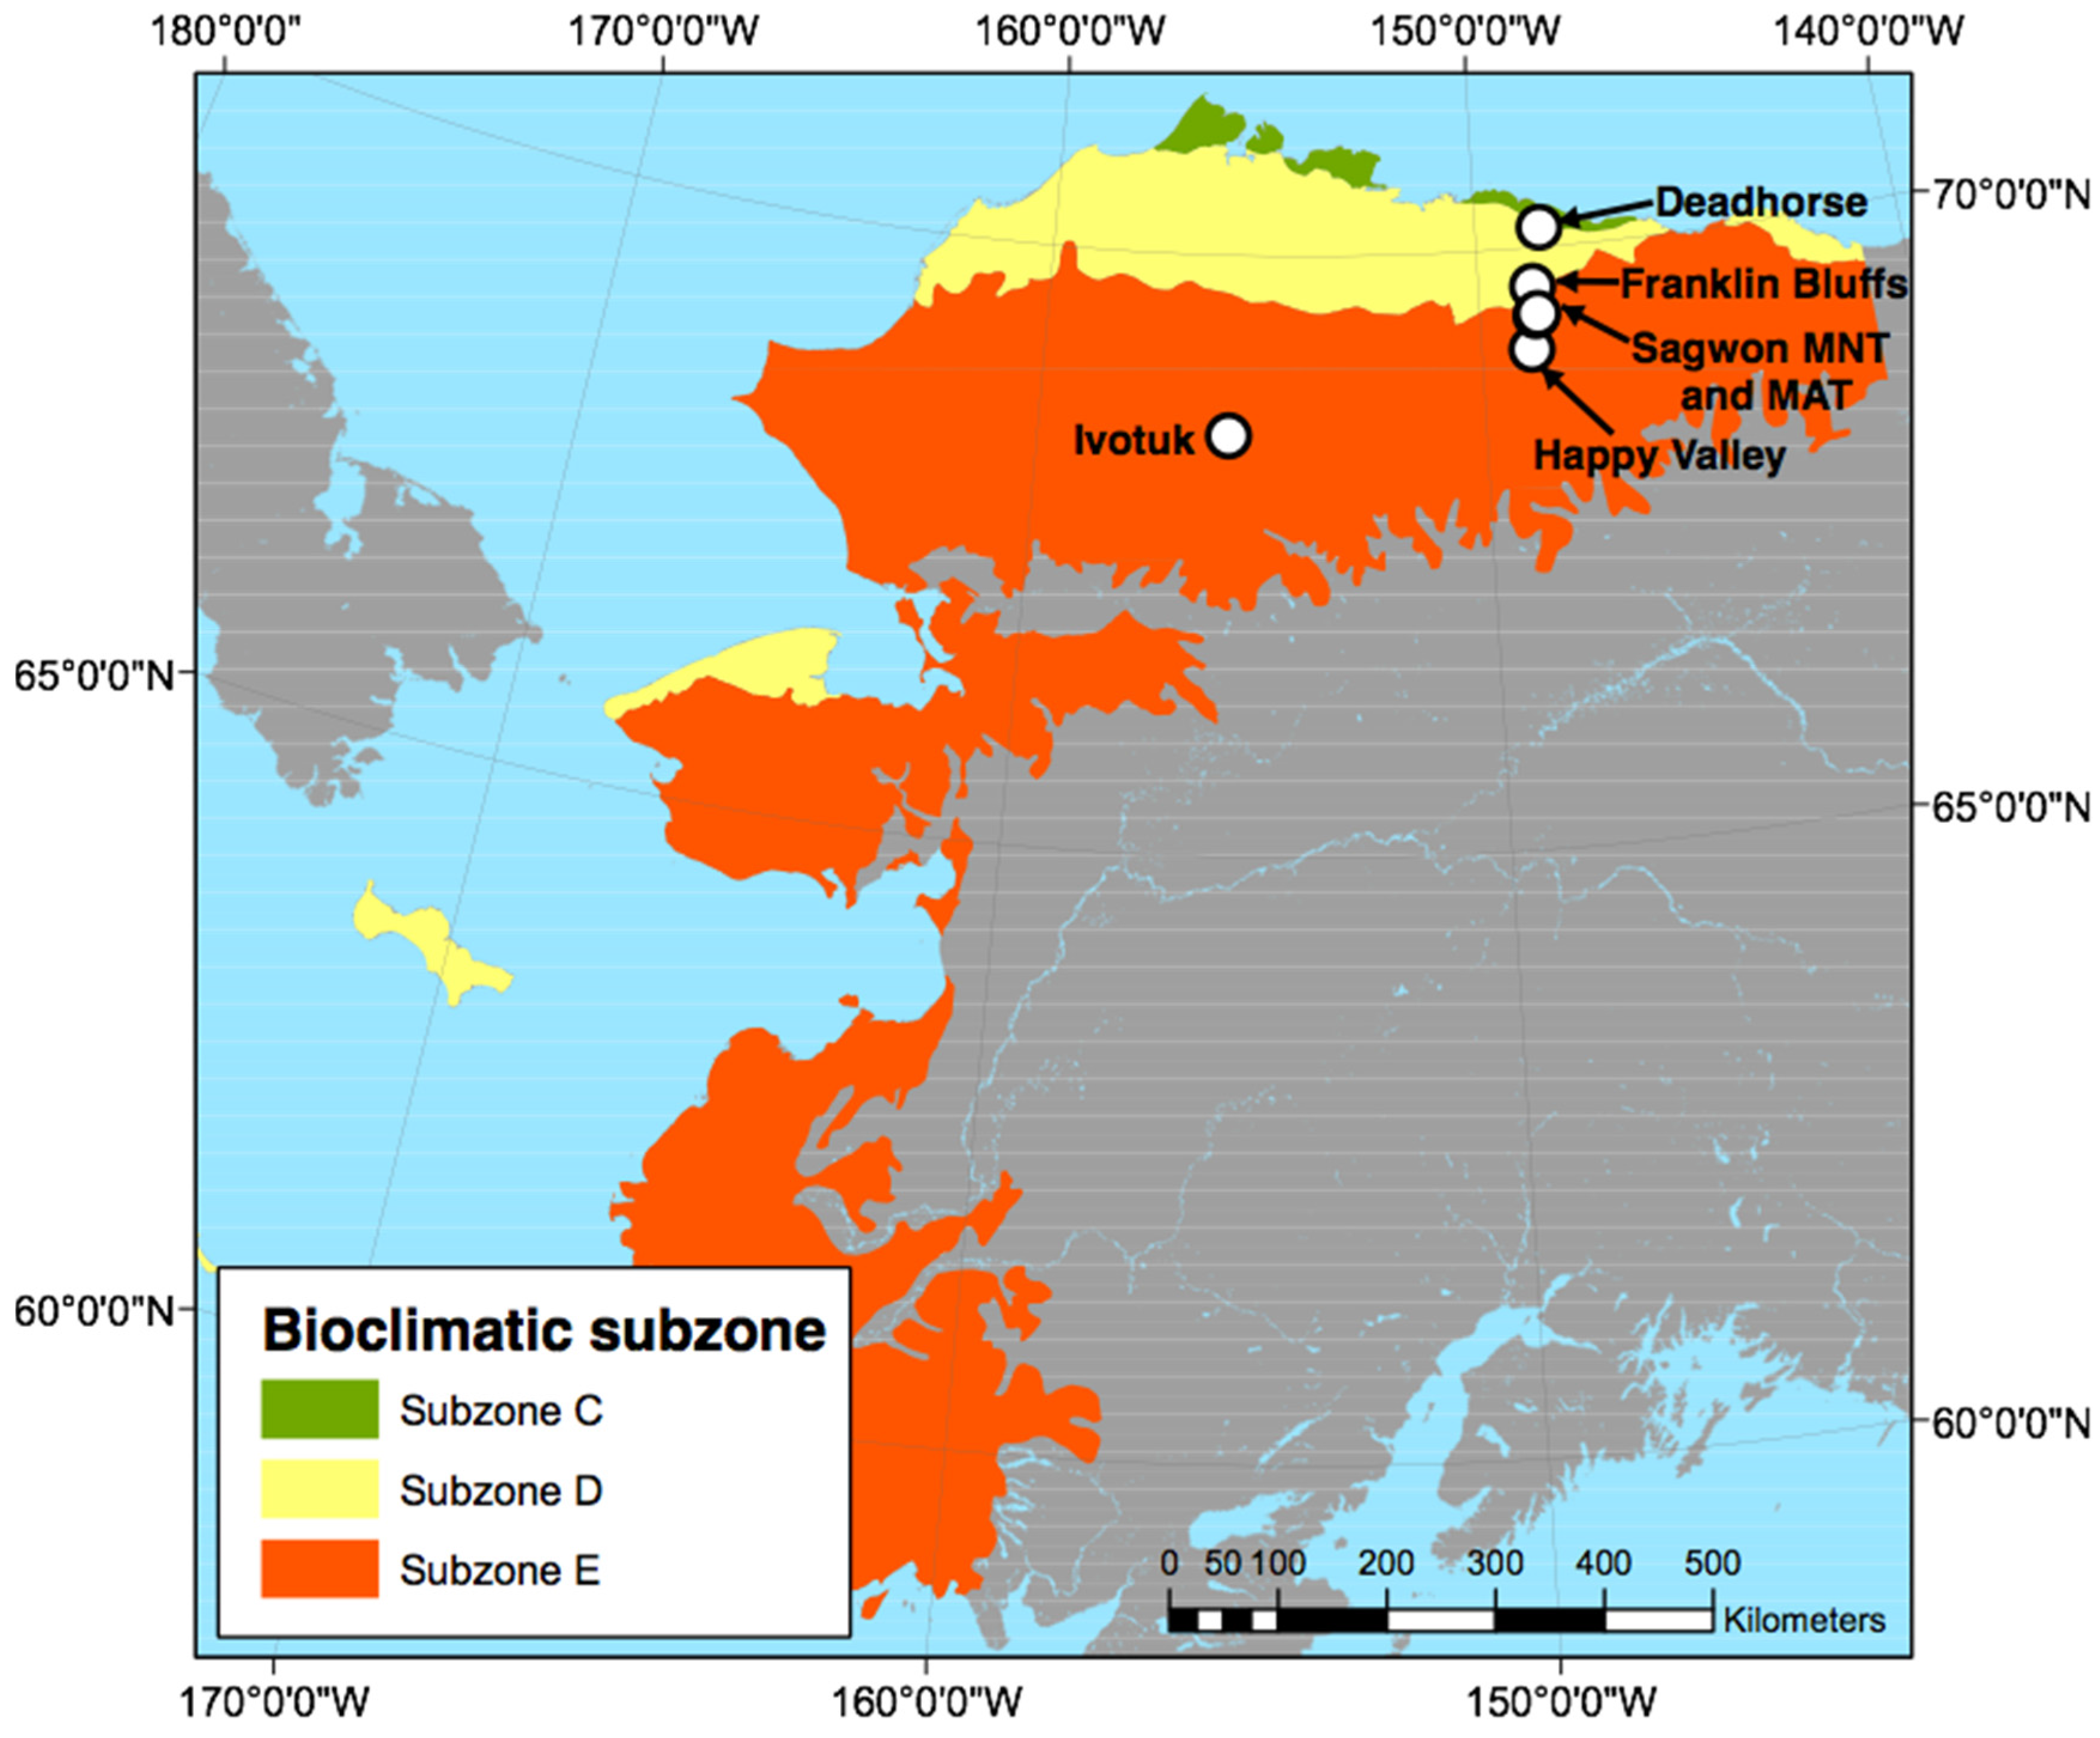
2.3. Study Sites


| PFT | Early | Peak | ||||||
|---|---|---|---|---|---|---|---|---|
| MAT (%) | MNT (%) | MT (%) | ST (%) | MAT (%) | MNT (%) | MT (%) | ST (%) | |
| Deciduous shrub | 15.6 | 3.7 | 3.6 | 64.1 | 18.8 | 5.1 | 3.6 | 55.9 |
| Evergreen shrub | 22.1 | 9.4 | 14.5 | 0.2 | 23.7 | 14.4 | 14.7 | 1.6 |
| Forb | 0.2 | 4.2 | 0.0 | 0.7 | 0.4 | 3.3 | 0.0 | 1.1 |
| Graminoid | 32.0 | 9.4 | 35.9 | 3.8 | 27.5 | 12.2 | 36.1 | 10.4 |
| Lichen | 4.9 | 3.0 | 3.1 | 1.3 | 5.7 | 3.6 | 3.3 | 2.4 |
| Moss | 25.2 | 70.3 | 42.4 | 29.9 | 23.9 | 61.5 | 42.4 | 28.6 |
2.4. Data Collection
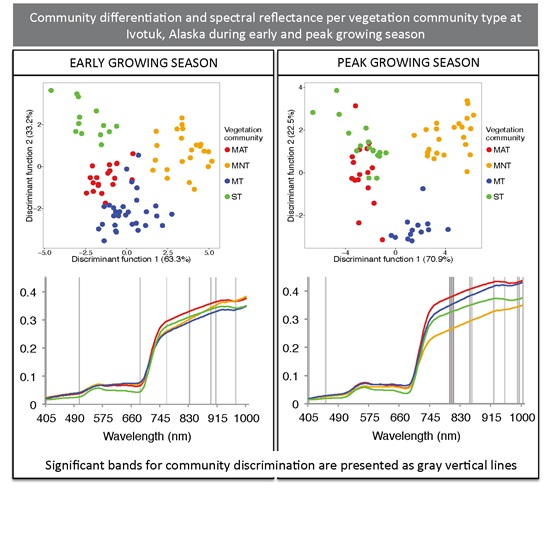
| Growing Season | MAT | MNT | MT | ST |
|---|---|---|---|---|
| Early | 7 June, 26 June, 2 July (n = 42) | 10 June, 25 June, 2 July (n = 45) | 10 June, 25 June, 2 July (n = 41) | 10 June, 26 June, 7 July (n = 37) |
| Peak | 16 July, 27 July, 17 August (n = 40) | 16 July, 27 July, 17 August (n = 43) | 16 July, 27 July (n = 33) | 16 July, 27 July, 7 August (n = 33) |
2.5. Spectral Processing
2.6. Data Analysis
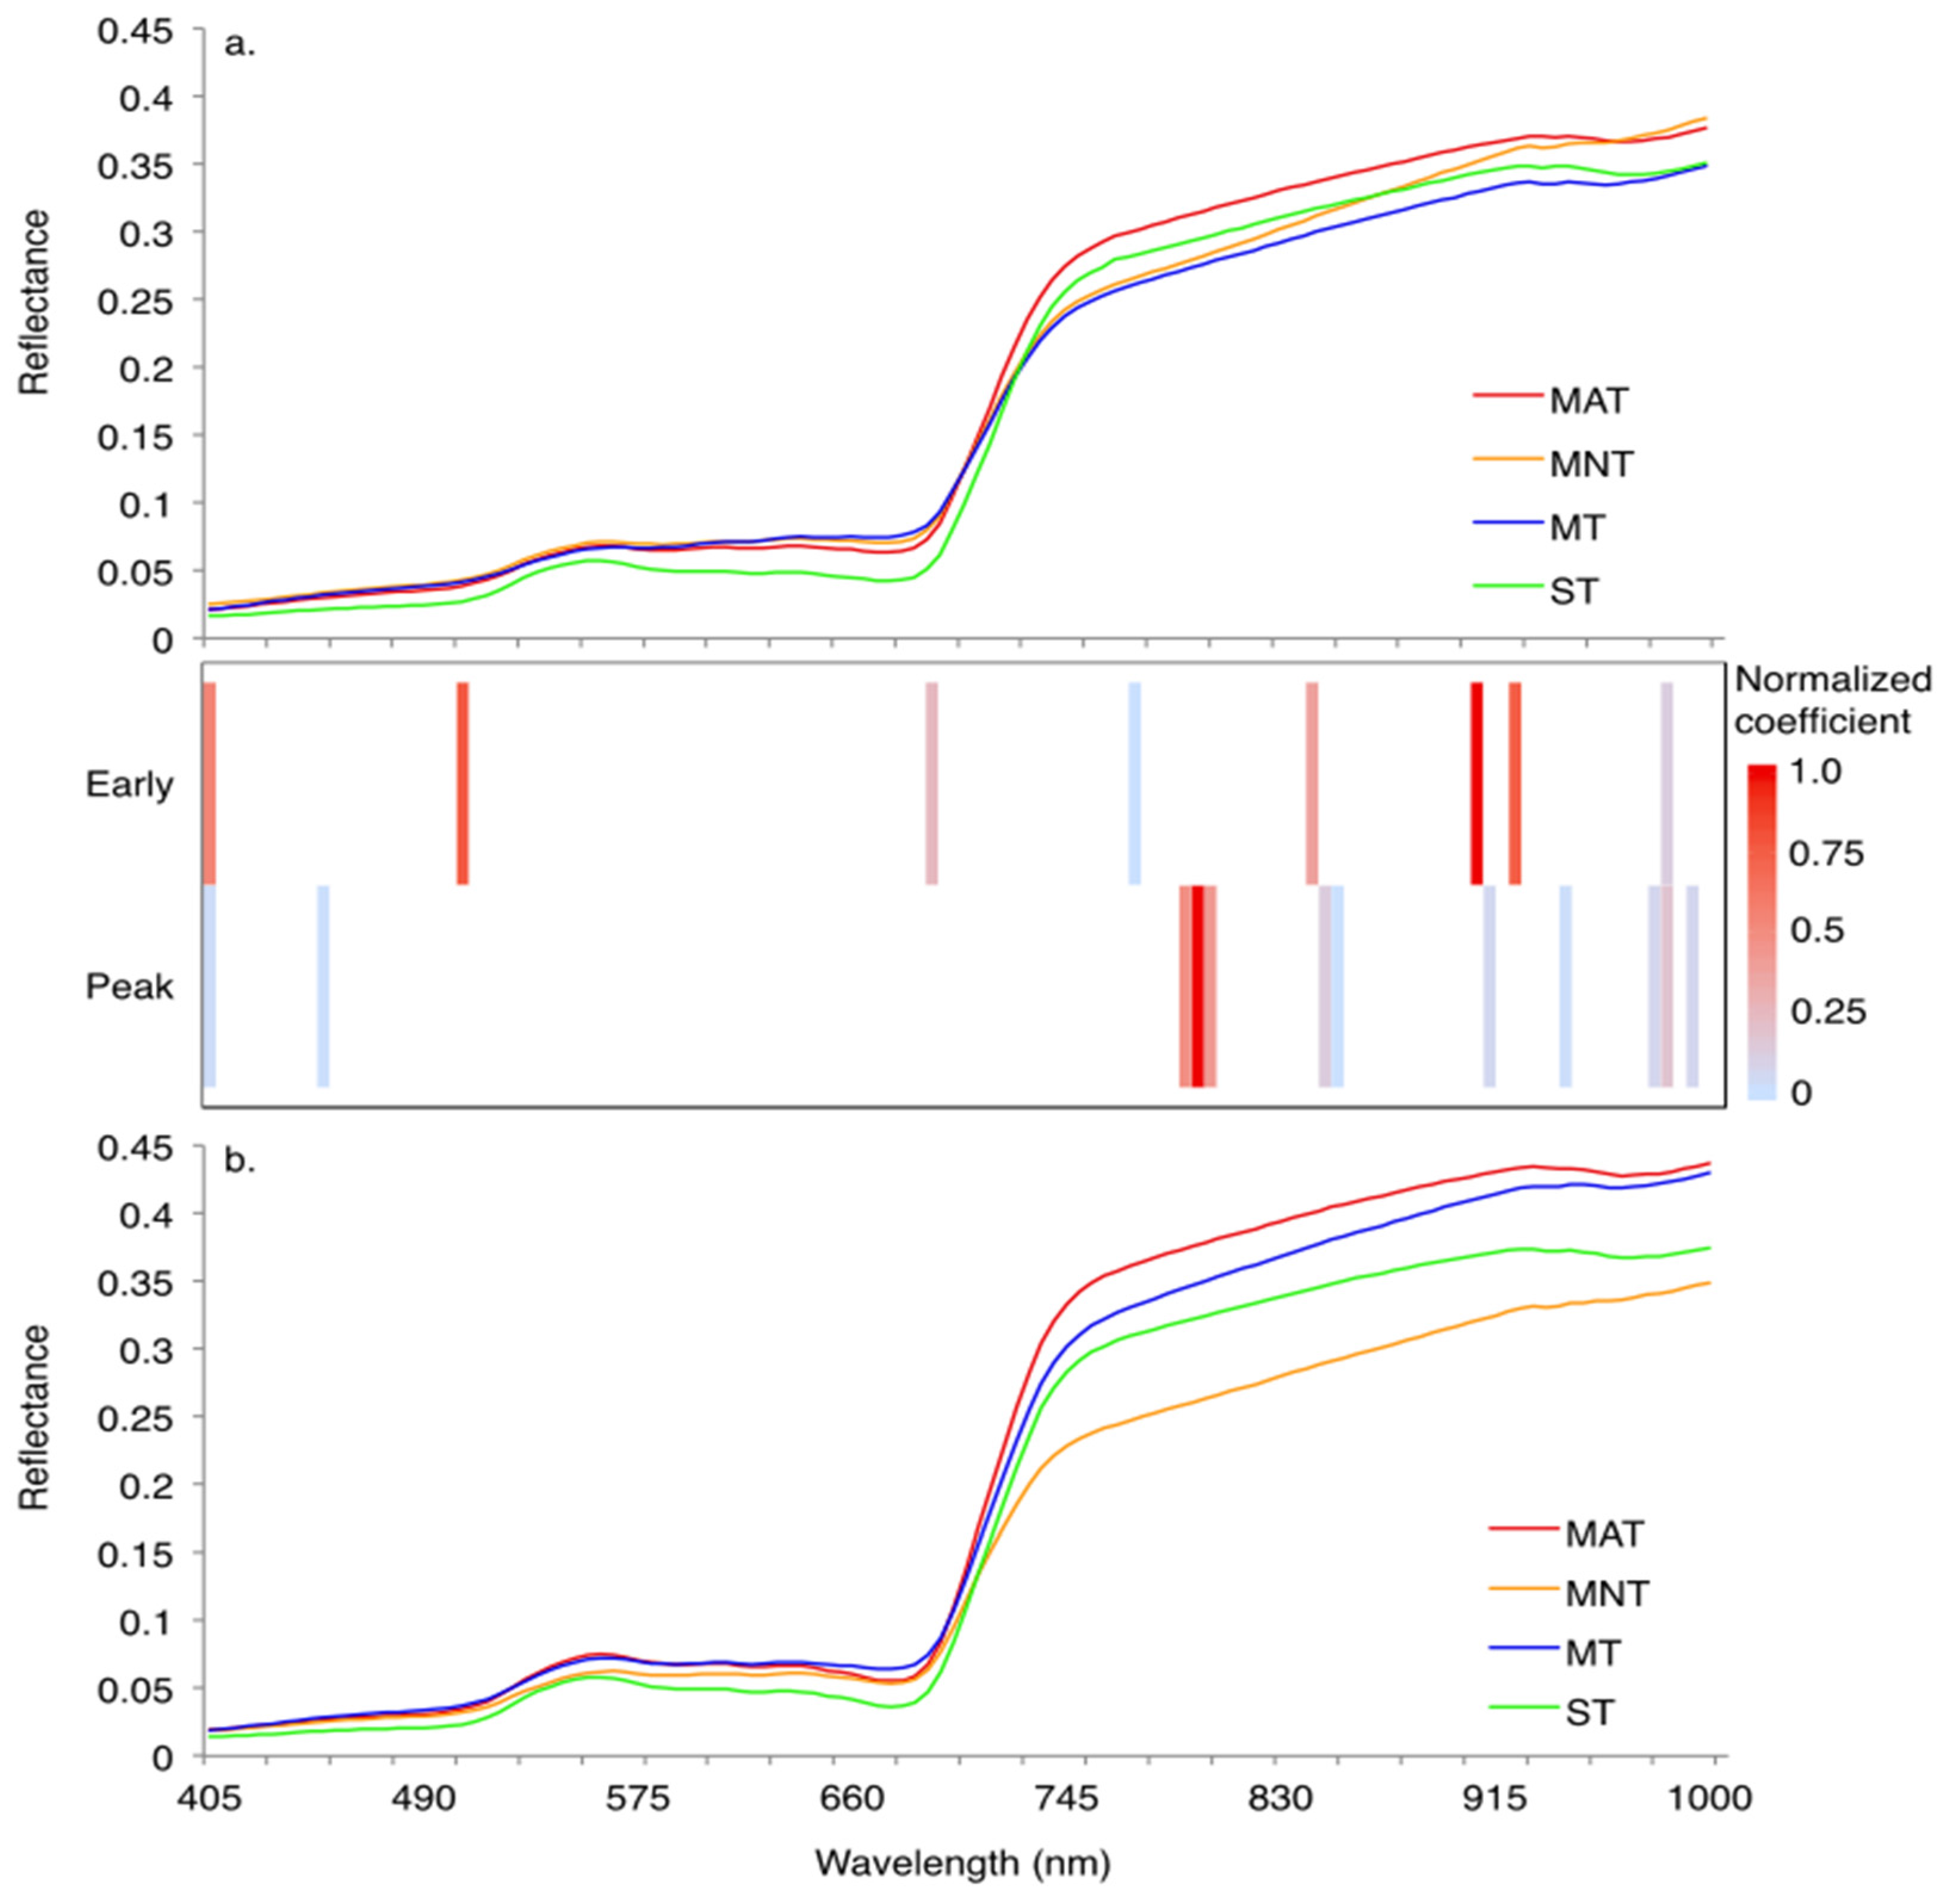
3. Results
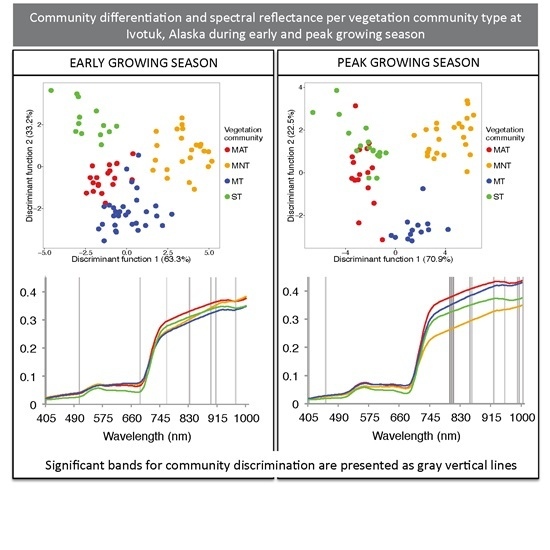
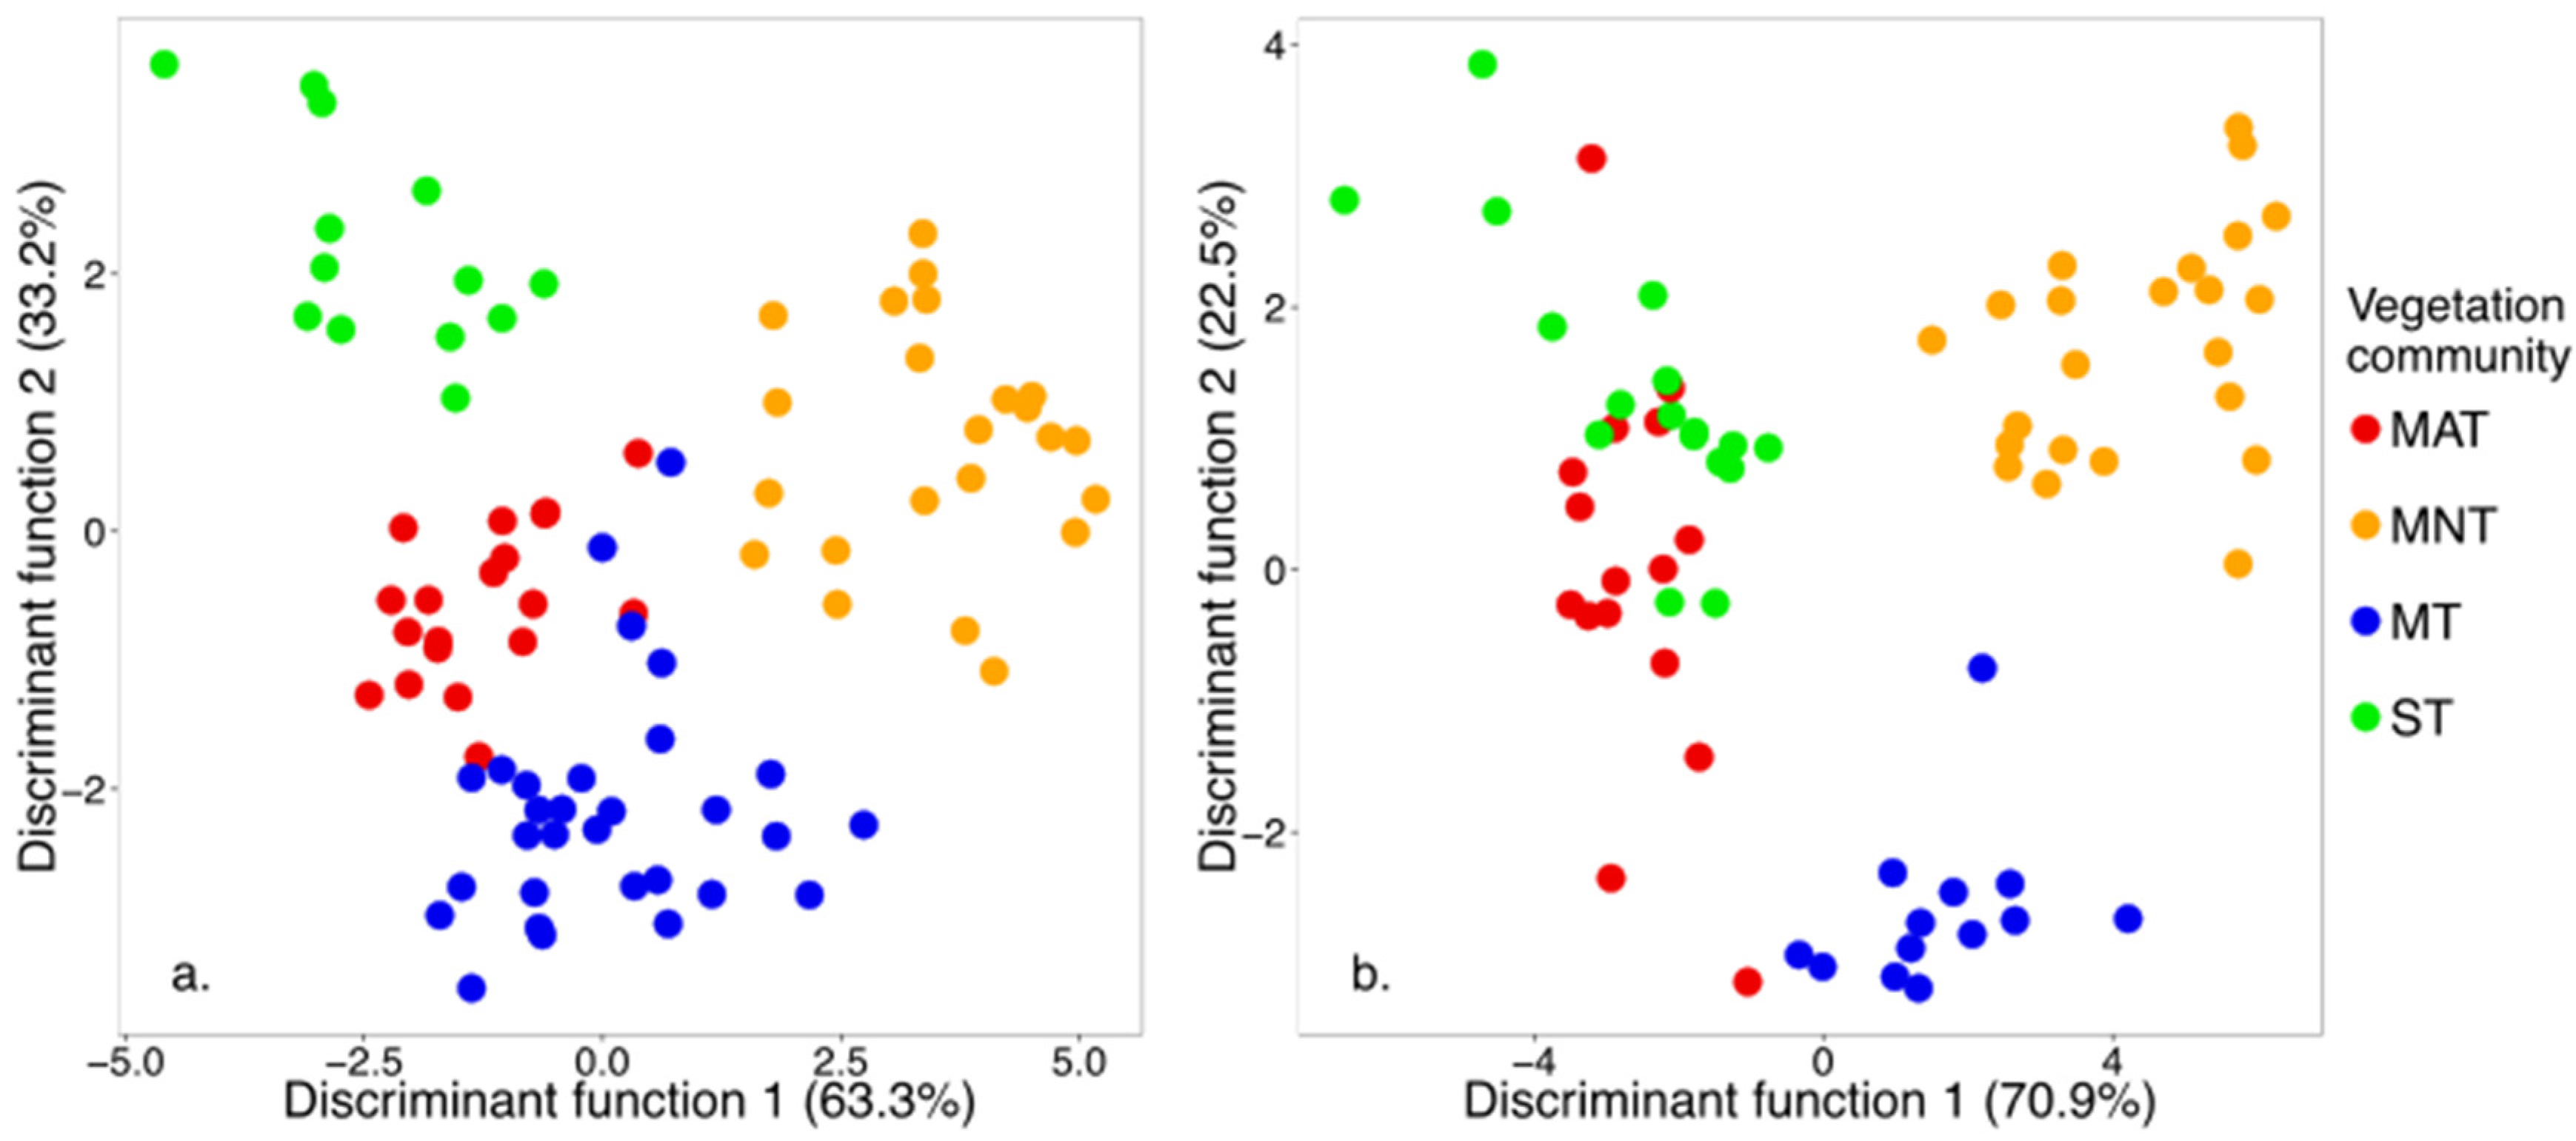
3.1. Sparse Partial Least Squares (SPLS) and Linear Discriminant Analysis (LDA)
| Sampling Period | Significant HNBs (nm) | Wilks’ Lambda | Sum of Eigenvalues | Overall Classification Accuracy Using the Optimal HNBs Only (%) |
|---|---|---|---|---|
| Early | 405, 505, 690, 770, 840, 905, 920, 980 | 0.03 | 8.41 | 84 |
| Peak | 405, 450, 790, 795, 800, 845, 850, 910, 940, 975, 980, 990 | 0.01 | 12.39 | 94 |
| Classification Accuracy (%) | Early Growing Season | Classification Accuracy (%) | Peak Growing Season | ||||||||
|---|---|---|---|---|---|---|---|---|---|---|---|
| MAT | MNT | MT | ST | MAT | MNT | MT | ST | ||||
| 73 | MAT | 16 | - | 4 | 2 | 80 | MAT | 16 | - | - | 4 |
| 92 | MNT | 1 | 2 | 1 | - | 100 | MNT | - | 23 | - | - |
| 100 | MT | - | - | 21 | - | 100 | MT | - | - | 13 | - |
| 65 | ST | 2 | - | 4 | 11 | 100 | ST | - | - | - | 13 |
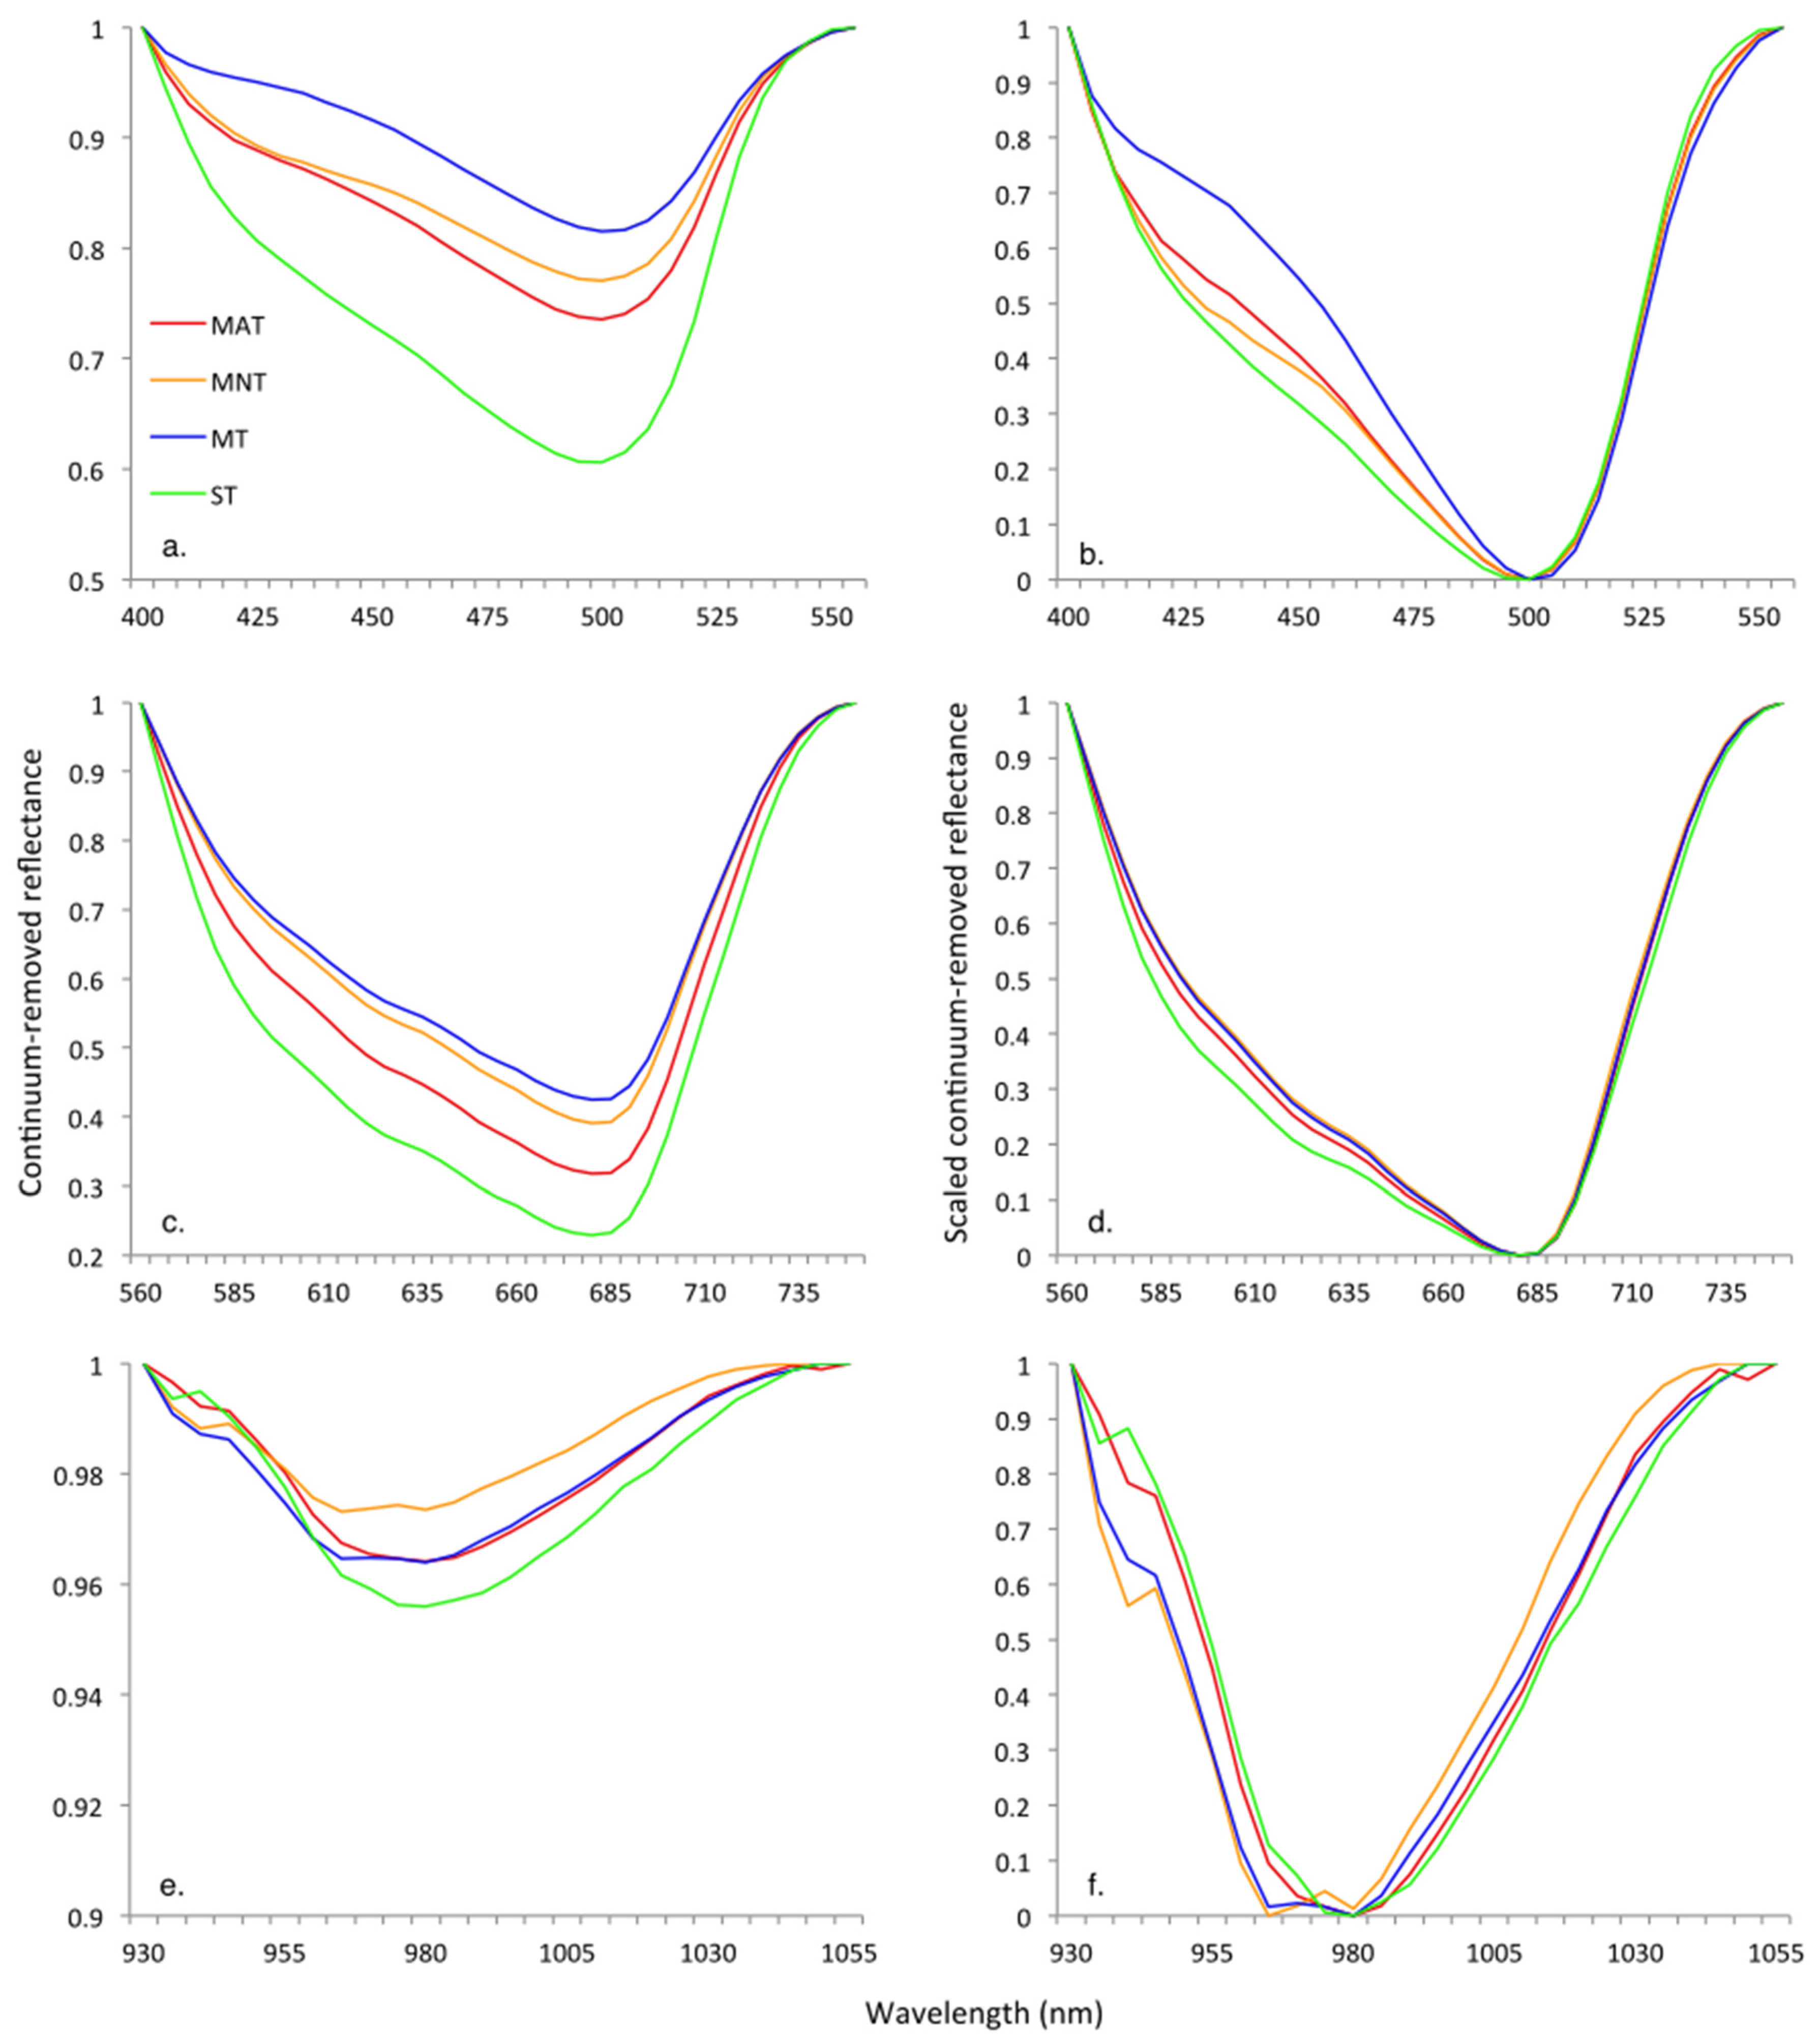
3.2. Continuum Removal

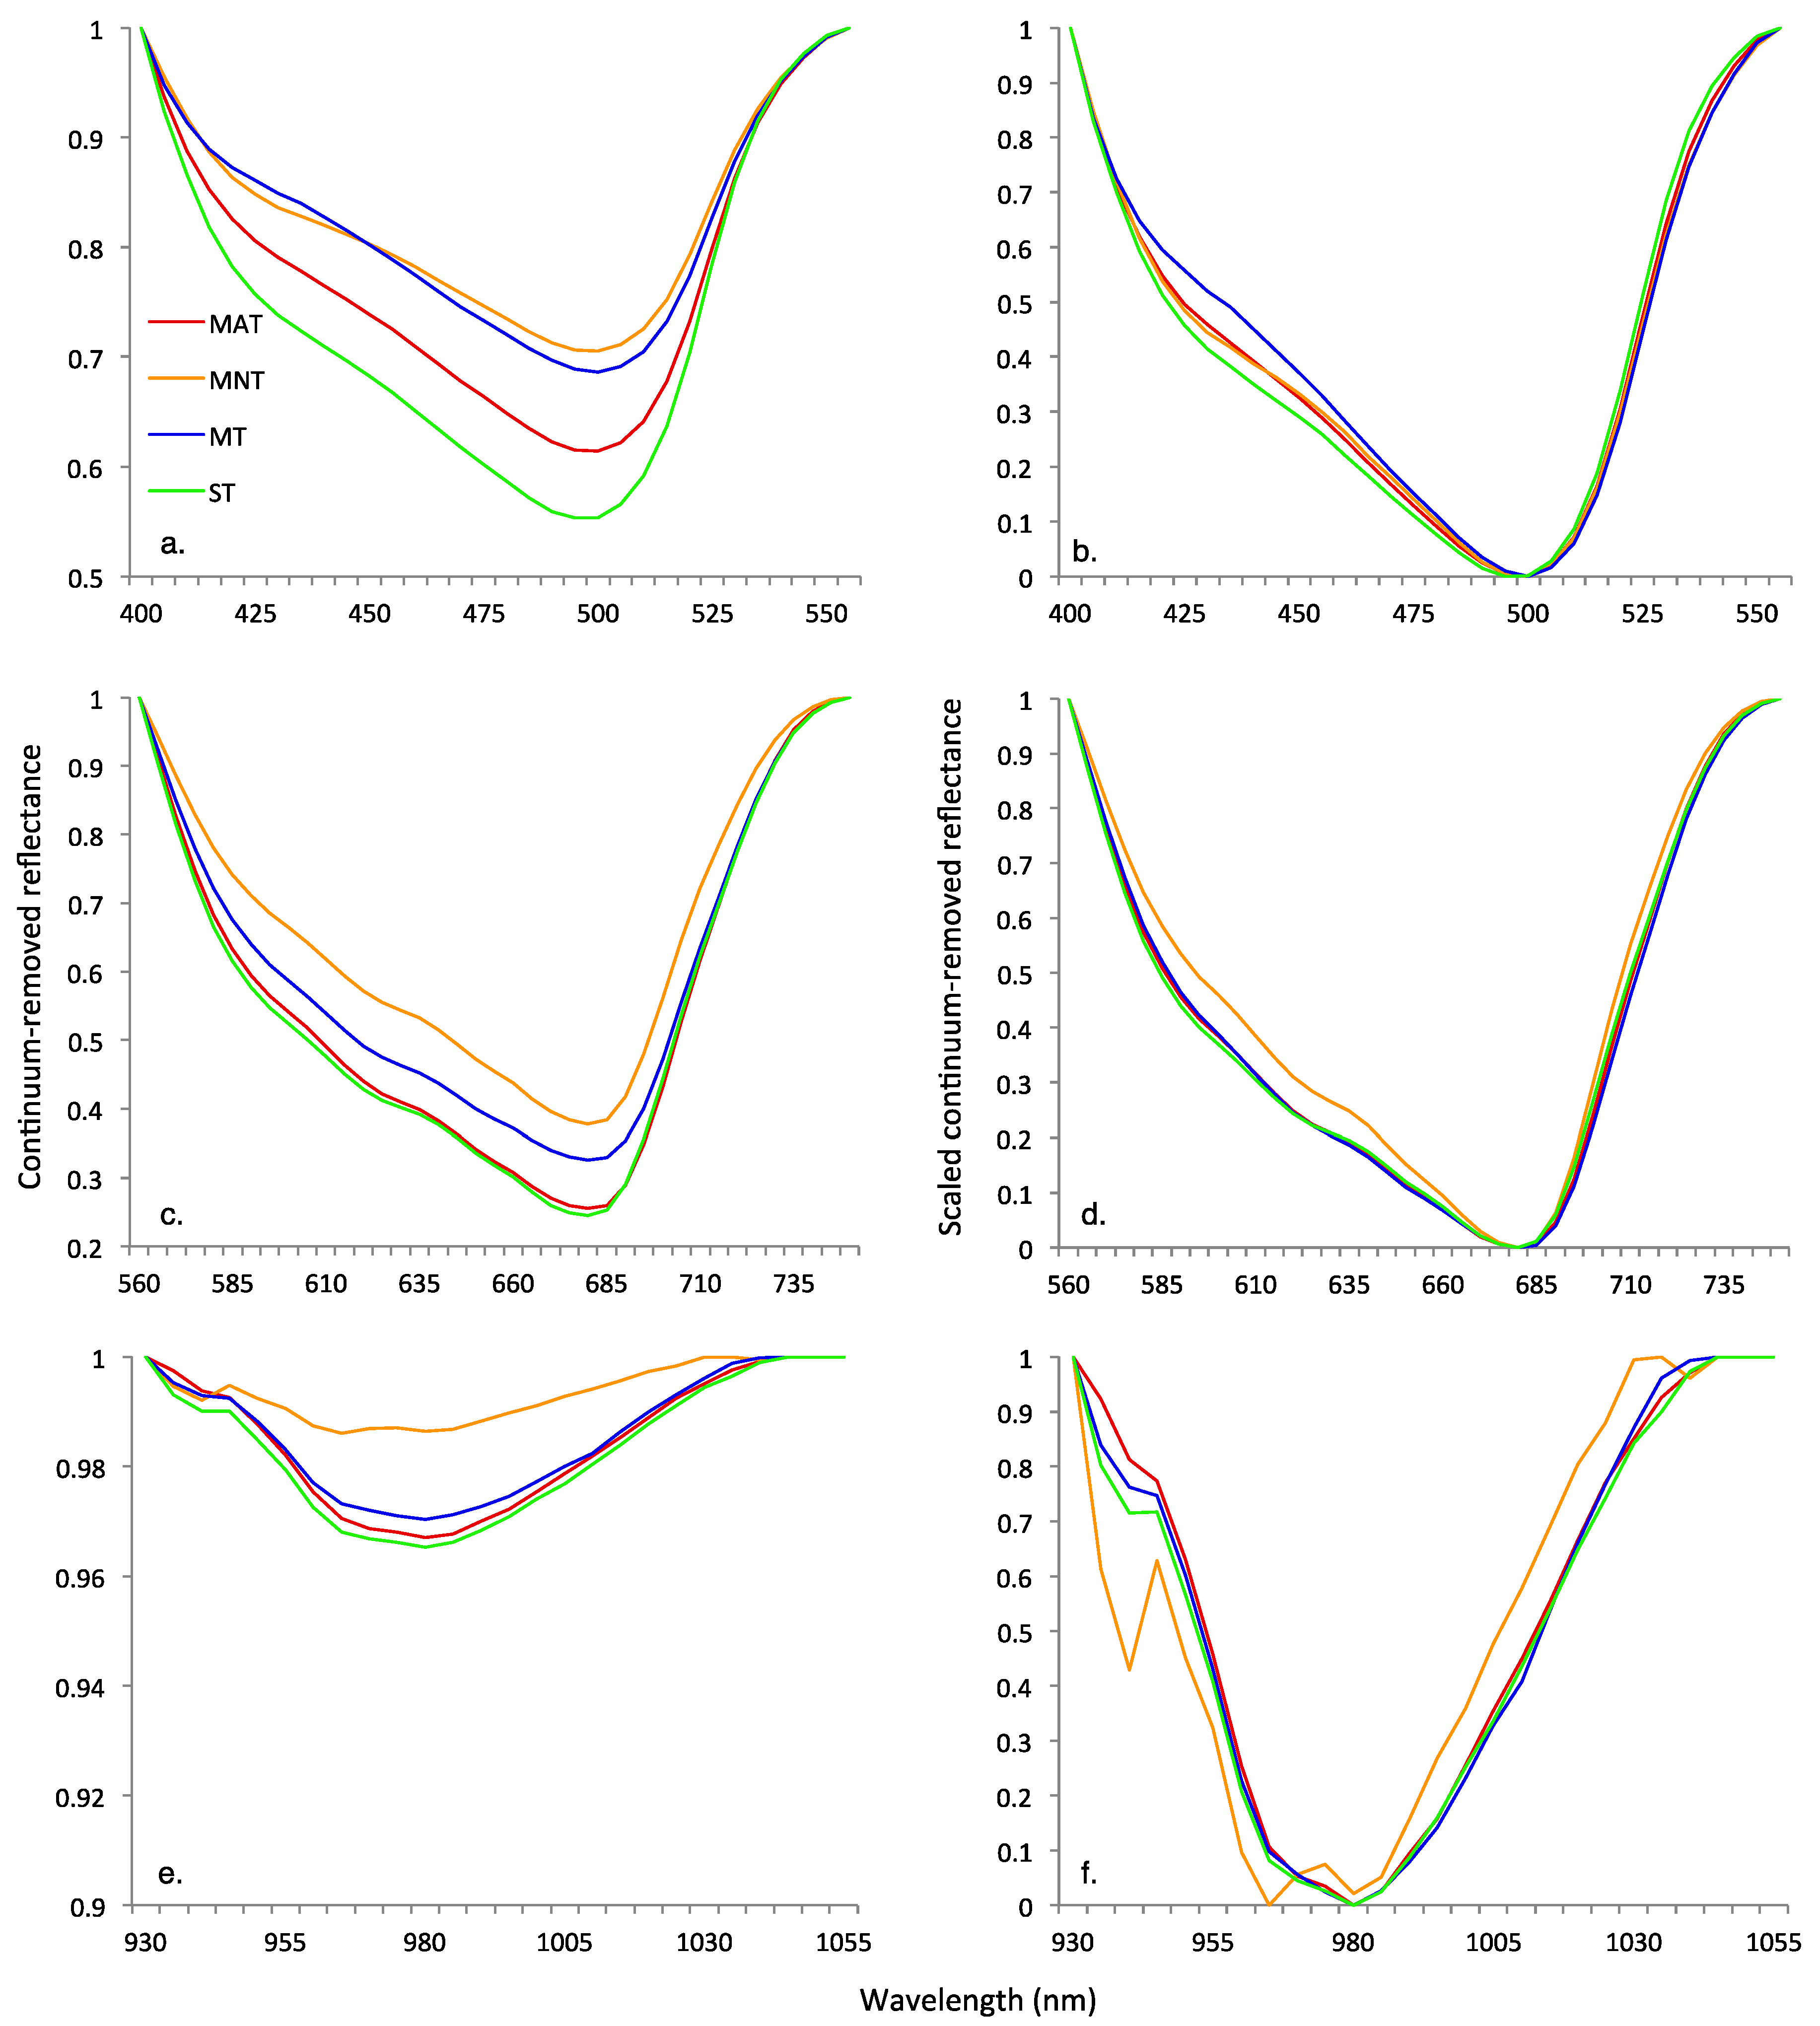
| Blue | Red | Water | |||||||||||
|---|---|---|---|---|---|---|---|---|---|---|---|---|---|
| Growing Season | Vegetation Community | HNB of Maximum Depth (nm) | Maximum Band Depth | Full Width at Half Maximum Band Depth (nm) | Area of Absorption Feature | HNB of Maximum Depth (nm) | Maximum Band Depth | Full Width at Half Maximum Band Depth (nm) | Area of Absorption Feature | HNB of Maximum Depth (nm) | Maximum Band Depth | Full Width at Half Maximum Band Depth | Area of Absorption Feature |
| Early | MAT | 500 | 0.26 | 87.53 | 22.8 | 680 | 0.68 | 125.01 | 78.1 | 980 | 0.04 | 61.66 | 2.2 |
| MNT | 500 | 0.23 | 96.52 | 20.2 | 680 | 0.61 | 120.23 | 67.6 | 965 | 0.03 | 65.44 | 1.7 | |
| MT | 500 | 0.18 | 71.53 | 14.4 | 680 | 0.58 | 121.64 | 64.6 | 980 | 0.04 | 67.04 | 2.4 | |
| ST | 500 | 0.39 | 98.56 | 35.6 | 680 | 0.77 | 131.28 | 92.2 | 980 | 0.04 | 60.69 | 2.8 | |
| Peak | MAT | 500 | 0.39 | 101.14 | 35.5 | 680 | 0.74 | 125.02 | 84.6 | 980 | 0.03 | 58.99 | 2.0 |
| MNT | 500 | 0.29 | 102.65 | 27.2 | 680 | 0.62 | 113.72 | 65.7 | 965 | 0.01 | 59.64 | 0.8 | |
| MT | 500 | 0.31 | 92.98 | 28.2 | 680 | 0.67 | 125.20 | 77.2 | 980 | 0.03 | 62.96 | 1.8 | |
| ST | 495 | 0.45 | 103.67 | 41.6 | 680 | 0.76 | 125.79 | 86.0 | 980 | 0.03 | 40.70 | 2.2 | |
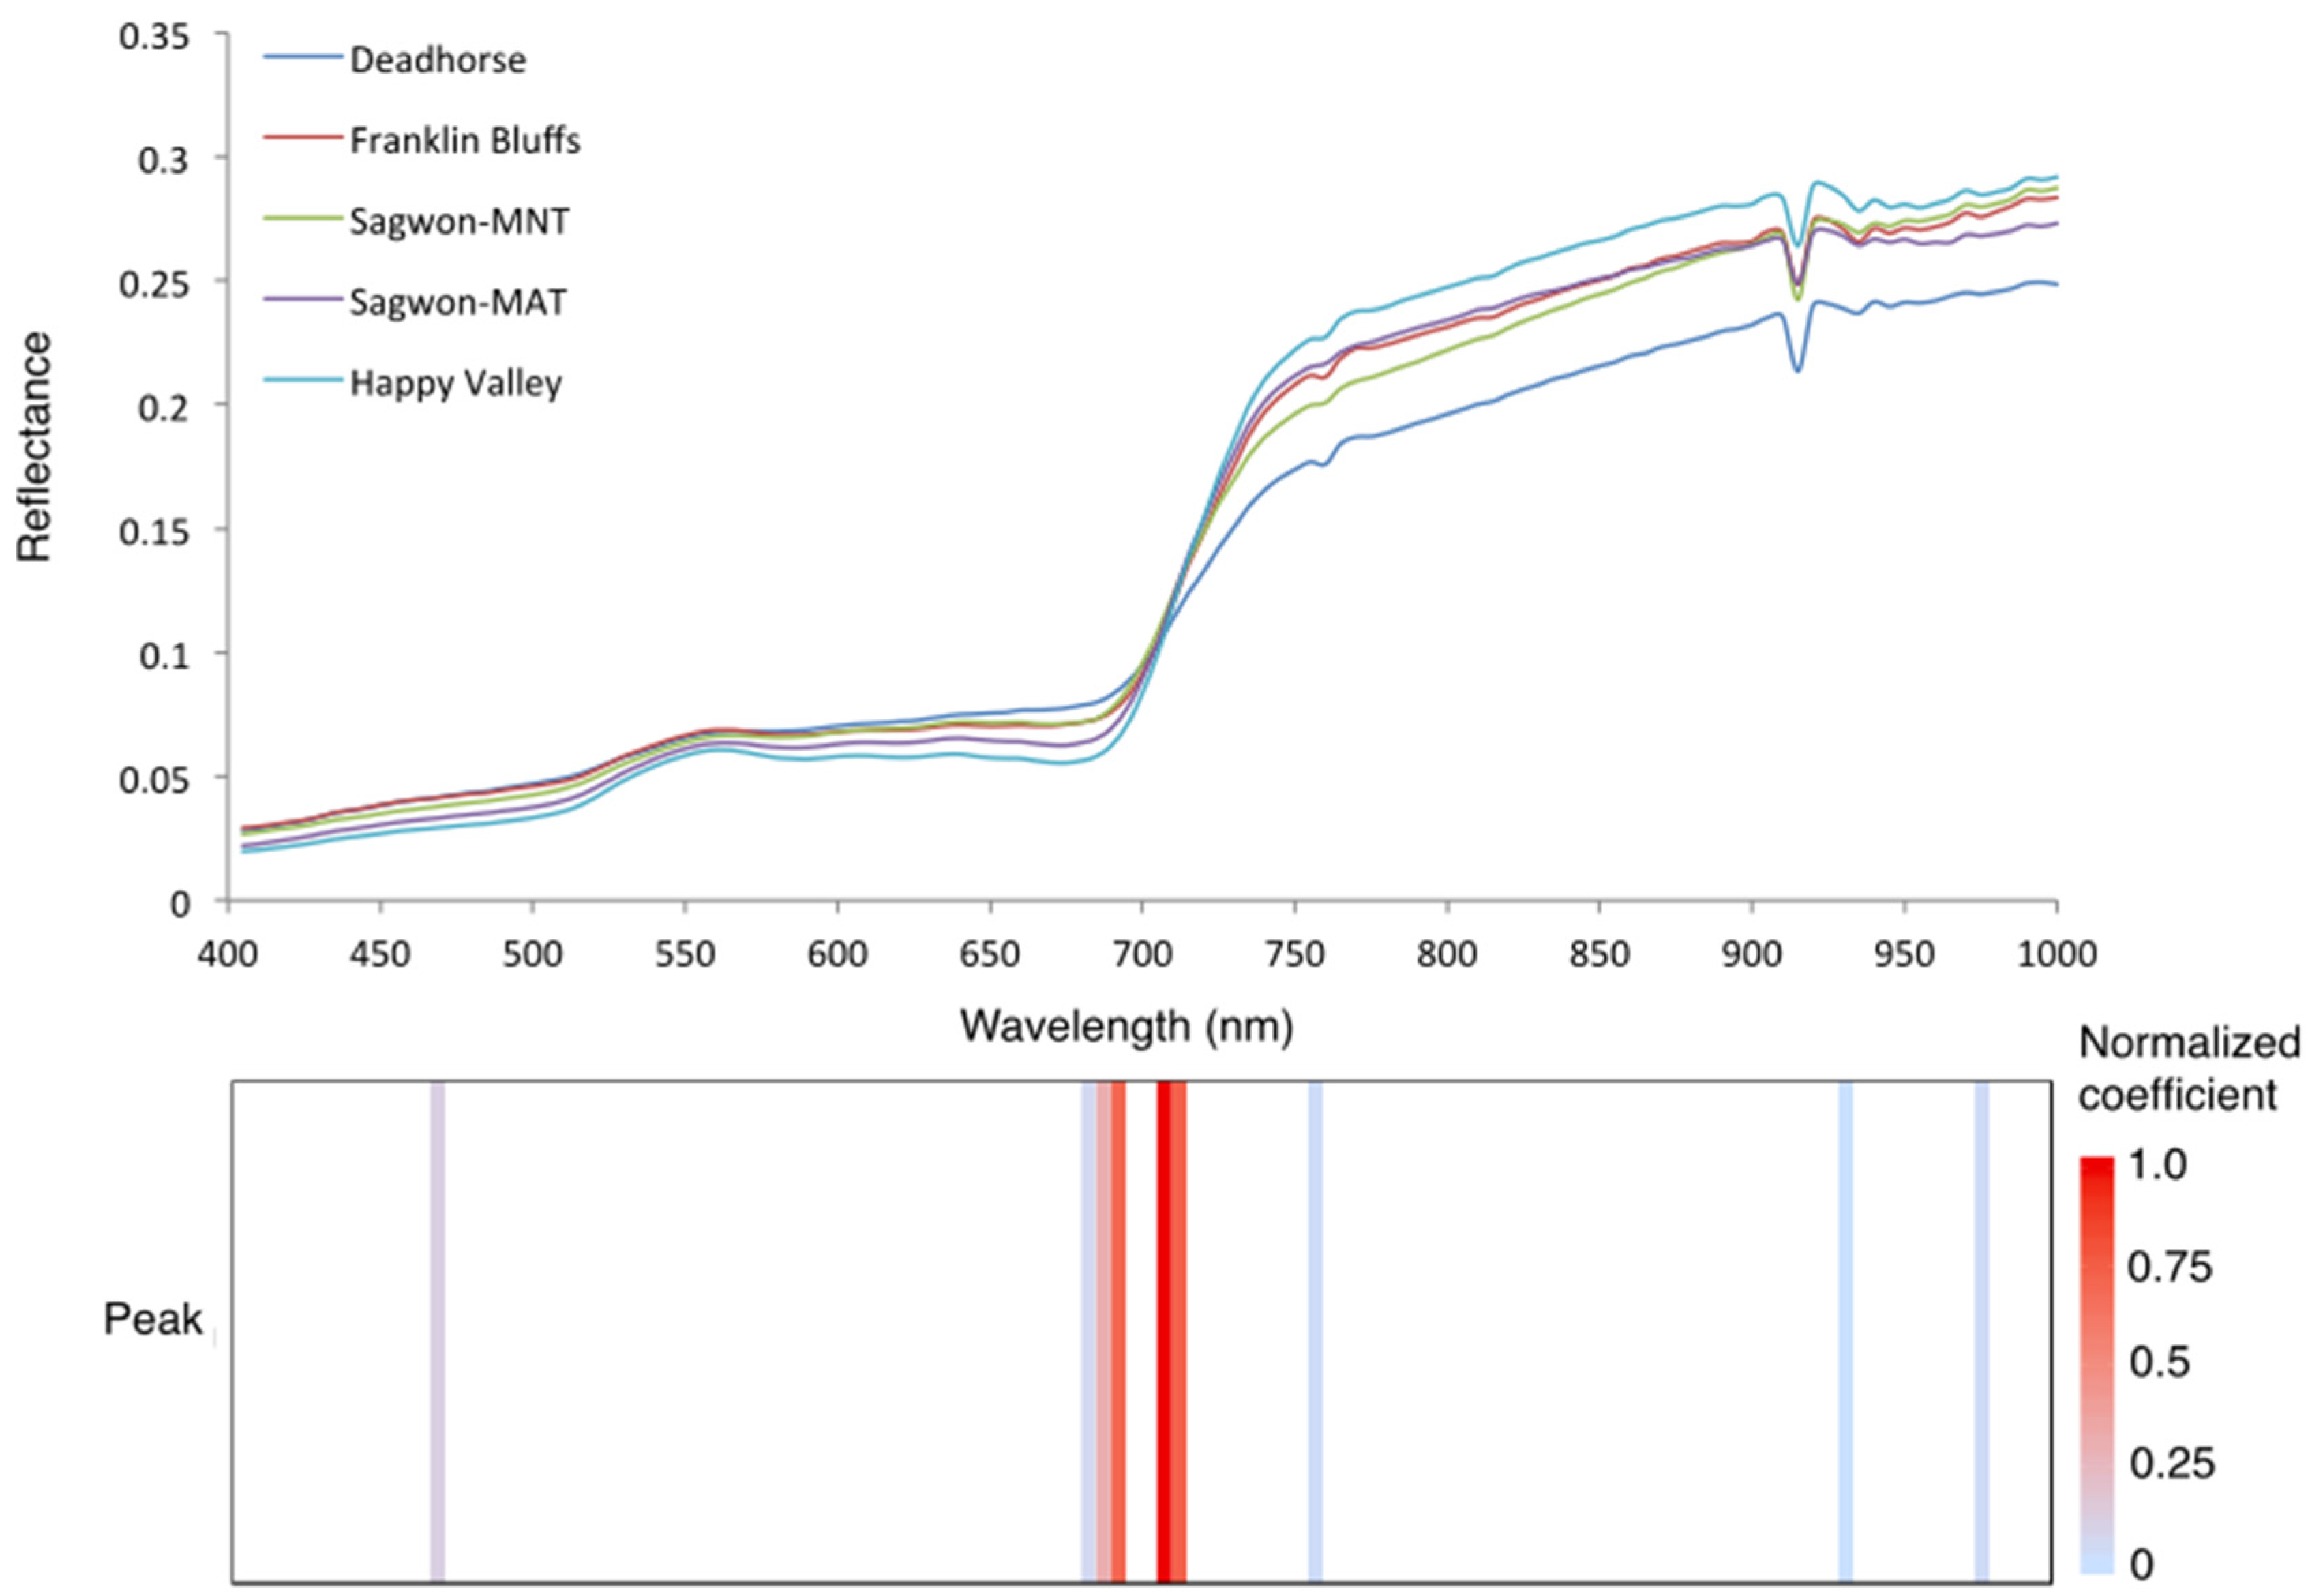
3.3. Predicting Vegetation Community Types at the Five Dalton Highway Test Sites
| Optimal HNBs (nm) | Site and Community Classification | Overall Classification Accuracy Using the Optimal HNBs Only (%) |
|---|---|---|
| 470, 685, 690, 695, 710, 715, 760, 935, 980 | Deadhorse | 56 |
| Franklin Bluffs | 55 | |
| Sagwon-MNT | 70 | |
| Sagwon-MAT | 91 | |
| Happy Valley | 90 |

4. Discussion
5. Conclusions
Acknowledgments
Author Contributions
Conflicts of Interest
References
- Stow, D.A.; Hope, A.; McGuire, D.; Verbyla, D.; Gamon, J.; Huemmrich, F.; Houston, S.; Racine, C.; Sturm, M.; Tape, K.; et al. Remote sensing of vegetation and land-cover change in arctic tundra ecosystems. Remote Sens. Environ. 2004, 89, 281–308. [Google Scholar] [CrossRef]
- Sturm, M.; Schimel, J.P.; Michaelson, G.J.; Welker, J.M.; Oberbauer, S.F.; Liston, G.E.; Fahnestock, J.; Romanovsky, V.E. Winter biological processes could help convert arctic tundra to shrubland. BioScience 2005, 55, 17–26. [Google Scholar] [CrossRef]
- Walker, D.A. An integrated vegetation mapping approach for northern Alaska (1:4 m scale). Int. J. Remote Sens. 1999, 20, 2895–2920. [Google Scholar] [CrossRef]
- Silapaswan, C.; Verbyla, D.; McGuire, A.D. Land cover change on the Seward Peninsula: The use of remote sensing to evaluate the potential influences of climate warming on historical vegetation dynamics. Can. J. Remote Sens. 2001, 27, 542–554. [Google Scholar] [CrossRef]
- Muller, S.V.; Racoviteanu, A.E.; Walker, D.A. Landsat MSS-derived land-cover map of northern Alaska: Extrapolation methods and a comparison with photo-interpreted and AVHRR-derived maps. Int. J. Remote Sens. 1999, 20, 2921–2946. [Google Scholar] [CrossRef]
- Tucker, C.J. Red and photographic infrared linear combinations for monitoring vegetation. Remote Sens. Environ. 1979, 8, 127–150. [Google Scholar] [CrossRef]
- Epstein, H.E.; Raynolds, M.K.; Walker, D.A.; Bhatt, U.S.; Tucker, C.J.; Pinzon, J.E. Dynamics of aboveground phytomass of the circumpolar arctic tundra during the past three decades. Environ. Res. Lett. 2012, 7, 015506. [Google Scholar] [CrossRef]
- Riedel, S.M.; Epstein, H.E.; Walker, D.A. Biotic controls over spectral reflectance of arctic tundra vegetation. Int. J. Remote Sens. 2005, 26, 2391–2405. [Google Scholar] [CrossRef]
- Huemmrich, K.F.; Gamon, J.A.; Tweedie, C.E.; Oberbauer, S.F.; Kinoshita, G.; Houston, S.; Kuchy, A.; Hollister, R.D.; Kwon, H.; Mano, M. Remote sensing of tundra gross ecosystem productivity and light use efficiency under varying temperature and moisture conditions. Remote Sens. Environ. 2010, 114, 481–489. [Google Scholar] [CrossRef]
- Hope, A.; Kimball, J.S.; Stow, D. The relationship between tussock tundra spectral reflectance properties and biomass and vegetation composition. Int. J. Remote Sens. 1993, 14, 1861–1874. [Google Scholar] [CrossRef]
- Vierling, L.A.; Deering, D.W.; Eck, T.F. Differences in arctic tundra vegetation type and phenology as seen using bidirectional radiometry in the early growing season. Remote Sens. Environ. 1997, 60, 71–82. [Google Scholar] [CrossRef]
- Laidler, G.J.; Treitz, P.; Atkinson, D. Remote sensing of arctic vegetation: Relations between the NDVI, spatial resolution and vegetation cover on Boothia Peninsula, Nunavut. Arctic 2008, 61, 1–13. [Google Scholar] [CrossRef]
- Olthof, I.; Latifovic, R. Short-term response of arctic vegetation NDVI to temperature anomalies. Int. J. Remote Sens. 2007, 28, 4823–4840. [Google Scholar] [CrossRef]
- Huemmrich, K.F.; Kinoshita, G.; Gamon, J.A.; Houston, S.; Kwon, H.; Oechel, W.C. Tundra carbon balance under varying temperature and moisture regimes. J. Geophys. Res. 2010, 115. [Google Scholar] [CrossRef]
- Myers-Smith, I.H.; Forbes, B.C.; Wilmking, M.; Hallinger, M.; Lantz, T.; Blok, D.; Tape, K.D.; Macias-Fauria, M.; Sass-Klaassen, U.; Lévesque, E.; et al. Shrub expansion in tundra ecosystems: Dynamics, impacts and research priorities. Environ. Res. Lett. 2011, 6, 045509. [Google Scholar] [CrossRef]
- Walker, D.A.; Epstein, H.E.; Jia, G.; Balser, A.; Copass, C.; Edwards, E.J.; Gould, W.A.; Hollingsworth, J.; Knudson, J.A.; Maier, H.A.; et al. Phytomass, LAI, and NDVI in northern Alaska: Relationships to summer warmth, soil pH, plant functional types, and extrapolation to the circumpolar Arctic. J. Geophys. Res. 2003, 108. [Google Scholar] [CrossRef]
- Riedel, S.; Epstein, H.E.; Walker, D.A.; Richardson, D.L.; Calef, M.P.; Edwards, E.; Moody, A. Spatial and temporal heterogeneity of vegetation properties among four tundra plant communities at Ivotuk, Alaska, U.S.A. Arct. Antarct. Alpine Res. 2005, 37, 25–33. [Google Scholar] [CrossRef]
- Buchhorn, M.; Walker, D.; Heim, B.; Raynolds, M.; Epstein, H.; Schwieder, M. Ground-based hyperspectral characterization of Alaska tundra vegetation along environmental gradients. Remote Sens. 2013, 5, 3971–4005. [Google Scholar] [CrossRef]
- Ustin, S.L.; Gamon, J.A. Remote sensing of plant functional types. New Phytol. 2010, 186, 795–816. [Google Scholar] [CrossRef] [PubMed]
- Curran, P.J. Remote sensing of foliar chemistry. Remote Sens. Environ. 1989, 30, 271–278. [Google Scholar] [CrossRef]
- Vogelmann, J.E.; Moss, D.M. Spectral reflectance measurements in the genus Sphagnum. Remote Sens. Environ. 1993, 45, 273–279. [Google Scholar] [CrossRef]
- Walker, D.A.; Epstein, H.E.; Raynolds, M.K.; Kuss, P.; Kopecky, M.A.; Frost, G.V.; Daniëls, F.J.A.; Leibman, M.O.; Moskalenko, N.G.; Matyshak, G.V.; et al. Environment, vegetation and greenness (NDVI) along the North America and Eurasia Arctic transects. Environ. Res. Lett. 2012, 7, 015504. [Google Scholar] [CrossRef]
- Boelman, N.T.; Gough, L.; McLaren, J.R.; Greaves, H. Does NDVI reflect variation in the structural attributes associated with increasing shrub dominance in arctic tundra? Environ. Res. Lett. 2011, 6, 035501. [Google Scholar] [CrossRef]
- Huemmrich, F.; Gamon, J.A.; Tweedie, C.E.; Campbell, P.; Landis, D.R.; Middleton, E. Arctic tundra vegetation functional types based on photosynthetic physiology and optical properties. IEEE J. Sel. Top. Appl. Earth Obs. Remote Sens. 2013, 6, 265–275. [Google Scholar] [CrossRef]
- Xu, H.; Twine, T.; Yang, X. Evaluating remotely sensed phenological metrics in a dynamic ecosystem model. Remote Sens. 2014, 6, 4660–4686. [Google Scholar] [CrossRef]
- DeMarco, J.; Mack, M.C.; Bret-Harte, M.S. Effects of arctic shrub expansion on biophysical versus biogeochemical drivers of litter decomposition. Ecology 2014, 95, 1861–1875. [Google Scholar] [CrossRef] [PubMed]
- Winton, M. Amplified arctic climate change: What does surface albedo feedback have to do with it? Geophys. Res. Lett. 2006, 33. [Google Scholar] [CrossRef]
- Serreze, M.C.; Francis, J.A. The arctic amplification debate. Clim. Chang. 2006, 76, 241–264. [Google Scholar] [CrossRef]
- Kaufman, D.S.; Schneider, D.P.; McKay, N.P.; Ammann, C.M.; Bradley, R.S.; Briffa, K.R.; Miller, G.H.; Otto-Bliesner, B.L.; Overpeck, J.T.; Vinther, B.M.; et al. Recent warming reverses long-term arctic cooling. Science 2009, 325, 1236–1239. [Google Scholar] [CrossRef] [PubMed]
- Comiso, J.C.; Hall, D.K. Climate trends in the Arctic as observed from space. Wiley Interdiscip. Rev. 2014, 5, 389–409. [Google Scholar] [CrossRef] [PubMed]
- Hansen, J.; Ruedy, R.; Sato, M.; Lo, K. Global surface temperature change. Rev. Geophys. 2010, 48. [Google Scholar] [CrossRef]
- Bhatt, U.S.; Walker, D.A.; Raynolds, M.K.; Comiso, J.C.; Epstein, H.E.; Jia, G.; Gens, R.; Pinzon, J.E.; Tucker, C.J.; Tweedie, C.E.; et al. Circumpolar arctic tundra vegetation change is linked to sea ice decline. Earth Interact. 2010, 14, 1–20. [Google Scholar] [CrossRef]
- Zeng, H.; Jia, G.; Epstein, H. Recent changes in phenology over the northern high latitudes detected from multi-satellite data. Environ. Res. Lett. 2011, 6, 045508. [Google Scholar] [CrossRef]
- Jia, G.J.; Epstein, H.E.; Walker, D.A. Controls over intra-seasonal dynamics of AVHRR NDVI for the arctic tundra in northern Alaska. Int. J. Remote Sens. 2004, 25, 1547–1564. [Google Scholar] [CrossRef]
- Hinzman, L.D.; Deal, C.J.; McGuire, A.D.; Mernild, S.H.; Polyakov, I.V.; Walsh, J.E. Trajectory of the arctic as an integrated system. Ecol. Appl. 2013, 23, 1837–1868. [Google Scholar] [CrossRef] [PubMed]
- Elmendorf, S.C.; Henry, G.H.; Hollister, R.D.; Bjork, R.G.; Bjorkman, A.D.; Callaghan, T.V.; Collier, L.S.; Cooper, E.J.; Cornelissen, J.H.; Day, T.A.; et al. Global assessment of experimental climate warming on tundra vegetation: Heterogeneity over space and time. Ecol. Lett. 2012, 15, 164–175. [Google Scholar] [CrossRef] [PubMed]
- Sturm, M.; Racine, C.; Tape, K.D. Increasing shrub abundance in the Arctic. Nature 2001, 411, 1251–1256. [Google Scholar] [CrossRef] [PubMed]
- Tape, K.E.N.; Sturm, M.; Racine, C. The evidence for shrub expansion in northern Alaska and the pan-Arctic. Glob. Chang. Biol. 2006, 12, 686–702. [Google Scholar] [CrossRef]
- Sturm, M.; McFadden, J.P.; Liston, G.E.; Chapin, F.S., III; Racine, C.; Holmgren, J. Snow-shrub interactions in arctic tundra: A hypothesis with climate implications. J. Clim. 2001, 14, 336–344. [Google Scholar] [CrossRef]
- Raynolds, M.K.; Walker, D.A.; Epstein, H.E.; Pinzon, J.E.; Tucker, C.J. A new estimate of tundra-biome phytomass from trans-arctic field data and AVHRR NDVI. Remote Sens. Lett. 2012, 3, 403–411. [Google Scholar] [CrossRef]
- Forbes, B.C.; Fauria, M.M.; Zetterberg, P. Russian arctic warming and “greening” are closely tracked by tundra shrub willows. Glob. Chang. Biol. 2010, 16, 1542–1554. [Google Scholar] [CrossRef]
- Jia, G.J.; Epstein, H.E.; Walker, D. Spatial characteristics of AVHRR-NDVI along latitudinal transectsin northern alaska. J. Veg. Sci. 2002, 13, 315–326. [Google Scholar] [CrossRef]
- CAVM. Circumpolar Arctic Vegetation Map. (1:7,500,000 Scale), Conservation of Arctic Flora and Fauna (Caff) Map No. 1; U.S. Fish and Wildlife Service: Anchorage, AK, USA, 2003.
- Walker, D.; Raynolds, M.; Daniels, F.J.A.; Einarsson, E.; Elvebakk, A.; Gould, W.A.; Katenin, A.E.; Kholod, S.S.; Markon, C.J.; Yurstev, B.A. The Circumpolar Arctic Vegetation Map. J. Veg. Sci. 2005, 16, 267–282. [Google Scholar] [CrossRef]
- Murray, D.F. Vegetation, floristics, and phytogeography of northern Alaska. In Vegetation and Production Ecology of an Alaskan Arctic Tundra; Tieszen, L.L., Ed.; Springer-Verlag: New York, NY, USA, 1978; pp. 19–36. [Google Scholar]
- Walker, M.D.; Walker, D.; Auerbach, N.A. Plant communities of a tussock tundra landscape in the Brooks Range foothills, Alaska. J. Veg. Sci. 1994, 5, 843–866. [Google Scholar] [CrossRef]
- Shaver, G.R.; Chapin, F.S. Production: Relationships and element cycling in contrasting arctic vegetation types. Ecol. Monogr. 1991, 61, 1–31. [Google Scholar] [CrossRef]
- Walker, D.; Bockheim, J.G.; Chapin, F.S.; Eugster, W.; Nelson, F.; Ping, C.L. Calcium-rich tundra, wildlife, and the “mammoth steppe”. Quat. Sci. Rev. 2001, 20, 149–163. [Google Scholar] [CrossRef]
- Walker, D.; Auerbach, N.A.; Bockheim, J.G.; Chapin, F.S.; Eugster, W.; King, J.Y.; McFadden, J.P.; Michaelson, G.J.; Nelson, F.; Oechel, W.C.; et al. Energy and trace-gas fluxes across a soil pH boundary in the Arctic. Nature 1998, 394, 469–472. [Google Scholar] [CrossRef]
- Walker, D.; Auerbach, N.A.; Shippert, M. NDVI, biomass, and landscape evolution of glaciated terrain in northern Alaska. Polar Rec. 1995, 31, 169–178. [Google Scholar] [CrossRef]
- Raynolds, M.; Walker, D. Effects of deglaciation on circumpolar distribution of arctic vegetation. Can. J. Remote Sens. 2009, 35, 118–129. [Google Scholar] [CrossRef]
- Bliss, L.C.; Matveyeva, N.V. Circumpolar arctic vegetation. In Arctic Ecosystems in a Changing Climate; Chapin, F.S., III, Jefferies, R.L., Reynolds, A., Shaver, G.R., Svoboda, J., Eds.; Academic Press, Inc.: San Diego, CA, USA, 1992. [Google Scholar]
- Tenhunen, J.D.; Lange, O.L.; Hahn, S.; Siegwolf, R.; Oberbauer, S.F. The ecosystem role of poikilohydric tundra plants. In Arctic Ecosystems in a Changing Climate: An Ecosphysiological Perspective; Chapin, F.S., III, Jefferies, R.L., Reynolds, J.F., Shaver, G.R., Eds.; Academic Press, Inc.: San Diego, CA, USA, 1992; pp. 213–239. [Google Scholar]
- Epstein, H.E.; Calef, M.P.; Walker, M.D.; Chapin, F.S., III; Starfield, A.M. Detecting changes in arctic tundra plant communities in response to warming over decadal time scales. Glob. Chang. Biol. 2004, 10, 1325–1334. [Google Scholar] [CrossRef]
- McGuire, A.D. Arctic transitions in the land-atmosphere system (atlas): Background, objectives, results, and future directions. J. Geophys. Res. 2003, 108. [Google Scholar] [CrossRef]
- Walker, D.A.; Jia, G.J.; Epstein, H.E.; Raynolds, M.K.; Chapin, F.S., III; Copass, C.; Hinzman, L.D.; Knudson, J.A.; Maier, H.A.; Michaelson, G.J.; et al. Vegetation-soil-thaw-depth relationships along a low-arctic bioclimate gradient, Alaska: Synthesis of information from the ATLAS studies. Permafr. Periglac. Process. 2003, 14, 103–123. [Google Scholar] [CrossRef]
- Epstein, H.E.; Walker, D.A.; Raynolds, M.K.; Jia, G.J.; Kelley, A.M. Phytomass patterns across a temperature gradient of the North American arctic tundra. J. Geophys. Res. 2008, 113. [Google Scholar] [CrossRef]
- Chapin, F.S.; Shaver, G.R.; Giblin, A.E.; Nadelhoffer, K.J.; Laundre, J.A. Responses of arctic tundra to experimental and observed changes in climate. Ecology 1995, 76, 694–711. [Google Scholar]
- Hobbie, S.E.; Shevtsova, A.; Chapin, F.S., III. Plant responses to species removal and experimental warming in Alaskan tussock tundra. Oikos 1999, 84, 417–434. [Google Scholar] [CrossRef]
- Atlas Project Website. Available online: http://www.eol.ucar.edu/projects/atlas/ivotuk_cd/html/IvotukFrameset.htm (accessed on 1 September 2015).
- Kade, A.; Walker, D.A.; Raynolds, M.K. Plant communities and soils in cryoturbated tundra along a bioclimate gradient in the low arctic, Alaska. Phytocoenologia 2005, 35, 761–820. [Google Scholar] [CrossRef]
- Raynolds, M.K.; Walker, D.A.; Munger, C.A.; Vonlanthen, C.M.; Kade, A.N. A map analysis of patterned-ground along a North American arctic transect. J. Geophys. Res. 2008, 113. [Google Scholar] [CrossRef]
- Walker, D.; Kuss, P.; Epstein, H.E.; Kade, A.N.; Vonlanthen, C.M.; Raynolds, M.; Daniëls, F.J.A. Vegetation of zonal patterned-ground ecosystems along the North America Arctic bioclimate gradient. Appl. Veg. Sci. 2011, 14, 440–463. [Google Scholar] [CrossRef]
- Walker, D.; Epstein, H.E.; Romanovsky, V.E.; Ping, C.L.; Michaelson, G.J.; Daanen, R.P.; Shur, Y.L.; Peterson, R.A.; Krantz, W.B.; Raynolds, M.; et al. Arctic patterned-ground ecosystems: A synthesis of field studies and models along a North American Arctic Transect. J. Geophys. Res. 2008, 113, 1–17. [Google Scholar] [CrossRef]
- Strauss, J.; Buchhorn, M. Expeditions to the Permafrost 2012: Alaskan North Slope/Itkilik, thermokarst in Central Yakutia, EyeSight-NAAT-Alaska; Alfred-Wegener-Institut für Polar-und Meeresforschung: Bremerhaven, Germany, 2012. [Google Scholar]
- Clark, R.N.; Roush, T.L. Reflectance spectroscopy: Quantitative analysis techniques for remote sensing applications. J. Geophys. Res. 1984, 89, 6329–6340. [Google Scholar] [CrossRef]
- Kokaly, R.F.; Skidmore, A.K. Plant phenolics and absorption features in vegetation reflectance spectra near 1.66 μm. Int. J. Appl. Earth Obs. Geoinform. 2015. [Google Scholar] [CrossRef]
- Marshall, G.J.; Thenkabail, P. Biomass modeling of four leading world crops using hyperspectral narrowbands in support of HyspIRI mission. Photogramm. Eng. Remote Sens. 2014, 80, 757–772. [Google Scholar] [CrossRef]
- Hughes, M. On the mean accuracy of statistical pattern recognizers. IEEE Trans. Inf. Theory 1968, 14, 55–63. [Google Scholar] [CrossRef]
- Chung, D.; Chun, H.; Keles, S. Spls: Sparse Partial Least Squares (spls) Regression and Classification; R Package Vignette: Madison, WI, USA, 2013. [Google Scholar]
- Chun, H.; Keles, S. Sparse partial least squares regression for simultaneous dimension reduction and variable selection. J. Royal Stat. Soc. Ser. B (Methodol.) 2010, 72, 3–25. [Google Scholar] [CrossRef] [PubMed]
© 2016 by the authors; licensee MDPI, Basel, Switzerland. This article is an open access article distributed under the terms and conditions of the Creative Commons by Attribution (CC-BY) license (http://creativecommons.org/licenses/by/4.0/).
Share and Cite
Bratsch, S.N.; Epstein, H.E.; Buchhorn, M.; Walker, D.A. Differentiating among Four Arctic Tundra Plant Communities at Ivotuk, Alaska Using Field Spectroscopy. Remote Sens. 2016, 8, 51. https://doi.org/10.3390/rs8010051
Bratsch SN, Epstein HE, Buchhorn M, Walker DA. Differentiating among Four Arctic Tundra Plant Communities at Ivotuk, Alaska Using Field Spectroscopy. Remote Sensing. 2016; 8(1):51. https://doi.org/10.3390/rs8010051
Chicago/Turabian StyleBratsch, Sara N., Howard E. Epstein, Marcel Buchhorn, and Donald A. Walker. 2016. "Differentiating among Four Arctic Tundra Plant Communities at Ivotuk, Alaska Using Field Spectroscopy" Remote Sensing 8, no. 1: 51. https://doi.org/10.3390/rs8010051
APA StyleBratsch, S. N., Epstein, H. E., Buchhorn, M., & Walker, D. A. (2016). Differentiating among Four Arctic Tundra Plant Communities at Ivotuk, Alaska Using Field Spectroscopy. Remote Sensing, 8(1), 51. https://doi.org/10.3390/rs8010051