Article

Improved Band-to-Band Registration Characterization for VIIRS Reflective Solar Bands Based on Lunar Observations

1
Science Systems and Applications Inc., 10210 Greenbelt Road, Greenbelt, MD 20706, USA
2
Sciences and Exploration Directorate, NASA GSFC, Greenbelt, MD 20771, USA
*
Author to whom correspondence should be addressed.
Remote Sens. 2016, 8(1), 27; https://doi.org/10.3390/rs8010027
Submission received: 20 October 2015 / Revised: 8 December 2015 / Accepted: 25 December 2015 / Published: 31 December 2015
(This article belongs to the Collection Visible Infrared Imaging Radiometers and Applications)

Abstract

:
Spectral bands of the Visible Infrared Imaging Radiometer Suite (VIIRS) instrument aboard the Suomi National Polar-orbiting Partnership (S-NPP) satellite are spatially co-registered. The accuracy of the band-to-band registration (BBR) is one of the key spatial parameters that must be characterized. Unlike its predecessor, the Moderate Resolution Imaging Spectroradiometer (MODIS), VIIRS has no on-board calibrator specifically designed to perform on-orbit BBR characterization. To circumvent this problem, a BBR characterization method for VIIRS reflective solar bands (RSB) based on regularly-acquired lunar images has been developed. While its results can satisfactorily demonstrate that the long-term stability of the BBR is well within ±0.1 moderate resolution band pixels, undesired seasonal oscillations have been observed in the trending. The oscillations are most obvious between the visible/near-infrared bands and short-/middle wave infrared bands. This paper investigates the oscillations and identifies their cause as the band/spectral dependence of the centroid position and the seasonal rotation of the lunar images over calibration events. Accordingly, an improved algorithm is proposed to quantify the rotation and compensate for its impact. After the correction, the seasonal oscillation in the resulting BBR is reduced from up to 0.05 moderate resolution band pixels to around 0.01 moderate resolution band pixels. After removing this spurious seasonal oscillation, the BBR, as well as its long-term drift are well determined.

Graphical Abstract

1. Introduction

The Visible Infrared Imaging Radiometer Suite (VIIRS) is a remote sensing instrument aboard the Suomi National Polar-orbiting Partnership (S-NPP) satellite and provides measurements of large-scale global dynamics in the oceans, on the land and in the lower atmosphere [1]. As a passive whiskbroom imaging spectroradiometer, VIIRS captures data in 15 reflective solar bands (RSB), including a panchromatic day/night band (DNB) and seven thermal emissive bands (TEB), covering a spectral range from 0.4 to 12.5 µm [2]. VIIRS was designed and built by the same instrument vendor as the Moderate resolution Imaging Spectroradiometer (MODIS) on board the NASA EOS Terra and Aqua satellites, for which it is the follow-on instrument [3]. The operation and calibration strategy of VIIRS has been largely inherited from MODIS [4].
VIIRS detectors have two spatial resolutions: the nominal ground pixel sizes at nadir are 375 m for the imaging (I) Bands I1–I5 and 750 m for the moderate (M) resolution Bands M1–M16, respectively. The M and I bands are located on three separate focal plane assemblies (FPA): the visible/near-infrared (VIS/NIR), the short-wave and mid-wave infrared (S/MWIR) and the long-wave infrared (LWIR). The bands are positioned in parallel, slightly separated from each other in the along-scan direction, as shown in Figure 1. The detectors in each band are aligned in the along-track direction. Through a band-dependent time delay, the Earth view images of all of these bands are spatially co-registered. The residual misalignments after co-registration are quantified by the band-to-band registration (BBR). The DNB uses a separate FPA and is not co-registered with other RSB bands. Therefore, it is excluded from the following discussion.
Figure 1. VIIRS band layout on (a) VIS/NIR; (b) short-wave and mid-wave infrared (S/MWIR) and (c) long-wave infrared (LWIR) focal plane assemblies (FPA) [2].
Remotesensing 08 00027 g001
BBR is a key performance parameter in VIIRS spatial characterization. The VIIRS BBR was characterized in a series of pre-launch tests [5,6]. There is no on-board calibrator, such as MODIS’s Spectroradiometric Calibration Assembly (SRCA) [7], to monitor the on-orbit BBR for VIIRS. Therefore, alternative approaches using remote targets have been developed, with the general idea of calculating the BBR offset between any two bands by measuring the shift between their images of the same target. Various approaches using Earth view data [8,9,10] or the lunar images have been proposed [11,12,13]. Compared to the Earth view data, lunar data are available much less frequently and cover a limited scan-angle range, because the Moon is only viewed at a fixed scan angle corresponding to the space view (SV) port. However, the surface property of the Moon is both spatially and radiometrically stable in the long run. In addition, lunar images are not blurred by atmospheric scattering [14]. Therefore, the shift measured by the lunar images is impacted by less dynamic error sources than Earth view images.
The shift between images can be measured in different ways, such as mutual information [9] or centroid. The lunar centroid approach was developed for MODIS and has been adapted to VIIRS. This paper continues the effort of our group to further improve the algorithm. While previous BBR results from the lunar centroid approach are good enough to demonstrate that the on-orbit BBR for the RSB has been stable and meets the sensor design requirement, there is an apparent band- or wavelength-dependent seasonal oscillation of up to 0.05 M band pixels observed in the BBR trending, which is more like an error instead of actual BBR oscillation [11]. The cause of the oscillation is diagnosed, and a correction based on the study is applied, which significantly reduces the oscillation in the updated BBR trending.

2. VIIRS Lunar Calibration

The Moon has been widely used as a target for on-orbit calibration and characterization of remote sensing instruments for its long-term stability. Regular VIIRS lunar observations are scheduled primarily for the validation of its RSB radiometric calibration stability [15]. The lunar irradiance strongly depends on the illumination and view geometries, especially the lunar phase or the Moon-to-Earth-to-VIIRS angle. To minimize the brightness variation, VIIRS lunar calibrations are scheduled only when the phase is within a small angular range from −51.5 to −50.5 degrees. A spacecraft roll maneuver is usually performed for each lunar calibration to ensure the Moon is viewed through the SV port at an elevation angle of 24.325 degrees below the instrument X-Y plane, which is the plane perpendicular to the nadir direction. The observations can only be scheduled around once a month. Limited by the satellite orbit and allowed roll angle range, the observations cannot be scheduled for three to four months each year. From the launch of VIIRS in late 2011 to September 2015, 33 scheduled lunar observations have been successfully performed.
Figure 1 shows the layout of VIIRS spectral bands on the FPA. Each I band has 32 detectors, and each M band has 16 detectors. In the along-scan direction, the I bands are sampled at twice the frequency of the M bands. An M band image pixel is registered with 2 by 2 I band image pixels. During the scheduled lunar calibration, a data sector rotation is applied, so the Moon image captured through the SV port is actually read out at the center of the Earth view sector. In this zone, the I bands and the single gain M bands (M6, M8–M12, M14–M16) are spatially aggregated onboard every three samples in the along-scan direction by the instrument. For the dual-gain M bands, the same aggregation strategy is applied in ground processing for consistency. After aggregation, an image pixel is of a nearly square shape with a size of 750 m × 750 m. The diameters of the lunar images are approximately 20 pixels for I bands and 10 pixels for M bands, depending on the VIIRS-Moon distances at the time of lunar calibration.
During a lunar calibration event, the Moon moves relative to the field of view (FOV) of the FPA along its track direction. Figure 2 shows the scan-by-scan Band I1 images acquired from the entire SV data sector during the April 2015 lunar calibration. The horizontal direction is the along-scan direction with a width of 96 frames; the vertical direction is the along-track direction with a height of 32 detectors. The illuminated fraction of the Moon at a phase of −51 degrees is about 81.5%. The orientations of the gibbous Moon change with calibration events, which is determined by the position and pointing direction of VIIRS relative to the Moon. The detector response is output as a 12-bit digital number (DN). The lunar images DN must have the dark reference subtracted on a scan-by-scan basis. The subtracted value is then corrected for the detector gain using the instrument temperature-dependent coefficients determined from the pre-launch measurement and the F-factor derived on-orbit using the on-board solar diffuser and the response versus scan (RVS) angle [16]. The result is the 2D radiance profile of the lunar surface.
Figure 2. Scan-by-scan Band I1 images during the April 2015 lunar calibration: the horizontal direction is the along-scan direction; the vertical direction is the along-track direction. The symbols in the lower left corner mark those scans with complete lunar images (not being cut-off by the top or bottom edge of the FPA).
Remotesensing 08 00027 g002

3. Lunar BBR Algorithm

3.1. Current Algorithm

The design specification of the VIIRS BBR is based on the overlapping fraction of the matching detectors between two bands. It can also be quantified by the relative offsets between the matching detectors in both the along-scan and along-track directions [5]. These two forms of expression are related by:
A ( 1 B B R s c a n ) ( 1 B B R t r a c k )
where BBRscan and BBRtrack are the offset in units of pixels in the along-scan and along-track directions, respectively. They are calculated for each detector. The results in this paper are presented using their band-averaged values.
In the lunar centroid approach, the centroid of the lunar radiance profiles in the along-scan direction is calculated by:
X B , D = f ( s L B , D ) f f s L B , D *
where L is the retrieved radiance of each pixel. f is the frame/sample number, and s is the scan number. B and D are the notations for band and detector, respectively. The centroid in the along-track direction is calculated by:
Y B , D = s ( f L B , D ) s s f L B , D
Ignoring the band dependence of the lunar centroid, the BBR offset between two bands is calculated by:
B B R s c a n = X B 1 , D ¯ X B 2 , D ¯ ; B B R t r a c k = ( Δ Y B 1 , D ¯ Δ Y B 2 , D ¯ ) / β
where β is the so-called oversampling factor. Because the moving speed of the satellite and the instantaneous field of view (IFOV) of the detector are not synchronized, VIIRS swaths on the lunar surface overlap along the track direction from scan to scan. β is defined as the number of scans taken for a VIIRS swath to move one detector IFOV in the track direction. This factor is calculated from the ephemeris of the VIIRS and the Moon, and the details of the calculation were introduced in a separate work [17]. The factor converts the along-track shift calculated per scan in Equation (3) to per IFOV or image pixel.
For VIIRS, the unit of the BBR result used in this paper is an M-band pixel. For the convenience of the users, it is sometimes converted to meters on the Earth ground by multiplying by the spatial resolution of the pixel on the ground at nadir, which is approximately 750 m for M bands. Figure 3 shows the BBR trending generated using the current approach, with Band I1 as the reference. The plot shows that the BBR for all RSBs have been stable since launch with values of less than 0.05 pixels in both the along-scan and along-track directions; some small drifts were observed.
Figure 3. Band-to-band registration (BBR) results using current the centroid approach in both the (a) along-scan and (b) along-track directions, referenced to Band I1.
Remotesensing 08 00027 g003

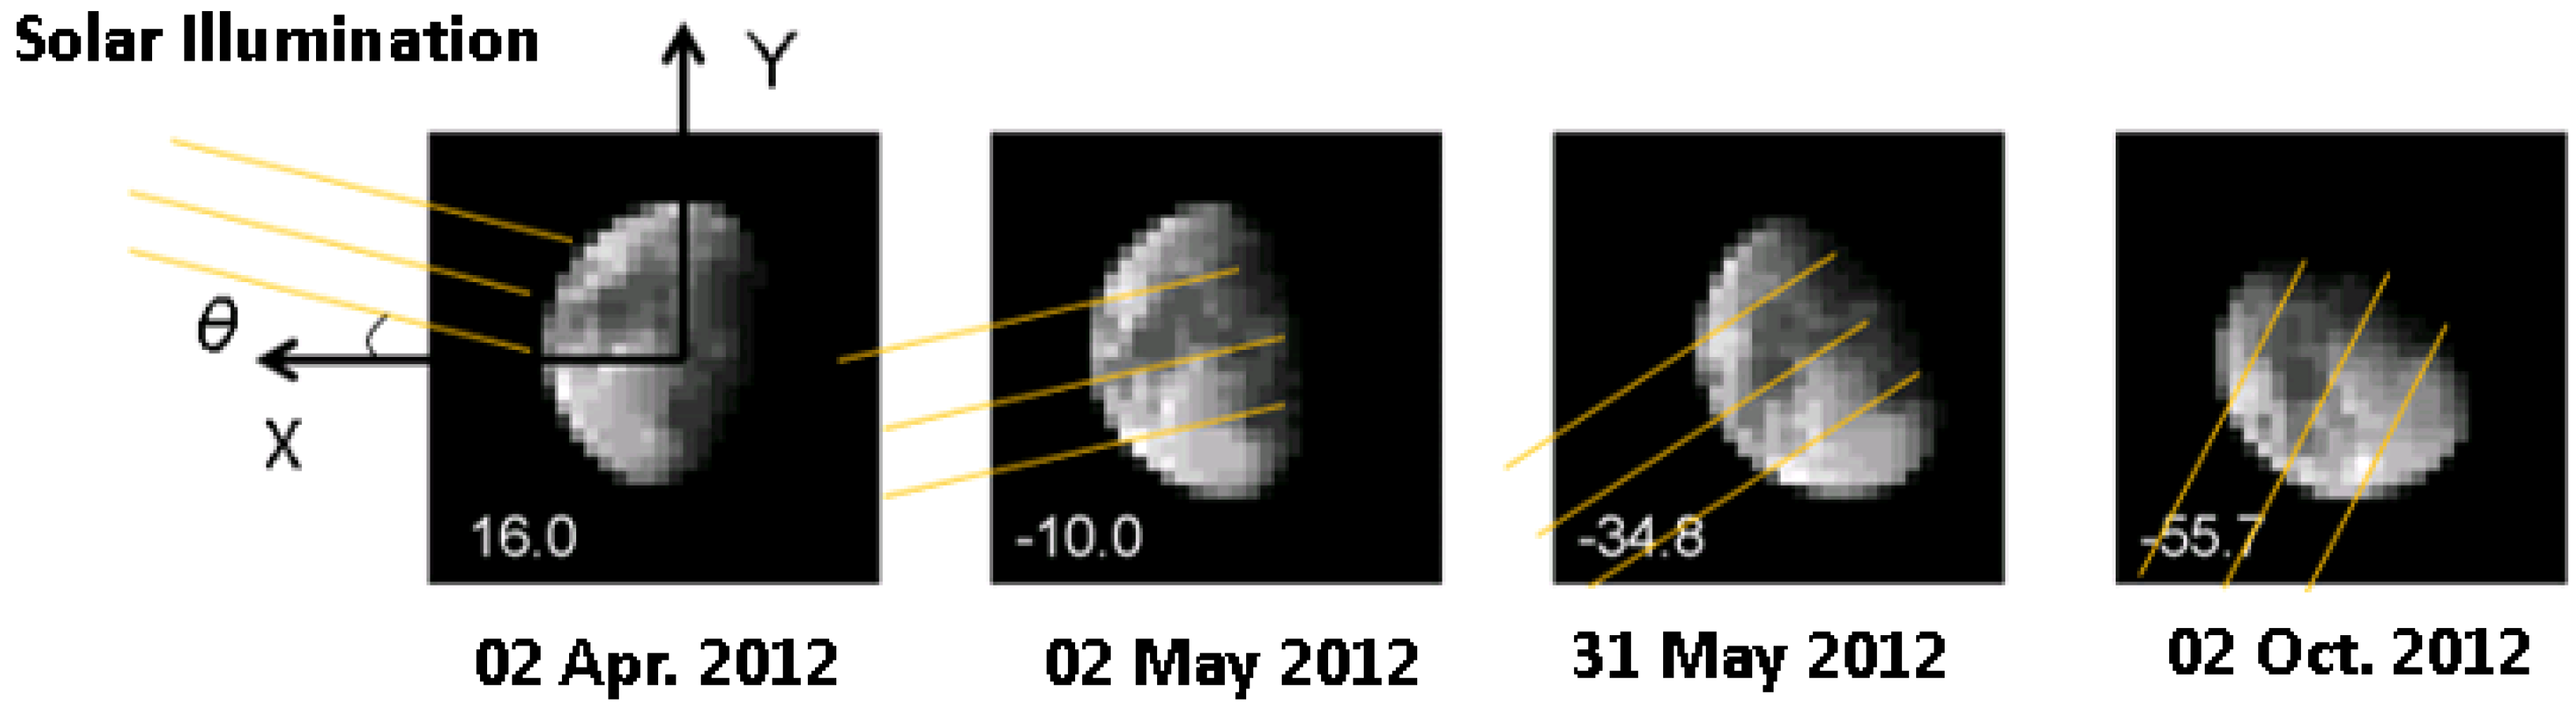
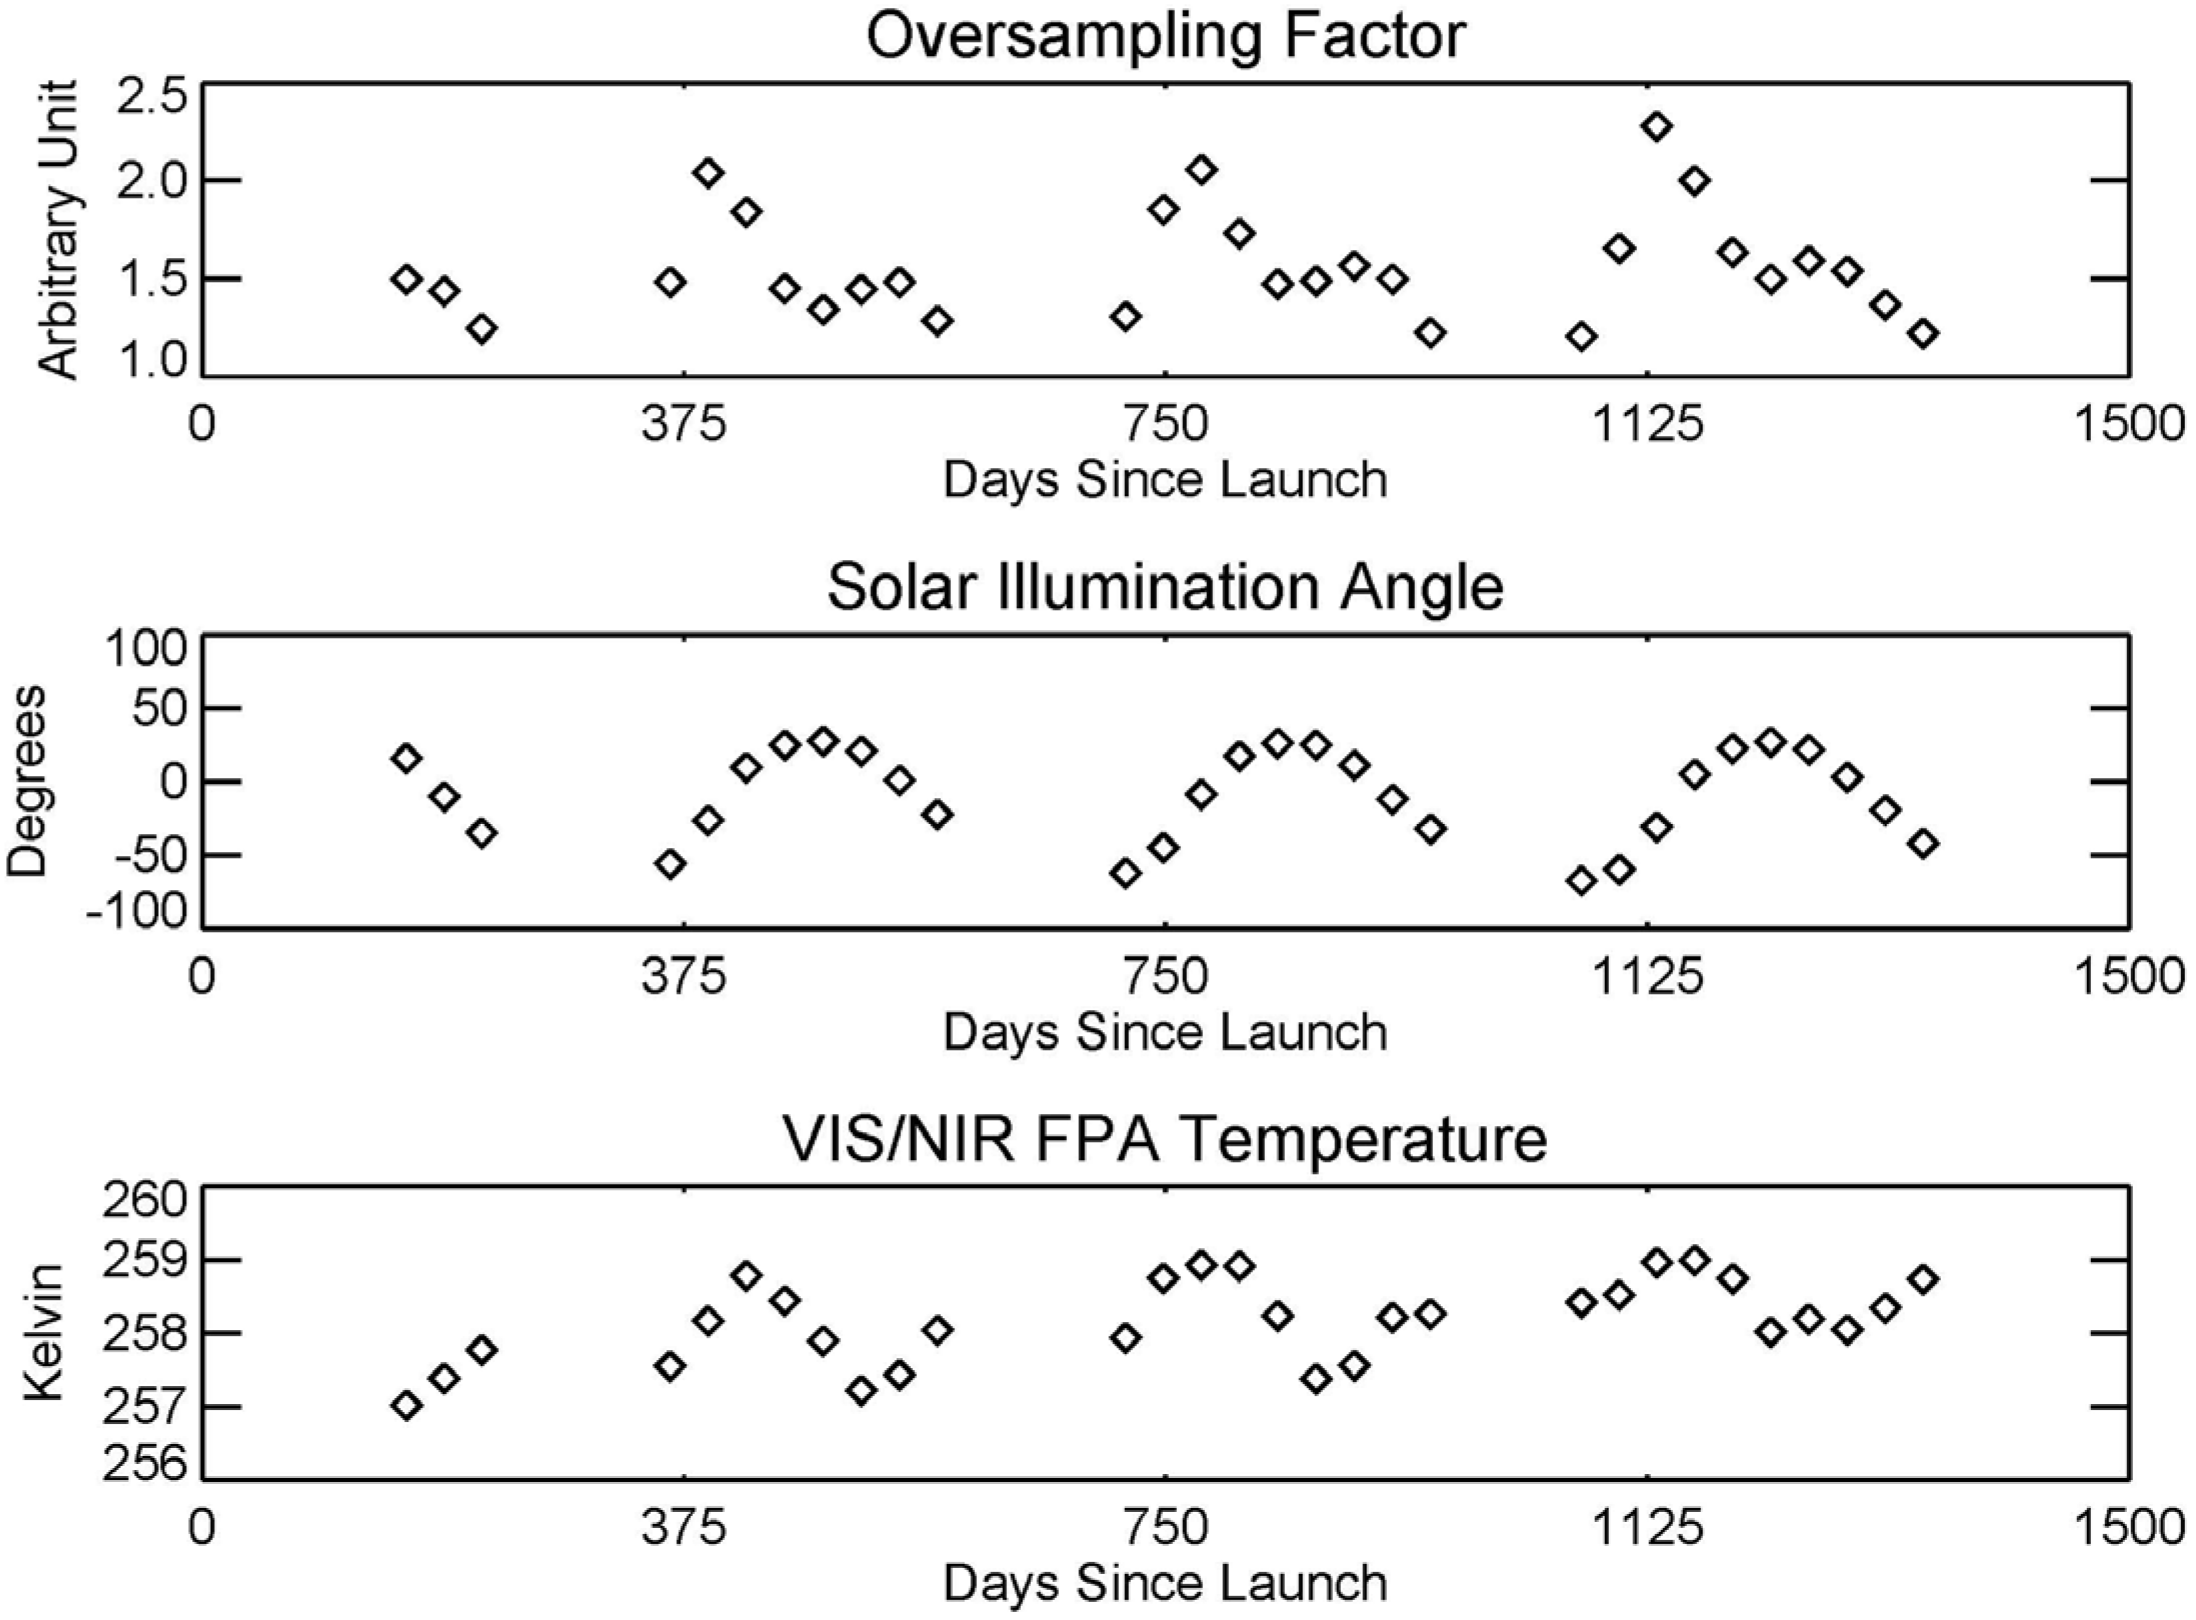
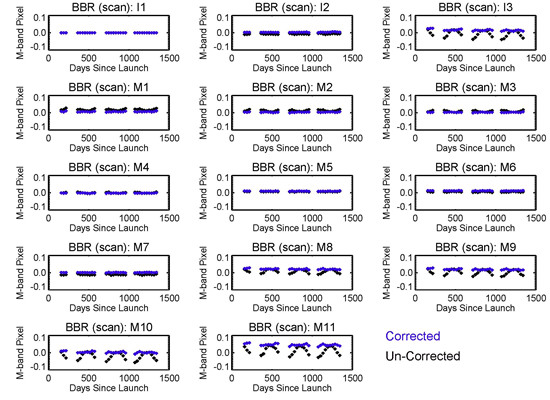
3.2. Impact of Lunar Image Rotation on BBR Results

Band- or wavelength-dependent seasonal oscillation patterns are observed in Figure 3. As the center wavelength difference relative to Band I1 increases, the amplitude of the BBR oscillation increases from Band M7 to M11. I2/M7 (865 nm) and I3/M10 (1610 nm) are two band pairs that have almost identical center wavelengths, and their BBR trending is very similar.
Further investigation has related the oscillation to the wavelength-dependence of the image centroids. The current approach assumes that the offset between the centroids of two bands in Equation (4) is solely caused by BBR offset. The actual centroid positions are actually wavelength dependent. Each plot in Figure 4a is a scan of the Band I1 lunar image captured during a calibration event. For nearly identical lunar phases and a small libration effect, we can assume that the centroid positions on the Moon are almost unchanged among events. Because the lunar images rotate from event to event, the centroids of two bands, which are displaced from each other, rotate accordingly. Thus, the centroid displacement, which is denoted by a vector R, will also rotate as is illustrated in Figure 4b.
Figure 4. (a) VIIRS Band I1 lunar images of the center scans of a few lunar calibration events. Blue and red crosses illustrate the estimated positions of the centroids of two bands; (b) a sketch that shows how the measured BBR varies with the rotation of the centroid displacement vector.
Remotesensing 08 00027 g004
Therefore, the centroid differences calculated from Equation (4) are a combination of the actual BBR offset and the components of R in the along-scan and along-track direction, respectively:
B B R s c a n = B B R s c a n , a c t u a l + R sin ( θ + θ 0 )
and:
B B R t r a c k = B B R t r a c k , a c t u a l + R cos ( θ + θ 0 )
where θ is the solar illumination angle, which is newly defined in this paper. It is in reference to FPA coordinates, as is shown in Figure 5. R is the length of the R, or the distance between the centroids of the two bands. θ0 is the fixed angle between R and the illumination angle.
Figure 5. The definition of the solar illumination angle in FPA coordinates. The number at the bottom left corner of each plot is the angle for that event.
Remotesensing 08 00027 g005
The trending of the solar illumination angles for all lunar events is plotted in Figure 6, as well as the trending of the oversampling factor and VIS/NIR FPA temperatures. Compared to the BBR results of the SWIR bands in Figure 3, the correlation between the two sets of data is significant. We conclude that the centroid displacement between bands and the lunar image rotation together contribute to the majority of the seasonal oscillations observed in Figure 3.
Figure 6. The trending of the instrumental parameters related to BBR characterization.
Remotesensing 08 00027 g006

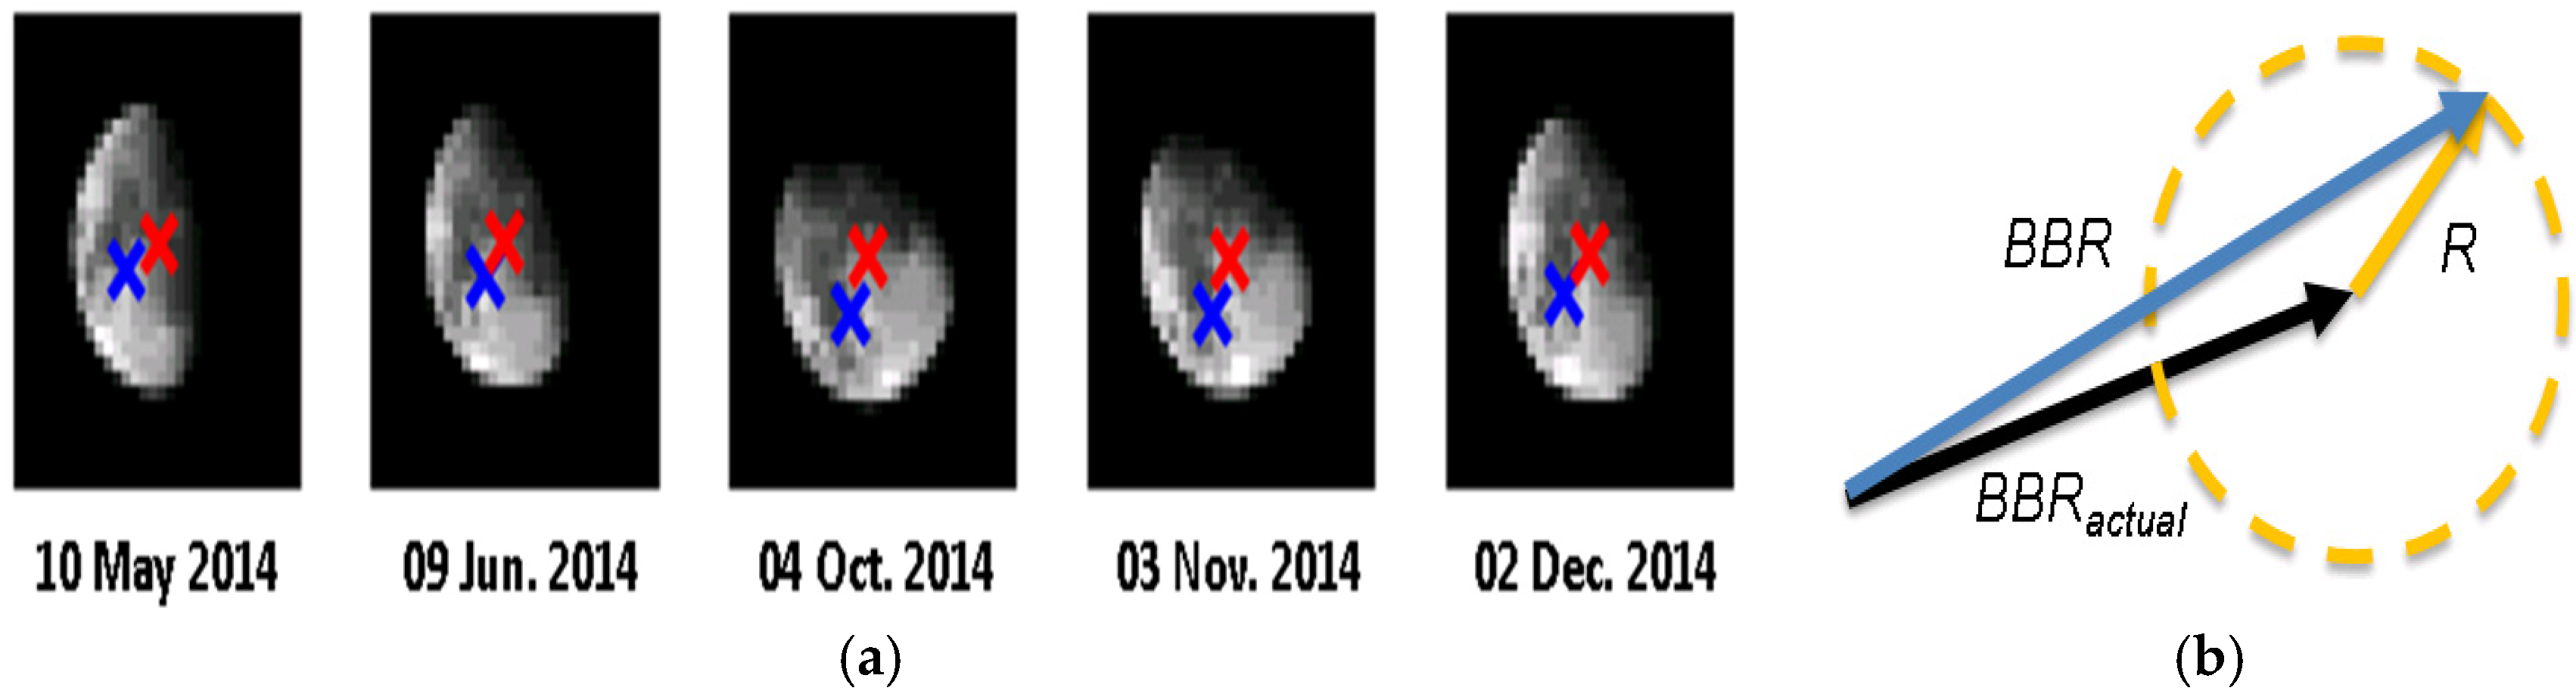
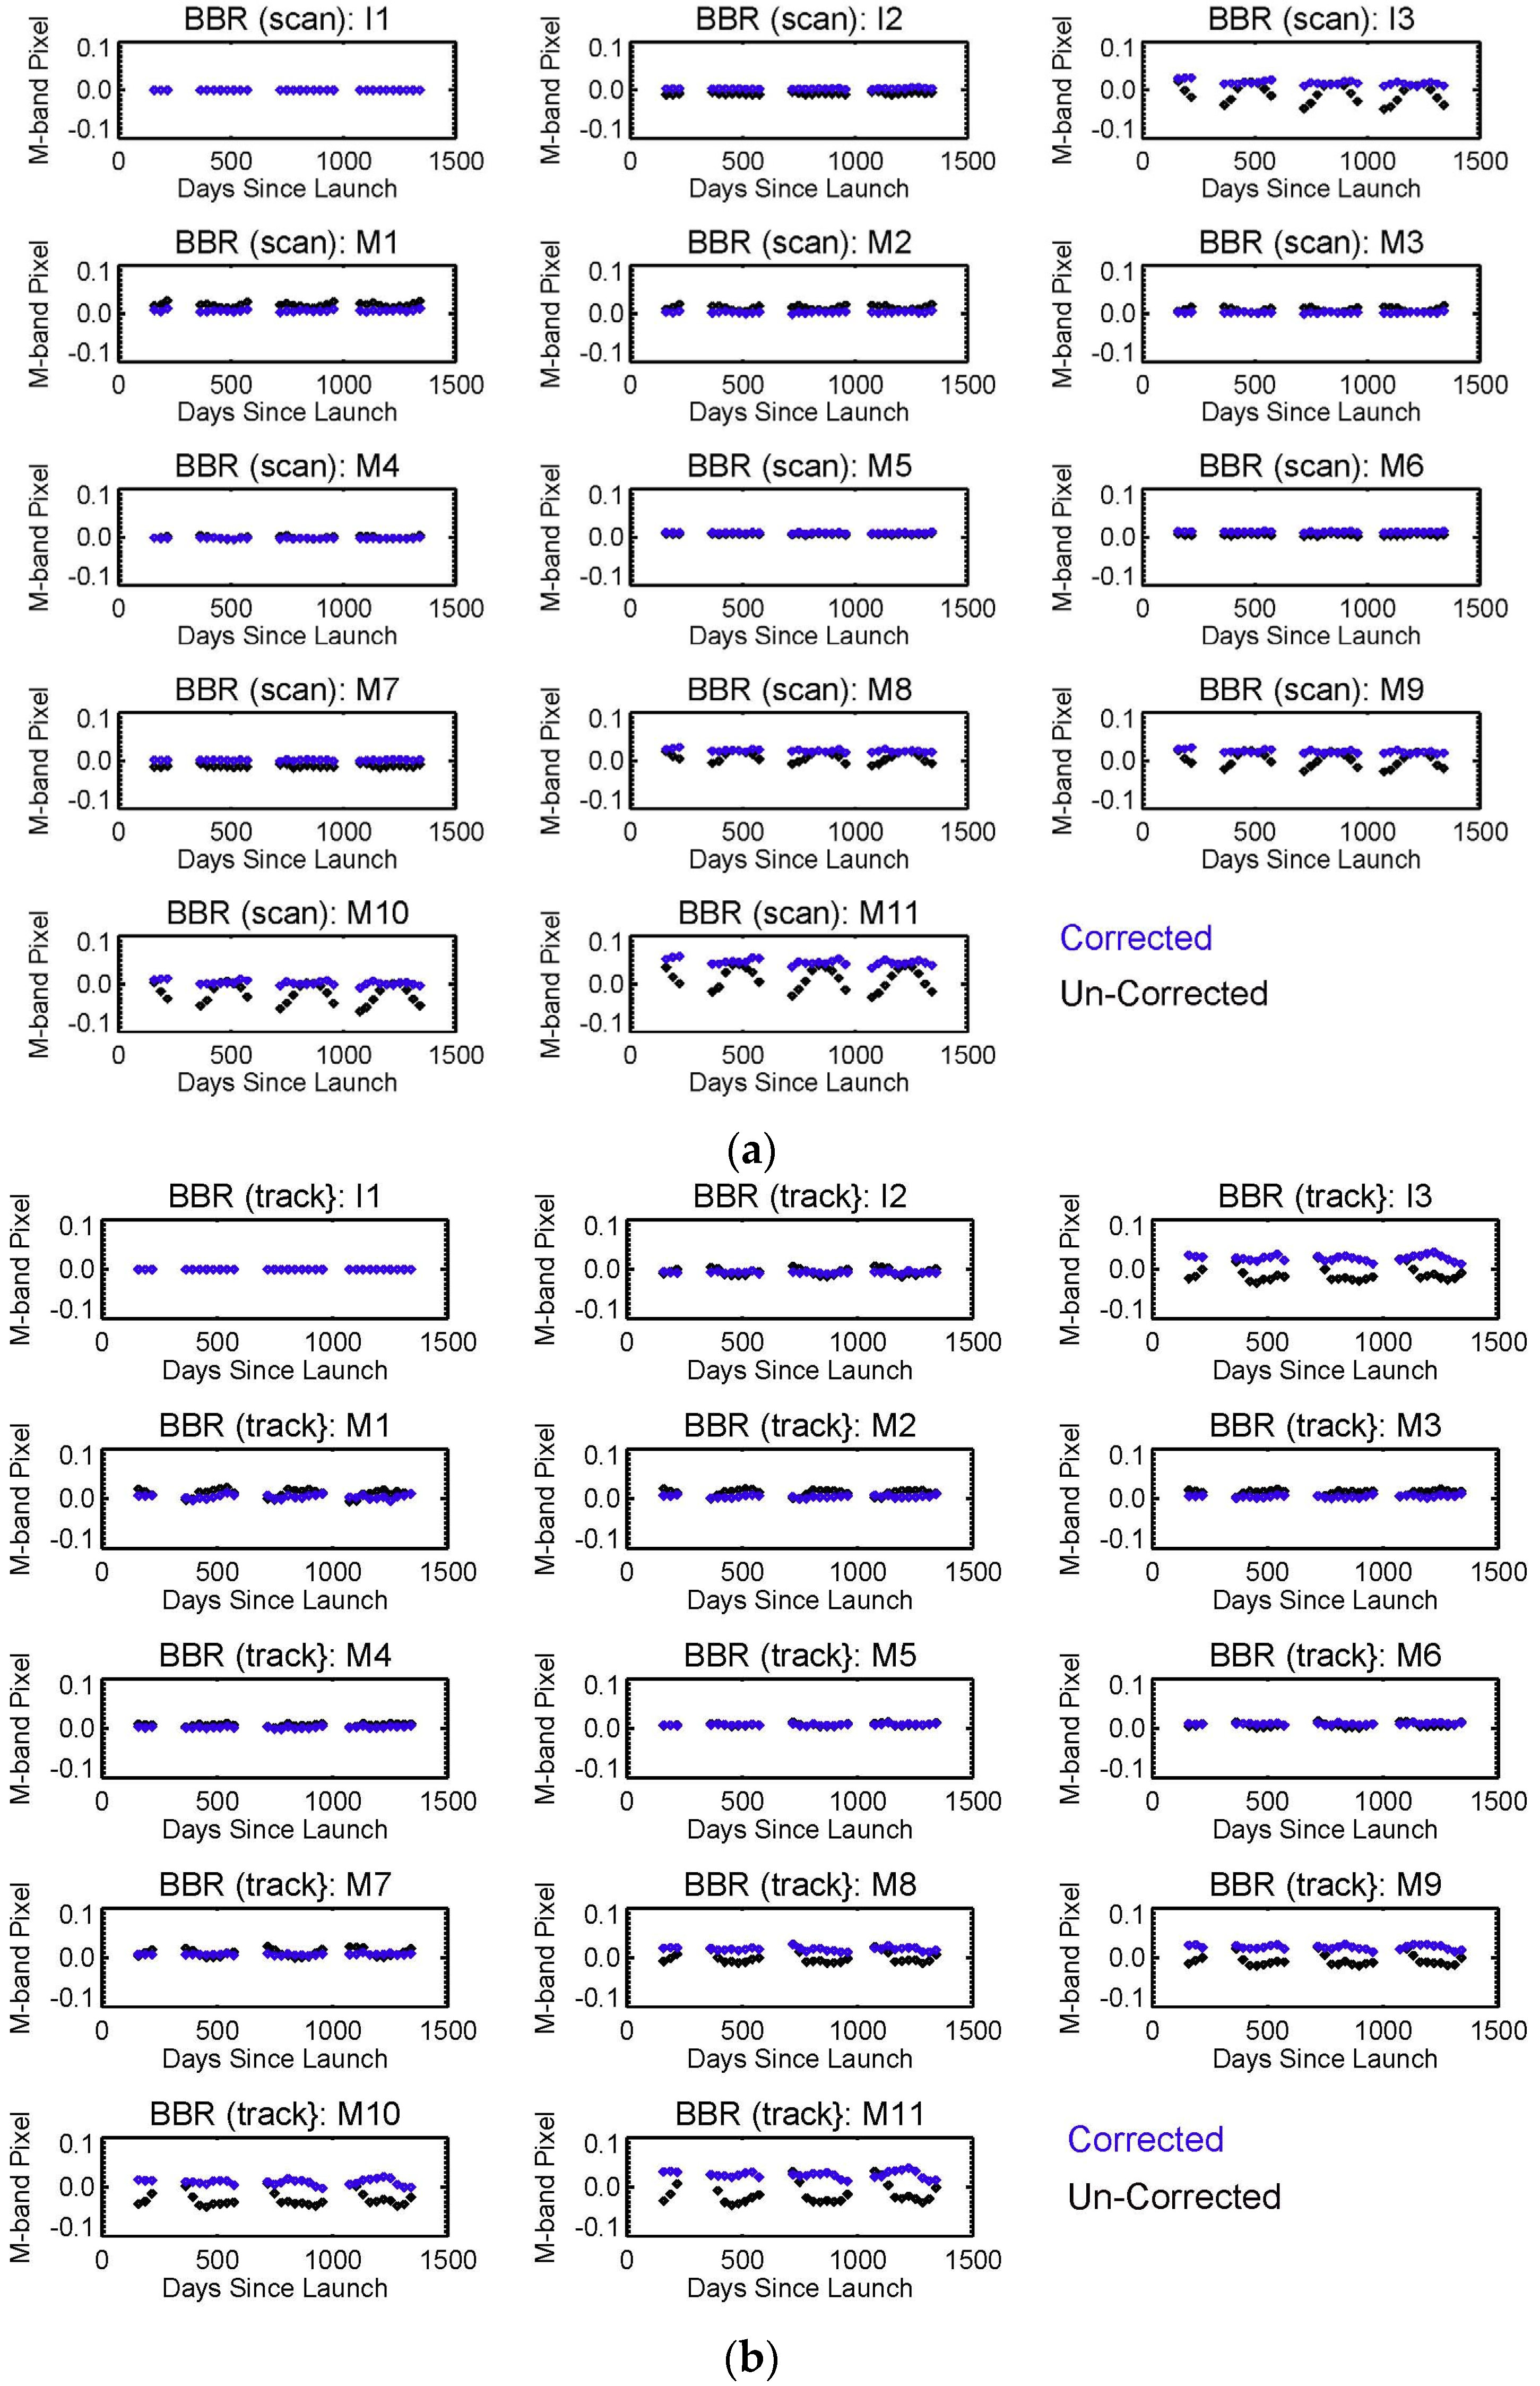
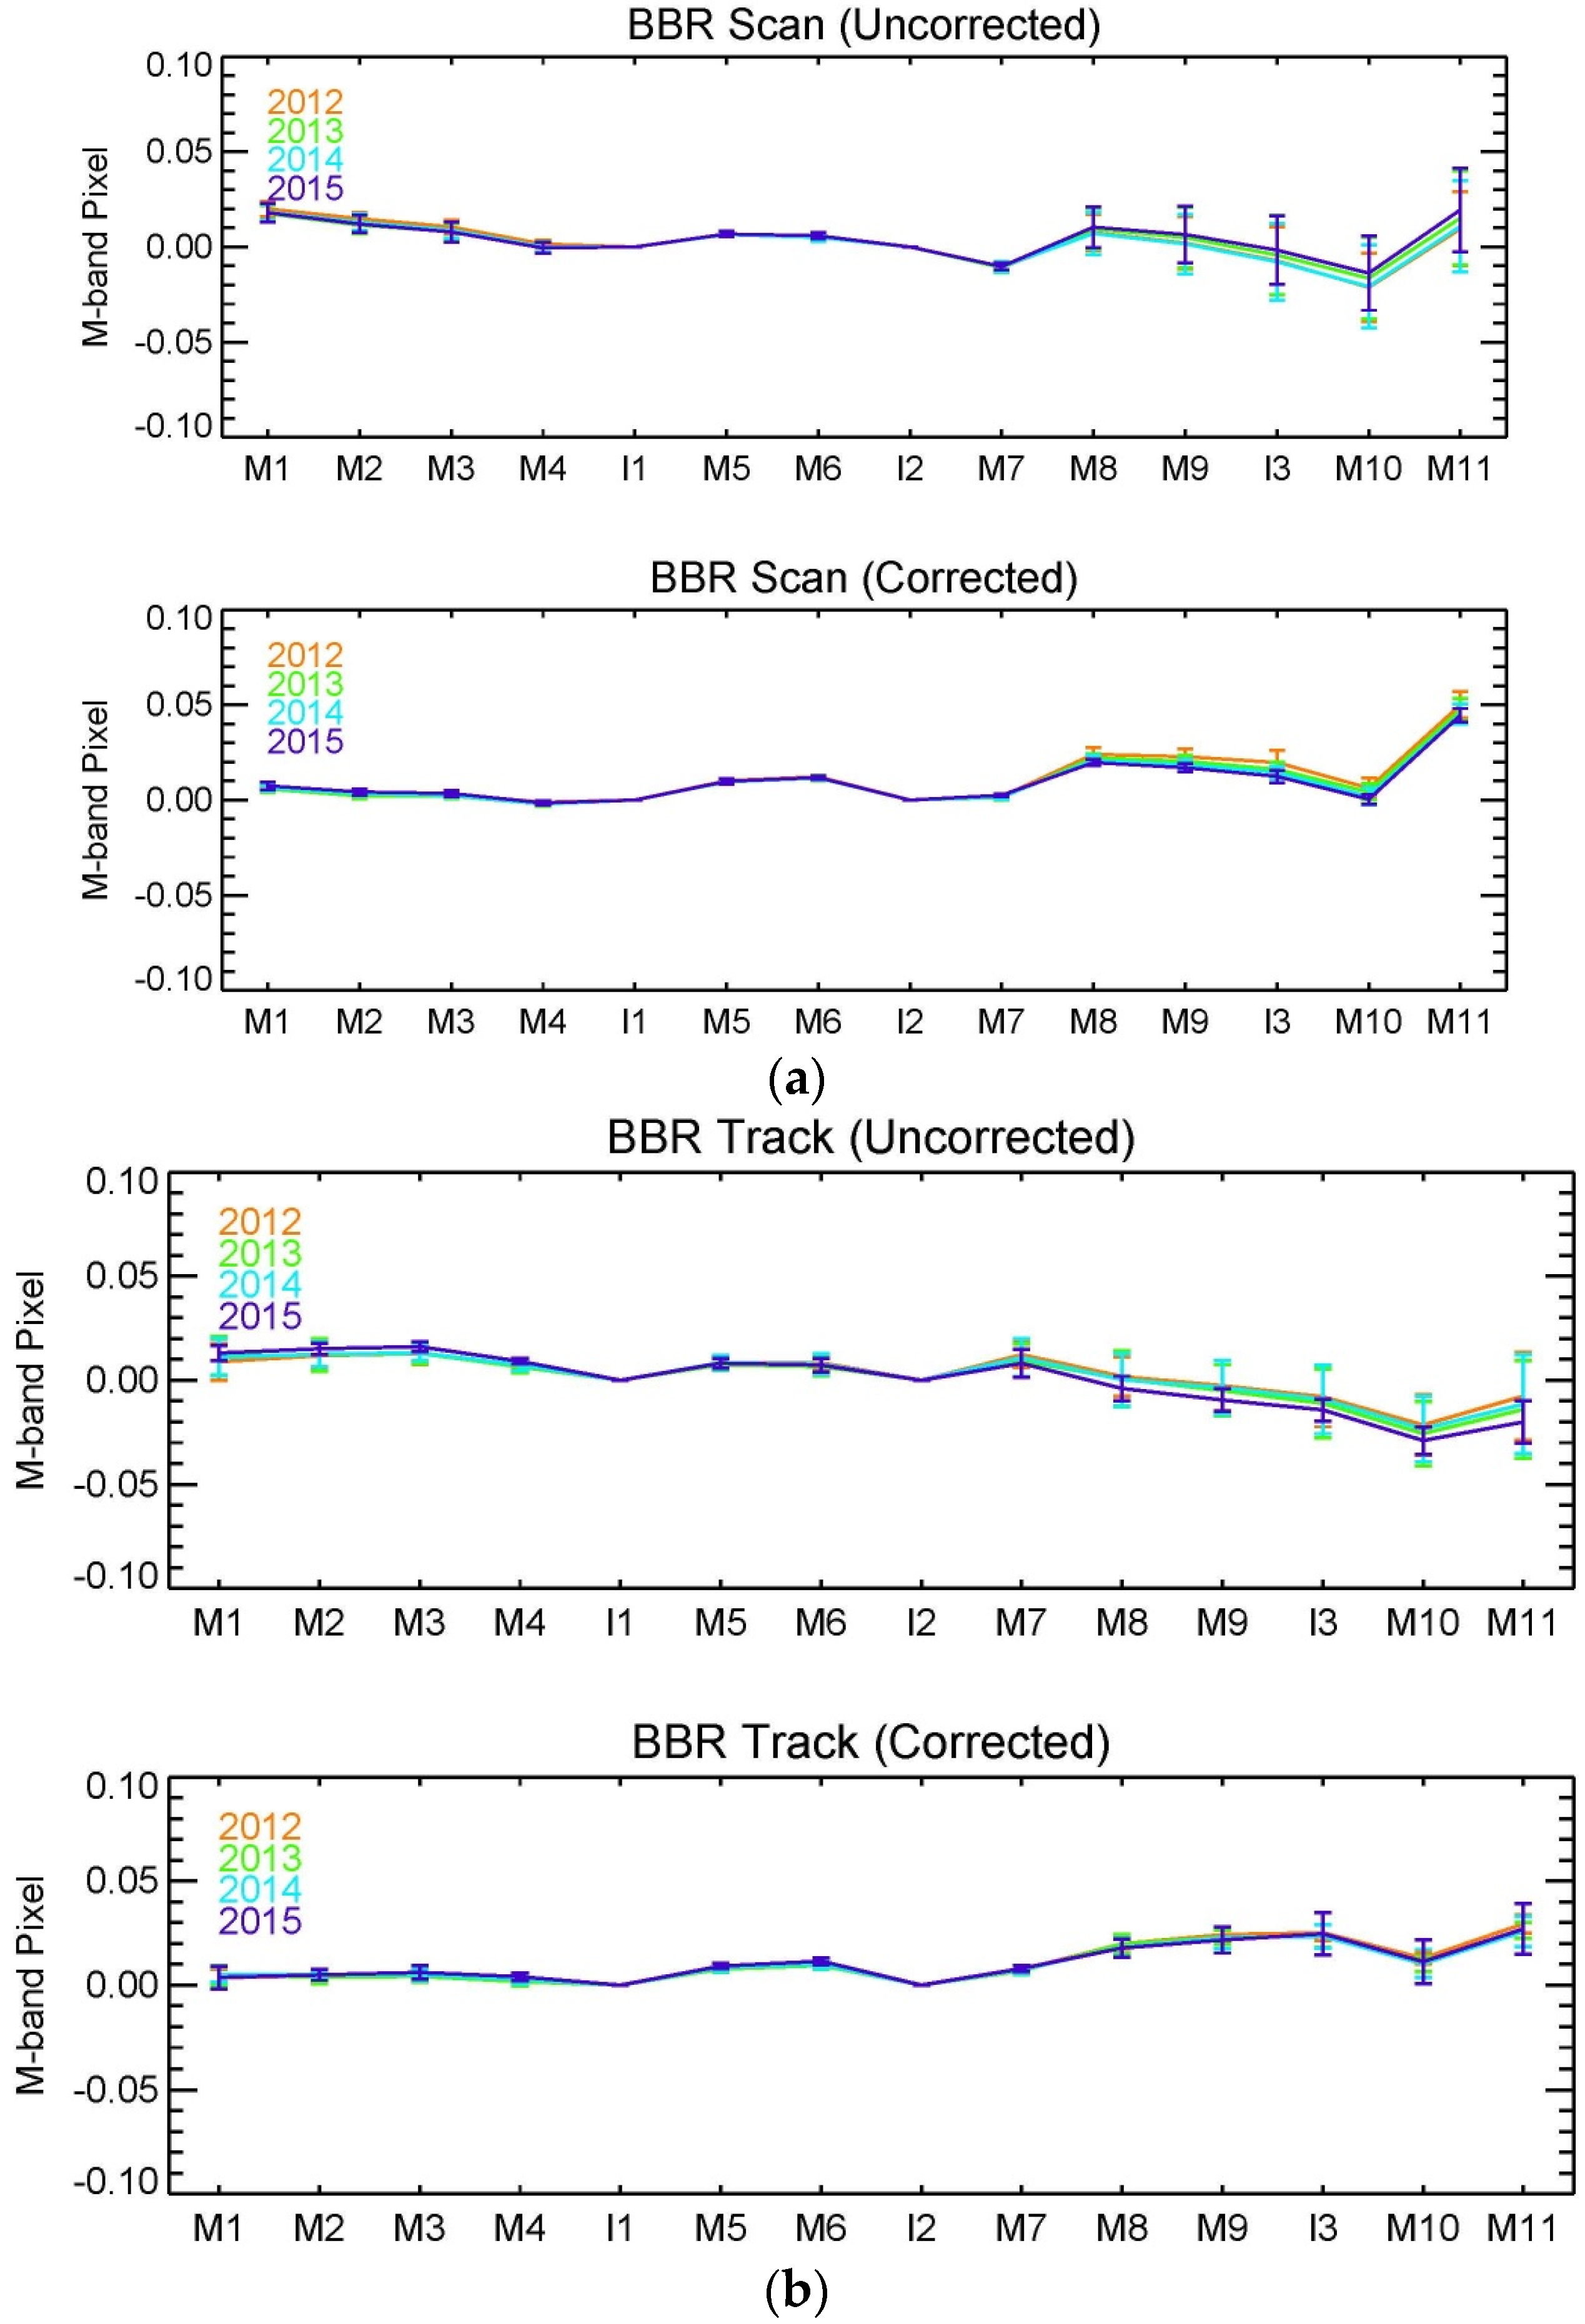
3.3. Image Rotation Correction

An improvement is proposed for the lunar centroid approach to correct the impact of the image rotation. In this proposed approach, R and θ0 are considered as unknown parameters and must be derived from lunar data themselves. We assume that the BBR offset remained unchanged in the first year after launch. Then, the lunar calibration events scheduled in this time period are used as the training dataset. Since BBRscan,actual and BBRtrack,actual are constant, they are fitted as unknown parameters together with R and θ0. The fitted values are provided in Table 1.
Table 1. The estimated coefficients.
BandCenter Wavelength (µm)BBRactual Scan (m)BBRactual Track (m)R (m)θ0
I10.640
I20.8650.13−3.637.5393.8
I31.61014.3118.9435.5822.1
M10.4127.664.459.4662.0
M20.4454.704.169.1142.7
M30.4883.283.758.3326.7
M40.555−1.092.334.4022.7
M50.6726.153.623.15133.4
M60.7468.456.095.51−106.1
M70.8650.094.8410.86−80.3
M81.24018.3415.1020.5825.9
M91.37817.2018.1228.4321.5
M101.6104.1719.6036.8522.4
M112.25038.2722.2346.4430.9
The centroid displacement is quantified by R. Not surprisingly, its magnitude increases as the difference in center wavelengths between two bands grows. When R increases, the oscillation observed in current BBRscan and BBRtrack without image rotation correction also increases. In reference to Figure 4b, the magnitude of R defines the maximum BBR variation that is possibly introduced. For Band M11, this value is approximately 46.44/750 = 0.062 pixels. Because the actual rotation of the lunar images does not cover the whole 360 degree range, the observed variation is smaller than this upper limit. This is consistent with the results shown in Figure 3.
With the parameters in Table 1, the actual BBR of the following event is calculated by:
B B R s c a n , a c t u a l = B B R s c a n R sin ( θ + θ 0 )
and:
B B R t r a c k , a c t u a l = B B R t r a c k R cos ( θ + θ 0 )
Again, the amount of correction is limited by ±R. If the actual BBR or its on-orbit change is much larger than this value; then, the effect of this correction will be less significant.

4. Results and Discussion

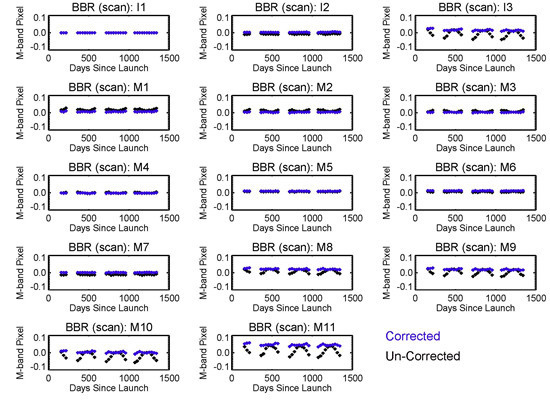
4.1. VIIRS BBR Results

The lunar BBR results have been updated with lunar image rotation correction for VIIRS RSB in the along-scan and along-track directions. Figure 7 shows the improved BBR trending, still with Band I1 as a reference. Compared to the uncorrected results in Figure 3, the seasonal oscillation in the BBR results is significantly reduced from up to ±0.05 M band pixels to less than ±0.01 M band pixels. The long-term drift between the SWIR bands and the VIS/NIR bands has also been identified more accurately.
Figure 8 shows the average (lines) and the standard deviation (error bars) of the BBR during the years 2012 to 2015, before and after the image rotation correction, respectively. The plots also demonstrate how the reduction in the seasonal BBR oscillation reduction helps to determine the actual BBR and its long-term drift more accurately.
The rotation of the lunar image provides an opportunity to separate R from the actual BBR offset so that we can calculate its absolute value. If the orientation of the Moon does not rotate so that R and θ are fixed, then the BBR offset derived from Equations (5) and (6) always contains the component of centroid displacement. Therefore, the results can only reflect the on-orbit change of the BBR offset, but not its actual values.
There is still residual seasonal oscillation that is possibly related to the on-orbit instrument temperature change. For VIIRS, while the temperature of S/MWIR FPA is controlled to be stable at around 80 K, the temperature of VIS/NIR FPA has a larger dependence on the instrument temperature that changes on orbit, as is shown in Figure 6. The temperature difference between the two FPAs may cause the BBR offset. A similar relationship between the BBR and instrument temperature has been observed from MODIS, as well [7]. Since the instrument temperature change introduces actual BBR offset instead of an artifact, there is no need to have it corrected.
Figure 7. The image rotation-corrected VIIRS BBR results in both (a) along-scan and (b) along-track directions, referenced to Band I1.
Remotesensing 08 00027 g007
Figure 8. The yearly-averaged BBR results after image rotation correction in both along-scan (a) and along-track (b) directions before and after image rotation correction, referenced to Band I1.
Remotesensing 08 00027 g008

4.2. Extent of Lunar Centroid Approach for Other Sensors

The centroid displacement on the lunar surface, RMoon, can be estimated by multiplying R in Table 1 by a constant ratio factor 384,400/828, where 384,400 km is the nominal Moon to Earth distance and 828 km is the nominal VIIRS altitude. These values are listed in Table 2. The values in Table 2 are properties of the lunar surface and are thus independent of the sensors.
Table 2. The centroid displacement on the lunar surface (at the phase around −51 degrees).
BandCenter Wavelength (µm)RMoon (m)BandCenter Wavelength (µm)RMoon (m)
I10.640M50.6721462
I20.8653495M60.7462558
I31.61016,518M70.8655042
M10.4124392M81.2409554
M20.4454229M91.37813,199
M30.4883867M101.61017,108
M40.5552043M112.25021,560
The values in Table 2 are useful to evaluate the compatibility of the lunar centroid approach for other sensors. It primarily depends on the spatial resolution of the sensors. Because the centroid displacement changes with lunar phase and libration, the value calculated here has certain uncharacterized uncertainty. Therefore, it is better that the centroid displacement, and its uncertainty, is small when compared to the spatial resolution of the sensor.
For sensors with coarser resolutions, such as MODIS and VIIRS, the maximum centroid displacement (0.640 µm vs. 2.25 µm) corresponds to about 0.1 pixels, so the centroid approach is likely feasible after the centroid displacement correction. For sensors with higher resolution, such as the Advanced Baseline Imager on the Geostationary Operational Environmental Satellite R-Series (GOES-R) with a resolution of 0.55 microradians (compared to 450 microradians for VIIRS), the centroid displacement between 0.640 µm and 2.25 µm corresponds to 1.15 pixels. The number is likely too large for characterizing sub-pixel level BBR. In this case, using the edge of the Moon instead of the centroid is probably more reasonable.

5. Conclusions

One of the key sensor spatial parameters, BBR, can be monitored on-orbit for VIIRS RSB with data from regularly-scheduled lunar calibration by comparing the centroids of the lunar images of different spectral bands. Seasonal oscillation of up to 0.05 pixels is observed in the BBR trending, and the amplitude of the oscillation increases with the center-wavelength difference between the two bands. It is found that the lunar image rotation among lunar calibration events contributes to the seasonal oscillation of BBR, because the centroid displacement vector between two spectral bands rotates with the lunar image, and the rotation changes its components in both along-scan and along-track directions.
In this paper, the lunar image rotation is quantified, and its impact is compensated. The seasonal oscillation in BBR trending is significantly reduced to a level of 0.01 pixels, especially between VIS/NIR bands and SWIR bands. The results confirm that the BBR in the SV direction, where the lunar image is actually acquired, has been stable and is well within the design specification of 0.1 pixels. The VIIRS BBR will be continuously monitored and evaluated throughout the VIIRS’s lifetime, as part of the on-orbit calibration effort. Furthermore, the lunar centroid displacement on the Moon is estimated, and the values can be used to check the applicability of the lunar centroid approach to characterize the BBR of similar sensors.

Acknowledgments

Jeff McIntire kindly reviewed the manuscript and made valuable suggestions to improve it. His effort is very much appreciated. The authors would also like to thank other members of the NASA MODIS Characterization Support Team and the VIIRS Characterization Support Team for their contribution.

Author Contributions

Zhipeng Wang developed and implemented the lunar image rotation algorithm presented in the paper. He drafted the manuscript and the responses to the reviewers’ comments. Xiaoxiong Xiong developed the concept of the band-to-band registration characterization using the Moon. He revised the manuscript critically and gave final approval of the version to be published. Yonghong Li was involved in the data acquisition and analysis. She also independently verified the results and revised the manuscript critically.

Conflicts of Interest

The authors declare no conflict of interest.

References

  1. Murphy, R.P.; Ardanuy, P.E.; Deluccia, F.; Clement, J.E.; Schueler, C. Earth science satellite remote sensing. In The Visible Infrared Imaging Radiometer Suite; Springer-Verlag: New York, NY, USA, 2006; Volume 1, pp. 199–223. [Google Scholar]
  2. Baker, N. Joint Polar Satellite System VIIRS Geolocation Algorithm Theoretical Basis Document (Section 3.3); Doc. No. 474-00053; GSFC JPSS Configuration Management Office: Greenbelt, MD, USA, 2011.
  3. Barnes, W.L.; Xiong, X.; Guenther, B.; Salomonson, V. Development, characterization, and performance of the EOS MODIS sensors. Proc. SPIE 2003, 5151, 337–345. [Google Scholar]
  4. Xiong, X.; Butler, J.; Chiang, K.; Efremova, B.; Fulbright, J.P.; Lei, N.; McIntire, J.; Oudrari, H.; Sun, J.; Wang, Z.; et al. VIIRS on-orbit calibration methodology and performance. J. Geophys. Res. 2014, 119, 5065–5078. [Google Scholar] [CrossRef]
  5. Lin, G.; Wolfe, R.E.; Nishihama, M. VIIRS geometric performance status. Proc. SPIE 2011, 8153. [Google Scholar] [CrossRef]
  6. Wolfe, R.E.; Lin, G.; Nishihama, M.; Tewari, K.P.; Montano, E. NPP VIIRS early on-orbit geometric performance. Proc. SPIE 2012, 8510. [Google Scholar] [CrossRef]
  7. Xiong, X.; Che, N.; Barnes, W.L. Terra MODIS on-orbit spatial characterization and performance. IEEE Trans. Geosci. Remote Sens. 2005, 43, 355–365. [Google Scholar] [CrossRef]
  8. Wolfe, R.E.; Lin, G.; Nishihama, M.; Tewari, K.P.; Tilton, J.C.; Isaacman, A.R. Suomi NPP VIIRS prelaunch and on-orbit geometric calibration and characterization. J. Geophys. Res. Atmos. 2013, 118, 11508–11521. [Google Scholar] [CrossRef]
  9. Tilton, J.C.; Tan, B.; Lin, G. Measurement of band-to-band registration of the NPP VIIRS instrument from on-orbit data. In Proceedings of the NOAA STAR JPSS Annual Science Team Meeting, College Park, MD, USA, 24–28 August 2015.
  10. Liao, L. Band-to-band registration of remotely sensed imagery using mutual information and its application to Suomi NPP VIIRS data. In Proceedings of the AMS 20th Confrence on Satellite Meteorology & Oceanography, Phoenix, AZ, USA, 4–8 January 2015.
  11. Xiong, X.; Sun, J.; Xiong, S.; Barnes, W.L. Using the Moon for MODIS on-orbit spatial characterization. Proc. SPIE 2003, 5234, 480–487. [Google Scholar]
  12. Wang, Z.; Xiong, X. VIIRS on-orbit spatial characterization using the Moon. IEEE Geosci. Remote Sens. Lett. 2014, 11, 1116–1120. [Google Scholar] [CrossRef]
  13. Wang, Z.; Xiong, X.; Li, Y. Update of VIIRS on-orbit spatial parameters characterized with the Moon. IEEE Trans. Geosci. Remote Sens. 2015, 53, 5486–5494. [Google Scholar] [CrossRef]
  14. Kieffer, H.H.; Stone, T.C. The spectral irradiance of the Moon. Astronom. J. 2005, 129, 2887–2901. [Google Scholar] [CrossRef]
  15. Xiong, X.; Sun, J.; Fulbright, J.; Wang, Z. Lunar calibration and performance for S-NPP VIIRS reflective solar bands. IEEE Trans. Geosci. Remote Sens. 2015. [Google Scholar] [CrossRef]
  16. Mills, S. VIIRS Radiometric Calibration Algorithm Theoretical Basis Document ATBD; Doc. No.: D43777; Northrop Grumman: Virgina, VA, USA, 2010. [Google Scholar]
  17. Sun, J.; Xiong, X.; Barnes, W.; Guenther, B. MODIS reflective solar bands on-orbit lunar calibration. IEEE Trans. Geosci. Remote Sens. 2007, 45, 2383–2393. [Google Scholar] [CrossRef]

