
Mapping Impervious Surface Distribution with Integration of SNNP VIIRS-DNB and MODIS NDVI Data


Abstract
:
1. Introduction
2. Study Area and Datasets
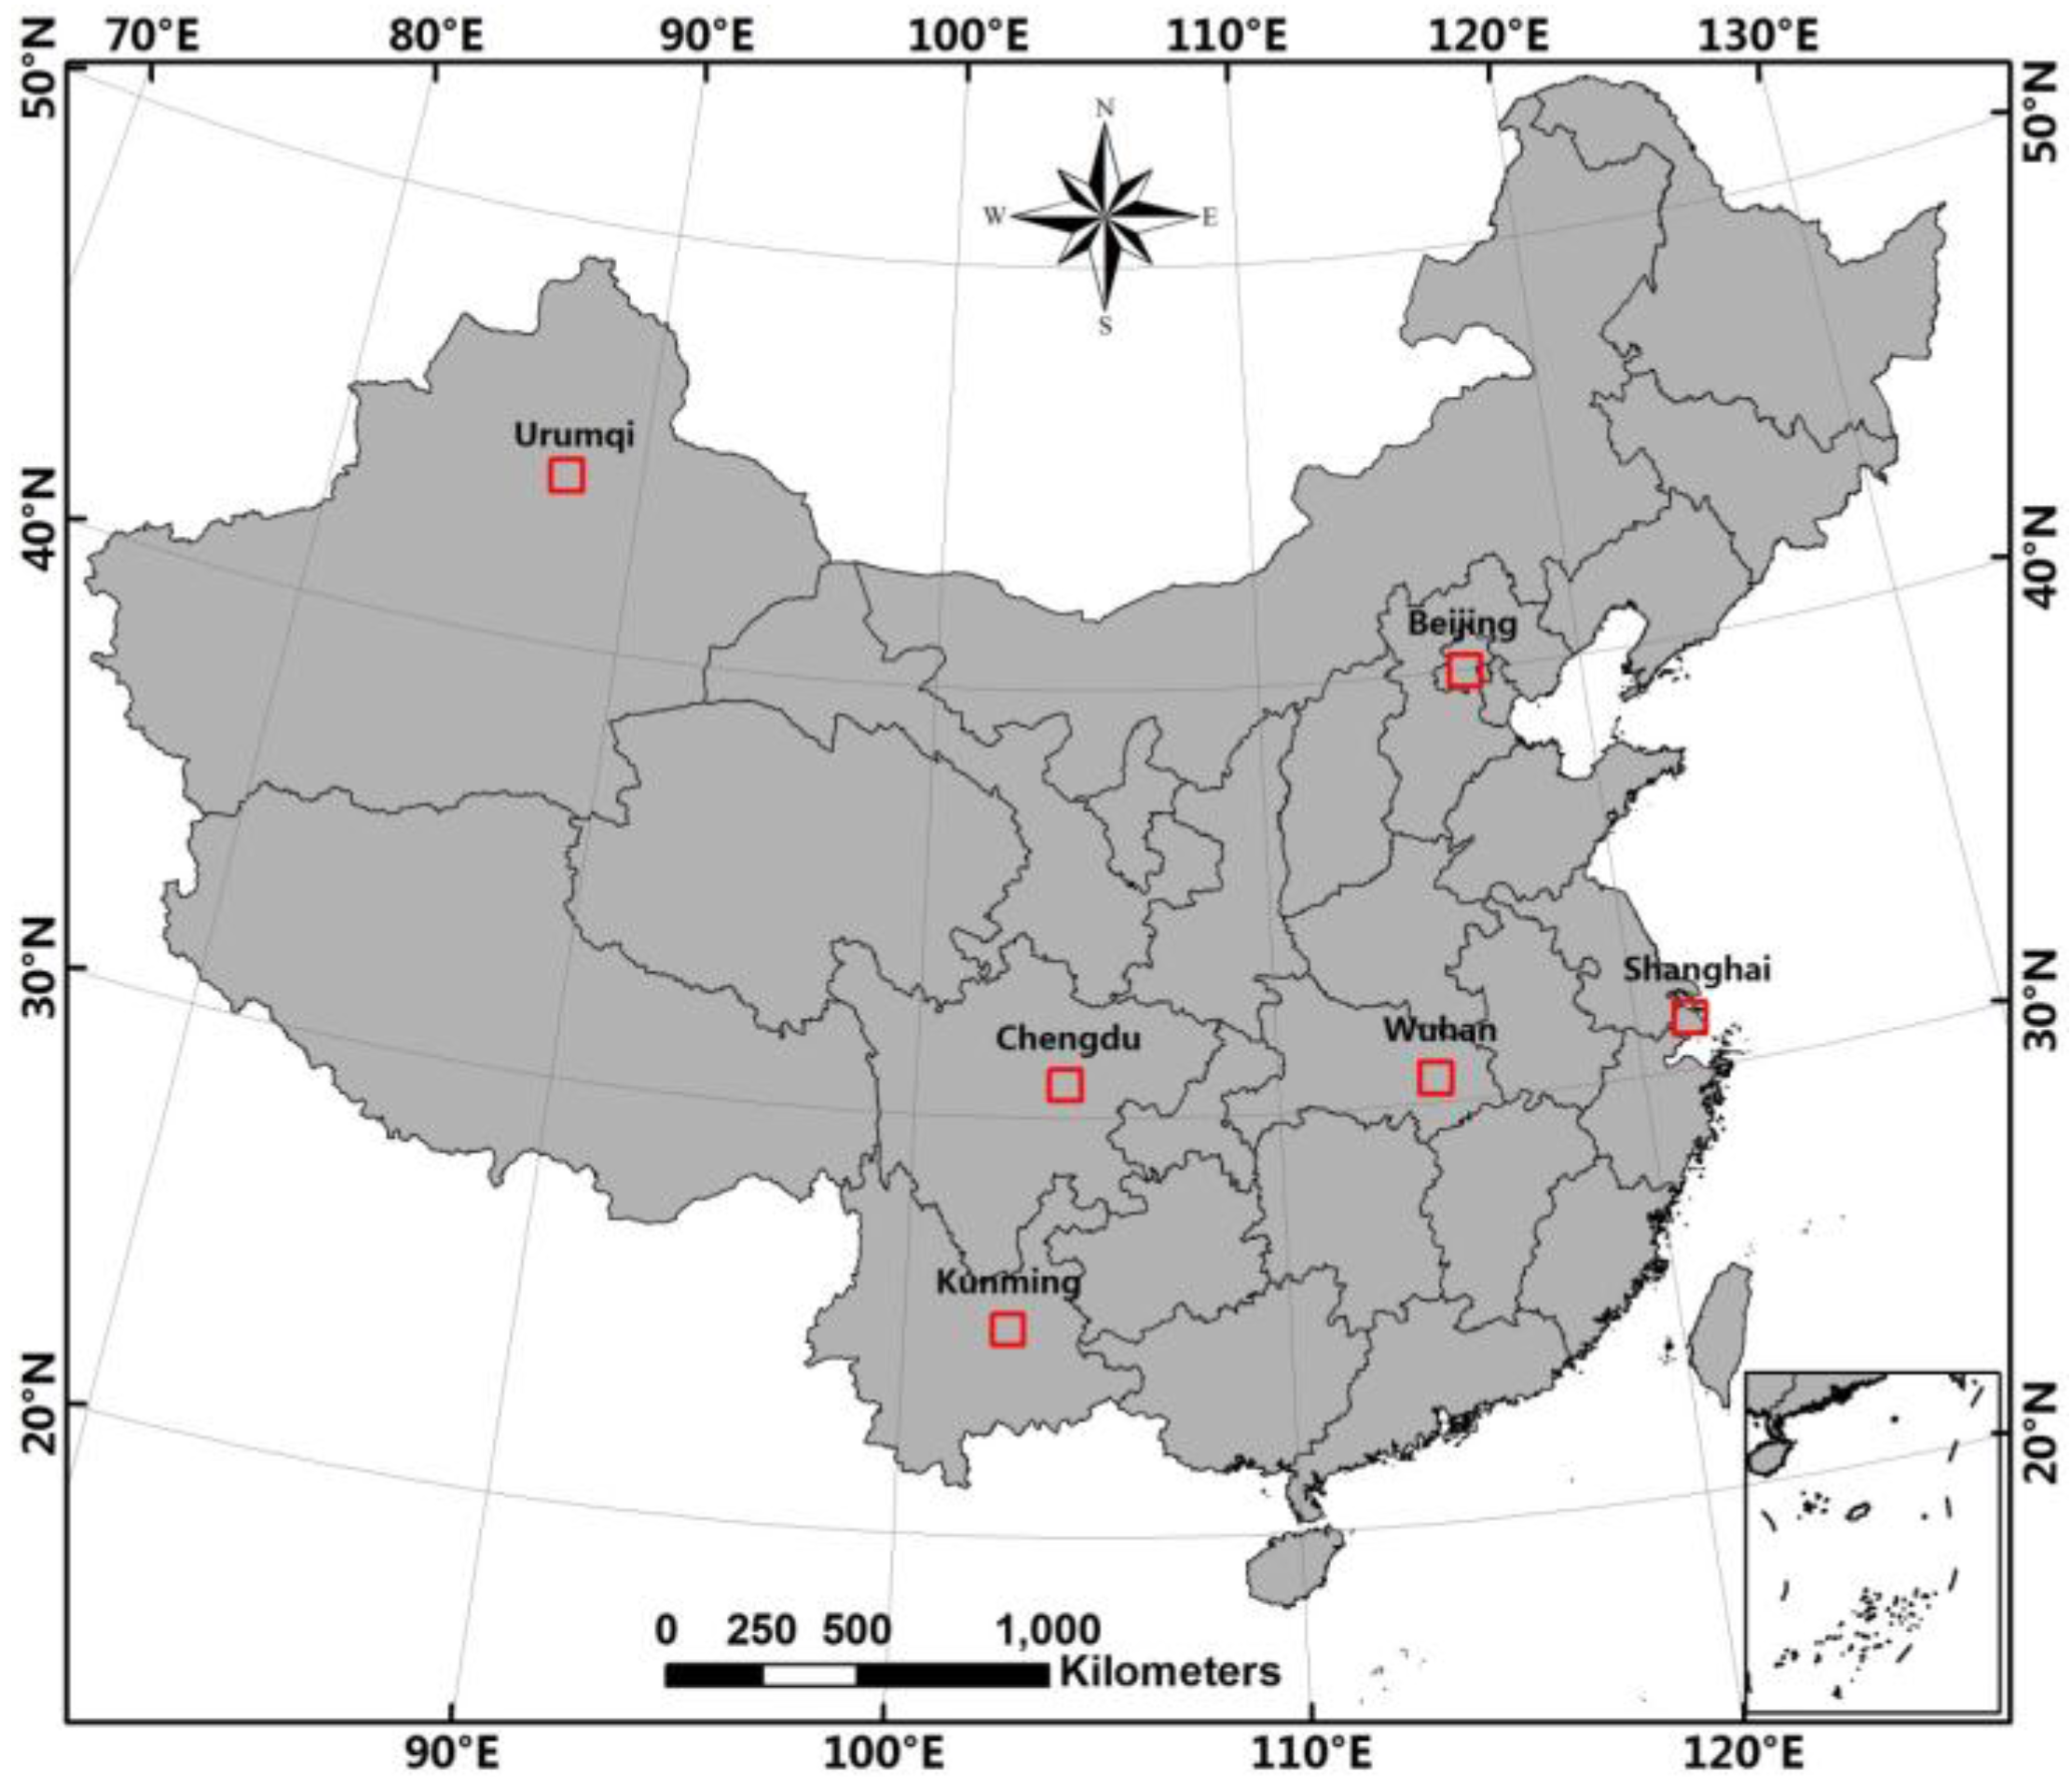
2.1. Study Area


| Cities | Population (Million) | GDP (Billion RMB) | Area (km2) |
|---|---|---|---|
| Beijing in North China | 20.69 | 1780.1 | 16,800.00 |
| Shanghai in East China | 23.80 | 2010.1 | 6340.50 |
| Wuhan in Central China | 10.12 | 800.3 | 8494.41 |
| Chengdu in Central China | 11.73 | 813.8 | 12,390.00 |
| Kunming in Southwest China | 6.53 | 301.1 | 21,001.28 |
| Urumqi in Northwest China | 3.35 | 206.0 | 15,173.13 |
2.2. Datasets
| Data | Acquisition Date | Description |
|---|---|---|
| VIIRS-DNB | Two-month composite product in April and October 2012 | A spectral range of 500–900 nm; highly sensitive to very low levels of visible light at night with zero moonlight; spatial resolution of 743 m. |
| MODIS NDVI (MOD13Q1) | 16-day MODIS NDVI composite between April and October 2012 (h23v04-h23v05, h24v04-h24v05, h25v03-h25v06, h26v03-h26v06, h27v04-h27v06, h28v05-h28v07, h29v06); total number of scenes: 247 | Gridded level-3 product with 250 m spatial resolution. |
| Landsat 8 OLI imagery | path/row: acquisition date | Six multispectral bands with 30 m and one panchromatic band with 15 m spatial resolution were used. Two thermal bands with 100 m spatial resolution were not used due to their relatively coarse spatial resolution. |
| 123/32: 1 September 2013 | ||
| 118/38: 29 August 2013 | ||
| 123/39: 12 May 2013 | ||
| 129/39: 20 April 2013 | ||
| 129/43: 20 April 2013 | ||
| 143/29: 28 August 2013 |
3. Methods

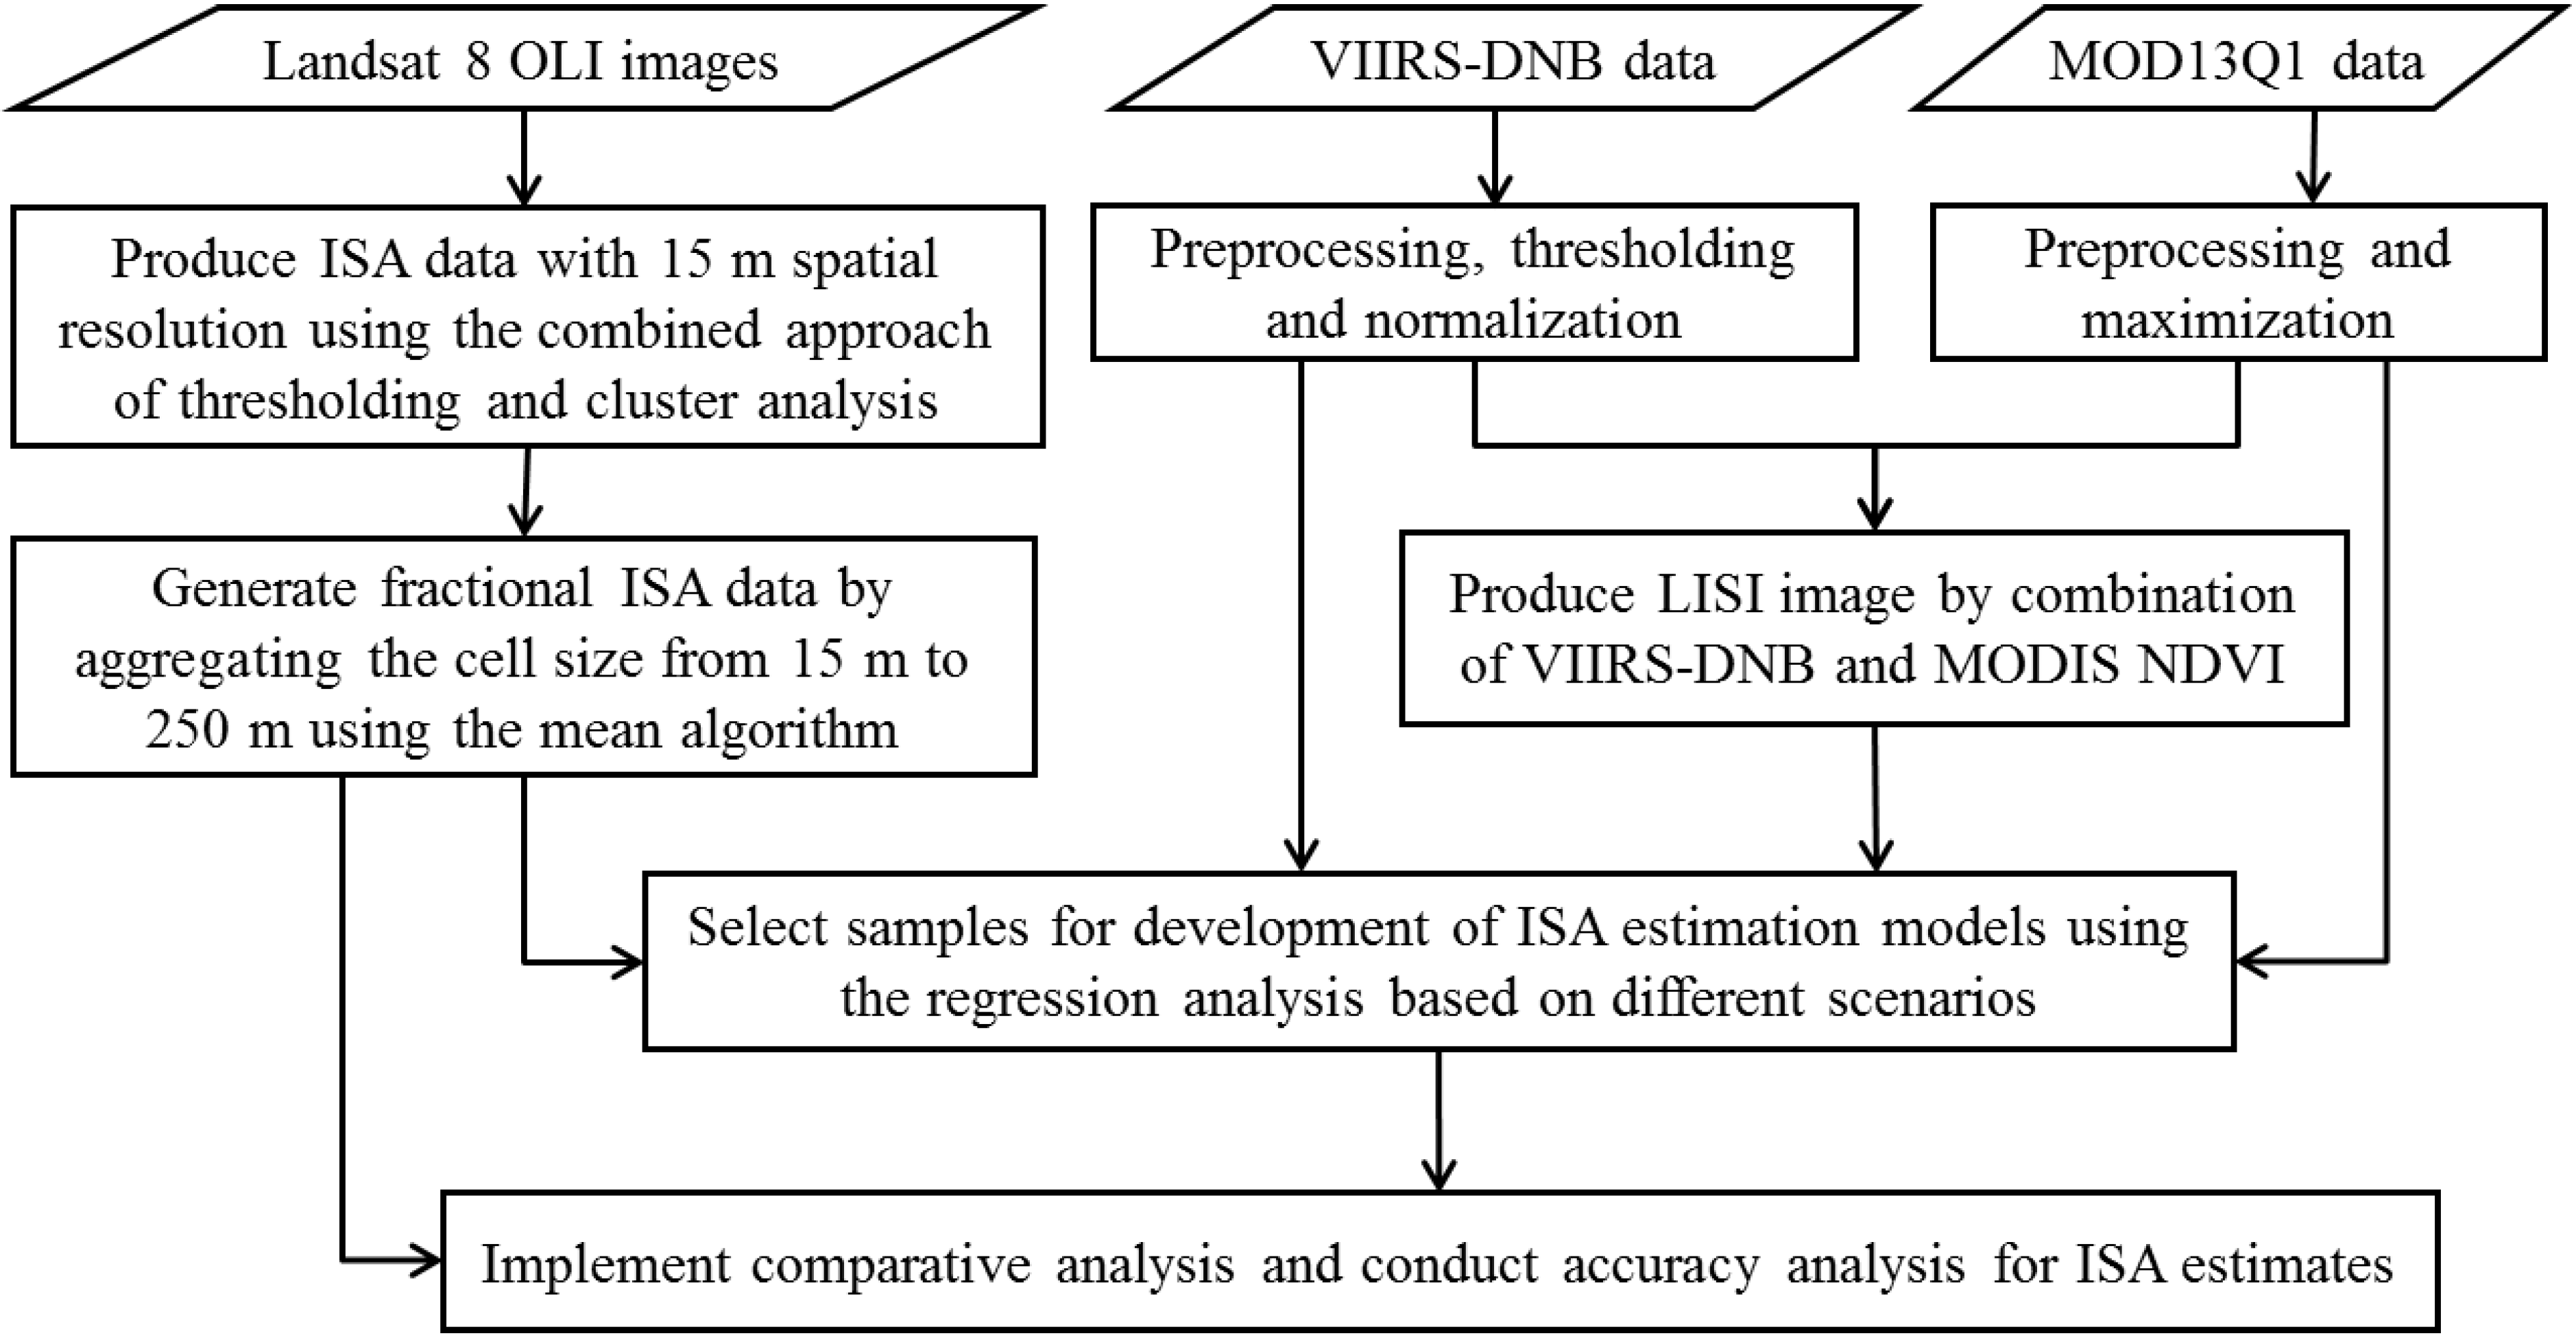
3.1. Produce ISA Reference Data from Landsat 8 OLI Imagery

3.2. Develop Large-Scale Impervious Surface Index Data through a Combination of VIIRS-DNB and MODIS NDVI Data

3.3. Map ISA Distribution with Regression Models
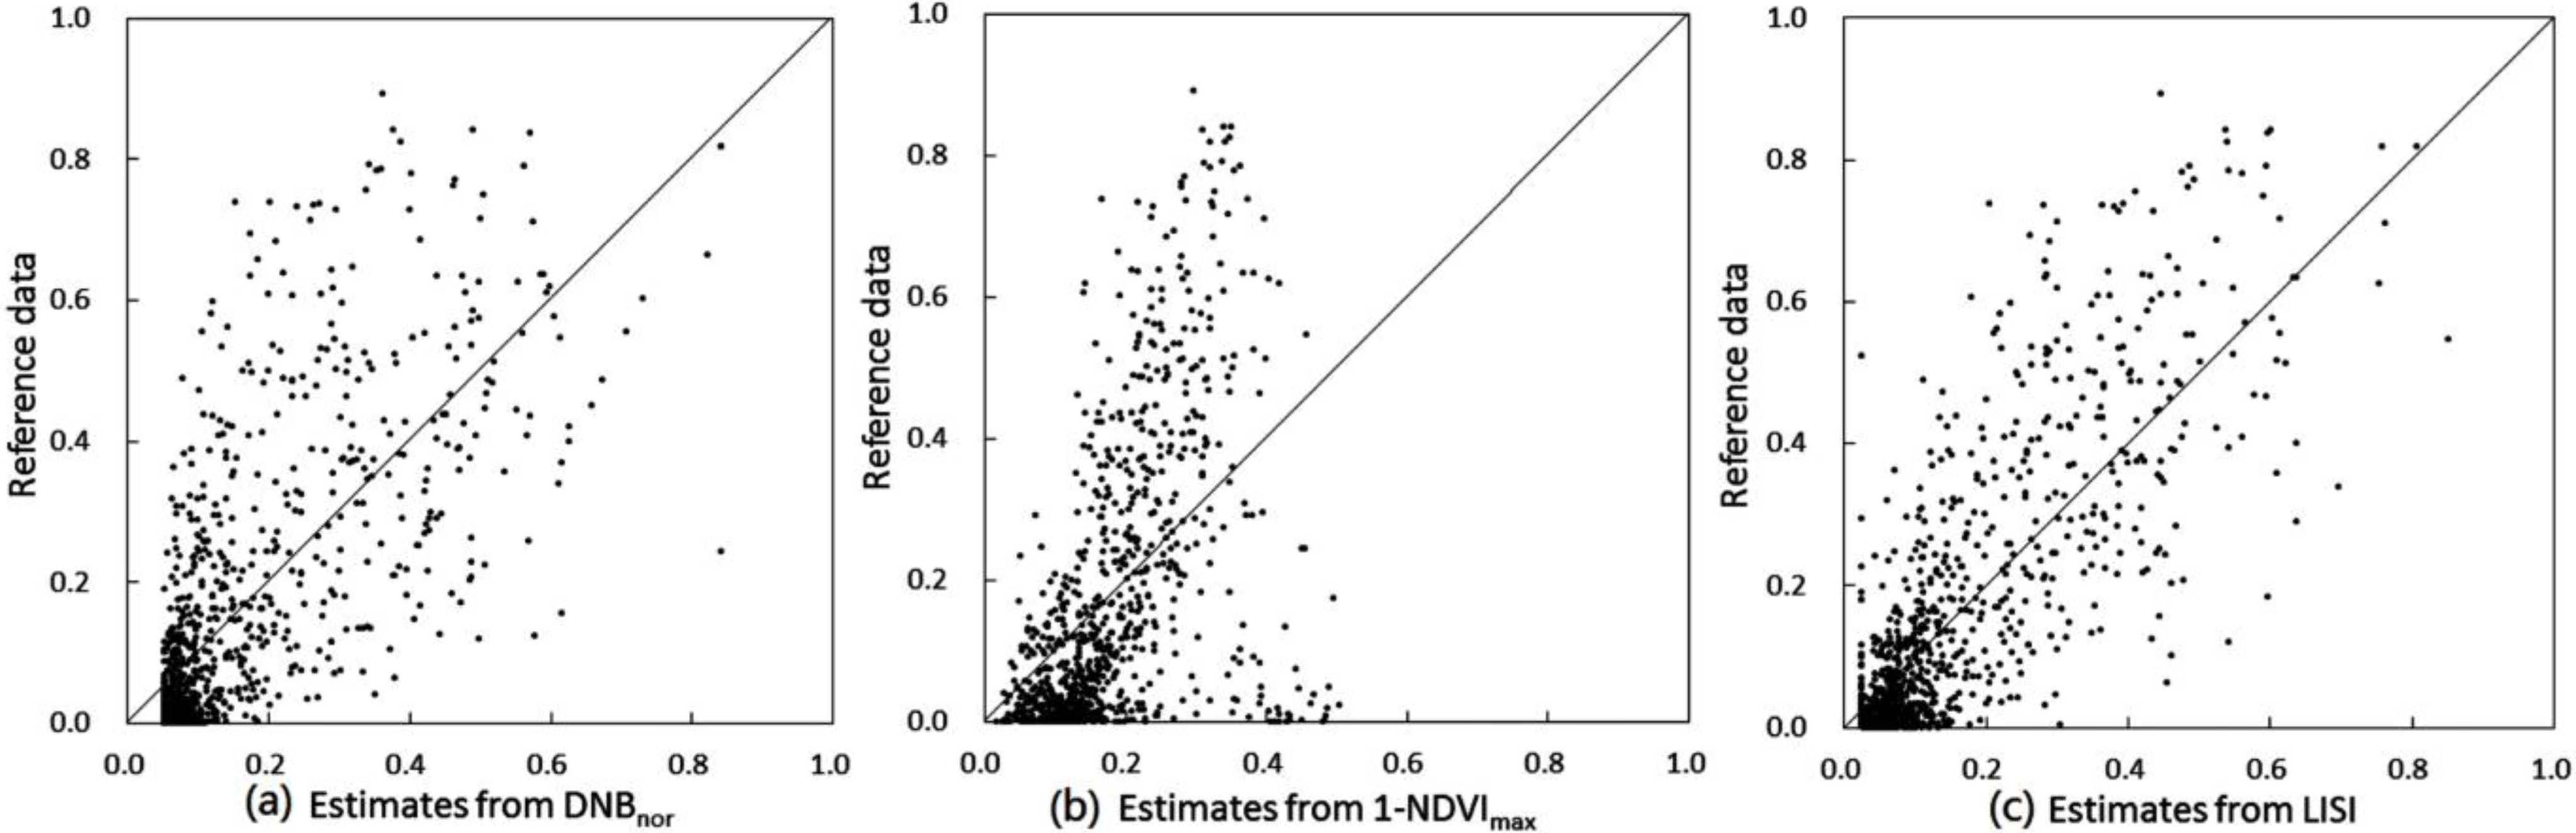
3.4. Conduct Evaluation of ISA Estimates
4. Results
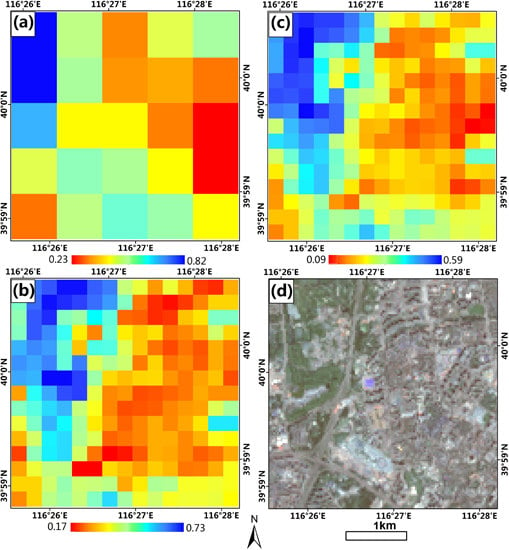
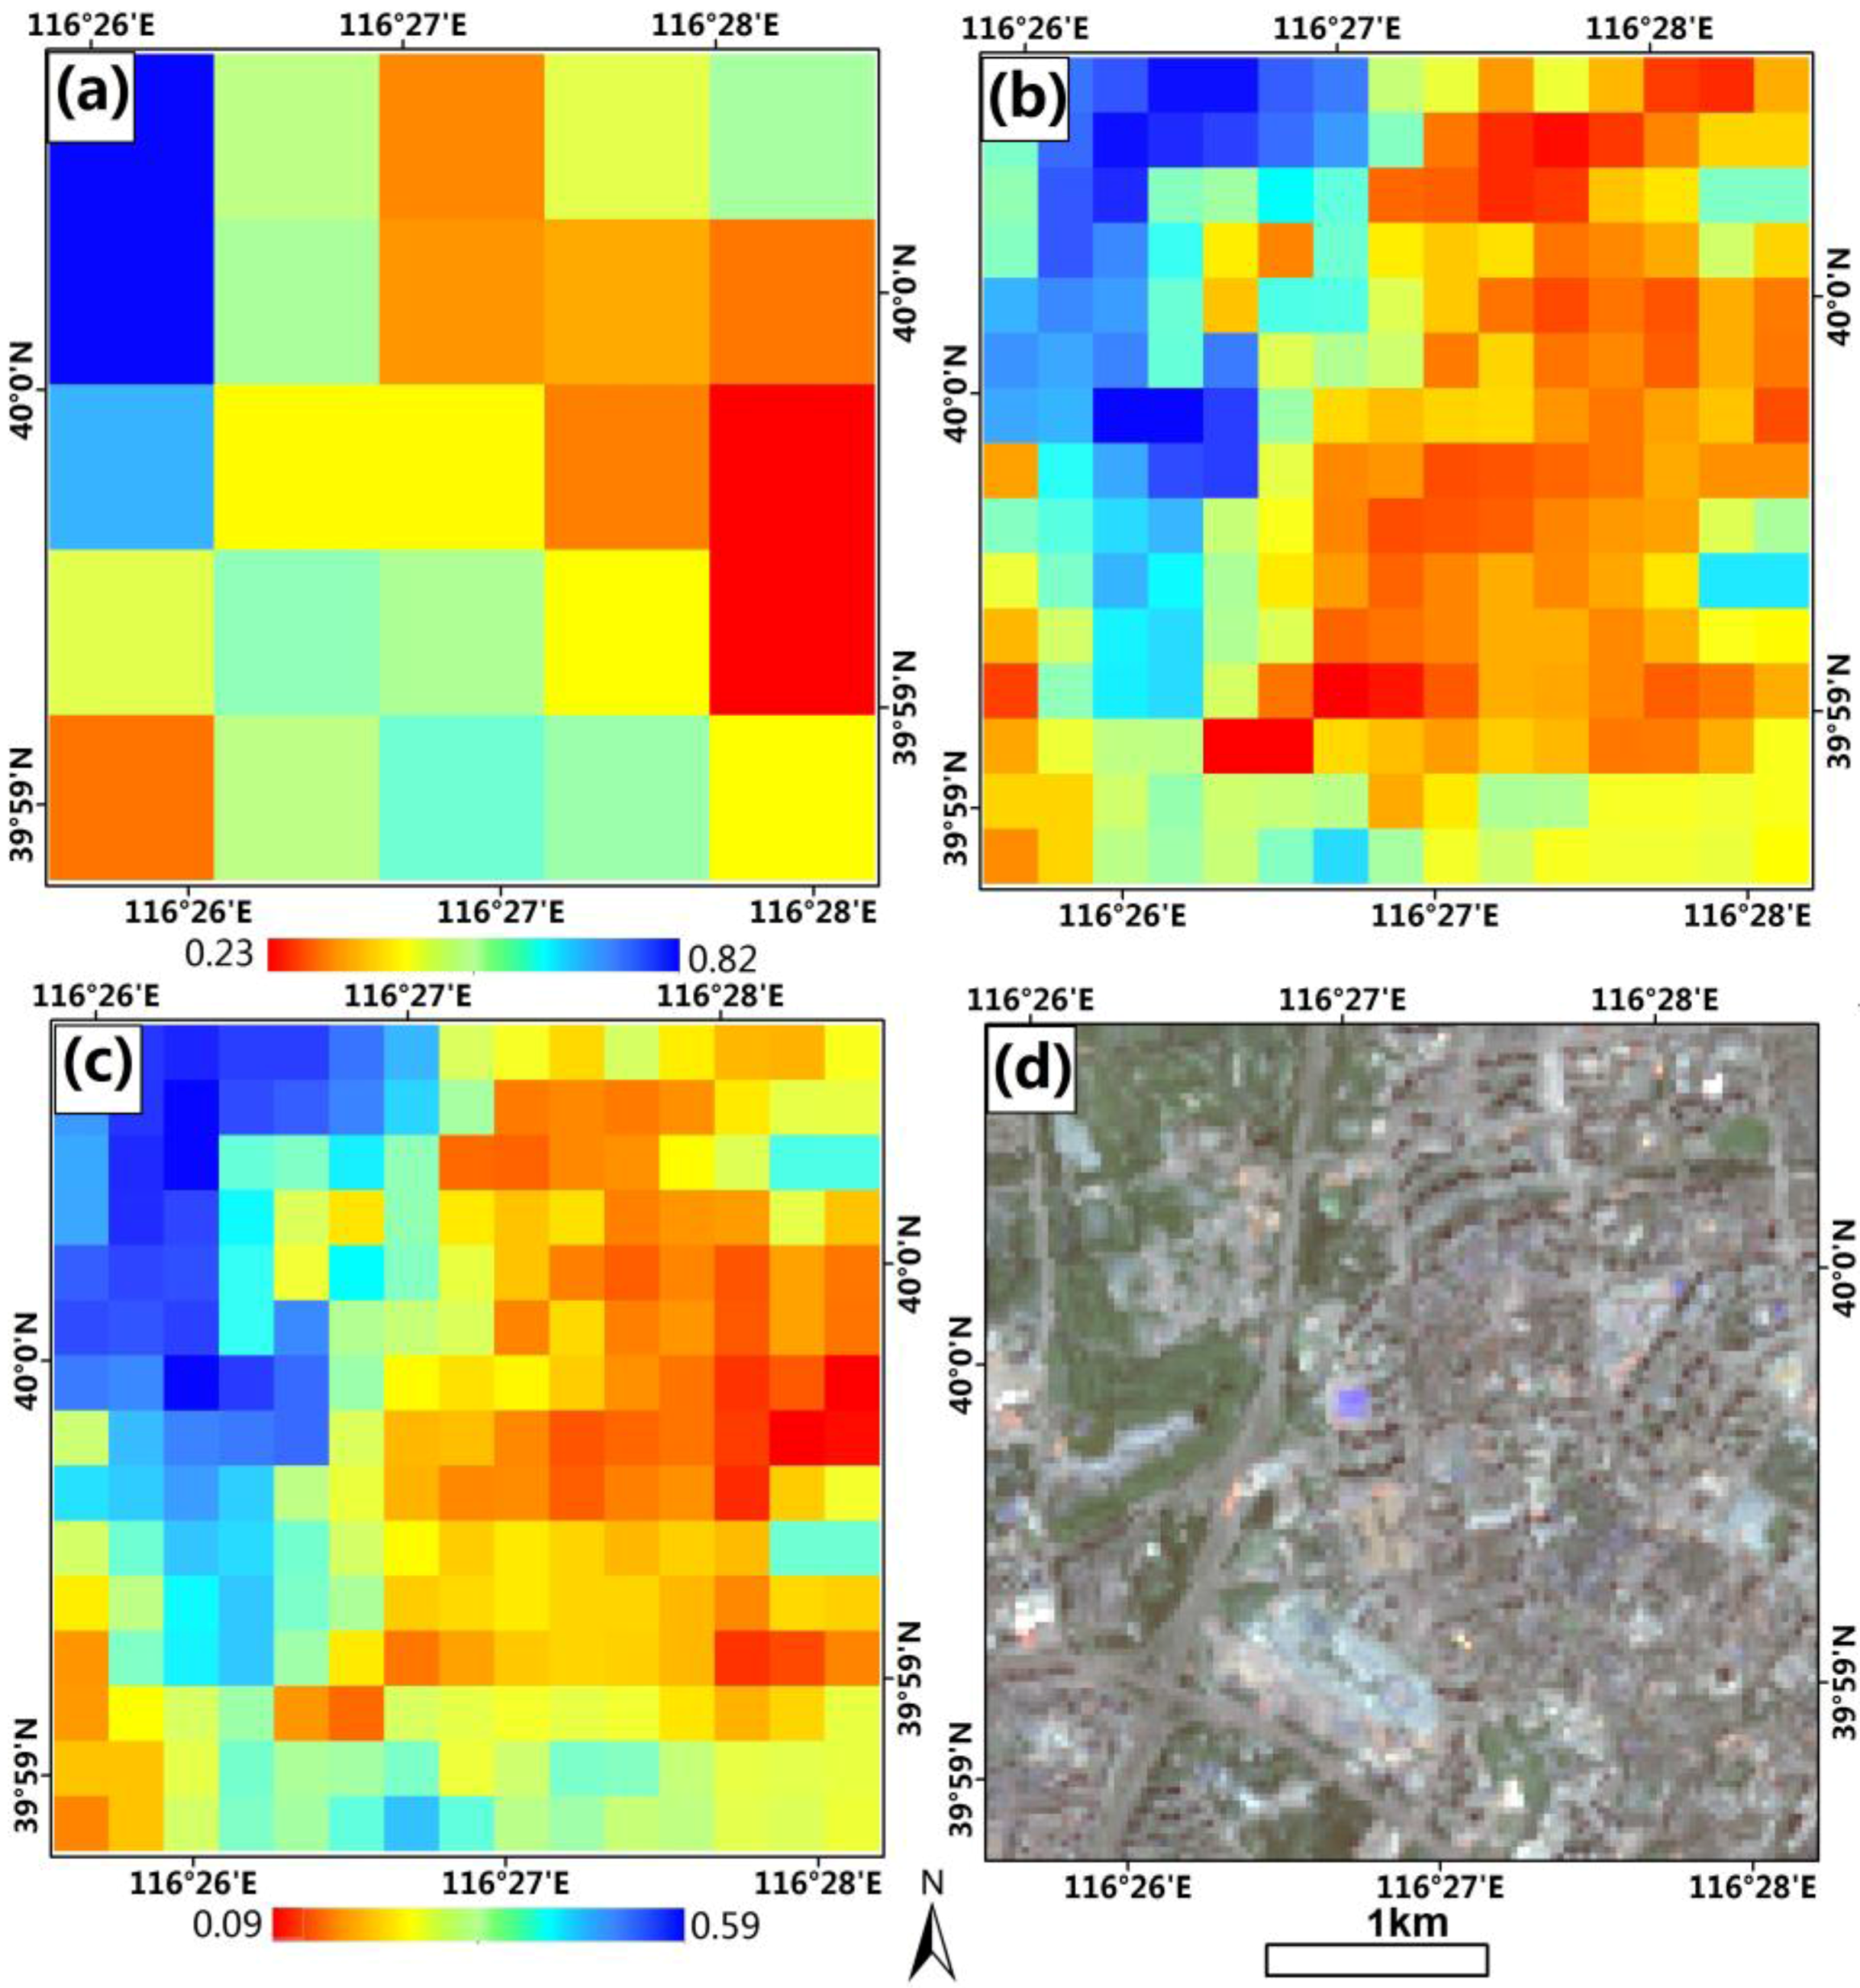
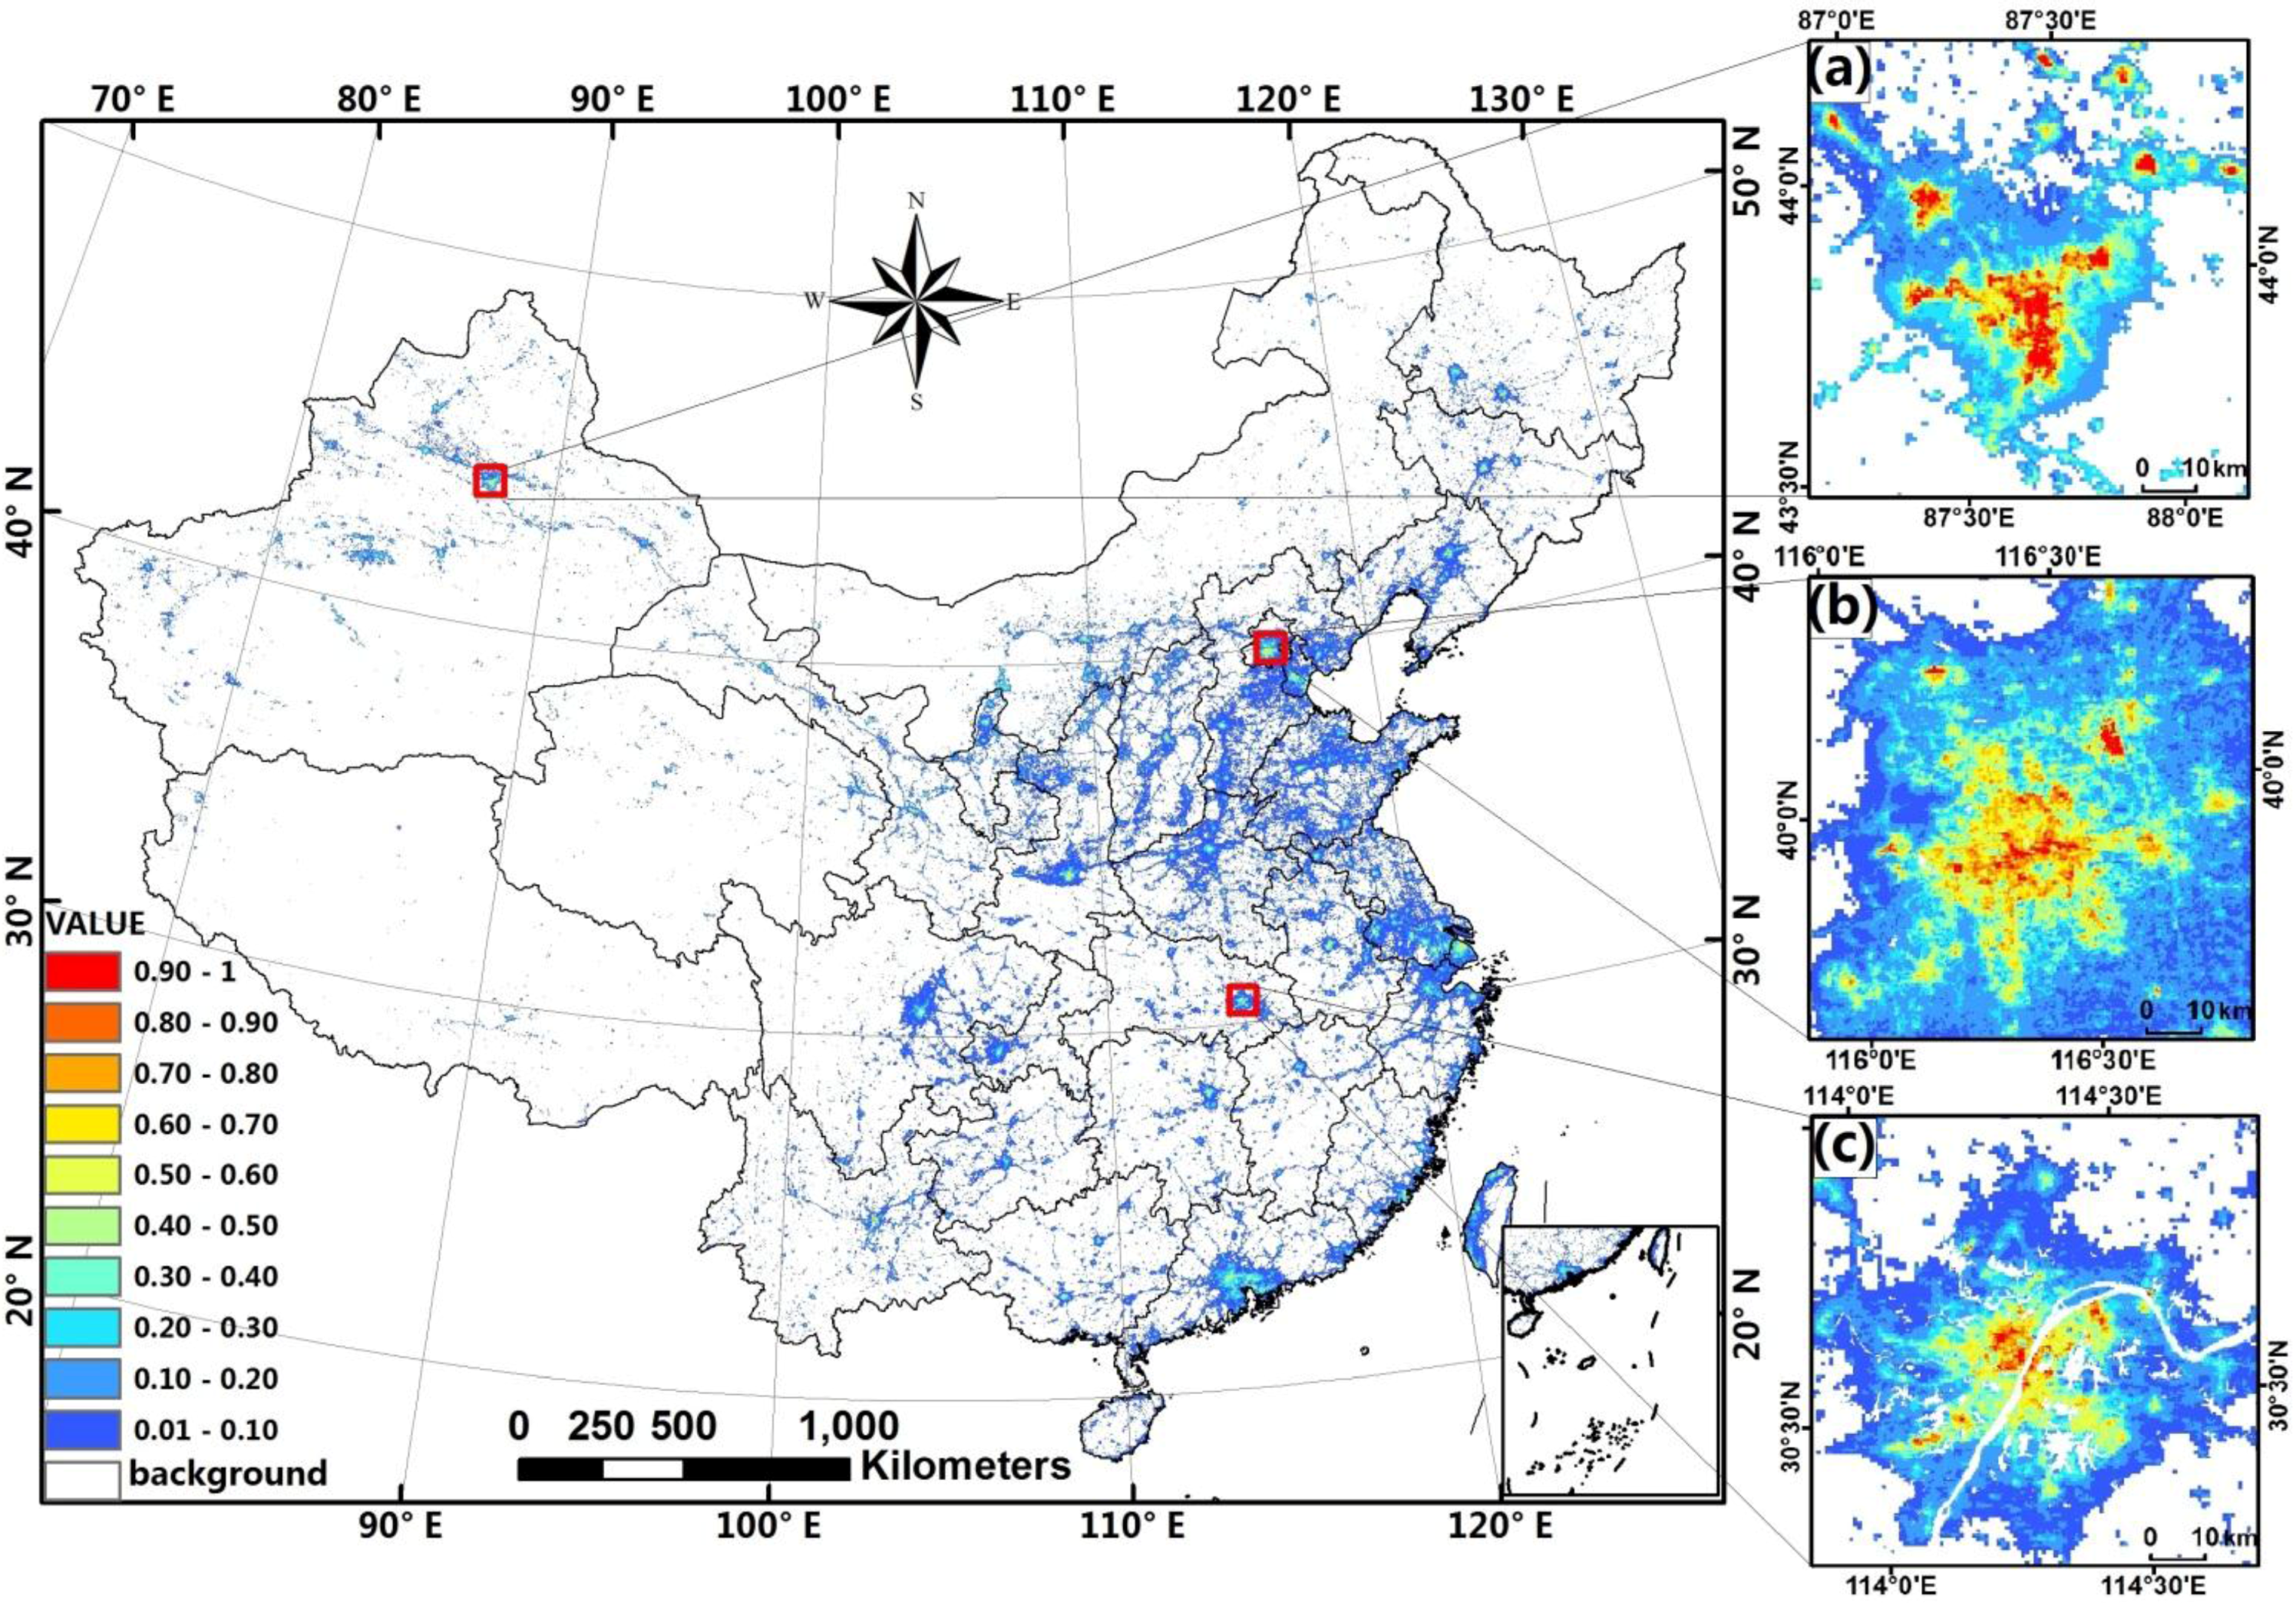
4.1. Analysis of ISA Spatial Distribution


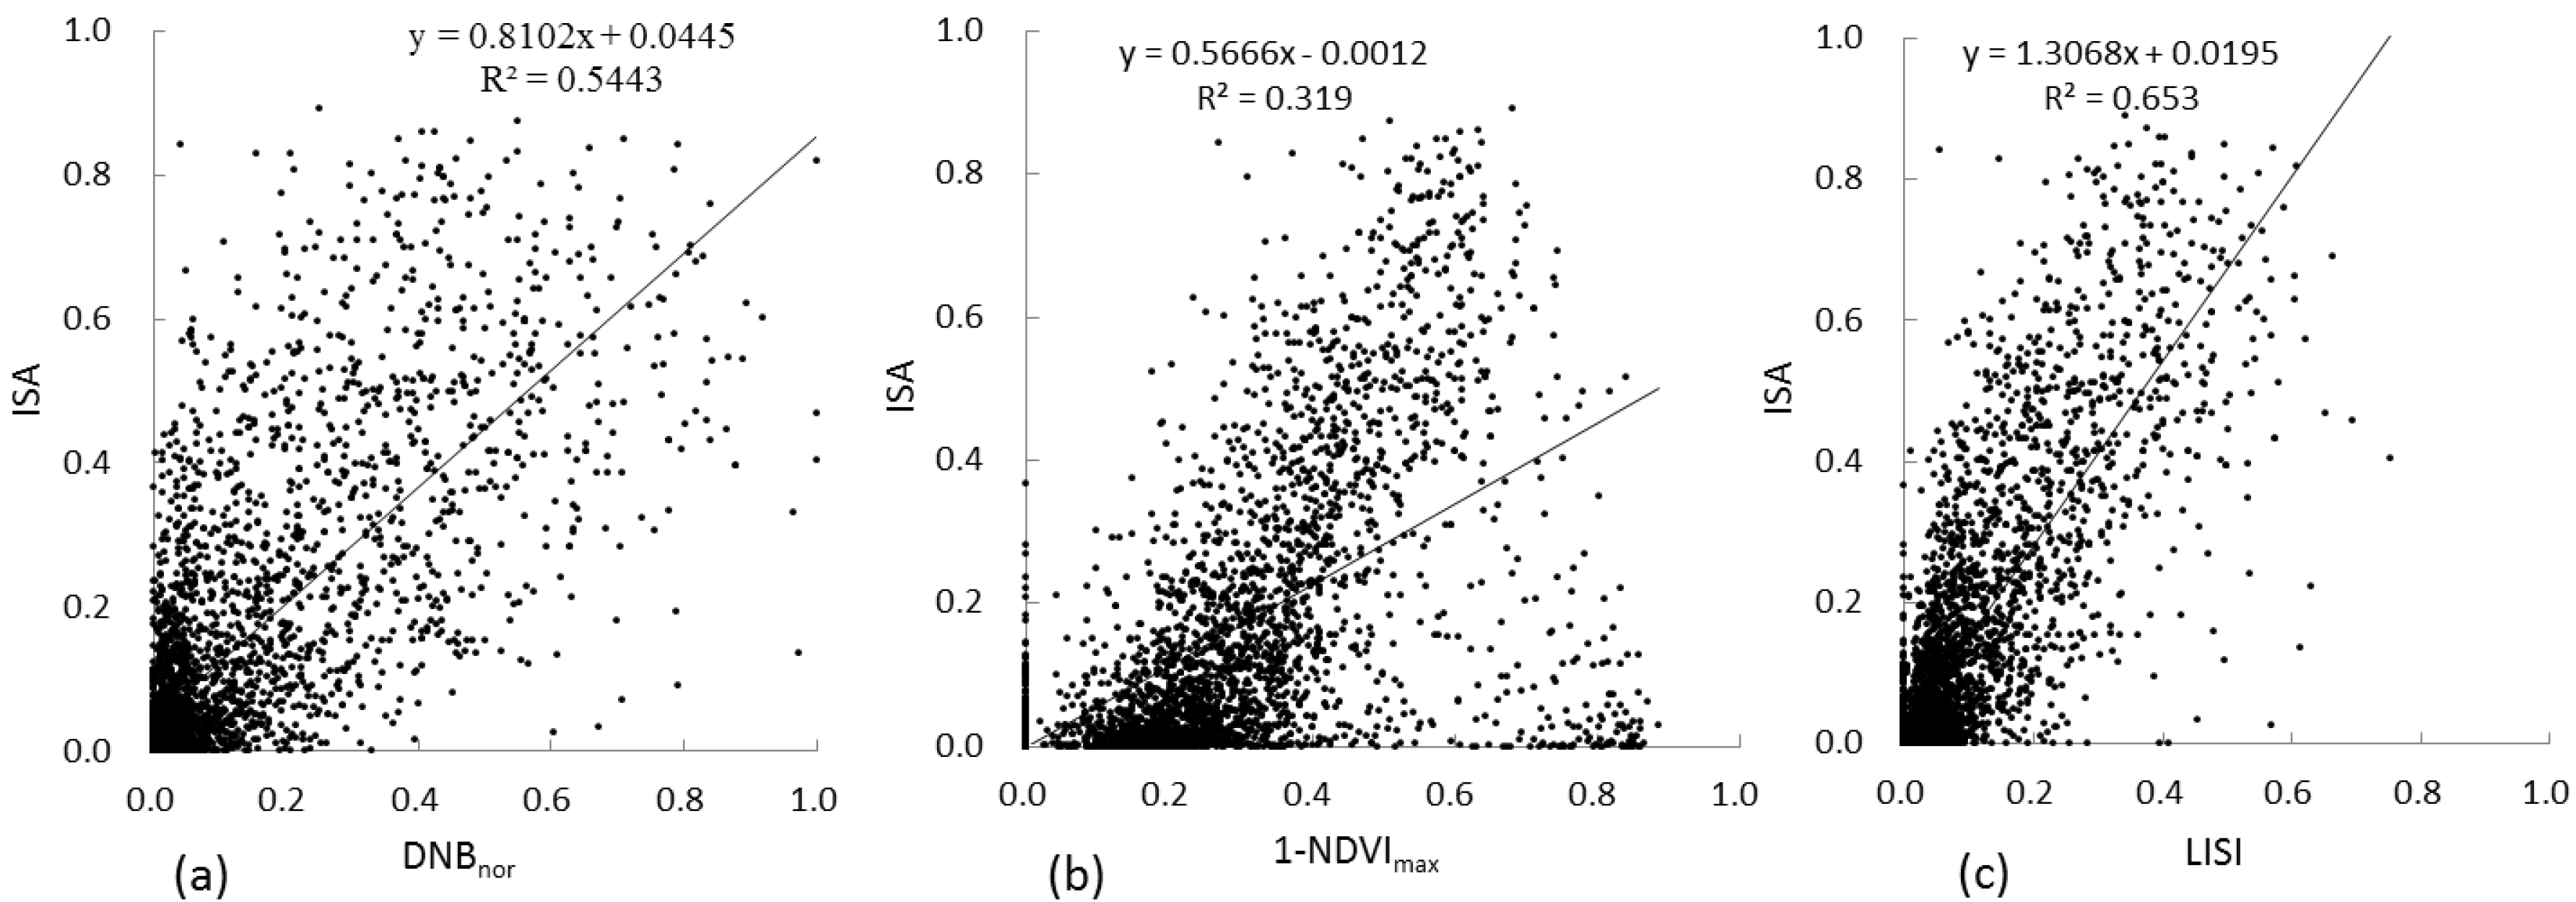
4.2. Comparative Analysis of ISA Estimates

| Variable | R | RMSE |
|---|---|---|
| DNBnor | 0.729 | 0.132 |
| 1-NDVImax | 0.563 | 0.160 |
| LISI | 0.812 | 0.113 |

| Group | Data Range | RMSE | ||
|---|---|---|---|---|
| DNBnor | 1-NDVImax | LISI | ||
| Very low | <0.2 | 0.100 | 0.121 | 0.076 |
| Low | 0.2–0.4 | 0.217 | 0.188 | 0.181 |
| Medium | 0.4–0.6 | 0.182 | 0.461 | 0.195 |
| High | 0.6–0.8 | 0.226 | Null | 0.179 |
| Very high | ≥0.8 | 0.310 | Null | 0.215 |
| Overall | 0.132 | 0.160 | 0.113 | |
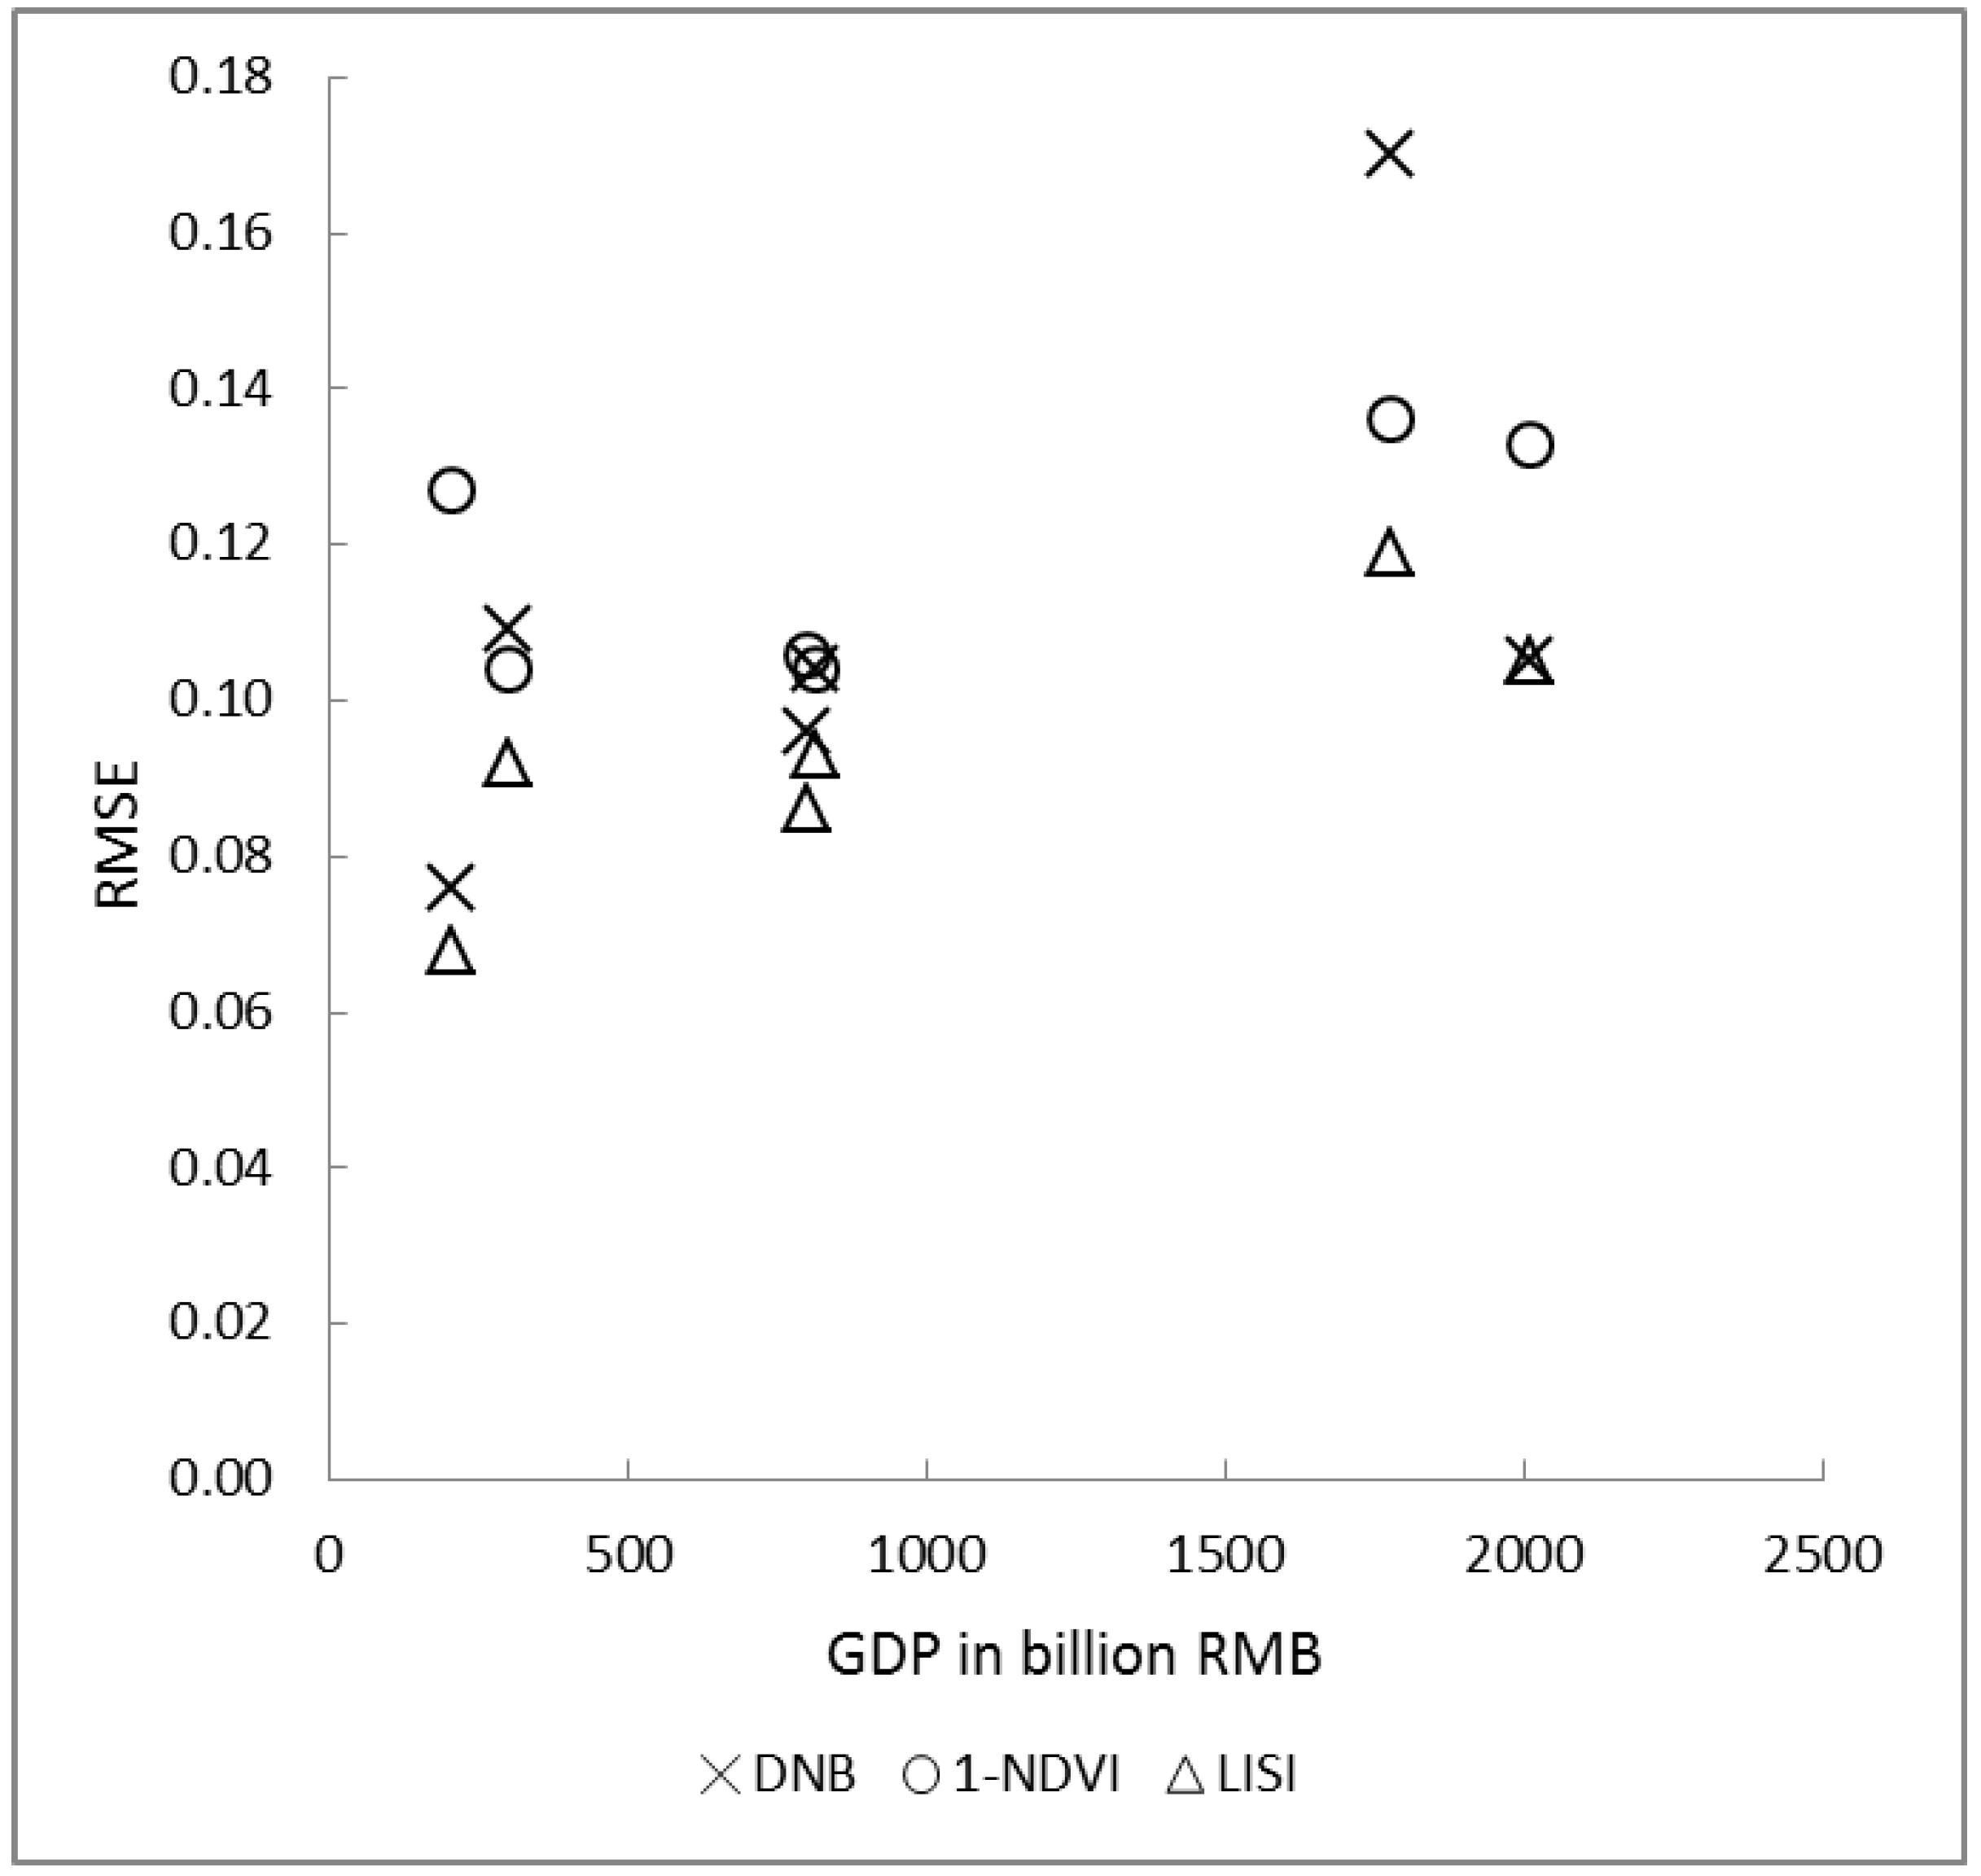
| City | DNBnor | 1-NDVImax | LISI | |||
|---|---|---|---|---|---|---|
| R | RMSE | R | RMSE | R | RMSE | |
| Beijing | 0.744 | 0.170 | 0.845 | 0.136 | 0.883 | 0.119 |
| Shanghai | 0.804 | 0.105 | 0.661 | 0.133 | 0.805 | 0.105 |
| Wuhan | 0.793 | 0.096 | 0.740 | 0.106 | 0.840 | 0.086 |
| Chengdu | 0.801 | 0.104 | 0.801 | 0.104 | 0.844 | 0.093 |
| Kunming | 0.739 | 0.109 | 0.764 | 0.104 | 0.822 | 0.092 |
| Urumqi | 0.814 | 0.076 | 0.233 | 0.127 | 0.852 | 0.068 |
5. Discussions

6. Conclusions
- (1)
- VIIRS-DNB can be used for ISA mapping in a large area with an overall RMSE of 0.13. However, the areas having higher ISA proportion produced higher errors. Additionally, very high or very low economic conditions influenced ISA estimation performance. This implies that individual VIIRS-DNB data may produce inaccurate spatial patterns of ISA distribution if the study area covers urban landscapes having considerably different economic conditions;
- (2)
- Individual MODIS NDVI is not a good variable for ISA mapping in a large area, especially in areas with very low vegetation covers, such as Western China. However, in some large cities such as Chengdu and Kunming in this research, NDVI can produce ISA estimates with similar to or even better performance than VIIRS-DNB. This implies that MODIS NDVI is valuable, but it is critical to properly use it in ISA estimation;
- (3)
- The proposed LISI variable combined advantages of both VIIRS-DNB and MODIS NDVI features and provided much improved ISA estimation performance, especially the improved spatial patterns. Overall, the LISI-based approach has an RMSE of 0.11 and has much-improved estimation performance when ISA proportion is high, compared to the other two datasets. Therefore, LISI is recommended for ISA estimation in a large area.
Acknowledgments
Author Contributions
Conflicts of Interest
References
- Brabec, E.; Schulte, S.; Richards, P.L. Impervious surfaces and water quality: A review of current literature and its implications for watershed planning. J. Plan. Lit. 2002, 16, 499–514. [Google Scholar] [CrossRef]
- Arnold, C.L.; Gibbons, C.J. Impervious surface coverage: The emergence of a key environmental indicator. J. Am. Plan. Assoc. 1996, 62, 243–258. [Google Scholar] [CrossRef]
- Lu, D.; Li, G.; Kuang, W.; Moran, E. Methods to extract impervious surface areas from satellite images. Int. J. Digit. Earth 2014, 7, 93–112. [Google Scholar] [CrossRef]
- Wu, C.; Murray, A.T. Estimating impervious surface distribution by spectral mixture analysis. Remote Sens. Environ. 2003, 84, 493–505. [Google Scholar] [CrossRef]
- Kuang, W.; Liu, J.; Zhang, Z.; Lu, D.; Xiang, B. Spatiotemporal dynamics of impervious surface areas across china during the early 21st century. Chin. Sci. Bull. 2012, 58, 1691–1701. [Google Scholar] [CrossRef]
- Ma, Q.; He, C.; Wu, J.; Liu, Z.; Zhang, Q.; Sun, Z. Quantifying spatiotemporal patterns of urban impervious surfaces in China: An improved assessment using nighttime light data. Landsc. Urban Plan. 2014, 130, 36–49. [Google Scholar] [CrossRef]
- Schneider, A.; Mertes, C.M.; Tatem, A.J.; Tan, B.; Sulla-Menashe, D.; Graves, S.J.; Patel, N.N.; Horton, J.A.; Gaughan, A.E.; Rollo, J.T.; et al. A new urban landscape in East-Southeast Asia, 2000–2010. Environ. Res. Lett. 2015, 10. [Google Scholar] [CrossRef]
- Schneider, A.; Chang, C.; Paulsen, K. The changing spatial form of cities in Western China. Landsc. Urban Plan. 2015, 135, 40–61. [Google Scholar] [CrossRef]
- Imhoff, M.L.; Zhang, P.; Wolfe, R.E.; Bounoua, L. Remote sensing of the urban heat island effect across biomes in the continental USA. Remote Sens. Environ. 2010, 114, 504–513. [Google Scholar] [CrossRef]
- Kaufmann, R.K.; Seto, K.C.; Schneider, A.; Liu, Z.; Zhou, L.; Wang, W. Climate response to rapid urban growth: Evidence of a human-induced precipitation deficit. J. Clim. 2007, 20, 2299–2306. [Google Scholar] [CrossRef]
- Wu, J. Urban sustainability: An inevitable goal of landscape research. Landsc. Ecol. 2009, 25, 1–4. [Google Scholar] [CrossRef]
- Carlson, T.N.; Traci Arthur, S. The impact of land use—Land cover changes due to urbanization on surface microclimate and hydrology: A satellite perspective. Glob. Planet. Chang. 2000, 25, 49–65. [Google Scholar] [CrossRef]
- Jennings, D.; Taylor Jarnagin, S. Changes in anthropogenic impervious surfaces, precipitation and daily streamflow discharge: A historical perspective in a mid-Atlantic subwatershed. Landsc. Ecol. 2002, 17, 471–489. [Google Scholar] [CrossRef]
- Xian, G. Satellite remotely-sensed land surface parameters and their climatic effects for three metropolitan regions. Adv. Space Res. 2008, 41, 1861–1869. [Google Scholar] [CrossRef]
- Buyantuyev, A.; Wu, J. Urban heat islands and landscape heterogeneity: Linking spatiotemporal variations in surface temperatures to land-cover and socioeconomic patterns. Landsc. Ecol. 2009, 25, 17–33. [Google Scholar] [CrossRef]
- Schneider, A. Monitoring land cover change in urban and peri-urban areas using dense time stacks of Landsat satellite data and a data mining approach. Remote Sens. Environ. 2012, 124, 689–704. [Google Scholar] [CrossRef]
- Weng, Q. Remote sensing of impervious surfaces in the urban areas: Requirements, methods, and trends. Remote Sens. Environ. 2012, 117, 34–49. [Google Scholar] [CrossRef]
- Schneider, A.; Friedl, M.A.; Potere, D. Mapping global urban areas using MODIS 500-m data: New methods and datasets based on “urban ecoregions”. Remote Sens. Environ. 2010, 114, 1733–1746. [Google Scholar] [CrossRef]
- Schneider, A.; Friedl, M.A.; Potere, D. A new map of global urban extent from MODIS satellite data. Environ. Res. Lett. 2009, 4. [Google Scholar] [CrossRef]
- Mertes, C.M.; Schneider, A.; Sulla-Menashe, D.; Tatem, A.J.; Tan, B. Detecting change in urban areas at continental scales with MODIS data. Remote Sens. Environ. 2015, 158, 331–347. [Google Scholar] [CrossRef]
- Huete, A.; Didan, K.; Miura, T.; Rodriguez, E.P.; Gao, X.; Ferreira, L.G. Overview of the radiometric and biophysical performance of the MODIS vegetation indices. Remote Sens. Environ. 2002, 83, 195–213. [Google Scholar] [CrossRef]
- Knight, J.; Voth, M. Mapping impervious cover using multi-temporal MODIS NDVI data. IEEE J. Sel. Top. Appl. Earth Obs. Remote Sens. 2011, 4, 303–309. [Google Scholar] [CrossRef]
- Yang, F.; Matsushita, B.; Fukushima, T.; Yang, W. Temporal mixture analysis for estimating impervious surface area from multi-temporal MODIS NDVI data in Japan. ISPRS J. Photogramm. Remote Sens. 2012, 72, 90–98. [Google Scholar] [CrossRef]
- Yang, F.; Matsushita, B.; Yang, W.; Fukushima, T. Mapping the human footprint from satellite measurements in Japan. ISPRS J. Photogramm. Remote Sens. 2014, 88, 80–90. [Google Scholar] [CrossRef]
- Lu, D.; Tian, H.; Zhou, G.; Ge, H. Regional mapping of human settlements in Southeastern China with multisensor remotely sensed data. Remote Sens. Environ. 2008, 112, 3668–3679. [Google Scholar] [CrossRef]
- Sutton, P.; Roberts, D.; Elvidge, C.; Baugh, K. Census from heaven: An estimate of the global human population using night-time satellite imagery. Int. J. Remote Sens. 2010, 22, 3061–3076. [Google Scholar] [CrossRef]
- Cao, C.; Bai, Y. Quantitative analysis of VIIRS DNB nightlight point source for light power estimation and stability monitoring. Remote Sens. 2014, 6, 11915–11935. [Google Scholar] [CrossRef]
- Cao, X.; Wang, J.; Chen, J.; Shi, F. Spatialization of electricity consumption of China using saturation-corrected DMSP-OLS data. Int. J. Appl. Earth Obs. Geoinf. 2014, 28, 193–200. [Google Scholar] [CrossRef]
- Shi, K.; Yu, B.; Huang, Y.; Hu, Y.; Yin, B.; Chen, Z.; Chen, L.; Wu, J. Evaluating the ability of NPP-VIIRS nighttime light data to estimate the gross domestic product and the electric power consumption of china at multiple scales: A comparison with DMSP-OLS data. Remote Sens. 2014, 6, 1705–1724. [Google Scholar] [CrossRef]
- Elvidge, C.D.; Baugh, K.E.; Anderson, S.J.; Sutton, P.C.; Ghosh, T. The night light development index (NLDI): A spatially explicit measure of human development from satellite data. Soc. Geogr. 2012, 7, 23–35. [Google Scholar] [CrossRef]
- Elvidge, C.; Safran, J.; Tuttle, B.; Sutton, P.; Cinzano, P.; Pettit, D.; Arvesen, J.; Small, C. Potential for global mapping of development via a nightsat mission. GeoJournal 2007, 69, 45–53. [Google Scholar] [CrossRef]
- Elvidge, C.D.; Erwin, E.H.; Baugh, K.E.; Ziskin, D.; Tuttle, B.T.; Ghosh, T.; Sutton, P.C. Overview of DMSP nightime lights and future possibilities. In Proceedings of Urban Remote Sensing Event, 2009 Joint, Shanghai, China, 20–22 May 2009; pp. 1–5.
- Elvidge, C.D.; Baugh, K.E.; Zhizhin, M.; Hsu, F.C. Why VIIRS data are superior to DMSP for mapping nighttime lights. In Proceedings of the Asia-Pacific Advanced Network, Boulder, CO, USA; 2013; Volume 35, p. 62. [Google Scholar]
- Sutton, P.C. A scale-adjusted measure of “urban sprawl” using nighttime satellite imagery. Remote Sens. Environ. 2003, 86, 353–369. [Google Scholar] [CrossRef]
- Elvidge, C.; Tuttle, B.; Sutton, P.; Baugh, K.; Howard, A.; Milesi, C.; Bhaduri, B.; Nemani, R. Global distribution and density of constructed impervious surfaces. Sensors 2007, 7, 1962–1979. [Google Scholar] [CrossRef]
- Zhang, Q.; Seto, K.C. Mapping urbanization dynamics at regional and global scales using multi-temporal DMSP/OLS nighttime light data. Remote Sens. Environ. 2011, 115, 2320–2329. [Google Scholar] [CrossRef]
- Zhou, Y.; Smith, S.J.; Elvidge, C.D.; Zhao, K.; Thomson, A.; Imhoff, M. A cluster-based method to map urban area from DMSP/OLS nightlights. Remote Sens. Environ. 2014, 147, 173–185. [Google Scholar] [CrossRef]
- Lee, T.E.; Miller, S.D.; Turk, F.J.; Schueler, C.; Julian, R.; Deyo, S.; Dills, P.; Wang, S. The NPOESS VIIRS day/night visible sensor. Bull. Am. Meteorol. Soc. 2006, 87, 191–199. [Google Scholar] [CrossRef]
- Miller, S.D.; Mills, S.P.; Elvidge, C.D.; Lindsey, D.T.; Lee, T.F.; Hawkins, J.D. Suomi satellite brings to light a unique frontier of nighttime environmental sensing capabilities. Proc. Natl. Acad. Sci. USA 2012, 109, 15706–15711. [Google Scholar] [CrossRef] [PubMed]
- Li, X.; Xu, H.; Chen, X.; Li, C. Potential of NPP-VIIRS nighttime light imagery for modeling the regional economy of China. Remote Sens. 2013, 5, 3057–3081. [Google Scholar] [CrossRef]
- Ma, T.; Zhou, C.; Pei, T.; Haynie, S.; Fan, J. Responses of Suomi-NPP VIIRS-derived nighttime lights to socioeconomic activity in China’s cities. Remote Sens. Lett. 2014, 5, 165–174. [Google Scholar] [CrossRef]
- Ma, T.; Zhou, Y.; Wang, Y.; Zhou, C.; Haynie, S.; Xu, T. Diverse relationships between Suomi-NPP VIIRS night-time light and multi-scale socioeconomic activity. Remote Sens. Lett. 2014, 5, 652–661. [Google Scholar] [CrossRef]
- Imhoff, M.L.; Lawrence, W.T.; Elvidge, C.; Paul, T.; Levine, E.; Prevalsky, M.; Brown, V. Using nighttime DMSP/OLS images of city lights to estimate the impact of urban land use on soil resources in the U.S. Remote Sens. Environ. 1997, 59, 105–117. [Google Scholar] [CrossRef]
- Henderson, M.; Yeh, E.T.; Gong, P.; Elvidge, C.; Baugh, K. Validation of urban boundaries derived from global night-time satellite imagery. Int. J. Remote Sens. 2003, 24, 595–609. [Google Scholar] [CrossRef]
- Lawrence, W.T.; Imhoff, M.L.; Kerle, N.; Stutzer, D. Quantifying urban land use and impact on soils in Egypt using diurnal satellite imagery of the earth surface. Int. J. Remote Sens. 2010, 23, 3921–3937. [Google Scholar] [CrossRef]
- Zhang, Q.; Schaaf, C.; Seto, K.C. The vegetation adjusted NTL urban index: A new approach to reduce saturation and increase variation in nighttime luminosity. Remote Sens. Environ. 2013, 129, 32–41. [Google Scholar] [CrossRef]
- Cao, X.; Chen, J.; Imura, H.; Higashi, O. A SVM-based method to extract urban areas from DMSP-OLS and spot VGT data. Remote Sens. Environ. 2009, 113, 2205–2209. [Google Scholar] [CrossRef]
- Pandey, B.; Joshi, P.K.; Seto, K.C. Monitoring urbanization dynamics in India using DMSP/OLS night time lights and spot-VGT data. Int. J. Appl. Earth Obs. Geoinf. 2013, 23, 49–61. [Google Scholar] [CrossRef]
- Shao, Z.; Liu, C. The integrated use of DMSP-OLS nighttime light and MODIS data for monitoring large-scale impervious surface dynamics: A case study in the Yangtze River Delta. Remote Sens. 2014, 6, 9359–9378. [Google Scholar] [CrossRef]
- Zhang, X.; Li, P.; Cai, C. Regional urban extent extraction using multi-sensor data and one-class classification. Remote Sens. 2015, 7, 7671–7694. [Google Scholar] [CrossRef]
- Kuang, W.; Chi, W.; Lu, D.; Dou, Y. A comparative analysis of megacity expansions in China and the U.S.: Patterns, rates and driving forces. Landsc. Urban Plan. 2014, 132, 121–135. [Google Scholar] [CrossRef]
- Ma, T.; Zhou, Y.; Zhou, C.; Haynie, S.; Pei, T.; Xu, T. Night-time light derived estimation of spatio-temporal characteristics of urbanization dynamics using DMSP/OLS satellite data. Remote Sens. Environ. 2015, 158, 453–464. [Google Scholar] [CrossRef]
- VIIRS-DNB. Two-Month Composite Product. Available online: http://ngdc.noaa.gov/eog/viirs/download_monthly.hOLIl (accessed on 9 February 2014).
- MODIS NDVI (MOD13Q1). Available online: http://ladsweb.nascom.nasa.gov/data/search.hOLIl (accessed on 2 December 2013).
- Landsat 8 OLI Description. Available online: http://landsat.usgs.gov/landsat8.php (accessed on 19 April 2015).
- Lu, D.; Li, G.; Moran, E.; Batistella, M.; Freitas, C.C. Mapping impervious surfaces with the integrated use of Landsat thematic mapper and radar data: A case study in an urban-rural landscape in the Brazilian Amazon. ISPRS J. Photogramm. Remote Sens. 2011, 66, 798–808. [Google Scholar] [CrossRef]
- Bannari, A.; Morin, D.; Bonn, F.; Huete, A.R. A review of vegetation indices. Remote Sens. Rev. 1995, 13, 95–120. [Google Scholar] [CrossRef]
- McDonald, A.J.; Gemmell, F.M.; Lewis, P.E. Investigation of the utility of spectral vegetation indices for determining information on coniferous forests. Remote Sens. Environ. 1998, 66, 250–272. [Google Scholar] [CrossRef]
- McFeeters, S.K. The use of the normalized difference water index (NDWI) in the delineation of open water features. Int. J. Remote Sens. 1996, 17, 1425–1432. [Google Scholar] [CrossRef]
- Xu, H. Modification of normalised difference water index (NDWI) to enhance open water features in remotely sensed imagery. Int. J. Remote Sens. 2006, 27, 3025–3033. [Google Scholar] [CrossRef]
- Weng, Q.; Lu, D.; Schubring, J. Estimation of land surface temperature—Vegetation abundance relationship for urban heat island studies. Remote Sens. Environ. 2004, 89, 467–483. [Google Scholar] [CrossRef]
- Small, C.; Pozzi, F.; Elvidge, C.D. Spatial analysis of global urban extent from DMSP-OLS night lights. Remote Sens. Environ. 2005, 96, 277–291. [Google Scholar] [CrossRef]
- Congalton, R.G.; Green, K. Assessing the Accuracy of Remotely Sensed Data: Principles and Practices, 2nd ed.; CRC Press: Boca Raton, FL, USA, 2009. [Google Scholar]
- Lu, D.; Weng, Q. Spectral mixture analysis of aster images for examining the relationship between urban thermal features and biophysical descriptors in Indianapolis, Indiana, USA. Remote Sens. Environ. 2006, 104, 157–167. [Google Scholar] [CrossRef]
- Imhoff, M.; Lawrence, W.T.; Stutzer, D.C.; Elvidge, C.D. A technique for using composite DMSP/OLS “city lights” satellite data to map urban area. Remote Sens. Environ. 1997, 61, 361–370. [Google Scholar] [CrossRef]
© 2015 by the authors; licensee MDPI, Basel, Switzerland. This article is an open access article distributed under the terms and conditions of the Creative Commons Attribution license (http://creativecommons.org/licenses/by/4.0/).
Share and Cite
Guo, W.; Lu, D.; Wu, Y.; Zhang, J. Mapping Impervious Surface Distribution with Integration of SNNP VIIRS-DNB and MODIS NDVI Data. Remote Sens. 2015, 7, 12459-12477. https://doi.org/10.3390/rs70912459
Guo W, Lu D, Wu Y, Zhang J. Mapping Impervious Surface Distribution with Integration of SNNP VIIRS-DNB and MODIS NDVI Data. Remote Sensing. 2015; 7(9):12459-12477. https://doi.org/10.3390/rs70912459
Chicago/Turabian StyleGuo, Wei, Dengsheng Lu, Yanlan Wu, and Jixian Zhang. 2015. "Mapping Impervious Surface Distribution with Integration of SNNP VIIRS-DNB and MODIS NDVI Data" Remote Sensing 7, no. 9: 12459-12477. https://doi.org/10.3390/rs70912459
APA StyleGuo, W., Lu, D., Wu, Y., & Zhang, J. (2015). Mapping Impervious Surface Distribution with Integration of SNNP VIIRS-DNB and MODIS NDVI Data. Remote Sensing, 7(9), 12459-12477. https://doi.org/10.3390/rs70912459