Article

An Uneven Illumination Correction Algorithm for Optical Remote Sensing Images Covered with Thin Clouds

1
Shenzhen Key Laboratory of Spatial Smart Sensing and Services & Key Laboratory for Geo-Environmental Monitoring of Coastal Zone of the National Administration of Surveying, Mapping and GeoInformation, Shenzhen University, Shenzhen 518060, China
2
College of Information Engineering, Shenzhen University, Shenzhen 518060, China
3
State Key Laboratory of Information Engineering in Surveying, Mapping and Remote Sensing, Wuhan University, Wuhan 430079, China
4
College of Computer Science and Software Engineering, Shenzhen University, Shenzhen 518060, China
*
Author to whom correspondence should be addressed.
Remote Sens. 2015, 7(9), 11848-11862; https://doi.org/10.3390/rs70911848
Submission received: 4 June 2015 / Revised: 6 September 2015 / Accepted: 8 September 2015 / Published: 16 September 2015

Abstract

:
The uneven illumination phenomenon caused by thin clouds will reduce the quality of remote sensing images, and bring adverse effects to the image interpretation. To remove the effect of thin clouds on images, an uneven illumination correction can be applied. In this paper, an effective uneven illumination correction algorithm is proposed to remove the effect of thin clouds and to restore the ground information of the optical remote sensing image. The imaging model of remote sensing images covered by thin clouds is analyzed. Due to the transmission attenuation, reflection, and scattering, the thin cloud cover usually increases region brightness and reduces saturation and contrast of the image. As a result, a wavelet domain enhancement is performed for the image in Hue-Saturation-Value (HSV) color space. We use images with thin clouds in Wuhan area captured by QuickBird and ZiYuan-3 (ZY-3) satellites for experiments. Three traditional uneven illumination correction algorithms, i.e., multi-scale Retinex (MSR) algorithm, homomorphic filtering (HF)-based algorithm, and wavelet transform-based MASK (WT-MASK) algorithm are performed for comparison. Five indicators, i.e., mean value, standard deviation, information entropy, average gradient, and hue deviation index (HDI) are used to analyze the effect of the algorithms. The experimental results show that the proposed algorithm can effectively eliminate the influences of thin clouds and restore the real color of ground objects under thin clouds.

Graphical Abstract

1. Introduction

Due to illumination conditions and other factors (such as cloud cover, large shadow, etc.) during the acquisition process, an optical remote sensing image may not have the same luminance. Meanwhile, the atmospheric impact will affect the quality of remote sensing products, such as vegetation index map, land cover map, and other thematic maps [1,2]. In order to eliminate the atmospheric impact, it is important to perform the atmospheric correction. For optical remote sensing images, the uneven illumination phenomenon caused by thin clouds is one of the atmospheric impacts. Applications of massive amounts of optical remote sensing images are suffering from thin clouds. Therefore, it is important to eliminate the influence and improve the applicability and usability of optical remote sensing images affected by thin clouds. In order to eliminate the uneven illumination effect, it is necessary to perform the uneven illumination correction for optical remote sensing images [3].
Recently, there are many uneven illumination image correction algorithms proposed to meet the requirement of high-quality remote sensing images, such as model-based methods and image-based methods. The model-based methods are absolute atmospheric correction methods, which can eliminate the atmospheric attenuation if the knowledge of the sensor profile and the atmospheric properties are available and accurate [4]. However, the atmospheric properties are usually difficult to acquire, and the model-based methods cannot eliminate the locally-concentrated thin clouds well [5,6]. The image-based methods are independent of the model, and perform the color correction for single optical remote sensing images. Nowadays, the image-based methods are widely used to solve the uneven illumination phenomenon. These image-based methods can be divided into three categories: methods based on Retinex theory, methods based on homomorphic filtering (HF) and methods based on MASK.
The Retinex theory is a theory about color constancy represented by a model of the lightness and color perception of human vision. The Retinex theory was proposed by Land and McCann in 1971 [7], and was discussed in more detail in 1997 [8]. After that, the Retinex theory was applied into the field of image processing. Jobson proposed Single-scale Retinex (SSR) [9] for digital imaging processing, and then proposed multi-scale Retinex (MSR) [10] to eliminate the halos in SSR. Now the Retinex theory has become a hot topic in the image enhancement field [11,12,13,14,15], and been used for uneven illumination correction [16]. The core of Retinex theory is that the amount of visible light perceived by eyes depends on the product of reflectance and illumination [7]. The methods based on Retinex theory successfully eliminate uneven illumination, however, these methods change the real hue of ground objects in remote sensing images [16].
Based on the assumption that the low spatial frequency component is dominated by haze [17], the homomorphic filtering-based methods were adopted to suppress the low frequency information, so as to remove thin clouds in remote sensing images [5,18]. However, the homomorphic filtering may degrade the image quality because of the Gaussian filtering process [19].
Some researchers proposed methods to eliminate the uneven illumination phenomenon inspired by the MASK technique, which is a traditional optical image printing technology [20]. In the MASK algorithm, an uneven illumination image can be described by the sum of the background image and the uniform illumination image [21]. Thus, the uneven illumination phenomenon of the image can be removed by subtracting the background image from the original image. The critical step of these methods is how to obtain the background images. Wang et al. [20] and Yuan et al. [21] obtained the background image by Fast Fourier Transform (FFT). Zhang et al. [22] used wavelet transform instead of Fourier Transform, and proposed a modified MASK algorithm based on Wavelet Transform (WT-MASK). Due to the background subtraction, the processed image may lose information of background objects.
In this paper, we propose an uneven illumination correction algorithm based on HSV color space transform and wavelet domain enhancement. We use two optical remote sensing images captured by different satellites for experiments, and three state-of-the-art algorithms are tested for comparison. The proposed algorithm can remove the thin clouds and eliminate the uneven illumination phenomenon. The image quality is improved and the real color of ground objects is restored.

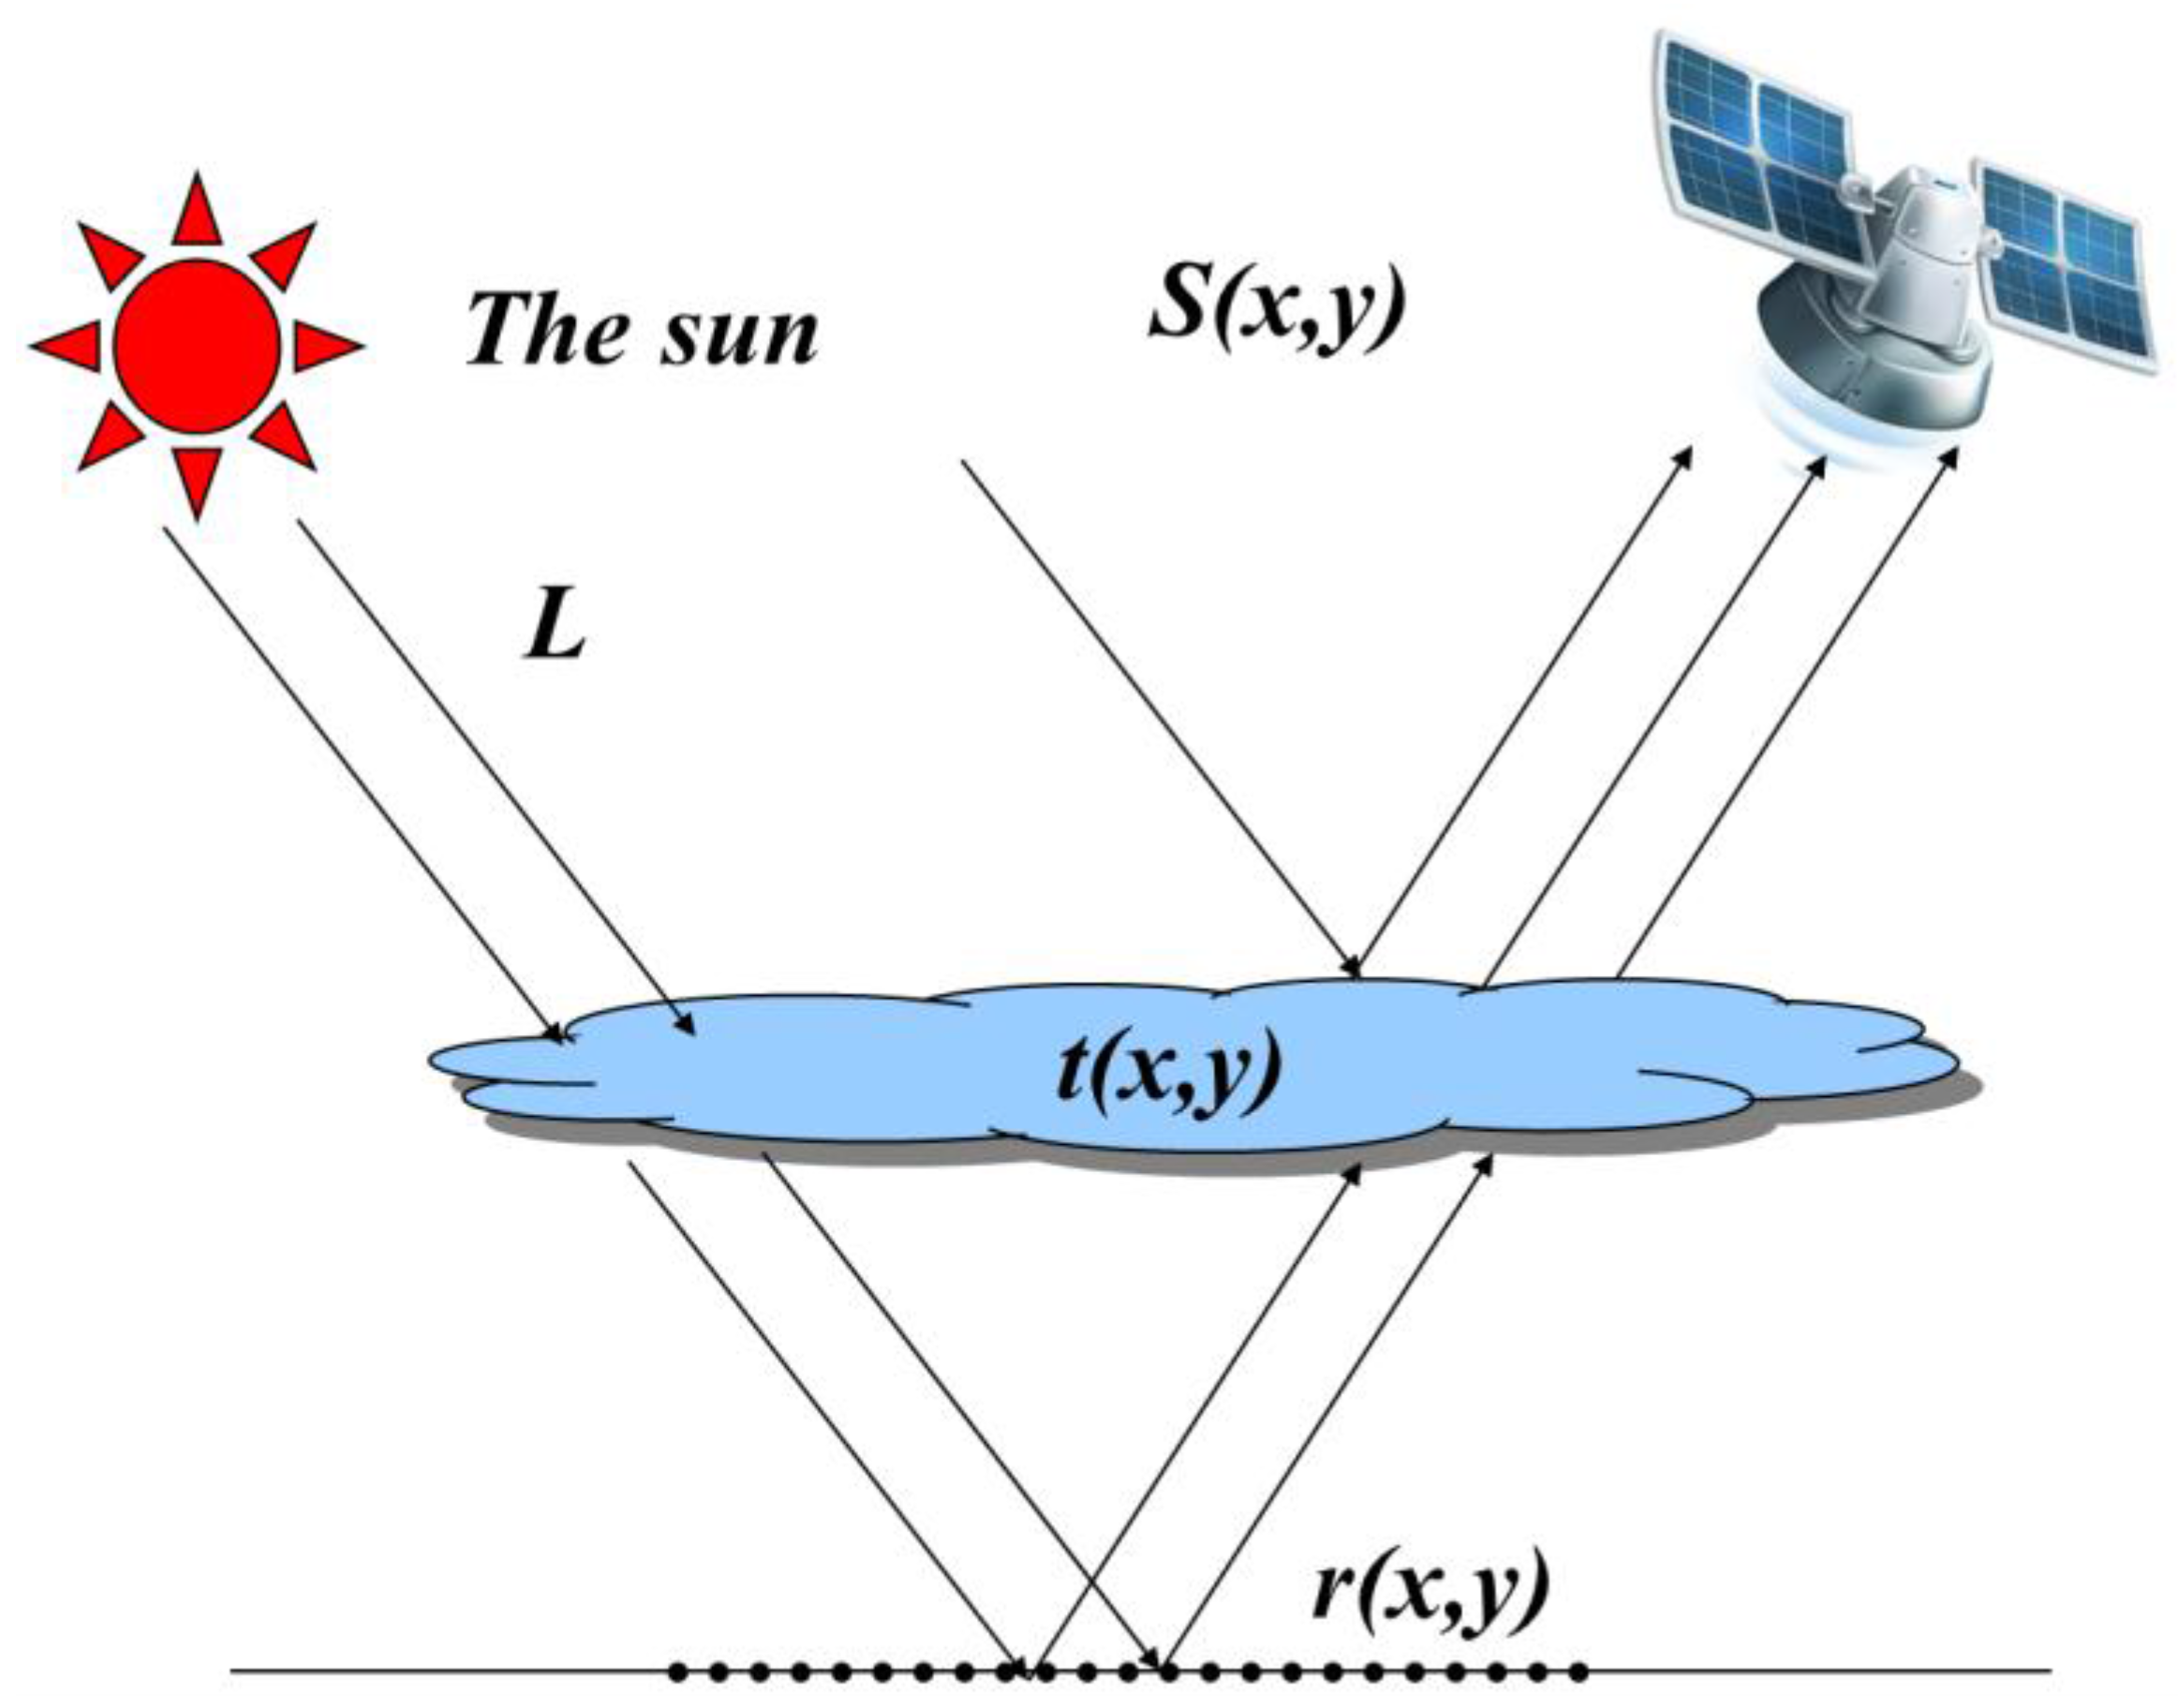
2. Imaging Model of Remote Sensing Images Covered by Thin Clouds

While thin clouds appear in dry seasons, the imaging model of remote sensing images covered by thin clouds are illustrated as Figure 1. An image captured by sensors could be referred to part of the sunlight reflected by thin clouds and part of the sunlight penetrating thin clouds but reflected by the surface. The imaging process of remote sensing images is shown in the following equation:
S ( x , y ) = a L r ( x , y ) t 2 ( x , y ) + a L ( 1 t ( x , y ) )
where S(x,y) is the image captured by the sensor. r(x,y) denotes the surface reflectivity. t(x,y) represents the cloudy transmissivity. L denotes the sunlight intensity, and a denotes the beam attenuation coefficient.
Figure 1. Imaging model of remote sensing images covered by thin clouds.
Remotesensing 07 11848 g001
After analyzing the above process, we can conclude several influences on imaging of remote sensing images covered by thin clouds.
(a)
The transmission attenuation of the imaging light by thin clouds. This type of light refers to the effective imaging, but the cloud reduces the contrast of the ground objects.
(b)
The reflection and scattering of the non-imaging light by thin clouds. This type of the light increases the brightness but decreases the saturation.
(c)
The scattering of the imaging light by thin clouds. This type of light causes blur of ground objects and decrease in contrast.
All of these three aspects finally lead to increases in brightness of areas covered by thin clouds, but decreases in saturation and contrast. In this paper, we aim to reduce brightness of areas covered by thin clouds, and raise saturation and image contrast, according to these characteristics.

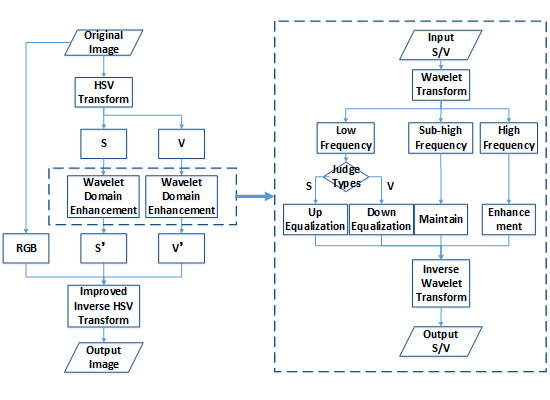
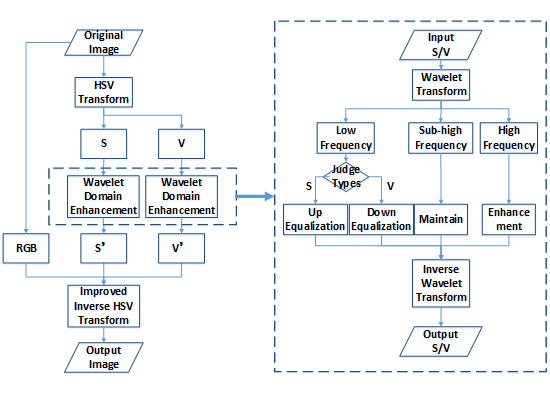
3. Image Uneven Illumination Correction Principle

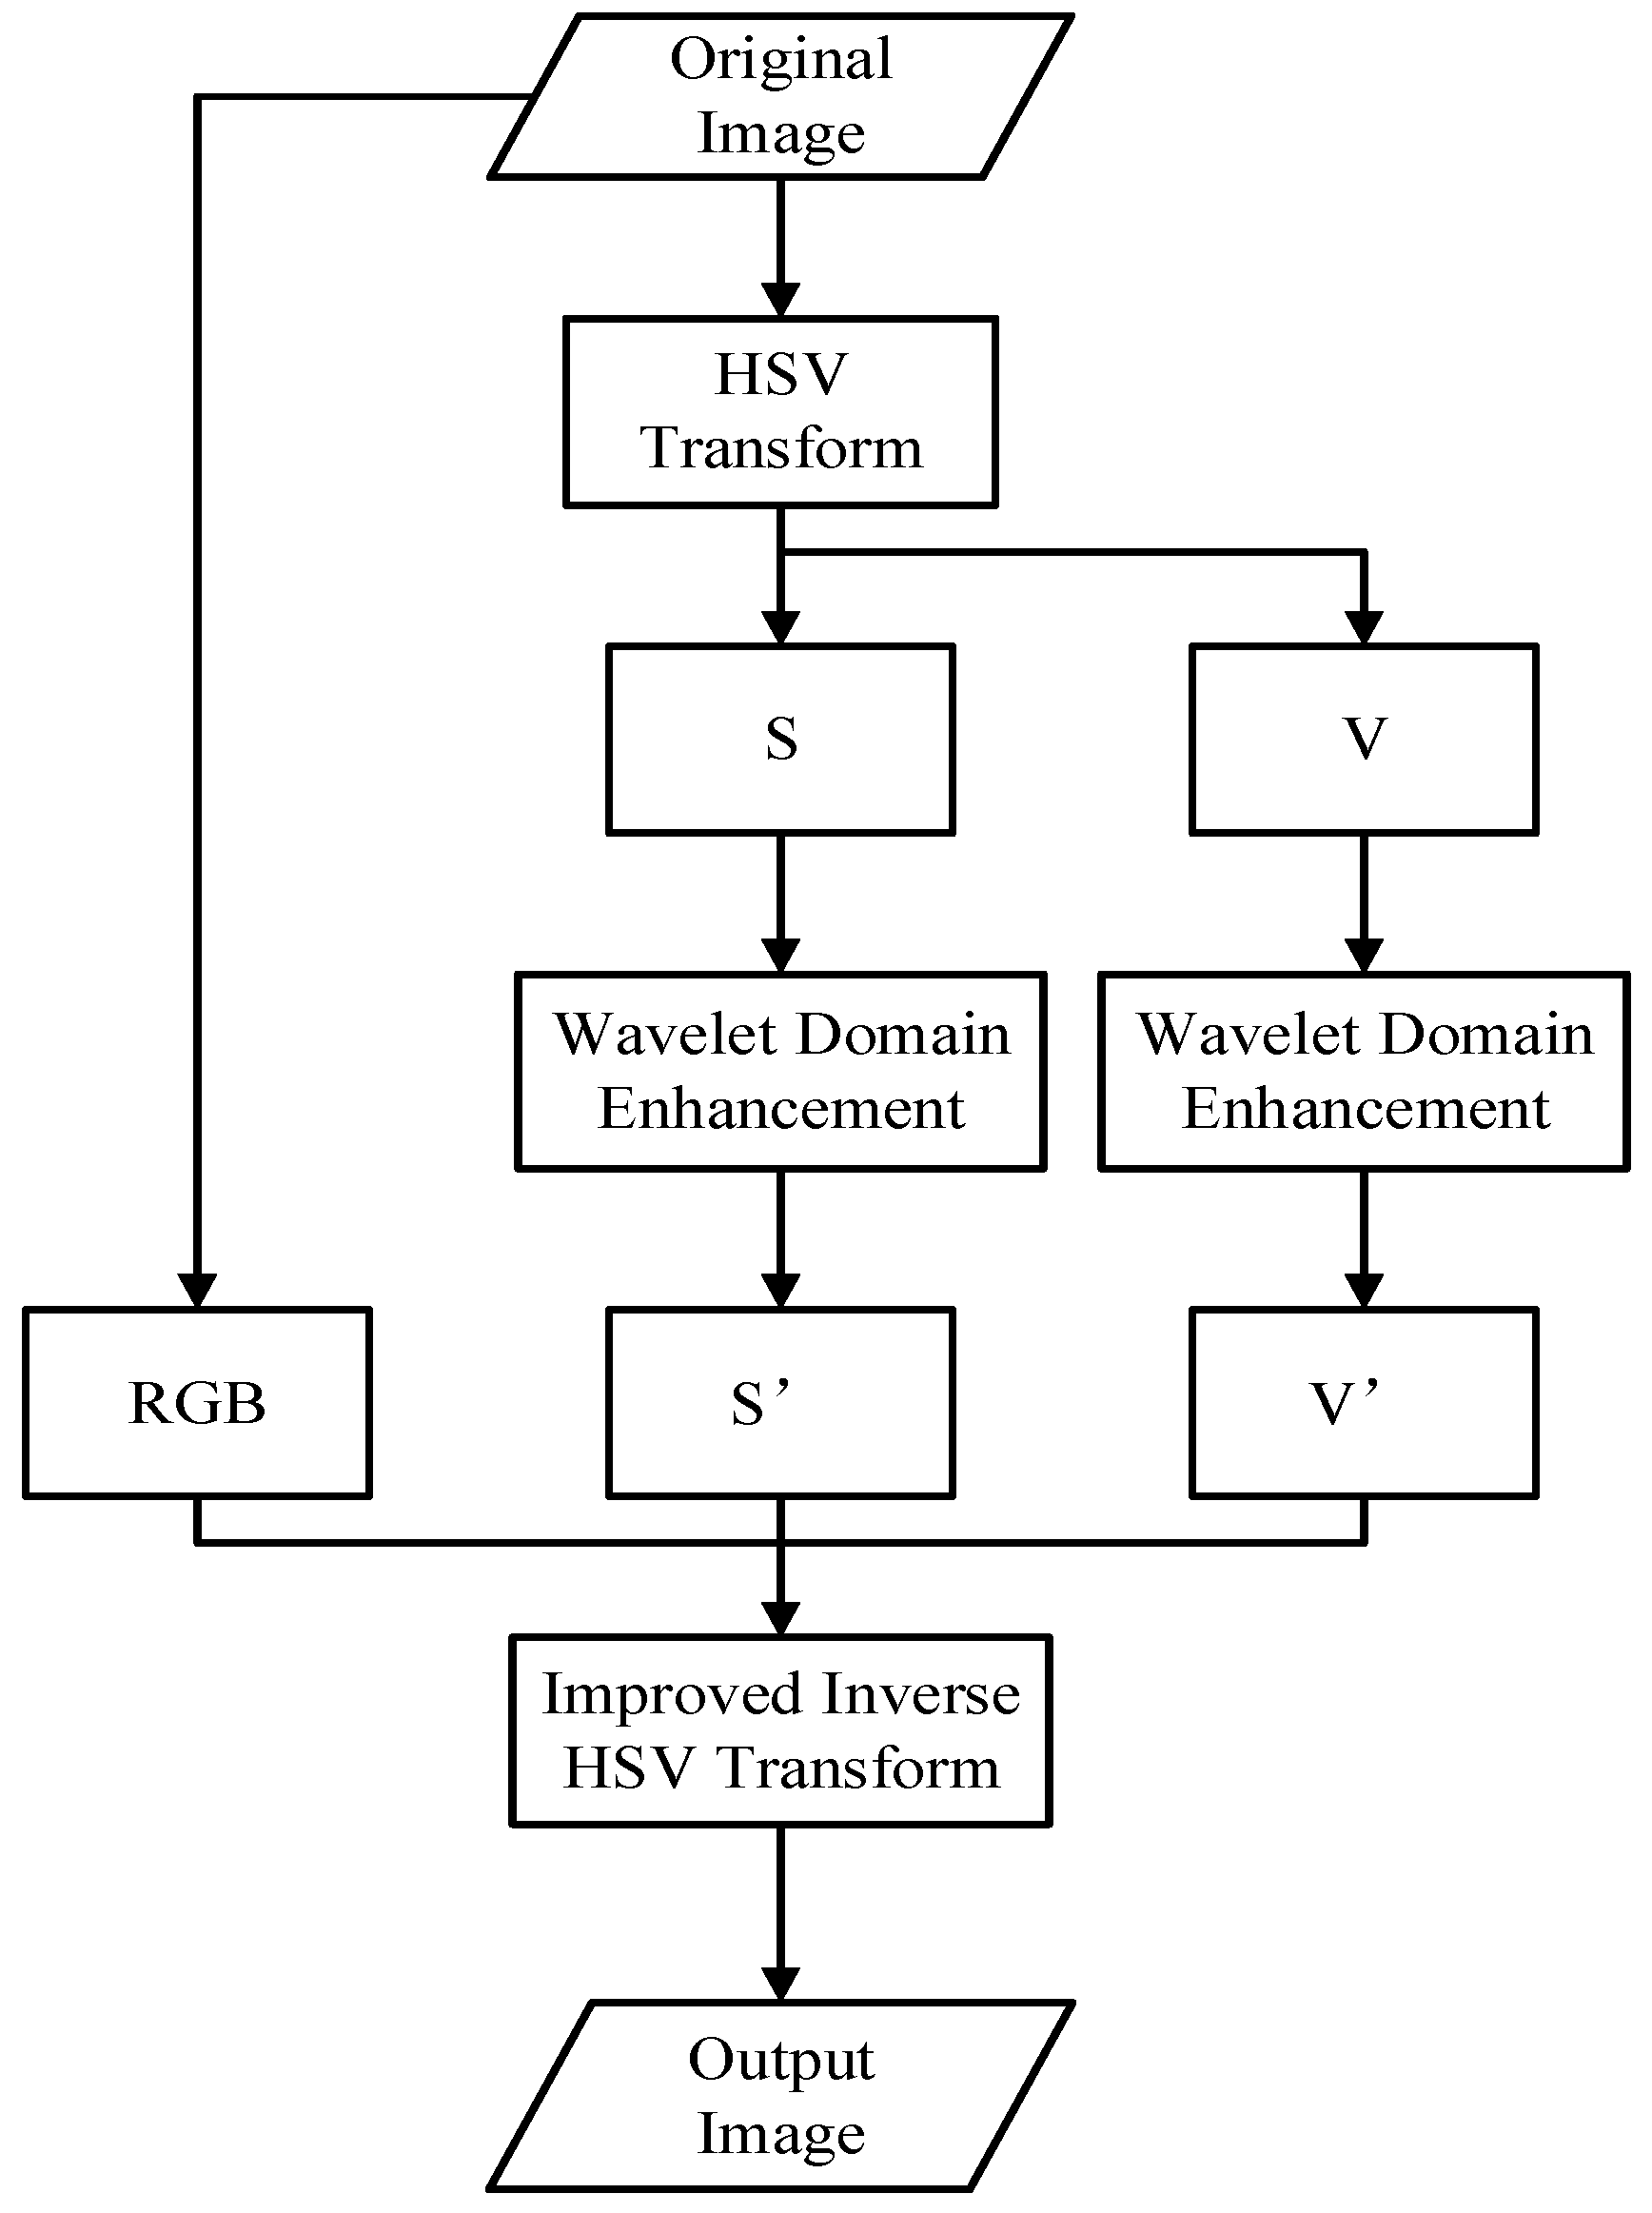
3.1. Improved HSV Color Space Transform

The areas covered by thin clouds show no distinct feature in Red-Green-Blue (RGB) color space. In order to use the characteristics such as high brightness, low saturation and contrast [23], the uneven illumination correction processing is performed in HSV color space. HSV color space is based on a mechanism of human visual model, which uses hue, saturation, and value for color representation.
Various color space models can be obtained under different coordinate systems, i.e., sphere model, cylindrical model, hexcone model, cone model, double-cone model, etc. [24,25,26]. In this paper, we adopt the HSV cone model. The axial direction of the cone model indicates the value component. The vertical axis indicates color from white to black. The radial direction of any horizontal circle section indicates the saturation component. The circumference’s angle of the circle section indicates the hue component.
The transform equations from RGB color space to HSV color space are as follows [27]:
{ H = { θ B G 360 ° θ B > G S = max min max V = max
where θ = arccos { 1 2 [ ( R G ) + ( R B ) ] ( R G ) 2 + ( R G ) ( G B ) } , max = max [ R , G , B ] , min = min [ R , G , B ] .
Hue is one of the most important features in remote sensing images, which indicates color relative to the wavelength of light. With thin clouds, the effects of Mie scattering to the hue of ground objects are negligible, we regards the hue in the image isn’t affected. As a result, improved inverse transform equations from HSV color space to RGB color space are proposed to make the hue invariant. As the equations do not include the hue component, we improve the HSV inverse transform from non-linear transform to linear transform. The equations without parameter H can reduce the running time and improve the algorithm efficiency. It is worth mentioning that the improved inverse transform equations can also be applied to the hexcone model and the double-cone model.
Suppose the HSV color P(H,S,V) of a pixel P(R,G,B) becomes P’(H’,S’,V’) after uneven illumination correction processing, we can calculate the pixel’s color P’(R’,G’,B’) in RGB color space as follows:
if  R = max , { R = V V R G = V V [ G ( R G ) ( S S ) S ] B = V V [ B ( R B ) ( S S ) S ] if  G = max , { R = V V [ R ( G R ) ( S S ) S ] G = V V G B = V V [ B ( G B ) ( S S ) S ] if  B = max , { R = V V [ R ( B R ) ( S S ) S ] G = V V [ G ( B G ) ( S S ) S ] B = V V B

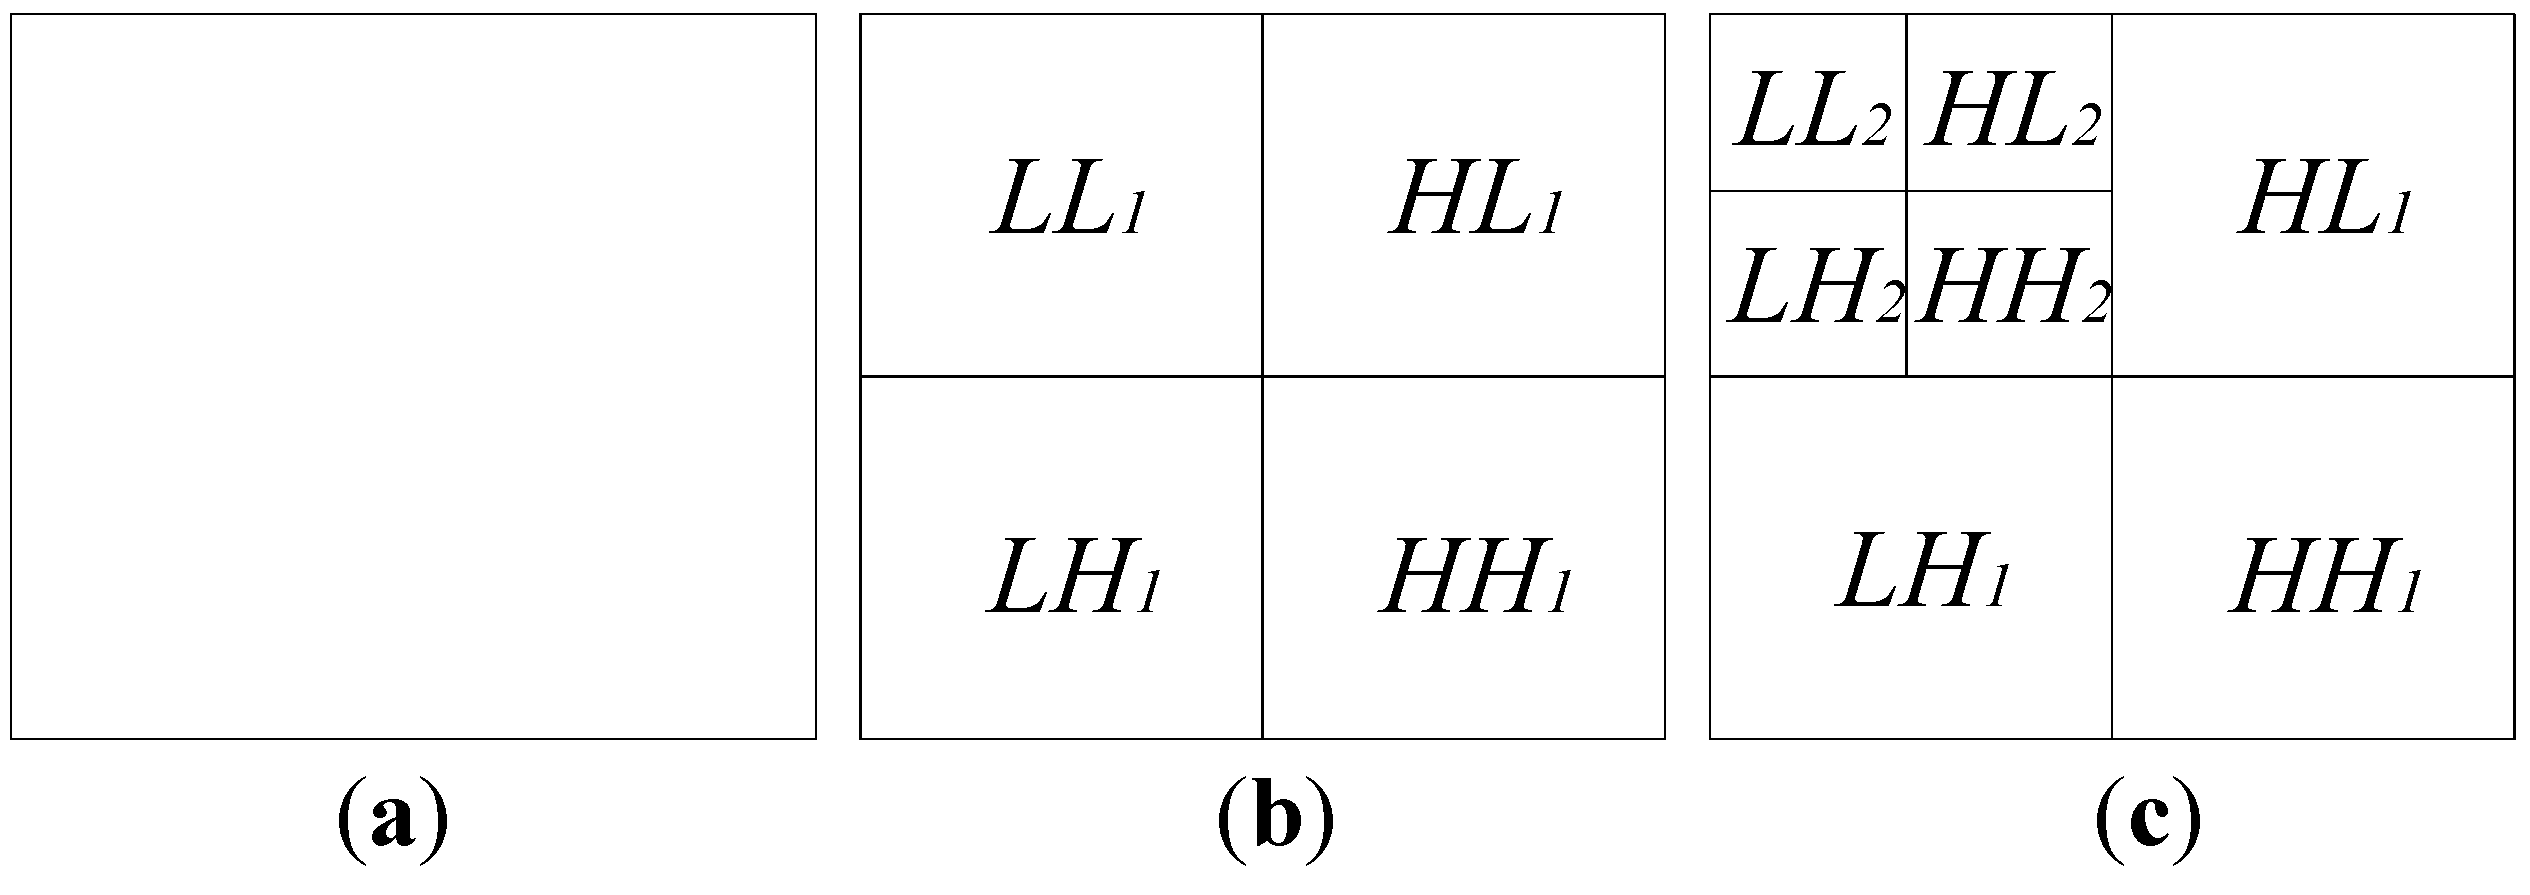
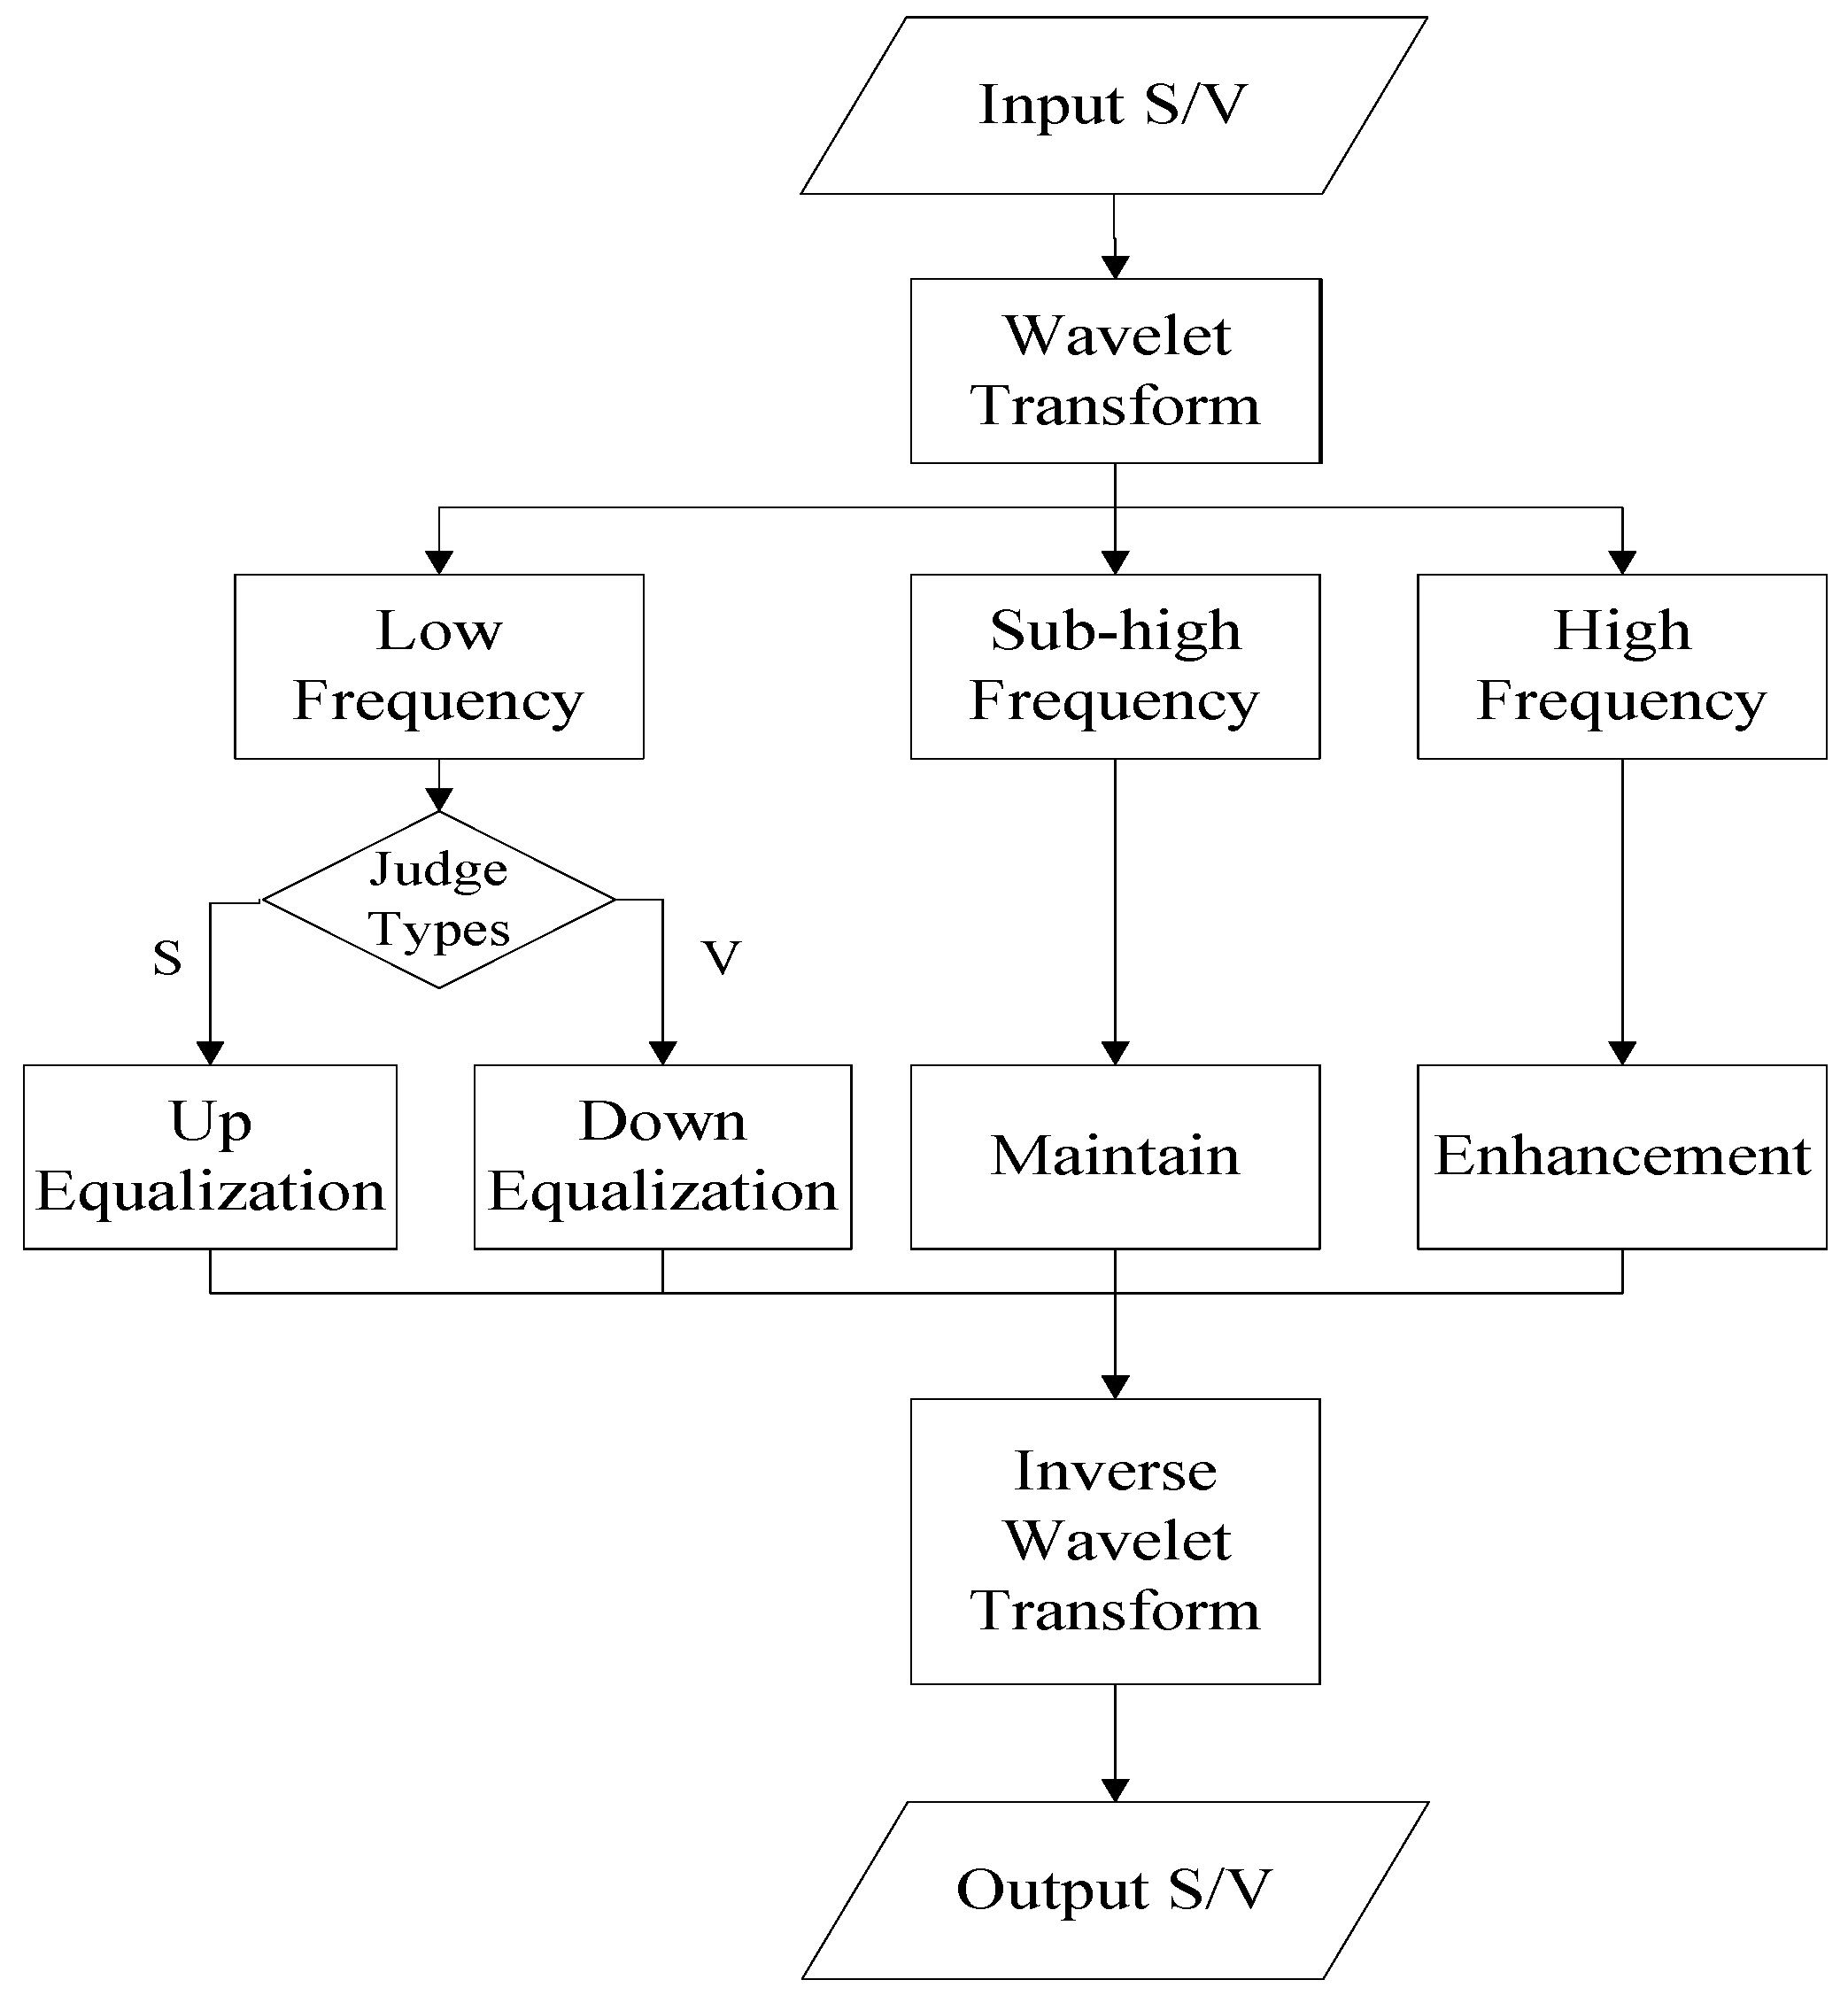
3.2. Uneven Illumination Correction Algorithm Based on Wavelet Domain Enhancement

The MASK algorithm obtains the background image by Gaussian low-pass filtering, and the images are transformed from spatial domain to frequency domain by Fourier transform. The applications of Fourier transform are limited because Fourier transform cannot extract both spatial and frequency information. Wavelet analysis has the advantages of multi-resolution analysis, and can express the local characteristics of signal in both the spatial and frequency domains [28,29].
An image can be viewed as a two dimensional matrix. Suppose the image size is N × N ( N = 2 n ) . Two dimensional wavelet transform decomposes the image into four sub-blocks, including image approximation coefficients (LL), the horizontal detail coefficients (LH), vertical detail coefficients (HL), and diagonal detail coefficients (HH). Further decomposing the LL sub-block image with two dimensional wavelet transform, four sub-blocks are constructed until it reaches a satisfactory level. Figure 2 shows the coefficient distribution of an image using two-level wavelet transform.
Approximation coefficients in the wavelet domain contain the background information of the image (low frequency information), and detail coefficients at different levels contain the detail information of the image at different scales (high frequency information). For remote sensing images covered by thin clouds, the effects of thin clouds are reflected in the background information while ground objects are reflected in the details. Wavelet analysis has the characteristics of multi-scale and multi-resolution, which can effectively separate the low and high frequency information of the image. According to the characteristics of images covered by thin clouds, the value and saturation components of the image in HSV color space are enhanced in wavelet domain differently.
Figure 2. Schematic of wavelet transform. (a) Original image; (b) one-level wavelet transform; and (c) two-level wavelet transform.
Remotesensing 07 11848 g002
As described in Section 2, the thin clouds cover in dry seasons increases region brightness, reduces saturation and contrast in remote sensing images, because of the transmission attenuation, reflection, and scattering by thin clouds. The algorithm enhances high frequency components, maintains sub-high frequency components and suppress low frequency components after wavelet transform. The thin cloud cover in remote sensing images is reflected in the low frequency component, and has characteristics such as low saturation and high brightness. Therefore, the proposed algorithm for the saturation component and the value component are processed in different ways.
The approximation coefficient C S ( m , n ) for saturation component after wavelet transform is processed as follows:
C S ( m , n ) = { m e a n [ C S ] , C S ( m , n ) < m e a n [ C S ] C S ( m , n ) , C S ( m , n ) m e a n [ C S ]
where C S ( m , n ) denotes the processed approximation coefficient, and m e a n [ C S ] denotes the mean value of the approximate coefficient.
The approximation coefficient C V ( m , n ) for value component after wavelet transform is processed as follows:
C V ( m , n ) = { C V ( m , n ) , C V ( m , n ) < m e a n [ C V ] m e a n [ C V ] , C V ( m , n ) m e a n [ C V ]
where C V ( m , n ) denotes the processed approximation coefficient, and m e a n [ C V ] denotes the mean value of the approximate coefficient.
For the high frequency components, a linear enhancement is performed as follows:
f ( x , y ) = k × ( f ( x , y ) μ ) + μ
where f ( x , y ) and f ( x , y ) denotes the high frequency coefficient before and after the enhancement, and μ denotes the mean value of the coefficient, and k denotes the enhancement coefficient.
The detailed uneven illumination correction algorithm is listed as follows. First, the input remote sensing image is transformed from RGB color space to HSV color space. Second, the saturation and value components are decomposed by wavelet transform. Third, the wavelet domain enhancement is performed. Different frequency components are handled correspondingly based on Equations (4)–(6). Last, the inverse wavelet transform is applied and the improved HSV inverse transform is performed based on Equation (3). In summary, the flow chart of the uneven illumination correction algorithm based on HSV transform and wavelet domain enhancement is shown in Figure 3. The algorithm flow chart of wavelet domain enhancement is shown in Figure 4.
Figure 3. Flow chart of the proposed algorithm.
Remotesensing 07 11848 g003
Figure 4. Flow chart of wavelet domain enhancement.
Remotesensing 07 11848 g004

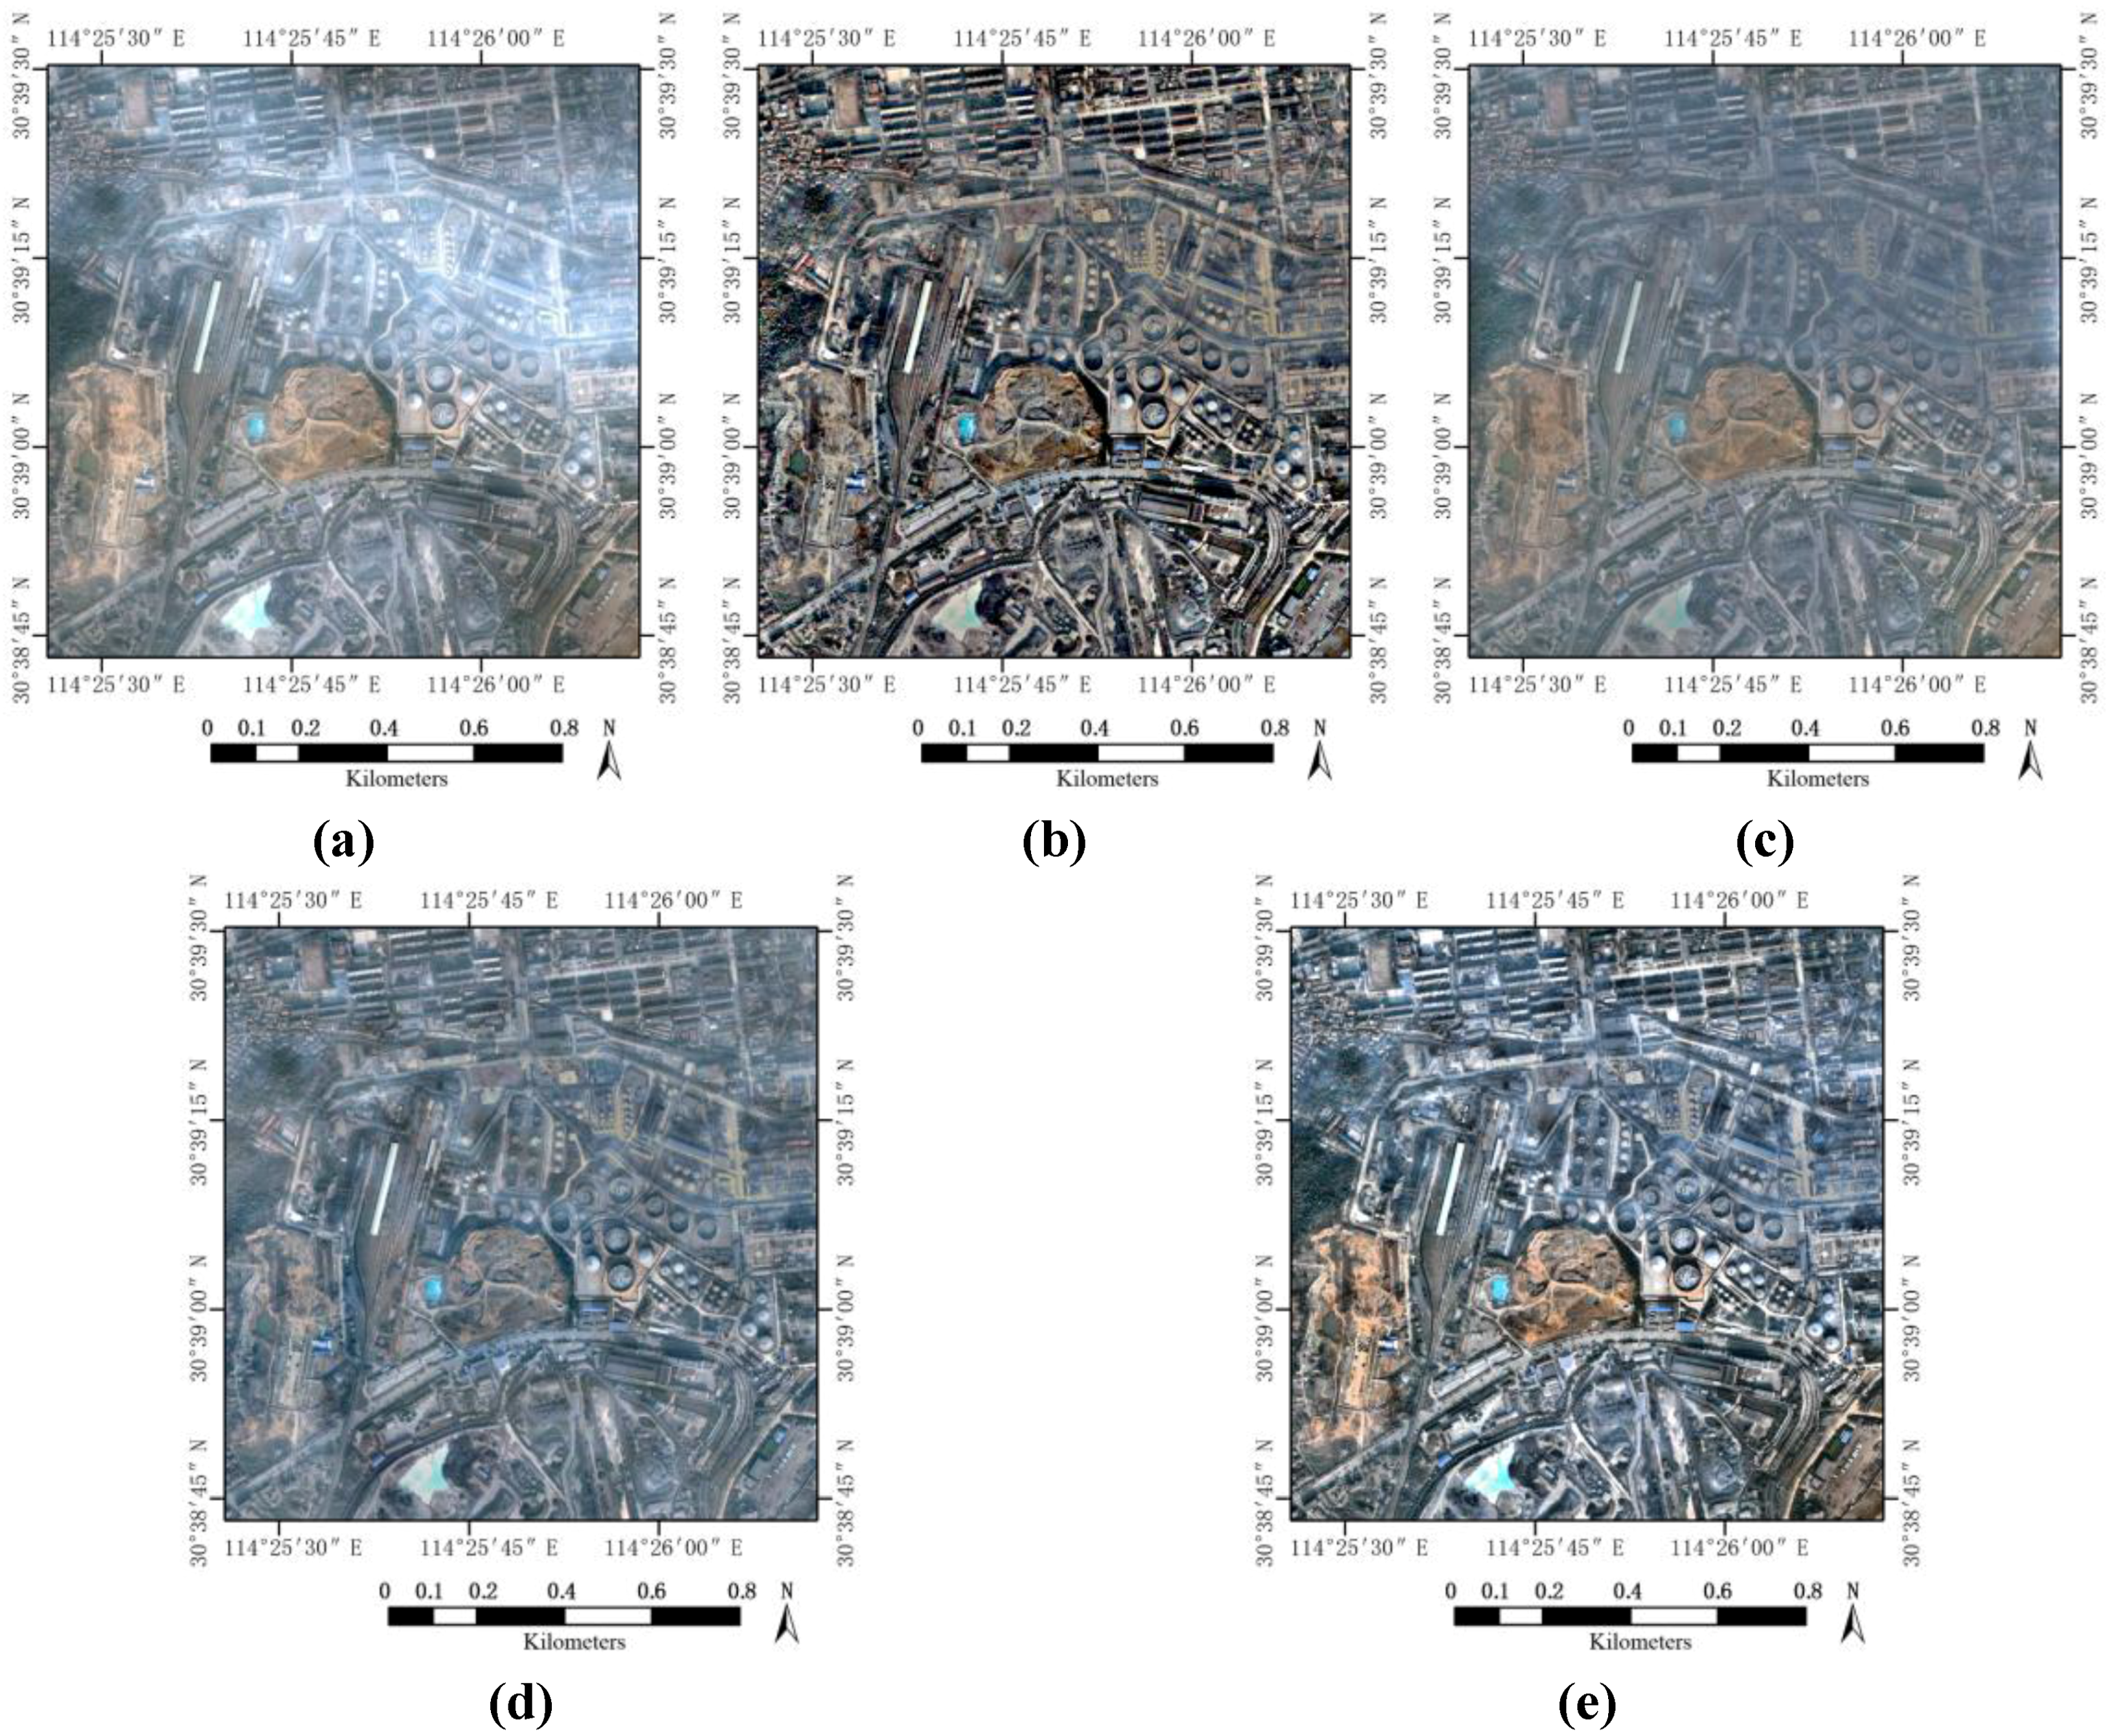
4. Experimental Results and Analysis

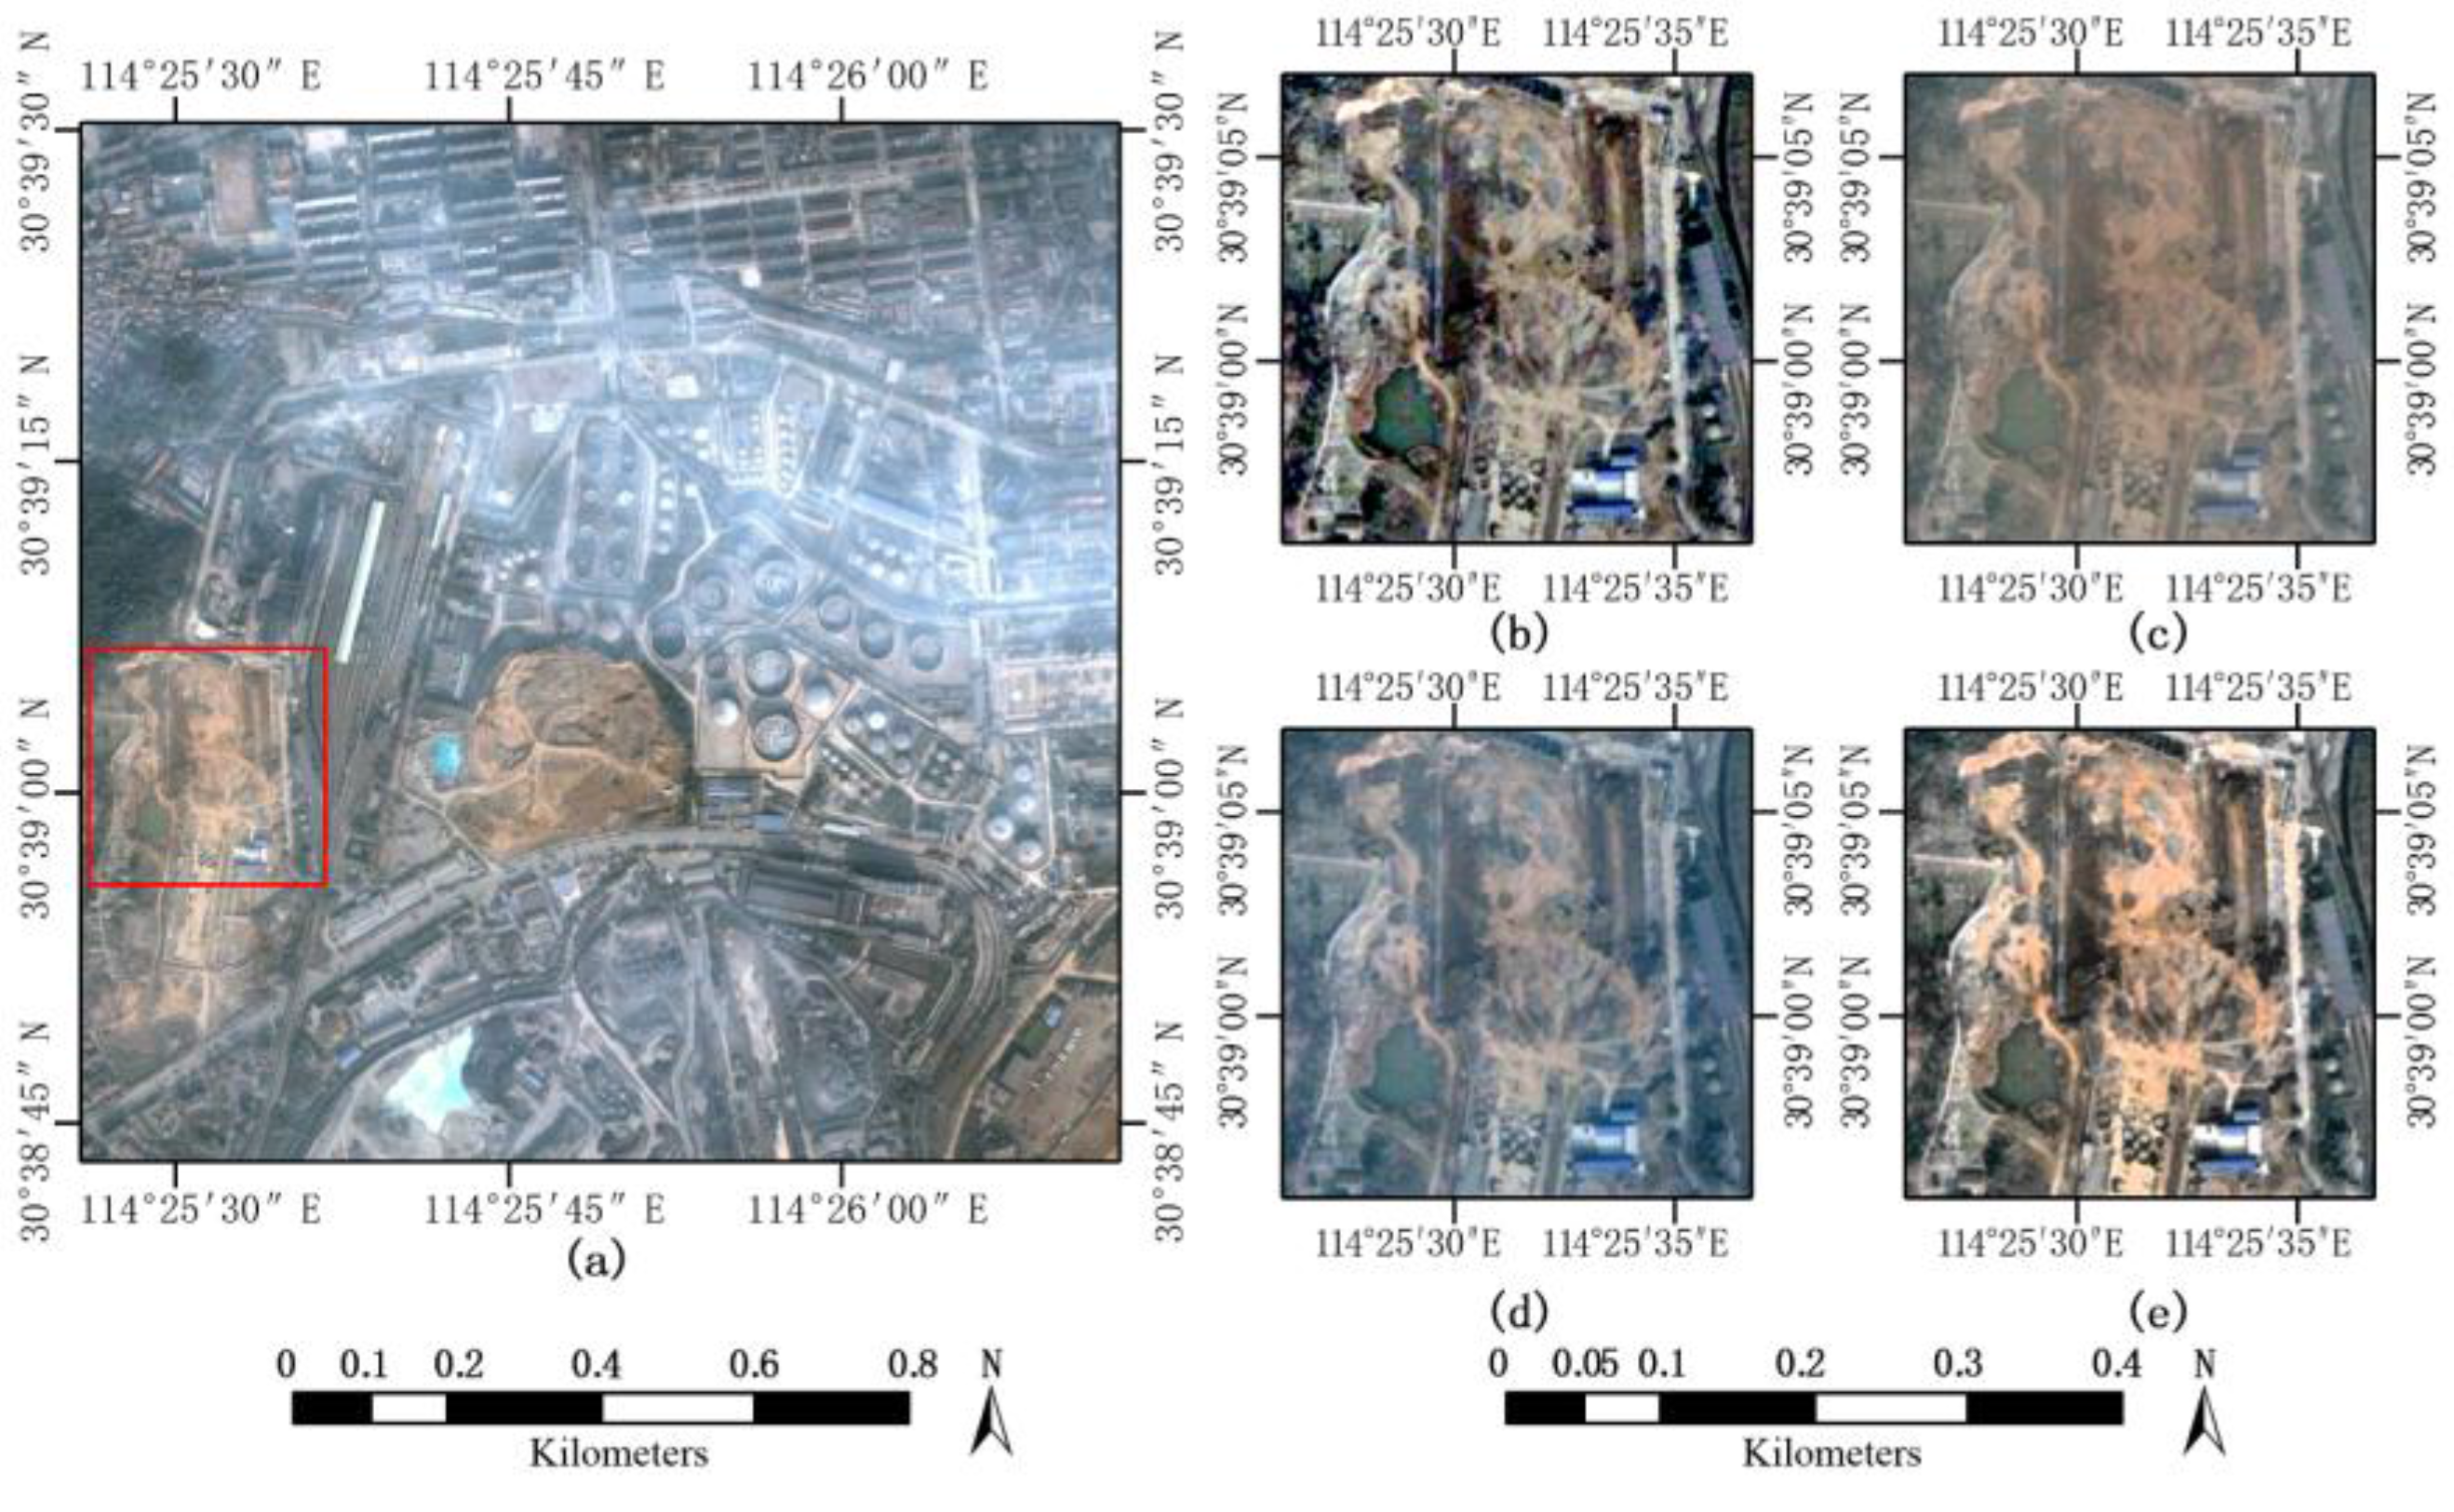
4.1. Experiments and Effects Evaluation

In order to test the proposed algorithm, two high resolution remote sensing images covered by thin clouds are chosen for experiments.
In the experiment I, a QuickBird satellite image with the size of 1024 × 1024 pixels is shown in Figure 5a, which was captured above the metropolitan area of Wuhan in 2006. There are obvious influences of thin clouds in the experimental image. The Daubechies-8 wavelet basis functions are utilized to conduct wavelet decomposition for the value component and the saturation component. Then the enhancement process is performed for the detail coefficients in the 1–6 level. In order to get the best clarity, we use the enhancement coefficient k = 2.0 and the result of the uneven illumination correction process is shown in Figure 5e. The appropriate enhancement coefficient is obtained through experiments, to make the details of ground objects clear enough and the experimental results satisfactory. For comparative analysis, three state-of-the-art uneven illumination correction algorithms, i.e., multi-scale Retinex algorithm in paper [10], homomorphic filtering-based algorithm in paper [18], and WT-MASK algorithm in paper [22] were tested. Their results are listed in Figure 5b–d, respectively. Enlarged sub-scenes of the results are shown in Figure 6, where the enlarged regions circled by the red rectangle in Figure 6a enhanced by different algorithms are listed in Figure 6b–e.
In the experiment II, a ZY-3 image with the size of 5000 × 5000 pixels from a Chinese high-resolution imaging satellite is shown in Figure 7a, which was also taken from Wuhan area in 2012. First, the Daubechies-8 wavelet basis functions are utilized to conduct wavelet decomposition for the value component and the saturation component. Then the detail coefficients in the 1-6 level are enhanced with the enhancement coefficient k = 2.0. Our proposed method achieves the uneven illumination correction result shown in Figure 7e. Figure 7b–d is the results of algorithms described in paper [10], paper [18], and paper [22], respectively.
After analyzing the experiment I and II, visible differences can be found between the original images and the proposed algorithm’s results. The remote sensing images processed by the proposed algorithm are greatly improved with even illumination, saturated color, distinct ground objects, and better visual impression. The influences of thin clouds in the two experiments have been removed to a great extent. In experiment I, the WT-MASK algorithm shows a bleached result in general, while the homomorphic filtering-based algorithm produces a grey image. In experiment II, the homomorphic filtering-based algorithm and WT-MASK algorithm make the result image dark and blurred. The explanation is that the homomorphic filtering and the background subtraction method in WT-MASK algorithm result in the loss of background information. In the two experiments, the ground objects including bare land, vegetation, waters, and buildings are changed from their original color characteristics by the MSR algorithm. The color distortion of ground objects may bring adverse effects to the image interpretation. Figure 6 shows the results of an enlarged sub-scene in experiment I. From the enlarged region circled by the red rectangle in Figure 6a, we can see the colors of the bare land in the region are changed from earthy yellow to grey by the MSR algorithm. The results by the MSR algorithm may confuse the interpreters between bare land and concrete surfaces. The proposed algorithm can retain color characteristics for background objects, and will not generate color distortion. Compared with the traditional algorithms, the proposed algorithm can get better results in enhancing the clarity of ground objects, like man-made buildings.
Figure 5. Uneven illumination correction performance of experiment I. (a) Original image; (b) MSR algorithm; (c) HF-based algorithm; (d) WT-MASK algorithm; and (e) the proposed algorithm.
Remotesensing 07 11848 g005
Figure 6. The results of the enlarged sub-scene region. (a) The enlarged region circled by the red rectangle in original image; (b) the result of MSR; (c) the result of HF-based algorithm; (d) the result of WT-MASK; and (e) the result of the proposed algorithm.
Remotesensing 07 11848 g006
Figure 7. Uneven illumination correction performance of experiment II. (a) Original image; (b) MSR algorithm; (c) HF-based algorithm; (d) WT-MASK algorithm; and (e) the proposed algorithm.
Remotesensing 07 11848 g007

4.2. Quantitative Analysis

Five indicators are selected to quantitatively evaluate the effects of four different uneven illumination correction algorithms. The five indexes are mean value, standard deviation, information entropy, average gradient, and hue deviation index, respectively [30,31]. In the following equations, M and N denote the row number and column number, and f(x,y) denotes the number of pixel located in the xth row and yth column.
(a)
Mean value represents the average brightness of all pixels in the whole image:
m e a n = 1 M × N x = 1 M y = 1 N f ( x , y )
(b)
Standard deviation represents the deviation extent of all pixels in the whole image, and reflects the whole contrast of the entire image. The higher standard deviation an image has, the more contrast information is highlighted:
s t d = 1 M × N x = 1 M y = 1 N [ f ( x , y ) m e a n ] 2
(c)
Information entropy stands for the richness of the information of an image. The higher information entropy an image contains, the richer information it conveys. If the pixel value of the image ranges from 0 to 255, the information entropy is calculated as follows:
H = i = 0 255 P i × log 2 P i
where Pi denotes the probability of digital number i.
(d)
Average gradient represents the differences between neighbor pixels, and reflects the contrast of image details. The higher average gradient an image has, the more contrast of image details you will see and the more ground objects are highlighted:
g r a d = 1 ( M 1 ) ( N 1 ) x = 1 M 1 y = 1 N 1 [ f ( x + 1 , y ) f ( x , y ) ] 2 + [ f ( x , y + 1 ) f ( x , y ) ] 2 2
(e)
Hue deviation index (HDI) denotes the variations of hue between an original image and the processed image. A lower hue deviation index represents the smaller hue variations. HDI less than 1% means that the uneven illumination correction process can keep the hue very well, and the processed images do not have color distortions:
H D I = x = 1 M y = 1 N min [ | H O r i ( x , y ) H R e ( x , y ) | , 1 | H O r i ( x , y ) H R e ( x , y ) | ] M × N × 100 %
where HOri(x,y) and HRe(x,y) denote the hues of the pixel located in the xth row and yth column in the original image and the processed image, respectively.
The comparative results of the four different uneven illumination correction algorithms for the experimental images are listed in Table 1 and Table 2, respectively. According to the statistics in the two tables, the average brightness of the image processed by the proposed algorithm is reduced, due to the removal of thin clouds.
In terms of the information entropy, the MSR algorithm is slightly better than the proposed algorithm in experiment II, while the proposed algorithm is optimal in experiment I. The background subtraction method in WT-MASK and the homomorphic filtering result in the loss of background information. However, the proposed wavelet domain enhancement algorithm enriches the information of details, which facilitates the process of visual interpretation.
In terms of standard deviation and average gradient, the proposed algorithm and the MSR algorithm give a relatively improvement over the original image, while the standard deviation and average gradient of the other two algorithms decreases to some extent separately. This suggests that the proposed algorithm can provide rich details and clear images.
As stated in Section 3.1, hue is constant during processing. It is known from the comparison that the proposed algorithm and the homomorphic filtering-based algorithm have obvious advantages in keeping the hue. The MSR algorithm has the highest HDI in two experiments, which means the MSR algorithm may result in color distortion of ground objects. The proposed algorithm can effectively restore the real color under thin clouds.
Table 1. Quantitative results of experiment I.
IndicatorChannelOriginal ImageMSR AlgorithmHF-based AlgorithmWT-MASK AlgorithmThe Proposed Algorithm
Mean valueR140.92103.23114.63109.90113.63
G152.00103.85123.30123.09123.19
B161.97104.73130.64134.17131.31
Standard deviationR39.1259.2625.7735.1656.60
G38.1055.2420.4630.0851.08
B43.1950.5320.4628.9450.75
Information entropyR7.317.546.687.157.72
G7.257.556.346.917.61
B7.387.506.376.867.59
Average gradientR7.1716.105.898.3414.34
G6.7216.635.517.8213.95
B6.6815.475.487.7714.04
HDI----17.890.297.470.34
Table 2. Quantitative results of experiment II.
IndicatorChannelOriginal ImageMSR AlgorithmHF-based AlgorithmWT-MASK AlgorithmThe Proposed Algorithm
Mean valueR85.63 104.31 49.05 77.63 73.78
G95.83 106.27 54.67 83.39 82.39
B101.96 106.38 57.18 84.32 86.90
Standard deviationR28.72 46.74 13.17 20.34 33.95
G29.14 38.17 11.23 17.41 31.97
B35.27 36.95 11.60 17.33 34.01
Information entropyR6.82 7.45 5.54 6.27 6.97
G6.89 7.18 5.39 6.06 6.95
B7.17 7.11 5.42 6.03 7.05
Average gradientR5.77 16.67 3.68 5.89 10.97
G5.59 15.20 3.59 5.71 10.88
B5.61 14.96 3.60 5.74 11.04
HDI----16.82 0.55 11.94 0.43
In our experiments, the proposed algorithm and the MSR algorithm both gave a great improvement over the original images in entropy, standard deviation, and average gradient, which means the two algorithms can enrich the image information, highlight the details of ground objects, and improve the image quality. However, the hue invariance is also very important in the uneven illumination correction process, and remote sensing images with color distortion may seriously affect the image interpretation. In our experiments, the MSR algorithm gave the highest HDI, i.e., the most serious color distortion. It can be seen from the experimental images that the MSR algorithm’s results changed the color characteristics of the whole image the most, which may bring adverse effects to the image interpretation. The HDI of the proposed algorithm and the homomorphic filtering-based algorithm is less than 1%, which means that the algorithms can keep the hue very well and will not generate any color distortion.

5. Conclusions

In this paper, we studied the HSV color space model and wavelet analysis theory, and proposed a remote sensing image uneven illumination correction algorithm, to correct the uneven illumination phenomenon affected by thin clouds. By analyzing the influences of thin clouds using the imaging model of remote sensing images covered by thin clouds, the proposed algorithm can effectively correct the uneven illumination phenomenon.
We used two different satellite images for experiments, three state-of-the-art algorithms for comparison, and five indicators for evaluation. In the first QuickBird image experiment, the proposed algorithm increased the standard deviation by 32.09% from the original image (the average of RGB channels, similarly hereafter), and increased the average gradient by 105.92%. In the second ZY-3 image experiment, the proposed algorithm increased the standard deviation by 8.12%, and increased the average gradient by 93.85%. These experimental results indicate that the proposed algorithm can eliminate the influences of thin clouds effectively, and improve the quality of the whole image. In terms of the standard deviation and the average gradient, the proposed algorithm has better performances than the HF-based algorithm and WT-MASK algorithm, while the MSR algorithm performs best. In terms of the information entropy, the proposed algorithm has an improvement of 4.47% in experiment I and 0.47% in experiment II. The proposed algorithm and the MSR algorithm both increased the information entropy. The proposed algorithm performs best in experiment I, while the MSR algorithm performs best in experiment II. The results indicate that the proposed algorithm can enrich the information of details, which facilitates the following process of visual interpretation. In terms of the HDI, the proposed algorithm has a HDI less than 1% in the two experiments, as well as the HF-based algorithm, which means the proposed algorithm can keep the hue very well, and does not produce color distortions in the processed images.
In general, the proposed algorithm for the uneven illumination correction can effectively eliminate the influences of thin clouds, and restore the real color of ground objects under thin clouds. However, the MSR algorithm can provide more local contrast of the image and highlight the image details better. In our future work, we will study on the enhancement of the image details to provide clearer ground objects under thin clouds.

Acknowledgments

This work is jointly supported by grants from National Natural Science Foundation of China (No. 61272050 and 41501370), the Science Foundation of Guangdong Province (No. 2014A030313556), Shenzhen Scientific Research and Development Funding Program (No. ZDSY20121019111146499 and JSGG20121026111056204), Shenzhen Dedicated Funding of Strategic Emerging Industry Development Program (No. JCYJ20121019111128765), the Science Foundation of Shenzhen City (No. JCYJ20130329115750231), and the Funding of Key Laboratory of Satellite Mapping Technology and Application, National Administration of Surveying, Mapping and Geoinformation.

Author Contributions

Linlin Shen is the corresponding author who designed the algorithm and revised the paper. Xiaole Shen implemented the algorithm and wrote the whole paper. Qingquan Li suggested the experimental design and revised the paper. Yingjie Tian helped to implement the algorithm and comparative experiments.

Conflicts of Interest

The authors declare no conflict of interest.

References

  1. Agapiou, A.; Hadjimitsis, D.G.; Papoutsa, C.; Alexakis, D.D.; Papadavid, G. The importance of accounting for atmospheric effects in the application of NDVI and interpretation of satellite imagery supporting archaeological research: The case studies of Palaepaphos and Nea Paphos Sites in Cyprus. Remote Sens. 2011, 3, 2605–2629. [Google Scholar] [CrossRef]
  2. Hadjimitsis, D.G.; Papadavid, G.; Agapiou, A.; Themistocleous, K.; Retalis, A.; Michaelides, S.; Chrysoulakis, N.; Toulios, L.; Clayton, C.R.I. Atmospheric correction for satellite remotely sensed data intended for hydrological cycle applications: Impact on vegetation indices. Nat. Hazards Earth Syst. Sci. 2010, 10, 89–95. [Google Scholar] [CrossRef]
  3. Du, Y.; Cihlar, J.; Beaubien, J.; Latifovic, R. Radiometric normalization, compositing, and quality control for satellite high resolution image mosaics over large areas. IEEE Trans. Geosci. Remote Sens. 2001, 39, 623–634. [Google Scholar]
  4. Jensen, J.R. Introductory Digital Image Processing: A Remote Sensing Perspective, 3rd ed.; Prentice-Hall Inc.: Upper Saddle River, NJ, USA, 1996. [Google Scholar]
  5. Shen, H.F.; Li, H.F.; Qian, Y.; Zhang, L.P.; Yuan, Q.Q. An effective thin cloud removal procedure for visible remote sensing images. ISPRS J. Photogramm. Remote Sens. 2014, 96, 224–235. [Google Scholar] [CrossRef]
  6. Liang, S. Atmospheric correction of Landsat ETM+ land surface imagery-part I: Methods. IEEE Trans. Geosci. Remote Sens. 2001, 39, 2490–2498. [Google Scholar] [CrossRef]
  7. Land, E.H.; McCann, J.J. Lightness and Retinex theory. J. Opt. Soc. Amer. 1971, 61, 1–11. [Google Scholar] [CrossRef]
  8. Land, E.H. The Retinex theory of color vision. Sci.Am. 1977, 237, 108–128. [Google Scholar] [CrossRef] [PubMed]
  9. Jobson, D.J.; Rahman, Z.U.; Woodell, G.A. Properties and performance of a center/surround Retinex. IEEE Trans. Image Process. 1997, 6, 451–462. [Google Scholar] [CrossRef] [PubMed]
  10. Jobson, D.J.; Rahman, Z.U.; Woodell, G.A. A multiscale Retinex for bridging the gap between color images and the human observation of scenes. IEEE Trans. Image Process. 1997, 6, 965–976. [Google Scholar] [CrossRef] [PubMed]
  11. Jang, J.H.; Bae, Y.; Ra, J.B. Contrast-enhanced fusion of multisensor images using subband-decomposed multiscale retinex. IEEE Trans. Image Process. 2012, 21, 3479–3490. [Google Scholar] [CrossRef] [PubMed]
  12. Jang, J.H.; Kim, S.D.; Ra, J.B. Enhancement of optical remote sensing images by subband-decomposed multiscale retinex with hybrid intensity transfer function. IEEE Geosci. Remote Sens. Lett. 2011, 8, 983–987. [Google Scholar] [CrossRef]
  13. Jang, I.S.; Lee, T.H.; Kyung, W.J. Local contrast enhancement based on adaptive multiscale retinex using intensity distribution of input image. J. Imaging Sci. Technol. 2011, 55, 1–14. [Google Scholar] [CrossRef]
  14. Rahman, Z.; Jobson, D.J.; Woodell, G.A. Investigating the relationship between image enhancement and image compression in the context of the multi-scale retinex. J. Vis. Commun. Image Represent. 2011, 22, 237–250. [Google Scholar] [CrossRef]
  15. Lee, S. An efficient content-based image enhancement in the compressed domain using retinex theory. IEEE. Trans. Circuits Syst. Video Technol. 2007, 17, 199–213. [Google Scholar] [CrossRef]
  16. Li, H.F.; Zhang, L.P.; Shen, H.F. A perceptually inspired variational method for the uneven intensity correction of remote sensing images. IEEE Trans. Geosci. Remote Sens. 2012, 50, 3053–3065. [Google Scholar] [CrossRef]
  17. Du, Y.; Guindon, B.; Cihlar, J. Haze detection and removal in high resolution satellite image with wavelet analysis. IEEE Trans. Geosci. Remote Sens. 2002, 40, 210–217. [Google Scholar]
  18. Nnolim, U.; Lee, P. Homomorphic Filtering of colour images using a Spatial Filter Kernel in the HSI colour space. In Proceedings of the 25th IEEE Instrumentation and Measurement Technology Conference, Victoria, Canada, 12–15 May 2008; pp. 1738–1743.
  19. Liu, J.; Wang, X.; Chen, M.; Liu, S.G.; Shao, Z.F.; Zhou, X.R.; Liu, P. Illumination and contrast balancing for remote sensing images. Remote Sens. 2014, 6, 1102–1123. [Google Scholar] [CrossRef]
  20. Wang, M.; Pan, J.; Chen, S.Q.; Li, H. A method of removing the uneven illumination phenomenon for optical remote sensing image. In Proceedings of the 25th IEEE International Geoscience and Remote Sensing Symposium (IGARSS 2005), Seoul, Korea, 25–29 July 2005; pp. 3243–3246.
  21. Yuan, X.X.; Han, Y.T.; Fang, Y. Improved mask dodging algorithm for aerial imagery. J. Remote Sens. 2014, 18, 630–641. [Google Scholar]
  22. Zhang, Z.; Zhu, B.S.; Zhu, S.L.; Cao, W. Improved Mask dodging method based on wavelet. J. Remote Sens. 2009, 13, 1074–1081. [Google Scholar]
  23. Pratt, W.K. Digital Image Processing, 3rd ed.; Wiley: New York, NY, USA, 2001. [Google Scholar]
  24. Smith, A.R. Color gamut transform pairs. ACM SIGGRAPH Comput. Graph. 1978, 12, 12–19. [Google Scholar] [CrossRef]
  25. Androutsos, D.; Plataniotis, K.N.; Venetsanopoulos, A.N. A novel vector-based approach to color image retrieval using a vector angular-based distance measure. Comput. Vis. Image Underst. 1999, 75, 46–58. [Google Scholar] [CrossRef]
  26. Gonzalez, R.C.; Woods, R.E. Digital Image Processing, 3rd ed.; Addison-Wesley: MA, USA, 2009. [Google Scholar]
  27. Chu, H.; Zhu, W.L. Fusion of Ikonos satellite imagery using IHS transform and local variation. IEEE Geosci. Remote Sens. Lett. 2008, 5, 653–657. [Google Scholar]
  28. Mallat, S.G. A theory for multiresolution signal decomposition: the wavelet representation. IEEE Trans. Pattern Anal. Mach. Intell. 1989, 11, 674–693. [Google Scholar] [CrossRef]
  29. Mallat, S. A Wavelet Tour of Signal Processing; Academic Press: Boston, MA, USA, 1998. [Google Scholar]
  30. Jobson, D.J.; Rahman, Z.U.; Woodell, G.A. The statistics of visual representation. In Proceedings of the Conference on Visual Information Processing XI, Orlando, FL, USA, 4 April 2002; pp. 25–35.
  31. Liu, J.; Shao, Z.F.; Cheng, Q.M. Color constancy enhancement under poor illumination. Opt. Lett. 2011, 36, 4821–4823. [Google Scholar] [CrossRef] [PubMed]

