Article

Satellite-Observed Energy Budget Change of Deforestation in Northeastern China and its Climate Implications

1
Institute of Geographic Sciences and Natural Resources Research, Chinese Academy of Sciences, Beijing 100101, China
2
University of Chinese Academy of Sciences, Beijing 100049, China
3
School of Water Conservancy & Environment, Zhengzhou University, Zhengzhou 450001, China
*
Author to whom correspondence should be addressed.
Remote Sens. 2015, 7(9), 11586-11601; https://doi.org/10.3390/rs70911586
Submission received: 7 June 2015 / Revised: 16 August 2015 / Accepted: 2 September 2015 / Published: 11 September 2015
(This article belongs to the Special Issue Carbon Cycle, Global Change, and Multi-Sensor Remote Sensing)

Abstract

:
Large-scale deforestation may affect the surface energy budget and consequently climate by changing the physical properties of the land surface, namely biophysical effects. This study presents the potential energy budget change caused by deforestation in Northeastern China and its climate implications, which was evaluated by quantifying the differences in MODIS-observed surface physical properties between cropland and forest. We used the MODIS land products for the period of 2001–2010 in 112 cells of 0.75° × 0.75° each, within which only best quality satellite pixels over the pure forest and cropland pixels are selected for comparison. It is estimated that cropland has a winter (summer) mean albedo of 0.38 (0.16), which is 0.15 (0.02) higher than that of forest. Due to the higher albedo, cropland absorbs 16.84 W∙m−2 (3.08 W∙m−2) less shortwave radiation than forest. Compared to forest, cropland also absorbs 8.79 W∙m−2 more longwave radiation in winter and 8.12 W∙m−2 less longwave radiation in summer. In total, the surface net radiation of cropland is 7.53 W∙m−2 (11.2 W∙m−2) less than that of forest in winter (summer). Along with these radiation changes, the latent heat flux through evapotranspiration over cropland is less than that over forest, especially in summer (−19.12 W∙m−2). Average sensible heat flux increases in summer (7.92 W∙m−2) and decreases in winter (−8.17 W∙m−2), suggesting that conversion of forest to cropland may lead to warming in summer and cooling in winter in Northeastern China. However, the annual net climate effect is not notable because of the opposite sign of the energy budget change in summer and winter.

Graphical Abstract

1. Introduction

Land cover changes caused by human activities are important forcings of climate [1]. Over the past 300 years, 15%–30% of the global natural forest has been converted to pasture or cropland [2]. Over the same period in China, the forested area has decreased by 9.2% [3]. During the past two decades, this area has decreased by 8.52 × 10⁵ hectare (hm2) because of cropland expansion, particularly in Northeastern China [4]. Such large-scale deforestation can affect climate through both biogeochemical and biophysical processes. Biogeochemical effects of land cover change (e.g., changes in carbon sinks) can alter the concentration of atmospheric greenhouse gases and affect global climate [5,6,7]. Biophysical effects (e.g., changes in albedo, surface roughness, and soil texture) can affect near-surface net radiation and the partitioning of this energy into sensible and latent heat [8,9,10,11]. Previous studies have reported that, unlike biogeochemical effects, which affect climate on a global scale, biophysical effects usually act at regional or local scales and may counteract or enhance biogeochemical processes [12,13]. However, recent studies have shown that regional biophysical effects can also have global climate impacts through changes in circulation and precipitation, despite small changes in mean global temperature [14].
Forests have lower albedo than areas covered with herbaceous plants or short vegetation because of their darker surface. Consequently, the replacement of forests by croplands decreases the absorption of shortwave radiation, which can lead to local cooling [8]. On the other hand, forests have higher evapotranspiration (ET) and surface roughness, so deforestation can also lead to local warming [10]. Furthermore, deforestation at different latitudes can have different impacts on climate [10,15,16,17]. It is widely known that deforestation in tropical regions can lead to warming through decreased ET, and that at high latitudes it can lead to cooling through increased albedo. However, there are varied effects of deforestation in temperate regions [10,18].
The biophysical effects of deforestation on climate have been extensively studied by comparing outputs of climate models using different land cover scenarios for example, forest scenario and non-forest scenario [18]. Biophysical parameters for forest, such as lower albedo and higher surface roughness used in models are different from those for cropland, which can lead to different impacts on climate. Climate model is a powerful tool to study the effects of land cover change on climate, simulating interactions among atmosphere, land surface, and oceans using a set of complicated numerical equations. However, differences in climate model structures, physical processes, and parameterization may generate conflicting results [19,20]. Furthermore, it is a challenge to accurately evaluate local climate effects using climate models because of their coarse spatial resolution [11].
Like climate models, satellite observations are an effective tool for investigating the climate impact of land cover change [10]. Recently, empirical analysis based on remote sensing data has produced some new results that differ from climate model simulation studies [18,21]. For example, although most climate models indicate that deforestation in temperate regions would result in decreased temperatures [10], using moderate resolution imaging spectroradiometer (MODIS) land surface temperature (LST) data, Wickham et al. [18] showed that the temperate forests in the continental United States are not a heat source relative to other classes of land cover. Houspanossian et al. [13] used MODIS data to investigate how changes in land cover affect the radiation budget. Observations from satellites enable the investigation of biophysical parameters of the land surface after changes in land cover at high resolution and can therefore improve the understanding of the local effects of deforestation on climate [11].
Historically, Northeastern China was heavily forested but is now the main agricultural region in China, having undergone significant deforestation over the last 300 years. This land cover conversion has potentially affected the regional environment and climate. The effects of deforestation on climate in Northeastern China have been investigated in the past. Gao et al. [22] , who used the RegCM2 model, found increased annual surface temperatures together with deforestation in the southern part of Northeastern China. Yu et al. [23] and Zhang et al. [24] found that deforestation in Northeastern China caused decreasing temperatures using a multi-model ensembles method. However, studies by Zhang et al. [24] using different regional climate models (RegCM3 versus WRF) showed contradicting results. Using MODIS data, Peng et al. [25] found a warming effect due to afforestation in areas north of 45°N. The results above show that climate effect studies of forest in Northeastern China produced varying outcomes. Therefore, more studies are needed for this region.
The objective of the present study is to investigate the energy budget change caused by deforestation and its climate implications in Northeastern China. In this article, we characterize the seasonal and spatial patterns of biophysical variables in forest and cropland based on the best quality MODIS pixels. Next, the energy budget is calculated and analyzed based on these biophysical parameters. The goal of the study is to obtain information on the effects of temperate forests on climate that may be useful to both policymakers and researchers.

2. Data and Methods

2.1. Study Area

The study area, Northeastern China (115°05′–135°02′E and 38°40′–53°34′N) includes the three provinces of Liaoning, Jilin, and Heilongjiang, as well as Eastern Inner Mongolia (Figure 1). It is located in a temperate climate zone and covers an area of approximately 1,450,000 km2. Northeastern China has long, extremely cold and dry winters, and short, mild, and moist summers. The mean January (July) temperature ranges from −30 °C (18 °C) in the north to −5 °C (24 °C) in the south. The annual precipitation ranges from 1000 mm in the southeastern Changbai Mountains to 200 mm on the Inner Mongolia Plateau. More than two thirds of the annual precipitation occurs during the summer [26]. The area is one of the main agricultural regions in China, and its cultivated land accounts for about 20% of the country’s total cultivated area [27].
Figure 1. The study area, Northeastern China. Each outlined cell contains sufficient number of forest and cropland pixels (at least > 20 each) for comparisons. In the study, the comparison of biophysical variables and energy budget changes between forest and cropland is restricted to these cells.
Remotesensing 07 11586 g001

2.2. MODIS Data

We used MODIS shortwave albedo (MCD43B3), ET (MOD16A2), LST and emissivity (MYD11A2) data spanning 2001–2010 (Table 1) for surface energy budget estimates. The MODIS albedo (MCD43B3) products include white-sky albedo and black-sky albedo. To isolate the dependence of albedo on surface characteristics [28], we used white-sky albedo in this study, and the bias of MODIS albedo is generally less than 5% [29]. The land surface temperature and emissivity data (MYD11A2) consist of daytime (~13:30 local time) and nighttime (~01:30 local time) temperature observations. In this study, afternoon (MODIS-AQUA) rather than morning (MODIS-TERRA) data were used, so daytime LST would reflect the daily temperature maxima [11,21]. Since the AQUA LST data start in July 2002, we used 2003–2010 data in this study. Unlike the MODIS albedo and LST data, which were retrieved directly from the satellite radiometric signals using a dedicated algorithm, MODIS ET data were derived using an improved Penman-Monteith model developed by Mu et al. [30,31].
The best quality pixels were selected for analysis. The albedo quality assessment (QA) flag from MCD43B2 was used for albedo quality control. Only full bidirectional reflectance distribution function (BRDF) inversion pixels (QA = 0 processed, good quality) were used. Similarly, LST and emissivity data were retrieved from the quality control file. MODIS data such as albedo, ET, and LST used in this study were 8-day composite images with a total of 46 images per year. These data were averaged across the years from 2001 to 2010 for each of the 46 8-day observation periods to smooth out interannual variability. Finally, data for each biophysical variable (albedo, LST, and ET) were averaged to monthly, seasonal, and yearly values (winter = December, January, February (DJF); spring = March, April, May (MAM); summer = June, July, August (JJA); autumn = September, October, November (SON)).
Table 1. The MODIS products and other data used in this study.
DatasetType of DataParameterSpatial ResolutionUse
MCD43B3MODISAlbedo1000 mNet shortwave radiation computation
MCD43B2MODISAlbedo QC1000 mAlbedo QC
MYD11A2MODISLand surface temperature & emissivity1000 mNet longwave radiation computation
MOD16A2MODISEvapotranspiration (ET)/latent heat flux (LE)1000 mEnergy balance computation
MOD12Q1MODISLand cover1000 mLand cover mask
Land coverCASLand cover1000 mLand cover mask
SSRDERA-interimSurface solar (shortwave) radiation downwards0.75°Net shortwave radiation computation
STRDERA-interimSurface thermal (longwave) radiation downwards0.75°Net longwave radiation computation

2.3. Land Cover Data

The 1-km land cover datasets (1-km percentage aggregate class) for 2000, 2005 and 2010 were acquired from the Institute of Geographic Sciences and Natural Resources Research, Chinese Academy of Sciences (CAS). The datasets are based on Landsat TM\ETM+ images. The images were geometrically corrected and georeferenced, and an outdoor survey and random sample check confirmed that the average accuracy for the interpretation of land use changes exceeded 90% [4]. The percentage land cover map was derived from 30 m × 30 m spatial resolution TM data by zonal statistic within a 1-km fishnet. Pure pixels rather than mixed pixels were selected in the study because a mixed pixel, which contains at least two land cover types, represents the spectral characteristics of multiple land cover types and is a source of error for remote sensing applications [32]. For example, a pixel was selected as a cropland pixel only if the proportion of cropland in that pixel was ≥ 90%. The analysis involved two land cover classes, forest and cropland. We defined forest as deciduous, evergreen mixed forest and shrubland. Cropland was defined based on the cropland class in the land cover dataset. Only cropland and forest pixels that had not changed between the 2000, 2005, and 2010 datasets were selected for further analysis. Note that the 2001 1-km MODIS Collection 4 land cover datasets (MOD12Q1) were used in this study because MODIS ET products were derived based on MOD12Q1 vegetation [30]. Due to the MODIS land cover data having some inconsistencies with the CAS land cover data [33], only pixels with the same land cover based on both MODIS and CAS data were used for further study via overlap analysis in the ArcGIS software.

2.4. Other Data

Downward shortwave and longwave radiation data (Rs↓ and Rl↓), acquired from the European Center for Medium Range Weather Forecasts (ECMWF) ERA-Interim reanalysis dataset were used to calculate radiative forcings (RF). This dataset has a spatial resolution of 0.75° × 0.75° and was carefully quality controlled [34]. Monthly mean radiation datasets were used for energy balance calculations (Table 1).

2.5. Analysis Method

To compare the biophysical variables between forests and croplands, Northeastern China was divided into 0.75° × 0.75° grid cells to match the resolution of the ERA-interim meteorological forcing data (Figure 1). Comparison of forest and cropland biophysical variables and energy budget was restricted in each 0.75° × 0.75° cell. This setting ensures that 1-km resolution forest and cropland pixels within a cell acquire the same downward radiation data. In a 0.75° × 0.75° cell, there are potentially about 6000 1-km pixels per class. However, we made our comparison using a very stringent control. First, we only used pure forest or pure cropland pixels (> 90% areal coverage) rather than mixed pixels in a cell. Moreover, we only used best quality MODIS pixels, which inevitably results in missing data within a cell. For example, there are less valid albedo or LST data for winter in Northeastern China due to unfavorable atmospheric conditions such as cloud contamination. The 112 cells that were eventually selected had a sufficient number of forest and cropland observations (at least 20 pixels each) to permit statistical comparisons and 60% of the cells contained at least 100 or more pixels for each vegetation type. In addition, to minimize the effect of elevation, we only selected paired pixels for which the elevation difference was in the range of ±100 m using a DEM filter in each cell.
Shortwave and longwave RF were used to quantify the change in Northeastern China’s energy budget resulting from conversion of forests to cropland. The term “radiative forcing” refers to the change in net (down minus up) radiative flux (shortwave plus longwave radiation in W∙m−2) caused by an imposed change such as an increase in CO2 or a change in albedo. Positive RFs, either shortwave or longwave, can increase mean temperature [13,28]. Non-radiative components, such as sensible heat and latent heat were also calculated to evaluate the energy budget. It has already been stressed that non-radiative impacts of land cover change have a similar magnitude, but may be of opposite sign (although non-radiative components are not part of RF) [15].
Surface shortwave RF from altered albedo in a cell is defined as the change in net shortwave radiation (downward minus upward) before and after conversion of land cover. It is calculated as:
R F s h o r t w a v e = R s ( 1 α c r o p l a n d ) R s ( 1 α f o r e s t )
where Rs↓ is the monthly downward shortwave flux, and αcropland and αforest are the monthly albedo values of cropland and forest, respectively.
Surface longwave RF from altered LST and emissivity in a cell is defined as the change in net longwave radiation (downward minus upward) at the surface and is calculated as:
R F l o n g w a v e = R l ( ε c r o p l a n d ε f o r e s t ) ( ε c r o p σ T c r o p l a n d 4 ε f o r e s t σ T f o r e s t 4 )
where Tcropland and Tforest denote LST of cropland and forest, with the corresponding emissivity being εcropland and εforest, Rl↓ is the monthly downward longwave flux, and σ (5.67 × 10⁻⁸ W∙m−2 K−4) is the Stefan–Boltzmann constant.
The climate effects of non-radiative forcings were investigated through the redistribution of sensible heat and latent heat. The regional climate impacts of non-radiative forcings are as important as the RFs that have recently gained much attention. Soil heat fluxes can be ignored in monthly or annual calculations and the energy balance equation becomes Rn = H + LE, where Rn is net radiation, H is sensible heat, and LE is latent heat. In the present study, the change in net radiation (ΔRn) after the conversion from forest to cropland can be calculated as ΔRn = RFshortwave + RFlongwave. Using the latent heat of vaporization λ, the change of latent heat flux λ·ΔET is obtained from the comparison of MODIS ET between forest and cropland. Therefore, the ΔH can be estimated as:
Δ H = Δ R n Δ λ E T = R F s h o r t w a v e + R F l o n g w a v e Δ λ E T

3. Results

3.1. Differences between Cropland and Forest Albedo

The change in land surface albedo due to land cover change is considered the main anthropogenic impact on climate change because altered albedo can affect the shortwave radiation budget. It is well known that areas covered with short vegetation, such as grasses or crops, have a brighter surface than forested areas. Therefore, deforestation leads to a large increase in surface albedo, particularly in areas where snow falls because short vegetation, like cropland, is easily buried by snow. Consequently, deforestation tends to increase land surface albedo and induces negative shortwave RF, leading to local cooling. The average annual difference in albedo between forest and cropland within the selected cells in Northeastern China is 0.05 ± 0.06 (Table 2). In summer, the albedo difference between cropland and forest is small. The zonally averaged albedo over these cells in August is 0.17 and 0.14 for cropland and forest, respectively. In winter, the albedo of cropland is much higher than that of forest, especially when snow is present. For example, the average albedo for February is 0.42 and 0.25 for cropland and forest, respectively (Figure 2 and Figure 3).
Figure 2. Albedo averaged over all selected cells. (a) Seasonal variations; (b) variations from 40°N to 50°N latitude for DOY 25 (winter).
Remotesensing 07 11586 g002
The latitudinal and seasonal variations in albedo for croplands and forests in the study area (Figure 2) indicate that long-term snow cover plays an important role in determining the surface albedo in Northeastern China, which is the coldest part of the country. Snow flags in the “Snow_BRDF_Albedo” dataset (MCD43B2) were used to identify the duration of snow cover in the region for the period from November (day of year (DOY) 305) to March of the next year (DOY 81). Cropland and forest albedo formed a U-shaped pattern (Figure 2a), which implies that high albedo values are strongly influenced by snow cover during this period. The albedo around DOY 25 in January increases with increasing latitude (Figure 2b) because snow cover becomes more prevalent at high latitudes. This is different from the situation in low-latitude regions [35], where albedo increases with latitude mainly because of sparse vegetation due to land degradation or drought. In Northeastern China, spring wheat, spring corn, and rice are the main crops. The growing season of these crops is from about May to September. Early in the growing season, the albedo of bare moist black soil or irrigated rice paddies is low, increases as crops are planted, and drops as the crops grow. We find that forest albedo is a bit higher than cropland albedo around DOY 150 in May (Figure 2a). This is likely because of the growth of new leaves of forest during that period when the increased reflectance related to the bright surfaces of those leaves enhances the forest albedo.
Figure 3. Mean seasonal variation of differences (cropland minus forest) in (a) albedo, (b) daily LST, (c) daytime LST, and (d) nighttime LST. The lines and shaded areas represent the mean and standard deviation (SD) of all sample cells, respectively.
Remotesensing 07 11586 g003

3.2. Differences between Cropland and Forest LST

Altered LST due to the conversion of forest to cropland modifies the longwave radiation budget. Overall, average daytime LST for forest is lower than average daytime LST for cropland in all seasons except in winter (Table 2, Figure 3). In contrast, average nighttime LST for forest is higher than average nighttime LST for croplands throughout the year. This is consistent with a previous study that found that forests were warmer than open fields at night because of downwelling of heat related to the higher surface roughness of forests [36]. The annual average difference in daytime and nighttime LST between croplands and forests within the selected cells is 0.50 K and −1.36 K, respectively (Table 2). The largest daytime LST difference is observed in summer, when the LST of croplands was 2.97 K higher than that of forests. This indicates that the forest surface is much cooler than the cropland surface. In Northeastern China, where most precipitation occurs during summer, larger latent heat fluxes accompanying evapotranspiration over forests can reduce the surface temperature. The average nighttime LST differences range from −0.51 K to −2.30 K between the two types of vegetation and the greatest difference is observed in winter. In summer, cooler forest daytime temperatures offset warmer forest nighttime temperatures, leading to daily average temperatures in forests that are cooler than those in croplands. In winter, because daytime and nighttime temperatures in forest are warmer than those of cropland, the daily average temperatures of forest are warmer than those of croplands.
Table 2. Changes in surface biophysical properties for potential conversion from forests to croplands (cropland minus forest) in Northeastern China and associated changes in energy budget components.
--AnnualWinterSpringSummerAutumn
ΔAlbedo0.05 ± 0.060.15 ± 0.020.01 ± 0.010.02 ± 0.020.04 ± 0.02
ΔLSTdaily−0.93 ± 1.08−1.93 ± 1.330.08 ± 1.101.23 ± 0.70−0.87 ± 1.04
ΔLSTdaytime0.50 ± 1.25−1.64 ± 1.911.91 ± 1.682.97 ± 1.200.59 ± 1.19
ΔLSTnighttime−1.36 ± 0.83−2.30 ± 1.23−1.13 ± 0.71−0.51 ± 0.72−1.74 ± 0.93
RFshortwave−6.37 ± 3.23−16.84 ± 11.16−2.23 ± 4.91−3.08 ± 2.51−4.08 ± 2.68
RFlongwave−0.37 ± 3.348.79 ± 8.75−2.06 ± 5.24−8.12 ± 5.58−0.38 ± 3.43
ΔRn−7.31 ± 3.99−7.53 ± 9.78−4.28 ± 9.01−11.20 ± 5.93−4.46 ± 3.93
ΔLE−7.27 ± 4.120.56 ± 1.33−7.30 ± 3.71−19.12 ± 8.93−3.24 ± 2.66
ΔH0.21 ± 3.56−8.17 ± 9.633.01 ± 8.177.92 ± 6.53−1.22 ± 4.15
The values reported here represent the spatial averages of each variable across all 0.75° × 0.75° cells where potential land cover conversions occur; units are K for LST and W∙m−2 for energy budget components.

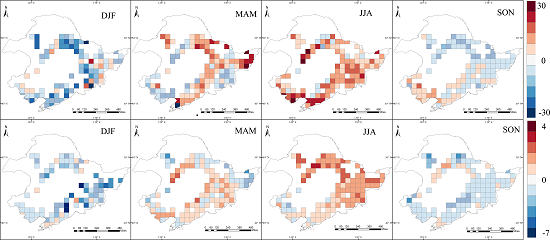
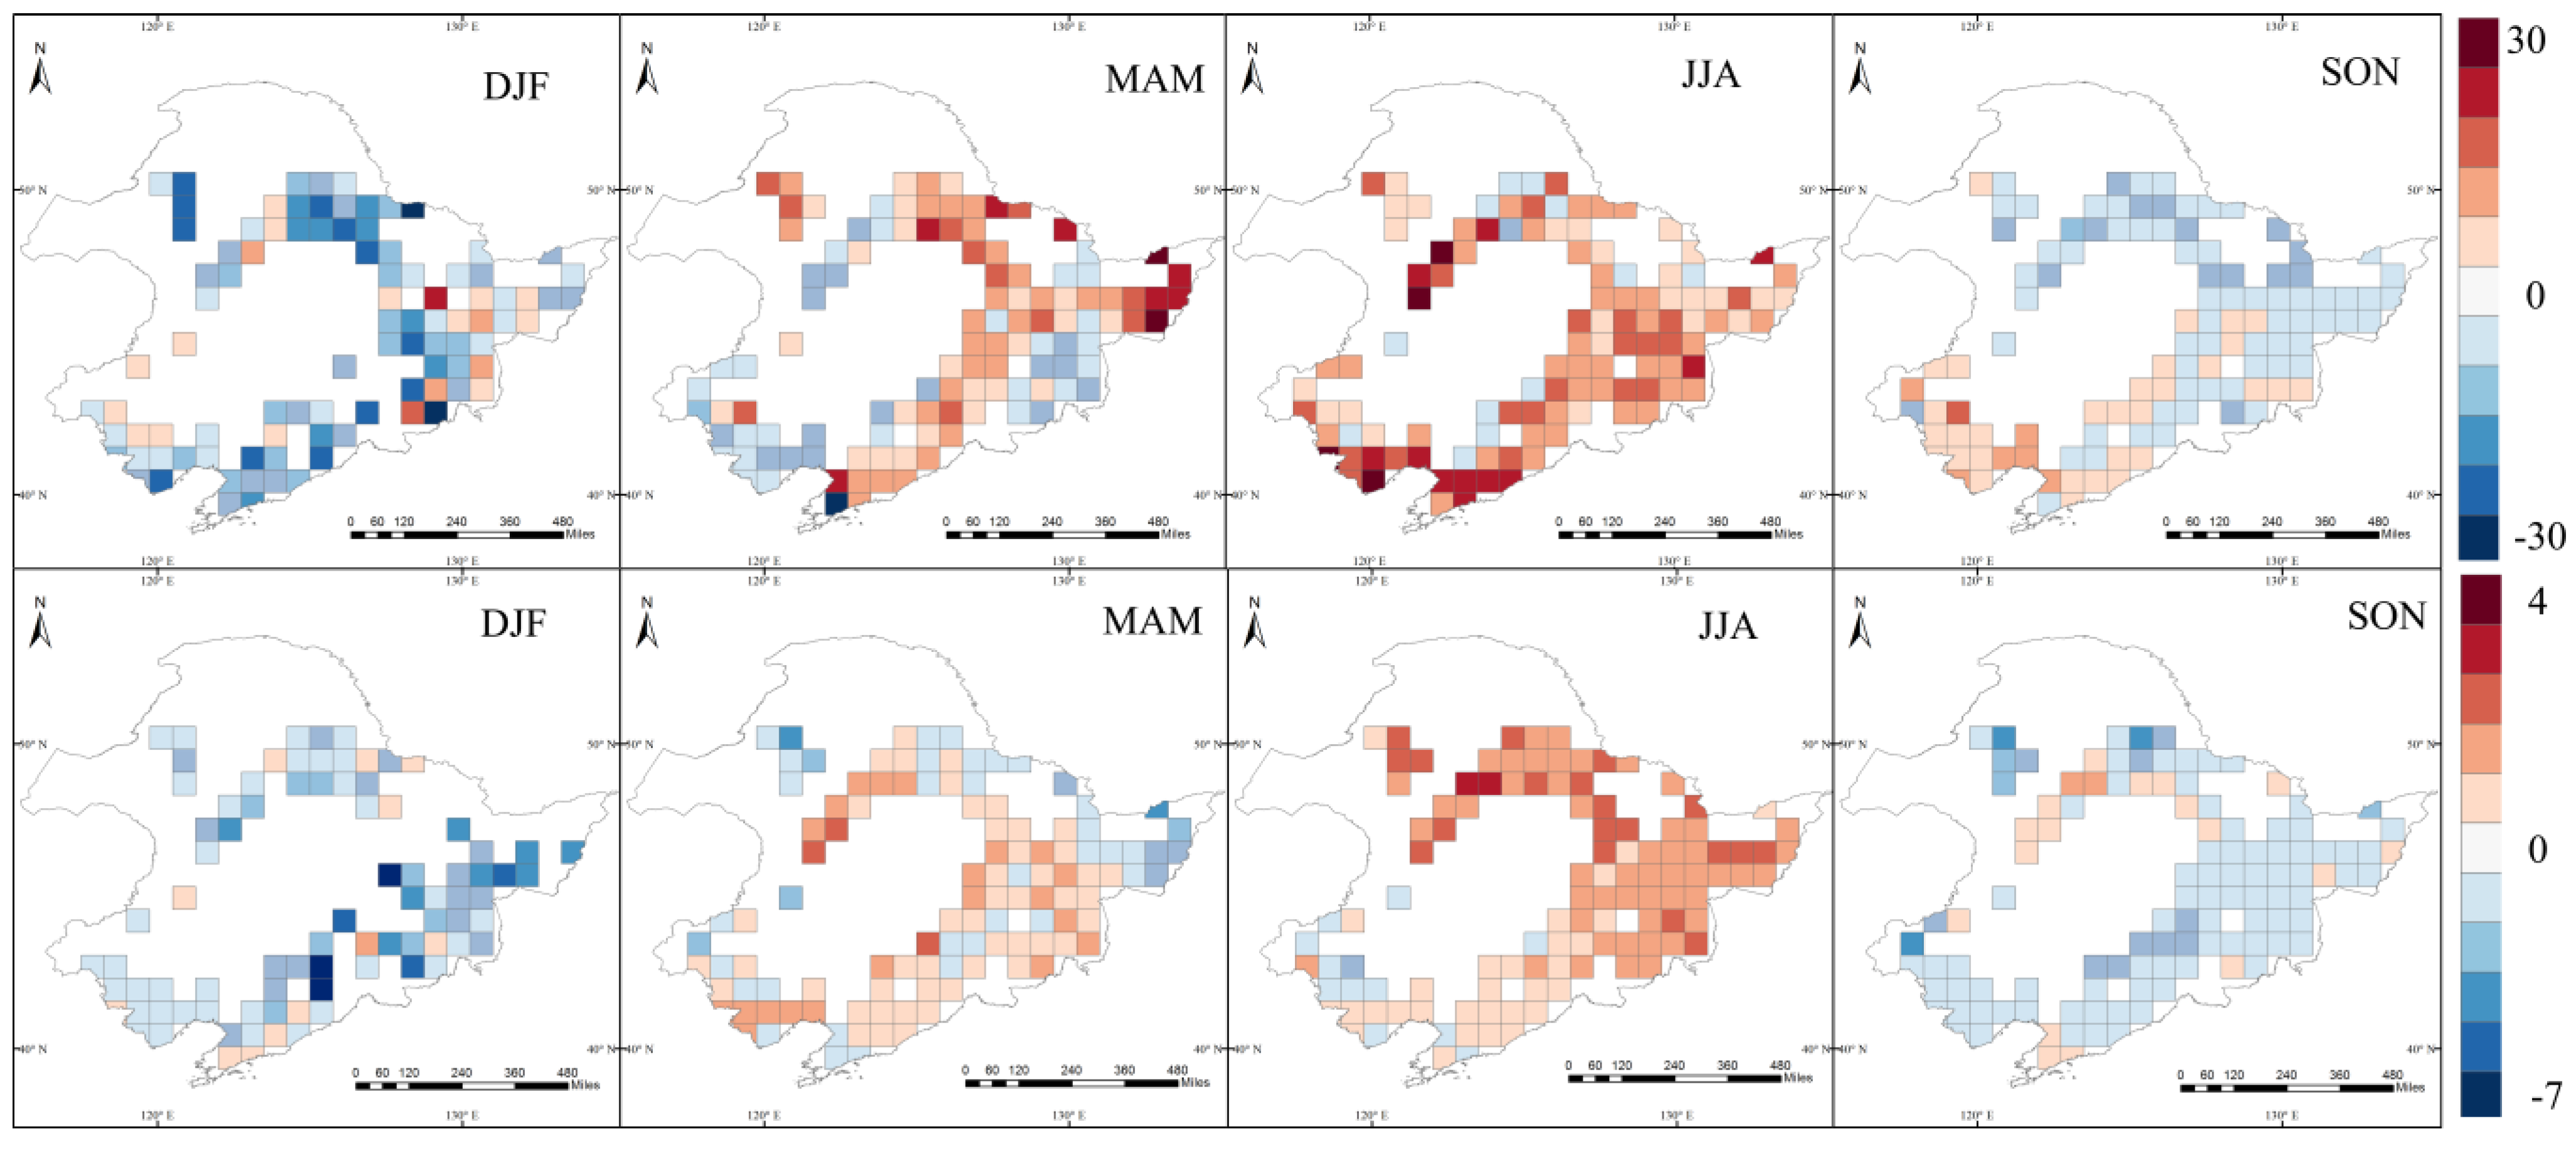
3.3. Shortwave RF and Longwave RF

The average annual shortwave RF after conversion of forest to cropland in northeastern China is −6.37 W∙m−2. This is larger than longwave RF, which is only −0.37 W∙m−2 (Table 2). The surface shortwave flux decreased for all seasons, as expected from the increased albedo caused by deforestation. The shortwave radiation change in summer (−3.08 W∙m−2) is smaller than that in winter (−16.84 W∙m−2). This is consistent with the seasonal variation in albedo. Therefore, the decreased shortwave RF in winter has more impact than the change in shortwave RF in summer.
Average annual longwave RF induced by LST change following conversion of forest to cropland is small in magnitude compared to the corresponding shortwave RF induced by albedo change (Table 2). However, longwave RF is particularly noticeable in summer and winter, when it reaches −8.12 W∙m−2 and 8.79 W∙m−2 respectively. This indicates that the conversion to croplands decreases the longwave energy flux in the summer, which enhances the warming effect by shortwave RF. In winter, the LST of forest is higher than that of cropland, which leads to a higher loss of upward longwave radiative flux. Thus, the change in longwave RF is positive, with an average difference of 8.79 W∙m−2. Overall, longwave RF resulting from conversion of forest to cropland is small compared to shortwave RF.

3.4. Net Radiation Change and Re-Partitioning of Sensible and Latent Heat

The combination of surface shortwave and longwave RF yields changes in surface net radiation that are mostly negative for conversion from forest to cropland in Northeastern China (Table 2). The average annual change in surface net radiation decreases by about 7.31 W∙m−2 after land cover change. The decreased shortwave radiation due to the change in albedo is the main contributor to the change.
Generally, more water evaporates from forest than from cropland, releasing more latent heat. This makes the forest surface cooler than the cropland surface. In northeastern China, the annual reduction in latent heat is about 7.27 W∙m−2 for the conversion from forest to cropland, which is comparable to the reduction in the shortwave RF (6.37 W∙m−2) due to albedo change. The largest difference in latent heat between forest and cropland is about −19.12 W∙m−2 in summer. This is because summer is the wet season in Northeastern China and forest has higher ET than cropland. Therefore, the decreased latent heat caused by conversion to croplands may cause warming.
Sensible heat warms the near-surface air, so increased sensible heat (ΔH >0) from the conversion of forest to cropland, regardless of the signs of ΔRn and ΔLE, would tend to increase local temperatures [28]. Overall, sensible heat in the study area shows an increasing trend (7.92 W∙m−2) in summer and a decreasing trend (−8.17 W∙m−2) in winter after the conversion of forest to cropland (Table 2). The sensible heat flux change due to conversion from forest to cropland in all 0.75° × 0.75° cells shows both a seasonal and spatial pattern (Figure 4). The altered land surface temperatures show the same seasonal variation and spatial dependence, indicating that energy imbalance tends to increase and decrease surface temperature and will eventually affect climate.
Figure 4. Spatial patterns of seasonal ΔH (upper panel, unit: W∙m−2) and ΔLST (lower panel, unit: K) for potential land conversion from forest to cropland. The mapped values here represent the difference in energy budget and LST of forest and cropland in each selected cell.
Remotesensing 07 11586 g004

4. Discussion

The results of this study show that potential conversion of forest to cropland in Northeastern China may lead to warming in summer and cooling in winter, mainly as a result of changes to the sensible heat budget, which are 7.92 W∙m−2 in summer and −8.17 W∙m−2 in winter. Although the change in net surface radiation is negative (−7.31 W∙m−2) mainly as a result of decreased shortwave radiation, which tends to be cooling, the decreased ET counteracts this cooling effect, especially in summer. Therefore, the annual change in temperature is not notable because of the opposite signs of the sensible heat flux change in summer and winter.
Snow cover played a critical role in the energy budget in Northeastern China. Snow cover enhances the difference in albedo between forest and cropland. Consequently, winter albedo in deforested regions is much higher than that in forests [37]. Betts [8] reported that the albedo range was 0.18–0.21 for cropland and 0.14–0.15 for evergreen coniferous forest under snow-free conditions while with snow cover the albedo value was 0.78 and 0.26 for cropland and forest, respectively. This is consistent with the present results except that the reported albedo for snow-covered cropland is higher than the winter maximum of 0.58 in the present study. The replacement of forest by cropland could increase the amount of outgoing shortwave flux and cause local cooling.
Net radiation shows a negative change in all four seasons following conversion from forest to cropland in Northeastern China. This indicates that the decreased albedo-induced shortwave RF (−6.37 W∙m−2) is the main RF for regional climate, especially in regions where snow falls. This is consistent with the finding of Betts et al. [9] that the shortwave radiation change caused by deforestation reaches approximately −4 to −5 W∙m−2 in mid-latitude regions such as Northern China. In contrast to shortwave radiation change, longwave radiation change caused by vegetation conversion is an important biophysical factor for the surface energy budget that has been ignored in many previous studies [28]. Although the LST-induced longwave radiation change is small at the top of the atmosphere and may be considered to have little impact on global climate, this longwave radiation change is comparable in magnitude to the albedo-induced shortwave RF in regional or local climate evaluations [28]. In Northeastern China, although the annual longwave RF is only −0.37 W∙m−2, it reaches about 8.79 W∙m−2 and −8.12 W∙m−2 in winter and in summer, respectively. This indicates that LST-induced longwave RF should not be ignored when evaluating land surface net radiation.
Our results are consistent with the findings of Peng et al. [25] who found, based on MODIS data, that afforestation could cause daytime and nighttime warming in winter and enhances ΔET but that ΔAlbedo is almost negligible in summer in areas north of 35°N. This implies that deforestation may cause cooling in winter and warming in summer in those regions. Our results are somewhat inconsistent with those of Yu et al. [23] and Zhang et al. [24], who reported a decreased temperature trend after deforestation in Northeastern China based on climate models. We found that the magnitude of decreased net radiation (−7.31 W∙m−2), which tends to have a cooling effect, was similar to the output of those climate models (−2 to −5 W∙m−2) [24]. However, the climate models detected an increase in ET (about 0.1–0.2 mm∙d−1, equal to 2.8–5.6 W∙m−2∙d−1) after deforestation [24]. In addition, they found a cooling effect not only in winter, but also in summer [23]. Using MODIS ET data, we and Peng et al. [25] found a decrease in ET due to conversion of forest to cropland. Although there is some uncertainty associated with MODIS ET data [30,38,39], Liu et al. [40] reported good performance of the MODIS ET data were observed at a flux site of forest located in northeastern China. A number of studies mentioned that inconsistencies in estimating climate effects of temperate forests may arise from the uncertainties of models when evaluating ET [11,41,42]. There are some other possible factors that may have contributed to inconsistent results between climate models and empirical studies based on satellite observations. First, most climate model studies couple land surface and atmosphere models to evaluate the impact of land cover change on climate using air temperature as a metric, while satellite observations use LST. Near-surface air temperature and LST have different physical meanings, although they are closely coupled [11,43,44]. Warming and cooling effects deduced from LST may be different from effects deduced from air temperature. In this study, we show that ΔH due to the deforestation is consistent with ΔLST, not only with regard to their magnitude, but also in terms of their spatial pattern (Figure 4). Therefore, by cross-validation between ΔH and ΔLST, we can infer the trend of potential temperature change in summer and winter after deforestation in Northeastern China. Second, climate models use relatively coarse grids to evaluate climate change and actual land cover change may not be evident on a coarse scale. Most climate models use sensitivity tests such as replacing all forest with cropland to study the climate effects of land cover change. However, the actual impacts on climate may be small compared to the results of the sensitivity analysis. Therefore, high-resolution climate models should be used for climate effect studies [11].
There are some other uncertainties in our study. We defined forest as deciduous, evergreen, mixed forest, and shrubland. This may have underestimated or overestimated the actual cooling effect of the forest. The climate effect of forest does differ depending on forest type. Deciduous broadleaf forest tends to cool near-surface air locally while evergreen needleleaf forest tends to warm it compared to cropland in some places [28]. In Northeastern China, mixed forest covers a large area and it is difficult to distinguish between deciduous broadleaf and evergreen needleleaf forests with land cover data. In addition, the input data used to calculate the MOD16 ET dataset did not distinguish between dry cropland and irrigated cropland. However, in Northeastern China, there are many paddy fields that could generate more water evaporation. Therefore, our evaluation may have underestimated the cooling effect of cropland.
To restore and improve the environment, a number of national afforestation policies, such as the Grain to Green Program (GTGP), have been implemented in China. From the perspective of climate change mitigation, although afforestation may cause warming in winter or throughout the year in some high-latitude regions, such as Northeastern China, a cooling effect during hot summers was observed in this study. Although the carbon sink from afforestation was offset by biophysical effects in some areas, afforestation and the avoidance of deforestation have other ecological benefits, such as preserving biodiversity and maintaining ecosystem services [45]. Therefore, experiences and lessons learned from afforestation programs in China [46] or other countries [47] should be used for future forest management.

5. Conclusions

In this study, MODIS data, land cover data, and meteorological forcing data were used to evaluate energy budget changes caused by potential conversion from forests to croplands in Northeastern China. The results suggest that deforestation tends to cause cooling in winter and warming in summer. In addition, we presented the spatial pattern of the energy budget change associated with land conversion. The altered land surface temperatures show the same seasonal variation and spatial dependence, indicating that energy imbalance due to deforestation tends to increase and decrease surface temperatures and will eventually affect climate. The relationship between energy budget, radiative temperature, and air temperature is still worth investigating. Future studies should more accurately evaluate the climatic effects of deforestation by combining satellite observations, field observations, and climate models.

Acknowledgments

We sincerely appreciate Guosong Zhao, Xuezhen Zhang, Feng Zhou and four anonymous reviewers for their constructive comments and suggestions. This research was supported by the National Natural Science Foundation of China (41371409 and 41371019) and Key Projects in the National Science & Technology Pillar Program (2013BAC03B04).

Author Contributions

Tian He, Quanqin Shao and Wei Cao designed the experiments; Tian He and Wei Cao performed the experiments; Tian He, Lulu Liu and Lin Huang analyzed the data; Tian He and Quanqin Shao wrote the paper.

Conflicts of Interest

The authors declare no conflict of interest.

References

  1. Bonan, G.B. Ecological Climatology: Concepts and Applications, 2nd ed.; Cambridge University Press: New York, NY, USA, 2008. [Google Scholar]
  2. Goldewijk, K.K. Estimating global land use change over the past 300 years: The HYDE database. Glob. Biogeochem. Cycles 2001, 15, 417–433. [Google Scholar] [CrossRef]
  3. He, F.; Ge, Q.; Dai, J.; Rao, Y. Forest change of China in recent 300 years. J. Geogr. Sci. 2008, 18, 59–72. [Google Scholar] [CrossRef]
  4. Liu, J.; Kuang, W.; Zhang, Z.; Xu, X.; Qin, Y.; Ning, J.; Zhou, W.; Zhang, S.; Li, R.; Yan, C.; et al. Spatiotemporal characteristics, patterns, and causes of land-use changes in China since the late 1980s. J. Geogr. Sci. 2014, 24, 195–210. [Google Scholar] [CrossRef]
  5. Pan, Y.; Birdsey, R.A.; Fang, J.; Houghton, R.; Kauppi, P.E.; Kurz, W.A.; Phillips, O.L.; Shvidenko, A.; Lewis, S.L.; Canadell, J.G.; et al. A large and persistent carbon sink in the world’s forests. Science 2011, 333, 988–993. [Google Scholar] [CrossRef]
  6. Zhou, F.; Shang, Z.; Ciais, P.; Tao, S.; Piao, S.; Raymond, P.; He, C.; Li, B.; Wang, R.; Wang, X.; et al. A new high-resolution N2O emission inventory for China in 2008. Environ. Sci. Technol. 2014, 48, 8538–8547. [Google Scholar] [CrossRef] [PubMed]
  7. Zhou, F.; Shang, Z.; Zeng, Z.; Piao, S.; Ciais, P.; Raymond, P.A.; Wang, X.; Wang, R.; Chen, M.; Yang, C.; et al. New model for capturing the variations of fertilizer-induced emission factors of N2O. Glob. Biogeochem. Cycles 2015. [Google Scholar] [CrossRef]
  8. Betts, R.A. Offset of the potential carbon sink from boreal forestation by decreases in surface albedo. Nature 2000, 408, 187–190. [Google Scholar] [CrossRef] [PubMed]
  9. Betts, R.A.; Falloon, P.D.; Goldewijk, K.K.; Ramankutty, N. Biogeophysical effects of land use on climate: Model simulations of radiative forcing and large-scale temperature change. Agric. For. Meteorol. 2007, 142, 216–233. [Google Scholar] [CrossRef]
  10. Bonan, G.B. Forests and climate change: Forcings, feedbacks, and the climate benefits of forests. Science 2008, 320, 1444–1449. [Google Scholar] [CrossRef] [PubMed]
  11. Li, Y.; Zhao, M.; Motesharrei, S.; Mu, Q.; Kalnay, E.; Li, S. Local cooling and warming effects of forests based on satellite observations. Nat. Commun. 2015, 6. [Google Scholar] [CrossRef] [PubMed]
  12. Anderson, R.G.; Canadell, J.G.; Randerson, J.T.; Jackson, R.B.; Hungate, B.A.; Baldocchi, D.D.; Ban-Weiss, G.A.; Bonan, G.B.; Caldeira, K.; Cao, L.; et al. Biophysical considerations in forestry for climate protection. Front. Ecol. Environ. 2011, 9, 174–182. [Google Scholar] [CrossRef]
  13. Houspanossian, J.; Nosetto, M.; Jobbágy, E.G. Radiation budget changes with dry forest clearing in temperate Argentina. Global Change Biol. 2013, 19, 1211–1222. [Google Scholar] [CrossRef] [PubMed]
  14. Swann, A.L.S.; Fung, I.Y.; Chiang, J.C.H. Mid-latitude afforestation shifts general circulation and tropical precipitation. Proc. Natl. Acad. Sci. USA 2012, 109, 712–716. [Google Scholar] [CrossRef] [PubMed]
  15. Davin, E.L.; de Noblet-Ducoudré, N. Climatic impact of global-scale deforestation: Radiative versus nonradiative processes. J. Climate 2010, 23, 97–112. [Google Scholar] [CrossRef]
  16. Arora, V.K.; Montenegro, A. Small temperature benefits provided by realistic afforestation efforts. Nat. Geosci. 2011, 4, 514–518. [Google Scholar] [CrossRef]
  17. Peng, C.; Ma, Z.; Lei, X.; Zhu, Q.; Chen, H.; Wang, W.; Liu, S.; Li, W.; Fang, X.; Zhou, X. A drought-induced pervasive increase in tree mortality across Canada’s boreal forests. Nat. Clim. Change 2011, 1, 467–471. [Google Scholar] [CrossRef]
  18. Wickham, J.D.; Wade, T.G.; Riitters, K.H. Empirical analysis of the influence of forest extent on annual and seasonal surface temperatures for the continental United States. Glob. Ecol. Biogeogr. 2013, 22, 620–629. [Google Scholar] [CrossRef]
  19. Diffenbaugh, N.S. Influence of modern land cover on the climate of the United States. Clim. Dynam. 2009, 33, 945–958. [Google Scholar] [CrossRef]
  20. Jackson, R.B.; Jobbagy, E.G.; Avissar, R.; Roy, S.B.; Barrett, D.J.; Cook, C.W.; Farley, K.A.; le Maitre, D.C.; McCarl, B.A.; Murray, B.C. Trading water for carbon with biological sequestration. Science 2005, 310, 1944–1947. [Google Scholar] [CrossRef] [PubMed]
  21. Wickham, J.D.; Wade, T.G.; Riitters, K.H. Comparison of cropland and forest surface temperatures across the conterminous United States. Agric. Forest Meteorol. 2012, 166, 137–143. [Google Scholar] [CrossRef]
  22. Gao, X.J.; Luo, Y.; Lin, W.T.; Zhao, Z.C.; Giorgi, F. Simulation of effects of land use change on climate in China by a regional climate model. Adv. Atmos. Sci. 2003, 20, 583–592. [Google Scholar]
  23. Yu, L.; Zhang, S.; Tang, J.; Liu, T.; Bu, K.; Yan, F.; Yang, C.; Yang, J. The effect of deforestation on the regional temperature in Northeastern China. Theor. Appl. Climatol. 2014, 120, 761–771. [Google Scholar] [CrossRef]
  24. Zhang, X.; Xiong, Z.; Zhang, X.; Shi, Y.; Liu, J.; Shao, Q.; Yan, X. Using multi-model ensembles to improve the simulated effects of land use/cover change on temperature: A case study over northeast China. Clim. Dynam. 2015. [Google Scholar] [CrossRef]
  25. Peng, S.S.; Piao, S.; Zeng, Z.; Ciais, P.; Zhou, L.; Li, L.Z.X.; Myneni, R.B.; Yin, Y.; Zeng, H. Afforestation in China cools local land surface temperature. Proc. Natl. Acad. Sci. USA 2014, 111, 2915–2919. [Google Scholar] [CrossRef] [PubMed] [Green Version]
  26. Zhang, X.Z.; Wang, W.C.; Fang, X.Q.; Ye, Y.; Zheng, J.Y. Agriculture development-induced surface albedo changes and climatic implications across Northeastern China. Chin. Geogr. Sci. 2012, 22, 264–277. [Google Scholar] [CrossRef]
  27. Wang, Z.; Liu, Z.; Song, K.; Zhang, B.; Zhang, S.; Liu, D.; Ren, C.; Yang, F. Land use changes in Northeast China driven by human activities and climatic variation. Chin. Geogr. Sci. 2009, 19, 225–230. [Google Scholar] [CrossRef]
  28. Zhao, K.; Jackson, R.B. Biophysical forcings of land-use changes from potential forestry activities in North America. Ecol. Monogr. 2014, 84, 329–353. [Google Scholar] [CrossRef]
  29. Liu, J.; Schaaf, C.; Strahler, A.; Jiao, Z.; Shuai, Y.; Zhang, Q.; Roman, M.; Augustine, J.A.; Dutton, E.G. Validation of moderate resolution imaging spectroradiometer (MODIS) albedo retrieval algorithm: Dependence of albedo on solar zenith angle. J. Geophys. Res. Atmos. 2009, 114. [Google Scholar] [CrossRef]
  30. Mu, Q.; Zhao, M.; Running, S.W. Improvements to a MODIS global terrestrial evapotranspiration algorithm. Remote Sens. Environ. 2011, 115, 1781–1800. [Google Scholar] [CrossRef]
  31. Mu, Q.; Heinsch, F.A.; Zhao, M.; Running, S.W. Development of a global evapotranspiration algorithm based on MODIS and global meteorology data. Remote Sens. Environ. 2007, 111, 519–536. [Google Scholar] [CrossRef]
  32. Zeng, T.; Zhang, Z.; Zhao, X.; Wang, X.; Zuo, L. Evaluation of the 2010 MODIS collection 5.1 land cover type product over China. Remote Sens. 2015, 7, 1981–2006. [Google Scholar] [CrossRef]
  33. Ran, Y.; Li, X.; Lu, L. Evaluation of four remote sensing based land cover products over China. Int. J. Remote Sens. 2010, 31, 391–401. [Google Scholar] [CrossRef]
  34. Dee, D.P.; Uppala, S.M.; Simmons, A.J.; Berrisford, P.; Poli, P.; Kobayashi, S.; Andrae, U.; Balmaseda, M.A.; Balsamo, G.; Bauer, P.; et al. The ERA-Interim reanalysis: Configuration and performance of the data assimilation system. Q. J. R. Meteorol. Soc. 2011, 137, 553–597. [Google Scholar] [CrossRef]
  35. Epule, E.T.; Peng, C.; Lepage, L.; Chen, Z. The causes, effects and challenges of Sahelian droughts: A critical review. Reg. Environ. Change 2014, 14, 145–156. [Google Scholar] [CrossRef]
  36. Lee, X.; Goulden, M.L.; Hollinger, D.Y.; Barr, A.; Black, T.A.; Bohrer, G.; Bracho, R.; Drake, B.; Goldstein, A.; Gu, L.; et al. Observed increase in local cooling effect of deforestation at higher latitudes. Nature 2011, 479, 384–387. [Google Scholar] [CrossRef] [PubMed]
  37. Bernier, P.Y.; Desjardins, R.L.; Karimi-Zindashty, Y.; Worth, D.; Beaudoin, A.; Luo, Y.; Wang, S. Boreal lichen woodlands: A possible negative feedback to climate change in eastern North America. Agric. Forest Meteorol. 2011, 151, 521–528. [Google Scholar] [CrossRef]
  38. Kim, H.W.; Hwang, K.; Mu, Q.; Lee, S.O.; Choi, M. Validation of MODIS 16 global terrestrial evapotranspiration products in various climates and land cover types in Asia. KSCE J. Civ. Eng. 2012, 16, 229–238. [Google Scholar] [CrossRef]
  39. Yang, Y.; Long, D.; Shang, S. Remote estimation of terrestrial evapotranspiration without using meteorological data. Geophys. Res. Lett. 2013, 40, 3026–3030. [Google Scholar] [CrossRef]
  40. Liu, Z.; Shao, Q.; Liu, J. The performances of MODIS-GPP and -ET products in China and their sensitivity to input data (FPAR/LAI). Remote Sens. 2015, 7, 135–152. [Google Scholar] [CrossRef]
  41. De Noblet-Ducoudré, N.; Boisier, J.; Pitman, A.; Bonan, G.B.; Brovkin, V.; Cruz, F.; Delire, C.; Gayler, V.; van den Hurk, B.J.J.M.; Lawrence, P.J.; et al. Determining robust impacts of land-use-induced land cover changes on surface climate over North America and Eurasia: Results from the first set of LUCID experiments. J. Clim. 2012, 25, 3261–3281. [Google Scholar] [CrossRef]
  42. Boisier, J.P.; de Noblet-Ducoudré, N.; Pitman, A.J.; Cruz, F.T.; Delire, C.; van den Hurk, B.J.J.M.; van der Molen, M.K.; Müller, C.; Voldoire, A. Attributing the impacts of land-cover changes in temperate regions on surface temperature and heat fluxes to specific causes: Results from the first LUCID set of simulations. J. Geophys. Res. Atmos. 2012, 117. [Google Scholar] [CrossRef]
  43. Mildrexler, D.J.; Zhao, M.; Running, S.W. A global comparison between station air temperatures and MODIS land surface temperatures reveals the cooling role of forests. J. Geophys. Res. 2011. [Google Scholar] [CrossRef]
  44. Luyssaert, S.; Jammet, M.; Stoy, P.C.; Estel, S.; Pongratz, J.; Ceschia, E.; Churkina, G.; Don, A.; Erb, K.; Ferlicoq, M.; et al. Land management and land-cover change have impacts of similar magnitude on surface temperature. Nat. Clim. Change 2014, 4, 389–393. [Google Scholar] [CrossRef]
  45. Davies-Barnard, T.; Valdes, P.J.; Singarayer, J.S.; Pacifico, F.M.; Jones, C.D. Full effects of land use change in the representative concentration pathways. Environ. Res. Lett. 2014, 9. [Google Scholar] [CrossRef]
  46. Liu, J.; Li, S.; Ouyang, Z.; Tam, C.; Chen, X. Ecological and socioeconomic effects of China’s policies for ecosystem services. Proc. Natl. Acad. Sci. USA 2008, 105, 9477–9482. [Google Scholar] [CrossRef] [PubMed]
  47. Epule, E.T.; Peng, C.; Lepage, L.; Chen, Z. Enabling conditions for successful greening of public spaces: The case of Touroua, Cameroon based on perceptions. Small-Scale For. 2014, 13, 143–161. [Google Scholar] [CrossRef]

