Abstract
The EnMAP-Box is a toolbox that is developed for the processing and analysis of data acquired by the German spaceborne imaging spectrometer EnMAP (Environmental Mapping and Analysis Program). It is developed with two aims in mind in order to guarantee full usage of future EnMAP data, i.e., (1) extending the EnMAP user community and (2) providing access to recent approaches for imaging spectroscopy data processing. The software is freely available and offers a range of tools and applications for the processing of spectral imagery, including classical processing tools for imaging spectroscopy data as well as powerful machine learning approaches or interfaces for the integration of methods available in scripting languages. A special developer version includes the full open source code, an application programming interface and an application wizard for easy integration and documentation of new developments. This paper gives an overview of the EnMAP-Box for users and developers, explains typical workflows along an application example and exemplifies the concept for making it a frequently used and constantly extended platform for imaging spectroscopy applications.
1. Introduction
Imaging spectroscopy is a powerful remote sensing approach for mapping the Earth’s surface [1,2,3,4]. Successful applications with imaging spectroscopy data cover all environments, including the analysis of managed forests [5,6], agricultural areas [7,8,9], mining sites [10,11], urban areas [12,13,14], of unmanaged forests [15,16] and (quasi-)natural ecosystems [17,18,19], including deserts [20,21] or snow and ice [22,23], as well as inland waters and oceans [24,25]. Given the broad range of applications, a great variety of analysis approaches is used with imaging spectroscopy data, e.g., mapping and monitoring [26,27], empirical modeling [5,28,29] or physical-based modeling, especially with radiative transfer models [6,30,31]. In many applications, the additional spectral information in imaging spectroscopy data was shown to improve results compared to those from data of lower spectral dimensionality [32,33,34].
With the launch of the Environmental Mapping and Analysis Program (EnMAP), a German spaceborne imaging spectroscopy mission envisioned for 2018, a new wealth of full range spaceborne imaging spectroscopy data from all types of environments is expected to be made available [35]. As part of the mission preparation, several research projects are funded that aim at the development of new algorithms to explore the full potential of EnMAP data in different application fields. In addition, a series of EnMAP summer schools is organized for doctoral researchers from these projects and from other research groups, where the young scientists are trained to implement their ideas for shared use. The EnMAP-Box, a toolbox for processing imaging spectrometer data, has been developed since 2010 to make the algorithmic developments of the mission’s preparation phase generally available. This toolbox will be freely distributed with EnMAP data and it is developed along three objectives: (i) complying with standards of common software for imaging spectroscopy data analysis, while extending functionality (e.g., for regression analysis); (ii) including very powerful approaches from the field of machine learning for state-of-the-art image processing; and (iii) offering interfaces to increasingly used scripting languages and, this way, most rapidly evolving resources. The background and motivation for these objectives are briefly outlined in the following paragraphs.
Earth observation (EO) with imaging spectrometers started in 1982 with the first flights of the Airborne Imaging Spectrometer (AIS) followed by the Advanced Visible/Infrared Imaging Spectrometer (AVIRIS) in 1987 [36,37]. The high information content of the contiguous narrow spectral bands, which cover the visible (VIS), near infrared (NIR), and short-ware infrared (SWIR), provided valuable insights on surface characteristics and opened up new pathways of image analysis. The unprecedented spectral resolution of imaging spectrometers enabled analyzing a spectrum’s shape, e.g., its slope or the depth and width of absorption features. In this context, the field of chemometrics offered a suite of techniques [38] that had already been applied to laboratory spectra from minerals and rocks (e.g., [39,40]). A first collection of applications for image data was available in the Spectral Image Processing System (SIPS), which was predominantly programmed in the Interactive Data Language (IDL) and could be used on various operating systems [41]. SIPS included routines for data input, visualization and analyses (e.g., spectral angle mapper, linear spectral unmixing [42,43]) and was the precursor for ENVI (Environment for Visualizing Images) [44]. ENVI addressed a broad range of users, allowing inexperienced users to easily adapt to an imaging spectroscopy workflow. At the same time, experienced users could include their own algorithms through the use of open and generic image file formats and the interface to IDL and its array-based data handling. The rapid methodological developments throughout the 1990s made ENVI the preferred choice for image processing (IP) from airborne instruments such as AVIRIS.
Looking at spaceborne EO the first three decades of application development were focused on multispectral data with four to six spectral bands. Many of the methods used to analyze such EO data, e.g., broad-band vegetation indices or Gaussian maximum likelihood classification, are not necessarily suited for analyzing imaging spectroscopy data. They either do not exploit the wealth of spectral information [34] or require additional IP steps such as feature extraction or selection [45]. The introduction of machine learning algorithms in EO data analysis, e.g., kernel-based methods [26] or self-learning decision trees [46], improved such drawbacks and the rapid increase in hardware processing power made them applicable [47]. Machine learning approaches are mostly used for statistical learning, e.g., in the context of data classification or regression, or data mining, but also for the inversion of radiative transfer models [48]. Due to high processing efforts, the most powerful implementations of machine learning algorithms are usually written in C/C++ and Java (see http://jmlr.org/mloss/). A well-known example is the LIBSVM library for support vector machines (SVM) [49], which is used in many applications and regularly improved, e.g., by new optimization approaches. Nevertheless, such libraries are usually domain-specific and are not provided with disciplinary interfaces, e.g., to read and write standard EO data formats or to automatize parameter tuning. At the same time, they are often not included in commercial software packages or only with limited parameter options. The use of, e.g., LIBSVM in typical environments for EO data processing thus requires programming skills beyond that of most EO data users. Other examples in this context are Breiman’s Random Forests [46], Markov Random Fields [50], or Gaussian Processes [51].
In parallel to the development of machine learning algorithms, there is a growing community that uses scripting languages for a wide range of applications. Over the past 10–15 years, languages such as R [52] or Python [53] opened up new and very effective pathways for effective code generation. The advantage of scripting languages that make it “possible to specify programming tasks in a few lines of code that would otherwise take hundreds of lines in a lower-level language such as C or C++” was already pointed out by Aho in a Science Viewpoint in 2004 [54]. Especially Python’s increasing popularity caused by “simple syntax, abundant online resources and a rich ecosystem of scientifically focused toolkits with a heavy emphasis on community” has recently also been described by Perkel [55] in a Nature Editorial. The success and power of scripting languages is to a great extent based on the constant improvement of shared resources within an active community. Flexible interfaces are needed in order to make the strength of such shared development available in software products.
Against this background, the concept for the EnMAP-Box is developed with a focus on exploring the full potential of future EnMAP data from various environments. Overarching aims are (1) extending the EnMAP user community beyond the existing user community of airborne imaging spectroscopy and (2) providing free-of-charge and user-friendly access to recent approaches for imaging spectroscopy data processing for experienced users. The EnMAP-Box works stand-alone but may be integrated into the ENVI classic menu to extend the range of available applications. It can be used with any multispectral imagery. It combines functionality for spectrally high dimensional data with latest machine learning and interfaces to R or Python. A standard procedure for effectively integrating machine learning approaches was created. This way, a suite of methods and interfaces is created that includes advantages from other commercial, e.g., ENVI, or non-commercial products, e.g., the Orfeo Toolbox [56], and combines them into a set of applications with functionality for imaging spectroscopy data analysis that does not exist elsewhere. The toolbox is delivered together with an application programming interface (API) for a standardized integration of new developments independent from the respective programming language.
This paper provides an overview of the EnMAP-Box (Section 2.1) and an application example (Section 2.2) followed by a description of the API (Section 3). The paper concludes with a general evaluation of the concept with regard to the aims and objectives and an outlook on future developments (Section 4).
2. EnMAP-Box Tools and Applications
2.1. Overview
The EnMAP-Box (currently version 2.1) is mainly developed in IDL for Windows, Mac, and Linux operating systems and distributed with an open source license via the mission’s website www.enmap.org. It requires the free-of-charge IDL virtual machine or an IDL/ENVI license. It provides a graphical user interface (GUI) that is designed in a single window approach (Figure 1) and contains a menu to start all tools and applications, a file list for managing all open image or spectral library data as well as an arbitrary number of frames displaying spectral images or libraries, which can easily be arranged within the window. Single frames, which include image data or library spectra, may be detached and moved to a second screen. Drag-and-drop functionality exists between the file list and frames to open images/bands or libraries/spectra, easily. Navigation and visualization within single frames are handled through common mouse gestures (e.g., direct pixel selection, panning and zooming with left mouse button and mouse-wheel, respectively) or the mouse context menu (e.g., displayed bands selection, data stretching, etc.). Users may also open a console at the bottom of the window, which gives an overview of processing tasks or tools for interactive manipulation, such as pixel/spectra labelling. A detailed description of the GUI functionality is given in manuals at www.enmap.org.
The EnMAP-Box uses generic file formats for storing image data and spectral libraries, e.g., binary spectral data in band sequential order with an associated header file that includes all metadata information. The design of the header files is compatible to the frequently used ENVI file format and in- and outputs therefore compatible with other software products. The EnMAP-Box header partly extends the current standards, e.g., to integrate labels for continuous values when performing quantitative mapping. In addition, spectral libraries are treated as pseudo-images (i.e., single column images) to allow their direct usage in IP methods, e.g., for the training of a regression model. This image-like handling of spectral libraries also enables attributing spectra with values from label images, which offers possibilities for regression analysis that are not available, e.g., in ENVI.
Available basic utilities are designed for spectrally high dimensional data. These include tools for the generation of image statistics, scatter plots, random samples, spatial/spectral subsets or reclassified images, and for data scaling, data transformation (with linear and kernel-based principle component analysis) or image stacking, and for applying masks, e.g., to select pixels to generate a spectral library. For interactive plotting of spectra an R-interface is created, which gives users a variety of graphical options and allows saving the resulting figures directly to the clipboard or as a file. This exemplifies the potential of the EnMAP-Box IDL interface to other scripting languages (see Section 3 for details).
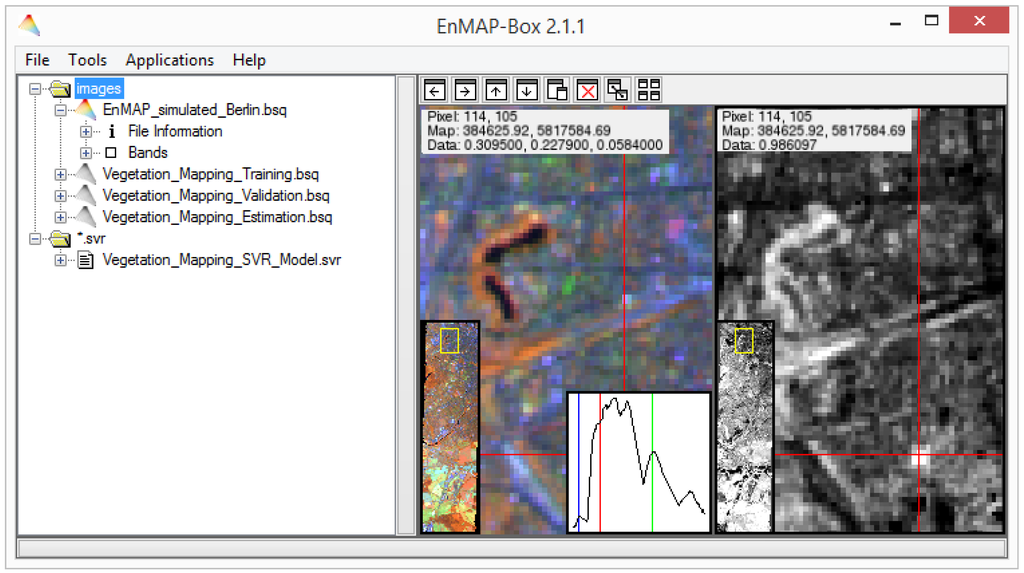
Figure 1.
Graphical user interface of the EnMAP-Box version 2.1.1 with main menu, file list and selected interactively linked data frames. Images show simulated EnMAP data from Berlin, Germany, together with modelled vegetation cover fraction (see Section 2.2).
The core part of the EnMAP-Box is a growing set of applications. This includes both universal applications that are generally very strong for the analysis of EnMAP-like data (e.g., support vector approaches) and application- or data-specific approaches (e.g., EnWaterMap for the automatic generation of water and shadow masks [57]). With the aim of providing most recent developments to the users, several steps were taken to create a standardized implementation of new applications as easy as possible (see Section 3.1). As a result, several well-known data processing approaches are already available in the EnMAP-Box (Table 1 [57,58,59,60,61,62,63]), which were developed and documented by a variety of laboratories involved in the EnMAP mission preparation. The standardized development scheme includes the option of separate license agreements for each included application. Authors of such applications retain all property rights for their work. Existing applications like imageSVM for SVM classification and regression and imageRF for Random Forest classification and regression [58] are already widely used for the analysis of EO data. In addition, a spatial-spectral calculator for pixel/band arithmetic is included (imageMath), which allows, e.g., the use of spectral filters to smooth or generate derivatives for full images in the spectral domain.

Table 1.
List of available applications in EnMAP-Box version 2.1.
| Type of Application | Application Name(s) and Reference | Contributor |
|---|---|---|
| General IP applications | ||
| Support vector classification and regression | imageSVM [59] | HUB |
| Import vector machines for classification | imageIVM [60] | UB, FUB |
| Random forests for classification and regression | imageRF [58] | UB, HUB |
| Partial least squares regression | autoPLSR [61] | UB |
| Spectral feature clustering | Feature Clustering [62] | HUB |
| Spectral index data mining tool | SpInMine | UT |
| Iterative spectral mixture analysis | iterativeSMA [63] | UT |
| SVR-based unmxing using synthetic libraries | syntMix-SVR [13] | HUB |
| Maximum entropy analysis | MaxEntWrapper | UB |
| Application related tools | ||
| Agricultural applications (including tools for estimating (i) the red-edge inflection point, (ii) a suite of 65 agricultural vegetation indices, (iii) spectral integrals and advanced statistical evaluation | iREIP , AVI, ASI, ASE | LMU |
| Ocean related parameter retrieval | Phytobenthos Index, Ocean Color Chlorophyll | HZG |
| Data specific tools | ||
| Surface water body detection | EnWaterMap [57] | GFZ |
Notes: HUB: Humboldt-Universität zu Berlin; UB: University of Bonn; FUB: Freie Universität Berlin; UT: Trier University; LMU: Ludwig-Maximilians-Universität München; HZG: Helmholtz-Zentrum Geesthacht; GFZ: Helmholtz Centre Potsdam; GFZ: German Research Centre for Geosciences.
The list of available applications shows a relatively high number of different regression approaches. Such quantitative approaches are especially effective on imaging spectroscopy data since absorption depths or other features of the contiguous spectral bands can be linked to environmental indicators with linear and non-linear empirical models. Still, most existing IP software only offers concepts for qualitative analysis, e.g., layers for discrete labels. The EnMAP-Box provides both qualitative and quantitative accuracy assessments for different mapping approaches. For qualitative evaluation, the EnMAP-Box integrates approaches for area-based normalization according to [64]. The quantitative accuracy assessment calculates metrics like root mean squared error of Pearson correlation and visualized the error distribution. To the authors’ knowledge, such comprehensive accuracy assessments for qualitative and quantitative results are not available in commercial IP software. In order to be fully independent from operating systems and to facilitate an easy use of textual, tabular and graphical outputs, all reports are printed to HTML documents. Section 2.2 shows an application example with an imageSVM regression with quantitative accuracy assessment.
With regard to the large share of ENVI users, the EnMAP-Box is programmed in a way that it can be integrated into the regular ENVI Classic menu (Figure 2). ENVI’s available bands list then functions as the file list and users may access the EnMAP-Box applications without leaving their regular IP environment.
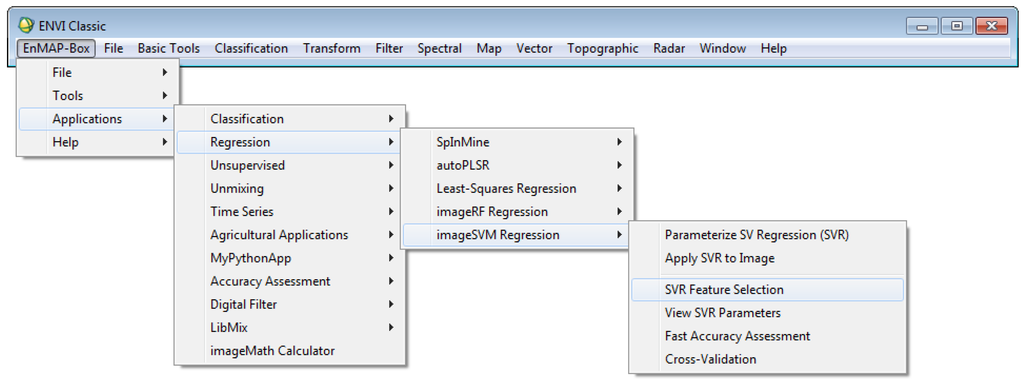
Figure 2.
ENVI classic menu with integrated EnMAP-Box sub-menu.
2.2. imageSVM: An Application Example for Quantitative Mapping in the EnMAP-Box
One of the first advanced applications in the EnMAP-Box was imageSVM for classification and regression. This machine learning application has been used for a variety of studies including both classification [14,65] and regression approaches [13,66]. Its implementation structure is outlined in Section 3.3. In the following, imageSVM is used to map vegetation fractions from simulated EnMAP data. Along this application example, the EnMAP-Box concept for integrating machine learning approaches as well as the functionality for quantitative mapping and accuracy assessment are explained and, this way, some key advantages of the EnMAP-Box compared to other available software products are illustrated.
The first step for mapping vegetation fractions with support vector regression (SVR) is the parameterization of the model. This includes the selection of model parameters and fitting the hyperplane during an optimization. This process is semi-automized in imageSVM by offering a grid search with default ranges that proved useful during many tests on remote sensing data. For each parameter combination, i.e., the kernel parameter γ, the penalization parameter C, and Vapnik’s insensitive loss function parameter ε, model accuracy is tested using cross validation. After starting the imageSVM regression model parameterization from the main menu, the user is asked to specify a spectral image and reference information. The EnMAP-Box interprets spectral libraries as images and users may therefore train from library data, and reference information for classification or regression may be entered analogous to image data. The reference information expects a single-band image with floating point pixel values and the definition of a no data value. This file type was created for the EnMAP-Box and constitutes a regression equivalent to training data for classification. Using the advanced options, users may select all relevant options individually (Figure 3).
During all machine learning applications in the EnMAP-Box, the model parameterization or training is separated from its application to an image or spectral library. Therefore, the SVR parameterization ends with saving the best model and listing it in the file list. An HTML report on the model performance during cross validation is created for the user to evaluate the model (Figure 4). In addition, the separation allows users to apply the model to a variety of images, independent from the source of training data. For the model application, an SVR model and an image need to be specified together with an optional mask and a path and name for the output file (Figure 5).
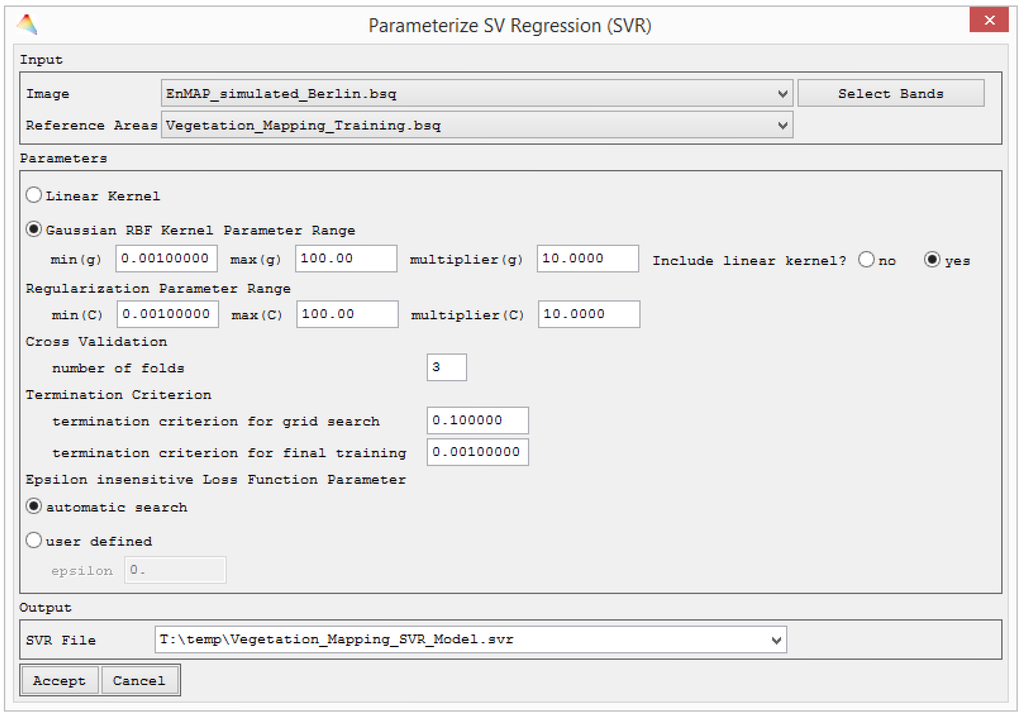
Figure 3.
Dialogue for and advanced SVM regression settings in imageSVM. The dialogue for the regular settings is limited to the Input and Output fields.
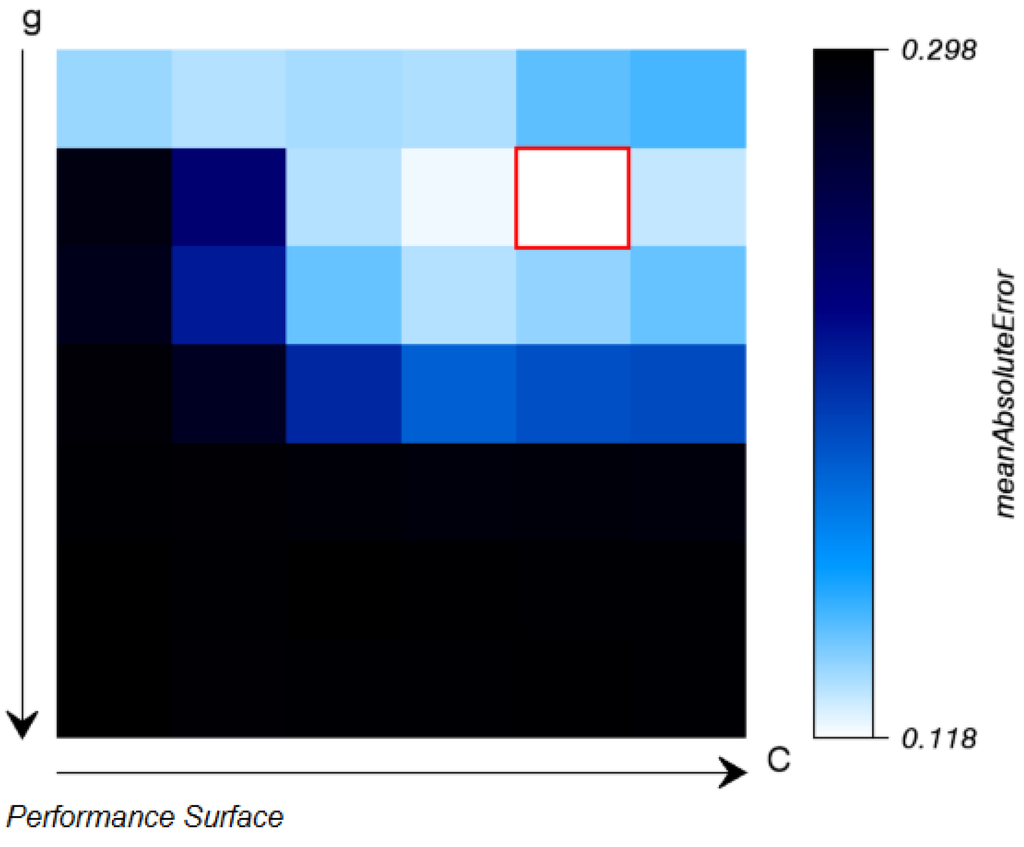
Figure 4.
imageSVM regression: after completed parameter search the results from the grid search with internal cross-validation are displayed in an HTML-report.
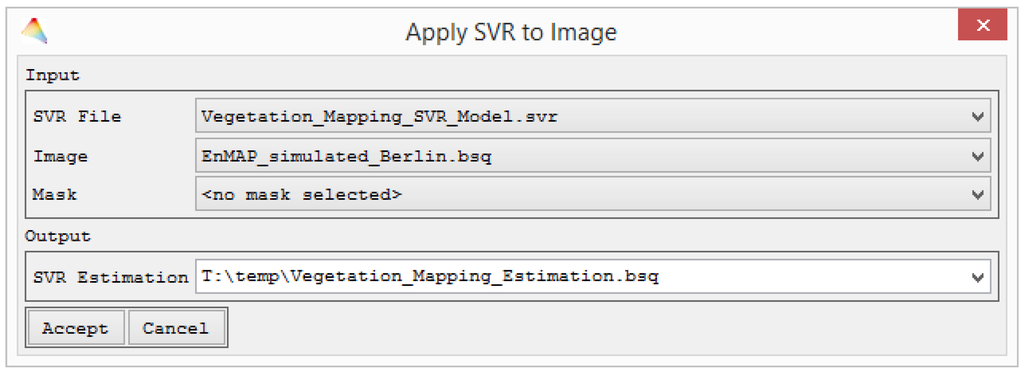
Figure 5.
SVM models are separately stored and, this way, may be flexibly applied to series of images or spectral libraries.
After successful model application, the resulting estimate is output and listed in the file list for further processing. In order to evaluate the accuracy of the result, the EnMAP-Box offers a comprehensive set of measures and visualizations specifically designed for the regression modelling of spectral image data. When choosing the accuracy assessment for regression, the user is asked to specify the regression estimate image and a reference image plus an optional mask. Afterwards, an HTML report appears showing information on the data sets, a variety of statistical measures and visualizations (Figure 6).
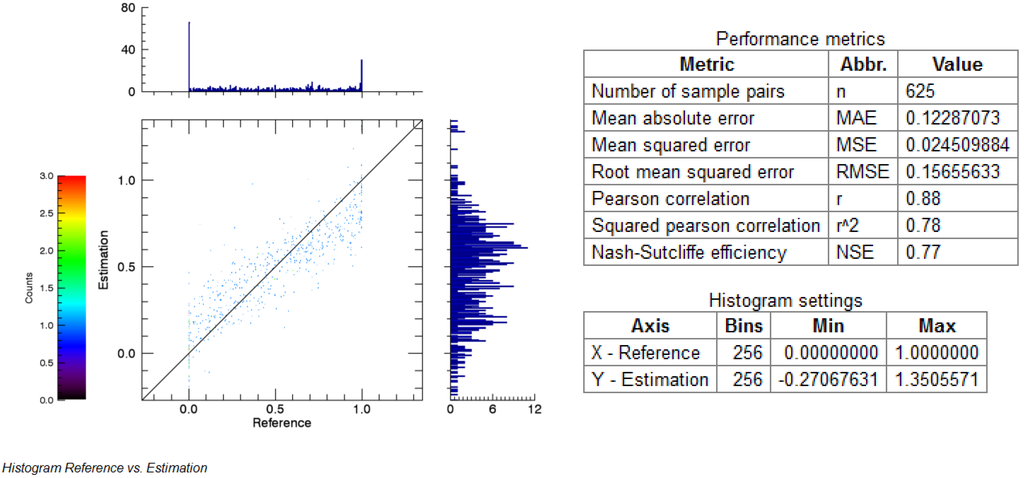
Figure 6.
For comprehensive quantitative accuracy assessment the EnMAP-Box generates various statistical performance measures and visualizes histograms in an HTML report (figure shows excerpt only).
3. Concept and API for Integrating Applications in the EnMAP-Box
3.1. Overview
Several measures are foreseen to make the EnMAP-Box an evolving toolbox where new applications can easily be integrated, regardless of the respective programming language. This way, the provision of latest developments to the user community shall be ensured. From a user perspective, such developments must ensure certain standards, e.g., data formats, but similarly the “look-and-feel” to enable the intuitive combination of several IP steps. Looking at the developer community needs, this may be achieved by offering wizards and pre-programmed code to quickly embed core parts of an application, which themselves do not have to be translated to IDL. Developers can therefore download an EnMAP-Box version with the full source code, the EnMAP-Box API, wizards to create base structures and code documentation, together with manuals for developers.
The concept for integrating external applications into the EnMAP-Box starts with a standardized strategy for all supervised approaches, which separates the model parameterization (Figure 3) and application of respective models to image data. In doing so, supervised approaches and most other procedures can be structured in five distinguished steps: (1) the collection of all parameters and files; (2) reading spectral data from files; (3) analysis of spectral data using specified parameters; (4) writing results to files; (5) reporting and visualizing results (Figure 7). Interaction by the user with the GUI and application specific dialogues is limited to steps 1 and 5 and can be considered an outer shell for the full program integration. The API offers auto-managed widgets that allow selection of various types of parameters and communicate with the file list for quick file selection. Steps 2 and 4 include data in- and output (data IO), for which API routines are provided, including tile-based reading and writing which is required for the large data volume of imaging spectroscopy data. The actual data processing is performed in step 3. By introducing this standardized structure, an optimized use of the different API components (i.e., auto-managed widgets, (tile-based) data IO, reporting) is enabled. At the same time, the core part of external applications is decoupled from all user interaction and concentrated in step 3, which then requires no standardization and may often be favorable to remain in an external programming language. In the case of imageSVM, for example, the LIBSVM library is integrated via the IDL-JAVA Bridge interface to perform the parameter optimization, only (see Section 3.2).
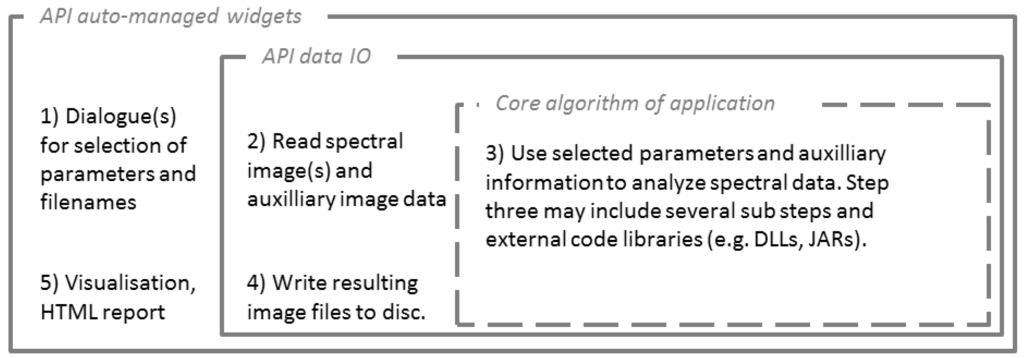
Figure 7.
General framework for standardized integration for embedding applications.
In the case of scripting languages, the bridging between IDL and languages like R or Python is more complicated as large binary spectral data cannot easily be passed-on. In this case, the data IO is better performed in the scripting language (Figure 8 (top)). In addition, user defined parameters and filenames are easily transferred via JSON strings (Figure 8 (bottom)).
Another component for the standardized implementation and consistent coding is the application development wizard. This IDL tool may be used to create a set of IDL routines which already follow the general framework for application development in Figure 7. This includes the creation of routine skeletons for input dialogues, image/data processing and HTML report creation, but also invokes source code documentation via IDLdoc to generate Javadoc-style HTML documents from comments in IDL [67]. Both measures are seen as incentives for all programmers to follow certain standards and this way enable joined work on improving and extending existing methods.
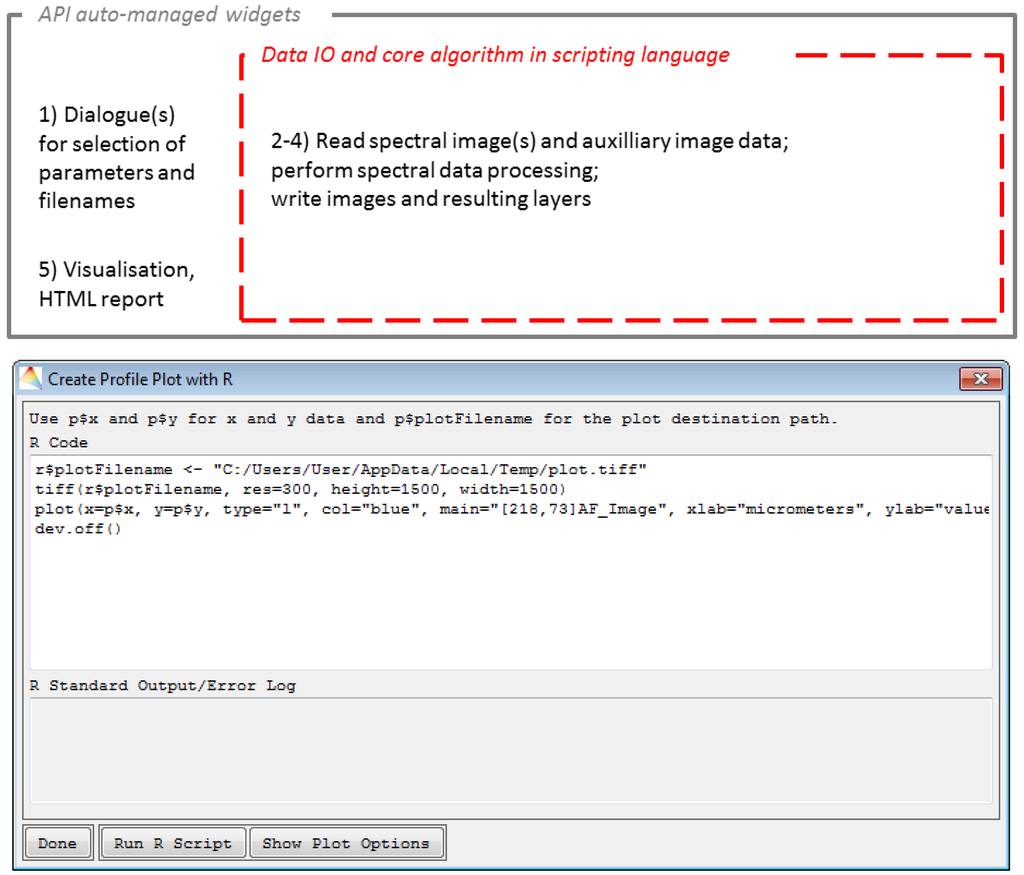
Figure 8.
Adapted framework for application integration using scripting languages (top) and example for scripting options (here the case of the plot interface) (bottom).
3.2. imageSVM—Implementing JAVA Code with the EnMAP-Box API
Aiming at high processing performances, scripting languages (e.g., R, Python) or interpreter languages (e.g., IDL, MATLAB) are often outperformed by C, C++ or Java. The integration of algorithms in these languages appears especially useful when optimization procedures and repetitive processes are needed. In the case of SVM, the use of LIBSVM [49] appears also useful with regard to constant improvements of the base code. In the imageSVM application, LIBSVM is used as a Java archive (i.e., JAR-file) via the IDL-Java Bridge for the optimization and evaluation of individual models with given training/test data and pre-defined parameters as part of an IDL-based grid search (Figure 9).
imageSVM for regression makes full use of the concept for embedding external Java. Following the parameter selection with auto-managed widgets from the API (Figure 6), the spectral data and labels that are needed for the model parameterization are read. The application specific core part consists of an IDL-based data preparation for the cross validation. IDL code is used to pass the spectral data and labels for training and testing via the IDL-Java Bridge to LIBSVM separately for each set of parameters resulting from the previously defined ranges. LIBSVM returns the models’ cross validation accuracy, and within IDL a best parameter pair is selected for the final training in LIBSVM. This model is saved and all results from the grid search are reported. The data output step is not required, here, because the application of the model to an image is performed separately.
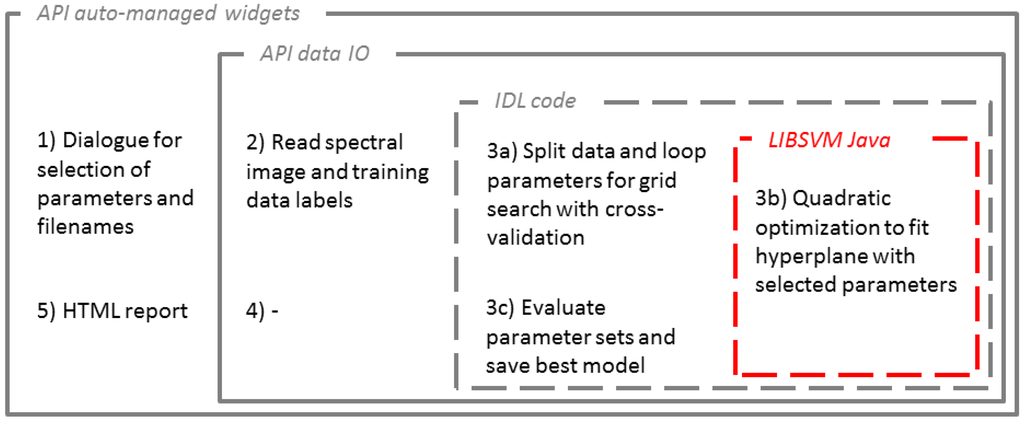
Figure 9.
Framework for embedding applications for the imageSVM regression example using Java-based LIBSVM and the IDL-Java Bridge.
3.3. Integration of Existing Libraries Using the Command Line Interface
Projects like the Geospatial Data Abstraction Library (GDAL, www.gdal.org) and the Orfeo ToolBox [56] have a long development history and provide efficient implementations of remote sensing relevant algorithms. In addition to its core API, which often has a C/C++ interface and requires deeper understanding of implementation details, they offer stand-alone applications that can be run from the command line interface (CLI). The EnMAP-Box source code provides wrapper routines that allow calling these applications from inside IDL and to integrate them into their own workflows.
4. Conclusions and Outlook
The EnMAP-Box integrates powerful machine learning algorithms and bridges to more and more popular scripting languages with well-established concepts of imaging spectroscopy software. Much of the available functionality of the EnMAP-Box is not available as an ENVI-industry standard in this field. Users may use support vector machines or random forests for regression and classification with spectral libraries or spectral images, and they may interface to Python toolkits or R script libraries. Various components of the EnMAP-Box were improved by sophisticated extensions, e.g., comprehensive HTML reports, the spatial/spectral calculator imageMath, etc. Developers, on the other hand, are provided with a concept and pre-programmed code to easily disseminate their implementation to a wider community.
Aiming at the extension of the user community and providing the most powerful algorithms for the analysis of EnMAP data, the needs of regular users as well as potential developers of new methods were integrated in the conceptual development over the past years. The EnMAP-box development was thus driven by the idea of
- user-friendliness—achieved, e.g., by an intuitive GUI focusing on the handling and visualization of data with high spectral dimensions, widget controlled machine learning algorithms, common file formats, selected basic tools and easy-to-use advanced methods, the possible integration into the ENVI menu;
- comprehensiveness—the set of available tools and applications as well as interfaces to scripting languages make the constant change between different software obsolete;
- standardization—the implementation and use of applications is standardized to assist external developers and provide the users a common look-and-feel, which also constitutes a key component for user-friendliness;
- addressing external developers—by making well-documented source code available, offering an API and creation wizard.
Ever since the prototype of the EnMAP-Box in 2009, its applications have been used in the field of imaging spectroscopy and beyond. Since about 2012, more and more external applications have been added, all following the idea of a standardized implementation. It was used for data processing within EnMAP summer schools since 2010 and always received positive responses. Several universities use the EnMAP-Box as a freely available tool in basic teaching. Feedback from users was constantly used to extend and improve its functionality.
Prior to the start of EnMAP, the toolbox will be extended by a set of sensor product specific tools. This will include, e.g., a tool for atmospheric correction to transfer data from level 1B to 2A with user defined settings, or for working with rational polynomial coefficients to reconstruct detector pixels from level 1B data. In addition, import filters for currently defined EnMAP data products as well as complementary sensors, e.g., Sentinel-2/3, Landsat OLI, will be included. Moreover, a set of disciplinary applications are currently being developed at laboratories involved in the mission preparation [35]. This includes an advanced suite for geological mapping based on the tetracorder approach [68] as well as a soil mapping suite.
Several recent software developments in remote sensing were linked to new instruments. The BEAM application suite (Basic Envisat and ERS (A)ATSR and MERIS Toolbox) and the Orfeo ToolBox (for Pleiades) are successful examples. Both are open-source and programmed in Java and C++, respectively. They are not limited to data from the mentioned sensors. The EnMAP-Box constitutes a similar approach that fills a gap with regard to imaging spectroscopy data. The chance for the EnMAP-box to become an evolving toolbox with a constantly growing set of applications is high, given the toolbox’s availability with future EnMAP data, its sensor specific algorithms together with its flexibility of integrating new developments in a variety of programming languages. In his 2009 overview paper on imaging spectroscopy, Goetz [1] explains the demise of the High Resolution Imaging Spectrometer (HIRIS) with the small number of scientists working with imaging spectroscopy data, and, in this context, he mentions a lack of readily available software and algorithms. Therefore, the early availability of simulated EnMAP data [69] in combination with the freely available EnMAP-Box can be seen as major pre-requisites for the success of the EnMAP-mission and a frequent use of its data in many environmental fields.
Acknowledgments
The EnMAP-Box is developed at Humboldt-Universität zu Berlin under contract by the Helmholtz Centre Potsdam—GFZ, with financial support of the German Aerospace Centre (DLR) with funds by the German Federal Ministry of Economy and Technology (FKZ 50EE1256). The authors are grateful to all colleagues who contributed to the development of the EnMAP-Box with embedding their own applications.
Author Contributions
Sebastian van der Linden designed the manuscript structure and led the writing process. All authors contributed to the manuscript, literature analysis and graphical inputs. In addition, all authors have contributed to the EnMAP-Box development and documentation constantly for several years.
Conflicts of Interest
The authors declare no conflict of interest.
References
- Goetz, A.F.H. Three decades of hyperspectral remote sensing of the Earth: A personal view. Remote Sens. Environ. 2009, 113, S5–S16. [Google Scholar] [CrossRef]
- Goetz, A.F.H.; Vane, G.; Solomon, J.E.; Rock, B.N. Imaging spectrometry for Earth remote-sensing. Science 1985, 228, 1147–1153. [Google Scholar] [CrossRef] [PubMed]
- Schaepman, M.E.; Ustin, S.L.; Plaza, A.J.; Painter, T.H.; Verrelst, J.; Liang, S. Earth system science related imaging spectroscopy—An assessment. Remote Sens. Environ. 2009, 113, S123–S137. [Google Scholar] [CrossRef]
- Kokaly, R.F.; Asner, G.P.; Ollinger, S.V.; Martin, M.E.; Wessman, C.A. Characterizing canopy biochemistry from imaging spectroscopy and its application to ecosystem studies. Remote Sens. Environ. 2009, 113, S78–S91. [Google Scholar] [CrossRef]
- Schlerf, M.; Atzberger, C.; Hill, J. Remote sensing of forest biophysical variables using HyMap imaging spectrometer data. Remote Sens. Environ. 2005, 95, 177–194. [Google Scholar] [CrossRef]
- Kötz, B.; Schaepman, M.; Morsdorf, F.; Bowyer, P.; Itten, K.; Allgower, B. Radiative transfer modeling within a heterogeneous canopy for estimation of forest fire fuel properties. Remote Sens. Environ. 2004, 92, 332–344. [Google Scholar] [CrossRef]
- Thenkabail, P.S.; Smith, R.B.; De Pauw, E. Hyperspectral vegetation indices and their relationships with agricultural crop characteristics. Remote Sens. Environ. 2000, 71, 158–182. [Google Scholar] [CrossRef]
- Haboudane, D.; Miller, J.R.; Tremblay, N.; Zarco-Tejada, P.J.; Dextraze, L. Integrated narrow-band vegetation indices for prediction of crop chlorophyll content for application to precision agriculture. Remote Sens. Environ. 2002, 81, 416–426. [Google Scholar] [CrossRef]
- Zarco-Tejada, P.J.; Berjon, A.; Lopez-Lozano, R.; Miller, J.R.; Martin, P.; Cachorro, V.; Gonzalez, M.R.; de Frutos, A. Assessing vineyard condition with hyperspectral indices: Leaf and canopy reflectance simulation in a row-structured discontinuous canopy. Remote Sens. Environ. 2005, 99, 271–287. [Google Scholar] [CrossRef]
- Zhang, B.; Wu, D.; Zhang, L.; Jiao, Q.; Li, Q. Application of hyperspectral remote sensing for environment monitoring in mining areas. Environ. Earth Sci. 2012, 65, 649–658. [Google Scholar] [CrossRef]
- Riaza, A.; Buzzi, J.; García-Meléndez, E.; Carrère, V.; Müller, A. Monitoring the extent of contamination from acid mine drainage in the Iberian Pyrite Belt (SW Spain) using hyperspectral imagery. Remote Sens. 2011, 3, 2166–2186. [Google Scholar] [CrossRef]
- Heiden, U.; Segl, K.; Roessner, S.; Kaufmann, H. Determination of robust spectral features for identification of urban surface materials in hyperspectral remote sensing data. Remote Sens. Environ. 2007, 111, 537–552. [Google Scholar] [CrossRef]
- Okujeni, A.; van der Linden, S.; Tits, L.; Somers, B.; Hostert, P. Support vector regression and synthetically mixed training data for quantifying urban land cover. Remote Sens. Environ. 2013, 137, 184–197. [Google Scholar] [CrossRef]
- Van der Linden, S.; Hostert, P. The influence of urban structures on impervious surface maps from airborne hyperspectral data. Remote Sens. Environ. 2009, 113, 2298–2305. [Google Scholar] [CrossRef]
- Asner, G.P.; Martin, R.E. Spectral and chemical analysis of tropical forests: Scaling from leaf to canopy levels. Remote Sens. Environ. 2008, 112, 3958–3970. [Google Scholar] [CrossRef]
- Somers, B.; Asner, G.P. Hyperspectral time series analysis of native and invasive species in Hawaiian rainforests. Remote Sens. 2012, 4, 2510–2529. [Google Scholar] [CrossRef]
- Roberts, D.A.; Gardner, M.; Church, R.; Ustin, S.; Scheer, G.; Green, R. Mapping chaparral in the Santa Monica mountains using multiple endmember spectral mixture models. Remote Sens. Environ. 1998, 65, 267–279. [Google Scholar] [CrossRef]
- Kooistra, L.; Wamelink, W.; Schaepman-Strub, G.; Schaepman, M.; van Dobben, H.; Aduaka, U.; Batelaan, O. Assessing and predicting biodiversity in a floodplain ecosystem: Assimilation of net primary production derived from imaging spectrometer data into a dynamic vegetation model. Remote Sens. Environ. 2008, 112, 2118–2130. [Google Scholar] [CrossRef]
- Suess, S.; van der Linden, S.; Okujeni, A.; Leitão, P.; Schwieder, M.; Hostert, P. Using class probabilities to map gradual transitions in shrub vegetation from simulated EnMAP data. Remote Sens. 2015, 7, 10668–10688. [Google Scholar] [CrossRef]
- Okin, G.S.; Roberts, D.A.; Murray, B.; Okin, W.J. Practical limits on hyperspectral vegetation discrimination in arid and semiarid environments. Remote Sens. Environ. 2001, 77, 212–225. [Google Scholar] [CrossRef]
- Ustin, S.L.; Valko, P.G.; Kefauver, S.C.; Santos, M.J.; Zimpfer, J.F.; Smith, S.D. Remote sensing of biological soil crust under simulated climate change manipulations in the Mojave desert. Remote Sens. Environ. 2009, 113, 317–328. [Google Scholar] [CrossRef]
- Dozier, J.; Green, R.O.; Nolin, A.W.; Painter, T.H. Interpretation of snow properties from imaging spectrometry. Remote Sens. Environ. 2009, 113, S25–S37. [Google Scholar] [CrossRef]
- Zhao, S.; Jiang, T.; Wang, Z. Snow grain-size estimation using Hyperion imagery in a typical area of the Heihe river basin, China. Remote Sens. 2013, 5, 238–253. [Google Scholar] [CrossRef]
- Isada, T.; Hirawake, T.; Kobayashi, T.; Nosaka, Y.; Natsuike, M.; Imai, I.; Suzuki, K.; Saitoh, S.-I. Hyperspectral optical discrimination of phytoplankton community structure in Funka Bay and its implications for ocean color remote sensing of diatoms. Remote Sens. Environ. 2015, 159, 134–151. [Google Scholar] [CrossRef]
- Ryan, J.; Davis, C.; Tufillaro, N.; Kudela, R.; Gao, B.C. Application of the hyperspectral imager for the coastal ocean to phytoplankton ecology studies in Monterey Bay, CA, USA. Remote Sens. 2014, 6, 1007–1025. [Google Scholar] [CrossRef]
- Plaza, A.; Benediktsson, J.A.; Boardman, J.W.; Brazile, J.; Bruzzone, L.; Camps-Valls, G.; Chanussot, J.; Fauvel, M.; Gamba, P.; Gualtieri, A.; et al. Recent advances in techniques for hyperspectral image processing. Remote Sens. Environ. 2009, 113, S110–S122. [Google Scholar] [CrossRef]
- Koetz, B.; Morsdorf, F.; Van der Linden, S.; Curt, T.; Allgöwer, B. Multi-source land cover classification for forest fire management based on imaging spectrometry and LiDAR data. For. Ecol. Manag. 2008, 256, 263–271. [Google Scholar] [CrossRef]
- Okujeni, A.; van der Linden, S.; Jakimow, B.; Rabe, A.; Verrelst, J.; Hostert, P. A comparison of advanced regression algorithms for quantifying urban land cover. Remote Sens. 2014, 6, 6324–6346. [Google Scholar] [CrossRef]
- Leitão, P.J.; Schwieder, M.; Suess, S.; Catry, I.; Milton, E.J.; Moreira, F.; Osborne, P.E.; Pinto, M.J.; van der Linden, S.; Hostert, P. Mapping beta diversity from space: Sparse generalised dissimilarity modelling (SGDM) for analysing high-dimensional data. Methods Ecol. Evol. 2015, 6, 764–771. [Google Scholar] [CrossRef]
- Jacquemoud, S.; Verhoef, W.; Baret, F.; Bacour, C.; Zarco-Tejada, P.J.; Asner, G.P.; François, C.; Ustin, S.L. PROSPECT+SAIL models: A review of use for vegetation characterization. Remote Sens. Environ. 2009, 113, S56–S66. [Google Scholar] [CrossRef]
- Laurent, V.C.E.; Verhoef, W.; Clevers, J.G.P.W.; Schaepman, M.E. Inversion of a coupled canopy-atmosphere model using multi-angular top-of-atmosphere radiance data: A forest case study. Remote Sens. Environ. 2011, 115, 2603–2612. [Google Scholar] [CrossRef]
- Herold, M.; Gardner, M.E.; Roberts, D.A. Spectral resolution requirements for mapping urban areas. IEEE Trans. Geosci. Remote Sens. 2003, 41, 1907–1919. [Google Scholar] [CrossRef]
- Okujeni, A.; van der Linden, S.; Hostert, P. Extending the vegetation-impervious-soil model using simulated EnMAP data and machine learning. Remote Sens. Environ. 2015, 158, 69–80. [Google Scholar] [CrossRef]
- Mariotto, I.; Thenkabail, P.S.; Huete, A.; Slonecker, E.T.; Platonov, A. Hyperspectral versus multispectral crop-productivity modeling and type discrimination for the HyspIRI mission. Remote Sens. Environ. 2013, 139, 291–305. [Google Scholar] [CrossRef]
- Guanter, L.; Kaufmann, H.; Segl, K.; Foerster, S.; Rogass, C.; Chabrillat, S.; Kuester, T.; Hollstein, A.; Rossner, G.; Chlebek, C.; et al. The EnMAP spaceborne imaging spectroscopy mission for Earth observation. Remote Sens. 2015, 7, 8830. [Google Scholar] [CrossRef]
- Vane, G.; Goetz, A.F.H.; Wellman, J.B. Airborne imaging spectrometer: A new tool for remote sensing. IEEE Trans. Geosci. Remote Sens. 1984, GE-22, 546–549. [Google Scholar] [CrossRef]
- Vane, G.; Green, R.O.; Chrien, T.G.; Enmark, H.T.; Hansen, E.G.; Porter, W.M. The airborne visible infrared imaging spectrometer (AVIRIS). Remote Sens. Environ. 1993, 44, 127–143. [Google Scholar] [CrossRef]
- Mark, H. Chemometrics in near-infrared spectroscopy. Anal. Chim. Acta 1989, 223, 75–93. [Google Scholar] [CrossRef]
- Clark, R.N.; King, T.V.V.; Klejwa, M.; Swayze, G.A.; Vergo, N. High spectral resolution reflectance spectroscopy of minerals. J. Geophys. Res. Solid Earth 1990, 95, 12653–12680. [Google Scholar] [CrossRef]
- Adams, J.B.; Smith, M.O.; Johnson, P.E. Spectral mixture modeling—A new analysis of rock and soil types at the Viking Lander-1 site. J. Geophys. Res. Solid Earth Planets 1986, 91, 8098–8112. [Google Scholar] [CrossRef]
- Kruse, F.A.; Lefkoff, A.B.; Boardman, J.W.; Heidebrecht, K.B.; Shapiro, A.T.; Barloon, P.J.; Goetz, A.F.H. The spectral image-processing system (sips)—Interactive visualization and analysis of imaging spectrometer data. Remote Sens. Environ. 1993, 44, 145–163. [Google Scholar] [CrossRef]
- Roberts, D.A.; Smith, M.O.; Adams, J.B. Green vegetation, nonphotosynthetic vegetation, and soils in AVIRIS data. Remote Sens. Environ. 1993, 44, 255–269. [Google Scholar] [CrossRef]
- Kruse, F.A.; Lefkoff, A.B.; Dietz, J.B. Expert system-based mineral mapping in northern Death-Valley, California Nevada, using the airborne visible infrared imaging spectrometer (AVIRIS). Remote Sens. Environ. 1993, 44, 309–336. [Google Scholar] [CrossRef]
- EXELIS. ENVI 5.2—Environment for Visualizing Images. Available online: http://www.exelisvis.com/ProductsServices/ENVIProducts.aspx (accessed on 27 August 2015).
- Kuo, B.-C.; Landgrebe, D.A. Nonparametric weighted feature extraction for classification. IEEE Trans. Geosci. Remote Sens. 2004, 42, 1096–1105. [Google Scholar]
- Breiman, L. Random forests. Mach. Learn. 2001, 45, 5–32. [Google Scholar] [CrossRef]
- Richards, J.A. Analysis of remotely sensed data: The formative decades and the future. IEEE Trans. Geosci. Remote Sens. 2005, 43, 422–432. [Google Scholar] [CrossRef]
- Verrelst, J.; Muñoz, J.; Alonso, L.; Delegido, J.; Rivera, J.P.; Camps-Valls, G.; Moreno, J. Machine learning regression algorithms for biophysical parameter retrieval: Opportunities for Sentinel-2 and -3. Remote Sens. Environ. 2012, 118, 127–139. [Google Scholar] [CrossRef]
- Chang, C.-C.; Lin, C.-J. LIBSVM: A library for support vector machines. ACM Trans. Intell. Syst. Technol. 2011, 2, 1–27. [Google Scholar] [CrossRef]
- Li, S.Z. Markov Random Field Modeling in Image Analysis; Springer-Verlag: London, UK, 2009. [Google Scholar]
- Rasmussen, C.E.; Williams, C.K.I. Gaussian Processes for Machine Learning; The MIT Press: Cambridge, MA, USA, 2006. [Google Scholar]
- R Core Team. R: A Language and Environment for Statistical Computing; R Foundation for Statistical Computing: Vienna, Austria, 2014. [Google Scholar]
- Python Software Foundation. Python (TM). Available online: http://www.python.org (accessed on 27 August 2015).
- Aho, A.V. Software and the future of programming languages. Science 2004, 303, 1331–1333. [Google Scholar] [CrossRef] [PubMed]
- Perkel, J.M. Programming: Pick up Python. A powerful programming language with huge community support. Nature 2015, 518, 125–126. [Google Scholar] [CrossRef] [PubMed]
- CNES. Orfeo Toolbox—Orfeo Toolbox is not a Black Box. Available online: http://www.orfeo-toolbox.org (accessed on 27 August 2015).
- Bochow, M.; Heim, B.; Küster, T.; Rogaß, C.; Bartsch, I.; Segl, K.; Reigber, S.; Kaufmann, H. On the use of airborne imaging spectroscopy data for the automatic detection and delineation of surface water bodies. In Remote Sensing of Planet Earth; Chemin, Y., Ed.; InTech: Rijeka, Croatia, 2012; pp. 3–22. [Google Scholar]
- Waske, B.; van der Linden, S.; Oldenburg, C.; Jakimow, B.; Rabe, A.; Hostert, P. ImageRF—A user-oriented implementation for remote sensing image analysis with random forests. Environ. Model. Softw. 2012, 35, 192–193. [Google Scholar] [CrossRef]
- Janz, A.; van der Linden, S.; Waske, B.; Hostert, P. ImageSVM—A user-oriented tool for advanced classification of hyperspectral data using support vector machines. In Proceedings of the 5th EARSeL SIG IS Workshop—“Imaging Spectroscopy: Innovation in Environmental Research”, Bruges, Belgium, 23–25 April 2007.
- Roscher, R.; Waske, B.; Foerstner, W. Incremental import vector machines for classifying hyperspectral data. IEEE Trans. Geosci. Remote Sens. 2012, 50, 3463–3473. [Google Scholar] [CrossRef]
- Wold, S.; Sjostrom, M.; Eriksson, L. PLS-regression: A basic tool of chemometrics. Chemom. Intell. Lab. Syst. 2001, 58, 109–130. [Google Scholar] [CrossRef]
- Held, M.; Rabe, A.; Senf, C.; van der Linden, S.; Hostert, P. Analyzing hyperspectral and hypertemporal data by decoupling feature redundancy and feature relevance. IEEE Geosci. Remote Sens. Lett. 2015, 12, 983–987. [Google Scholar] [CrossRef]
- Rogge, D.M.; Rivard, B.; Zhang, J.; Feng, J. Iterative spectral unmixing for optimizing per-pixel endmember sets. IEEE Trans. Geosci. Remote Sens. 2006, 44, 3725–3736. [Google Scholar] [CrossRef]
- Olofsson, P.; Foody, G.M.; Stehman, S.V.; Woodcock, C.E. Making better use of accuracy data in land change studies: Estimating accuracy and area and quantifying uncertainty using stratified estimation. Remote Sens. Environ. 2013, 129, 122–131. [Google Scholar] [CrossRef]
- Alcantara, C.; Kuemmerle, T.; Prishchepov, A.V.; Radeloff, V.C. Mapping abandoned agriculture with multi-temporal MODIS satellite data. Remote Sens. Environ. 2012, 124, 334–347. [Google Scholar] [CrossRef]
- Schwieder, M.; Leitao, P.J.; Suess, S.; Senf, C.; Hostert, P. Estimating fractional shrub cover using simulated EnMAP data: A comparison of three machine learning regression techniques. Remote Sens. 2014, 6, 3427–3445. [Google Scholar] [CrossRef]
- EXELIS. IDLdoc. Available online: http://www.exelisvis.com/docs/Using_IDLdoc_to_Generate.html (accessed on 27 August 2015).
- Dalton, J.B.; Bove, D.J.; Mladinich, C.S.; Rockwell, B.W. Identification of spectrally similar materials using the USGS Tetracorder algorithm: The calcite-epidote-chlorite problem. Remote Sens. Environ. 2004, 89, 455–466. [Google Scholar] [CrossRef]
- Segl, K.; Guanter, L.; Rogass, C.; Kuester, T.; Roessner, S.; Kaufmann, H.; Sang, B.; Mogulsky, V.; Hofer, S. EeteS—The EnMAP end-to-end simulation tool. IEEE J. Sel. Top. Appl. Earth Obs. Remote Sens. 2012, 5, 522–530. [Google Scholar] [CrossRef]
© 2015 by the authors; licensee MDPI, Basel, Switzerland. This article is an open access article distributed under the terms and conditions of the Creative Commons Attribution license (http://creativecommons.org/licenses/by/4.0/).