Article

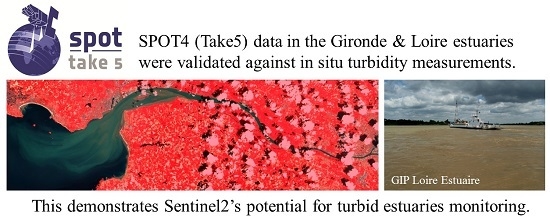
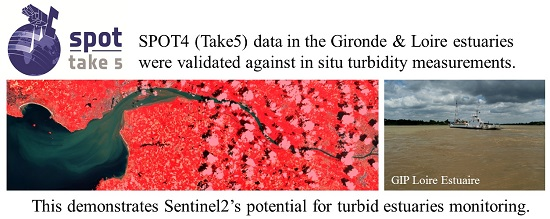
Toward Sentinel-2 High Resolution Remote Sensing of Suspended Particulate Matter in Very Turbid Waters: SPOT4 (Take5) Experiment in the Loire and Gironde Estuaries

1
EA 2160 Mer Molécules Santé (MMS), Université de Nantes, 2 chemin de la Houssinière, 44322 Nantes, France
2
GEO-Transfert, UMR 5805 Environnements et Paléo-environnements Océaniques et Continentaux (EPOC), Université de Bordeaux, Allée Geoffroy Saint-Hilaire, 33615 Pessac, France
3
SEA, Bordeaux Technowest, 25 rue Marcel Issartier, 33700 Mérignac, France
4
UMR 5805 Environnements et Paléo-environnements Océaniques et Continentaux (EPOC), Université de Bordeaux, Allée Geoffroy Saint-Hilaire, 33615 Pessac, France
5
Groupement d'intérêt public (GIP) Loire Estuaire, 22 rue de la Tour d'Auvergne, 44200 Nantes, France
*
Author to whom correspondence should be addressed.
Remote Sens. 2015, 7(8), 9507-9528; https://doi.org/10.3390/rs70809507
Submission received: 28 May 2015 / Revised: 30 June 2015 / Accepted: 20 July 2015 / Published: 24 July 2015

Abstract

:
At the end of the SPOT4 mission, a four-month experiment was conducted in 2013 to acquire high spatial (20 m) and high temporal (5 days) resolution satellite data. In addition to the SPOT4 (Take5) dataset, we used several Landsat5, 7, 8 images to document the variations in suspended particulate matter (SPM) concentration in the turbid Gironde and Loire estuaries (France). Satellite-derived SPM concentration was validated using automated in situ turbidity measurements from two monitoring networks. The combination of a multi-temporal atmospheric correction method with a near-infrared to visible reflectance band ratio made it possible to quantify SPM surface concentration in moderately to extremely turbid waters (38–4320 g·m−3), at an accuracy sufficient to detect the maximum turbidity zone (MTZ) in both estuaries. Such a multi-sensor approach can be applied to high spatial resolution satellite archives and to the new ESA Sentinel-2 mission. It offers a promising framework to study the response of estuarine ecosystems to global changes at unprecedented spatio-temporal resolution.

Graphical Abstract

1. Introduction

Due to the Water Framework Directive and Marine Strategy Framework Directive, European state members are required to monitor the environmental status of their inland and coastal waters. Water quality monitoring is all the more needed in major estuaries hosting large urban areas and important industrial activities where the transfer of suspended material from terrestrial to oceanic ecosystems is significantly affected by land-use changes [1] and anthropogenic contamination [2,3]. Amongst other environmental issues, suspended particulate matter (SPM) transport and accumulation have direct and indirect effects on aquatic ecosystems and human activities. Direct effects mainly concern the modification of river morphology due to erosion and sedimentation, locally resulting in bed sediment washout, mudflat and sandbar moves, or silting-up of harbours and navigation channels [4]. Indirect effects include changes in light attenuation and primary production [5], oxygen saturation [6], alteration of fish nursery function [7], transport of SPM-attached pollutants [8], modification of nutrients pathways [9] and biogeochemical cycles [10].
In estuaries, SPM concentration is characterized by a high degree of variability due to the concomitant intrusion of marine waters and freshwater discharge. This results in intermingled physical and chemical processes such as sediments deposition and resuspension during tidal cycles [11], turbulence-induced particle accumulation [12] and flocculation [13]. Measurement is needed at high temporal and high spatial resolution to accurately document SPM variation. Though the deployment of automated sensors makes it possible to study SPM temporal variation over a range of scales from hours to years [14], it is restricted to the geographical location of the instrumented stations in instrumented estuaries, and most estuaries are not instrumented [6]. Due to its global coverage and ability to zoom in specific areas, satellite remote sensing provides synoptic observations of water reflectance in the visible and near infrared (NIR) spectral regions, which in turn can be used to map SPM surface concentration in turbid waters [15] at worldwide scale.
Landsat and SPOT high spatial resolution data have been widely used to detect SPM concentration in estuaries and nearshore areas. Since the early observations of the turbid discharge of the Mississippi waters in the Louisiana Bight [16], a variety of Landsat and SPOT images have been analysed to map SPM surface concentration in the world’s main estuaries, including the Amazon [17], Gironde [18], Mekong [19], Rhone [20], and Yangtze [21,22] estuaries. Due to their low acquisition frequency, Landsat and SPOT observations are however temporally limited to document SPM variability in highly dynamical coastal areas. With a revisit time of 1–3 days, MODIS and MERIS data can be used more systematically to quantify surface SPM dynamics in large estuaries [23,24,25], but their spatial resolution (250 m–1 km) is not sufficient to detect small scale SPM variations in narrow estuaries and nearshore areas.
Launched in June 2015 by the European Space Agency (ESA), Sentinel-2 is the first satellite mission to systematically observe the world’s coastal zone at both high spatial (10–60 m) and temporal resolution (5 days). With 13 spectral bands from the visible to the short wave infrared (SWIR) spectral regions, the Multispectral Instrument (MSI) on board Sentinel-2 will provide continuity and improvements to SPOT and Landsat image archives. To prepare the analysis of Sentinel-2 data, the French Space Agency (Centre National d’Etudes Spatiales, CNES, Paris, France) implemented the SPOT4 (Take5) experiment in 2013, providing a four-month time series of images simulating the revisit frequency, spatial resolution and large field of view of Sentinel-2 data.
SPOT4 (Take5) data have been used for a variety of applications, from land and habitat studies to monitoring of inland and coastal waters. We present here an analysis of the SPOT4 (Take5) images acquired over two major estuaries of the French Atlantic coast, namely the Gironde and Loire estuaries. Satellite data were analysed in conjunction with automated in situ turbidity measurements, in order to evaluate the accuracy of the SPM algorithms previously proposed for both study sites [26]. The Doxaran et al. (2003) algorithm has previously been validated in the Gironde estuary at moderate resolution using MODIS data [23], and already applied to SPOT and Landsat images [18], but a thorough evaluation of the approach to high resolution satellite images has never been done, neither in the Gironde, nor in the Loire estuary. In the present study, we used the opportunity of the SPOT4 (Take5) experiment to evaluate SPOT4 and Landsat SPM data processed using the Doxaran et al. (2003) algorithms [26], and to study the spatial distribution of SPM surface concentration at high resolution in both estuaries.

2. Material and Methods

2.1. Study Sites

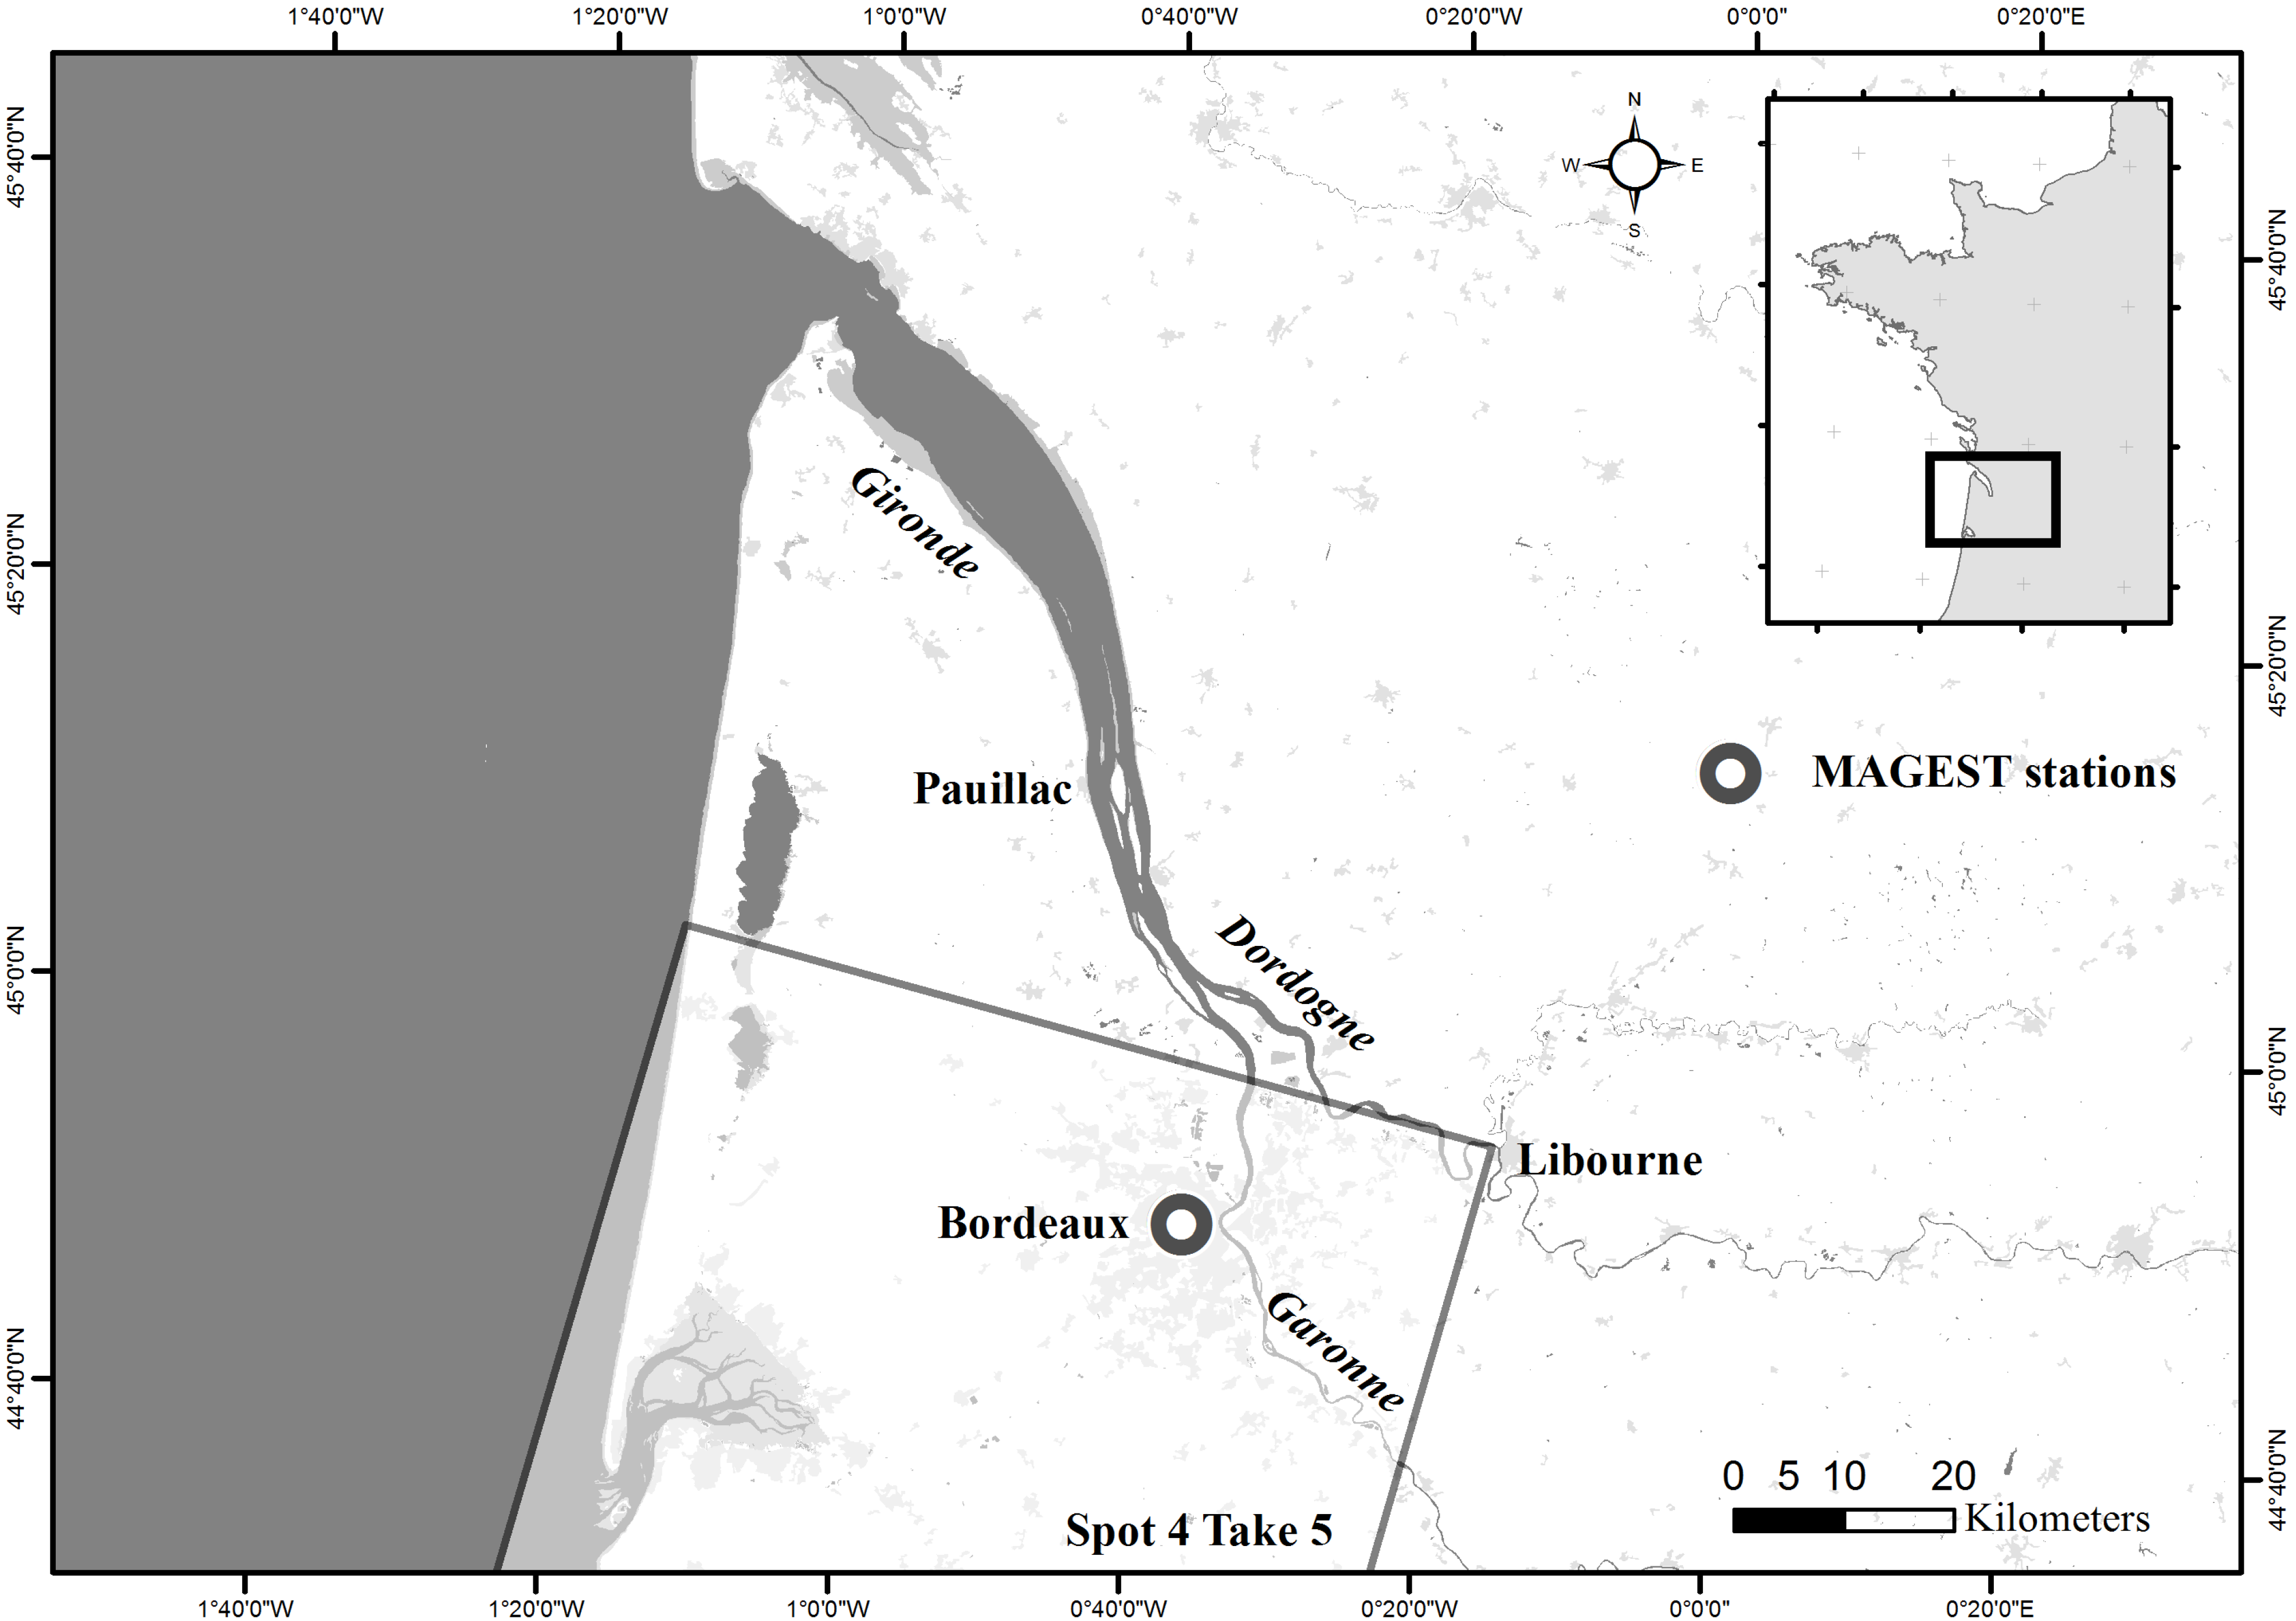
2.1.1. Gironde Estuary

The Gironde estuary, formed by the confluence of the Garonne and Dordogne rivers (Figure 1), has the largest surface area of any estuary in Europe. Its length is about 75 km, and its width ranges from 3–11 km. The Garonne and Dordogne rivers exhibit watershed areas of 57,000 km2 and 24,000 km2, respectively. The Gironde’s flow rate averages 1100 m3·s−1 [27]. The Garonne and the Dordogne respectively contribute 65% and 35% of freshwater inputs in the Gironde estuary. The freshwater discharge in the Garonne ranges from less than 100 m3·s−1 to more than 4000 m3·s−l, whereas it varies between 200 and 1500 m3·s−1 in the Dordogne [28]. The Gironde’s morphology is typical of wave and tide dominated estuaries. Due to tidal amplitude ranging from 2–5 m, the Gironde estuary is classified as macrotidal. It presents a well-developed maximum turbidity zone (MTZ). From a remote sensing point of view, the MTZ is defined here as the zone where suspended particulate matter (SPM) surface concentration exceeds 1000 g·m−3. A MTZ has been both observed in the downstream and upstream sectors of the Gironde estuary. During summer, it can move upstream in the Garonne and reside around Bordeaux, about 30 km upstream the Dordogne and Garonne convergence [29,30].
Figure 1. Map of the Gironde estuary showing SPOT4 (Take5) spatial coverage and the location of the MAGEST automated turbidity station used for match-up.
Remotesensing 07 09507 g001

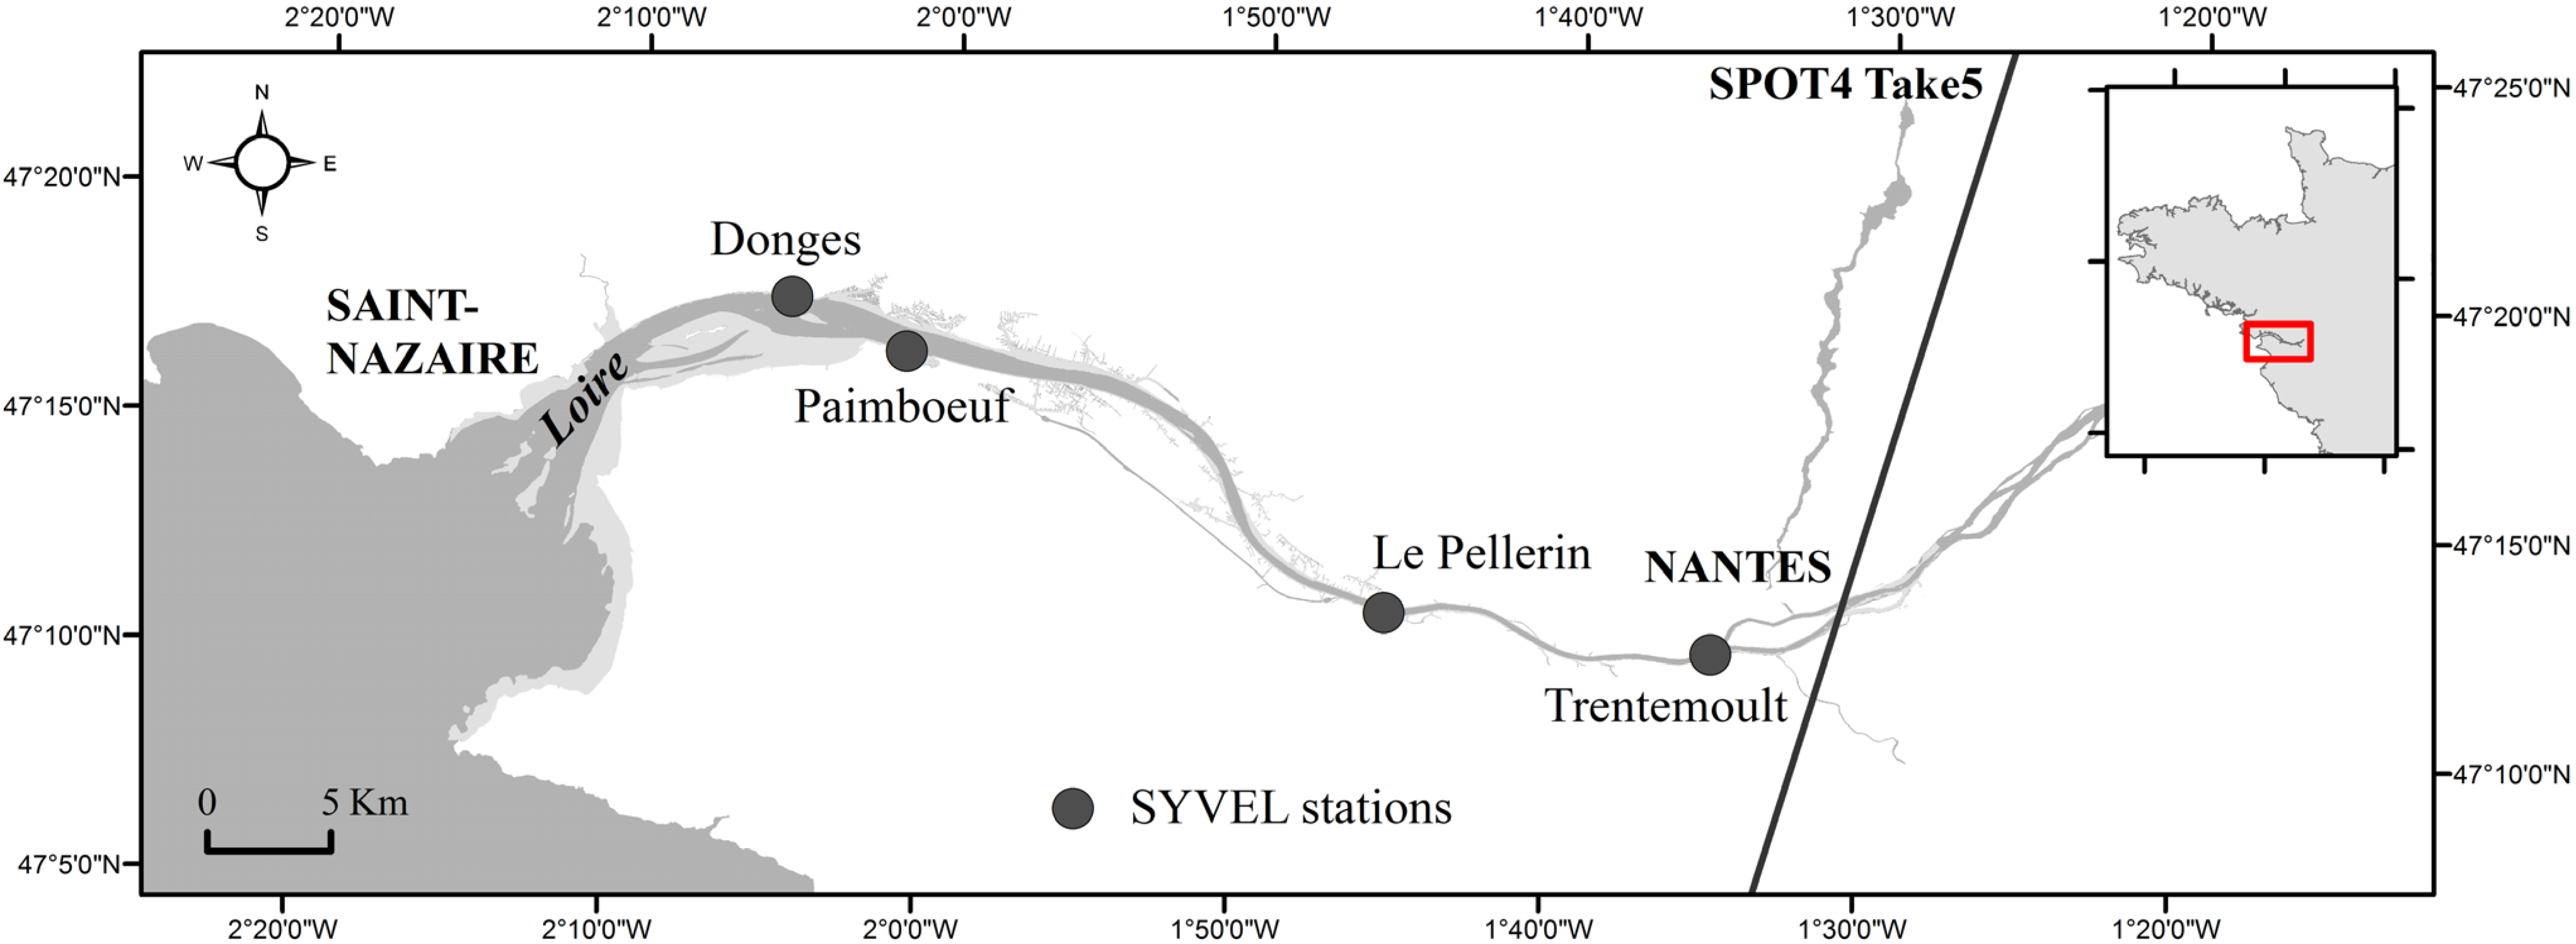
2.1.2. Loire Estuary

With a length of 1012 km and a watershed area of 117,000 km2, the Loire is the largest river in France. The Loire estuary is about 100 km long, stretching from a freshwater portion upstream of Nantes to the outer estuary downstream of Saint-Nazaire (Figure 2). The Loire’s flow rate averages 850 m3·s−1. It varies from less than 300 m3·s−l during summer droughts to more than 4000 m3·s−l during winter floods. Estuarine water residence time varies from less than one day during floods to 10 days during droughts [31]. The Loire estuary is macrotidal, with 4 m average tidal amplitude at Saint-Nazaire. The intertidal area covers more than 30 km2, most of which are mudflats colonized by benthic microalgae [32].
As in many other macrotidal estuaries, the Loire estuary is characterized by large variations in SPM concentration, which varies from about 50 g·m−3 in the moderately turbid freshwater sector to a zone of maximum turbidity where SPM surface concentration exceeds 1000 g·m−3 [9]. In the Loire estuary, the MTZ is 20–50 km long, depending on river flow and tidal current [33]. In the MTZ, SPM surface concentration typically reaches 2000 g·m−3 during spring tide, but decreases to 100 g·m−3 during neap tides, when suspended particles are temporarily trapped just above sediment bed, creating fluid mud layers where bottom SPM concentration can exceed 20 kg·m−3 [34]. The total mass of SPM transported from the river to the estuary is about one million tons every year [2].
Figure 2. Map of the Loire estuary showing SPOT4 (Take5) spatial coverage and the location of the automated turbidity stations of the SYVEL network.
Remotesensing 07 09507 g002

2.2. SPOT4 (Take5) Experiment in the Gironde and Loire Estuaries

At the end of SPOT4’s mission, before de-orbiting the satellite in June 2013, the Centre d’Etudes Spatiales de la BIOsphere (CESBIO) proposed a four-month experiment to increase the revisit time of SPOT4 to 5 days, thus potentially serving as a simulator for the Sentinel-2 mission (Table 1). The experiment, which was named SPOT4 (Take5) in reference to Paul Desmond and Dave Brubeck’s famous jazz piece (Take Five), was successfully implemented by the CNES. The worldwide remote sensing community was invited to join the experiment and to propose observation sites for which high temporal resolution was relevant to environmental monitoring or methodology development purposes.
Table 1. Sentinel-2 spectral bands and spatial resolution. Corresponding information for SPOT4 are indicated in brackets.
Band NumberCentral Wavelength (nm)Band Width (nm)Spatial Resolution (m)
14432060
24906510
3 (XS1) 560 (545)35 (90)10 (20)
4 (XS2)665 (645)30 (70)10 (20)
57051520
67401520
77832020
8 (XS3)842 (835)115 (110)10 (20)
8b8652020
99402060
1013753060
11 (XS4)1610 (1665)90 (170)20 (20)
12219018020
We proposed to study two sites centered on the Gironde and Loire estuaries. For the Gironde study, the SPOT4 (Take5) spatial coverage was restricted to the southern part of the estuary, focusing on the Garonne river (Figure 1), which is a narrow (400 m wide in Bordeaux) meandering and macrotidal river. The SPOT4 (Take5) image extent does not cover the whole estuary, and is susceptible to match the records of only one automated in situ turbidity station, as described in Section 2.3. A dataset of Landsat images covering the whole Gironde estuary was therefore used to complement SPOT4 (Take5) data. Landsat images were acquired from January 2011 to December 2013. For the Loire estuary, the SPOT4 (Take5) footprint covers the whole estuary, and a total of four automated in situ turbidity stations were available for match-up purpose (Figure 2).
SPOT4 (Take5) and Landsat data were processed and distributed by the Theia Land Data Centre, a French national inter-agency organization designed to foster the use of images issued from the space observation of land surface and nearshore coastal areas. Top-of-atmosphere radiance data were corrected from aerosol effects using the multi-sensor atmospheric correction and cloud screening (MACCS) method [35,36,37]. Level 2A data include ortho-rectified surface reflectance, along with a mask for clouds and their shadows, and a correction of adjacency effects. In situ regional algorithms developed by Doxaran et al. (2003 [26]) to retrieve SPM surface concentration from reflectance measurements in turbid waters were then applied to SPOT4 data in the Gironde (Equation (1)) and Loire (Equation (2)) estuary, and to Landsat data in the Gironde estuary (Equation (3)):
SPM concentration = exp [ ( R r s _ XS3 / R r s   _ XS1   +   0.9068 ) / 0.3056 ]
SPM concentration = exp [ ( R r s   _ XS3 / R r s _ XS1   +   0.7965 ) / 0.2887 ]
SPM concentration = exp [ ( R r s   _ LNIR / R r s   _ LG   +   0.7878 ) / 0.2577 ]
where Rrs is the remote sensing surface reflectance, XS1 and XS3 are SPOT4 spectral bands in the green (0.5–0.59 nm), and near infrared (XS3: 0.79–0.89 nm), and LG and LNIR are Landsat spectral bands corresponding to 0.53–0.59 nm, and 0.85–0.88 nm, respectively.
Doxaran et al. (2003 [26]) demonstrated that relations based on reflectance ratios between near infrared and visible spectral bands were robust to variations in sediment type and to changes in illumination conditions. The robustness of the approach was previously evaluated in the Gironde estuary using MODIS Aqua data. Based on 75 match-ups, the relative uncertainty was found to be around 20% over a range of SPM concentration from 10–2250 g·m−3 [23]. Though the algorithm has been already applied to SPOT and Landsat data in the Gironde estuary [18], a thorough validation of its performance with high resolution satellite data is still lacking in the Gironde and Loire estuaries. In the present study, a dataset of automated in situ measurements was used to assess the accuracy of satellite-derived SPM concentration in both estuaries.

2.3. Validation Dataset

2.3.1. In Situ Turbidity Measurements in the Gironde Estuary

The Marel Gironde estuary network (MAGEST), operating since 2005, is composed of four MAREL stations (Mesures Automatisées en Réseau pour l'Environnement et le Littoral) [38] located in the central and fluvial estuary. Due to the spatial coverage of the SPOT4 (Take5) experiment in the Gironde estuary, only one MAGEST station was used in the present study. It is located in the fluvial section of the Gironde to the north of the city of Bordeaux (Figure 1). The water was sampled at less than 1 m below surface, and pumped to the sensors. Turbidity measurements, given in Nephelometric Turbidity Unit (NTU), were automatically performed using commercial sensors (Turbimax CUS31, Endress & Hauser, Reinach, Switzerland) covering the range 0–9999 NTU range. Data were quality-controlled and validated following a protocol adapted to the estuarine environment [6], including a regular calibration of the turbidity sensors. Turbidity measurements were used to estimate SPM concentration using a regional empirical relationships derived from laboratory calibration. The most recent turbidity vs. SPM concentration relationship [23], which was obtained for a range of SPM concentration up to 2000 g·m−3, was used for this study (Equation (4)):
SPM concentration =  0.9946   NTU ;   R 2   =   0.97 ;   n   =   65
A recent analysis of the 2005–2013 turbidity time series in the fluvial section showed seasonal variations from <100 NTU during droughts to >9000 NTU during floods [39]. These changes can be related to MTZ migration from the Gironde estuary to the Garonne River [40]. In addition to the impact of freshwater discharge on the MTZ location, surface turbidity varies during the tidal cycle: first, turbidity shows typical patterns of erosion-deposition cycle observed in macrotidal estuaries [41,42,43], and second, two distinct SPM peaks are observed during the semi-diurnal tidal cycle at mid-flood and mid-ebb due to resuspension by tidal currents [6].

2.3.2. In Situ Turbidity Measurements in the Loire Estuary

Along the Loire estuary, continuous turbidity measurements have been performed since 2007 in the frame of the SYVEL (Système de veille dans l’estuaire de la Loire) monitoring network operated by the GIPLE (Groupement d’Intérêt Public Loire Estuaire, Nantes, France) using MAREL stations (Figure 2). Sensors are housed inside an instrumented chamber fixed on a pier. As in the Gironde estuary, the Loire water was sampled at less than 1 m below surface, pumped to the sensors, and turbidity measurement was automatically performed every 30 min using a Turbimax CUS31 sensor (Endress & Hauser, Reinach, Switzerland) covering the range 0–9999 NTU range. Turbidity data were calibrated in SPM concentration using a regional relationship [44].

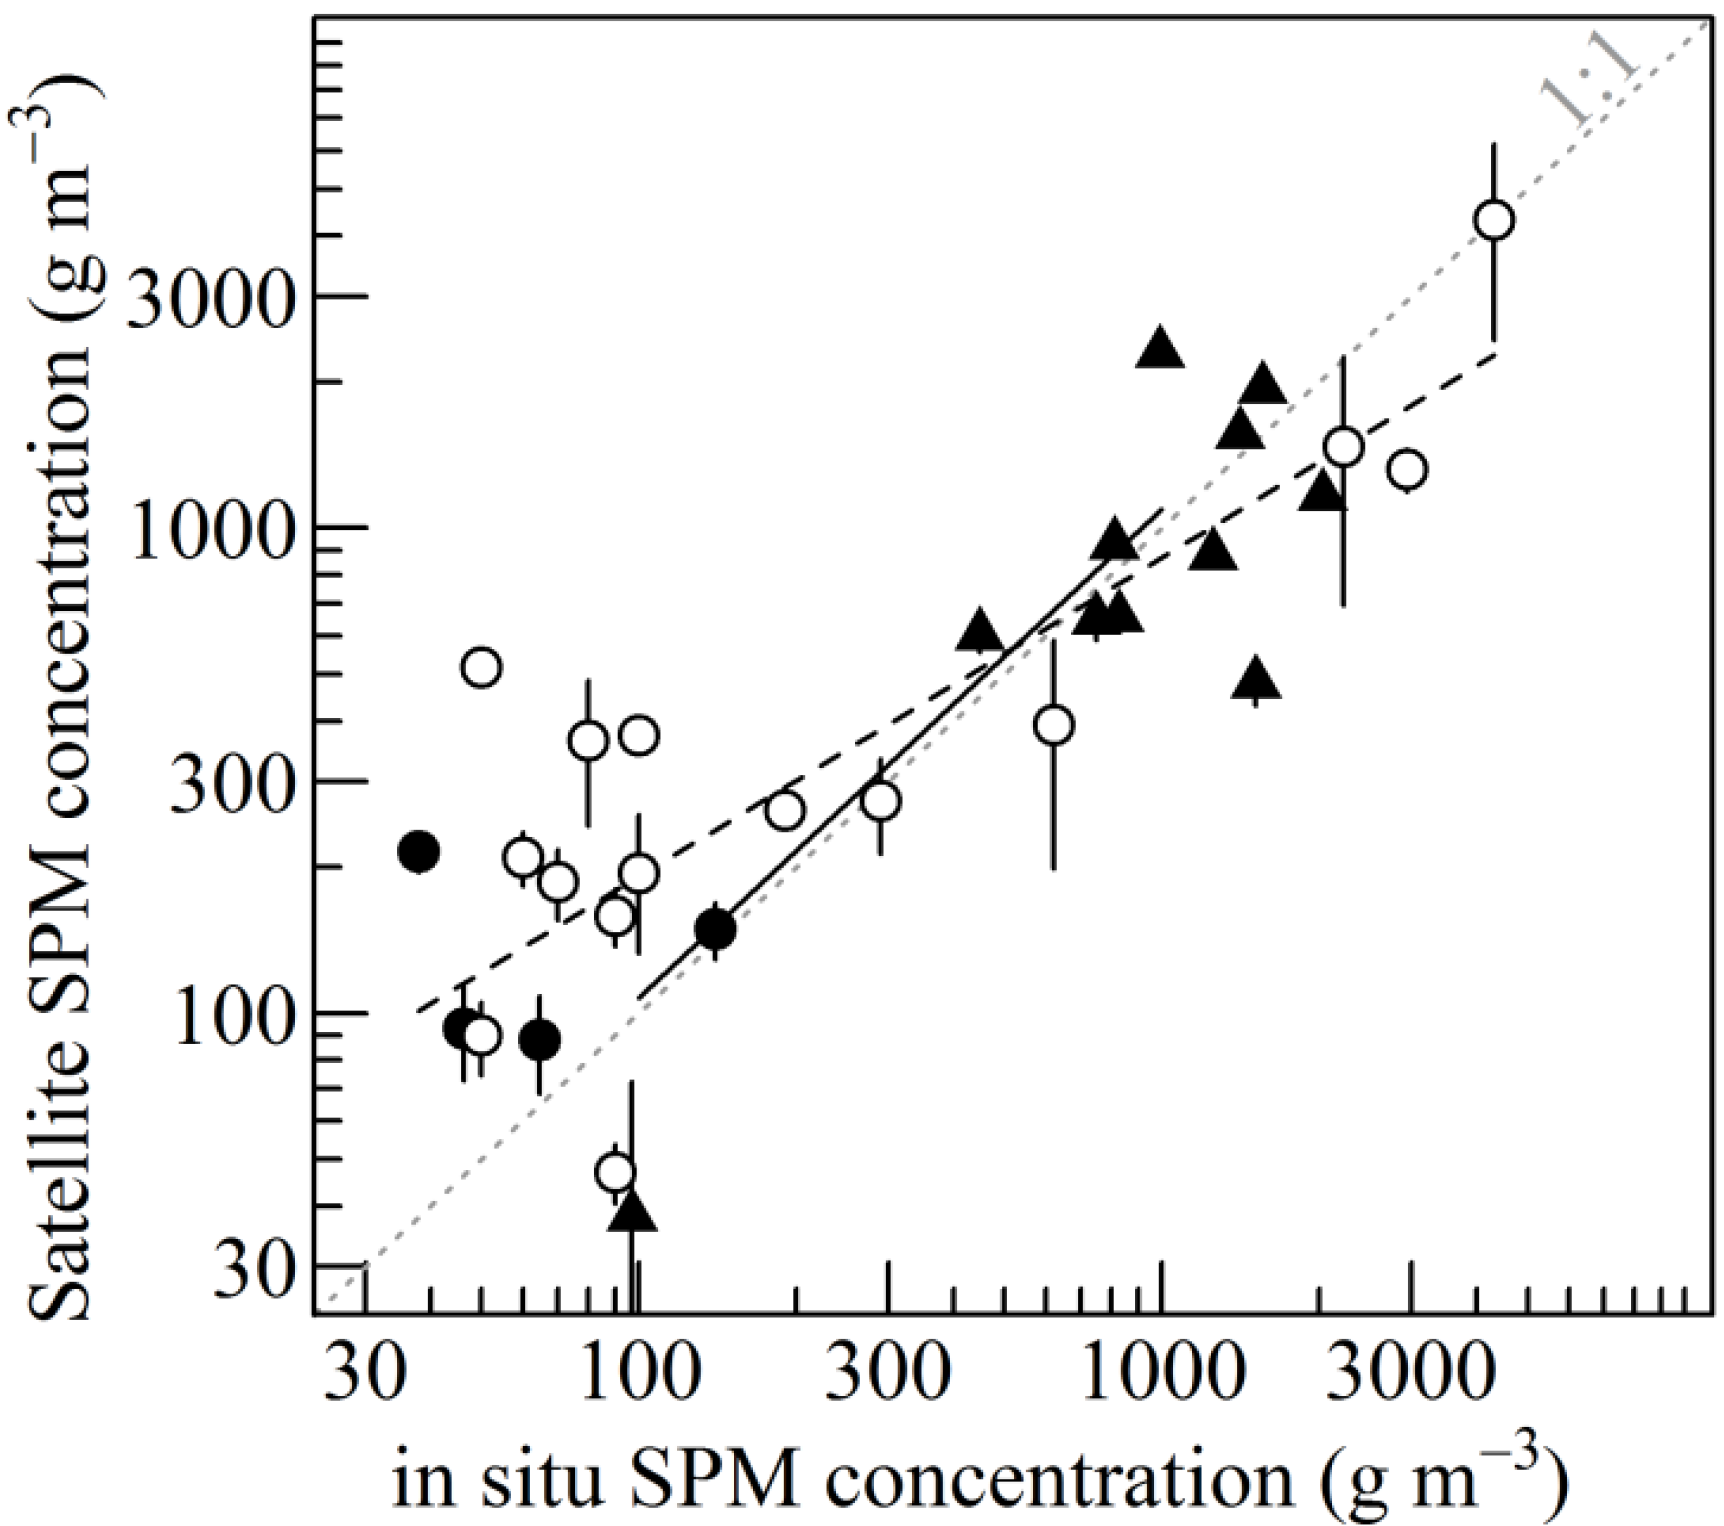
2.3.3. Evaluation of SPM Algorithm Performance

High-frequency in situ SPM time series from the MAGEST and SYVEL were used for match-ups with satellite-derived SPM concentration in the Gironde and Loire estuaries. For this exercise, in situ data were interpolated to the exact time of image acquisition in order to prevent from uncertainties associated with small scale temporal variation. For both study sites, match-ups were performed using four pixels, including the pixel nearest to the station’s location and a longitudinal line of three pixels located 30 m away from the riverbank, in order to limit potential adjacency effects. The accuracy of satellite-derived concentration was evaluated using standard metrics, including the relative root mean square error (RRMSE) and the mean normalized bias (MNB) [45]. All statistics were computed using R [46].

3. Results

3.1. Satellite Data Summary

During the SPOT4 (Take5) experiment, satellite acquisitions were successfully performed every 5 days from February to early June 2013 in the Gironde and Loire estuaries. Due to poor weather conditions however, only a limited number of (partially) cloud free data was available. A total of nine SPOT4 images were selected within the four months of the Take5 experiment (Table 2 and Table 3).
Selected images were acquired over a wide range of hydrological conditions. River flow varied from 581 to 1650 m3·s−1 in the Gironde estuary, and from 1400–3200 m3·s−1 in the Loire estuary. A total of 11 Landsat images acquired in 2011 and 2013 were selected and added to the Gironde satellite dataset. The addition of Landsat imagery in 2011 made it possible to extend the lower limit of hydrological conditions experienced during satellite overpasses, with river flow smaller than 100 m3·s1 on several occasions. In the Gironde estuary, the addition of SPOT4 (Take5) and Landsat8 data in 2013 made it possible to study SPM concentration changes on a monthly basis from February to October 2013. For the selected satellite imagery, average tidal range respectively varied between 3.30 and 5.15 m in the Gironde estuary, and between 2.24 and 5.55 m in the Loire estuary. In the Loire estuary, SPOT4 images were acquired during both neap and spring tides, whereas Gironde’s SPOT4 and Landsat cloud free images were mostly acquired during neap tides, thus probably leading to an underestimated picture of SPM concentration in the fluvial section of the estuary. The high river flows observed during the SPOT4 (Take5) experiment further contributed to flush SPM seaward and decrease SPM surface concentration in the Garonne section of the Gironde estuary.
Table 2. List of selected satellite data for the Gironde estuary. Water height and tidal range provided by the SHOM at Bordeaux. River flow data measured at Tonneins, 100 km upstream of Bordeaux.
DateSensorAcquisition Time (UT)Low Tide (UT)Tidal Range (m)Water Height (m)River Flow (m3·s−1)
10 January 2011Landsat510:4004:564.454.42317
7 March 2011Landsat710:4115:345.152.89471
8 April 2011Landsat710:4216:274.603.59482
2 May 2011Landsat510:4013:344.751.54253
5 July 2011Landsat510:4016:535.103.8297
23 September 2011Landsat510:4009:253.601.79116
1 October 2011Landsat710:4116:403.353.7699
18 November 2011Landsat710:4205:454.004.46294
20 February 2013SPOT410:1809:023.301.691120
7 March 2013SPOT410:1709:284.000.88581
21 April 2013SPOT410:1309:593.950.43978
5 June 2013SPOT410:0911:344.250.801650
10 July 2013Landsat810:5015:134.752.42393
11 August 2013Landsat810:4916:354.903.48291
30 October 2013Landsat810:4910:063.801.10178
Table 3. List of selected SPOT4 (Take5) data for the Loire estuary. Water height and tidal range provided by the SHOM for the main harbour in the Loire estuary (Saint-Nazaire). River flow data measured at Montjean-sur-Loire, 60 km upstream of Nantes.
DateAcquisition Time (UT)Low Tide (UT)Tidal Range (m)Water Height (m)River Flow (m3·s−1)
6 February 201309:5805:493.054.093200
21 February 201309:5706:552.243.552080
28 March 201309:5410:385.550.831400
17 April 201309:5314:222.254.142410
27 May 201309:4911:235.371.612400

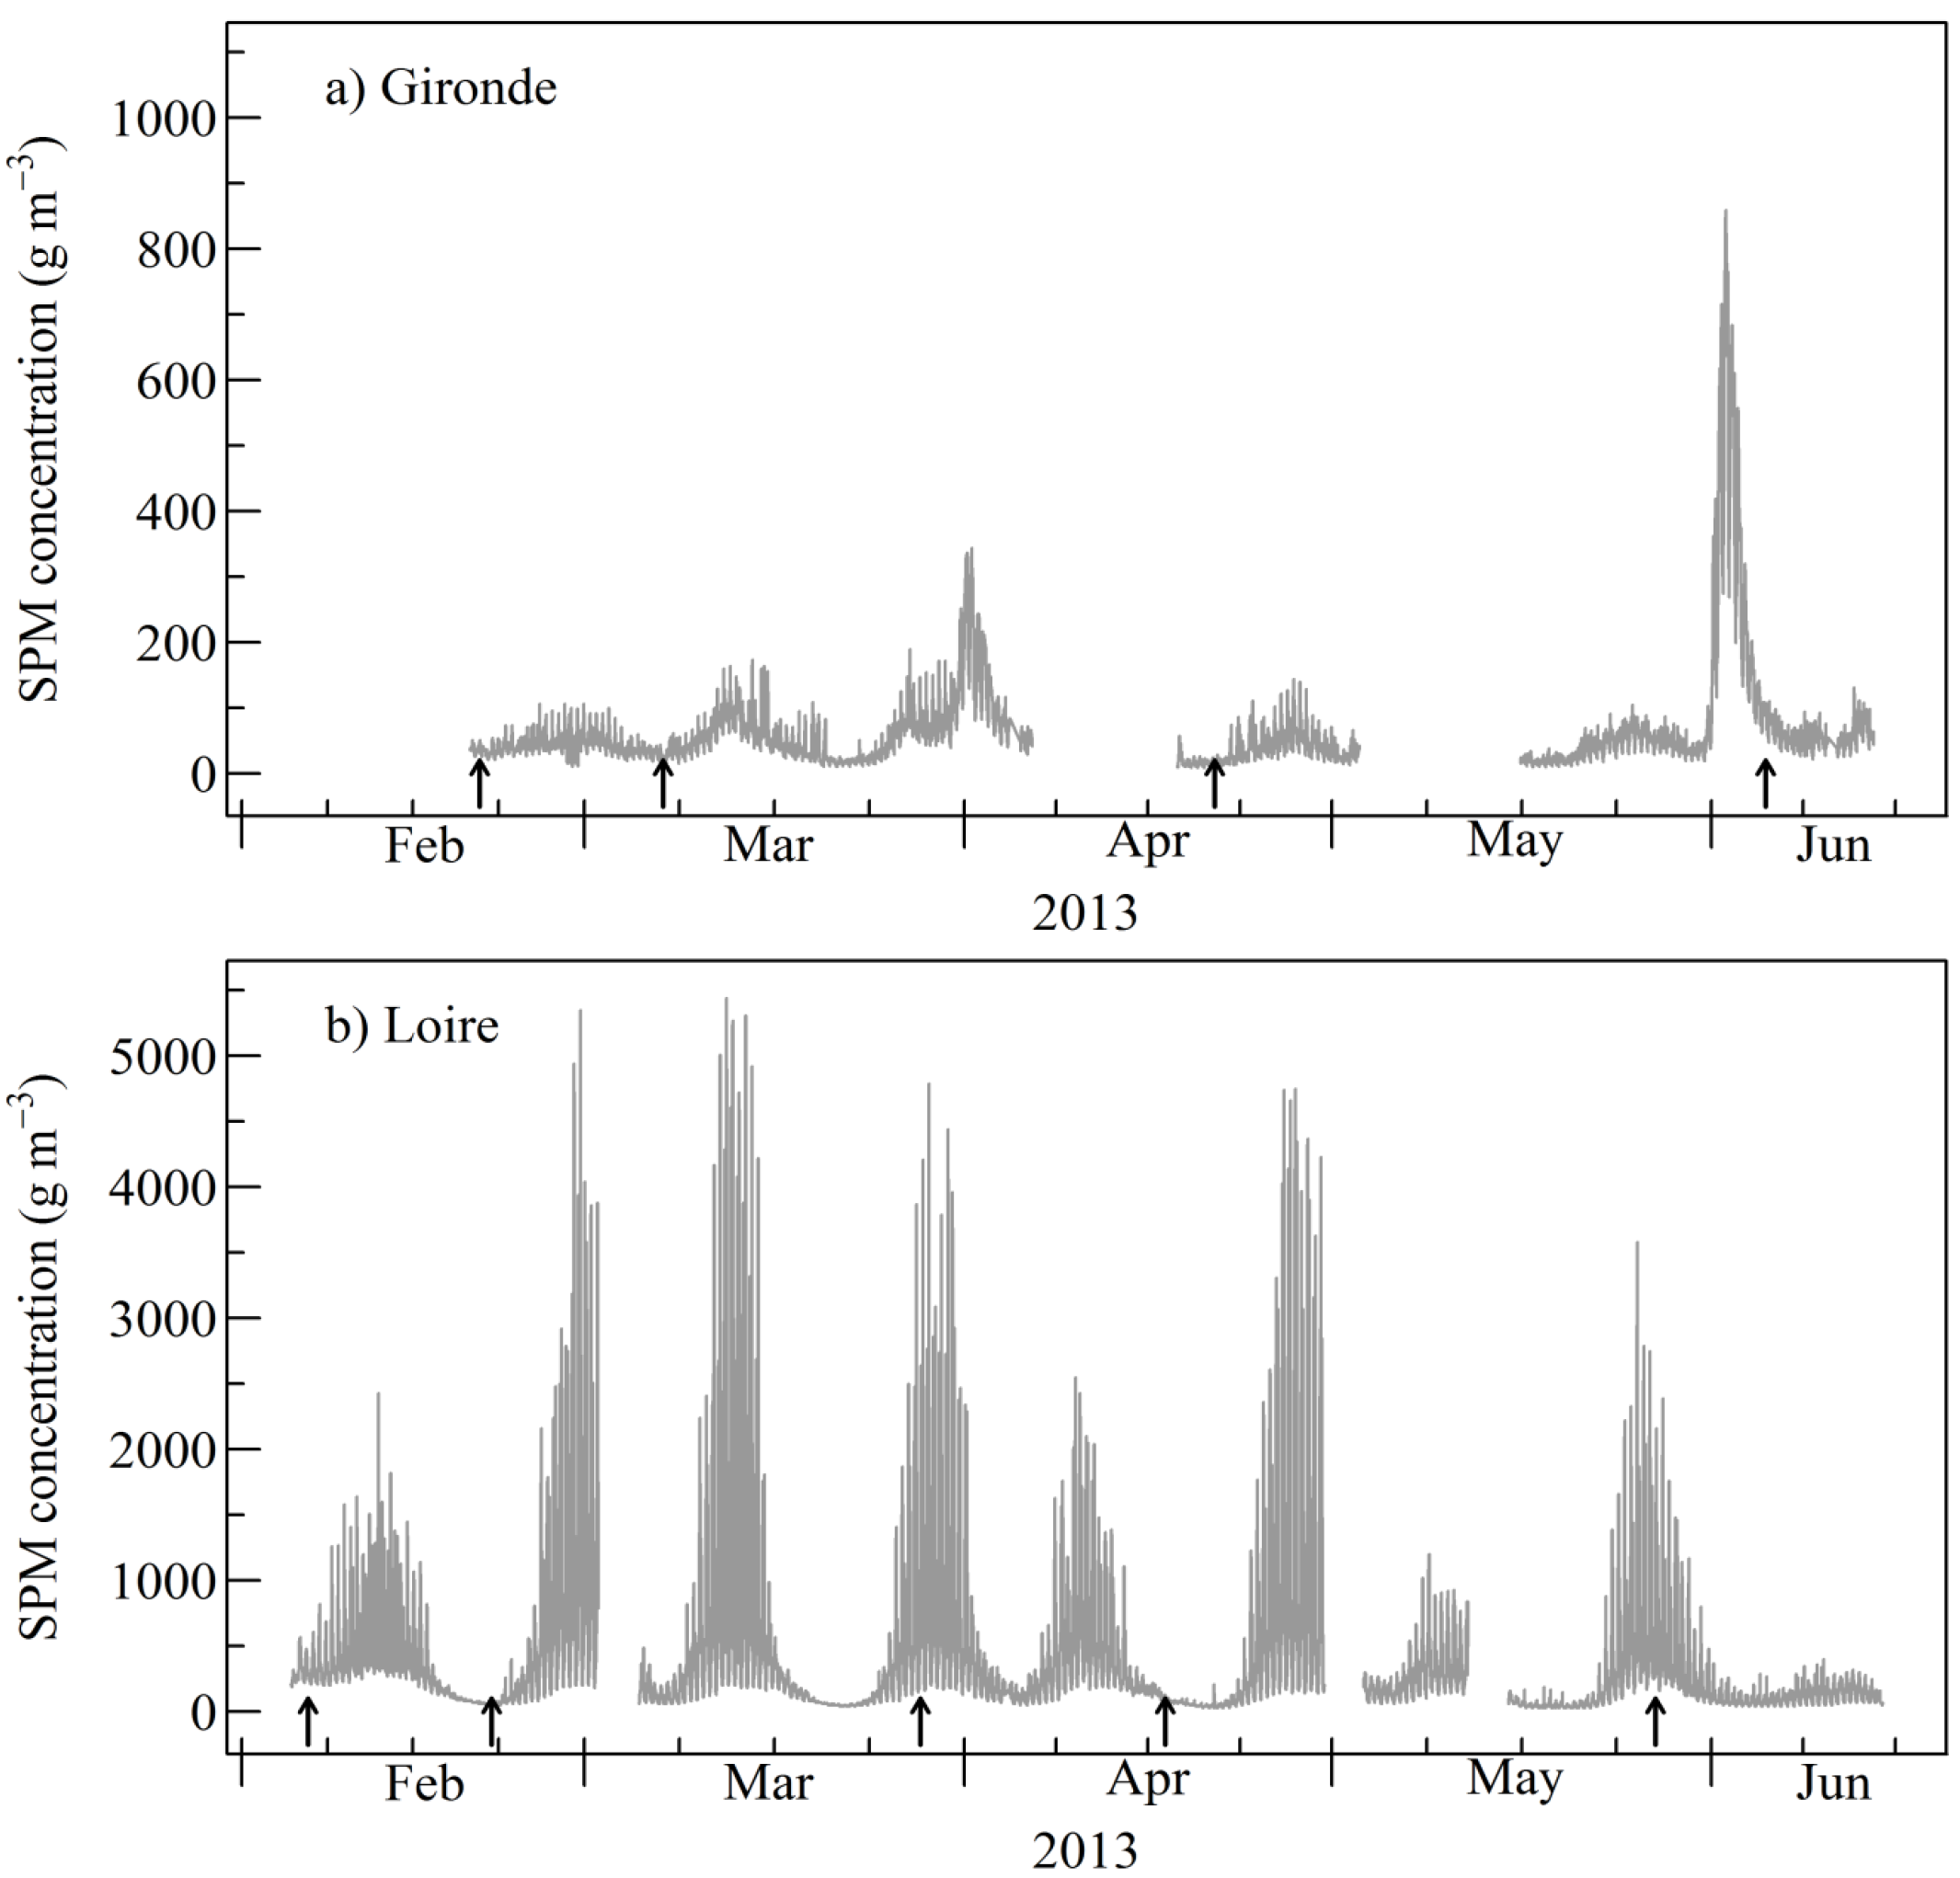
3.2. Range of SPM Concentration during SPOT4 (Take5) Experiment

The Gironde and Loire automated turbidity sensors recorded a very wide range of SPM surface concentration during the SPOT4 (Take5) experiment, from 8.95 to 5440 g·m−3 (Figure 3). At Bordeaux, minimum SPM concentration was observed in the Gironde estuary on 19 April 2013. At this station, SPM concentrations did not exceed 859.3 g·m−3 (Figure 3a). The range of concentration recorded that year was relatively low in comparison with interannual averages [6]. This is probably caused by the downstream shift of the MTZ resulting from fresh water discharges associated with important precipitations that occurred at the beginning of the year. Winter and spring 2013 were indeed very rainy, and it is likely that important land runoff and river flow contribute to an overall decrease of SPM concentration in the Garonne section of the Gironde estuary. Moreover, the location of the Bordeaux station did not allow recording the upstream intrusion of turbid waters during spring tides.
Figure 3. (a) Suspended particulate matter (SPM) concentration measured using automated turbidity station in the Gironde estuary at Bordeaux; (b) SPM concentration measured using automated turbidity station in the Loire estuary at Donges. Vertical arrows show the dates of partially cloud free SPOT4 (Take5) images listed in Table 2 and Table 3.
Remotesensing 07 09507 g003
SPM surface concentration was approximately five times higher in the Loire estuary than in the Garonne estuary. Automated SPM time series at Donges consistently displayed a high degree of variation (Figure 3b). SPM concentration exceeded 5000 g·m−3 several times in winter 2013. Maximum SPM concentration (5.4 kg·m−3) was recorded on 12 March 2013 during spring tide (tidal range >6 m). The influence of tidal dynamics on turbidity time-series was clearly visible. The lunar neap-spring cycle significantly imprinted SPM variations with a regular fluctuation of about 15 days, and maximum turbid events always occurred during spring tides. At shorter time-scales, the quarter-diurnal cycle lead to dramatic changes in SPM concentration in terms of amplitude (>5000 g·m−3) and duration (<3 h), resulting from water height changes as well as from the alternation of sedimentation and resuspension processes caused by tidal dynamics.

3.3. SPM Match-Ups in the Gironde and Loire Estuaries

A total number of 30 data points was available for SPM match-up purpose (Figure 4). In the Gironde estuary, the Bordeaux turbidity station provided 15 match-ups. In the Loire estuary, though only five images were selected, a total of 15 pairs of concomitant in situ and satellite measurements were extracted at four in situ turbidity stations. The match-up dataset covered a very wide range of SPM concentration, from 37.9–4320 g·m−3. The RRMSE and MNB were 220.0% and 89.3%, respectively. There was a significant linear relationship between in situ and satellite-derived SPM concentration (r-squared regression coefficient is 0.75, p-value < 10−9), with a slope of 0.66. The accuracy of satellite SPM concentration retrieval was better in the 100–1000 g m−3 interval, with a RRMSE and a MNB of respectively 49.5% and 16.3%, and a slope very close to 1 (Figure 4, solid line).
Figure 4. Suspended particulate matter (SPM) concentration match-up between in situ measurements and satellite data, respectively obtained using SPOT4 (black circles) and Landsat (black triangles) in the Gironde estuary, and SPOT4 (white circles) in the Loire estuary. Vertical lines show the standard deviation of the four pixels selected for match-up. The dashed line shows the linear fit from 37.9–4320 g·m−3, whereas the solid line shows the linear fit between 100 and 1000 g·m−3.
Remotesensing 07 09507 g004

3.4. SPM Spatial Distribution in the Gironde and Loire Estuary

A focus on a few SPOT4 and Landsat8 images spanning different hydrological and tidal regimes allowed us to better appraises the performance of the SPM algorithm for both satellite sensors. Examples of satellite-derived SPM surface concentration maps are displayed in Figure 5 and Figure 6 for the Gironde and Loire estuaries, respectively.
Figure 5. (a) SPOT4 suspended particulate matter (SPM) concentration in the Gironde estuary on 20 February 2013; (b) SPOT4 SPM concentration on 5 June 2013; (c) Landsat8 SPM concentration on 10 July 2013; (d) Landsat8 SPM concentration on 30 October 2013. The crosses show the location of the transect pixels used in Figure 7.
Remotesensing 07 09507 g005
Figure 6. (a) SPOT4 suspended particulate matter (SPM) concentration in the Loire estuary during neap tide on 21 February 2013; (b) SPOT4 SPM concentration during neap tide on 28 March 2013. The crosses show the location of transect pixels used in Figure 8.
Remotesensing 07 09507 g006aRemotesensing 07 09507 g006b

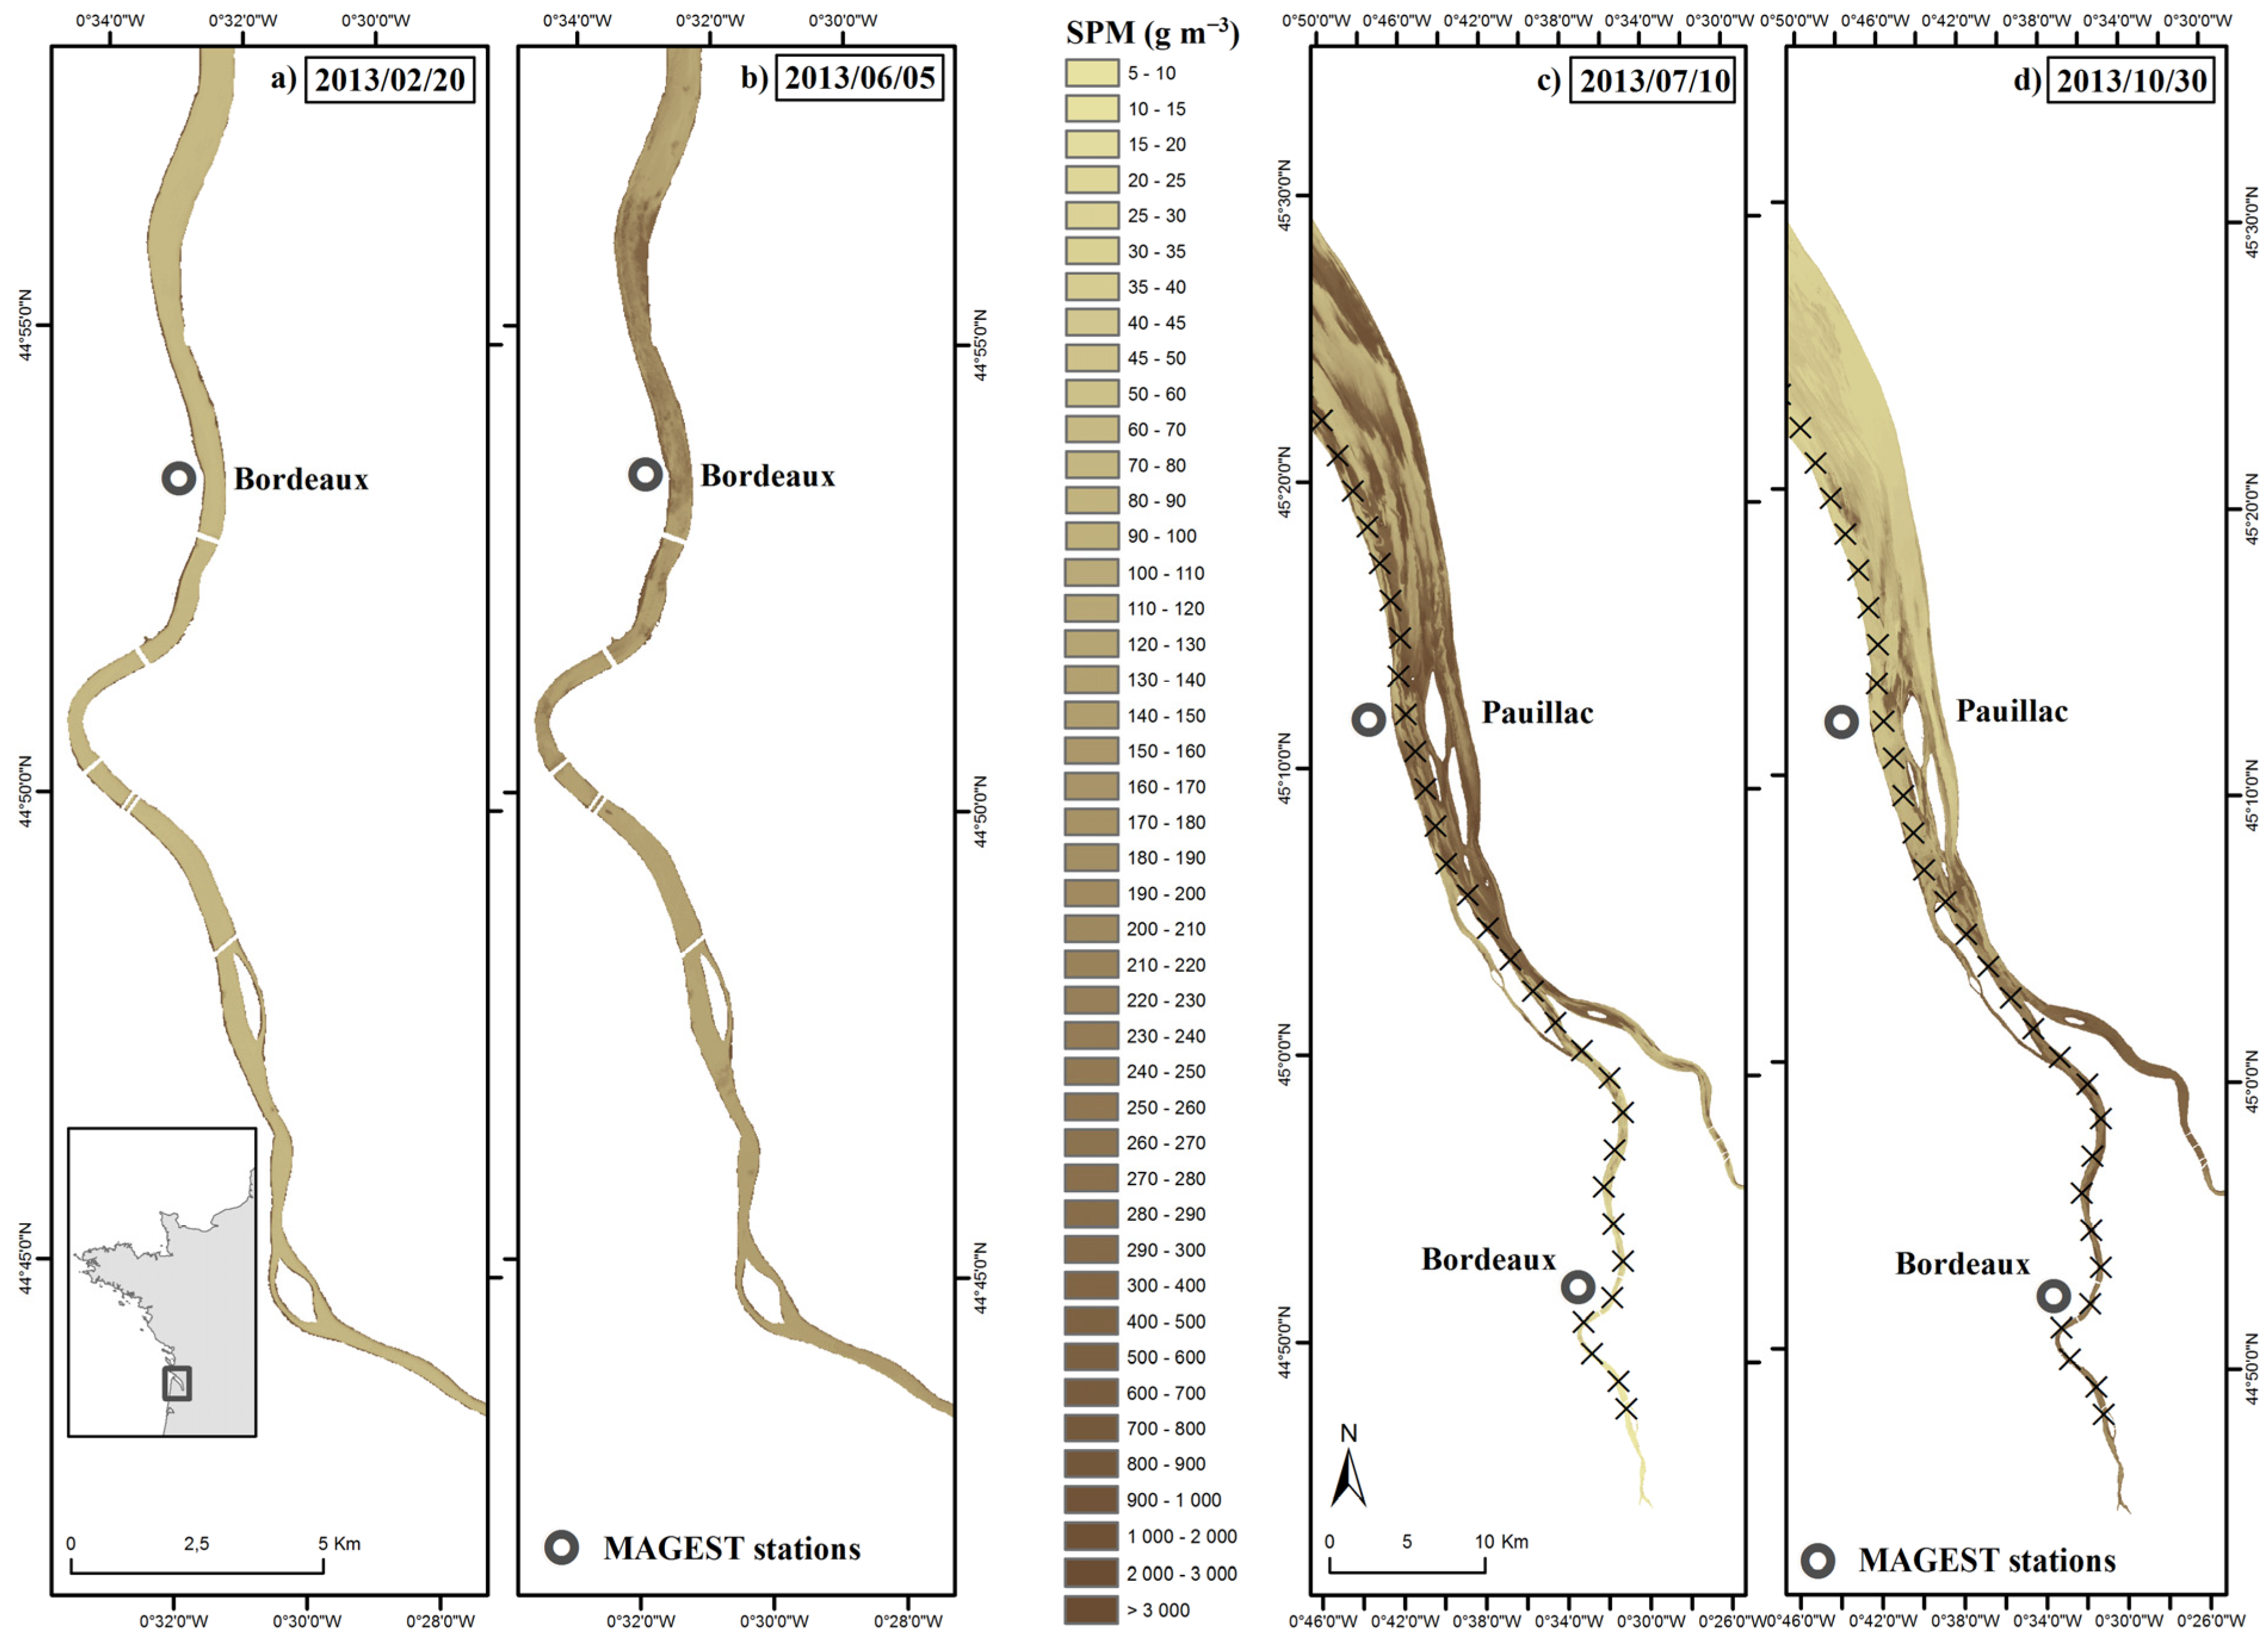
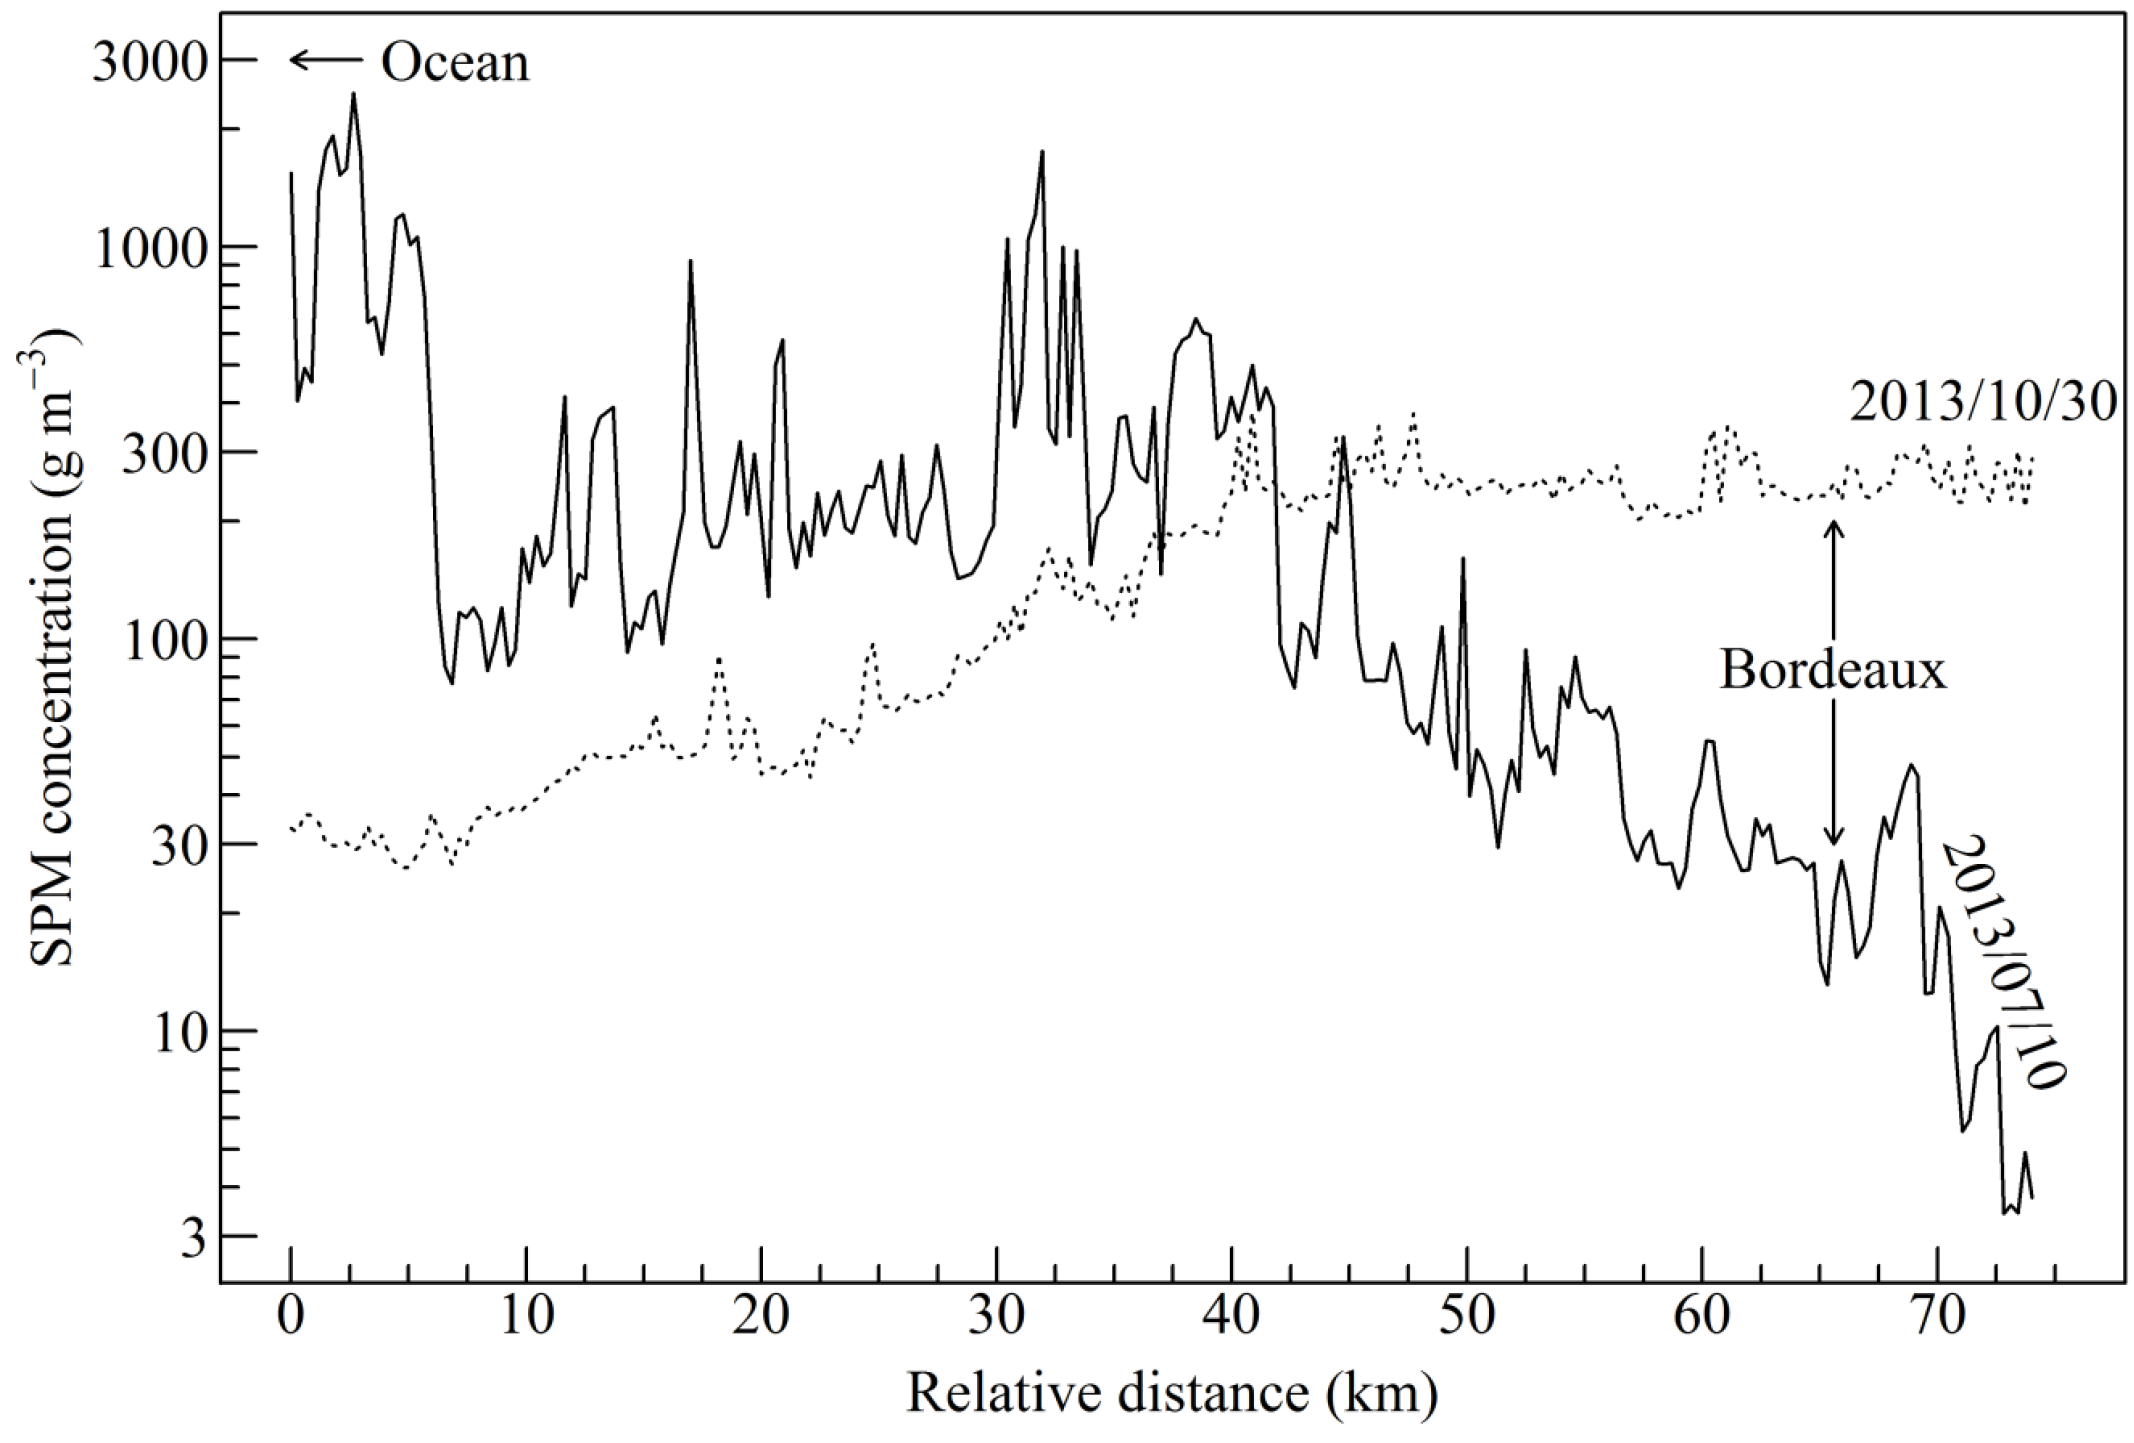
3.4.1. SPM Concentration Maps in the Gironde Estuary

Around Bordeaux, in the Garonne section of the Gironde estuary, SPOT4 (Take5) data generally displayed low SPM concentrations in February 2013 (Figure 5a). Due to strong precipitation in winter and spring, enhanced land runoff increased water height and vertically diluted SPM concentrations in the estuary’s fluvial section. The SPOT4 (Take5) time series of SPM concentration did not exhibit strong spatio-temporal variations, and turbidity levels were quite similar from February to May 2013. In June, a patch of turbid water was observed to the north of Bordeaux (Figure 5b), with SPM surface concentration 5 to 30 times higher than in February. This increase in SPM concentration can probably be explained by bed sediment resuspension resulting from spring tide currents and increase in river flow.
The spatial frame of the SPOT4 (Take5) images in the Gironde estuary did not allow us to observe SPM spatial distribution outside the Garonne section. The addition of Landsat data made it possible to observe the rest of the Gironde estuary, from the Garonne and Dordogne confluence to the Gironde’s mouth (Figure 5c,d). In the July 2013 example, the Landsat8 image confirmed the confinement of the relatively clear waters within the upstream sections of the estuary, whereas the most turbid waters stretched from the Garonne and Dordogne confluence down to the sea (Figure 5c). In October 2013, the situation was reversed: maximum SPM concentration was found in the fluvial section, whilst surface waters were generally less turbid downstream Pauillac (Figure 5d). Longitudinal SPM transects displayed reversed gradients on 10 July and 30 October (Figure 7). In addition to the overall longitudinal changes, SPM surface concentration showed variations associated with varying sedimentary patterns. For example, in the central section of the estuary, the July 2013 example exhibited low-high turbidity strips parallel to the orientation of surface currents, whereas these patterns were far less pronounced in October 2013. In July, the strips of high turbidity were presumably linked to increased resuspension over shallow mud flats. Tidal conditions were different on 10 July (mid-ebb during spring tide) and 30 October (low tide during neap tide), thus leading to distinct tidal currents’ strength and associated resuspension processes [6]. The July image may also illustrate the impact of spring tides on mud bank erosion. More data are necessary to better appreciate the respective role of tidal processes on sediment dynamics at the scale of the estuary.
Figure 7. Landsat8-derived longitudinal transect of suspended particulate matter (SPM) surface concentration in the Gironde estuary on 10 July 2013 (solid line) and 30 October 2013 (dotted line).
Remotesensing 07 09507 g007

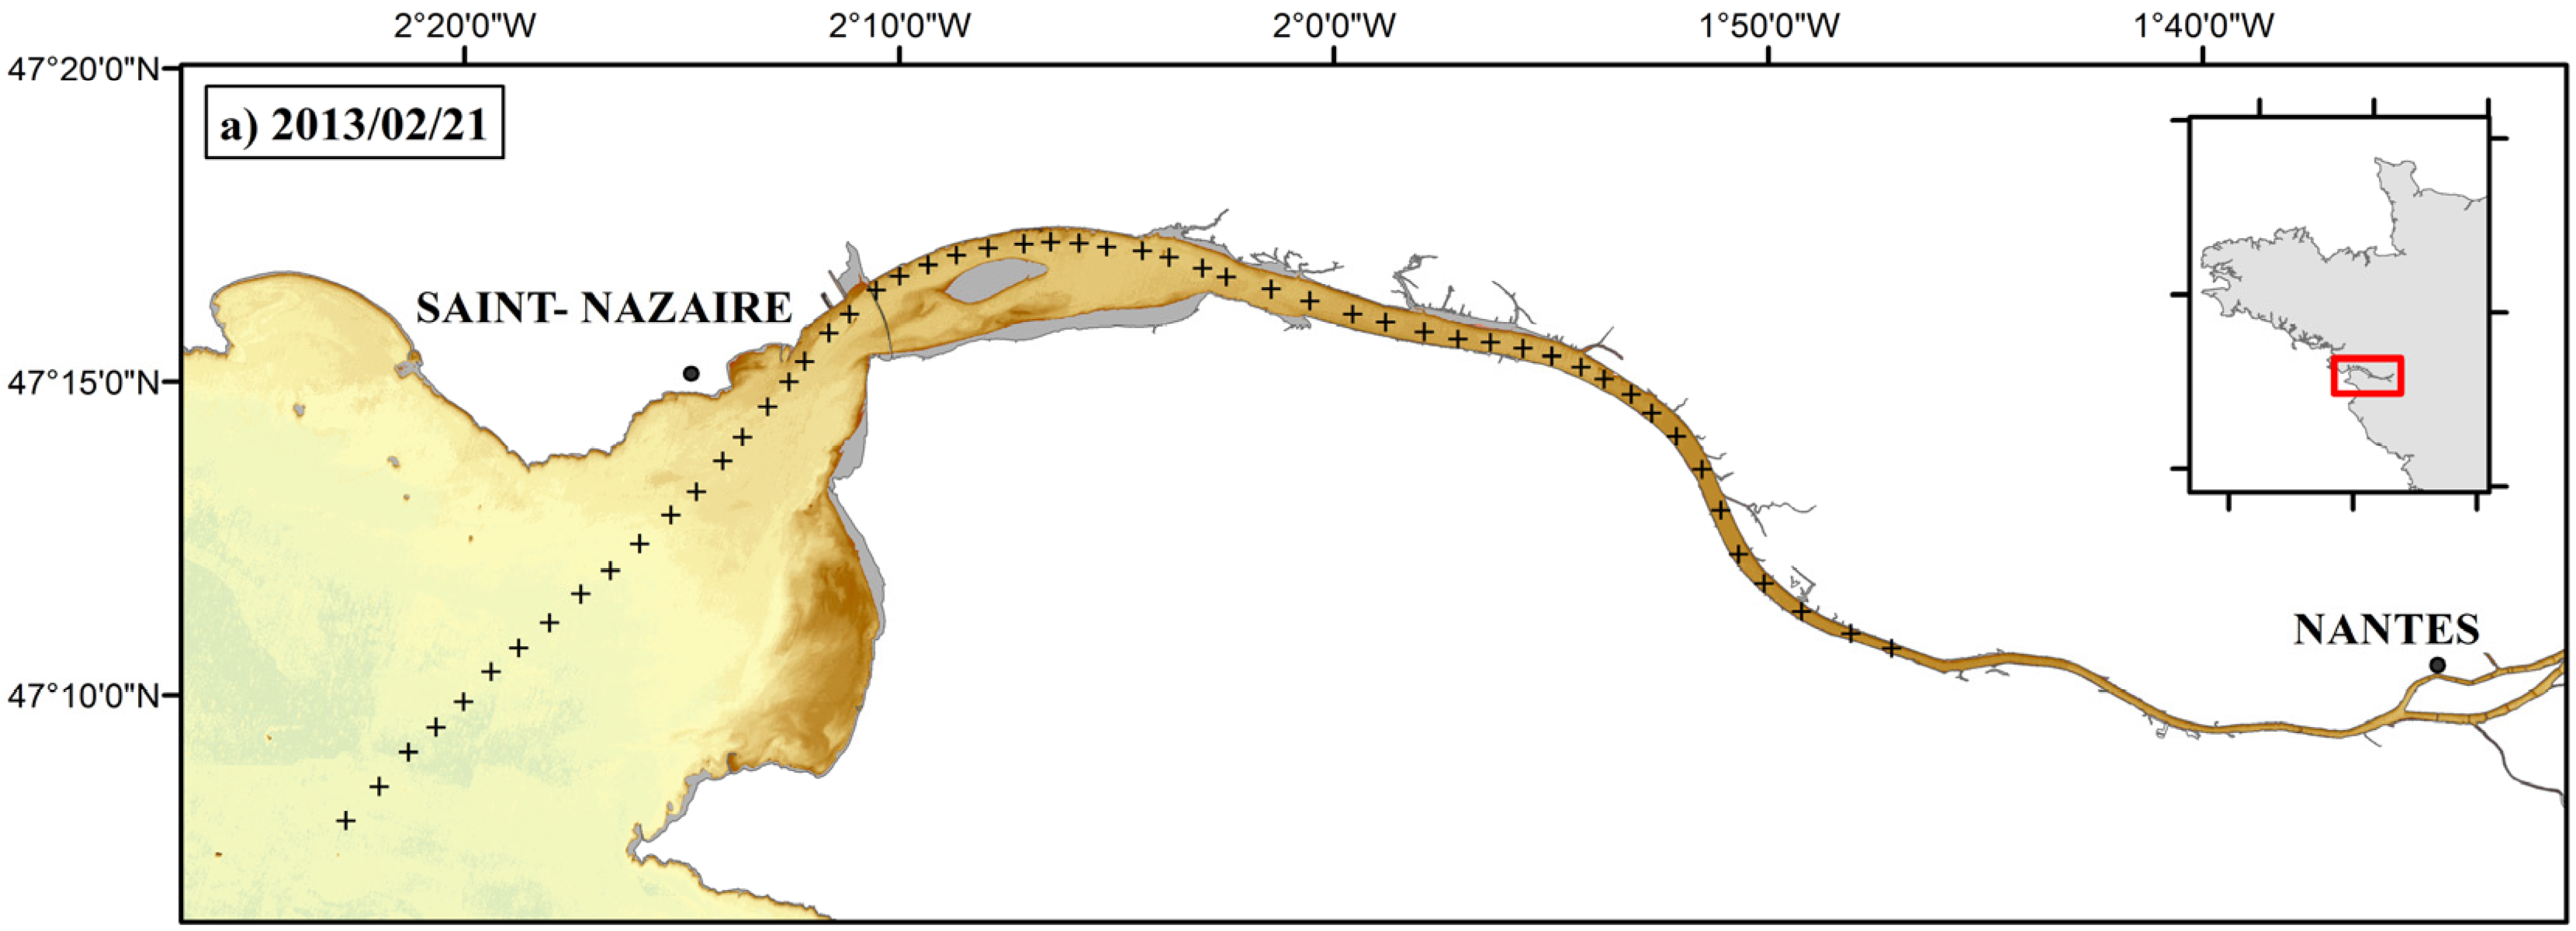
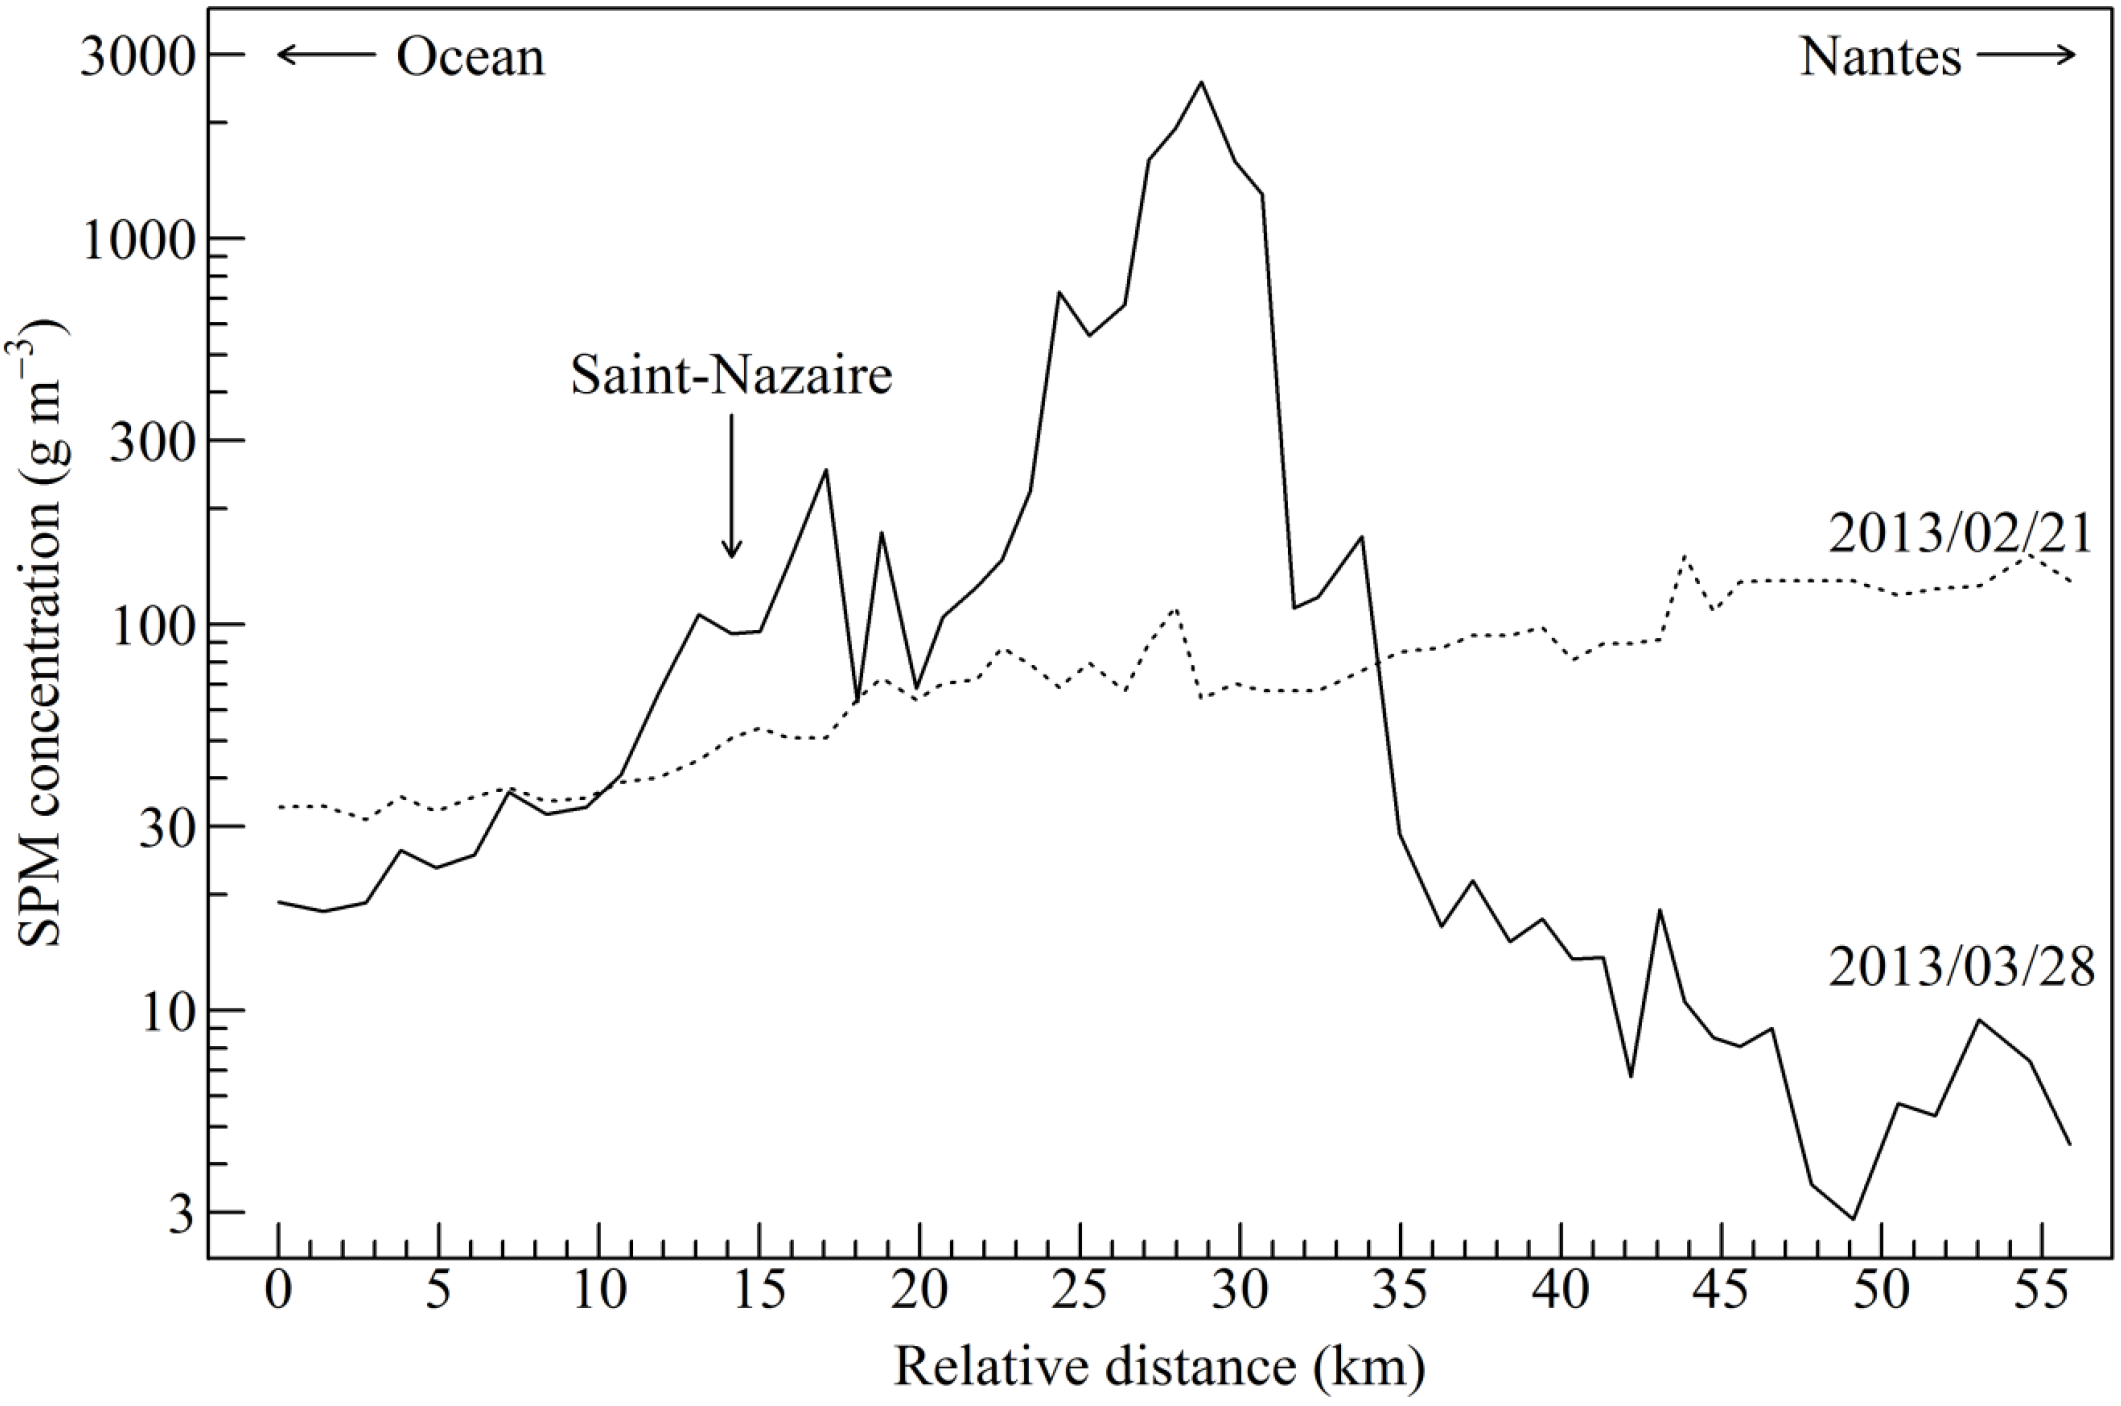
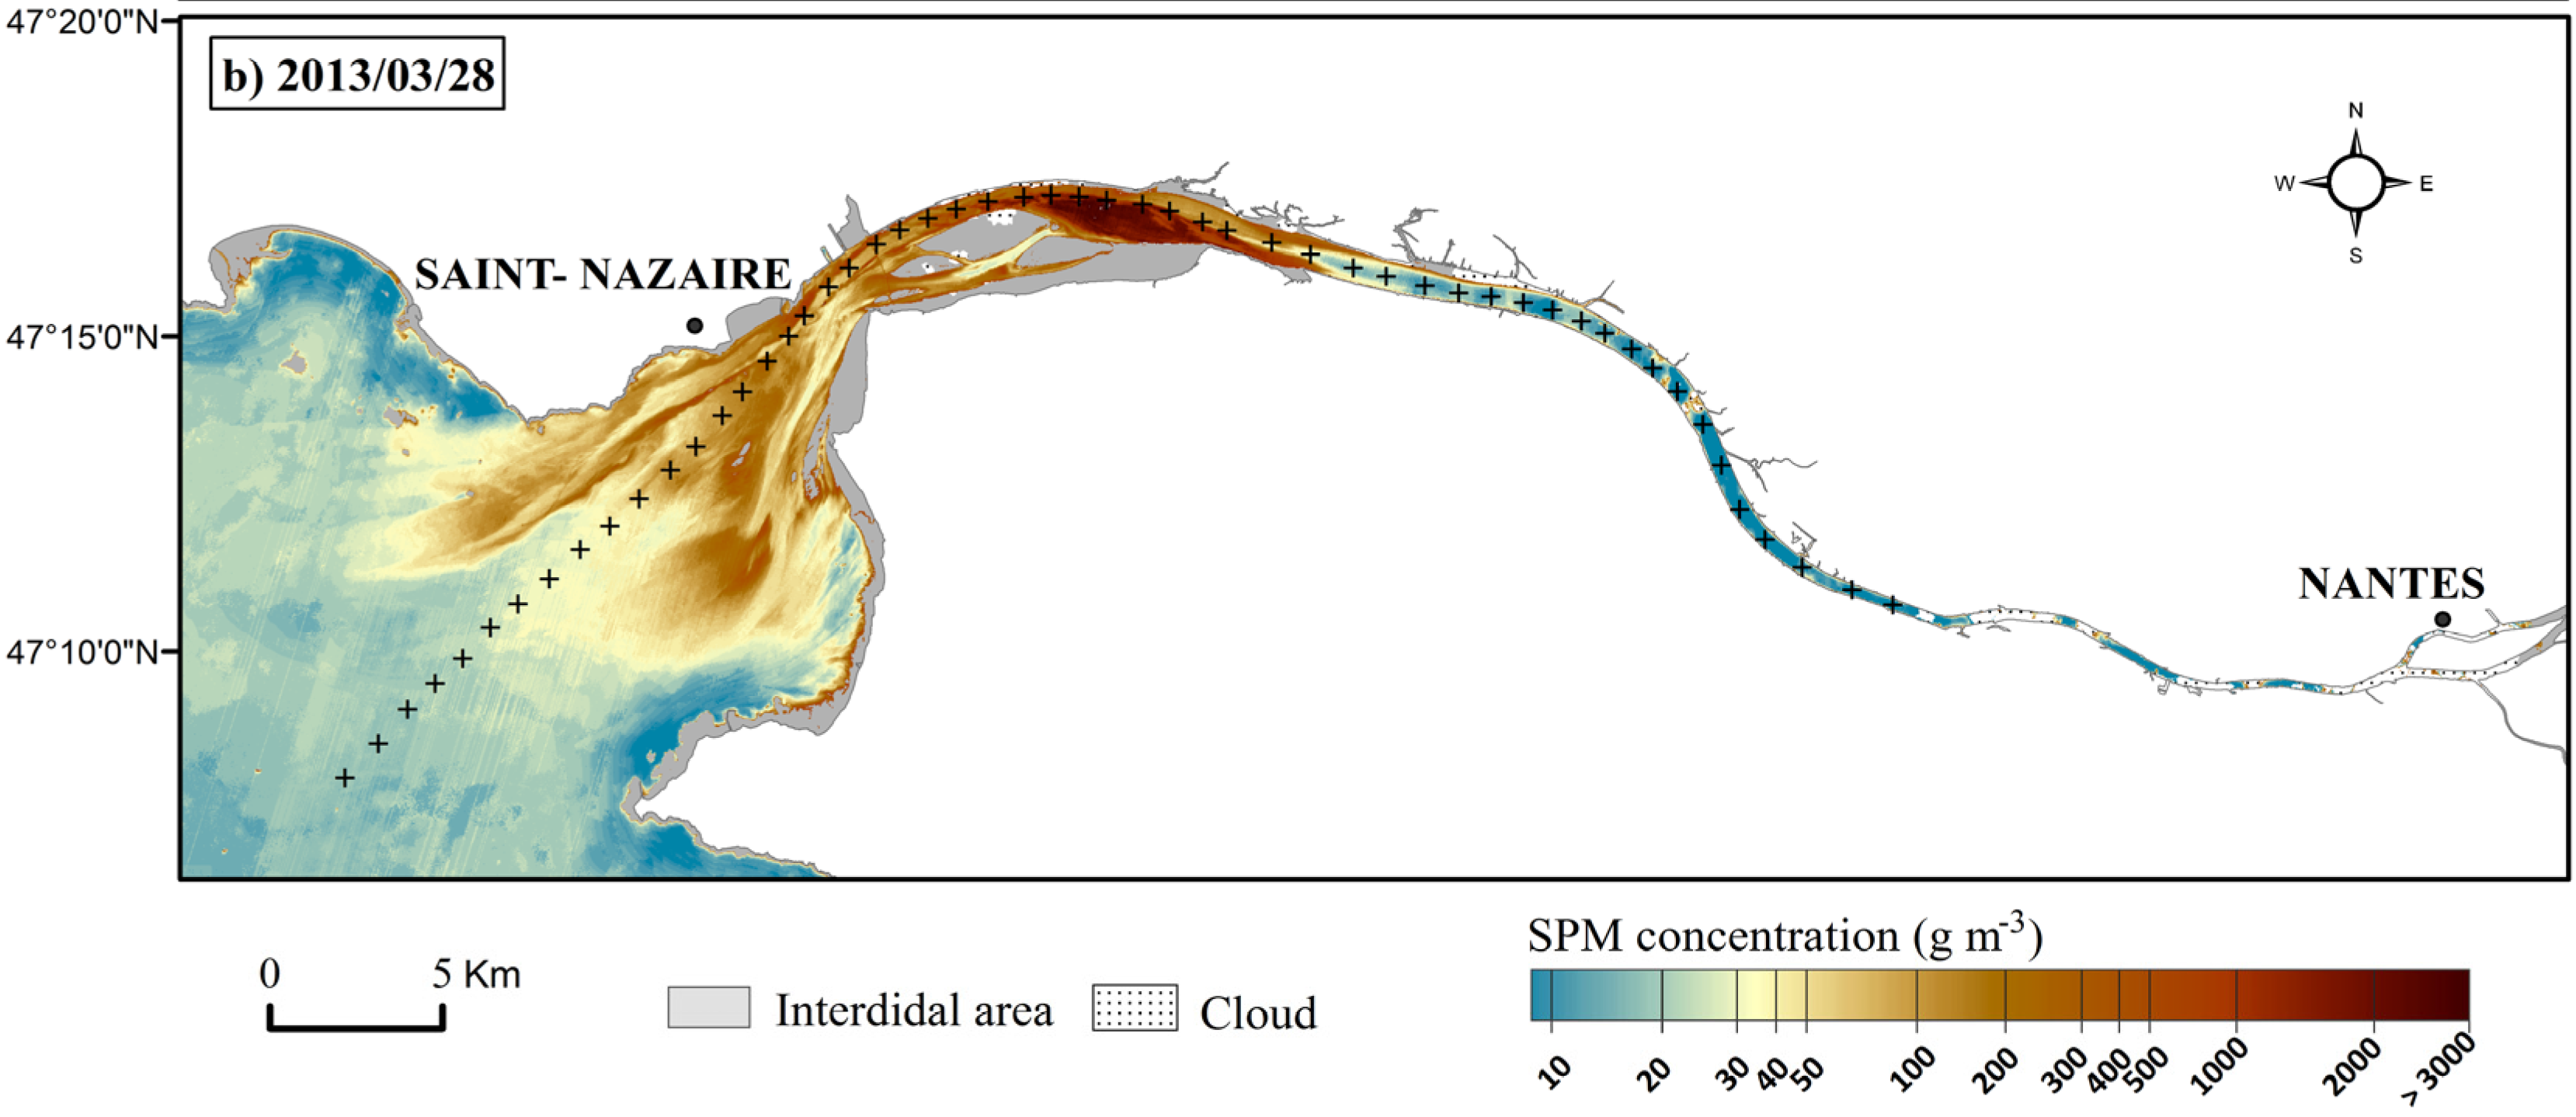
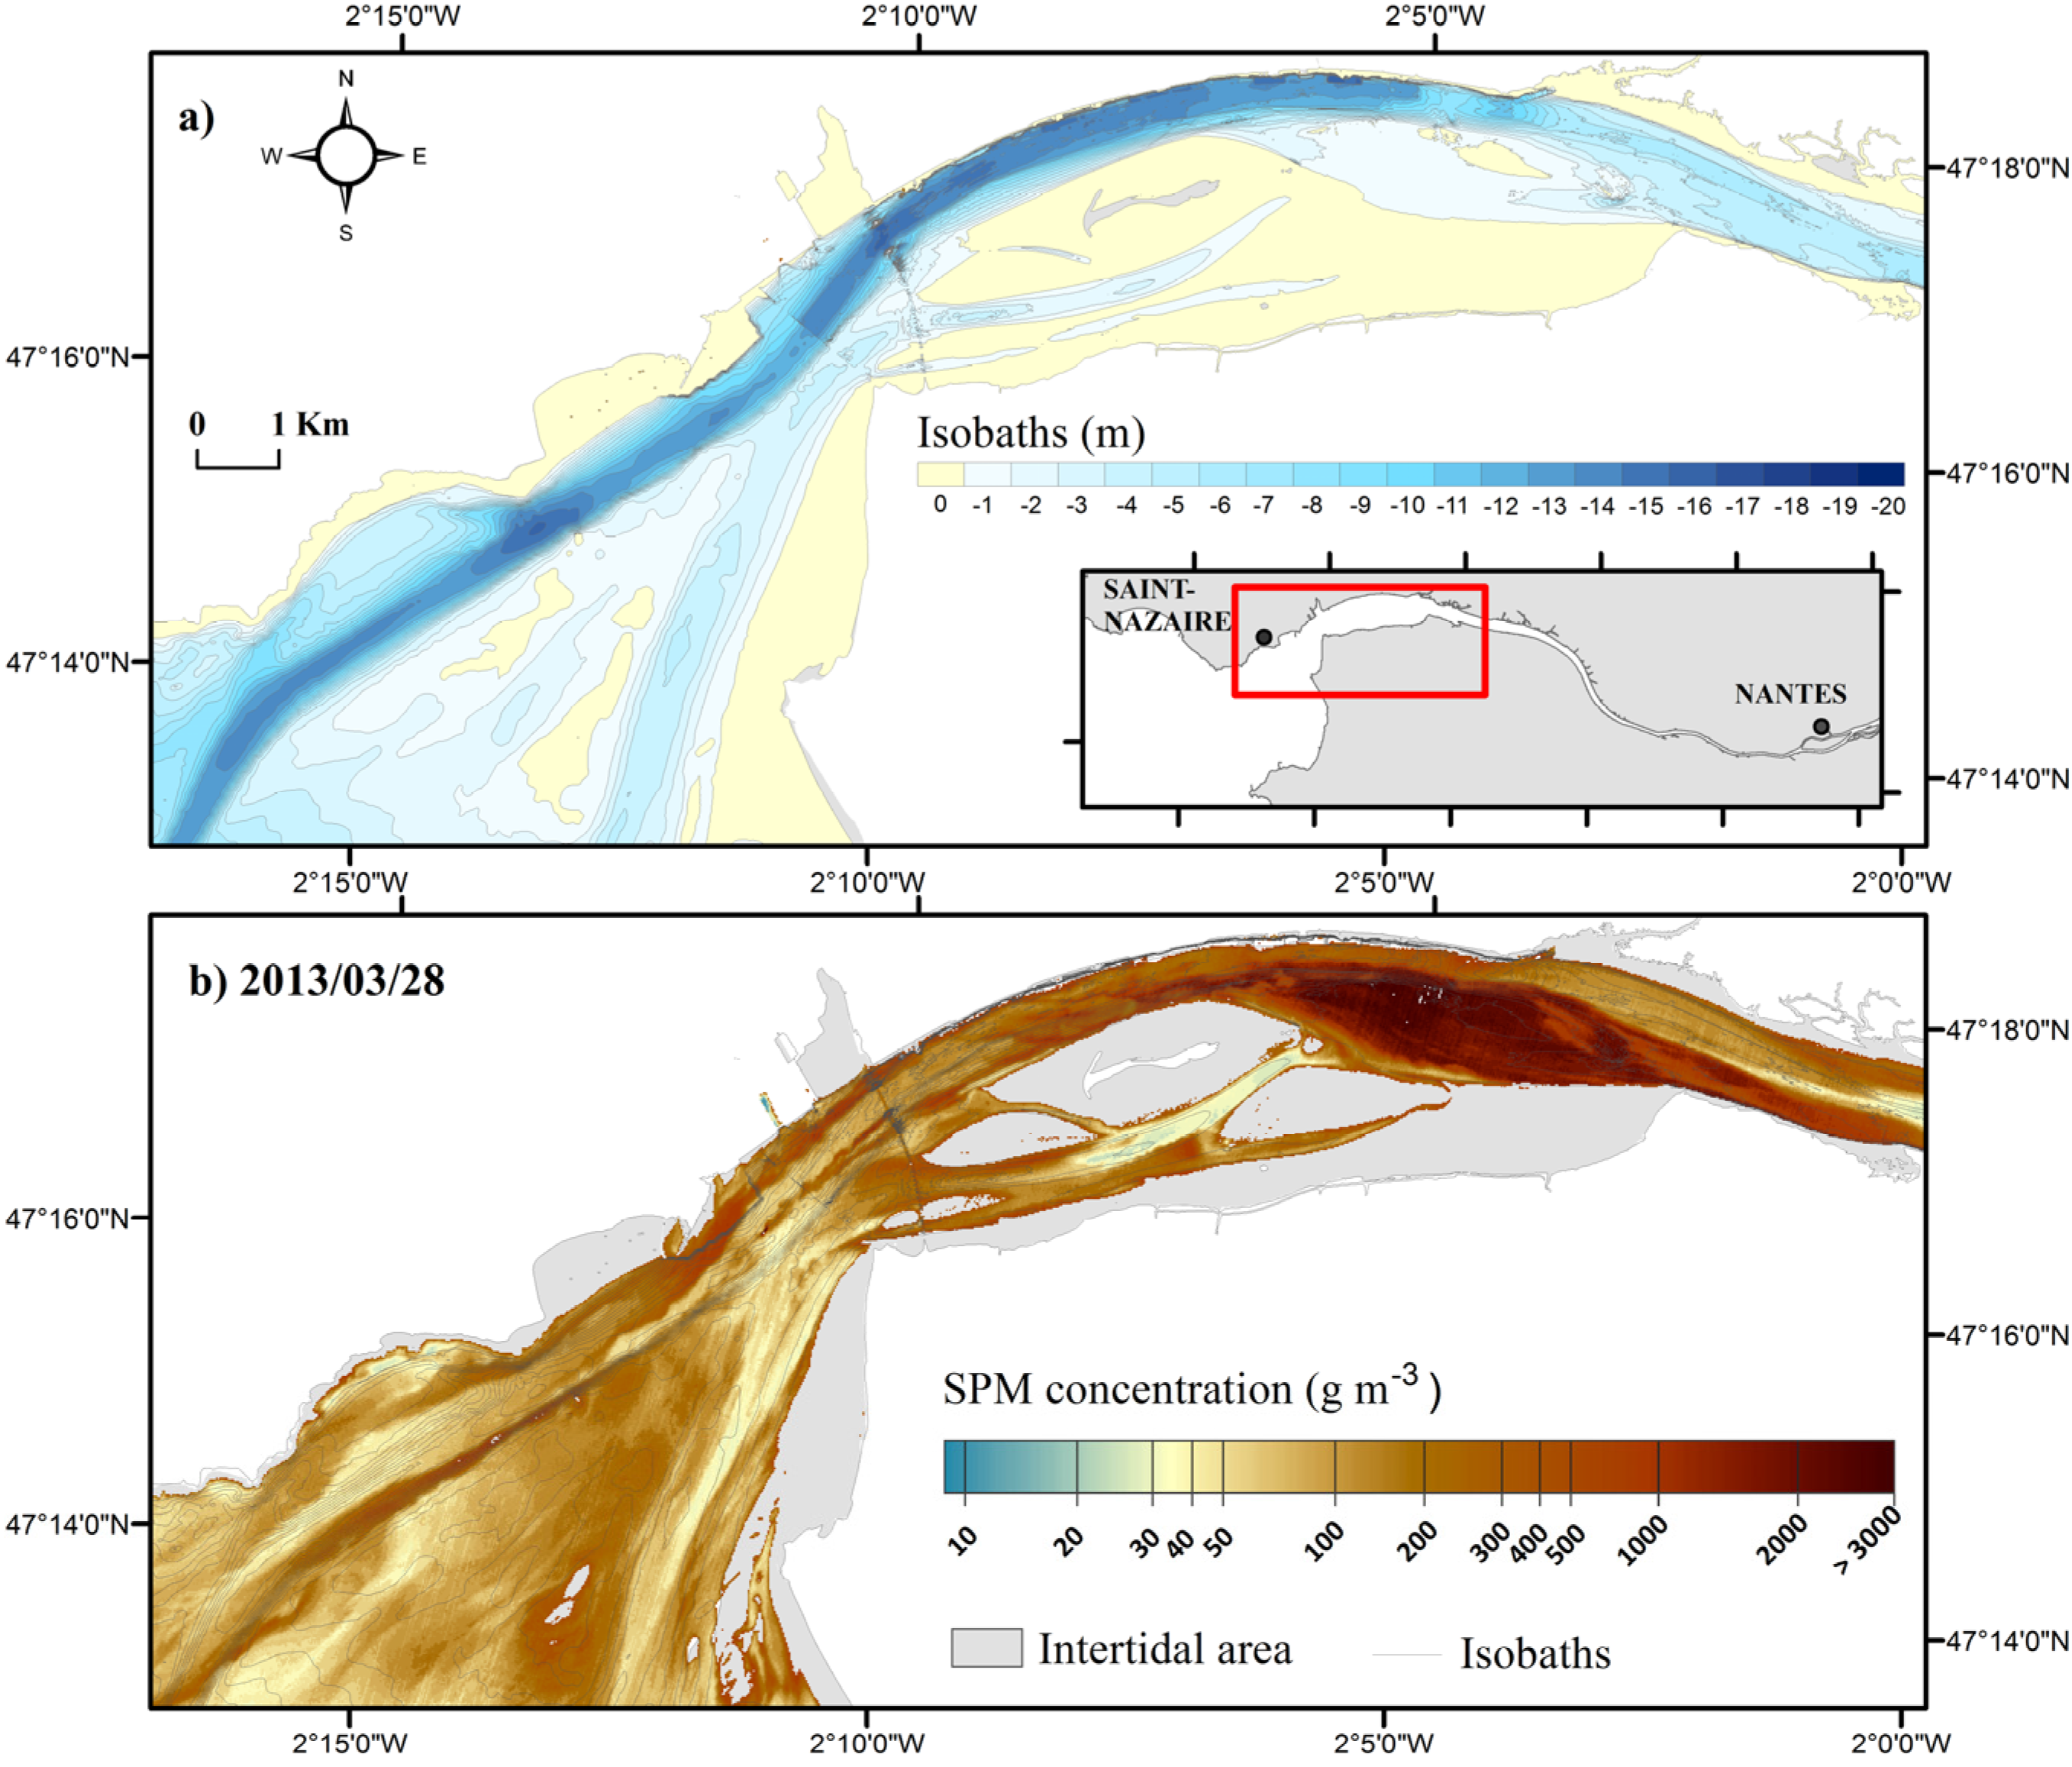
3.4.2. SPM Concentration Maps in the Loire Estuary

Two SPOT4 (Take5) images and corresponding longitudinal transects are shown to illustrate the diversity of SPM spatial distribution in the Loire estuary (Figure 6 and Figure 8). The first example corresponds to an image acquired on 21 February 2013, three hours after low tide during neap tide (tidal range was 2.24 m, Table 3). SPM surface concentration longitudinally decreased from Nantes to the ocean off Saint-Nazaire (Figure 6a). SPM concentration did not exceed 130 g·m−3, even in the most turbid sectors of the estuary around 1°50′W (Figure 8). SPM concentration remained above 100 g·m−3 over a 20 km section upstream of 2°05′W. In this section, SPM was homogeneously distributed between the river banks. In the outer estuary, SPM concentration was generally lower than 35 g·m−3, but varied importantly from the northern to the southern side of the river, with maximum values up to 250 g·m−3 near shore at about 47°12′N, 2°11′W. The turbid plume spreading out the Loire was confined to the south-eastern section of the estuary. Off the estuary, the marine waters were moderately turbid, probably due to wave-induced particle resuspension. Wave height was higher than 1 m, and wind speed averaged 37 km·h−1, with gusts at 59 km·h−1.
The second example corresponds to an image acquired one month later on 28 March 2013, 44 min before low tide during a spring tide (tidal range is 5.55 m, Table 3). Wave height was smaller than 0.5 m, and wind speed did not exceed 30 km·h−1. The distribution of SPM concentration was dramatically different than on 21 February 2013. In contrast with the previous situation, the most turbid waters were located downstream to Nantes (Figure 6b). Relatively low turbid waters, with SPM concentration as low as 5 g·m−3, were observed in the fluvial section. Within a few km from Nantes, SPM concentration exhibited very large longitudinal changes, from less than 10 g·m−3 to more than 1 kg·m−3 (Figure 8). The most noticeable feature consisted in the rapid formation of a maximum turbidity zone between 2°10′ and 2°0′W. The MTZ occupied a length of 3.5 km. Downstream of Saint-Nazaire, a turbid plume spreading out of the Loire was located in the center of the estuary. Within this turbid plume, across-side variations in SPM concentration were very important at small spatial scale. They were mostly associated with bathymetry changes, and the two navigational channels were visible along the two sides of the outer Loire estuary between 2°10′ and 2°15′W (Figure 9). A patch of extremely turbid waters (SPM concentration higher than 2000 g·m−3) was observed at 2°50′W, probably due to the concentration of SPM in very shallow waters and to enhanced sediments erosion and resuspension by nearby mudflats.
Figure 8. SPOT4-derived longitudinal transect of suspended particulate matter (SPM) surface concentration in the Loire estuary on 21 February 2013 (dotted line) and 28 March 2013 (solid line).
Remotesensing 07 09507 g008
Figure 9. (a) Bathymetry of the Loire estuary’s outer section; (b) SPOT4 suspended particulate matter (SPM) concentration at low tide on 28 March 2013, superimposed to bathymetric contour lines.
Remotesensing 07 09507 g009

4. Discussion

4.1. Accuracy of Satellite-derived SPM Concentration Maps

It is generally acknowledged that the accuracy of satellite match-ups is affected not only by uncertainties in bio-optical algorithms, but also by errors in field measurements, spatial and temporal differences between sampling and satellite overflight, and atmospheric correction uncertainties.

4.1.1. In Situ Measurements Uncertainties

Variability in particle size, composition and inherent optical properties affects the turbidity vs. SPM concentration relationship [47]. Regional calibration of turbidity measurements into SPM concentration are therefore required [48]. In the Gironde estuary, the relationship between SPM concentration and turbidity was linear from 0–2000 g·m−3 [23]. A polynomial fit was used to calibrate turbidity sensors in the Loire estuary. Beside the calibration of turbidity data, another source of error in match-up exercises is generally associated with temporal differences between water sampling and satellite overflight. Due to the high-frequency of in situ turbidity measurements acquired automatically in the frame of the MAGEST and SYVEL networks, it was possible in the present study to interpolate SPM time-series to the exact time of satellite images acquisition, thus preventing temporal biases. In highly dynamic estuarine and nearshore waters, SPM concentration can change dramatically within less than one hour due to tidal processes, and the use of high-frequency data is strongly recommended for satellite match-ups [49].

4.1.2. Spatial Heterogeneity and Match-Up Pixel Selection

An in situ experiment was carried out in the Gironde estuary at the Pauillac turbidity station to assess the impact of small-scale spatial heterogeneity on satellite turbidity retrieval over pixels adjacent to the riverbank. Water sampling was simultaneous performed just along the Pauillac embankment, and 50 m away from it during two consecutive days in order to encompass ebb and flood tidal conditions. The difference between near- and offshore SPM concentrations varied with tidal currents. A significant increase in SPM concentration was observed shoreward, with nearshore values up to two times higher than in the center of the estuary. This preliminary result highlights the importance of small-scale SPM spatial variation in nearshore waters. Small-scale spatial variability prevents the use of pixels coarser than 50 m for nearshore estuarine studies. It has also to be taken into account in match-ups exercises.
As the SPM match-up was performed using in situ data acquired from turbidity stations sampling water in the immediate vicinity of the riverbank (Figure 1 and Figure 2), a preliminary sensitivity analysis was performed in the selection of SPOT4 match-up pixels. Several configurations in the number and location of match-up pixels were tested. The best configuration was obtained when four pixels were used, including the pixel nearest to the sampling point and three additional pixels located along a line parallel to the flow, at about 30 m from the riverbank. In the Loire estuary, due to small-scale spatial heterogeneity, the match-up accuracy decreased when the number selected pixels was higher than 5, and when the pixels selected were too far away (i.e., >40 m) from the station location. Pixels too close to the shore were removed, in order to take into account the possible contamination of marine pixels by land adjacency effect [50]. In the present study, the size of SPOT4 (20 m) and Landsat (30 m) pixels was small enough to select the best configuration of match-up pixels, and it is expected that the use of higher resolution satellite data such as Sentinel-2 (10–60 m), SPOT5 (10 m), SPOT6 (6 m) or Pléiades (2 m) might improve pixel selection and match-up accuracy. Further studies are needed to implement a standard match-up protocol for the validation of remote-sensing data using land-based in situ turbidity station with nearshore water sampling.

4.1.3. Validity Range of the Doxaran et al. (2003) Algorithm

The Doxaran et al. (2003) algorithm is based on empirical relationships between SPM concentration and a NIR/VIS reflectance ratio established using a large dataset of in situ measurements [26]. Two distinct relationships were developed for the retrieval of SPM concentration from SPOT data in the Gironde and Loire estuaries, and a third relationship was also proposed to derive SPM concentration from c (Figure 7 and Figure 8 in [26]), and when used together, no bias was observed in the multi-sensor and multi-site match-up performed in the present study (Figure 4). Though the match-up was satisfactory over a very wide range of SPM concentration (38–4320 g·m−3), its performance was better in the 100–1000 g·m−3 range.
The Doxaran et al. (2003) relationships displayed some scatter at the lower range (see Figure 9 in [26]), and the use of an exponential fit could amplify the uncertainties. For turbid waters in the 10–500 g·m−3 range, it has been recently demonstrated that a linear relationship between SPM concentration and a NIR/VIS reflectance band ratio was sufficient to accurately determine SPM concentration in the Loire estuary and regional waters [51]. In extremely turbid waters (SPM>1000 g·m−3), it is generally recognized that NIR/VIS Rrs ratio may saturate [26], and more data are still needed to develop robust SPM algorithms for highly turbid waters [48]. Beside the SPM algorithm itself, other factors such as small-scale spatial heterogeneity (see Section 4.1.2) and atmospheric correction uncertainties (see below) also contribute to degrade match-up performance in turbid waters.

4.1.4. Atmospheric Correction

The reflectance at the top of the atmosphere (TOA) is the sum of the atmospheric reflectance and of the surface marine reflectance transmitted by the atmosphere. Over clear oceanic waters, the contribution of the atmosphere is computed in the NIR where the marine reflectance is assumed to be zero because of the strong pure water absorption and of the negligible contribution by SPM [52]. In turbid waters, the NIR dark pixel assumption is not valid anymore [53]. The contribution of SPM to the marine reflectance in the NIR, and for highly turbid waters in the SWIR between 1000 and 1250 nm [51,54], has to be taken into account to separate the atmospheric effects from the TOA reflectance. Beyond 1600 nm, it can be assumed that the SWIR marine reflectance is negligible, and a SWIR-based atmospheric correction has been recently implemented for Landsat8-OLI data over turbid waters [55]. As this latter method has not been implemented for SPOT4 data, another approach was used in the present study for SPOT4 atmospheric correction.
In the present study, the MACCS atmospheric correction was used for cloud detection and atmospheric correction of satellite data [35]. This method has been developed for the correction of multi-temporal images acquired using a constant viewing angle. Over land, it assumes that the surface reflectance in the blue does not change quickly with time. Changes in TOA reflectance will be detected and identified as clouds or aerosol optical thickness variations, making it possible to characterize the atmospheric reflectance, and to remove it from the TOA signal to determine surface reflectance [35]. A notable advantage of the MACCS method is its ability to be applied to different sensors, as long as a sufficient number of multi-temporal data is available, and that the viewing angle remains constant for each sensor [36,37]. These two conditions are met for SPOT4 (Take5) and Landsat8 imagery, and the MACCS atmospheric correction was applied to all images selected in Table 2 and Table 3. A thorough evaluation of the MACCS atmospheric correction for the Gironde and Loire waters was out of scope of the present study, but as the SPM match-up did not show any bias between sites and sensors (Figure 4), it seemed that MACCS can be seamlessly applied to SPOT4, Landsat5, 7 and 8 data to study SPM concentration in turbid waters (SPM concentration > 100 g·m-3).

4.2. Influence of Environment on SPM Dynamics

We presented here a few examples of satellite-derived SPM distribution, and the number of SPM maps was not sufficient for a detailed analysis of SPM dynamics in response to environmental changes. The interpretation of SPM spatial distribution was mainly based on analyzing the time of satellite acquisition in the context of the tidal cycle, which is generally recognized as one of the main factors affecting SPM dynamics [6,29]. River topography (i.e., mud banks location), morphology and bathymetry can also affect SPM spatial distribution [39]. The high spatial resolution of SPOT4 made it possible to show the influence of river topography on SPM small-scale distribution. The tidal river is also very sensitive to river discharge variations, and it has been recently shown that the MTZ was expulsed from the Bordeaux sector when the river flow exceeded 350 m3·s−1 [39], which was generally consistent with the situations described here in the Gironde estuary. In the Loire estuary, winter and spring 2013 were exceptionally rainy, and the high rain falls affected the river discharge. From February to May 2013, the daily river flow was systematically higher than the decadal average (850 m3·s−1). The mean SPOT4 (Take5) river flow was 1711 m3·s−1, thus exceeding the interannual average by a factor of 2. The series of SPM data presented here is however too short to analyze the effect of above-average hydrological conditions on SPM dynamics and MTZ characteristics.

5. Conclusions and Future Directions

In this paper, we validated the use of SPOT4 (Take5) and Landsat data to detect and quantify SPM surface concentration in the Gironde and Loire estuaries. We demonstrated that the combination of the MACCS atmospheric correction [35] with a simple NIR/VIS reflectance band ratio algorithm [26] satisfactorily quantified SPM concentration in moderately to extremely turbid waters (38–4320 g·m−3) at an accuracy sufficient to detect the maximum turbidity zone in two optically distinct estuaries. We presented a multi-sensor approach that can be applied to SPOT and Landsat archives, as well as to other high spatial resolution Earth Observation sensors such as the Sentinel-2 mission by the European Space Agency.
Using moderate resolution remote sensing, it has been previously demonstrated that decadal satellite time series can be used to study the turbidity response of large estuaries to global changes [22,23,25,56]. Based on a few high spatial resolution SPOT and Landsat images, we provided here a preliminary description of the fine-scale spatial distribution of SPM concentration in the Gironde and Loire estuaries during contrasted hydrological conditions. At the time we wrote the paper, the SPOT5 (Take5) experiment (April–August 2015) was currently under way, and the Sentinel-2 satellite has been successfully launched on 23 June 2015. It is expected that in a near future, the high spatial resolution (10 m) and high frequency (5 days) of the data provided by these two missions will make it possible to more systematically document SPM concentration changes in nearshore and estuarine areas, and to more accurately study the response of coastal ecosystems to environmental changes.

Acknowledgments

We thank the CESBIO, CNES and ESA for the SPOT4 (Take5) experiment. The provision of atmospherically-corrected SPOT4 and Landsat data on the THEIA web portal was greatly appreciated. Part of this research was funded by the GIPLE and the CNES (Rivercolor project). We acknowledge the MAGEST and SYVEL network teams for the availability of automated in situ turbidity time series in the Gironde and Loire estuaries. We also thank the students of Bordeaux Science Agro who participated to the field campaigns dedicated to the analysis of SPM heterogeneity in the vicinity of MAGEST stations. We thank four anonymous reviewers for helpful comments.

Author Contributions

All authors contributed to data analysis and interpretation. BL, VL and SC participated to field data acquisition. AL, PG, CC and VL processed the data and prepared the figures. PG, VL and AL designed and wrote the paper.

Conflicts of Interest

The authors declare no conflict of interest.

References

  1. Avoine, J.; Allen, G.P.; Nichols, M.; Salomon, J.C.; Larsonneur, C. Suspended-sediment transport in the Seine estuary, France: Effect of man-made modifications on estuary—Shelf sedimentology. Mar. Geol. 1981, 40, 119–137. [Google Scholar] [CrossRef]
  2. Figueres, G.; Martin, J.M.; Meybeck, M.; Seyler, P. A comparative study of mercury contamination in the Tagus Estuary (Portugal) and major French Estuaries (Gironde, Loire, Rhône). Estuar. Coast. Shelf Sci. 1985, 20, 183–203. [Google Scholar] [CrossRef]
  3. Budzinski, H.; Jones, I.; Bellocq, J.; Pierard, C.; Garrigues, P.H. Evaluation of sediment contamination by polycyclic aromatic hydrocarbons in the Gironde estuary. Mar. Chem. 1997, 58, 85–97. [Google Scholar] [CrossRef]
  4. Fredsøe, J.; Deigaard, R. Mechanics of Coastal Sediment Transport; Advanced Series on Ocean Engineering; Liu, P.L.-F., Ed.; World Scientific: Singapore, 1992; Volume 3, p. 369. [Google Scholar]
  5. Irigoien, X.; Castel, J. Light limitation and distribution of chlorophyll pigments in a highly turbid estuary: The Gironde (SW France). Estuar. Coast. Shelf Sci. 1997, 44, 507–517. [Google Scholar] [CrossRef]
  6. Etcheber, H.; Schmidt, S.; Sottolichio, A.; Maneux, E.; Chabaux, G.; Escalier, J.M.; Wennekes, H.; Derriennic, H.; Schmeltz, M.; Quéméner, L.; et al. Monitoring water quality in estuarine environments: Lessons from the MAGEST monitoring program in the Gironde fluvial-estuarine system. Hydrol. Earth Syst. Sci. 2011, 15, 831–840. [Google Scholar] [CrossRef]
  7. Marchand, J. The influence of seasonal salinity and turbidity maximum variations on the nursery function of the Loire estuary (France). Neth. J. Aquat. Ecol. 1993, 27, 427–436. [Google Scholar] [CrossRef]
  8. Turner, A.; Millward, G.E. Suspended particles: Their role in estuarine biogeochemical cycles. Estuar. Coast. Shelf Sci. 2002, 55, 857–883. [Google Scholar] [CrossRef]
  9. Meybeck, M.; Cauwet, G.; Dessery, S.; Somville, M.; Gouleau, D.; Billen, G. Nutrients (organic C, P, N, Si) in the eutrophic river Loire (France) and its estuary. Estuar. Coast. Shelf Sci. 1988, 27, 595–624. [Google Scholar] [CrossRef]
  10. Wollast, R. Interactions in estuaries and coastal waters. In The Major Biogeochemical Cycles and Their Interactions, Scientific Committee on Problems of the Environment (SCOPE); Bolin, B., Cook, R.B., Eds.; John Wiley & Sons: New York, NY, USA, 1983; Chapter 14; pp. 385–407. [Google Scholar]
  11. Uncles, R.J.; Stephens, J.A. Distribution of suspended sediment at high water in a macrotidal estuary. J. Geophys. Res. 1989, 94, 14395–14405. [Google Scholar] [CrossRef]
  12. Geyer, W.R. The importance of suppression of turbulence by stratification on the estuarine turbidity maximum. Estuaries 1993, 16, 113–125. [Google Scholar] [CrossRef]
  13. Sholkovitz, E.R. Flocculation of dissolved organic and inorganic matter during the mixing of river water and seawater. Geochim. Cosmochim. Acta 1976, 40, 831–845. [Google Scholar] [CrossRef]
  14. Mitchell, S.B.; Lawler, D.M.; West, J.R.; Couperthwaite, J.S. Use of continuous turbidity sensor in the prediction of fine sediment transport in the turbidity maximum of the Trent Estuary, UK. Estuar. Coast. Shelf Sci. 2003, 58, 643–650. [Google Scholar] [CrossRef]
  15. Doxaran, D.; Froidefond, J.M.; Castaing, P. Reflectance band ratio used to estimate suspended matter concentrations in coastal sediment-dominated waters. Int. J. Remote Sens. 2002, 23, 5079–5085. [Google Scholar] [CrossRef]
  16. Rouse, L.J.; Coleman, J.M. Circulation observations in the Louisiana Bight using LANDSAT imagery. Remote Sens. Environ. 1976, 5, 55–66. [Google Scholar] [CrossRef]
  17. Mertes, L.A.; Smith, M.O.; Adams, J.B. Estimating suspended sediment concentrations in surface waters of the Amazon River wetlands from Landsat images. Remote Sens. Environ. 1993, 43, 281–301. [Google Scholar] [CrossRef]
  18. Doxaran, D.; Castaing, P.; Lavender, S.J. Monitoring the maximum turbidity zone and detecting fine-scale turbidity features in the Gironde estuary using high spatial resolution satellite sensor (SPOT HRV, Landsat ETM+) data. Int. J. Remote Sens. 2006, 27, 2303–2321. [Google Scholar] [CrossRef]
  19. Heege, T.; Kiselev, V.; Wettle, M.; Hung, N.N. Operational multi-sensor monitoring of turbidity for the entire Mekong Delta. Int. J. Remote Sens. 2014, 35, 2910–2926. [Google Scholar] [CrossRef]
  20. Forget, P.; Ouillon, S. Surface suspended matter off the Rhone river mouth from visible satellite imagery. Oceanol. Acta 1998, 21, 739–749. [Google Scholar] [CrossRef]
  21. Shi, Z.; Kirby, R. Observations of fine suspended sediment processes in the turbidity maximum at the North Passage of the Changjiang Estuary, China. J. Coast. Res. 2003, 19, 529–540. [Google Scholar]
  22. Jiang, X.; Lu, B.; He, Y. Response of the turbidity maximum zone to fluctuations in sediment discharge from river to estuary in the Changjiang Estuary (China). Estuar. Coast. Shelf Sci. 2013, 131, 24–30. [Google Scholar] [CrossRef]
  23. Doxaran, D.; Froidefond, J.M.; Castaing, P.; Babin, M. Dynamics of the turbidity maximum zone in a macrotidal estuary (the Gironde, France): Observations from field and MODIS satellite data. Estuar. Coast. Shelf Sci. 2009, 81, 321–332. [Google Scholar] [CrossRef]
  24. Eleveld, M.A.; van der Wal, D.; van Kessel, T. Estuarine suspended particulate matter concentrations from sun-synchronous satellite remote sensing: Tidal and meteorological effects and biases. Remote Sens. Environ. 2014, 143, 204–215. [Google Scholar] [CrossRef]
  25. Zheng, G.; DiGiacomo, P.M.; Kaushal, S.S.; Yuen-Murphy, M.A.; Duan, S. Evolution of sediment plumes in the Chesapeake Bay and implications of climate variability. Environ. Sci. Technol. 2015. [Google Scholar] [CrossRef] [PubMed]
  26. Doxaran, D.; Froidefond, J.M.; Castaing, P. Remote-sensing reflectance of turbid sediment-dominated waters. Reduction of sediment type variations and changing illumination conditions effects by use of reflectance ratios. Appl. Opt. 2003, 42, 2623–2634. [Google Scholar] [CrossRef] [PubMed]
  27. Etcheber, H.; Taillez, A.; Abril, G.; Garnier, J.; Servais, P.; Moatar, F.; Commarieu, M.V. Particulate organic carbon in the estuarine turbidity maxima of the Gironde, Loire and Seine estuaries: origin and lability. Hydrobiologia 2007, 588, 245–259. [Google Scholar] [CrossRef]
  28. Masson, M.; Schäfer, J.; Blanc, G.; Pierre, A. Seasonal variations and annual fluxes of arsenic in the Garonne, Dordogne and Isle Rivers, France. Sci. Total Environ. 2007, 373, 196–207. [Google Scholar] [CrossRef] [PubMed]
  29. Allen, G.P.; Sauzay, G.; Castaing, P.; Jouanneau, J.M. Transport and deposition of suspended sediment in the Gironde estuary, France. Estuar. Process. 1977, 2, 63–81. [Google Scholar]
  30. Saari, H.-K.; Schmidt, S.; Castaing, P.; Blanc, G.; Sautour, B.; Masson, O.; Cochran, J.K. The particulate 7Be/210Pbxs and 234Th/210Pbxs activity ratios as tracers for tidal-to-seasonal particle dynamics in the Gironde estuary (France): Implications for the budget of particle-associated contaminants. Sci. Total Environ. 2010, 408, 4784–4794. [Google Scholar] [CrossRef] [PubMed]
  31. Guillaud, J.F.; Romana, A. La gestion des estuaires en France. Norois 1984, 121, 97–112. [Google Scholar] [CrossRef]
  32. Benyoucef, I.; Blandin, E.; Lerouxel, A.; Jesus, B.; Rosa, P.; Méléder, V.; Launeau, P.; Barillé, L. Microphytobenthos interannual variations in a north-European estuary (Loire estuary, France) detected by visible-infrared multispectral remote sensing. Estuar. Coast. Shelf Sci. 2014, 136, 43–52. [Google Scholar] [CrossRef]
  33. Gallenne, B. Les Accumulations Turbides de l’Estuaire de la Loire. Etude de la Crème de Vase. Ph.D. Thesis, Nantes University, Nantes, France, 1974. [Google Scholar]
  34. Le Normant, C. Three-dimensional modelling of cohesive sediment transport in the Loire estuary. Hydrol. Process. 2000, 14, 2231–2243. [Google Scholar] [CrossRef]
  35. Hagolle, O.; Dedieu, G.; Mougenot, B.; Debaecker, V.; Duchemin, B.; Meygret, A. Correction of aerosol effects on multi-temporal images acquired with constant viewing angles: Application to Formosat-2 images. Remote Sens. Environ. 2008, 112, 1689–1701. [Google Scholar] [CrossRef] [Green Version]
  36. Hagolle, O.; Huc, M.; Villa Pascual, D.; Dedieu, G. A multi-temporal method for cloud detection, applied to FormoSat-2, VENµS, LandSat and Sentinel-2 images. Remote Sens. Environ. 2010, 114, 1747–1755. [Google Scholar] [CrossRef] [Green Version]
  37. Hagolle, O.; Huc, M.; Villa Pascual, D.; Dedieu, G. A multi-temporal and multi-spectral method to estimate aerosol optical thickness over land, for the atmospheric correction of FormoSat-2, LandSat, VENμS and Sentinel-2 Images. Remote Sens. 2015, 7, 2668–2691. [Google Scholar] [CrossRef]
  38. Woerther, P.; Grouhel, A. MAREL: Automated measurement network for the coastal environment. In Proceedings of the OCEANS ’98 Conference, Nice, France, 28 September–1 October 1998; pp. 1149–1154.
  39. Jalon-Rojas, I.; Schmidt, S.; Sottolichio, A. Turbidity in the fluvial Gironde Estuary (southwest France) based on 10-year continuous monitoring: Sensitivity to hydrological conditions. Hydrol. Earth Syst. Sci. 2015, 19, 2805–2819. [Google Scholar] [CrossRef]
  40. Sottolichio, A.; Castaing, P.; Etcheber, H.; Maneux, E.; Schmeltz, M.; Schmidt, S. Observations of suspended sediment dynamics in a highly turbid macrotidal estuary, derived from continuous monitoring. J. Coast. Res. 2011, 64, 1579–1583. [Google Scholar]
  41. Allen, G.P.; Salomon, J.C.; Bassoullet, P.; Du Penhoat, Y.; De Grandpre, C. Effects of tides on mixing and suspended sediment transport in macrotidal estuaries. Sediment. Geol. 1980, 26, 69–90. [Google Scholar] [CrossRef]
  42. Castaing, P.; Allen, G.P. Mechanisms controlling seaward escape of suspended sediment from the Gironde: A macrotidal estuary in France. Mar. Geol. 1981, 40, 101–118. [Google Scholar] [CrossRef]
  43. Uncles, R.J.; Stephens, J.A. Turbidity and sediment transport in a muddy sub-estuary. Estuar. Coast. Shelf Res. 2010, 87, 213–224. [Google Scholar] [CrossRef]
  44. Groupement d’Intérêt Public Loire Estuaire. La Dynamique du Bouchon Vaseux; Fiche L1.E2; GIP Loire Estuaire: Nantes, France, 2014. [Google Scholar]
  45. Zhang, Y.; Shi, K.; Liu, X.; Zhou, Y.; Qin, B. Lake Topography and Wind Waves Determining Seasonal-Spatial Dynamics of Total Suspended Matter in Turbid Lake Taihu, China: Assessment Using Long-Term High-Resolution MERIS Data. PLoS One 2014, 9, e98055. [Google Scholar] [CrossRef] [PubMed]
  46. R Core Team. R: A Language and Environment for Statistical Computing; R Foundation for Statistical Computing: Vienna, Austria, 2012. [Google Scholar]
  47. Boss, E.; Taylor, L.; Gilbert, S.; Gundersen, K.; Hawley, N.; Janzen, C.; Johengen, T.; Purcell, H.; Robertson, C.; Schar, D.W.H.; et al. Comparison of inherent optical properties as a surrogate for particulate matter concentration in coastal waters. Limnol. Oceanogr. Methods 2009, 7, 803–810. [Google Scholar] [CrossRef]
  48. Dogliotti, A.I.; Ruddick, K.; Nechad, B.; Doxaran, D.; Knaeps, E. A single algorithm to retrieve turbidity from remotely-sensed data in all coastal and estuarine waters. Remote Sens. Environ. 2015, 156, 157–168. [Google Scholar] [CrossRef]
  49. Fettweis, M.P.; Nechad, B. Evaluation of in situ and remote sensing sampling methods for SPM concentrations, Belgian continental shelf (southern North Sea). Ocean Dyn. 2011, 61, 157–171. [Google Scholar] [CrossRef]
  50. Sterckx, S.; Knaeps, S.; Kratzer, S.; Ruddick, K. SIMilarity Environment Correction (SIMEC) applied to MERIS data over inland and coastal waters. Remote Sens. Environ. 2015, 157, 96–110. [Google Scholar] [CrossRef]
  51. Gernez, P.; Barillé, L.; Lerouxel, A.; Mazeran, C.; Lucas, A.; Doxaran, D. Remote sensing of suspended particulate matter in turbid oyster-farming ecosystems. J. Geophys. Res.: Oceans 2014, 119, 7277–7294. [Google Scholar] [CrossRef]
  52. Gordon, H.R.; Wang, M. Retrieval of water-leaving radiance and aerosol optical thickness over the oceans with SeaWiFS: A preliminary algorithm. Appl. Opt. 1994, 33, 443–452. [Google Scholar] [CrossRef] [PubMed]
  53. Ruddick, K.; Ovidio, F.; Rijkeboer, M. Atmospheric correction of SeaWiFS imagery for turbid coastal and inland waters. Appl. Opt. 2000, 39, 897–912. [Google Scholar] [CrossRef] [PubMed]
  54. Knaeps, E.; Dogliotti, A.I.; Raymaekers, D.; Ruddick, K.; Sterckx, S. In situ evidence of non-zero reflectance in the OLCI 1020 nm band for a turbid estuary. Remote Sens. Environ. 2012, 120, 133–144. [Google Scholar] [CrossRef]
  55. Vanhellemont, Q.; Ruddick, K. Advantages of high quality SWIR bands for ocean colour processing: Examples from Landsat-8. Remote Sens. Environ. 2015, 161, 89–106. [Google Scholar] [CrossRef]
  56. Martinez, J.M.; Guyot, J.L.; Filizola, N.; Sondag, F. Increase in suspended sediment discharge of the Amazon River assessed by monitoring network and satellite data. Catena 2009, 79, 257–264. [Google Scholar] [CrossRef]

