
Monitoring Spatial and Temporal Dynamics of Flood Regimes and Their Relation to Wetland Landscape Patterns in Dongting Lake from MODIS Time-Series Imagery

Abstract
:
1. Introduction
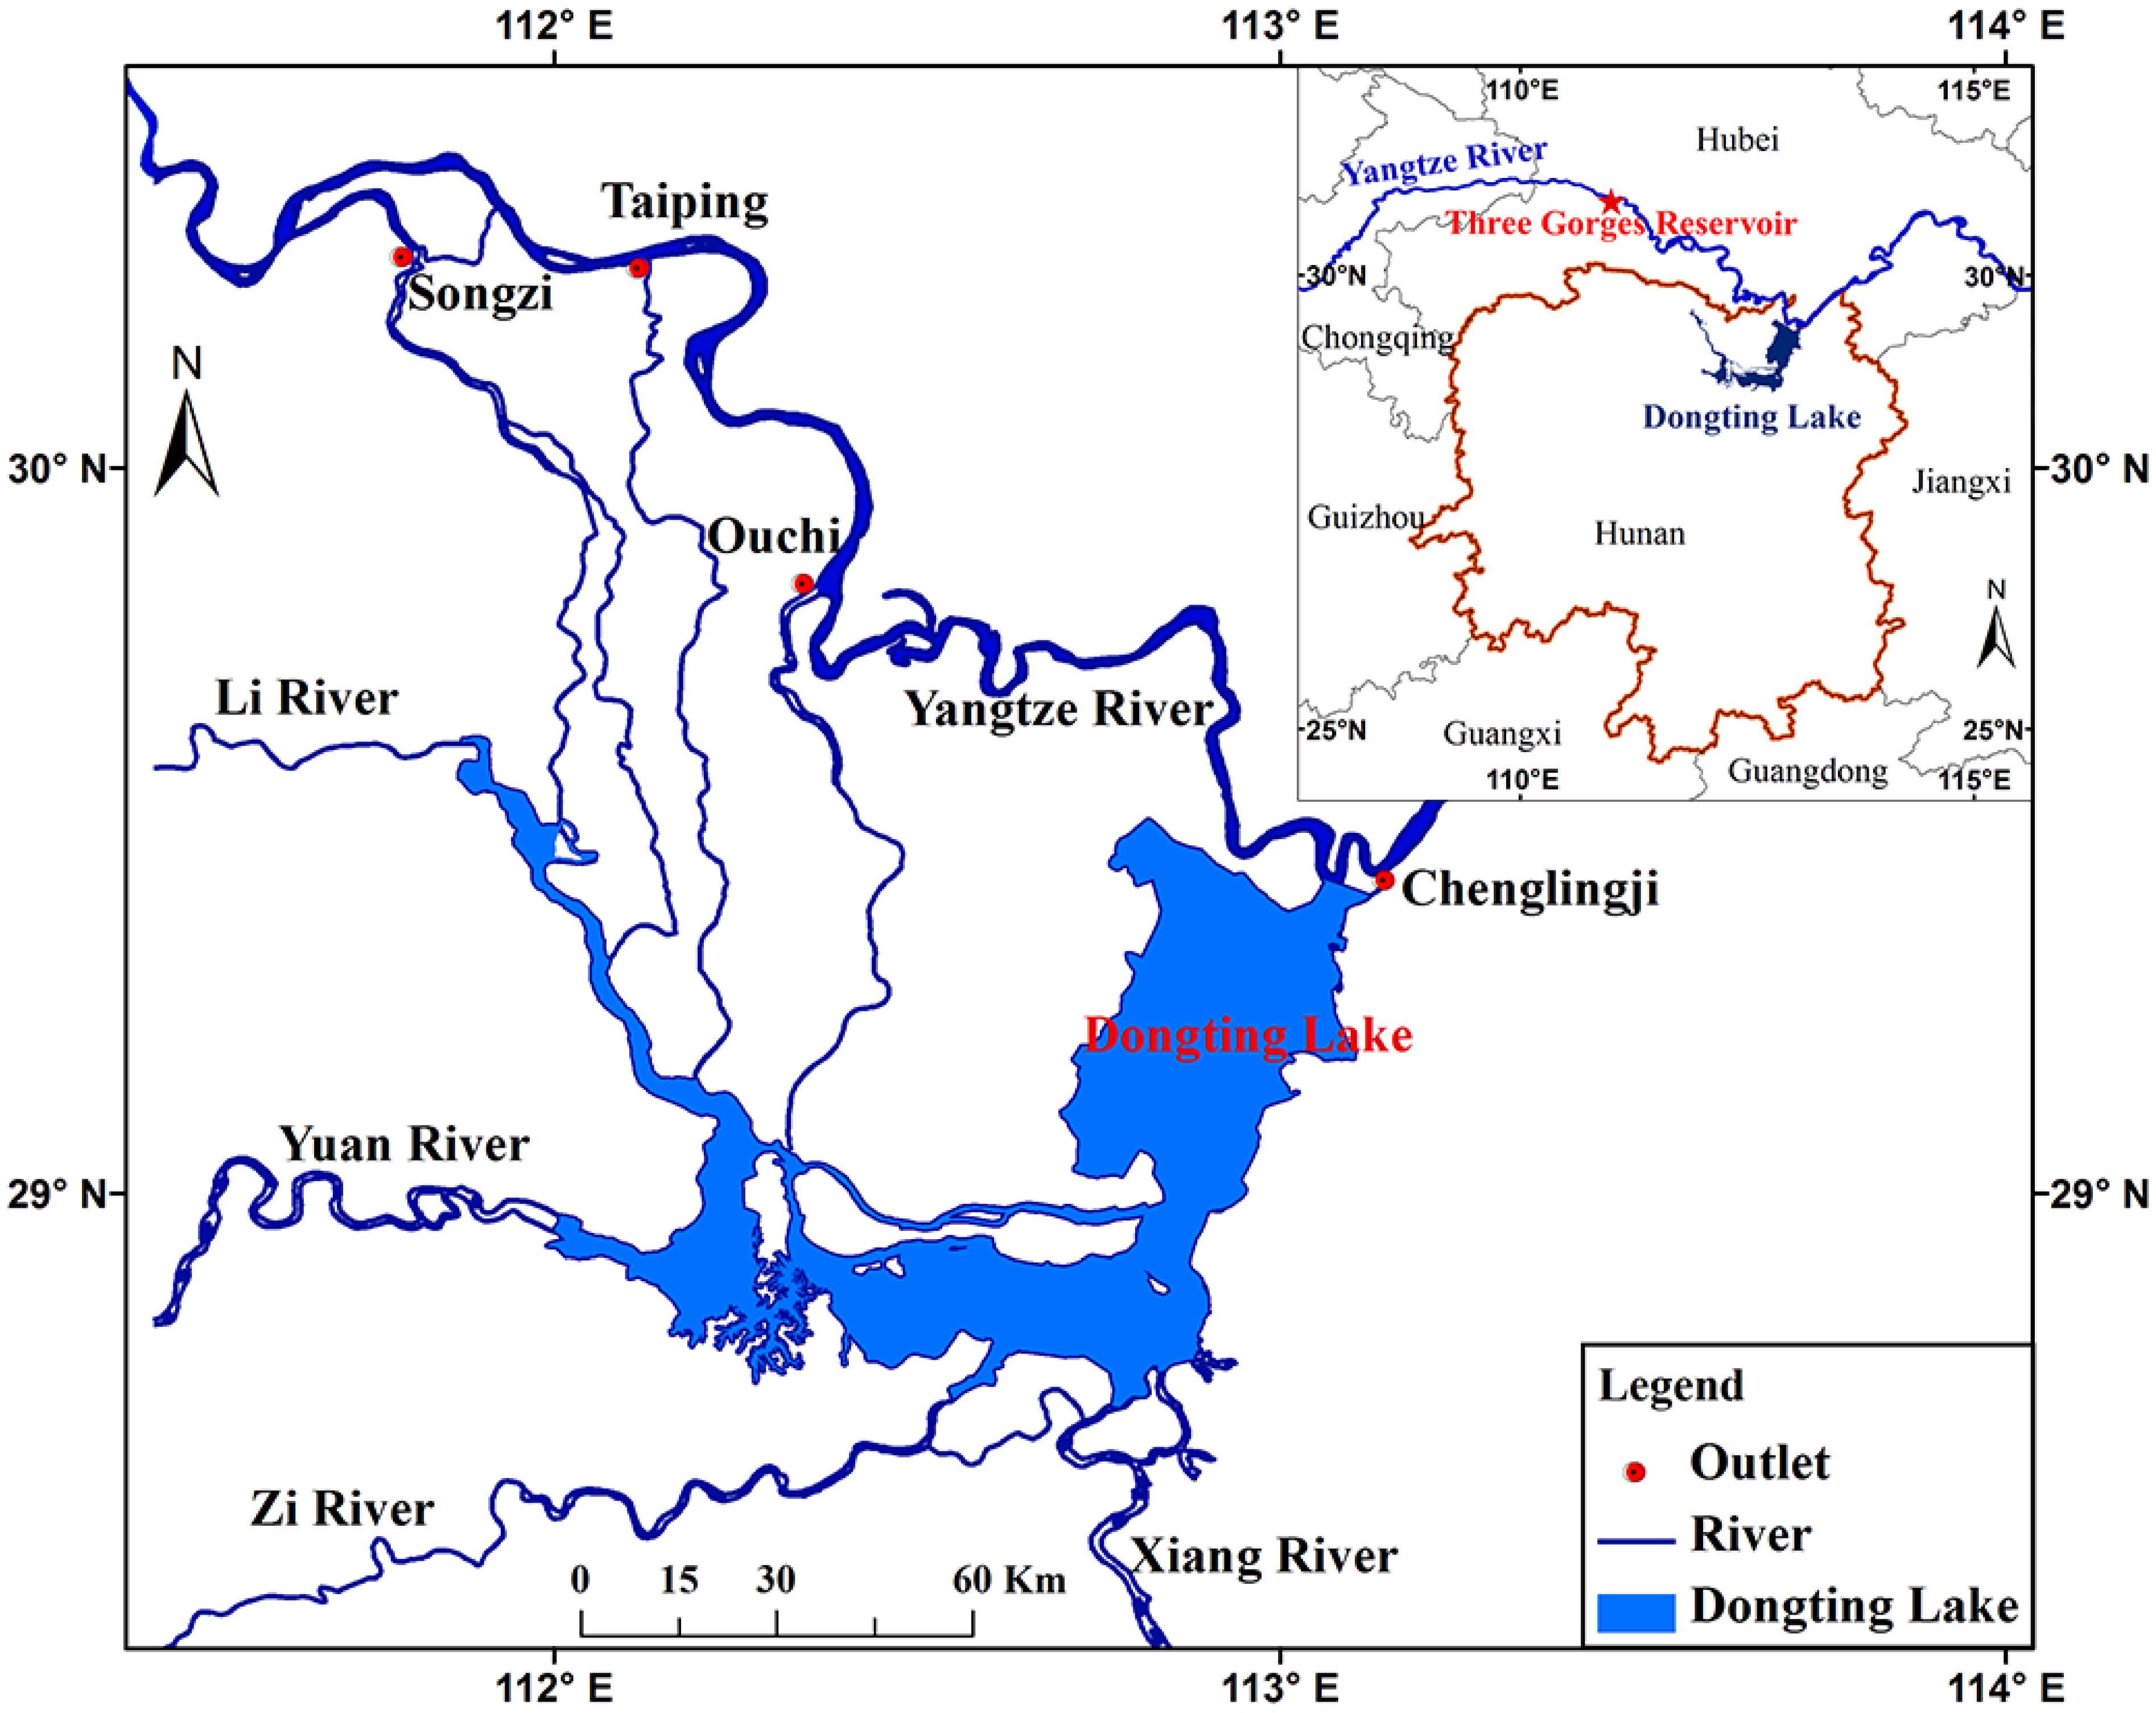
2. Study Area

3. Data and Materials
3.1. Remote Sensing Imagery

| Month | 2000 | 2001 | 2002 | 2003 | 2004 | 2005 | 2006 | 2007 | 2008 | 2009 | 2010 | 2011 | 2012 |
|---|---|---|---|---|---|---|---|---|---|---|---|---|---|
| January | - | 1 | 1 | 5 | 1 | 1 | 4 | 3 | 2 | 3 | 1 | 1 | 1 |
| February | 1 | 2 | 4 | 3 | 2 | 0 | 0 | 1 | 2 | 1 | 1 | 2 | 0 |
| March | 2 | 2 | 2 | 3 | 4 | 3 | 1 | 2 | 3 | 2 | 2 | 1 | 3 |
| April | 2 | 1 | 1 | 5 | 5 | 7 | 2 | 6 | 1 | 2 | 2 | 2 | 3 |
| May | 6 | 3 | 2 | 3 | 3 | 0 | 3 | 4 | 1 | 3 | 3 | 4 | 1 |
| June | 2 | 1 | 1 | 2 | 1 | 2 | 3 | 0 | 1 | 4 | 0 | 0 | 0 |
| July | 4 | 3 | 5 | 8 | 4 | 5 | 1 | 3 | 1 | 3 | 1 | 6 | 3 |
| August | 1 | 1 | 4 | 4 | 3 | 2 | 3 | 1 | 0 | 3 | 6 | 3 | 1 |
| September | 5 | 10 | 3 | 4 | 5 | 6 | 6 | 4 | 1 | 2 | 3 | 0 | 4 |
| October | 1 | 1 | 6 | 4 | 5 | 4 | 2 | 1 | 4 | 4 | 4 | 3 | 4 |
| November | 7 | 9 | 5 | 6 | 2 | 2 | 5 | 6 | 3 | 6 | 5 | 3 | 4 |
| December | 1 | 2 | 0 | 0 | 5 | 6 | 7 | 1 | 5 | 0 | 7 | 4 | 4 |
| Cloudless | 32 | 36 | 34 | 47 | 40 | 38 | 37 | 32 | 24 | 33 | 35 | 29 | 28 |
| Total | 293 | 346 | 355 | 356 | 364 | 364 | 364 | 365 | 361 | 364 | 365 | 365 | 366 |
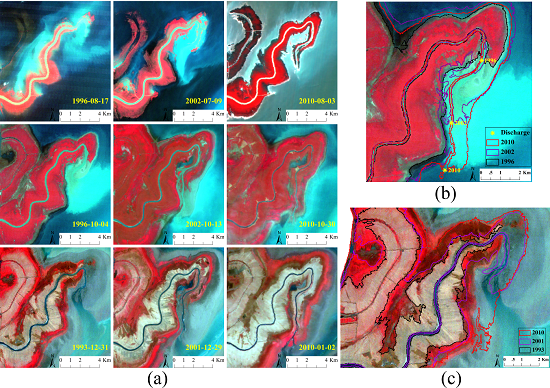
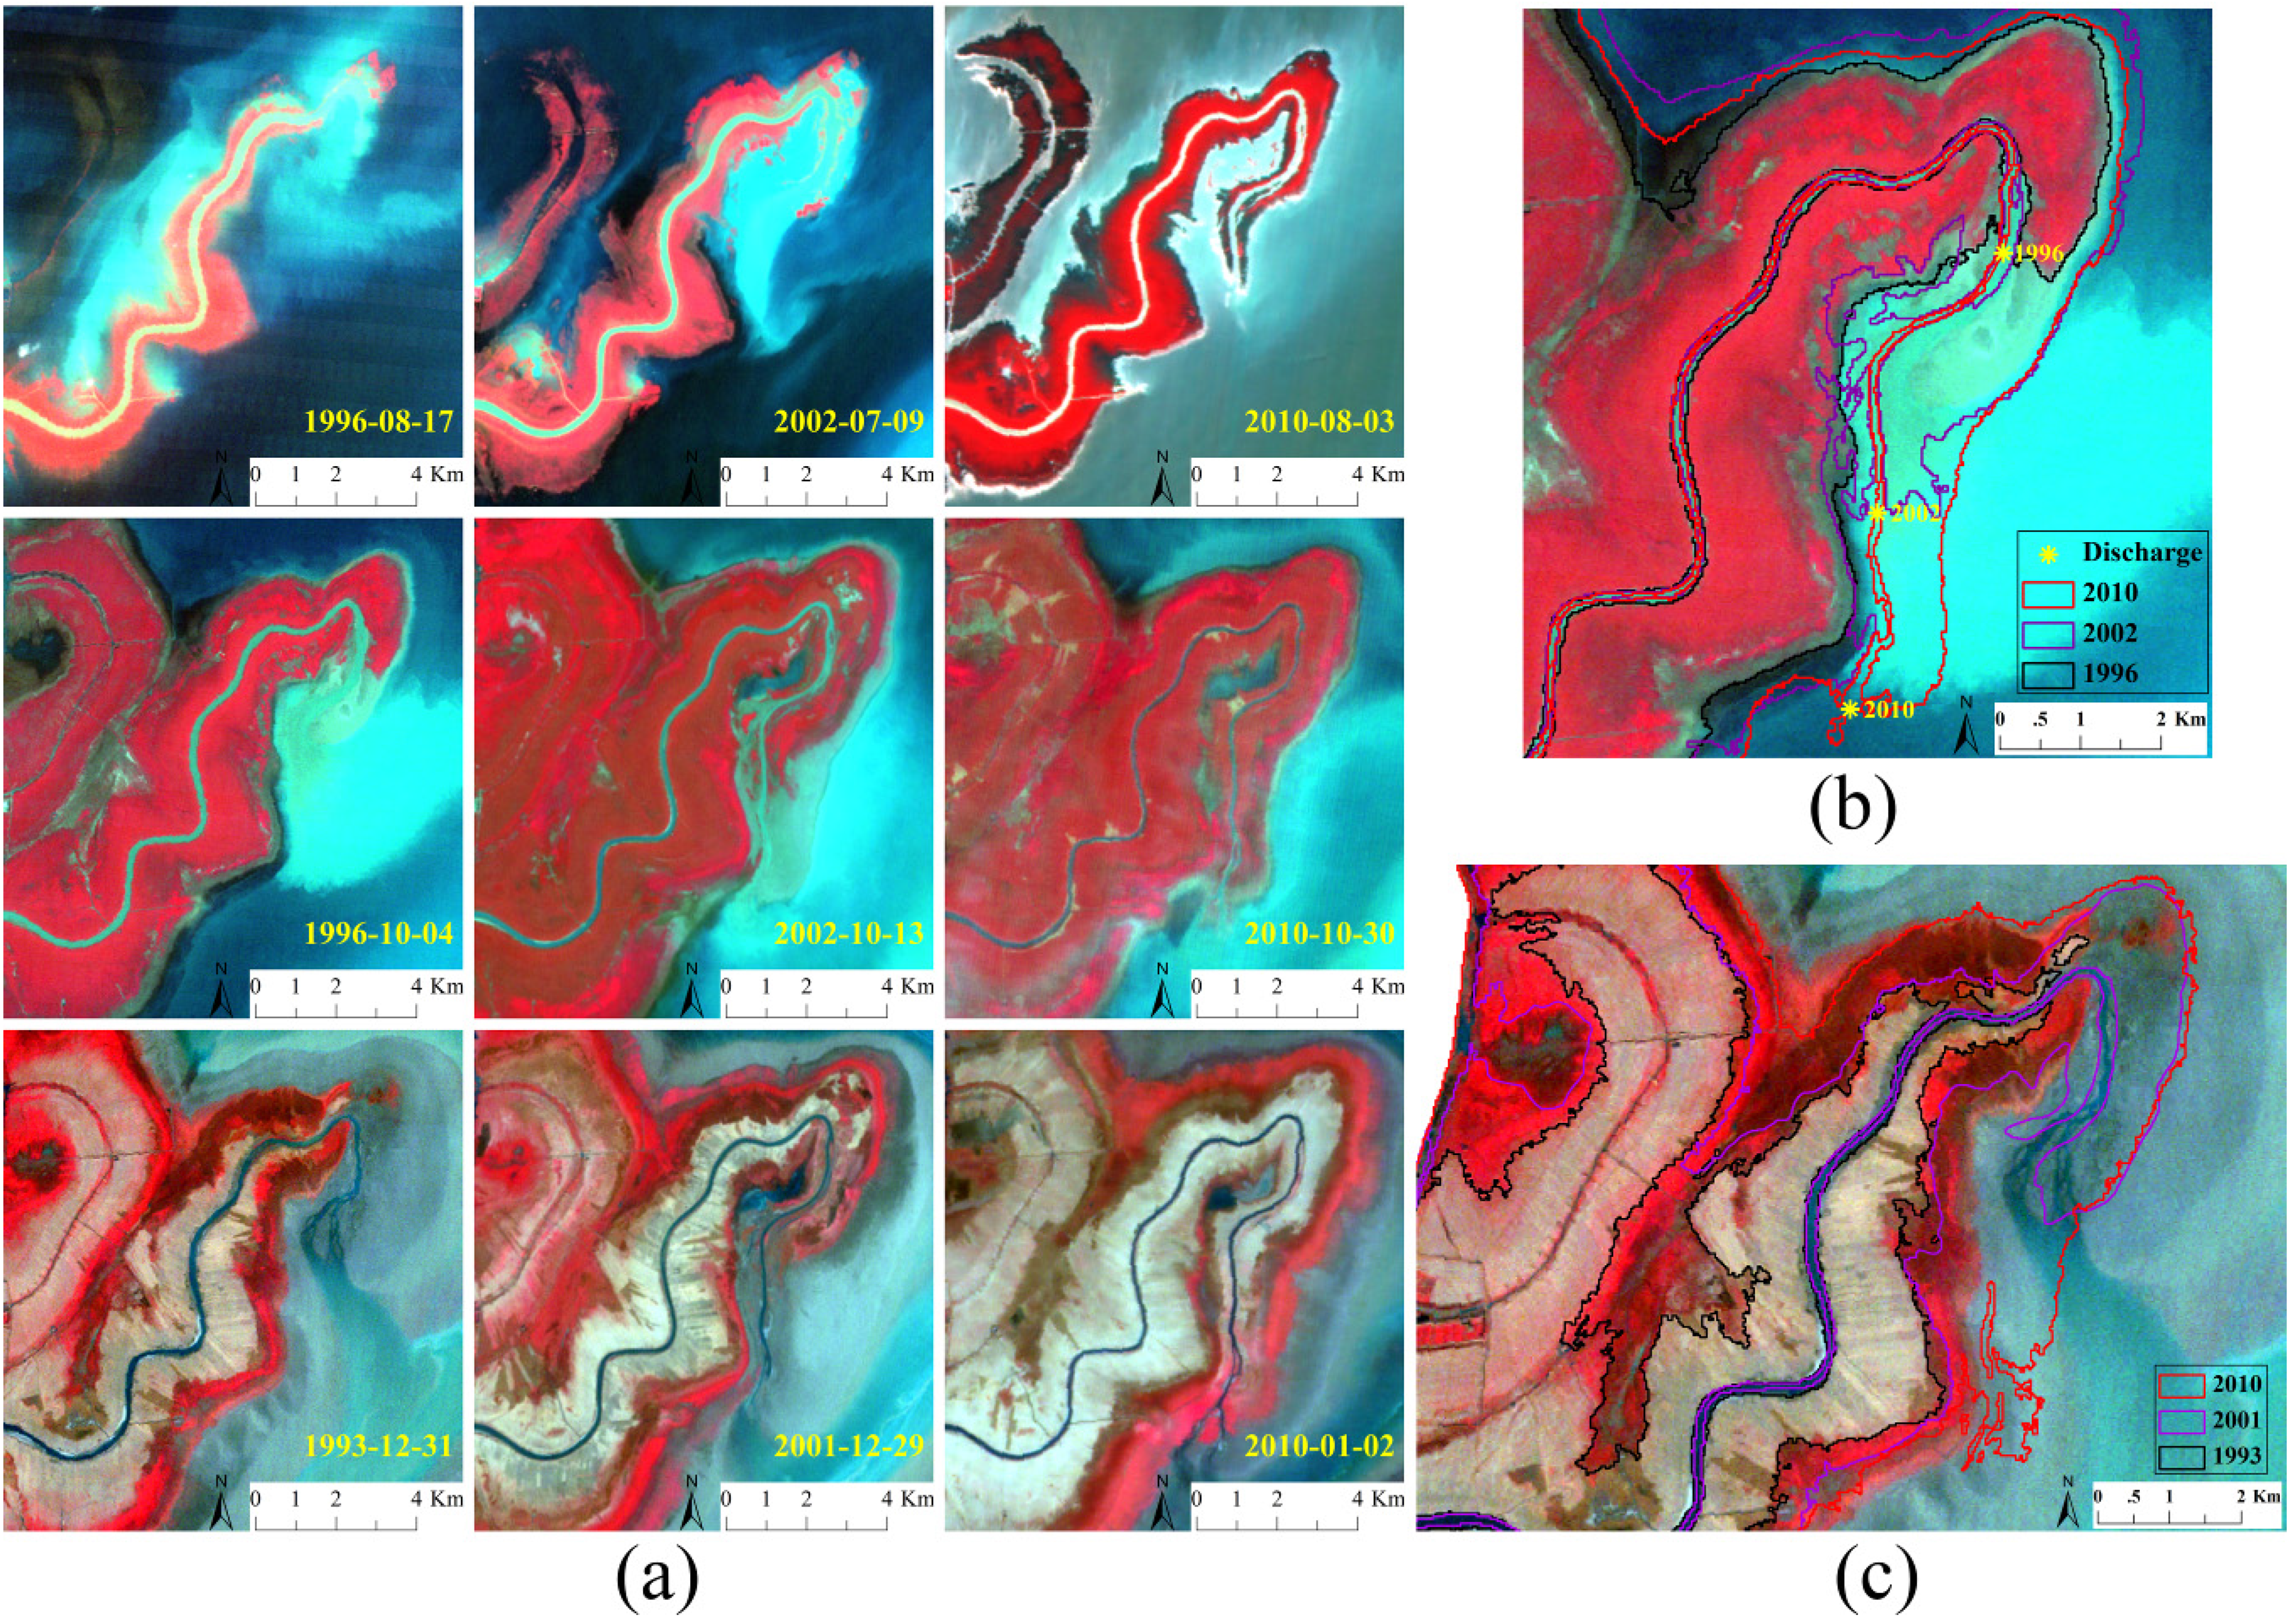
| Period | Path/Row | Date | Landsat |
|---|---|---|---|
| The flood season | 123/40 | 08/17/1996 07/09/2002 08/03/2010 | TM ETM+ TM |
| The normal season | 123/40 | 10/04/1996 10/13/2002 10/30/2010 | TM ETM+ TM |
| The dry season | 123/40 | 12/31/1993 12/29/2001 01/02/2010 | TM ETM+ TM |
3.2. Hydrological and Meteorological Monitoring Data
3.3. Auxiliary Data
4. Methods
4.1. Water Area Delineation
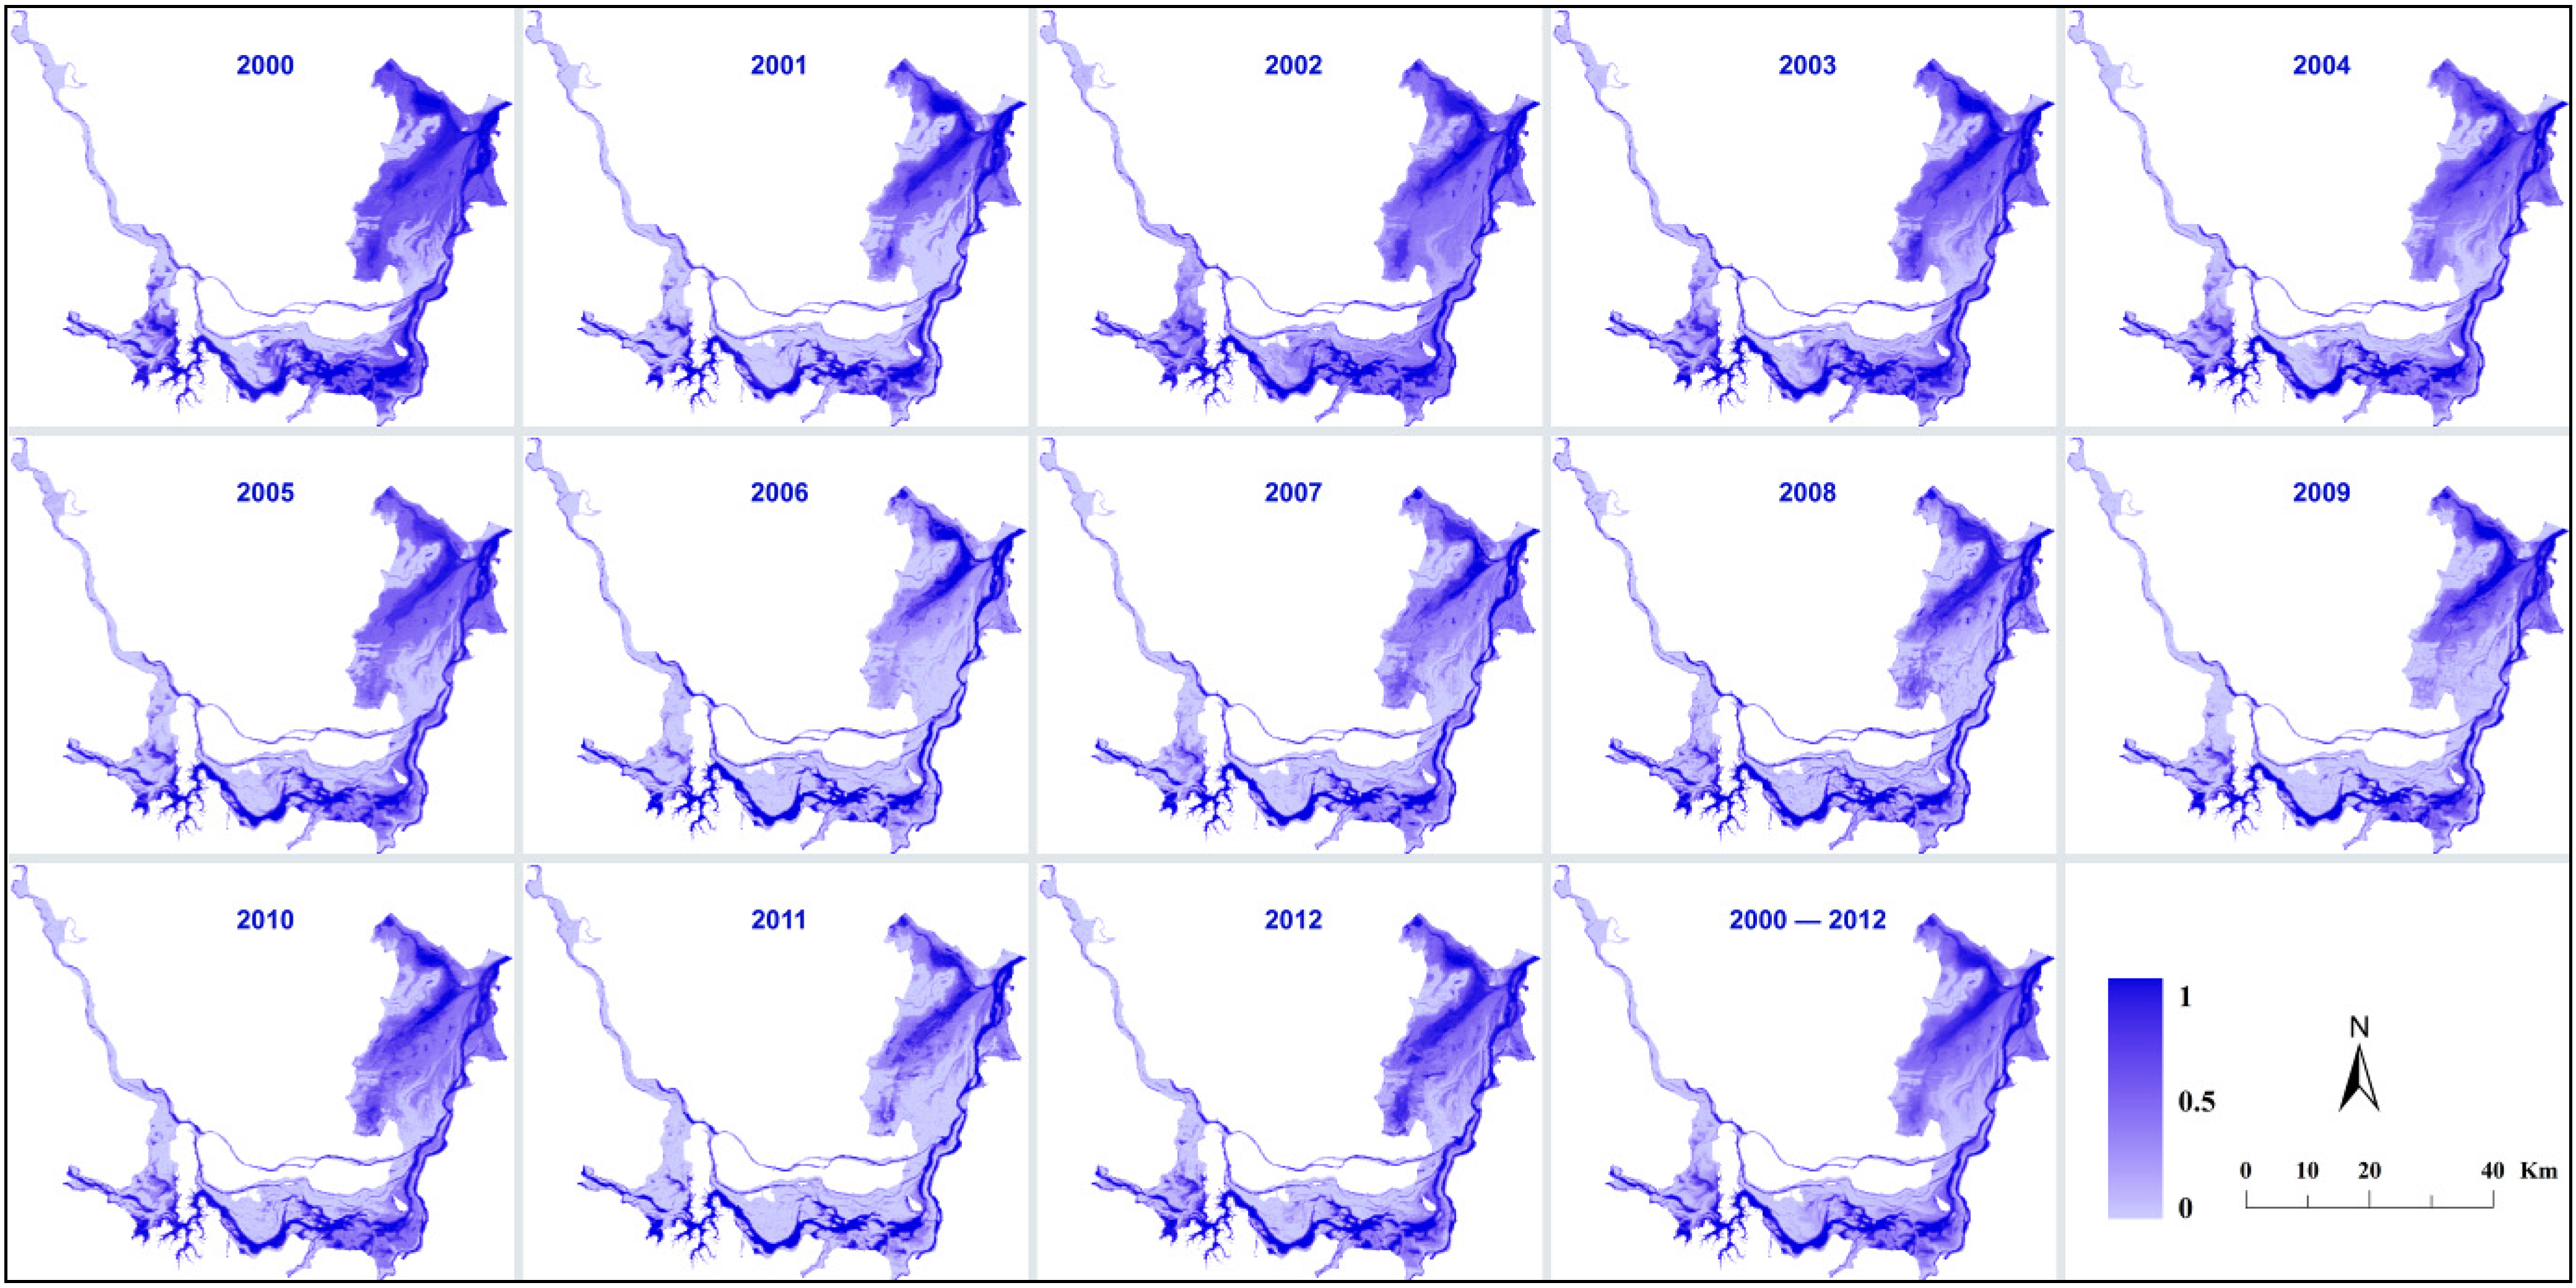
4.2. Flood Inundation Probability
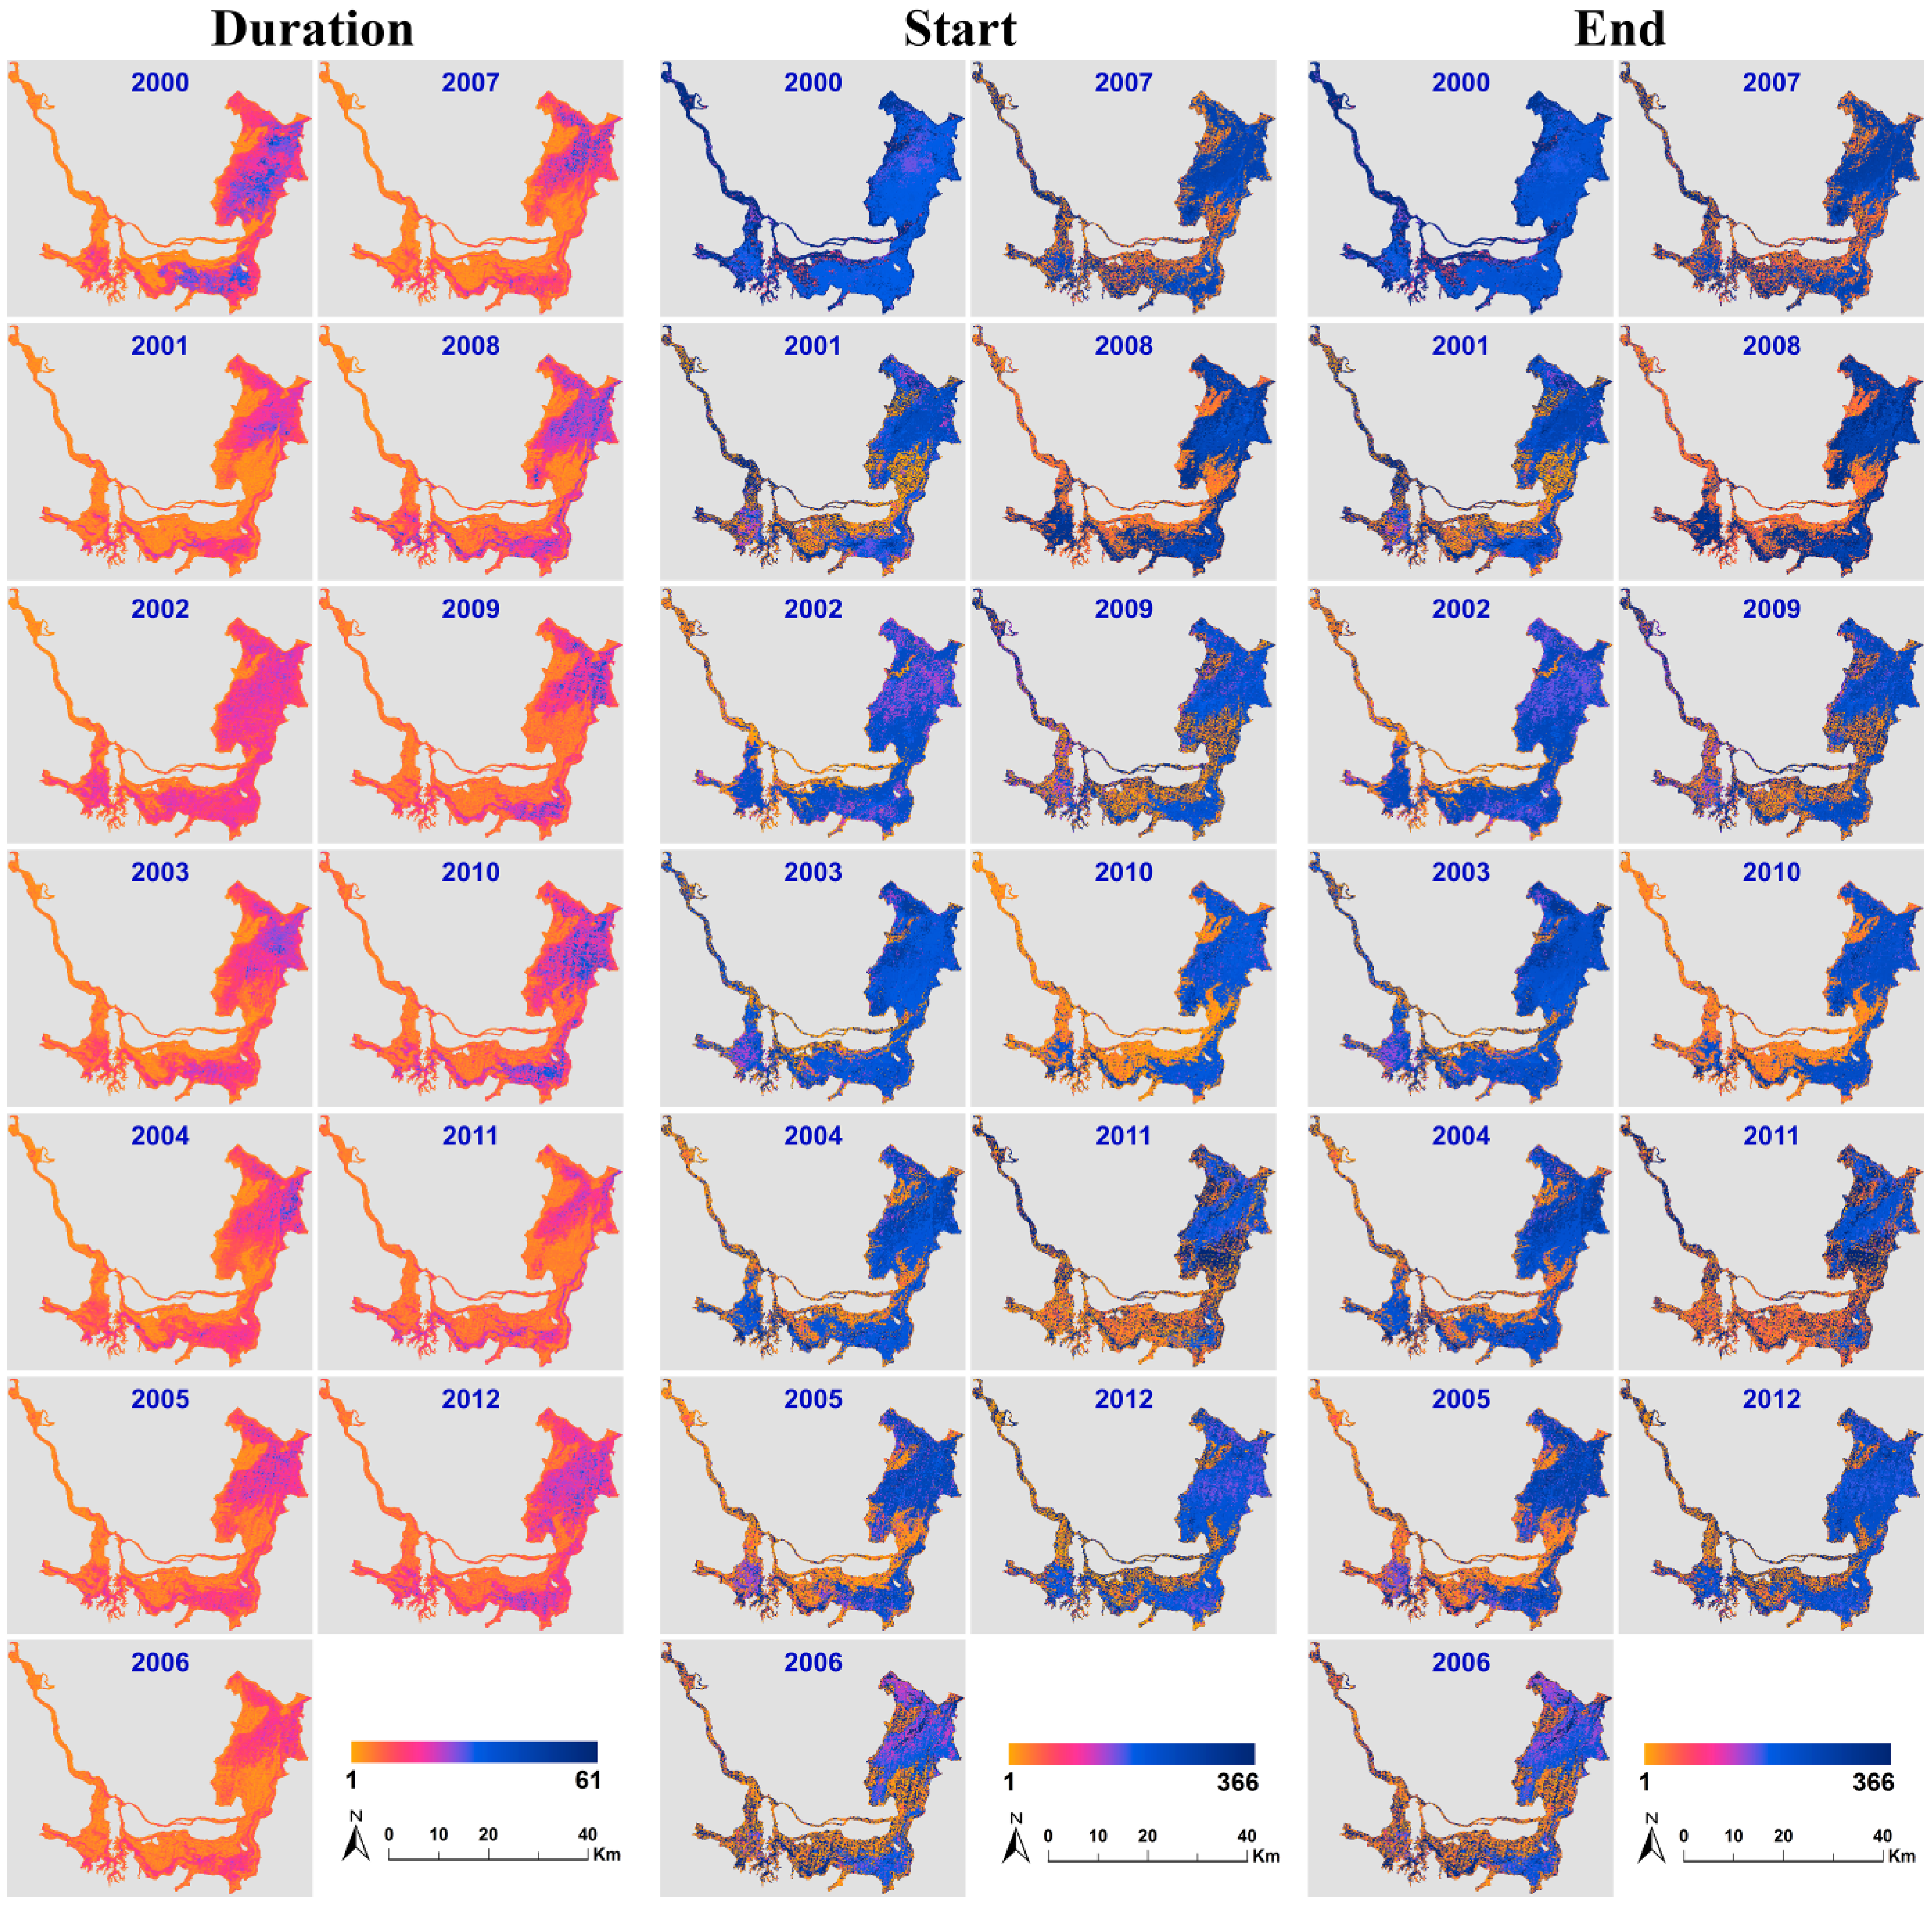
4.3. Duration and Start/End Date of the Annual Largest Flood
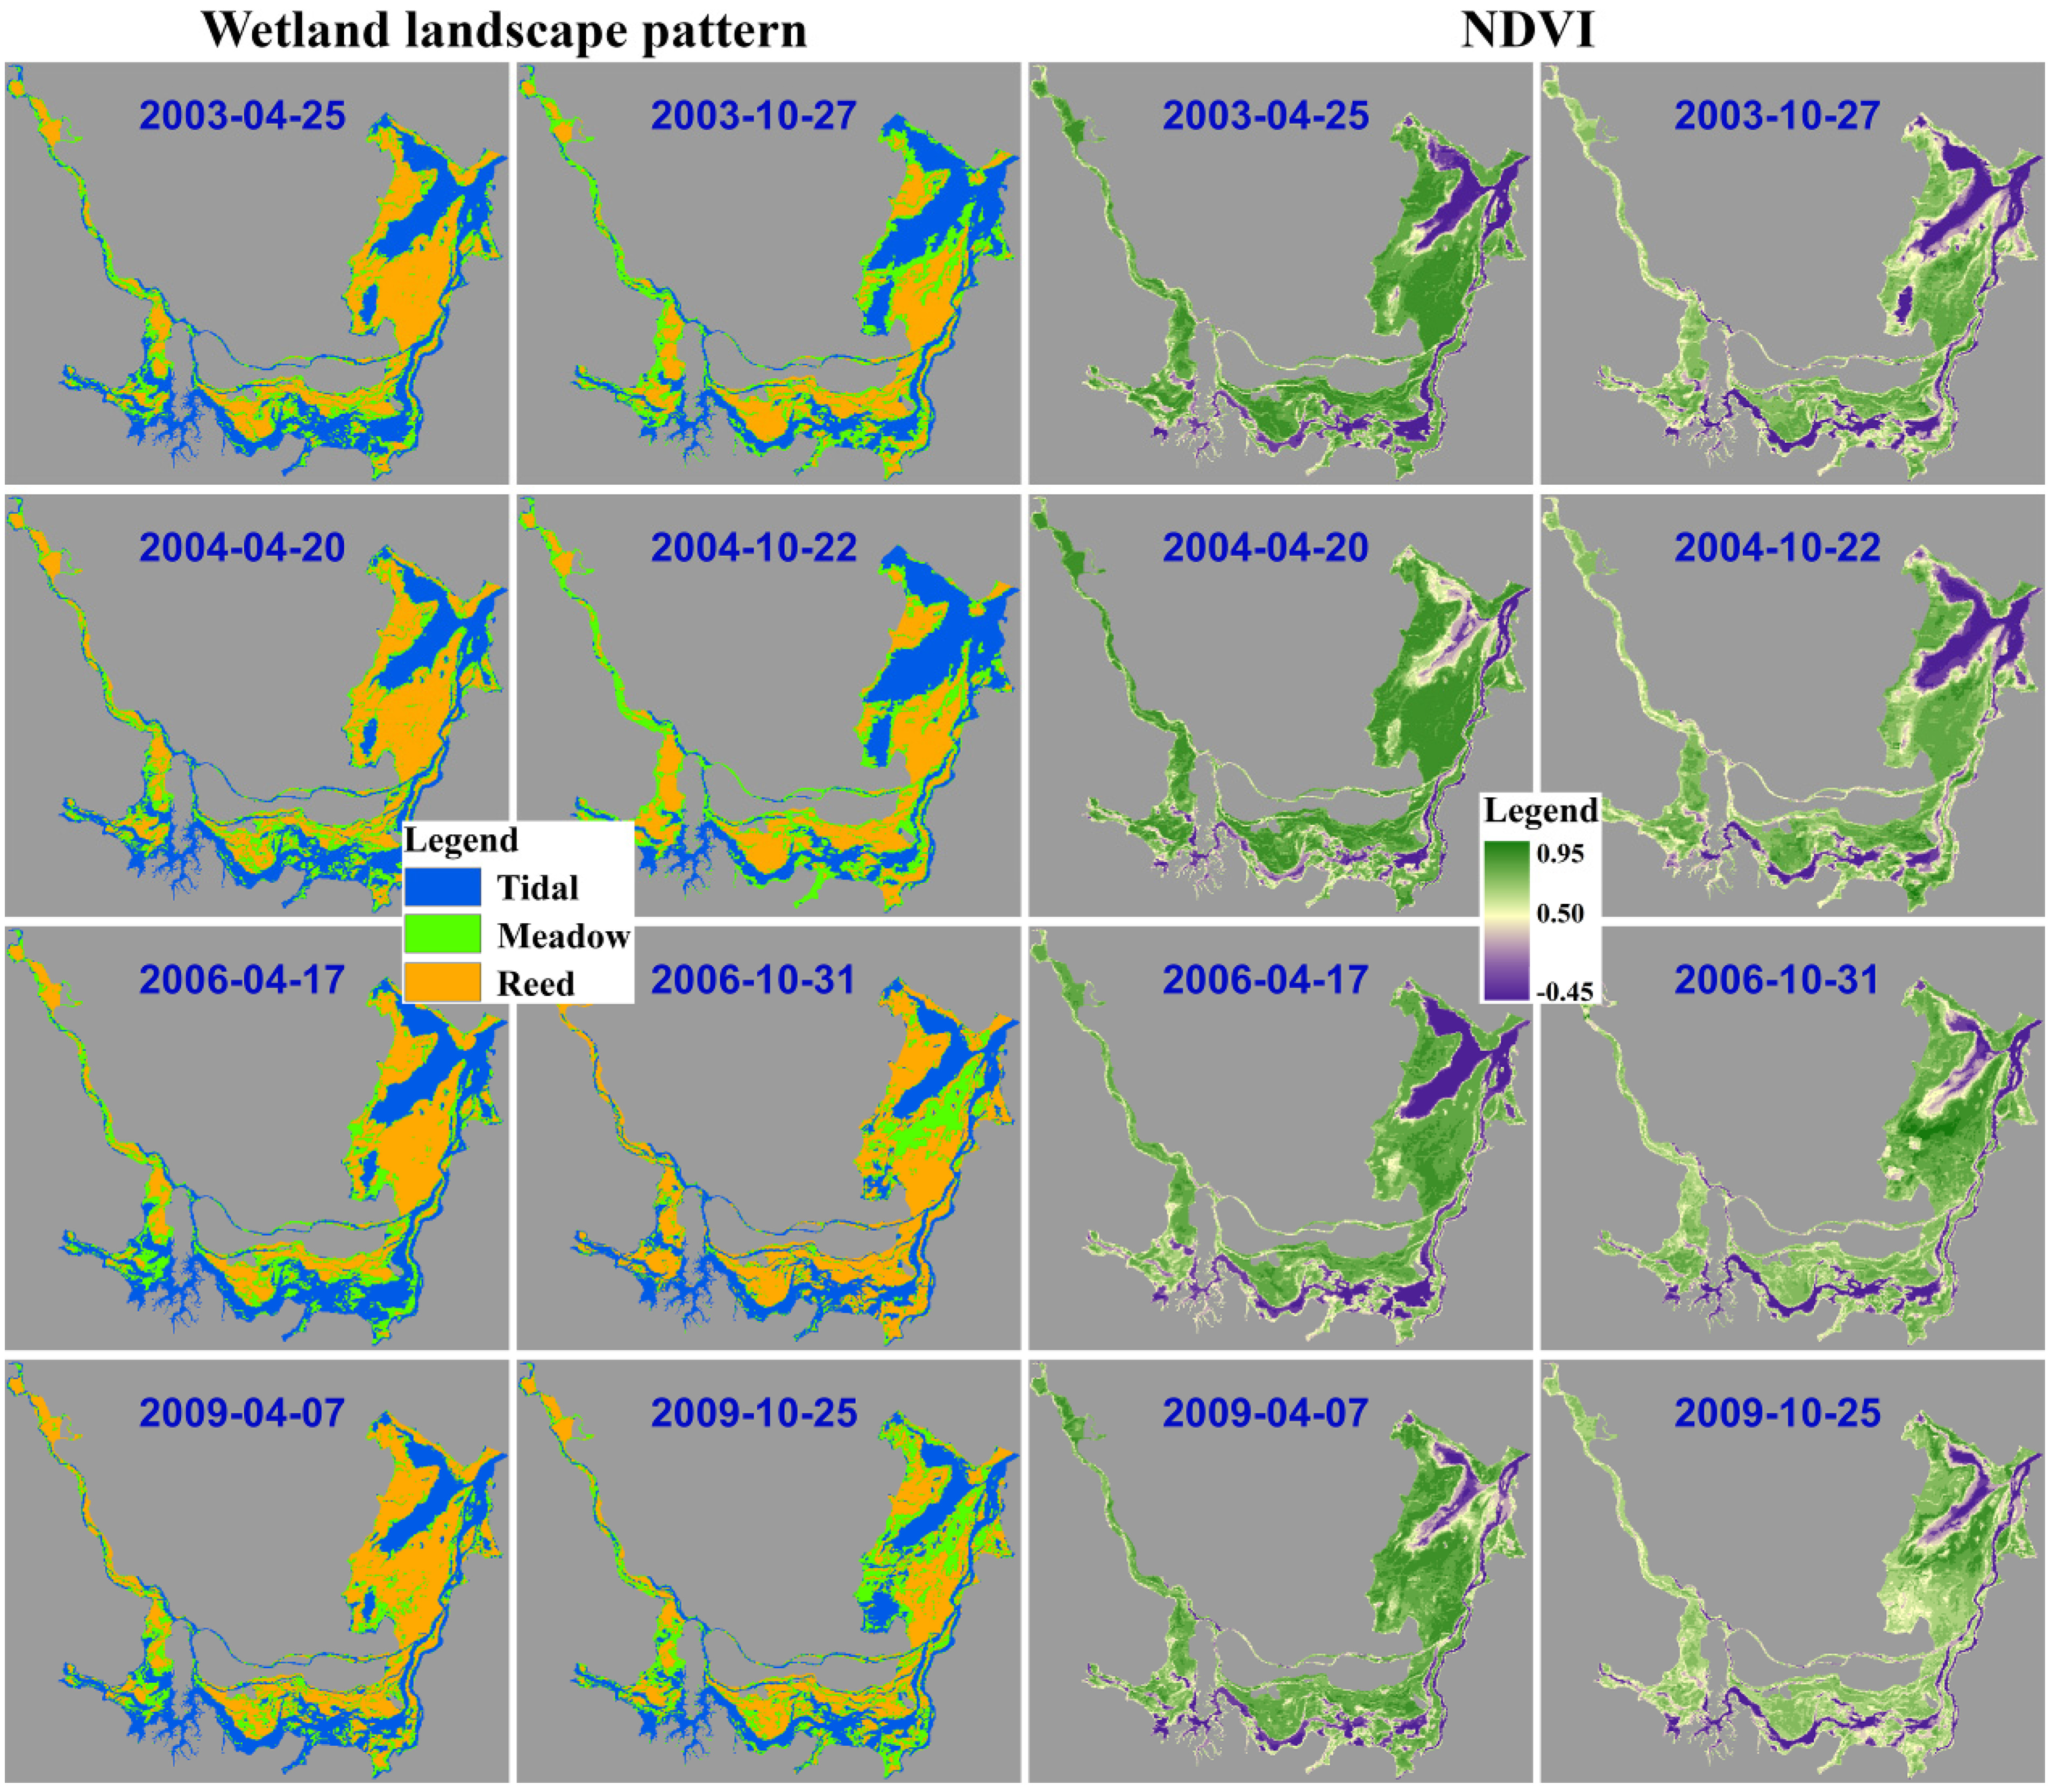
4.4. Wetland Landscape Patterns before and after the Flood Period
5. Results
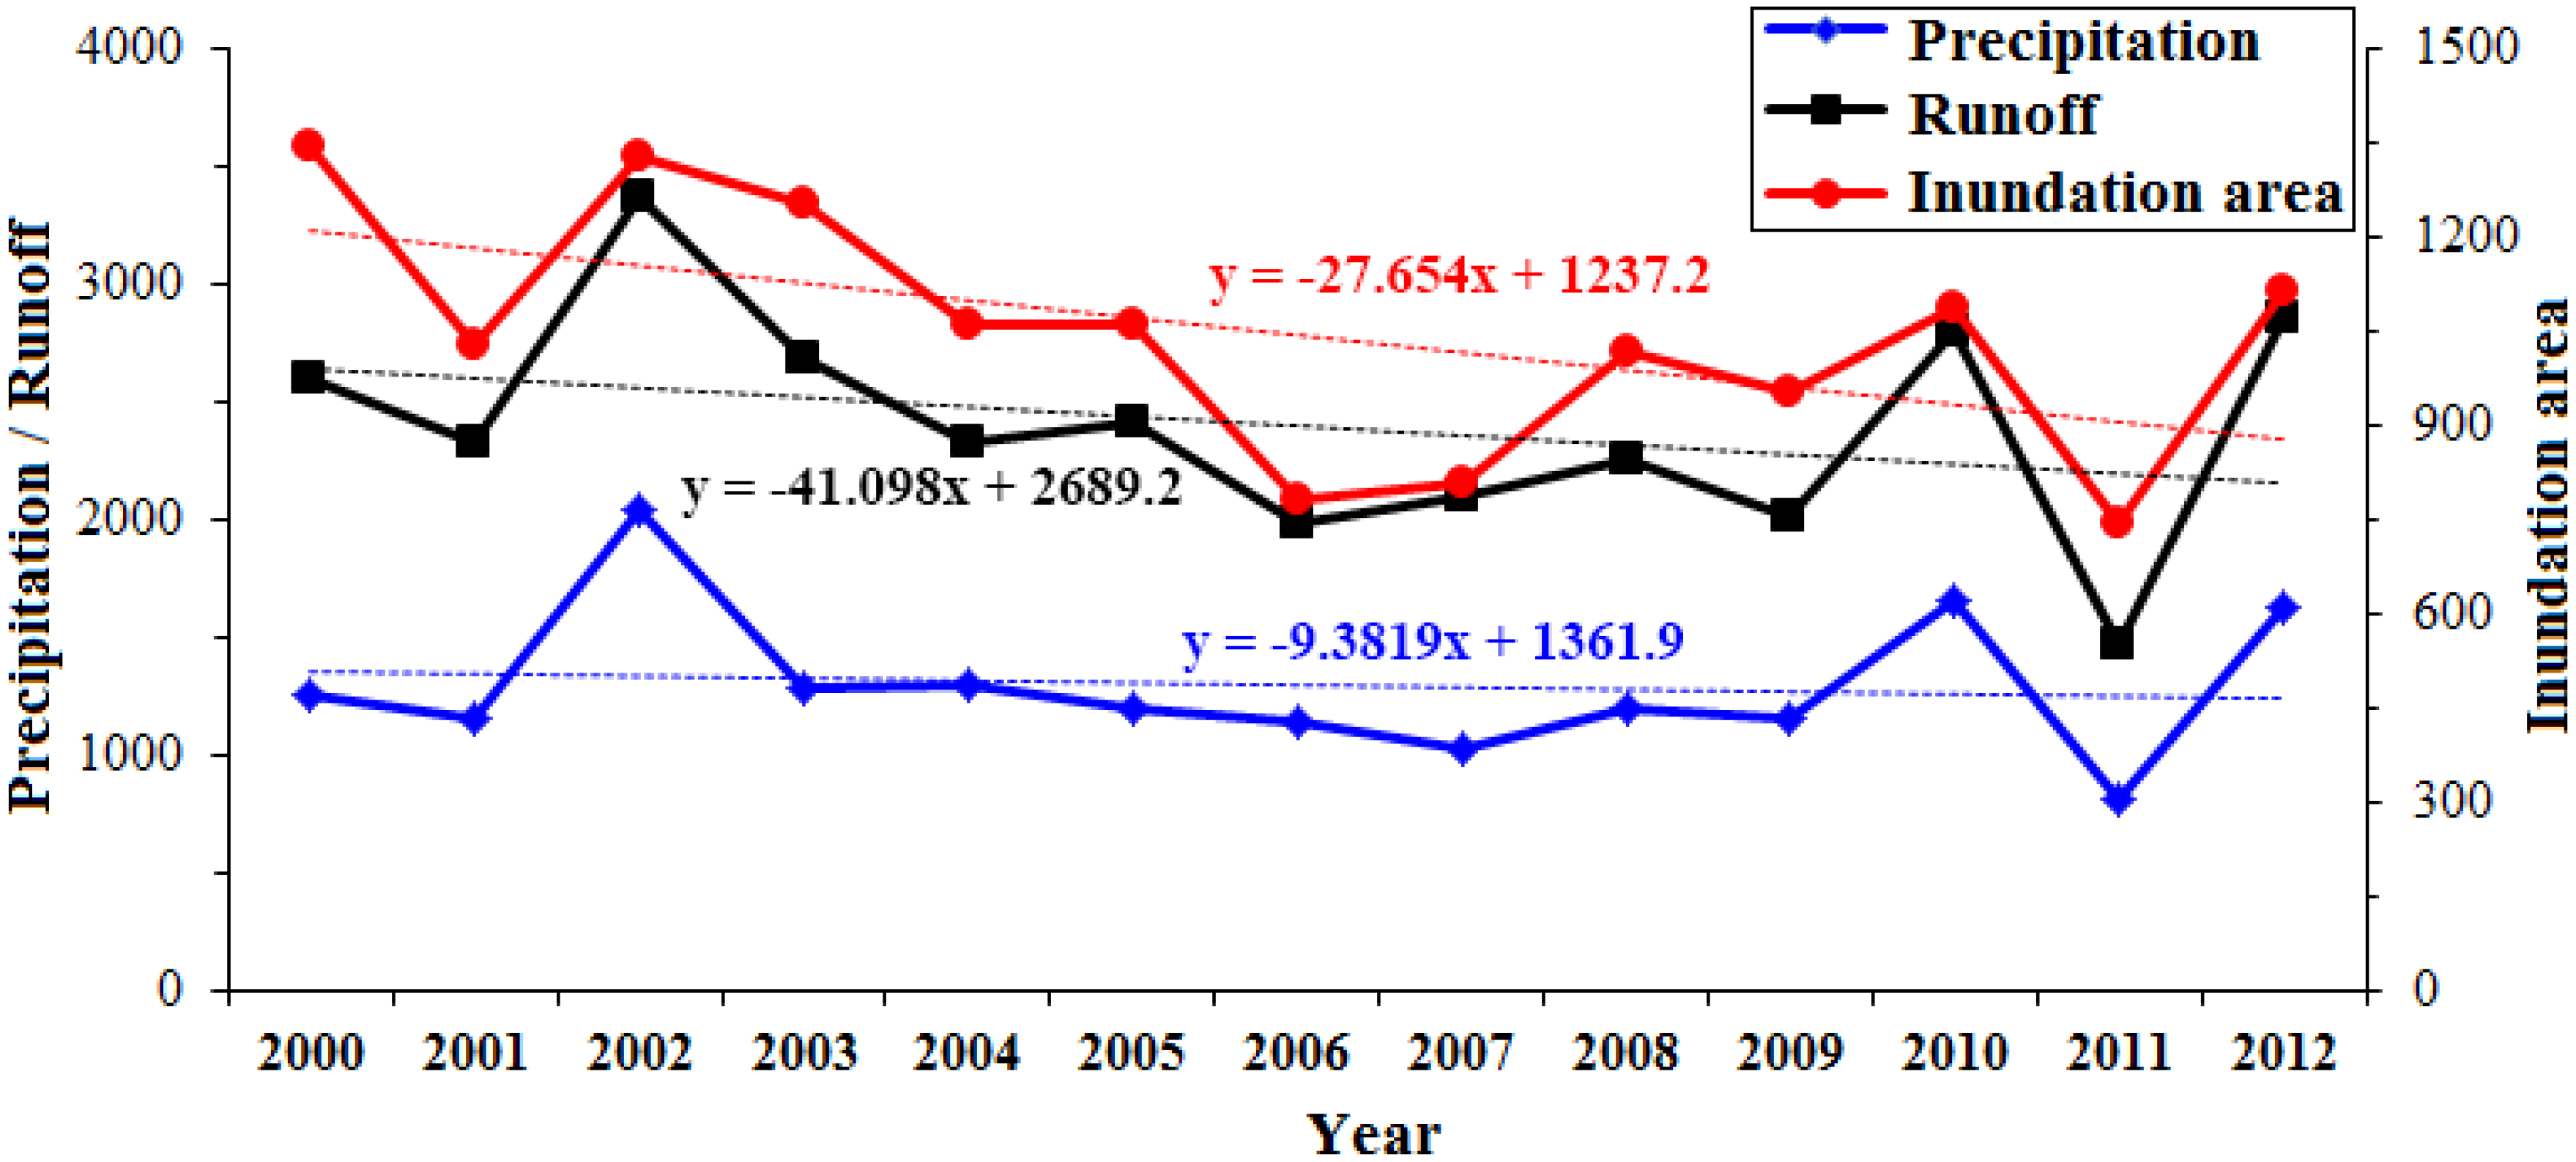
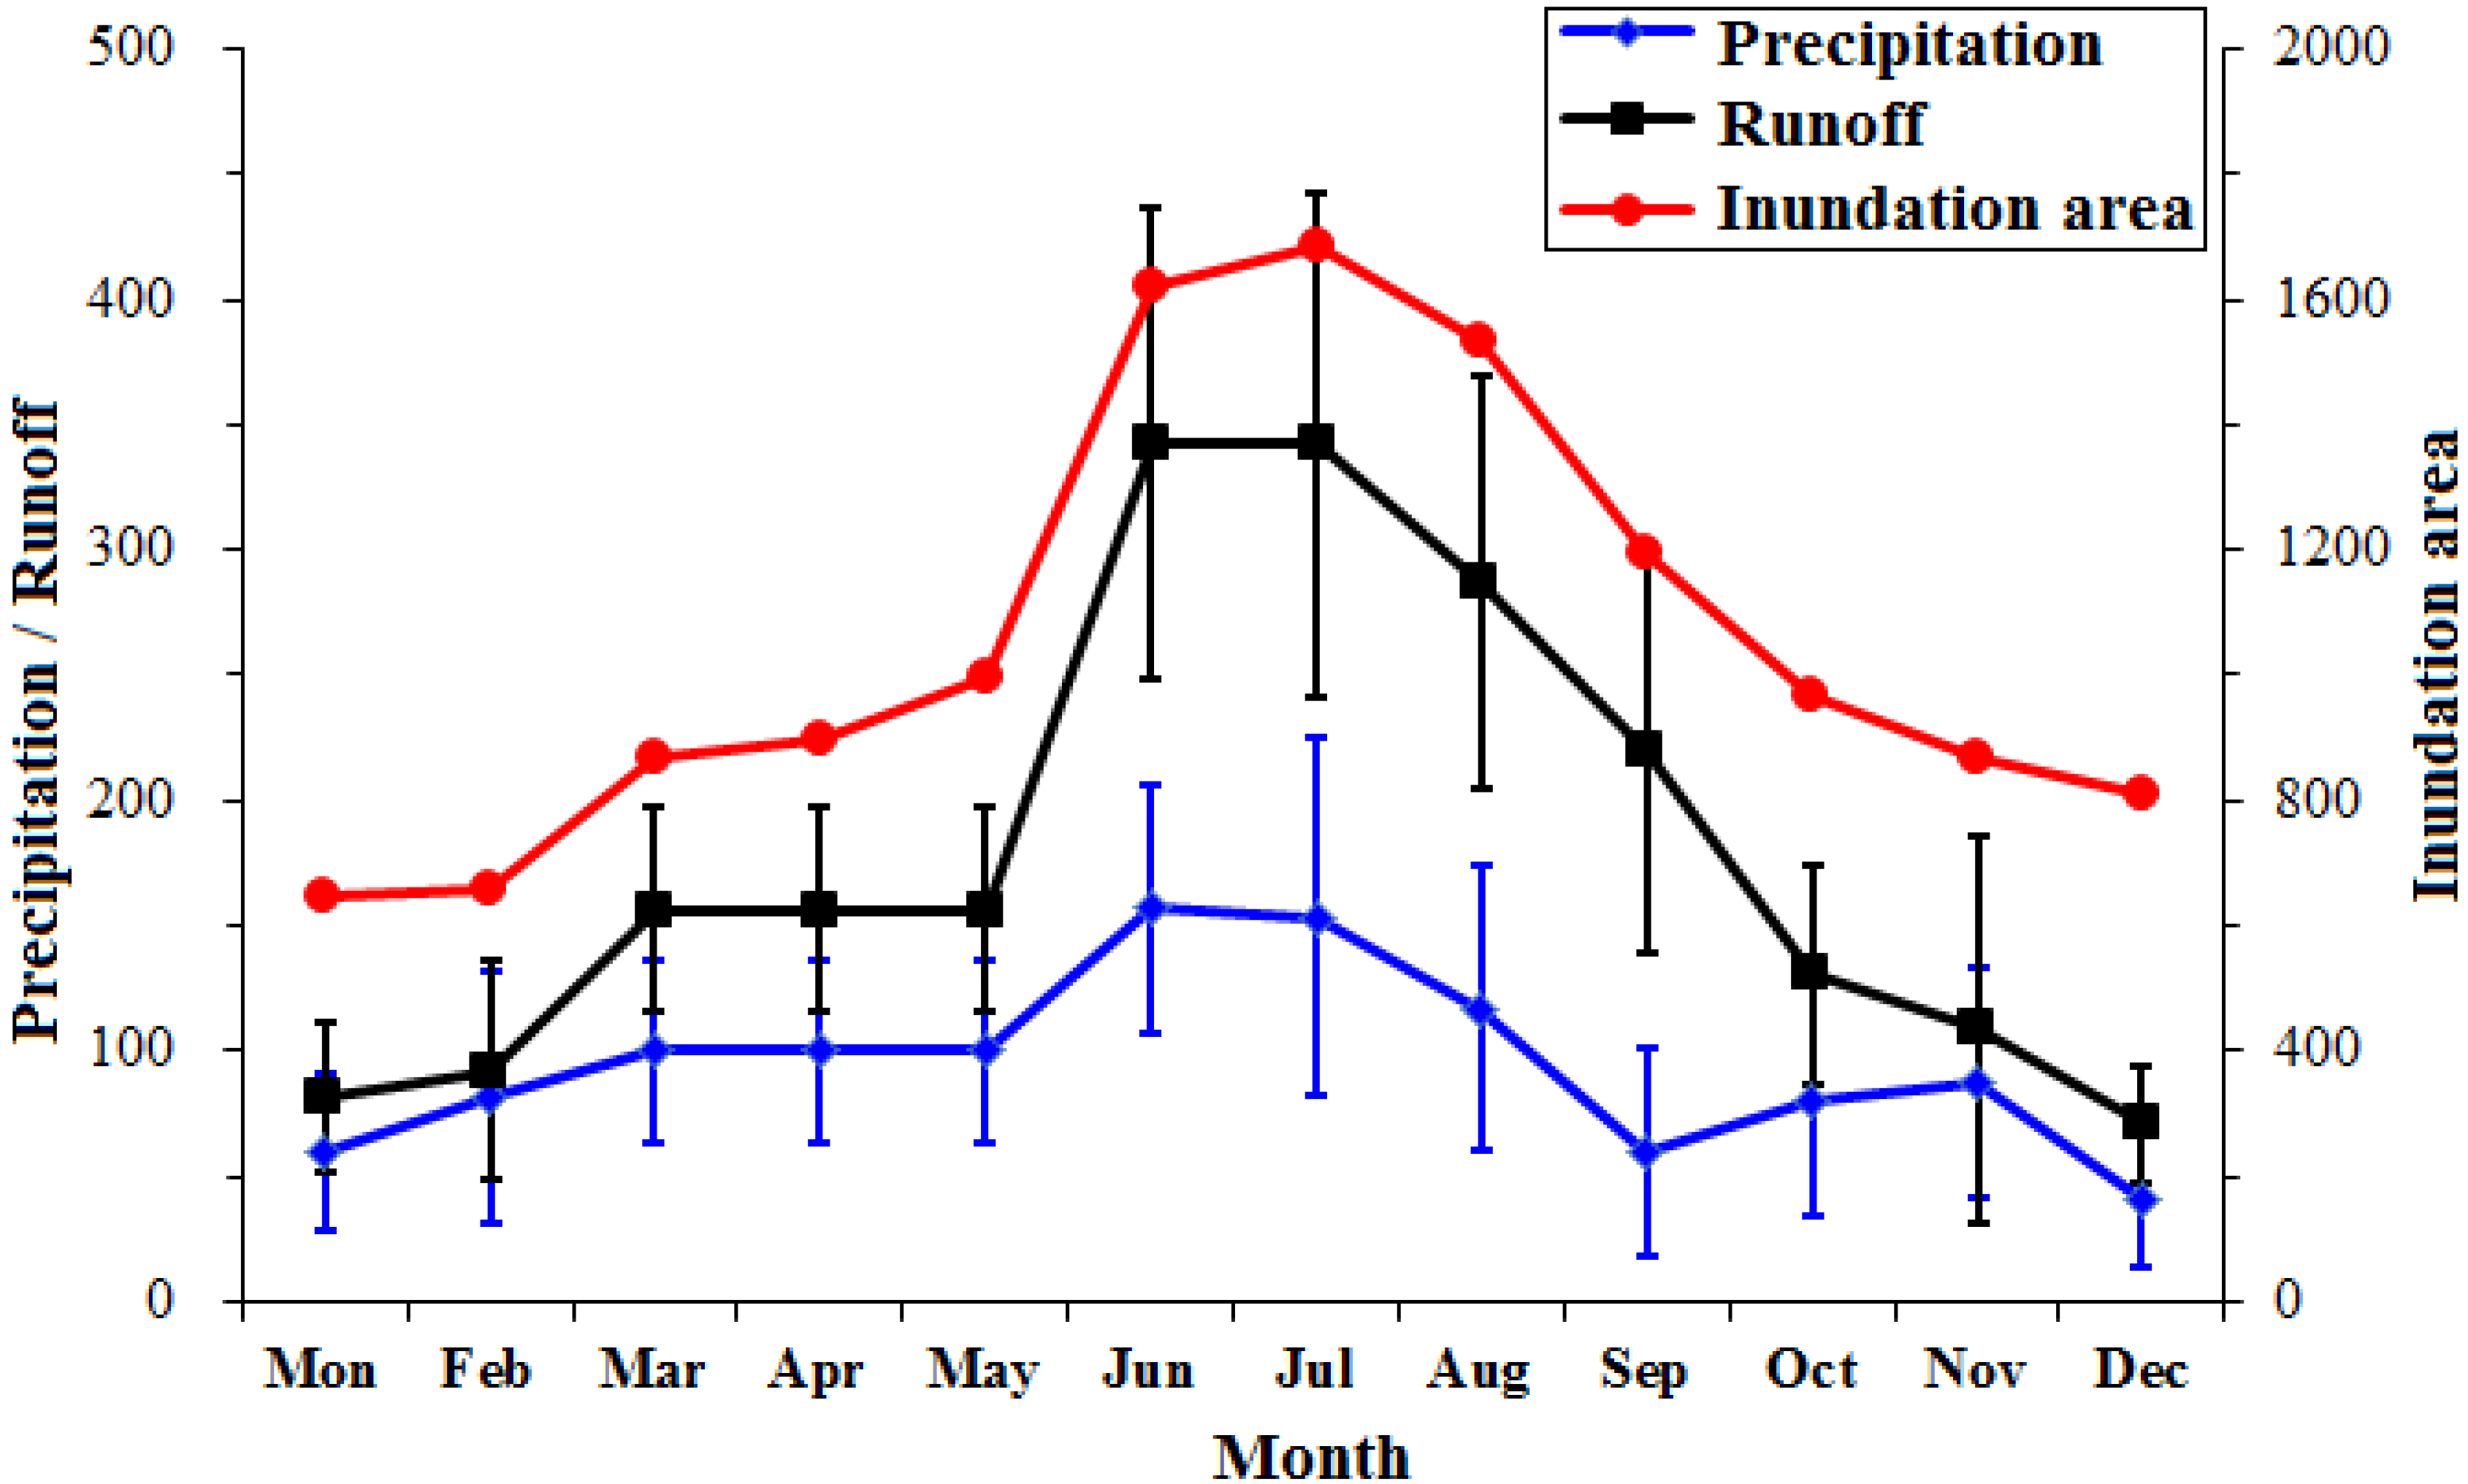
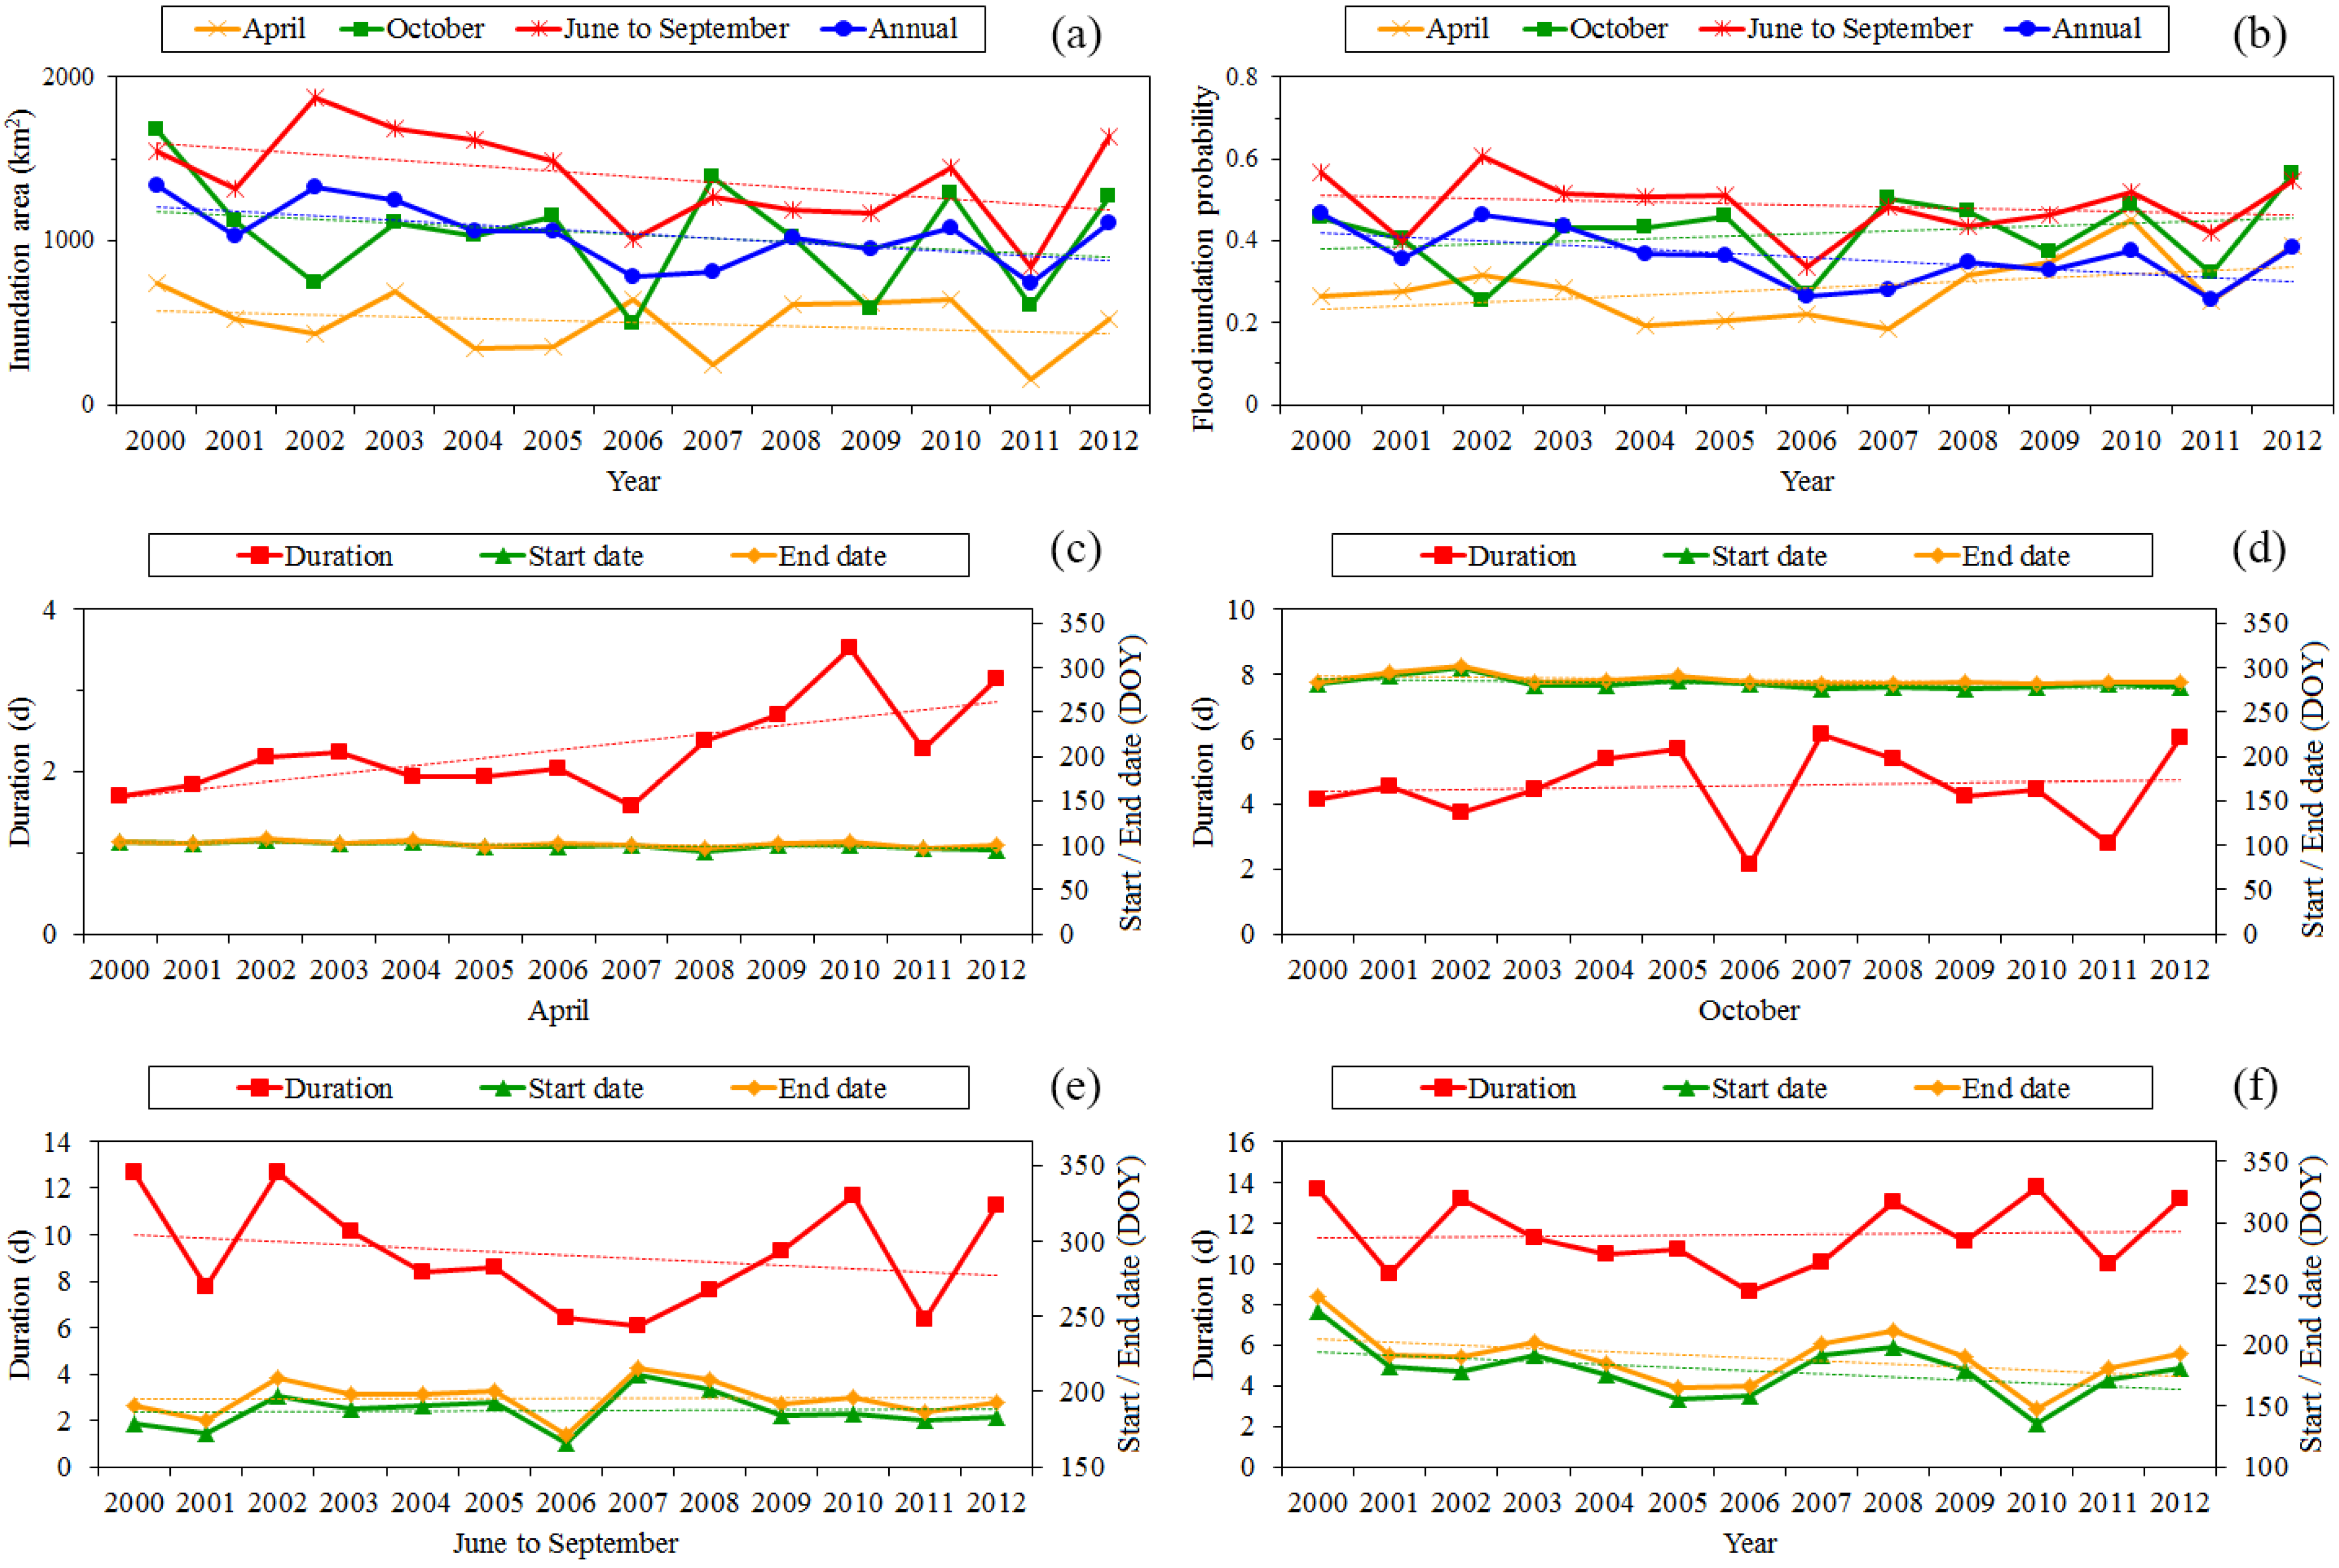
5.1. Inter-Annual and Seasonal Variations in Inundation Extents


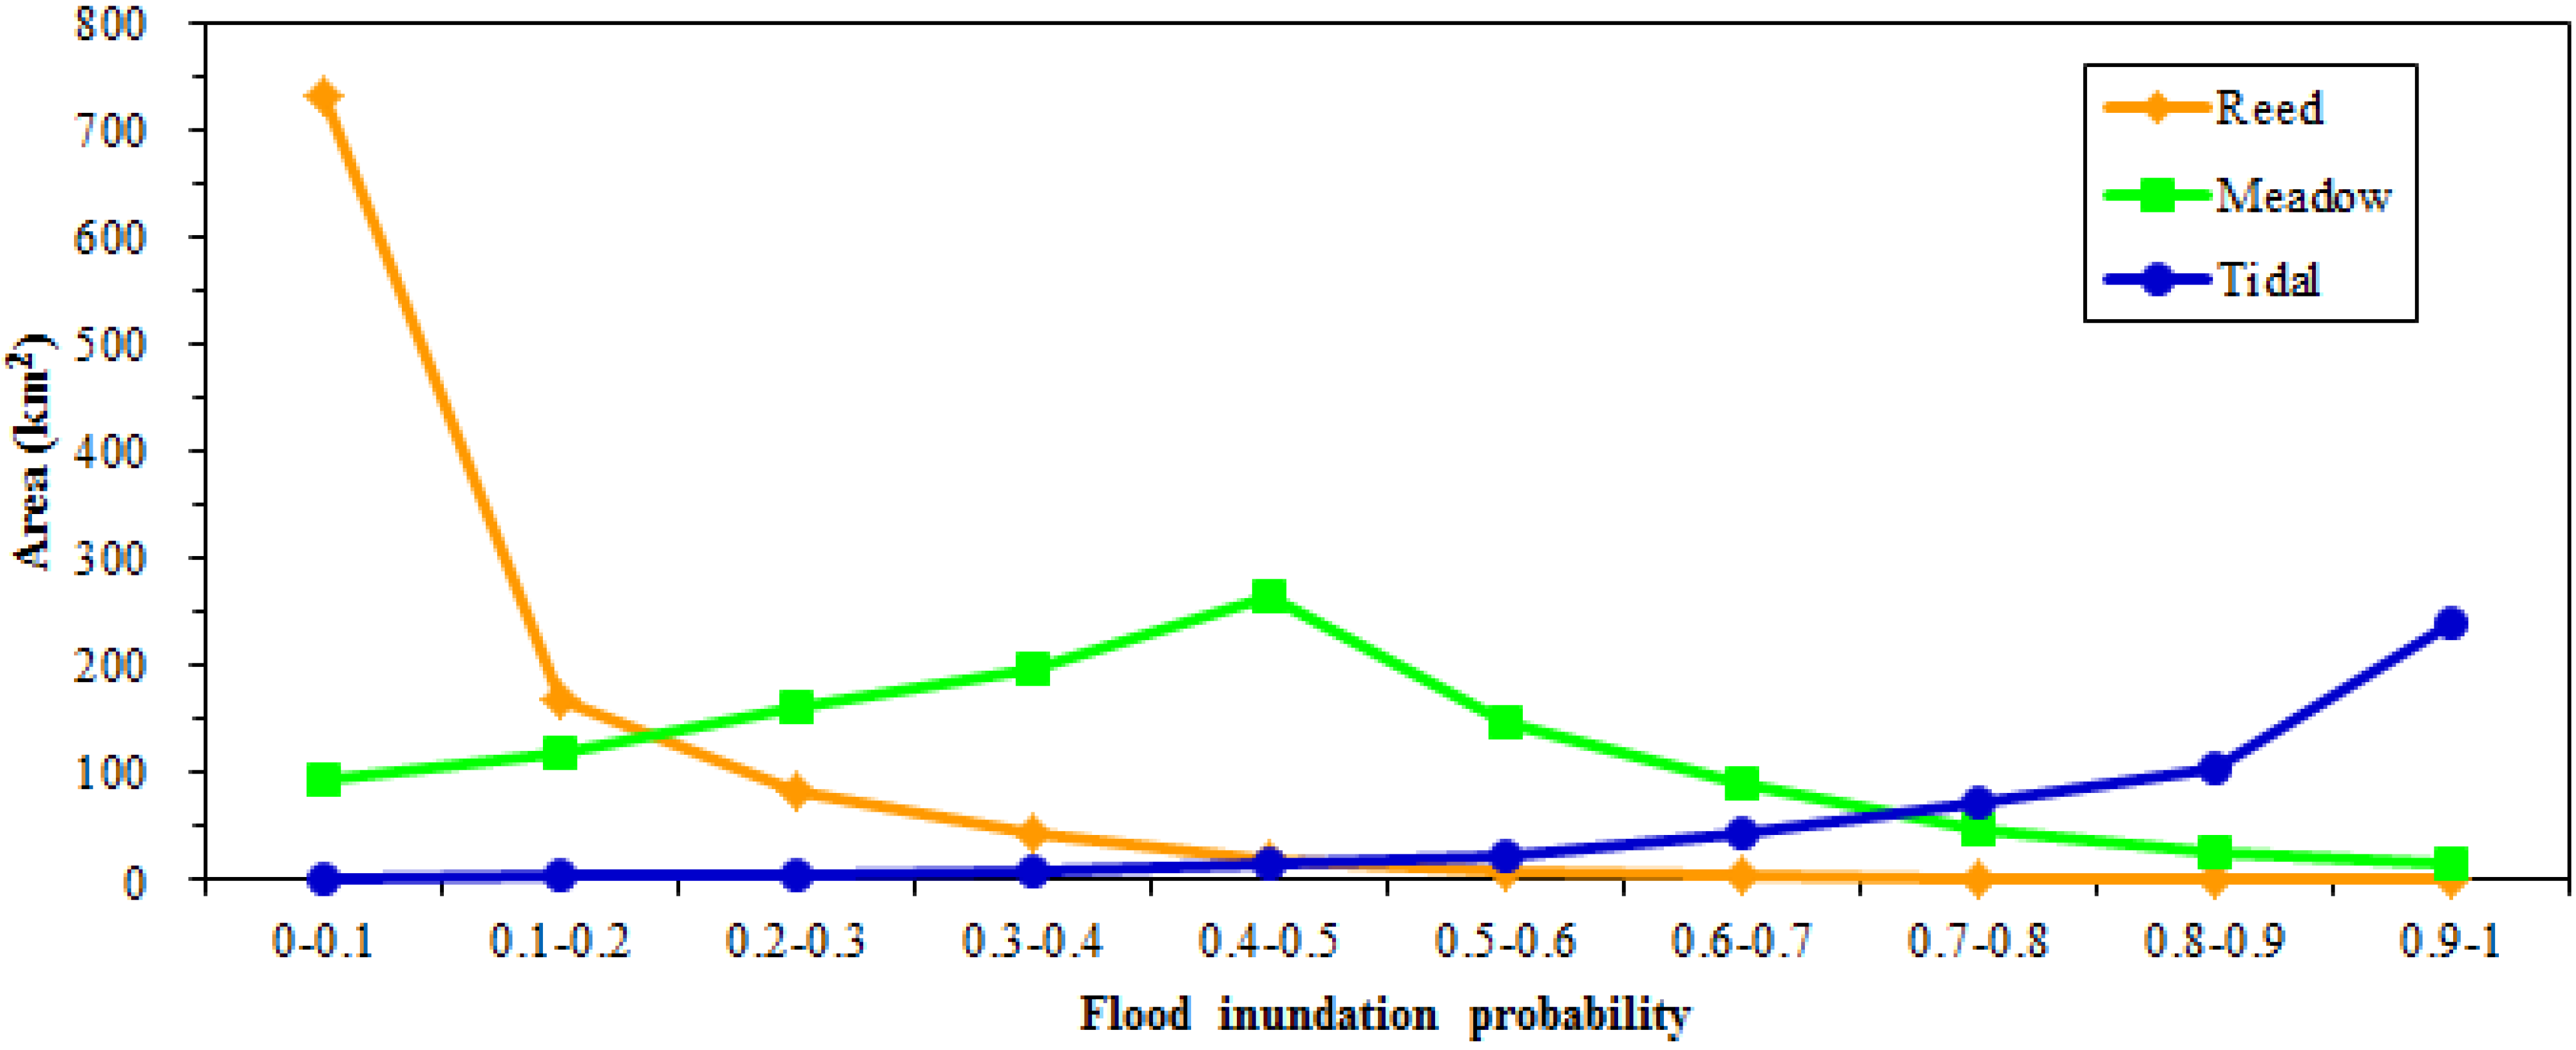
5.2. Flood Inundation Probability and Its Relation to Wetland Landscape Patterns

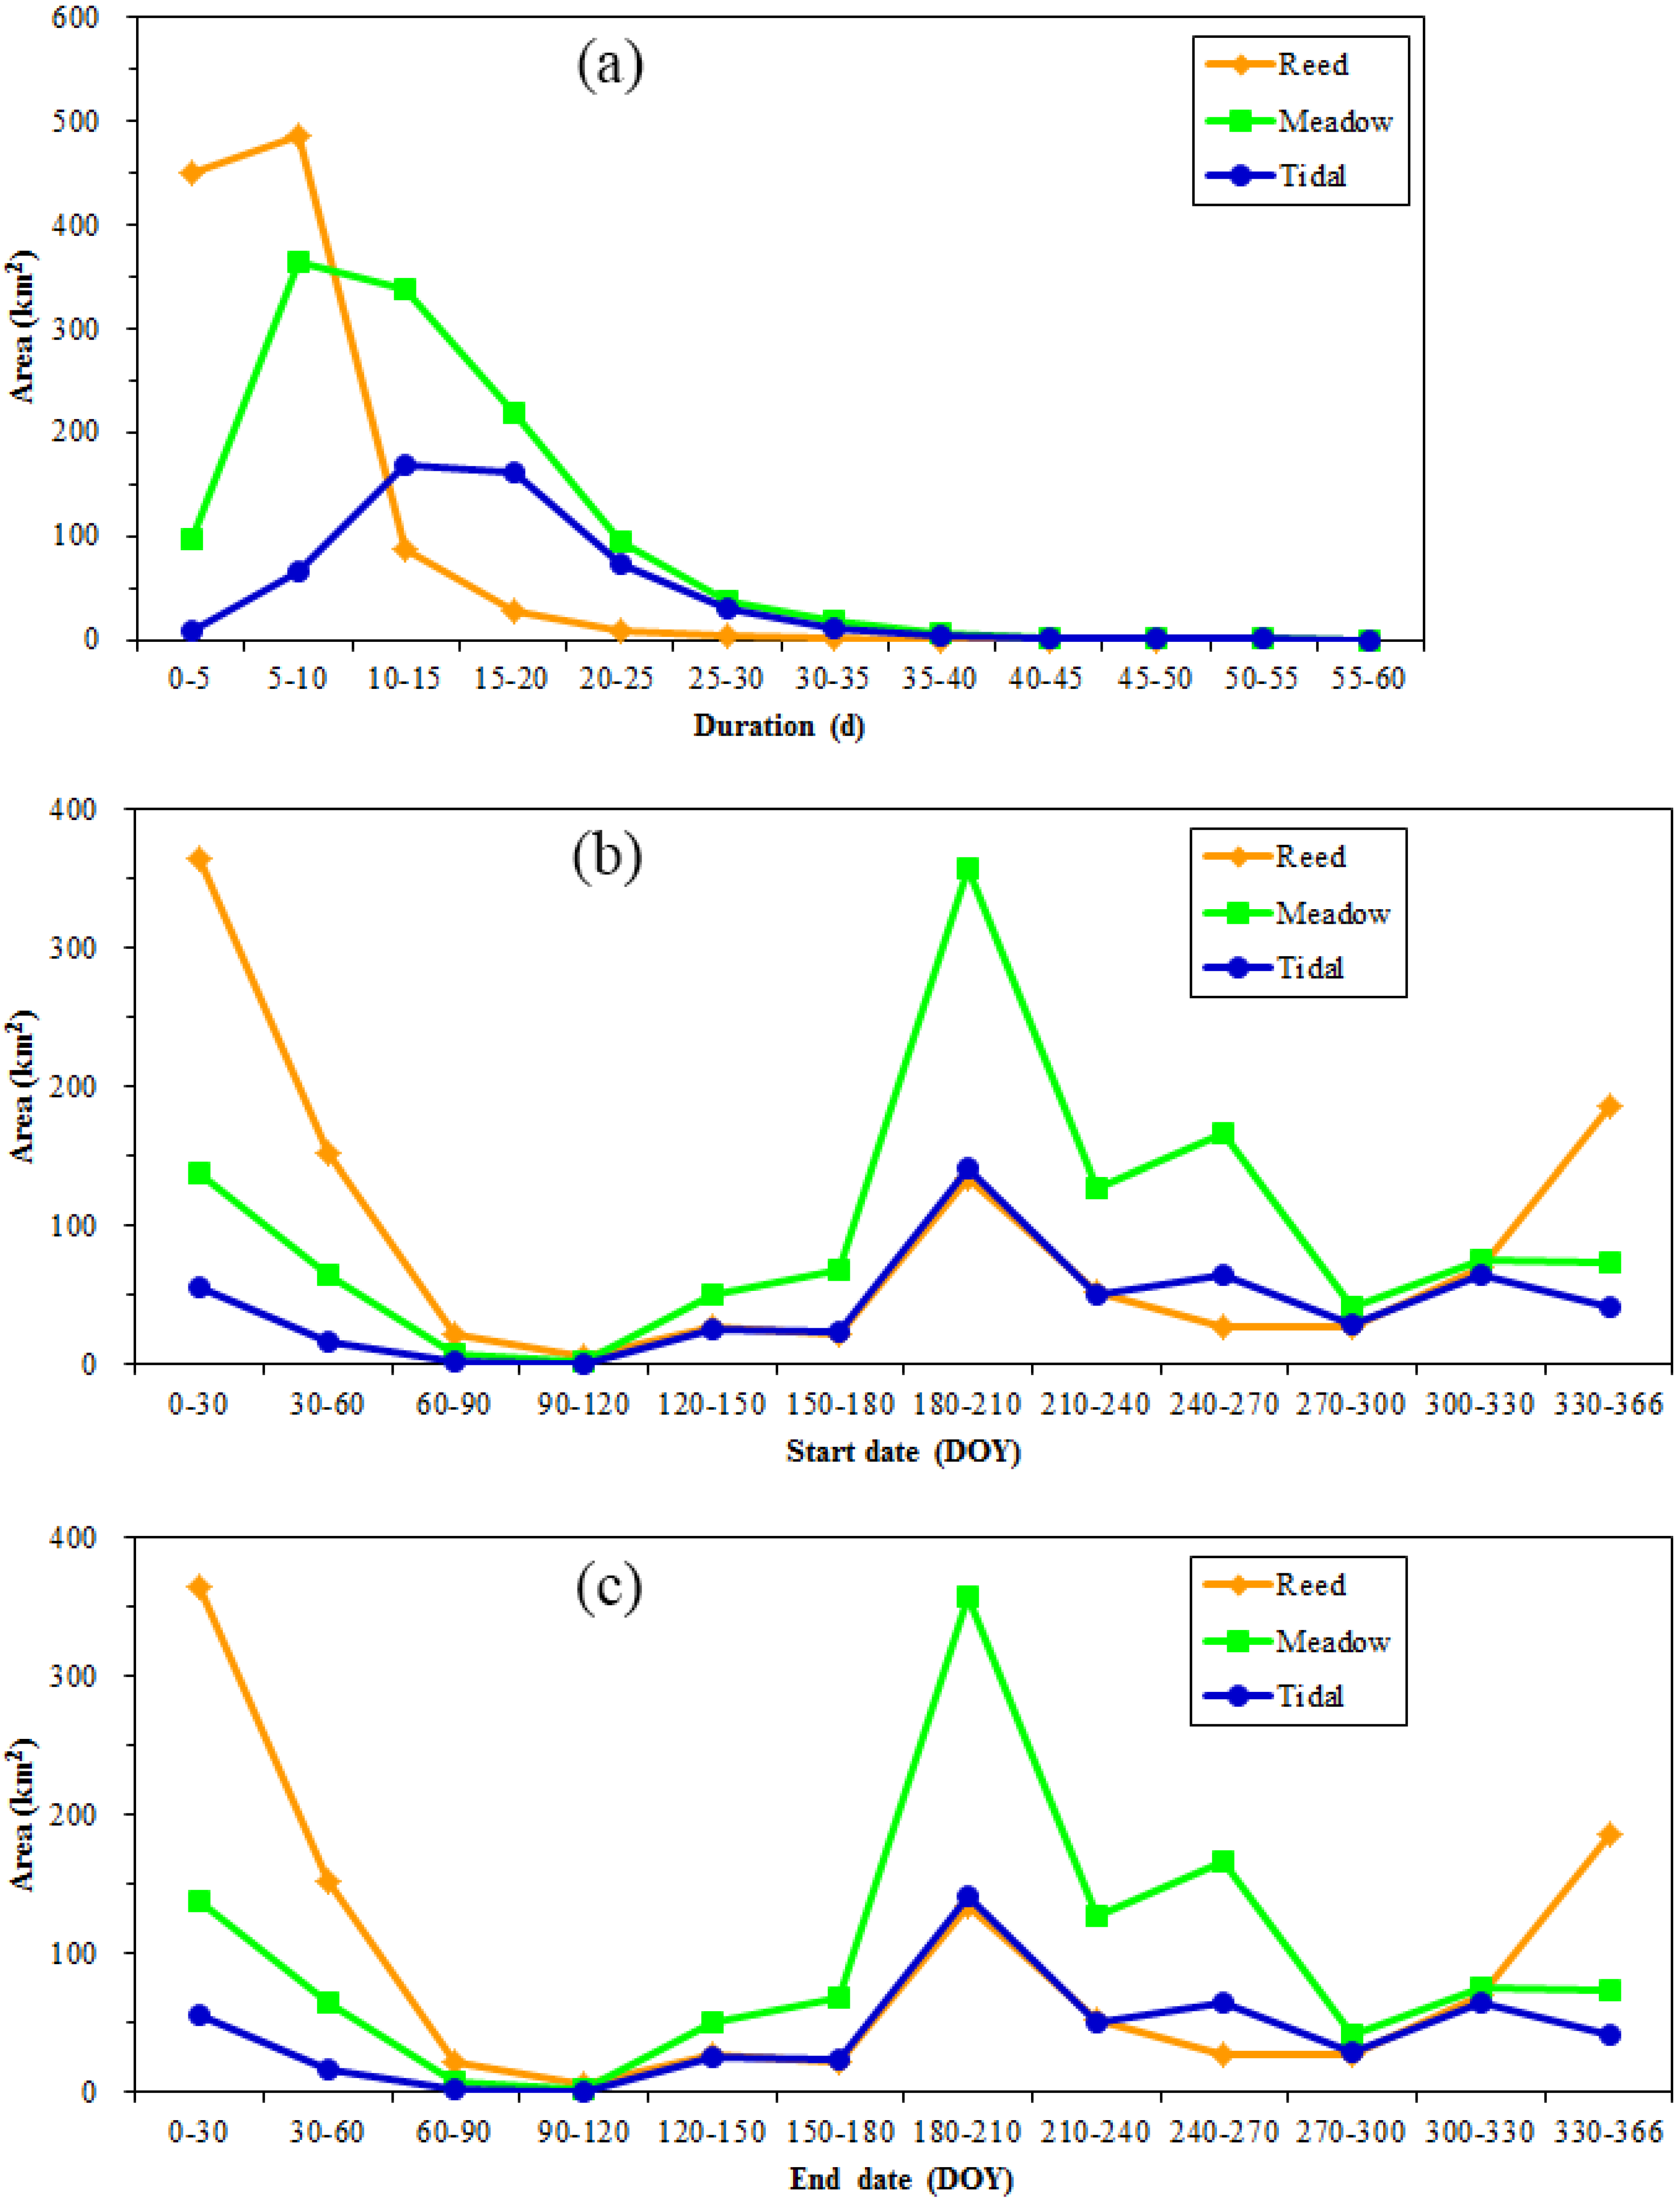
5.3. Spatial-Temporal Characteristics of the Annual Largest Flood

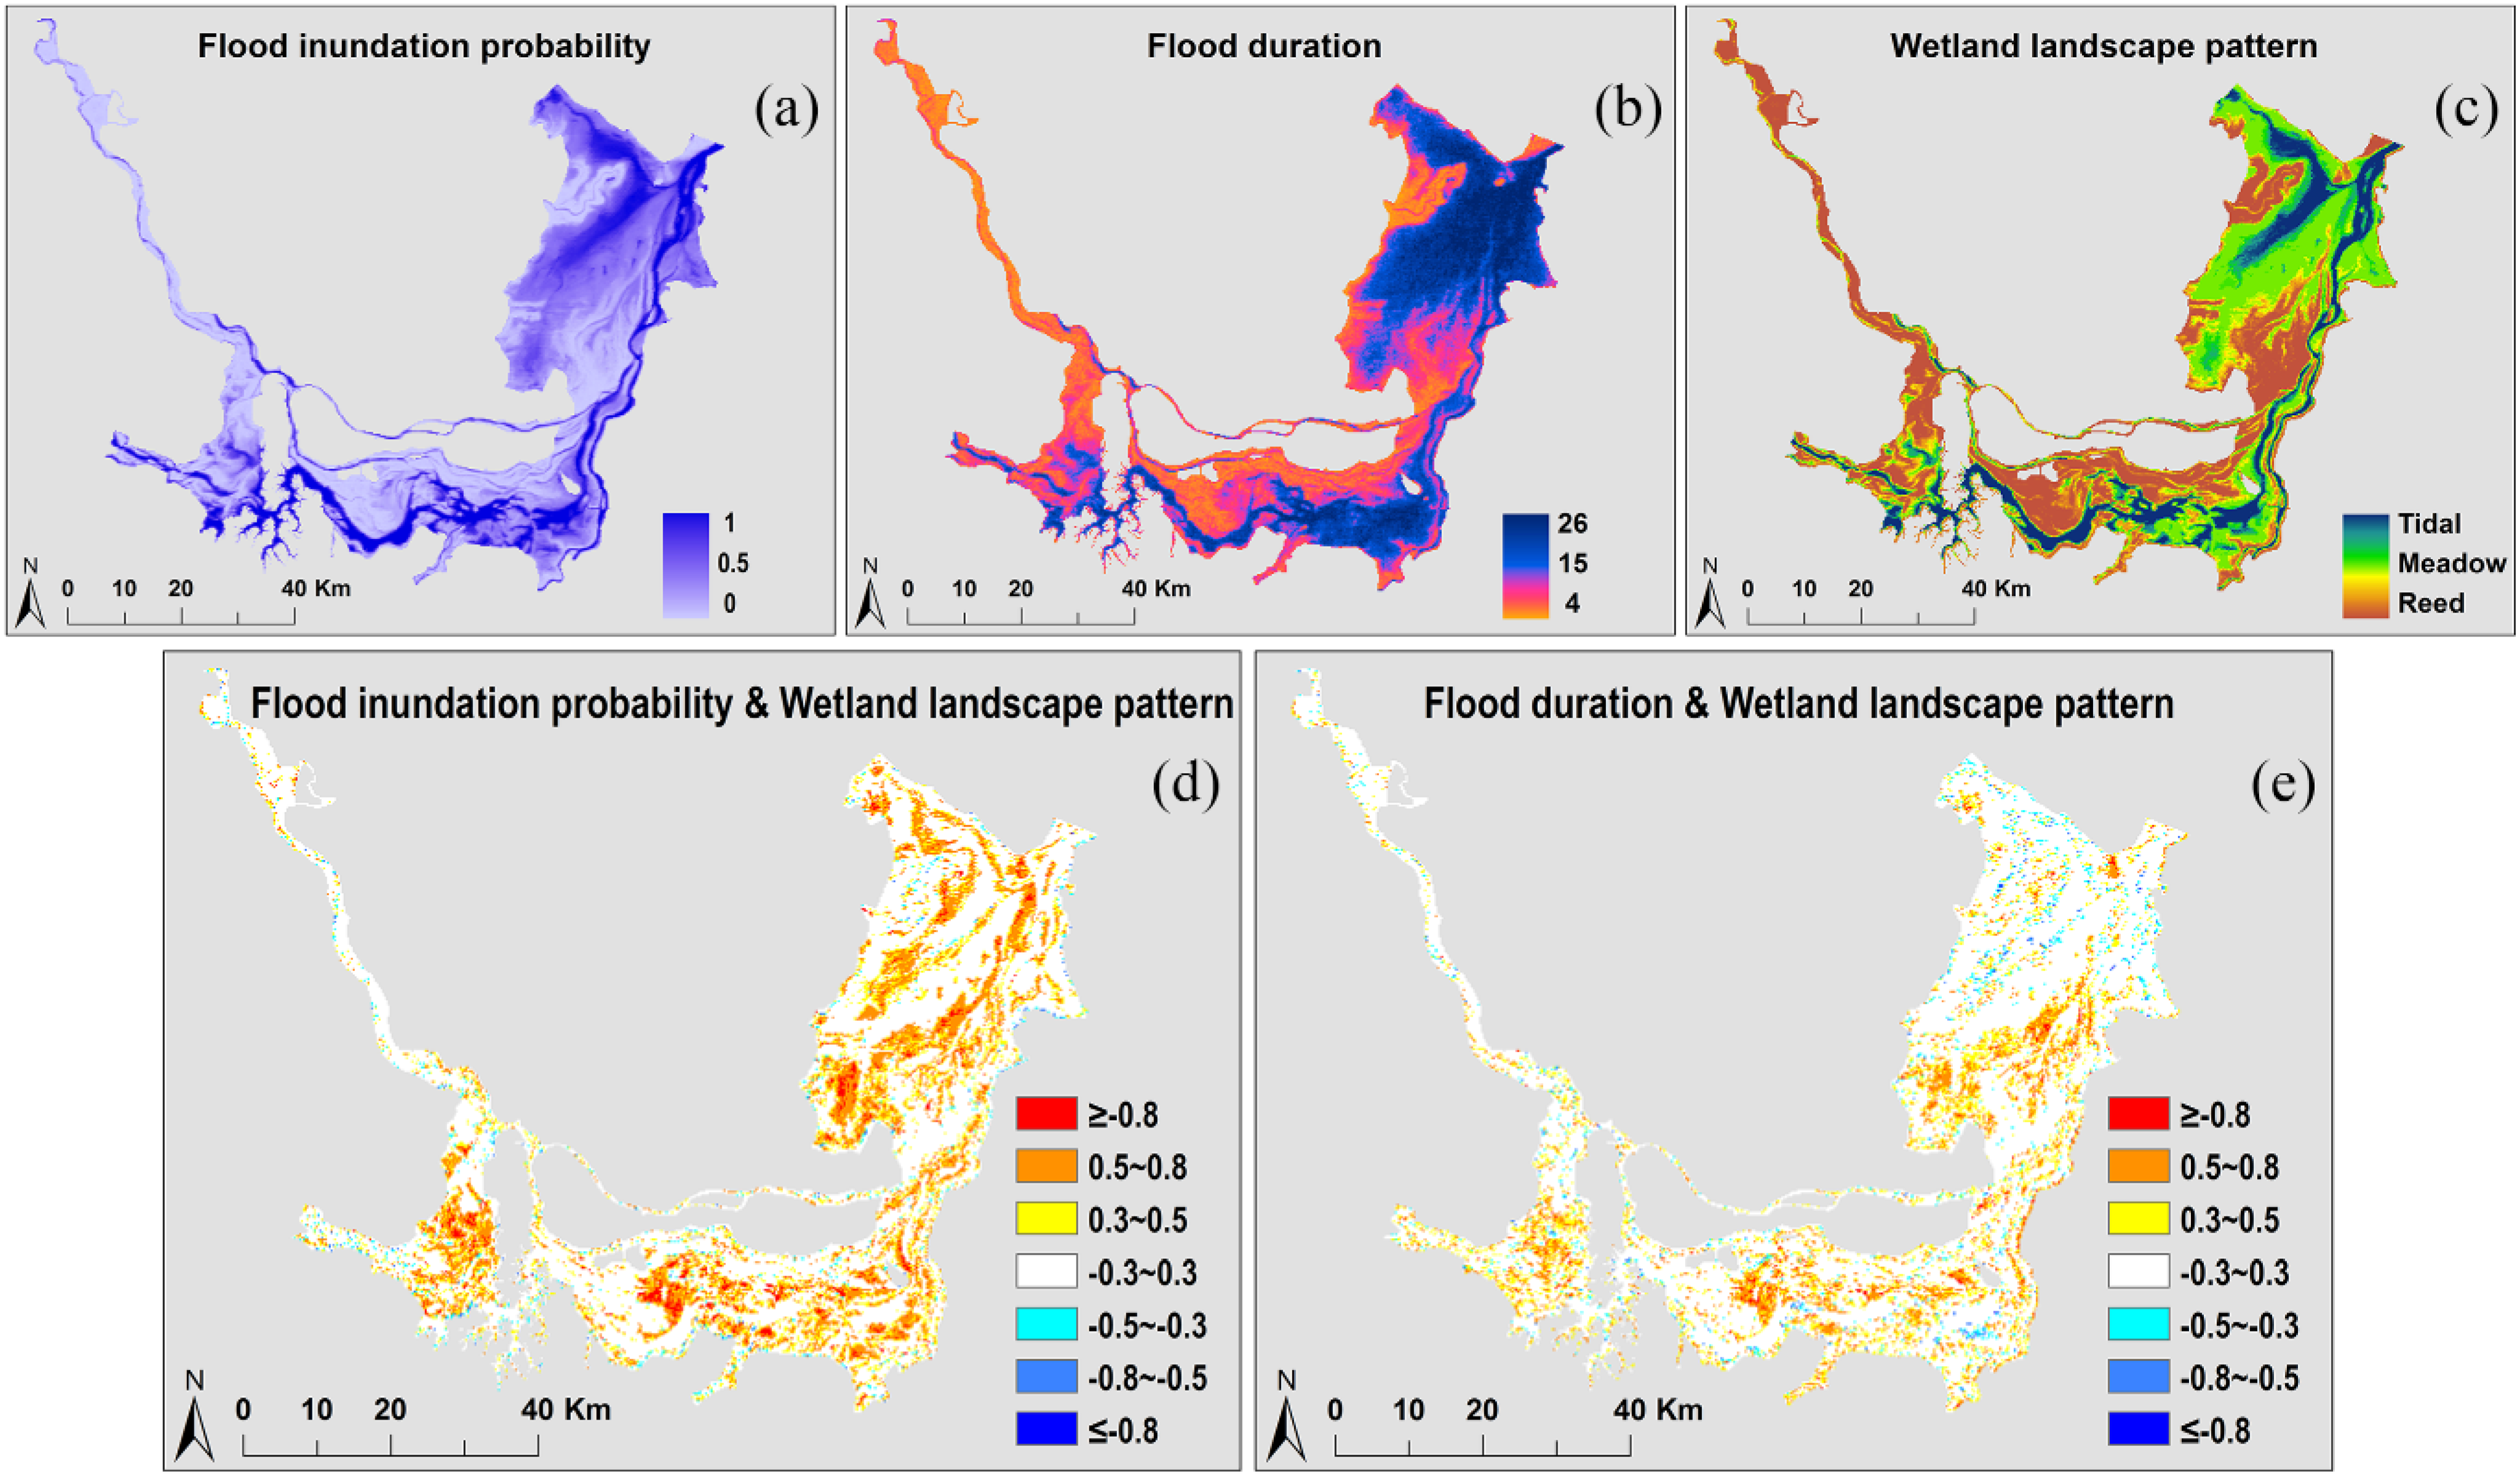
5.4. Spatial-Temporal Correlations between Flood Regimes and Wetland Landscape Patterns

6. Discussion
6.1. Development of Flood Regimes and Their Influences on Wetland Landscape Patterns

6.2. Changes in Wetland Landscape Patterns after the Flood Period
6.3. Role of Flooding in Wetland Evolution, and Its Possible Effects on Vegetation Succession

7. Conclusions
Acknowledgments
Author Contributions
Conflicts of Interest
References
- Andel, J.V.; Bakker, J.P.; Grootjans, A.P. Mechanisms of vegetation succession: A review of concepts and perspectives. Acta Bot. Neerl. 1993, 42, 413–433. [Google Scholar] [CrossRef]
- Xie, Y.H.; Chen, X.S. Effects of Three-Gorge Project on succession of wetland vegetation in Dongting Lake. Res. Agric. Mod. 2008, 29, 684–687. [Google Scholar]
- Zhao, B.; Yan, Y.E.; Guo, H.Q.; He, M.M.; Gu, Y.J.; Li, B. Monitoring rapid vegetation succession in estuarine wetland using time series MODIS-based indicators: An application in the Yangtze River Delta area. Ecol. Indic. 2009, 9, 346–356. [Google Scholar] [CrossRef]
- Fu, W.G.; Li, P.P.; Wu, Y.Y. Mechanism of the plant community succession process in the Zhenjiang Waterfront Wetland. Plant Ecol. 2011, 212, 1339–1347. [Google Scholar] [CrossRef]
- Ho, M.C.; Richardson, C.J. A five year study of floristic succession in a restored urban wetland. Ecol. Eng. 2013, 61, 511–518. [Google Scholar] [CrossRef]
- O’Donnell, J.; Fryirs, K.; Leishman, M.R. Can the regeneration of vegetation from riparian seed banks support biogeomorphic succession and the geomorphic geomorphic recovery of degraded river channels? River Res. Appl. 2014. [Google Scholar] [CrossRef]
- Palanisamy, B.; Chui, T.F.M. Understanding wetland plant dynamics in response to water table changes through ecohydrological modelling. Ecohydrology 2013, 6, 287–296. [Google Scholar] [CrossRef]
- Rosenzweig, C.; Tubiello, F.N.; Goldberg, R.; Mills, E.; Bloomfield, J. Increased crop damage in the US from excess precipitation under climate change. Global Environ. Chang. 2002, 12, 197–202. [Google Scholar] [CrossRef]
- Voesenek, L.A.C.J.; Rijnders, J.H.G.M.; Peeters, A.J.M. Plant hormones regulate fast shoot elongation under water from genes to communities. Ecology 2004, 85, 16–27. [Google Scholar] [CrossRef]
- Bai, J.H.; Ouyang, H.; Yang, Z.F.; Cui, B.S.; Cui, L.J.; Wang, Q.G. Changes in wetland landscape patterns: A review. Progr. Geog. 2005, 24, 36–45. [Google Scholar]
- Broen, M.T. A simulation model of hydrology and nutrient dynamics in wetlands. Comput. Environ. Urban Syst. 1988, 12, 221–237. [Google Scholar] [CrossRef]
- Coates, R.; Swanson, M.; Williams, P. Hydrologic analysis for coastal wetland restoration. Environ. Manag. 1989, 13, 715–727. [Google Scholar] [CrossRef]
- Wu, C.D.; Meng, X.M.; Chu, J.Y.; Fu, W.G.; He, H.J.; Meng, X.J. Correlation between hydrological situation and vegetation in Mount Beigu wetland. J. Jiangsu Univ. 2005, 26, 331–335. (In Chinese) [Google Scholar]
- Li, J.B.; Dai, Y.; Ou, C.M.; Peng, P.; Deng, C.X. Effects of store water application of the three gorges reservoir on Yangtze River on water and sediment characteristics in the Dongting Lake. J. Soil Water Conserv. 2011, 25, 215–219. [Google Scholar]
- Yao, S.M.; Lu, J.Y. Research on water and sediment transport characteristics downstream the Three Gorges Reservoir before and after its impoundment. J. Hydroelectr. Eng. 2011, 30, 117–123. [Google Scholar]
- Cai, Q.H. The Dongting Lake and Three Gorges Project. Yangtze River 2012, 43, 1–4. (In Chinese) [Google Scholar]
- Lai, X.J.; Jiang, J.H.; Huang, Q. Water storage effects of Three Gorges Project on water regime of Poyang Lake. J. Hydroelectr. Eng. 2012, 31, 132–148. [Google Scholar]
- Huang, Q.; Jiang, J.H.; Lai, X.J.; Sun, Z.D. Changes of landscape structure in Dongting Lake wetlands and the evaluation on impacts from operation of the three gorges project. Yangtze Basin Resour. Environ. 2013, 22, 922–927. [Google Scholar]
- Toner, M.; Keddy, P. River hydrology and riparian wetlands: A predictive model for ecological assembly. Ecol. Appl. 1997, 7, 236–246. [Google Scholar] [CrossRef]
- Chambers, R.M.; Smith, S.V.; Hollibaugh, J.T. An ecosystem-level content for tidal exchange studies in salt marshes of Tomales Bay. California, USA. In Global Wetlands: Old World and New; Mitsch, W.J., Ed.; Elsevier: Amsterdam, The Netherlands, 1994; pp. 265–276. [Google Scholar]
- Dame, R.F. The net flux of materials between marsh-estuarine systems and the sea: The Atlantic coast of the United States. In Global Wetlands: Old World and New; Mitsch, W.J., Ed.; Elsevier: Amsterdam, The Netherlands, 1994; pp. 295–302. [Google Scholar]
- Dame, R.F.; Lefeuvre, J.C. Tidal exchange: Import-export of nutrients and organic matter in new and old world salt marshes: Conclusions. In Global Wetlands: Old World and New; Mitsch, W.J., Ed.; Elsevier: Amsterdam, The Netherlands, 1994; pp. 181–201. [Google Scholar]
- Duan, Y.; Li, Q.S.; Yang, F.; Li, X.C.; Zhang, H.P.; Li, Y. Study on the effects on wetlands in flooded area caused by transportation of sediment in floodwater. Sci. Technol. Eng. 2004, 4, 967–971. [Google Scholar]
- Lu, X.L.; Deng, W. Review of flood effect on wetland system. Wetland Sci. 2005, 3, 136–142. [Google Scholar]
- Liang, J.; Cai, Q.; Guo, S.L.; Xie, G.X.; Li, X.D.; Huang, L.; Zeng, G.M.; Long, Y.; Wu, H.P. MODIS-based analysis of wetland area responses to hydrological processes in the Dongting Lake. Acta Ecol. Sin. 2012, 32, 6628–6635. [Google Scholar] [CrossRef]
- You, H.L. Research on Effect of Water Regime on the Growth and Spatial Pattern of Wetland Vegetation in Poyang Lake. Ph.D. Thesis, The University of Chinese Academy of Sciences, Beijing, China, 2014. [Google Scholar]
- Mishra, D.; Narumalani, S.; Lawson, M.; Rundquist, D. Bathymetric mapping using IKONOS multispectral data. Gisci. Remote Sens. 2004, 41, 301–321. [Google Scholar] [CrossRef]
- Fricker, H.A.; Scambos, T.; Carter, S.; Davis, C.; Haran, T.; Joughin, I. Synthesizing multiple remote-sensing techniques for subglacial hydrologic mapping: Application to a lake system beneath MacAyeal Ice Stream, West Antarctica. J. Glaciol. 2010, 56, 187–199. [Google Scholar] [CrossRef]
- Chormanski, J.; Okruszko, T.; Ignar, S.; Batelaan, O.; Rebel, K.T.; Wassen, M.J. Flood mapping with remote sensing and hydrochemistry: A new method to distinguish the origin of flood water during floods. Ecol. Eng. 2011, 37, 1334–1349. [Google Scholar] [CrossRef]
- Schumann, G.J.P.; Neal, J.C.; Mason, D.C.; Bates, P.D. The accuracy of sequential aerial photography and SAR data for observing urban flood dynamics, a case study of the UK summer 2007 floods. Remote Sens. Environ. 2011, 115, 2536–2546. [Google Scholar] [CrossRef]
- Klemas, V. Remote sensing of wetlands: Case studies comparing practical techniques. J. Coastal Res. 2011, 27, 418–427. [Google Scholar] [CrossRef]
- Long, C.M.; Pavelsky, T.M. Remote sensing of suspended sediment concentration and hydrologic connectivity in a complex wetland environment. Remote Sens. Environ. 2013, 129, 197–209. [Google Scholar] [CrossRef]
- Kuenzer, C.; Guo, H.D.; Huth, J.; Leinenkugel, P.; Li, X.W.; Dech, S. Flood mapping and flood dynamics of the Mekong delta: Envisat-ASAR-WSM based time series analyses. Remote Sens. 2013, 5, 687–715. [Google Scholar] [CrossRef]
- Sakamoto, T.; van Nguyen, N.; Kotera, A.; Ohno, H.; Ishitsuka, N.; Yokozawa, M. Detecting temporal changes in the extent of annual flooding within the Cambodia and the Vietnamese Mekong Delta from MODIS time-series imagery. Remote Sens. Environ. 2007, 109, 295–313. [Google Scholar] [CrossRef]
- Feng, L.; Hu, C.M.; Chen, X.L.; Cai, X.B.; Tian, L.Q.; Gan, W.X. Assessment of inundation changes of Poyang Lake using MODIS observations between 2000 and 2010. Remote Sens. Environ. 2012, 121, 80–92. [Google Scholar] [CrossRef]
- Huang, C.; Chen, Y.; Wu, J. Mapping spatio-temporal flood inundation dynamics at large river basin scale using time-series flow data and MODIS imagery. Int. J. Appl. Earth Obs. 2014, 26, 350–362. [Google Scholar] [CrossRef]
- Ordoyne, C.; Friedl, M.A. Using MODIS data to characterize seasonal inundation patterns in the Florida Everglades. Remote Sens. Environ. 2008, 112, 4107–4119. [Google Scholar] [CrossRef]
- Kuai, X.T.; Chen, D.Q.; Chen, Z.D. Application of MODIS L1B data to water resources. Geospatial Inf. 2006, 4, 41–43. [Google Scholar]
- Li, J.G.; Li, J.R.; Huang, S.F.; Zuo, C.G. Application of Terra/MODIS time series data in dynamic monitoring of lake water area variations. J. Nat. Resour. 2009, 24, 923–933. [Google Scholar]
- Zhou, H.; Mao, D.H.; Liu, P.L. The investigation on water lever of East Dongting Lake affected by Three-Gorge Reservoir. T. Oceanol. Limnol. 2014, 4, 180–186. [Google Scholar]
- Li, Z.W.; Zhao, X.N.; Xie, G.X.; Yuan, M.; Jiang, Y.S. Water environmental quality properties of Dongting Lake affected by construction of the Three Gorges Project. Geogr. Res. 2013, 32, 2021–2030. [Google Scholar]
- Long, Y. The spatial distribution and adaptability analysis of vegetation and its biomass in East Dongting Lake Wetland and the influence of Three Gorges Project. Master’s Thesis, Hunan University, Changsha, China, 2013. [Google Scholar]
- Li, J.B.; Dai, Y.; Yin, R.X.; Yang, Y.; Li, Y.D.; Wang, K.Y. Effects of Three Gorges Reservoir impoundment on the wetland ecosystem service value of Dongting Lake’ South-Central China. Chin. J. Appl. Ecol. 2013, 24, 809–817. [Google Scholar]
- Wang, S.M.; Dou, H.S.; Chen, K.Z.; Wang, X.C.; Jiang, J.H. The History of Chinese Lakes, 1st ed.; Science Press: Beijing, China, 1998; pp. 179–183. [Google Scholar]
- Shi, X.; Xiao, W.H.; Wang, Y.; Wang, X. Characteristics and factors of water level variations in Dongting Lake during the recent 50 years. South-North Water Diversion Water Sci. Technol. 2012, 10, 18–22. (In Chinese) [Google Scholar]
- Grime, J.P. Evidence for the existence of three primary strategies in plants and its relevance to ecological and evolutionary theory. Amer. Nat. 1977, 111, 1169–1194. [Google Scholar] [CrossRef]
- Blom, C.W.P.M.; Voesenek, L.A.C.J. Flooding: The survival strategies of plants. Trends Ecol. Evol. 1996, 11, 290–295. [Google Scholar] [CrossRef]
- Trebino, H.J.; Chaneton, E.J.; Leon, R.J.C. Flooding, topography, and successional age as deterninants of species diversity in old-field vegetation. Can. J. Bot. 1996, 74, 582–588. [Google Scholar] [CrossRef]
- Wang, H.Y.; Chen, J.K.; Zhou, J. Influence of water level gradient on plant growth reproduction and biomass allocation wetland plant species. Acta Phytoecol. Sin. 1999, 23, 269–274. [Google Scholar]
- Casanova, M.T.; Brock, M.A. How do depth, duration and frequency of flooding influence the establishment of wetland plant communities. Plant Ecol. 2000, 147, 237–250. [Google Scholar] [CrossRef]
- Tan, X.J.; Zhao, X.S. Spatial distribution and ecological adaptability of wetland vegetation in Yellow River Delta along a water table depth gradient. Chin. J. Ecol. 2006, 25, 1460–1464. [Google Scholar]
- Liu, X.Z.; Ye, J.X. Jiangxi Wetlands, 1st ed.; China Forestry Press: Beijing, China, 2000. (In Chinese) [Google Scholar]
- Yuan, Z.K. Resources and Environment of Wetland in Dongting Lake, 1st ed.; Hunan Normal University Press: Changsha, China, 2008. (In Chinese) [Google Scholar]
- NASA. EOSDIS, NASA’s Earth Observing System Data and Information System. Available online: https://reverb.echo.nasa.gov/ (accessed on 4 June 2015).
- MODIS Reprojection Tool. Available online: https://lpdaac.usgs.gov/tools/modis_reprojection_tool/ (accessed on 4 June 2015).
- Pohl, C.; van Genderen, J.L. Review article Multisensor image fusion in remote sensing: Concepts, methods and applications. Int. J. Remote Sens. 1998, 19, 823–854. [Google Scholar] [CrossRef]
- USGS. Landsat Missions. Available online: http://landsat.usgs.gov/ (accessed on 4 June 2015).
- China Meteorological Data Sharing Service System. Available online: http://cdc.nmic.cn/ (accessed on 4 June 2015). (In Chinese)
- Changjiang Water Resources Commission of the Ministry of Water Resources. The bulletin of the Sediments. Available online: http://www.cjw.com.cn/zwzc/bmgb/nsgb/ (accessed on 4 June 2015). (In Chinese)
- Hu, Y.X.; Huang, J.L.; Du, Y.; Han, P.P.; Wang, J.L.; Huang, W. Monitoring wetland vegetation pattern response to water-level change resulting from the Three Gorges Project in the two largest freshwater lakes of China. Ecol. Eng. 2014, 74, 274–285. [Google Scholar] [CrossRef]
- Ceccato, P.; Gobron, N.; Flasse, S.; Pinty, B.; Tarantola, S. Designing a spectral index to estimate vegetation water content from remote sensing data: Part 1. Theoretical approach. Remote Sens. Environ. 2002, 82, 188–197. [Google Scholar] [CrossRef]
- Sawaya, K.E.; Olmanson, L.G.; Heinert, N.J.; Brezonik, P.L.; Bauer, M.E. Extending satellite remote sensing to local scales: Land and water resource monitoring using high-resolution imagery. Remote Sens. Environ. 2003, 88, 144–156. [Google Scholar] [CrossRef]
- Feyisa, G.L.; Meilby, H.; Fensholt, R.; Proud, S.R. Automated Water Extraction Index: A new technique for surface water mapping using Landsat imagery. Remote Sens. Environ. 2014, 140, 23–35. [Google Scholar] [CrossRef]
- Deering, D.W. Rangeland Reflectance Characteristics Measured by Aircraft and Spacecraft Sensors. Ph.D. Thesis, Texas A&M University, College Station, TX, USA, 1978. [Google Scholar]
- McFeeters, S.K. The use of the normalized difference water index (NDWI) in the delineation of open water features. Int. J. Remote Sens. 1996, 17, 1425–1432. [Google Scholar] [CrossRef]
- Xu, H.Q. Modification of normalized difference water index (NDWI) to enhance open water features in remotely sensed imagery. Int. J. Remote Sens. 2006, 27, 3025–3033. [Google Scholar] [CrossRef]
- Hu, C.M. A novel ocean color index to detect floating algae in the global oceans. Remote Sens. Environ. 2009, 113, 2118–2129. [Google Scholar] [CrossRef]
- Jian, X.; Chen, H.; Xing, Z.Y.; Feng, T.; Yin, L.Y. Influence of waterbody types on threshold of waterbody area extraction using remote sensing technology. Sci. Technol. Eng. 2014, 18, 267–274. [Google Scholar]
- Roberts, L.G. Machine perception of three-dimensional solids. In Optical and Electro-Optical Information Processing; Tippet, J.T., Ed.; MIT Press: Cambridge, UK, 1965; pp. 157–161. [Google Scholar]
- Silleos, N.G.; Alexandridis, T.K.; Gitas, I.Z.; Perakis, K. Vegetation indices: Advances made in biomass estimation and vegetation monitoring in the last 30 years. Geocarto Int. 2006, 21, 21–28. [Google Scholar] [CrossRef]
- Rouse, J.W.; Haas, R.W.; Schell, J.A.; Deering, D.W.; Harlan, J.C. Monitoring the Vernal Advancement and Retrogradation (Green Wave Effect) of Natural Vegetation. Available online: http://ntrs.nasa.gov/archive/nasa/casi.ntrs.nasa.gov/19730017588.pdf (accessed on 2 June 2015).
- Zhao, Y.S. Principles and Methods of the Application of Remote Sensing, 1st ed.; Science Press: Beijing, China, 2003; pp. 373–374. [Google Scholar]
- Ma, Y.X.; Lai, H.Z. Research on the variations of the water and sediment for recent 50 years in the Jingjiang River and Dongting Lake area. Res. Soil Water Conserv. 2005, 12, 103–106. [Google Scholar]
© 2015 by the authors; licensee MDPI, Basel, Switzerland. This article is an open access article distributed under the terms and conditions of the Creative Commons Attribution license (http://creativecommons.org/licenses/by/4.0/).
Share and Cite
Hu, Y.; Huang, J.; Du, Y.; Han, P.; Huang, W. Monitoring Spatial and Temporal Dynamics of Flood Regimes and Their Relation to Wetland Landscape Patterns in Dongting Lake from MODIS Time-Series Imagery. Remote Sens. 2015, 7, 7494-7520. https://doi.org/10.3390/rs70607494
Hu Y, Huang J, Du Y, Han P, Huang W. Monitoring Spatial and Temporal Dynamics of Flood Regimes and Their Relation to Wetland Landscape Patterns in Dongting Lake from MODIS Time-Series Imagery. Remote Sensing. 2015; 7(6):7494-7520. https://doi.org/10.3390/rs70607494
Chicago/Turabian StyleHu, Yanxia, Jinliang Huang, Yun Du, Pengpeng Han, and Wei Huang. 2015. "Monitoring Spatial and Temporal Dynamics of Flood Regimes and Their Relation to Wetland Landscape Patterns in Dongting Lake from MODIS Time-Series Imagery" Remote Sensing 7, no. 6: 7494-7520. https://doi.org/10.3390/rs70607494
APA StyleHu, Y., Huang, J., Du, Y., Han, P., & Huang, W. (2015). Monitoring Spatial and Temporal Dynamics of Flood Regimes and Their Relation to Wetland Landscape Patterns in Dongting Lake from MODIS Time-Series Imagery. Remote Sensing, 7(6), 7494-7520. https://doi.org/10.3390/rs70607494