Abstract
In-situ soil moisture was widely used to validate and calibrate the satellite-retrieved data of different footprints. However, it contained unavoidable uncertainty when used as spatial representative. This paper examined the uncertainty in pixel-wise soil moisture designed for satellite validation in the HiWATER project. Two in-situ data sets were used for the examination, which were carefully designed to capture the spatial heterogeneity of soil moisture at different scales. Our results indicated that the pixel-wise uncertainty increased with increasing extent. At a small area, the uncertainty referred to the natural spatial variability of in-situ soil moisture. With respect to a large area, sampling error of spatial soil moisture played an important role, particularly of dry condition. Temporally, the uncertainty was higher during rainfall than that after then. It suggested that in-situ soil moisture could be more spatially representative at a small area after rainfall, valuable for satellite validation. Uncertainty was correlated to soil moisture. It was strongly correlated to spatial mean at a small scale and was to the spatial pattern at a large scale. Results of this study offered some clues to examine the uncertainty of in-situ soil moisture for satellite validation.
1. Introduction
Soil moisture is an important state variable in the land surface systems. It plays an important role in water cycle [1] and plant growth [2]. In-situ measurement is a traditional method for directly measuring soil moisture within a few square meters [3,4,5,6,7]. For hydrological studies, it is important to monitor soil moisture at a large scale (e.g., the basin scale) [8]. In recent decades, remote sensing has been widely used to determine large-scale soil moisture because of its spatially consistent view [9]. Unfortunately, remote sensing is criticized for its inherently coarse spatial resolution [10]. This limitation weakens the reliability of the satellite retrievals due to spatial heterogeneity within a satellite pixel [11]. In practice, in-situ data is commonly used to validate and calibrate satellite-retrieved data at basin [9], regional [12] or global [13] scales. However, the in-situ soil moisture involves notable uncertainty when it is used as spatial representatives for remote sensing footprints [6]. Thus, this uncertainty must be quantified for satellite validation and calibration.
The uncertainty comes from natural spatial variability of soil moisture and varies with spatial scales due to environmental factors. At small scale, the uncertainty strongly depends on variability of soil property [14], which mainly affects infiltration [15,16]. As the scale increases, vegetation [17] and topography [18] become the dominant causes of the uncertainty by altering evapotranspiration [19] and infiltration [20,21]. At regional or global scale, climate factors (particularly of rainfall) add additional influences on the uncertainty [22,23]. Each factor exerts a degree of spatial organization on the distribution of soil moisture by introducing (removing) water into (from) the soil. Furthermore, the factors produce combined influences on soil moisture and its uncertainty through complex interactions at different scales. Thus, each factor either enhances or reduces the uncertainty, depending on its spatial distribution and combination with other factors [24]. There are numerous previous studies investigated the interactive effects. Entekhabi and Rodriguez-Iturbe [25] revealed that homogeneous soil properties can reduce the uncertainty created by heterogeneous precipitation. In contrast, Peters-Lidard and Pan [26] showed that heterogeneous soil textures can increase the variability under homogeneous precipitation conditions. Teuling and Troch [27] demonstrated that plant transpiration, soil water drainage, and their spatial variations could significantly alter the spatial variability of soil moisture. It is important to evaluate the uncertainty generated from combined effects of different influences across spatial scales.
The uncertainty also strongly depends on artificial sampling configuration of in-situ measurements [28,29,30,31]. Blöschl and Sivapalan [32] defined the sampling configuration with three components: spacing, extent and support. Specifically, “spacing” refers to the distance between the samples that is negatively correlated to the sampling density, “extent” is the overall coverage, and “support” represents the area that is integrated by each sample. When single in-situ soil moisture is used as spatial representative, its uncertainty commonly increases with increasing spacing and decreases with increasing support [33,34,35]. Relationship between uncertainty and spacing (sampling density) is controversial. Western et al. [23,29] indicated that the uncertainty does not change with spacing in southeastern Australia. However, Crow et al. [28] showed that it decreases as the sampling density increased in the National Airborne Field Experiments 2005 (NAFE’05) field campaign. These studies displayed the complex characteristics of uncertainty and the sampling configuration.
In addition, the uncertainty may change temporally, which is strongly correlated to soil moisture dynamics [8,24]. The temporal behavior can be illustrated by two indices. The first one is the mean soil moisture defined as a mean of spatially distributed soil moisture within an extent. Relationship between uncertainty and spatial mean of soil moisture varies in different studies. Bell et al. [33] and Famiglietti et al. [36] showed that spatial variability of soil moisture decreased with soil drying. However, Famiglietti et al. [30] observed an increasing variability when the mean soil moisture decreased. Furthermore, Li and Rodell [22] and Cho and Choi [37] showed an upward convex correlation between spatial variability and the spatial mean of soil moisture when statistics from dry, intermediate, and wet climates were combined. Another index is the probability density function (PDF) bounded between the wilting point and porosity. It represents spatial pattern or sub-grid variability of soil moisture [38]. Similar to the spatial mean, PDF correlates to the uncertainty in a complex way. Western et al. [23] pointed out that bounded PDF typically become skewed and less variable as the mean approaches a boundary. Famiglietti et al. [24] present a positive relationship between spatial variability and skewness (a index of PDF) of soil moisture in Oklahoma and Iowa in the central USA. The uncertainty versus soil moisture relationship is useful for characterizing the soil moisture variations because it exhibits a predictable exponential pattern, even when a limited number of samples are collected. Therefore, the mean soil moisture and the PDF should be considered jointly to characterize the temporal behavior of the uncertainty.
To explore spatial and temporal characteristics of uncertainty, this study takes advantages of the field campaign sponsored by the Heihe Watershed Allied Telemetry Experimental Research (HiWATER) project. The project was carried out in the Heihe River Basin in the arid region of northwest China in 2010. One of its main objectives was to improve the observability of hydrological process and enhance the applicability of remote sensing at the basin scale [39]. Several eco-hydrological Wireless Sensor Networks (WSN) were launched for satellite validation in the HiWATER project, which were carefully designed to investigate spatial variability of hydrological variables. In this study, WSNs of WaterNET and SoilNET are used to examine the uncertainty. Firstly, uncertainty is quantified with consideration of spatial variability and sampling configuration. Next, the uncertainties at scales of 1 × 1 km2 (SoilNET) and 4 × 4 km2 (WaterNET) are analyzed during a changing soil moisture. Finally, the correlations between uncertainty and soil moisture (spatial mean and PDF) are examined.
2. Methods
2.1. Data Sampling and Spatial Representativeness of in-Situ Soil Moisture
It needs to capture the spatial representative to quantify the uncertainty of in-situ soil moisture. Several studies focused on the sample number for estimating spatial soil moisture at the satellite footprint scale. Crow et al. [28] summarized the number of sample stations that were used in previous studies, which varied from 12 to 41 with averaged station spacing from 2 × 2 to 50 × 50 km2. The study also revealed that the accuracy of spatial soil moisture increases with the increasing sample numbers at a certain scale. Besides the number of samples, the spatial distribution is also critical to the accuracy of spatial soil moisture [40]. To obtain accurate spatial soil moisture, the sampling configuration should represent the heterogeneity of soil and environmental variables. The in-situ data sets of this study adopt a hybrid model-based sampling method for the requirement [39,41]. The sampling method optimizes the distribution by satisfying two sub-criteria: one for improving the accuracy of the spatial soil moisture to evaluate remote sensing productions, another for reducing the variogram to represent the variability of in-situ soil moisture. Specifically, the model is described as [41]:
where Φhybrid is a weighted sum of two sub-criterions with weighted coefficients of ω1 and ω2. S refers to the optimized point set. SP and EP are methods that are effective for calculating spatial soil moisture and estimating variogram parameters. The goal of the sampling method is to develop an optimal scheme with a fixed number of sampling stations via minimization of the Φhybrid value. The calculation of the criterions (SP and EP) and weight coefficients (ω1 and ω2) could be seen in reference of Kang et al. [41] in detail. Through Φhybrid, the uncertainty of in-situ soil moisture can be divided into two parts, which helps to capture the error sources and quantify them.
To evaluate the uncertainty, this study uses the spatial mean of in-situ measurement values to represent the spatial soil moisture. PDF is adopted to describe the spatial pattern of soil moisture. PDF presents the probabilities of in-situ soil moisture within different intervals, which reflect the spatial distribution of the in-situ soil moisture [42]. Skewness and kurtosis are the two most important variables for PDF. Skewness measures the symmetry of the distribution. The distribution is symmetrical or asymmetrical when the skewness is equal to or unequal to 0, respectively. For an asymmetrical distribution, a positive skewness indicates that a soil moisture peak is left-skewed in the PDF curve, while a negative value indicates that the peak is right-skewed. Kurtosis describes the sharpness of the probability peak. The peak is high or low when the kurtosis is greater than or less than 3, respectively. For a normal distribution, the skewness and kurtosis are equal to 0 and 3, respectively. The equations for skewness and kurtosis are as follows:
where Sx and Kx refer to the skewness and kurtosis, σ is standard deviation of the in-situ soil moisture, is the mean in-situ soil moisture, xi is the in-situ soil moisture at station i, and n is the number of stations.
2.2. Uncertainty of in-Situ Soil Moisture
There is unavoidable uncertainty when single in-situ soil moisture is used as spatial representative. According to Equation (1), the uncertainty includes two different forms. The first one is the sampling error between the spatial soil moisture and the “actual” value. The second form is the spatial variability of in-situ soil moisture. It is assumed that the two data samplings (sample_A and sample_B), with equal sample numbers, are designed for a large area, A, and a small area, B, through the optimization method above. Furthermore, several sample stations of sample_B (sample_BA) locate in the extent of A. As mentioned, the sampling configurations capture the variations of soil and environmental variables at the corresponding scales. The spatial mean soil moisture of sample_B is accurate for the sufficient sample stations in a small area. However, since the sample number and environment change, mean value of sample_BA is inaccurate to reflect the spatial representative, the sampling error can be described as:
Where is the uncertainty of sampling error. and are the spatial mean of sample_A and sample_BA. abs means the absolute value.
Standard deviation (SD) is used to evaluate the natural spatial variability of in-situ soil moisture. This index describes the variance between the in-situ soil moisture and the spatial mean, which refers to the error when single in-situ soil moisture is selected to represent the spatial mean [24,30]. Furthermore, this study uses the coefficient of variation (CV), which is obtained by the division of SD to spatial mean, to evaluate the relative variability [43].
Absolute and relative uncertainties are finally calculated. The absolute uncertainty (Uabs) is the summarization of sampling error and spatial variability. The relative uncertainty (Urel) is also proposed to measure the degree with spatial mean. Two uncertainties are written as:
where Uabs and Urel refer to the absolute and relative uncertainties. is defined for Equation (4), and σ are spatial mean and standard deviation.
3. Materials and Data Processing
The study area is located in the Daman irrigation district of the Heihe River Basin, China (Figure 1). The basin is the second largest inland river basin and is representative of all of the inland river basins in China. The water-ecosystem-economy relationship at the basin has attracted considerable researcher attention [44]. With respect to the study area, topography is flat, with the terrain slope gently tilting downward from west to east, with elevation ranges from 1560 to 1447 m [45]. Land cover is relatively heterogeneous, which is covered by large areas of corn and non-vegetation. Two data sets are used in this study. The first one is the WaterNET (44 sample stations) dataset observed by Hydro Probe II with an extent of 4 × 4 km2 (10.3972/hiwater.118.2013.db). The second one is the SoilNET (50 sample stations) dataset observed by SImple SOil MOisture Probe (SISOMOP) with an extent of 1 × 1 km2 (10.3972/hiwater.120.2013.db). Overall, 6 sample stations of WaterNET (sub_WaterNET) locate within the extent of SoilNET. The Hydro Probe II is the first moisture sensor to use the digital microwave moisture measurement technique. Measurements are taken 25 times per second as the material passes over or around the sensor face, meaning that the sensor can rapidly detect changes in moisture levels. Soil moisture measuring part of SISOMOP is based on a ring oscillator whose frequency is changing with water content. It allows on site water content measurements without knowledge of the tested soil. Two types of probes are installed horizontally at a depth of 4 cm and measure soil moisture at 10 min intervals [46]. The observed data sets are obtained from the Cold and Arid Regions Sciences Data Center at Lanzhou from 1–31 July 2012 [47]. To eliminate random errors, the hourly mean soil moisture is calculated and used in this study. Because two types of probes are used in this study, the systematic measurement difference should be calibrated. For this aim, data sets from the nearest in-situ stations of WaterNET and SoilNET are selected. Then, the measurement difference is eliminated through the method of regression analysis.
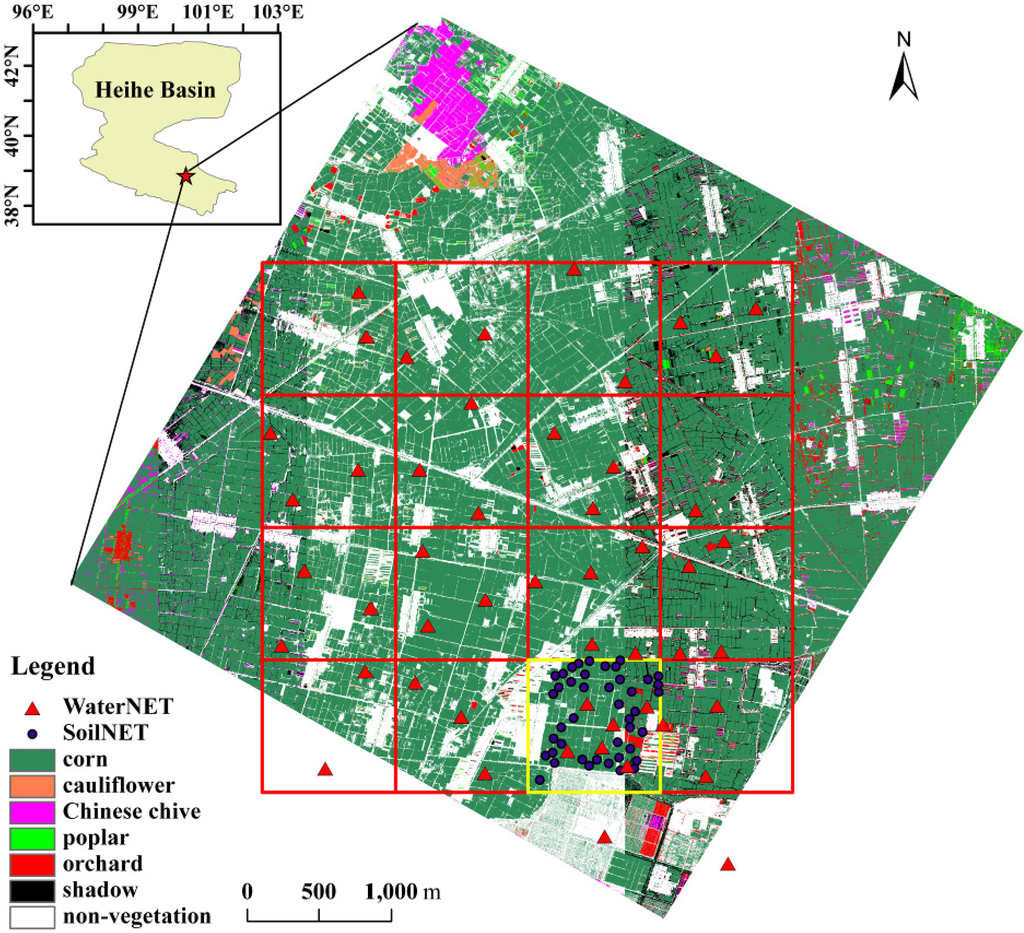
Figure 1.
Study area.
Rainfall plays an important role in soil moisture and its spatial variability. It causes sharp changes in soil moisture that is helpful for capturing the dynamic characteristics. Furthermore, rainfall also generates a heterogeneous surface that covered by ponded and non-ponded area, which increases the spatial variability of soil moisture [48]. Therefore, it is important to analyze the uncertainty during a typical rainfall process. As shown in Figure 2, the highest daily rainfall (15.8 mm) occurred on the 16th day of the observation period. Under this condition, spatial mean of soil moisture increases from 20.5% to 39.7% for WaterNET and from 25.3% to 37.6% for SoilNET. The changes of soil moisture cover from capillary disrupting moisture to field capacity of the study area [49]. It indicates that the maximum range of soil moisture change could be observed under this rainfall event. In other words, the uncertainty in every soil moisture conditions could be captured. Therefore, the period from the 16th to 19th is selected as the study period. Next, the two phases are further divided according to the soil moisture dynamics. Phase I (16 July 2012 5:00 p.m.~17 July 2012 1:00 a.m.) occurs during rainfall as the soil moisture increases, and phase II (17 July 2012 2:00 a.m.~19 July 2012 11:00 p.m.) occurs after rainfall as the soil moisture decreases.
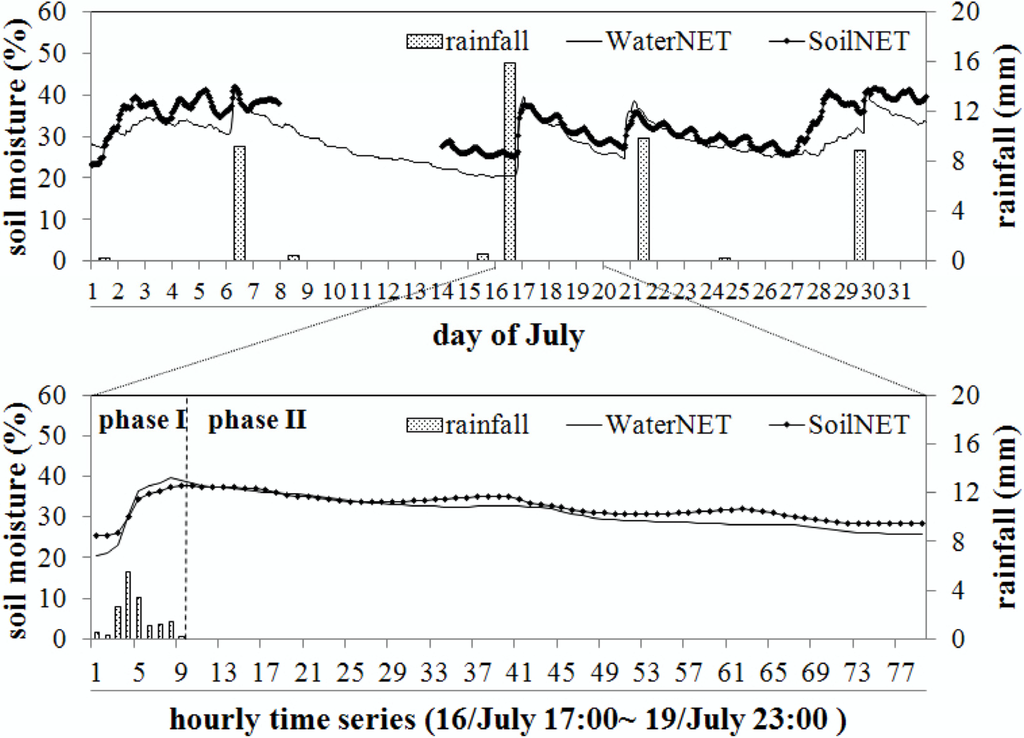
Figure 2.
Hourly mean soil moisture and rainfall for the WaterNET and SoilNET datasets during the observation period.
4. Results
4.1. Overall Condition of Soil Moisture
As shown in Figure 2, there are similar temporal trends between WaterNET and SoilNET, while the soil moisture values are different. The mean soil moisture of WaterNET and SoilNET are 31.3% and 32.6% throughout the study period, 31.9% and 32.1% during rainfall, and 31.2% and 32.7% after rainfall. The PDF also varies in different phases. During rainfall, a sharp peak at high soil moisture is observed. After rainfall, however, the peak occurs at low soil moisture and is depressed, which results in a flat PDF. Specifically, the mean skewness and kurtosis of WaterNET are 0.55 and 4.25 throughout the study period. During rainfall, these values are 0.27 and 3.23, which are lower than the values after rainfall (0.59 and 4.38). With respect to SoilNET, the mean skewness and kurtosis values are 0.07 and 2.24 throughout the study period, 0.22 and 2.76 during rainfall, and 0.05 and 2.18 after rainfall.
More specifically, this study selects three typical moments to investigate the PDF changes: the start, maximum and end. The first moment refers to the beginning of the study period, the second one is the time at which the highest soil moisture occurs and last one refers to the end of the study period. PDF in these three moments capture the possible changes over the study period. Figure 3 shows the PDFs of WaterNET and SoilNET at the three moments. Regarding WaterNET, the in-situ soil moisture presents a pulse distribution at the start (start-W). Overall, 70.45% of the in-situ soil moisture varies from 24% to 28%. Under this distribution, the skewness and kurtosis values are 0.47 and 2.96. These results imply that the in-situ soil moisture is close to each other, which potentially generates homogeneous spatial soil moisture with low spatial variability. The PDF shows normal distribution when the spatial mean reaches maximum (maximum-W). The skewness and kurtosis values are −0.59 and 3.61, with 77.27% of the soil moisture falls into the range from 36% to 48%. After rainfall, the soil moisture of SoilNET decreases and generates a new peak at the low soil moisture, with 70.45% of the soil moisture varies from 24% to 28% (end-W). Under this condition, the in-situ soil moisture is similar with minor differences, which generates homogeneous spatial soil moisture.
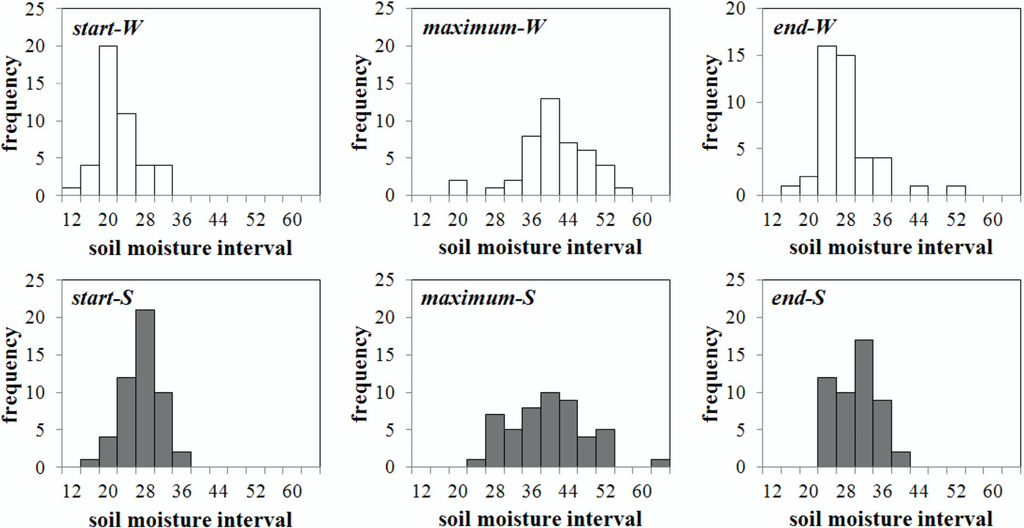
Figure 3.
The probability density function (PDF) of soil moisture during rainfall for WaterNET (at top) and SoilNET (at bottom). “start”, “maximum” and “end” refer to the three typical moments of soil moisture begins to increase, reaches its maximum and the end of the study period. “W” and “S” are the abbreviations of WaterNET and SoilNET.
For SoilNET, a soil moisture peak occurs at the low soil moisture at the start, with skewness and kurtosis values of −0.24 and 2.62 (start-S). At this moment, 86.18% of the in-situ soil moisture varies from 24% to 32%. Next, the soil moisture increases during rainfall. The distribution becomes flat when the mean soil moisture reaches its maximum (maximum-S). Specifically, 96.23% of the in-situ soil moisture varies from 28% to 52%, with skewness and kurtosis values are 0.23 and 2.72. This finding indicates that the soil moisture presents significant spatial variations, which may result in a high uncertainty. At the end of the study period, the soil moisture decreases to its minimum value. At this time, the soil moisture peak occurs at low soil moisture (with a skewness of 0.01 and a kurtosis of 2.02) (end-S). Meanwhile, 78.54% of the soil moisture is between 28% and 36%. Soil moisture returns homogeneous, which would reduce the uncertainty.
4.2. Spatial and Temporal Characteristics of Uncertainty
As mentioned above, the uncertainty contains sampling error and spatial variability. This study firstly examines the sampling error of WaterNET soil moisture. Figure 4 shows the mean soil moisture of sub-WaterNET, WaterNET and SoilNET. The change trends are highly similar, while the values are different. The soil moisture of sub-WaterNET is close to that of WaterNET but lower than that of SoilNET, particularly in dry period. As described in the Section 2, spatial mean of SoilNET is accurate for the sufficient sample stations in a small area. However, the value of WaterNET is relatively inaccurate, which contains unavoidable sampling error. Taken the spatial mean of SoilNET as a reference, the sampling error of WaterNET is calculated through Equation (4), with a mean error of 2.9% over the study period. Temporally, the values of sampling error are 3.3% and 2.8% during and after rainfall. Furthermore, the sampling error varies with soil moisture condition, which is relative low in wet period and high in dry soil moisture.
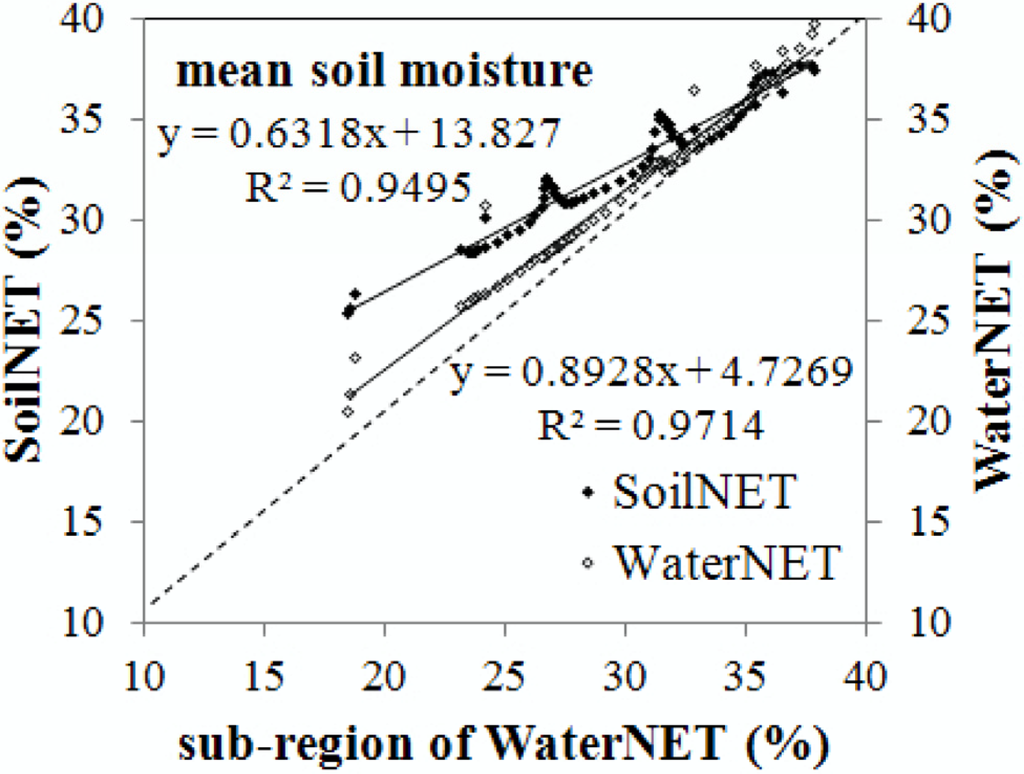
Figure 4.
Comparison of the mean soil moisture of sub-WaterNET, WaterNET and SoilNET.
The spatial variability of WaterNET and SoilNET soil moisture are shown in Figure 5. SD of WaterNET is 5.9% throughout the study period, 8.3% during rainfall and 5.6% after rainfall. These values are 5.6%, 6.9% and 5.5% for SoilNET. The mean values of CV are 0.19 for WaterNET and 0.17 for SoilNET. Temporally, the values of CV are 0.26 and 0.21 during rainfall and 0.18 and 0.16 after rainfall for WaterNET and SoilNET, respectively. It can be seen that spatial variability increases with the increasing extent, which is consistent with the prior studies [22,23,24,28,29,30]. It is because land cover is more heterogeneous in large area, which enhances soil moisture variation. In addition, the variability shows significant temporal dynamics. Both SD and CV are high during rainfall and low after rainfall. It is mainly attributed to the spatial variability of soil property, which would generate heterogeneous infiltration [50]. Ma et al. [49] measured the soil moisture characteristic curves with matric potential increases from 0.2 to 13 bar. The data includes one measurement sample at SoilNET and 11 at WaterNET. As shown in Figure 6, the curves are quite different, which demonstrates that the soil property is heterogeneous in the study area. Furthermore, the difference of in-situ soil moisture increases from 14.0% to 17.2% with the spatial mean increases from 18.6% to 46.4%. It implies that the increasing rate for in-situ soil moisture is quite different during rainfall. The spatial variability would increase with the increasing soil moisture. It is worth noting that SD and CV of WaterNET increase at hour 37. The reason is that the field station 14# location is irrigated by the farm owner. The single in-situ soil moisture therefore increases from 22.7% to saturation (53.6%), which also increases the variance of in-situ soil moisture. Because the irrigation area is small, its effect on the spatial variability over the extent of WaterNET can be neglected. To represent the actual condition, soil moisture of station 14# is preserved in the later statistics and analysis.
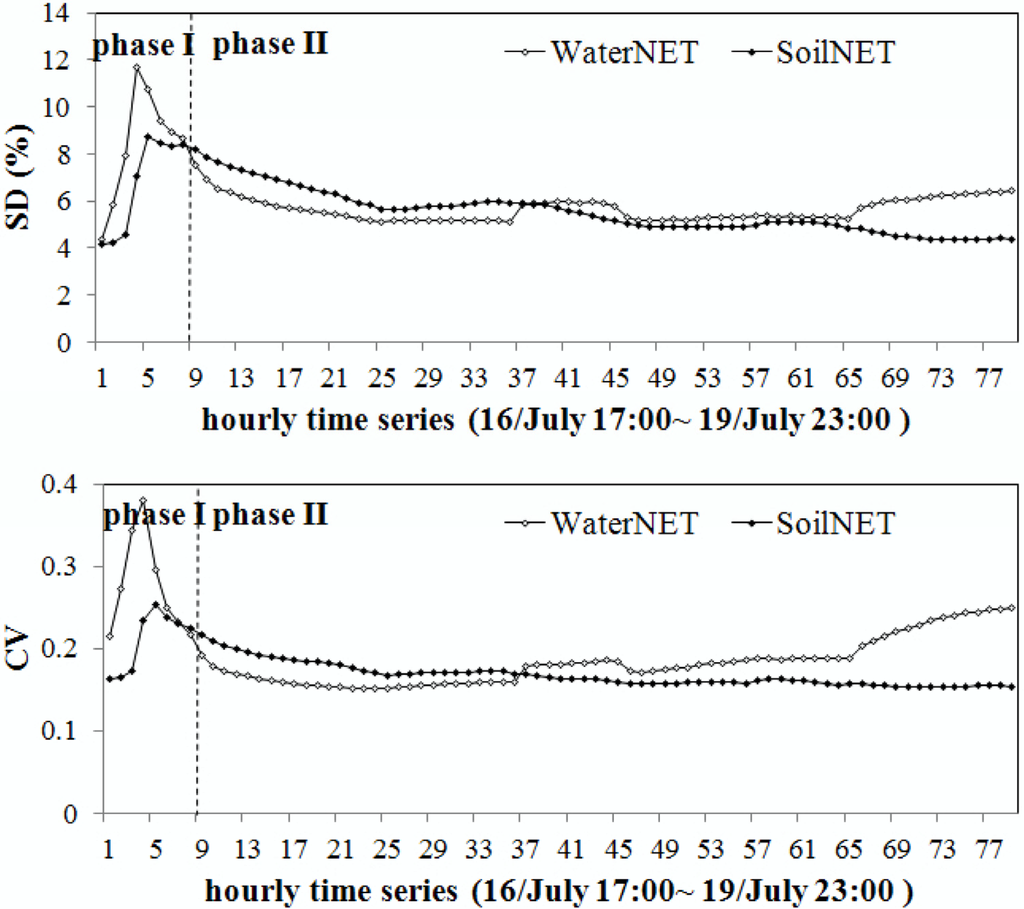
Figure 5.
Dynamics of the spatial variability for SoilNET and WaterNET.
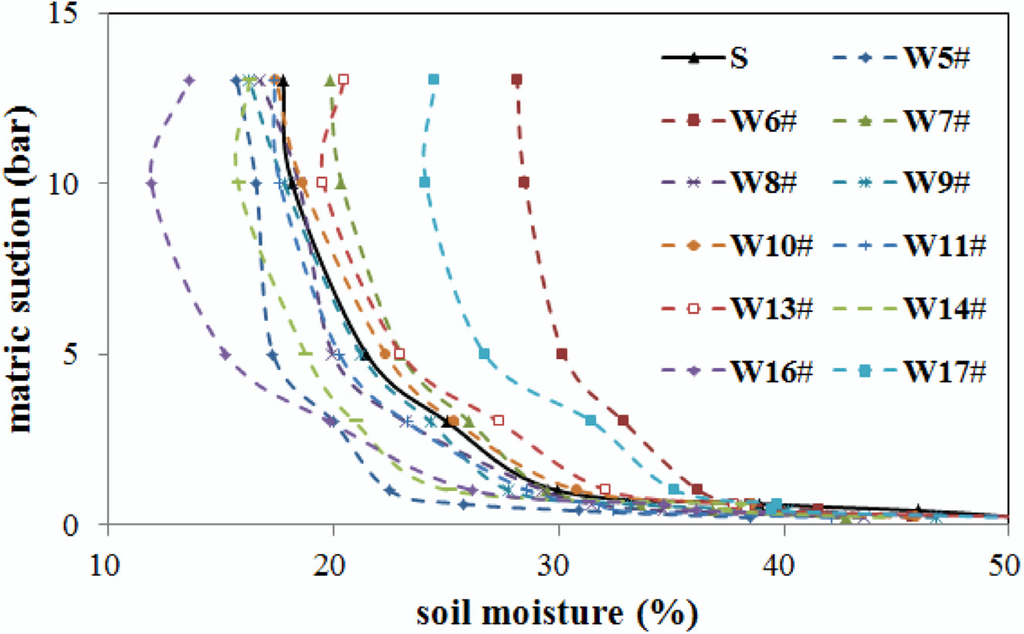
Figure 6.
Soil moisture characteristic curves of the SoilNET and WaterNET samples. S means the measurement sample at SoilNET and W*# means the samples at WaterNET.
The “actual” uncertainty is the combination of sampling error and spatial variability. Figure 7 shows the uncertainty of WaterNET, sub-WatetNET and SoilNET. The lowest uncertainty occurs in SoilNET. Specifically, the mean Uabs are 8.8%, 6.6% and 5.6% for the WaterNET, sub-WaterNET and SoilNET. These values are 11.7%, 10.0% and 6.9% during rainfall, and 8.5%, 6.2% and 5.5% after rainfall. Meanwhile, the Urel are 0.26, 0.21 and 0.17 over the study period, 0.34, 0.32 and 0.26 during rainfall, and 0.25, 0.19 and 0.16 after rainfall. The uncertainties of sub-WaterNET and SoilNET are lower than those of WaterNET, which is attributed to the heterogeneous environmental variables. Temporally, uncertainty is high during rainfall and low after rainfall. For SoilNET, soil moisture increases as rainwater enters the soil. However, this increased rate is different for the heterogeneous soil properties. After rainfall, soil moisture decreases through evapotranspiration. Because the main influencing factors of evapotranspiration (i.e., soil property, land cover) are homogeneous in a small area, similar soil moisture decreases would be observed. Under this condition, soil moisture is homogeneous and uncertainty is low. Uncertainty of WaterNET increases consistently during phase II after rainfall; the reason is that the sampling error of WaterNET increases and enhances the uncertainty with the drying soil moisture (Figure 4).
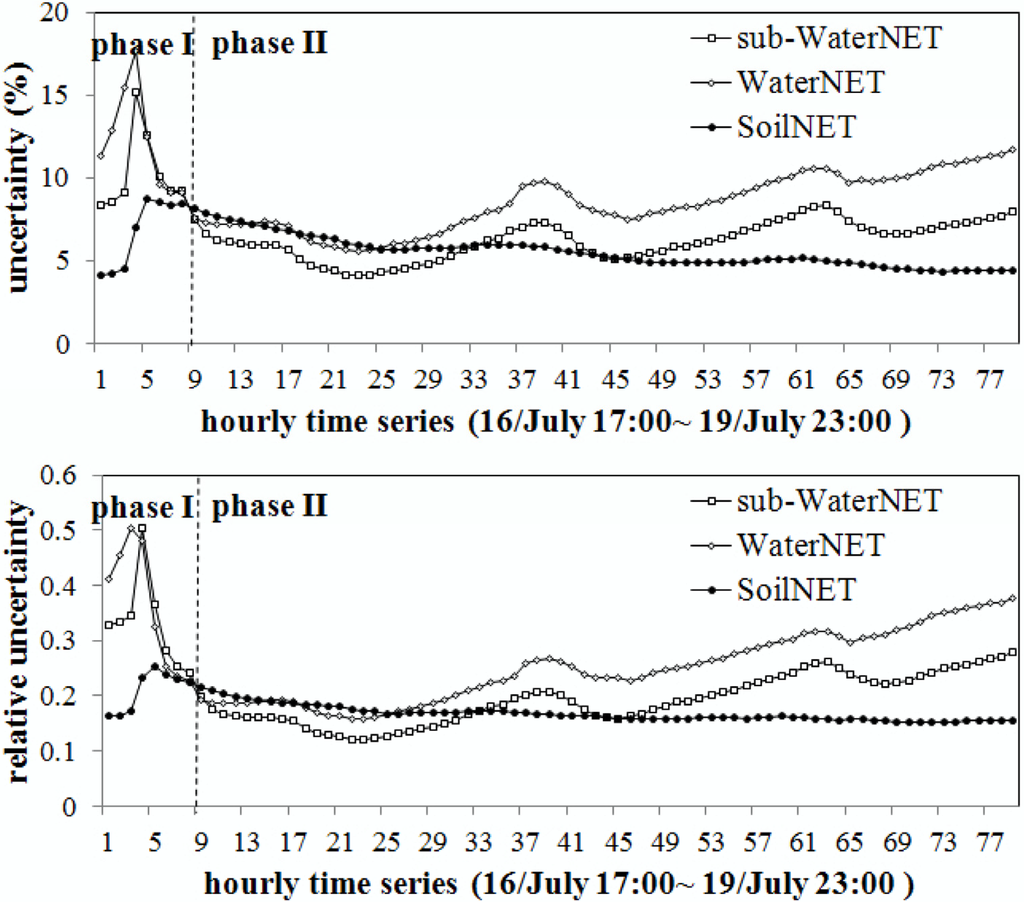
Figure 7.
The absolute (top) and relative (bottom) uncertainties of SoilNET, sub-WaterNET and WaterNET.
It is important to identify the representative in-situ soil moisture for validation or calibration of satellite-retrieved data. Previous studies that employed the “temporal stability” analysis revealed that in-situ data has similar trend with spatial soil moisture of a large area, which helps to identify the representative in-situ soil moisture [51,52,53,54]. Figure 8 shows the differences between each in-situ soil moisture and the spatial mean of WaterNET and SoilNET. The minor differences occur in station 2# (<0.1%) for WaterNET and station 5# (0.2%) for SoilNET. Meanwhile, the corresponding time standard deviations are also minor. It means that soil moisture from these two in-situ stations are closed to the spatial mean continuously, which could be used to represent the spatial soil moisture and validate the corresponding satellite-retrieved data sets.
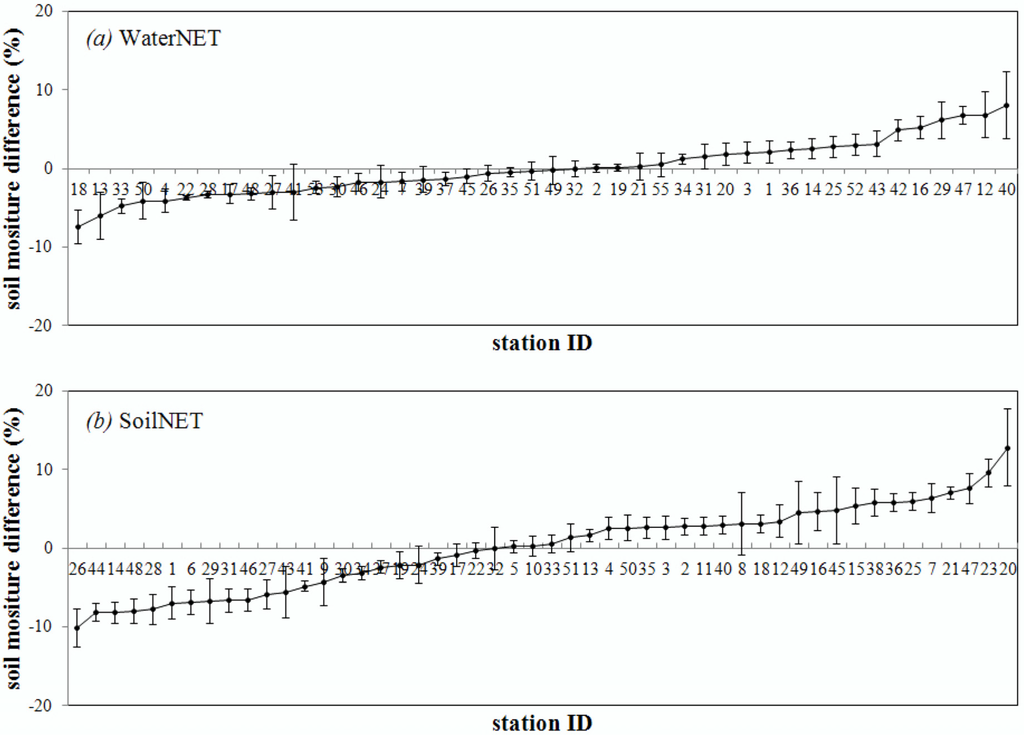
Figure 8.
Rank ordered mean relative differences with standard deviation (vertical bar) for the soil moisture monitoring campaigns carried out for: (a) WaterNET and (b) SoilNET.
4.3. Correlations between Uncertainty and Soil Moisture
This study then examines the correlations between uncertainties with spatial mean and PDF (Table 1). At WaterNET scale, correlations with PDF are mainly higher than that with spatial mean. That is because sampling error influences the uncertainty significantly at a large scale. In other words, the spatial pattern, which is determined by sampling configuration, is strongly correlated to the uncertainty. Temporally, the correlations are weak during rainfall. The correlation coefficients (R) are mainly less than 0.4, except for the correlation between the uncertainties of the mean soil moisture and kurtosis. After rainfall, however, this significance increases (R > 0.7). Moreover, the coefficients of relative uncertainty (Urel) are much greater than those of the absolute uncertainty (Uabs). It means that Urel after rainfall could be estimated from soil moisture if the regression is built at a large area. Meanwhile, both Uabs and Urel present negative correlations to spatial mean after rainfall. The reason is that soil moisture decreases in this phase, while the uncertainty increases with the increasing sampling error in dry condition.
In contrast with WaterNET, uncertainty is mainly positively correlated to the spatial mean in SoilNET. Meanwhile, correlations with spatial mean (R > 0.8) are higher than with PDF (R < 0.8). It means that as environmental variables (i.e., land cover and topography) are relatively homogeneous at a small area, uncertainty of in-situ soil moisture is strongly correlated to the spatial mean. Furthermore, the correlation coefficients of Uabs are greater than those of Urel. That is because Urel eliminates the effects of spatial soil moisture according to its calculation equation. Temporally, the correlations are mainly lower during rainfall than after rainfall. That is because soil property is the main influencing factor of soil moisture variability at small area. It generates heterogeneous infiltration during rainfall and increases the uncertainty, which weakens the correlation with soil moisture.

Table 1.
Correlations between uncertainties with the mean soil moisture and PDF.
| WaterNET | |||||
|---|---|---|---|---|---|
| phase | index | Uabs | Urel | ||
| R | p | R | p | ||
| I | mean | 0.59 | 0.091 | −0.10 | 0.839 |
| skewness | −0.28 | 0.45 | 0.40 | 0.288 | |
| kurtosis | −0.57 | 0.112 | 0.17 | 0.659 | |
| II | mean | −0.08 | 0.688 | −0.74 | <0.001 |
| skewness | 0.37 | 0.001 | 0.85 | <0.001 | |
| kurtosis | 0.69 | <0.001 | 0.93 | <0.001 | |
| SoilNET | |||||
| phase | index | Uabs | Urel | ||
| R | p | R | p | ||
| I | mean | 0.95 | <0.001 | 0.82 | 0.007 |
| skewness | 0.66 | 0.051 | 0.80 | 0.01 | |
| kurtosis | −0.14 | 0.689 | −0.07 | 0.945 | |
| II | mean | 0.96 | <0.001 | 0.89 | <0.001 |
| skewness | 0.57 | <0.001 | 0.55 | <0.001 | |
| kurtosis | 0.65 | <0.001 | 0.62 | <0.001 | |
5. Discussion
It was necessary to discuss and distinguish the concepts of measurement uncertainty, error and accuracy. Error and accuracy referred to the difference and closeness between a specific measurement result and the true value, which were usually adopted to evaluate the measurement quantity. However, the measurement result varied in measurement exercises, which usually present a random distribution pattern and generated significant uncertainty for the specific measurement [55,56]. Therefore, it was required to quantify this uncertainty before evaluating the measurement quantity. This study revealed the complex characteristics of uncertainty at different spatial scales, which required a further discussion. In previous studies, sampling configurations were the same across different spatial scales, and the sampling error was neglected [22,23,24,28,29,30]. However, in-situ soil moisture networks were usually built using multiple strategies, which would generate significant sampling error. Result of this study revealed that sampling error increases in drying condition at a large extent, which played an important role in the degree and dynamics of uncertainty. Thus, sampling error should be considered when examining uncertainty.
The land surface characteristics (land cover, topography and soil property) were main factors influencing on soil moisture spatial variation at basin and regional scales [57,58]. Wind was also an important factor affecting evapotranspiration and subsequently the uncertainty, while its effect was temporary when compared with the factors above. The study area was characterized by the flat topography and heterogeneous land cover and soil property with the increasing extent. Under this condition, the uncertainty was higher at a large scale than at small scale. Because of the heterogeneous infiltration that generated by soil property (Figure 6), uncertainty was high during rainfall. The spatial and temporal characteristics of uncertainty were useful for obtaining accurate spatial soil moisture and for validating and calibrating satellite-retrieved data sets. They could also help to identify the representative in-situ soil moisture (station 2# for WaterNET and station 5# for SoilNET in this study) through the time stability analysis. Uncertainty was strongly correlated to spatial mean at small scale (SoilNET). That was because environmental variables are homogeneous at small scale, the uncertainty was mainly correlated to the soil properties and soil moisture itself. At large area (WaterNET), the heterogeneity of soil moisture increased for the effects of environmental factors, which generated a significant correlation between relative uncertainty to the PDF. Through the correlations, the empirical regressions between uncertainty and soil moisture could be built. These regressions can be further used to calculate the uncertainty, including its evolution with drying and wetting [24].
The results of this study could be used to evaluate the uncertainty of in-situ soil moisture for different remote sensing footprints. The environmental variables play complex and interactive role in the uncertainty, which are generally difficult to isolate and measure [28]. Famiglietti et al. [24] further concluded that each factor can either enhance or reduce the spatial variability of soil moisture depending on how it is spatial distributed and how it is combined with other factors. Because soil moisture was influenced by several factors with complex interactions, no single factor can fully explain soil moisture variability. Thus, a comprehensive investigation regarding the causes of the spatial variability of soil moisture and their effects on uncertainty should be performed.
6. Conclusions
In this study, the uncertainty of in-situ soil moisture was quantified with the combination of spatial variability and sampling error. Table 2 summarized the composition of uncertainties at different scales with examinations of WaterNET and SoilNET. The weights of spatial variability and sampling error to the uncertainty varied with scales. At a small scale, the effect of sampling error could be neglected and the uncertainty referred to the spatial variability of soil moisture. At a large scale, however, sampling error played an increasing role.
Table 2.
Uncertainties of WaterNET and SoilNET.
| Network | Time | Sampling Error (%) | SD (%) | CV | Uabs (%) | Urel |
|---|---|---|---|---|---|---|
| WaterNET | study period | 2.9 | 5.9 | 0.19 | 8.8 | 0.26 |
| phase I | 3.3 | 8.3 | 0.26 | 11.7 | 0.34 | |
| phase II | 2.8 | 5.6 | 0.18 | 8.5 | 0.25 | |
| SoilNET | study period | -- | 5.6 | 0.17 | 5.6 | 0.17 |
| phase I | -- | 6.9 | 0.21 | 6.9 | 0.21 | |
| phase II | -- | 5.5 | 0.16 | 5.5 | 0.16 |
The results of Table 2 revealed that the uncertainty of soil moisture increased with increasing extent, which were consistent with the previous studies [22,23,24,28,29,30]. Temporally, the uncertainty was higher during rainfall than that after then. It could be concluded that uncertainty of in-situ soil moisture was relative low at a small scale after rainfall, which could be used to validate satellite-retrieved soil moisture. The uncertainty was strongly correlated to soil moisture, which varied with spatial and temporal scales. Generally, the uncertainty was strongly correlated to mean soil moisture at a small scale and was to the spatial pattern at a large scale. Temporally, the correlations were weak during rainfall. Therefore, researchers should consider the temporal characteristics and influencing factors when discussing the uncertainty.
This study evaluated the uncertainty of in-situ soil moisture at different scales. As mentioned above, the uncertainty was influenced by several factors with complex interaction. The relationship between the uncertainty and its influencing factors would be investigated in the further research.
Acknowledgments
This work was supported by the National Natural Science Foundation of China (No. 91125004). Datasets of land cover classification and the boundaries of the study area were provided by M. Ma and Associate R. Jin. The boundary of the Heihe Basin was available from the Cold and Arid Regions Sciences Data Center (http://westdc.westgis.ac.cn). We highly appreciate the anonymous reviewers for their constructive comments on this manuscript.
Author Contributions
Huihui Feng carried out data processing, data analysis and wrote the paper. Yuanbo Liu proposed the main idea, offered guidance to complete the work and made revisions to the manuscript. Guiping Wu participated in data analysis.
Conflicts of Interest
The authors declare no conflicts of interest.
References
- James, A.L.; Roulet, N.T. Antecedent moisture conditions and catchment morphology as controls on spatial patterns of runoff generation in small forest catchments. J. Hydrol. 2009, 377, 351–366. [Google Scholar] [CrossRef]
- Champagne, C.; Berg, A.A.; McNairn, H.; Drewitt, G.; Huffman, T. Evaluation of soil moisture extremes for agricultural productivity in the canadian prairies. Agric. For. Meteorol. 2012, 165, 1–11. [Google Scholar] [CrossRef]
- Savva, Y.; Szlavecz, K.; Carlson, D.; Gupchup, J.; Szalay, A.; Terzis, A. Spatial patterns of soil moisture under forest and grass land cover in a suburban area, in maryland, USA. Geoderma 2013, 192, 202–210. [Google Scholar] [CrossRef]
- Venkatesh, B.; Lakshman, N.; Purandara, B.K.; Reddy, V.B. Analysis of observed soil moisture patterns under different land covers in western ghats, India. J. Hydrol. 2011, 397, 281–294. [Google Scholar] [CrossRef]
- Walker, J.P.; Willgoose, G.R.; Kalma, J.D. In situ measurement of soil moisture: A comparison of techniques. J. Hydrol. 2004, 293, 85–99. [Google Scholar] [CrossRef]
- Brocca, L.; Tullo, T.; Melone, F.; Moramarco, T.; Morbidelli, R. Catchment scale soil moisture spatial-temporal variability. J. Hydrol. 2012, 422–423, 63–75. [Google Scholar] [CrossRef]
- Qin, J.; Yang, K.; Lu, N.; Chen, Y.; Zhao, L.; Han, M. Spatial upscaling of in-situ soil moisture measurements based on modis-derived apparent thermal inertia. Remote. Sens. Environ. 2013, 138, 1–9. [Google Scholar] [CrossRef]
- Brocca, L.; Zucco, G.; Moramarco, T.; Morbidelli, R. Developing and testing a long-term soil moisture dataset at the catchment scale. J. Hydrol. 2013, 490, 144–151. [Google Scholar] [CrossRef]
- Cheema, M.J.M.; Bastiaanssen, W.G.M.; Rutten, M.M. Validation of surface soil moisture from AMSR-E using auxiliary spatial data in the transboundary Indus basin. J. Hydrol. 2011, 405, 137–149. [Google Scholar] [CrossRef]
- Loew, A.; Schlenz, F. A dynamic approach for evaluating coarse scale satellite soil moisture products. Hydrol. Earth. Syst. Sci. 2011, 15, 75–90. [Google Scholar] [CrossRef]
- Mahmood, R.; Hubbard, K.G. Simulating sensitivity of soil moisture and evapotranspiration under heterogeneous soils and land uses. J. Hydrol. 2003, 280, 72–90. [Google Scholar] [CrossRef]
- Cho, E.; Choi, M.; Wagner, W. An assessment of remotely sensed surface and root zone soil moisture through active and passive sensors in northeast Asia. Remote. Sens. Environ. 2015, 160, 166–179. [Google Scholar] [CrossRef]
- Dorigo, W.A.; Gruber, A.; de Jeu, R.A.M.; Wagner, W.; Stacke, T.; Loew, A.; Albergel, C.; Brocca, L.; Chung, D.; Parinussa, R.M.; et al. Evaluation of the ESA CCI soil moisture product using ground-based observations. Remote. Sens. Environ. 2014. [Google Scholar] [CrossRef]
- English, N.B.; Weltzin, J.F.; Fravolini, A.; Thomas, L.; Williams, D.G. The influence of soil texture and vegetation on soil moisture under rainout shelters in a semi-desert grassland. J. Arid. Environ. 2005, 63, 324–343. [Google Scholar] [CrossRef]
- Neris, J.; Jiménez, C.; Fuentes, J.; Morillas, G.; Tejedor, M. Vegetation and land-use effects on soil properties and water infiltration of andisols in tenerife (canary islands, spain). CATENA 2012, 98, 55–62. [Google Scholar] [CrossRef]
- Gómez-Plaza, A.; Martı́nez-Mena, M.; Albaladejo, J.; Castillo, V.M. Factors regulating spatial distribution of soil water content in small semiarid catchments. J. Hydrol. 2001, 253, 211–226. [Google Scholar] [CrossRef]
- Chen, L.; Huang, Z.; Gong, J.; Fu, B.; Huang, Y. The effect of land cover/vegetation on soil water dynamic in the hilly area of the loess plateau, China. CATENA 2007, 70, 200–208. [Google Scholar] [CrossRef]
- Qiu, Y.; Fu, B.; Wang, J.; Chen, L. Soil moisture variation in relation to topography and land use in a hillslope catchment of the loess plateau, China. J. Hydrol. 2001, 240, 243–263. [Google Scholar] [CrossRef]
- Olchev, A.; Ibrom, A.; Priess, J.; Erasmi, S.; Leemhuis, C.; Twele, A.; Radler, K.; Kreilein, H.; Panferov, O.; Gravenhorst, G. Effects of land-use changes on evapotranspiration of tropical rain forest margin area in central sulawesi (Indonesia): Modelling study with a regional svat model. Ecol. Model. 2008, 212, 131–137. [Google Scholar] [CrossRef]
- Mapa, R.B. Effect of reforestation using tectona grandis on infiltration and soil water retention. Forest. Ecol. Manag. 1995, 77, 119–125. [Google Scholar] [CrossRef]
- Thierfelder, C.; Wall, P.C. Effects of conservation agriculture techniques on infiltration and soil water content in Zambia and Zimbabwe. Soil. Till. Res. 2009, 105, 217–227. [Google Scholar] [CrossRef]
- Li, B.; Rodell, M. Spatial variability and its scale dependency of observed and modeled soil moisture over different climate regions. Hydrol. Earth Syst. Sci. 2013, 17, 1177–1188. [Google Scholar] [CrossRef]
- Western, A.W.; Grayson, R.B.; Blöschl, G. Scaling of soil moisture: A hydrologic perspective. Annu. Rev. Earth Planet. Sci. 2002, 30, 149–180. [Google Scholar] [CrossRef]
- Famiglietti, J.S.; Ryu, D.; Berg, A.A.; Rodell, M.; Jackson, T.J. Field observations of soil moisture variability across scales. Water Resour. Res. 2008, 44. [Google Scholar] [CrossRef]
- Entekhabi, D.; Rodriguez-Iturbe, I. Analytical framework for the characterization of the space-time variability of soil moisture. Adv. Water Resour. 1994, 17, 35–45. [Google Scholar] [CrossRef]
- Peters-Lidard, C.D.; Pan, F. Re-thinking the contradictions of soil moisture spatial variability. In Proceedings of AGU 2002 Fall Meeting, San Francisco, CA, USA, 6–10 December 2002. abstract #NG12C-1042.
- Teuling, A.J.; Troch, P.A. Improved understanding of soil moisture variability dynamics. Geophys. Res. Lett. 2005, 32. [Google Scholar] [CrossRef]
- Crow, W.T.; Berg, A.A.; Cosh, M.H.; Loew, A.; Mohanty, B.P.; Panciera, R.; Rosnay, P.D.; Ryu, D.; Walker, J.P. Upscaling sparse ground-based soil moisture observations for the validation of coarse-resolution satellite soil moisture products. Rev. Geophys. 2012. [Google Scholar] [CrossRef]
- Western, A.W.; Blöschl, G. On the spatial scaling of soil moisture. J. Hydrol. 1999, 217, 203–224. [Google Scholar] [CrossRef]
- Famiglietti, J.S.; Devereaux, J.A.; Laymon, C.; Tsegaye, T.; Houser, P.; Jackson, T.J.; Graham, S.T.; Rodell, M.; Oevelen, P.J.V. Ground-based investigation of soil moisture variability within remote sensing footprints during the southern great plains 1997 (sgp97) hydrology experiment. Water Resour. Res. 1999, 35, 1839–1851. [Google Scholar] [CrossRef]
- Brocca, L.; Morbidelli, R.; Melone, F.; Moramarco, T. Soil moisture spatial variability in experimental areas of central Italy. J. Hydrol. 2007, 333, 356–373. [Google Scholar] [CrossRef]
- Blöschl, G.; Sivapalan, M. Scale issues in hydrological modelling: A review. Hydrol. Process 1995, 9, 251–290. [Google Scholar] [CrossRef]
- Crow, W.T.; Wood, E.F. Multi-scale dynamics of soil moisture variability observed during sgp’97. Geophys. Res. Lett. 1999, 26, 3485–3488. [Google Scholar] [CrossRef]
- Crow, W.T.; Wood, E.F. The value of coarse-scale soil moisture observations for regional surface energy balance modeling. J. Hydrometeorol. 2002, 3, 467–482. [Google Scholar] [CrossRef]
- Bell, K.R.; Blanchard, B.J.; Schmugge, T.J.; Witczak, M.W. Analysis of surface moisture variations within large-field sites. Water. Resour. Res. 1980, 16, 796–810. [Google Scholar] [CrossRef]
- Famiglietti, J.S.; Rudnicki, J.W.; Rodell, M. Variability in surface moisture content along a hillslope transect: Rattlesnake hill, Texas. J. Hydrol. 1998, 210, 259–281. [Google Scholar] [CrossRef]
- Cho, E.; Choi, M. Regional scale spatio-temporal variability of soil moisture and its relationship with meteorological factors over the korean peninsula. J. Hydrol. 2014. [Google Scholar] [CrossRef]
- Beven, K. Linking parameters across scales: Subgrid parameterizations and scale dependent hydrological models. Hydrol. Process. 1995, 9, 507–522. [Google Scholar] [CrossRef]
- Li, X.; Cheng, G.; Liu, S.; Xiao, Q.; Ma, M.; Jin, R.; Che, T.; Liu, Q.; Wang, W.; Qi, Y.; et al. Heihe watershed allied telemetry experimental research (HiWATER): Scientific objectives and experimental design. Bull. Am. Meteorol. Soc. 2013, 94, 1145–1160. [Google Scholar] [CrossRef]
- Pastuszka, T.; Krzyszczak, J.; Sławiński, C.; Lamorski, K. Effect of time-domain reflectometry probe location on soil moisture measurement during wetting and drying processes. Measurement 2014, 49, 182–186. [Google Scholar] [CrossRef]
- Kang, J.; Li, X.; Jin, R.; Ge, Y.; Wang, J.; Wang, J. Hybrid optimal design of the eco-hydrological wireless sensor network in the middle reach of the Heihe River Basin, China. Sensors 2014, 14, 19095–19114. [Google Scholar] [CrossRef] [PubMed]
- Carsel, R.F.; Parrish, R.S. Developing joint probability distributions of soil water retention characteristics. Water. Resour. Res. 1988, 24, 755–769. [Google Scholar] [CrossRef]
- Charpentier, M.A.; Groffman, P.M. Soil moisture variability within remote sensing pixels. J. Geophys. Res.: Atmos. 1992, 97, 18987–18995. [Google Scholar] [CrossRef]
- Cheng, G.; Li, X.; Zhao, W.; Xu, Z.; Feng, Q.; Xiao, S.; Xiao, H. Integrated study of the water-ecosystem-economy in the heihe river basin. Natl. Sci. Rev. 2014, 1, 413–428. [Google Scholar] [CrossRef]
- Ge, Y.; Liang, Y.; Wang, J.; Zhao, Qi.; Liu, S. Upscaling Sensible Heat Fluxes With Area-to-Area Regression Kriging. IEEE. Geosci. Remote. Sens. 2015, 12, 656–660. [Google Scholar] [CrossRef]
- Jin, R.; Li, X.; Yan, B.; Li, X.; Luo, W.; Ma, M.; Guo, J.; Kang, J.; Zhu, Z.; Zhao, S. A nested ecohydrological wireless sensor network for capturing the surface heterogeneity in the midstream areas of the Heihe River Basin, China. IEEE. Geosci. Remote. Sens. Lett. 2014, 11, 2015–2019. [Google Scholar] [CrossRef]
- Cold and Arid Regions Sciences Data Center. Available online: http://westdc.westgis.ac.cn/ (accessed on 18 August 2013).
- Ojha, R.; Morbidelli, R.; Saltalippi, C.; Flammini, A.; Govindaraju, R.S. Scaling of surface soil moisture over heterogeneous fields subjected to a single rainfall event. J. Hydrol. 2014, 516, 21–36. [Google Scholar] [CrossRef]
- Ma, M.; Chen, Y.; Wang, X.; Han, H.; Yu, W.; H, W.; Shang, H. Hiwater: Dataset of soil parameters in the middle streams of heihe river basin. Cold Arid Reg. Environ. Eng. Res. Instit. Chin. Acad. Sci. 2012. [Google Scholar] [CrossRef]
- Yoo, C.; Valdés, J.B.; North, G.R. Evaluation of the impact of rainfall on soil moisture variability. Adv. Water. Resour. 1998, 21, 375–384. [Google Scholar] [CrossRef]
- Vachaud, G.; Passerat De Silans, A.; Balabanis, P. Temporal stability of spatially measured soil water probability density function. Soil Sci. Soc. Am. J. 1985, 49, 822–828. [Google Scholar]
- Jacobs, J.M.; Mohanty, B.P.; En-Ching, H.; Miller, D. SMEX02: Field scale variability, time stability and similarity of soil moisture. Remote Sens. Environ. 2004, 92, 436–446. [Google Scholar] [CrossRef]
- Cosh, M.H.; Jackson, T.J.; Moran, S.; Bindlish, R. Temporal persistence and stability of surface soil moisture in a semi-arid watershed. Remote Sens. Environ. 2008, 112, 304–313. [Google Scholar] [CrossRef]
- Brocca, L.; Melone, F.; Moramarco, T.; Morbidelli, R. Soil moisture temporal stability over experimental areas in Central Italy. Geoderma 2009, 148, 364–374. [Google Scholar] [CrossRef]
- Chunovkina, A.G. Measurement error, measurement uncertainty, and measurand uncertainty. Meas. Tech. 2000, 43, 581–586. [Google Scholar] [CrossRef]
- Kuznetsov, V.P. Error of measurement and uncertainty: A comparison. Meas. Tech. 2003, 46, 751–760. [Google Scholar] [CrossRef]
- Mohanty, B.P.; Skaggs, T.H. Spatio-temporal evolution and time-stable characteristics of soil moisture within remote sensing footprints with varying soil, slope, and vegetation. Adv. Water Resour. 2001, 24, 1051–1067. [Google Scholar] [CrossRef]
- Sur, C.; Jung, Y.; Choi, M. Temporal stability and variability of field scale soil moisture on mountainous hillslopes in Northeast Asia. Geoderma 2013, 207–208, 234–243. [Google Scholar] [CrossRef]
© 2015 by the authors; licensee MDPI, Basel, Switzerland. This article is an open access article distributed under the terms and conditions of the Creative Commons Attribution license (http://creativecommons.org/licenses/by/4.0/).