
Spectroscopic Remote Sensing of Non-Structural Carbohydrates in Forest Canopies


Abstract
:
1. Introduction
2. Methods
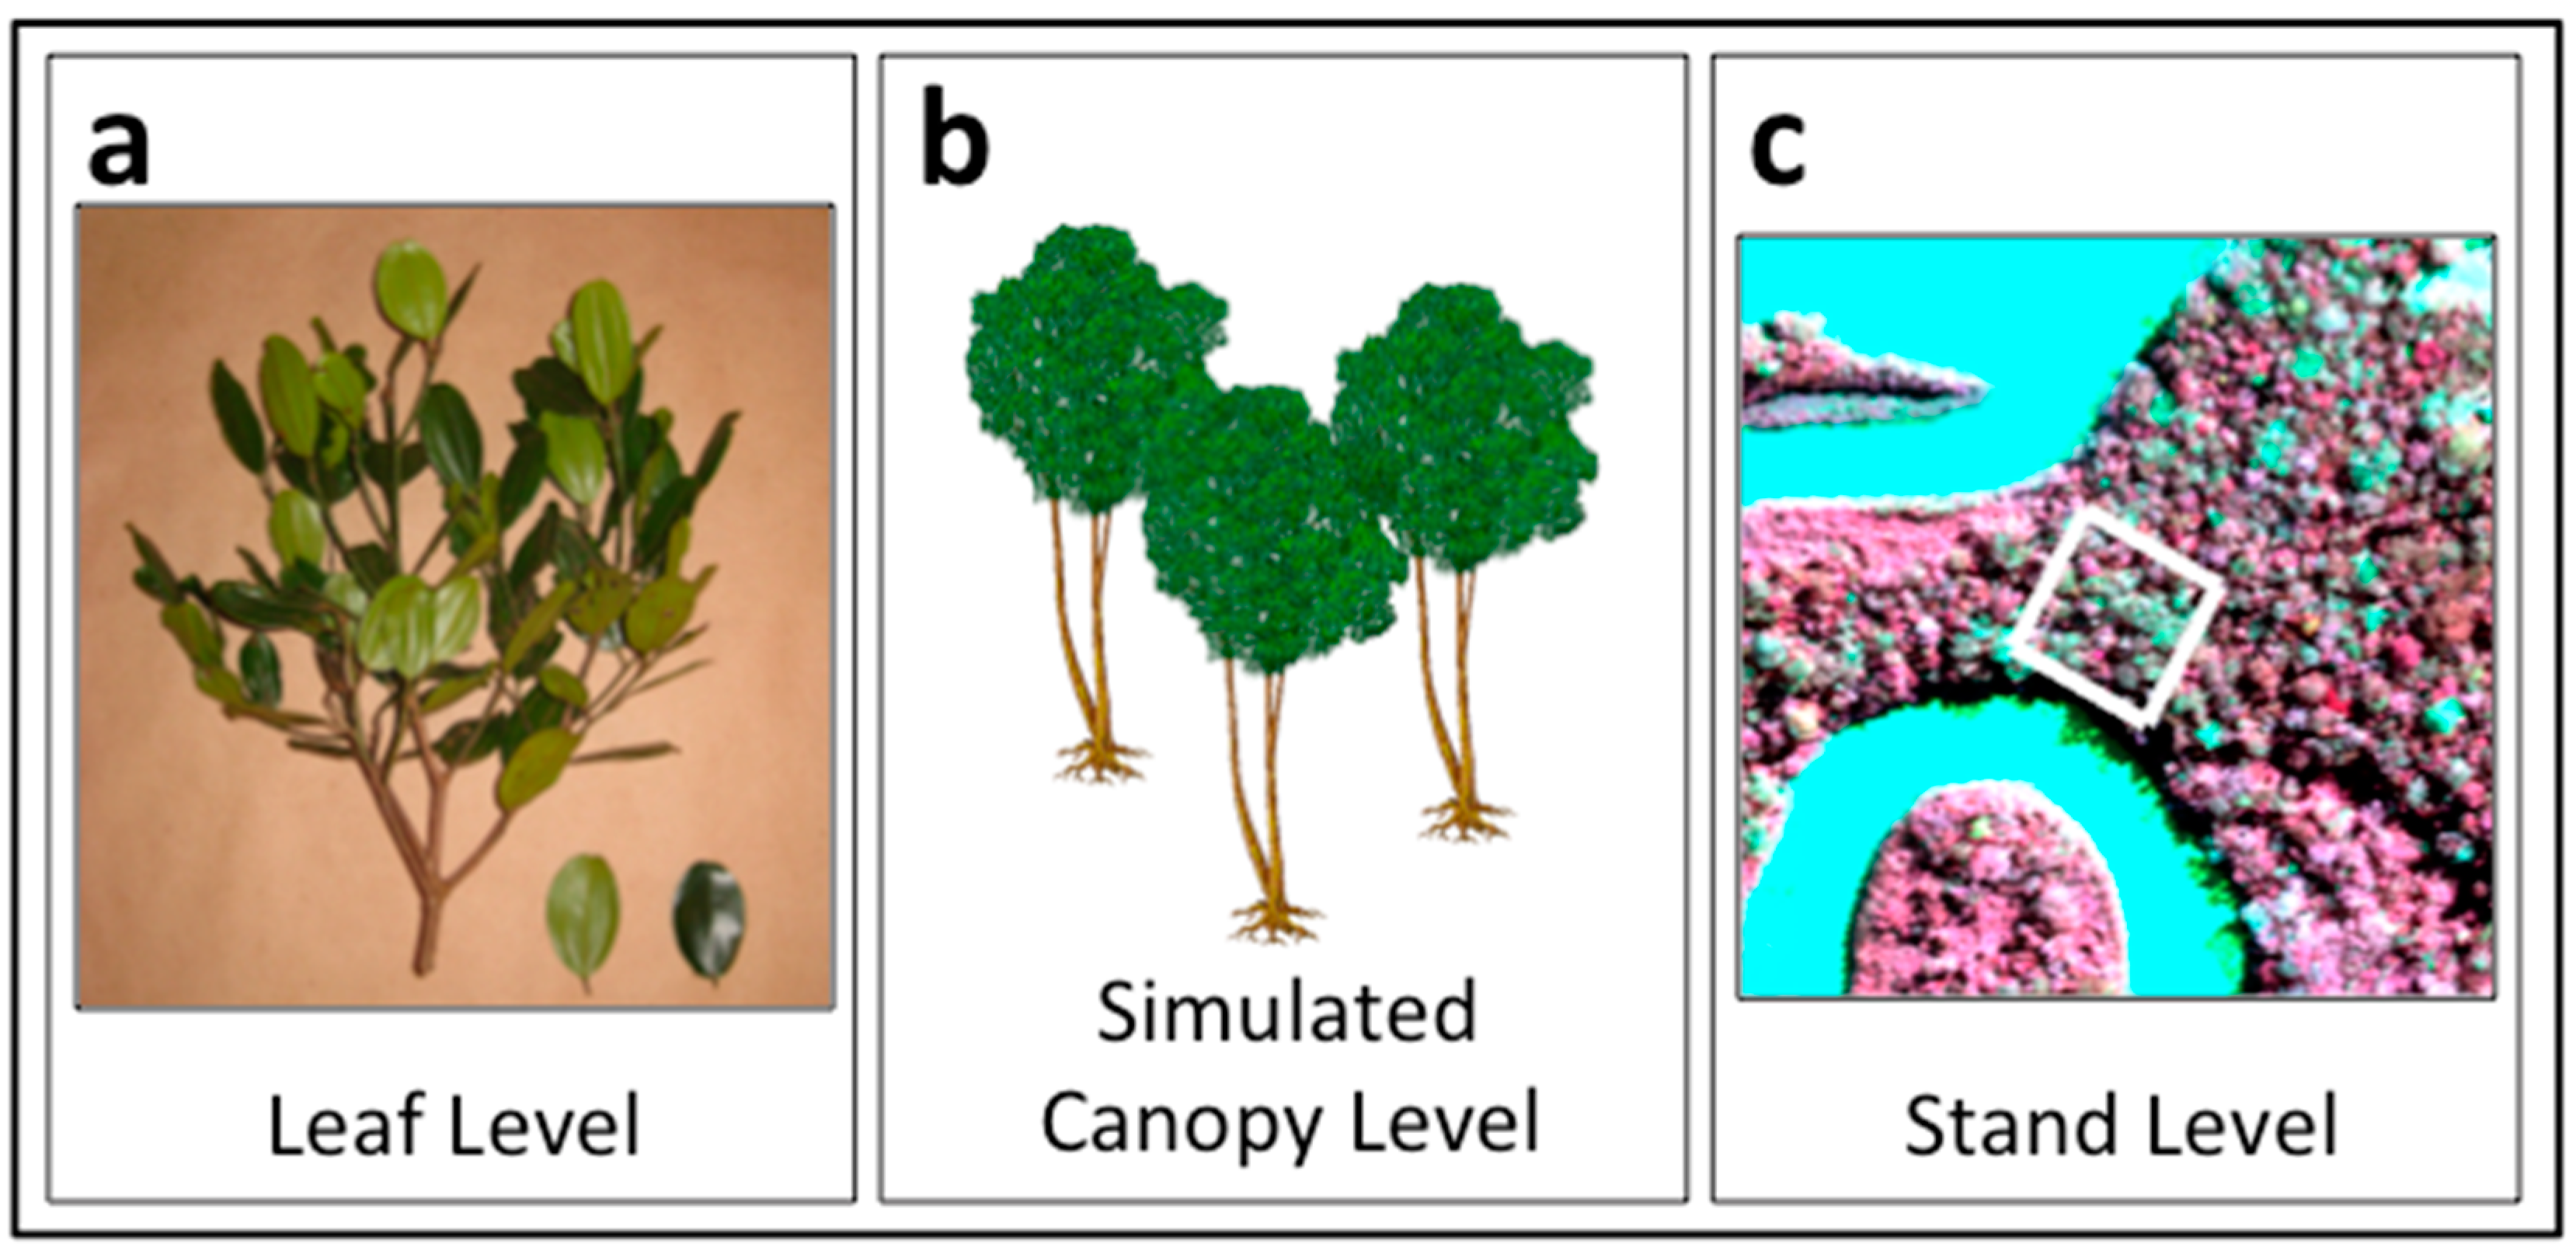
2.1. General Approach

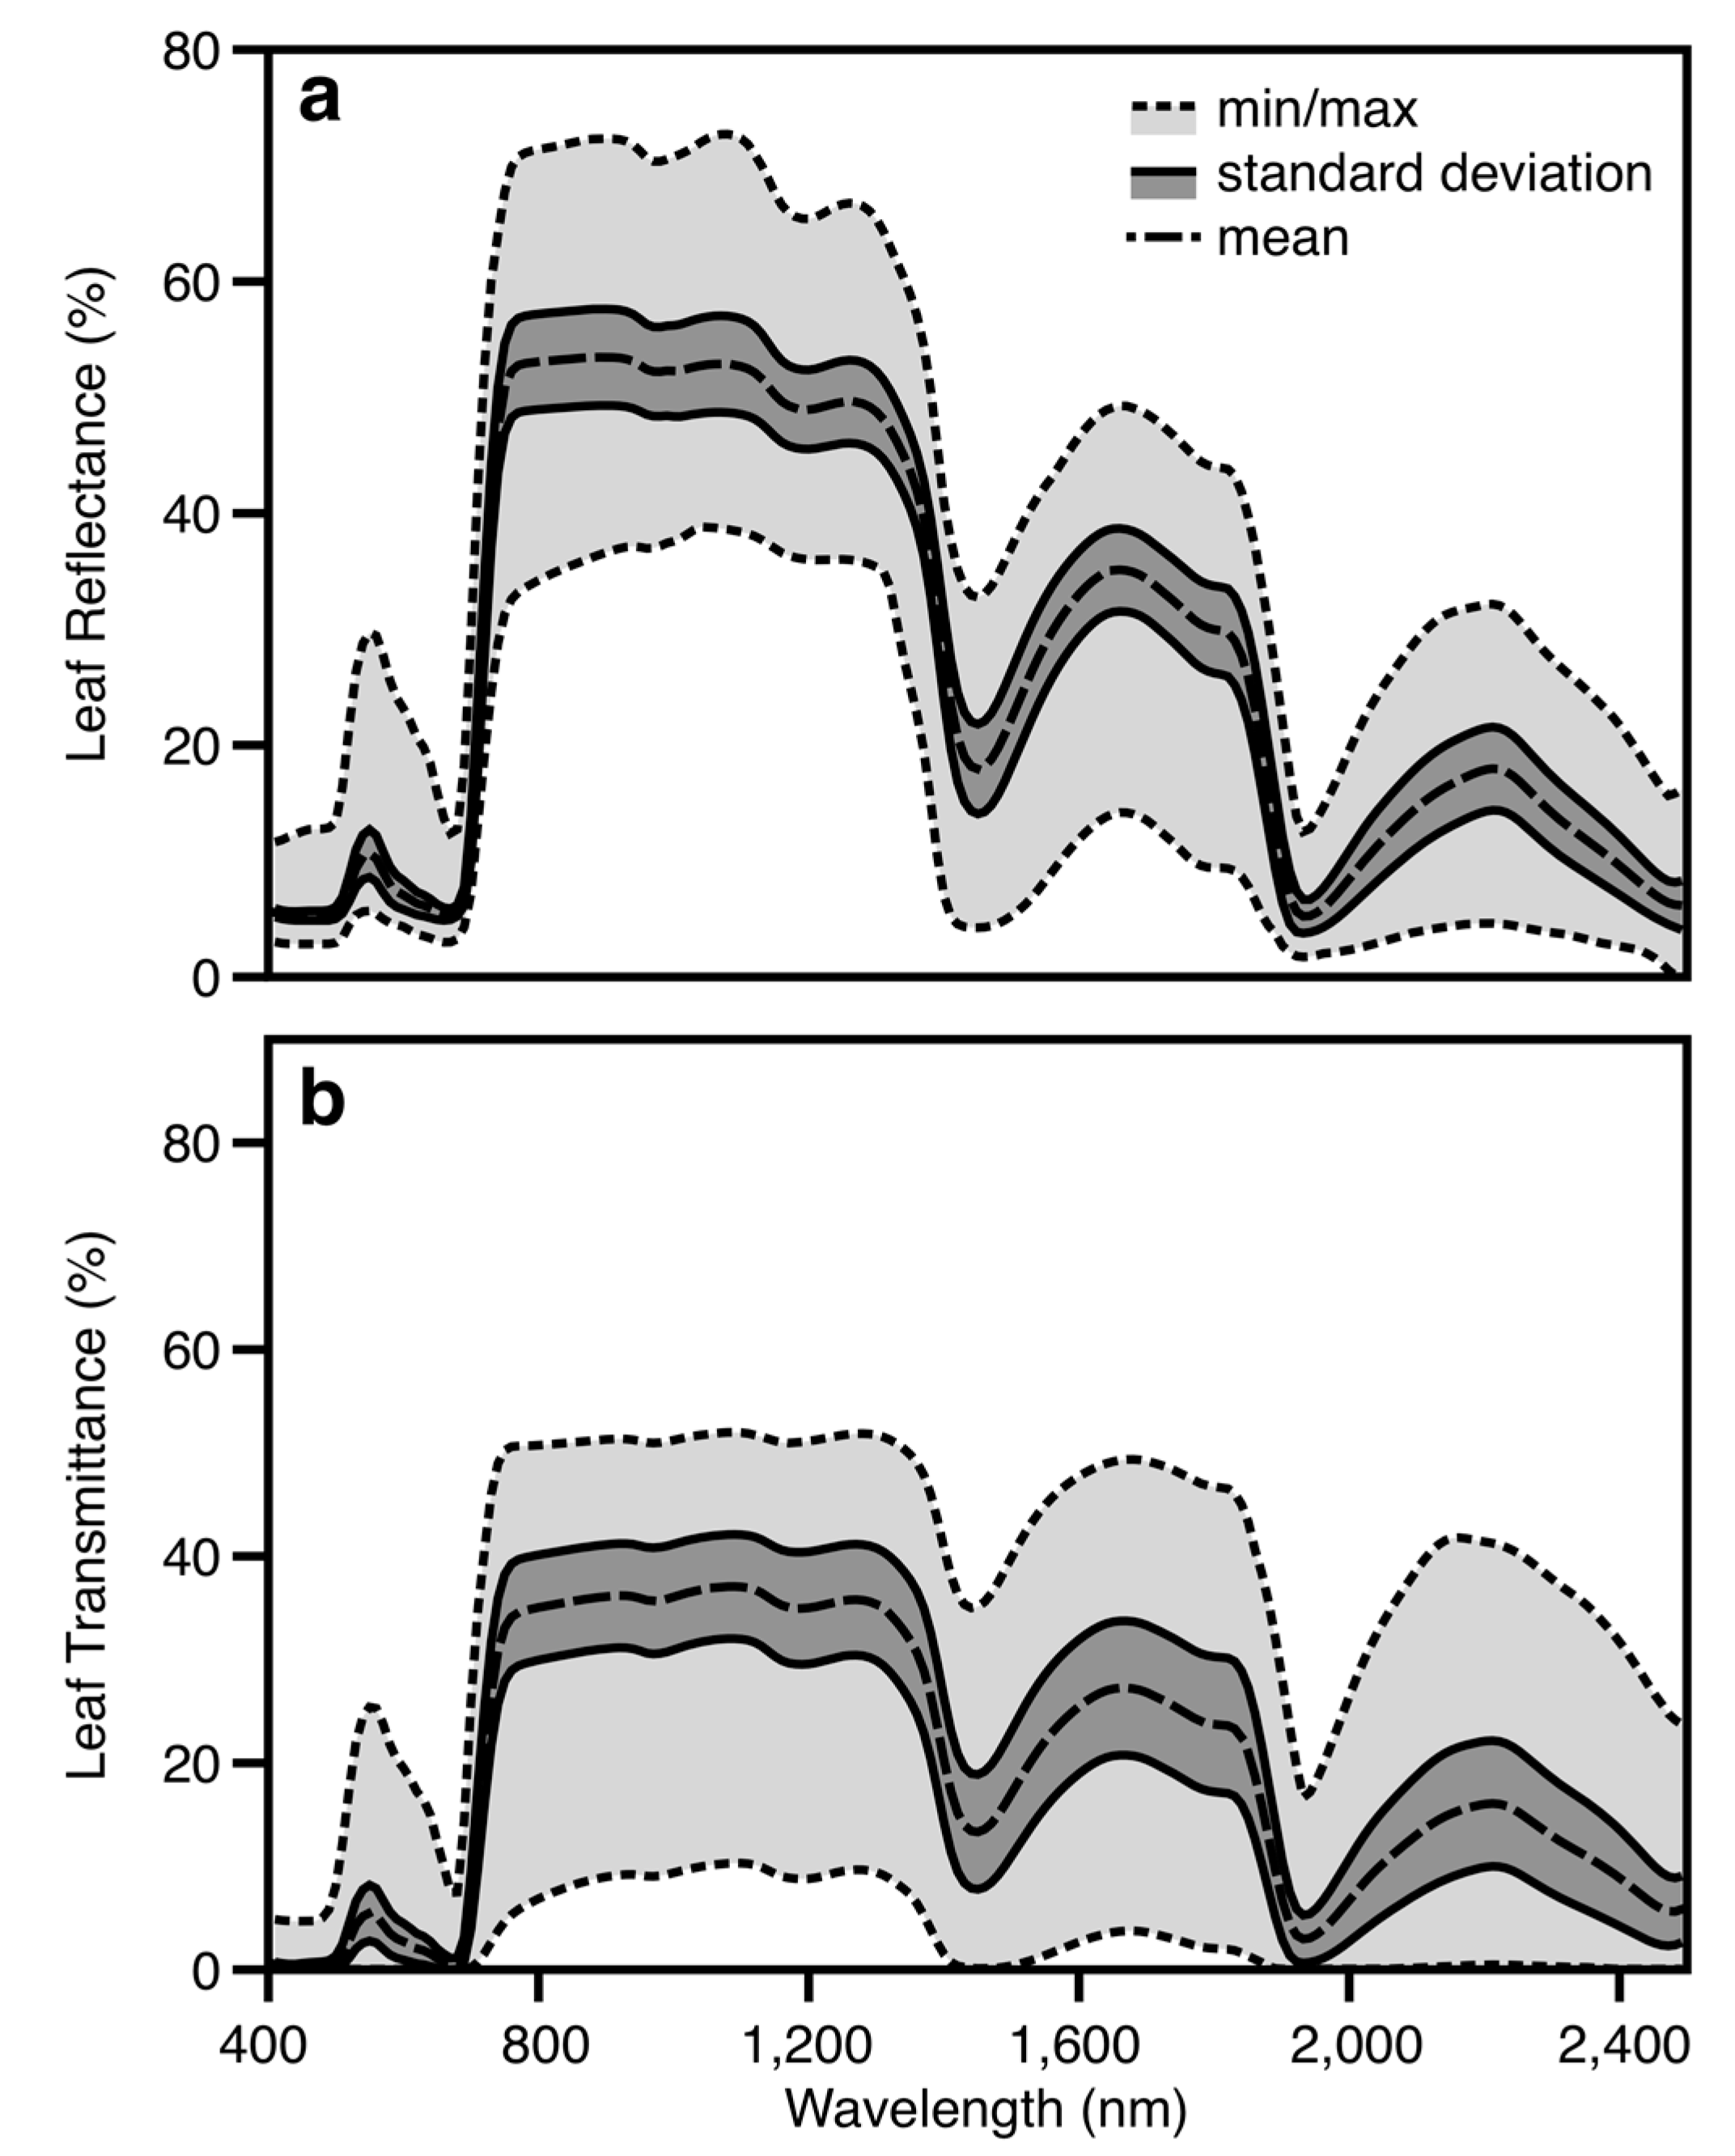
2.2. Leaf Spectral Properties


| Political Unit | No. of Sites | Elevation 1 Range | MAP 2 Range | MAT 3 Range | Soil Orders 4 | No. of Samples | No. of Families | No. of Genera | No. of Species |
|---|---|---|---|---|---|---|---|---|---|
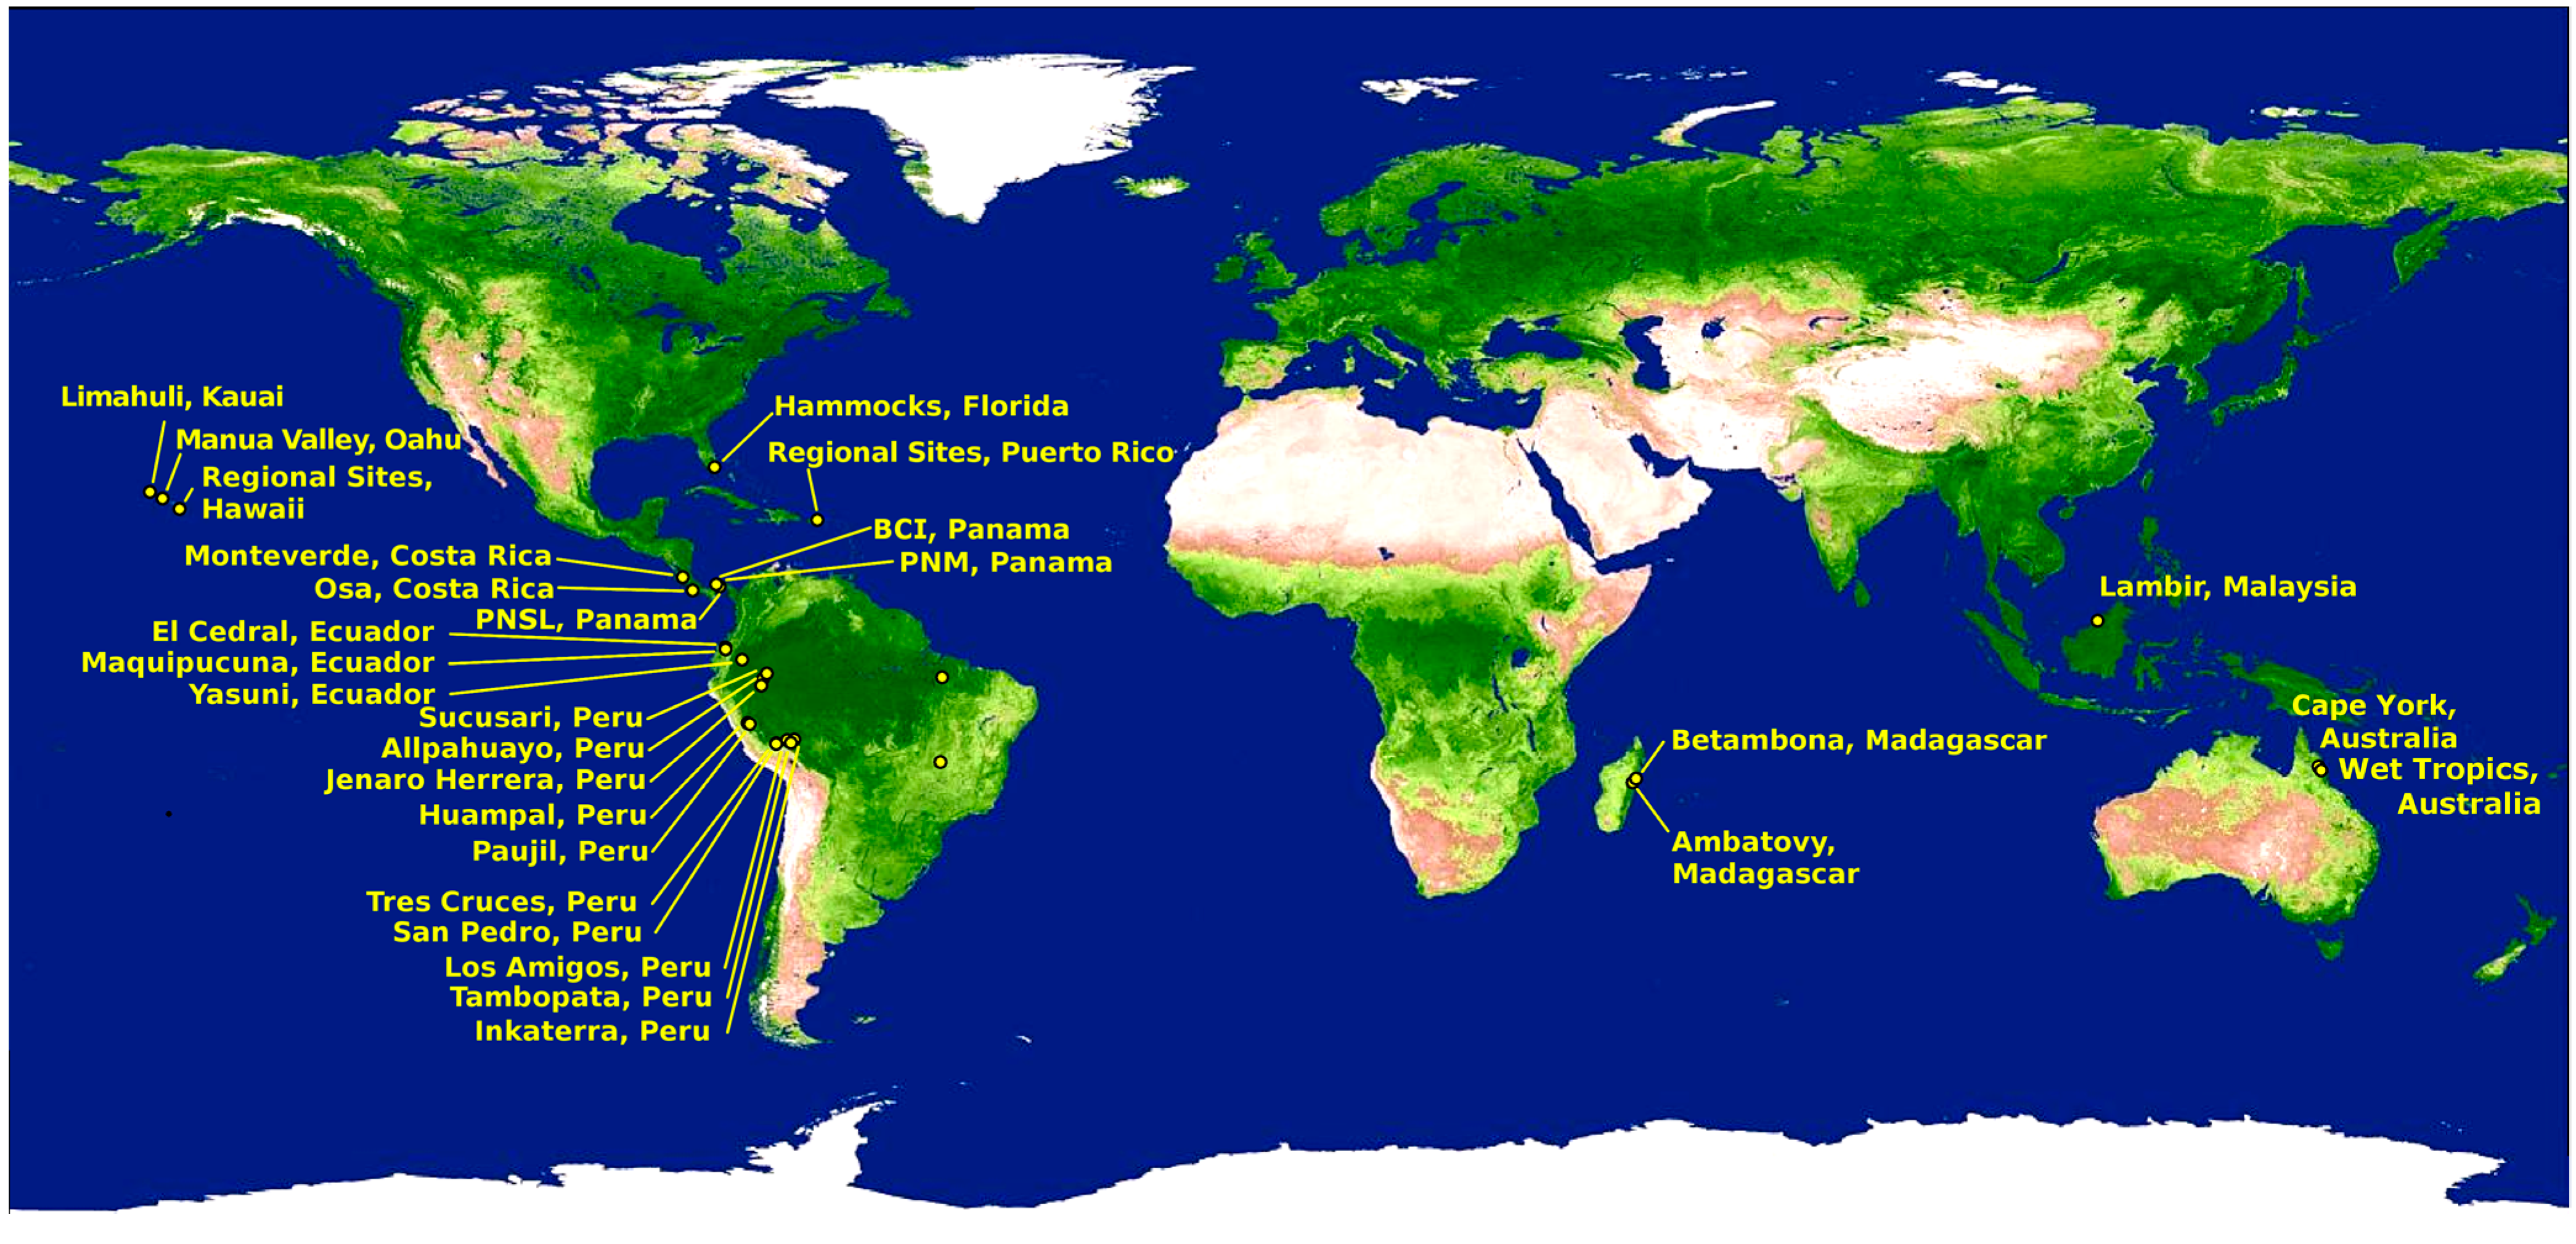
| Australia | 11 | 21–1084 | 1165–3333 | 18.3–23.7 | Alf, Ent, Inc, Oxi, Ult | 188 | 45 | 121 | 187 |
| Costa Rica | 9 | 50–1607 | 2832–4698 | 17.7–25.8 | And, Inc, Ult | 746 | 100 | 321 | 607 |
| Ecuador | 1 | 1325–1980 | 3200 | 18 | Inc | 242 | 51 | 105 | 162 |
| Hawaii | 9 | 27–1570 | 1800–5080 | 13.2–23.8 | And, Inc | 180 | 58 | 129 | 156 |
| Madagascar | 3 | 330–1118 | 1700–3020 | 17–24.3 | Ent, Oxi, Ult | 624 | 72 | 204 | 426 |
| Panama | 4 | 84–189 | 1865–3140 | 26–27.2 | Inc | 269 | 65 | 180 | 258 |
| Peru | 17 | 92–3660 | 2380–6128 | 8–26.6 | Ent, His, Inc, Ult | 3338 | 122 | 515 | 2090 |
| Puerto Rico | 6 | 140–910 | 3460–6096 | 21.3–25.6 | Inc, Ult | 104 | 47 | 86 | 101 |
| Borneo | 1 | 70–80 | 2680 | 26.6 | Ult | 395 | 51 | 108 | 235 |
2.3. Leaf NSC Assays
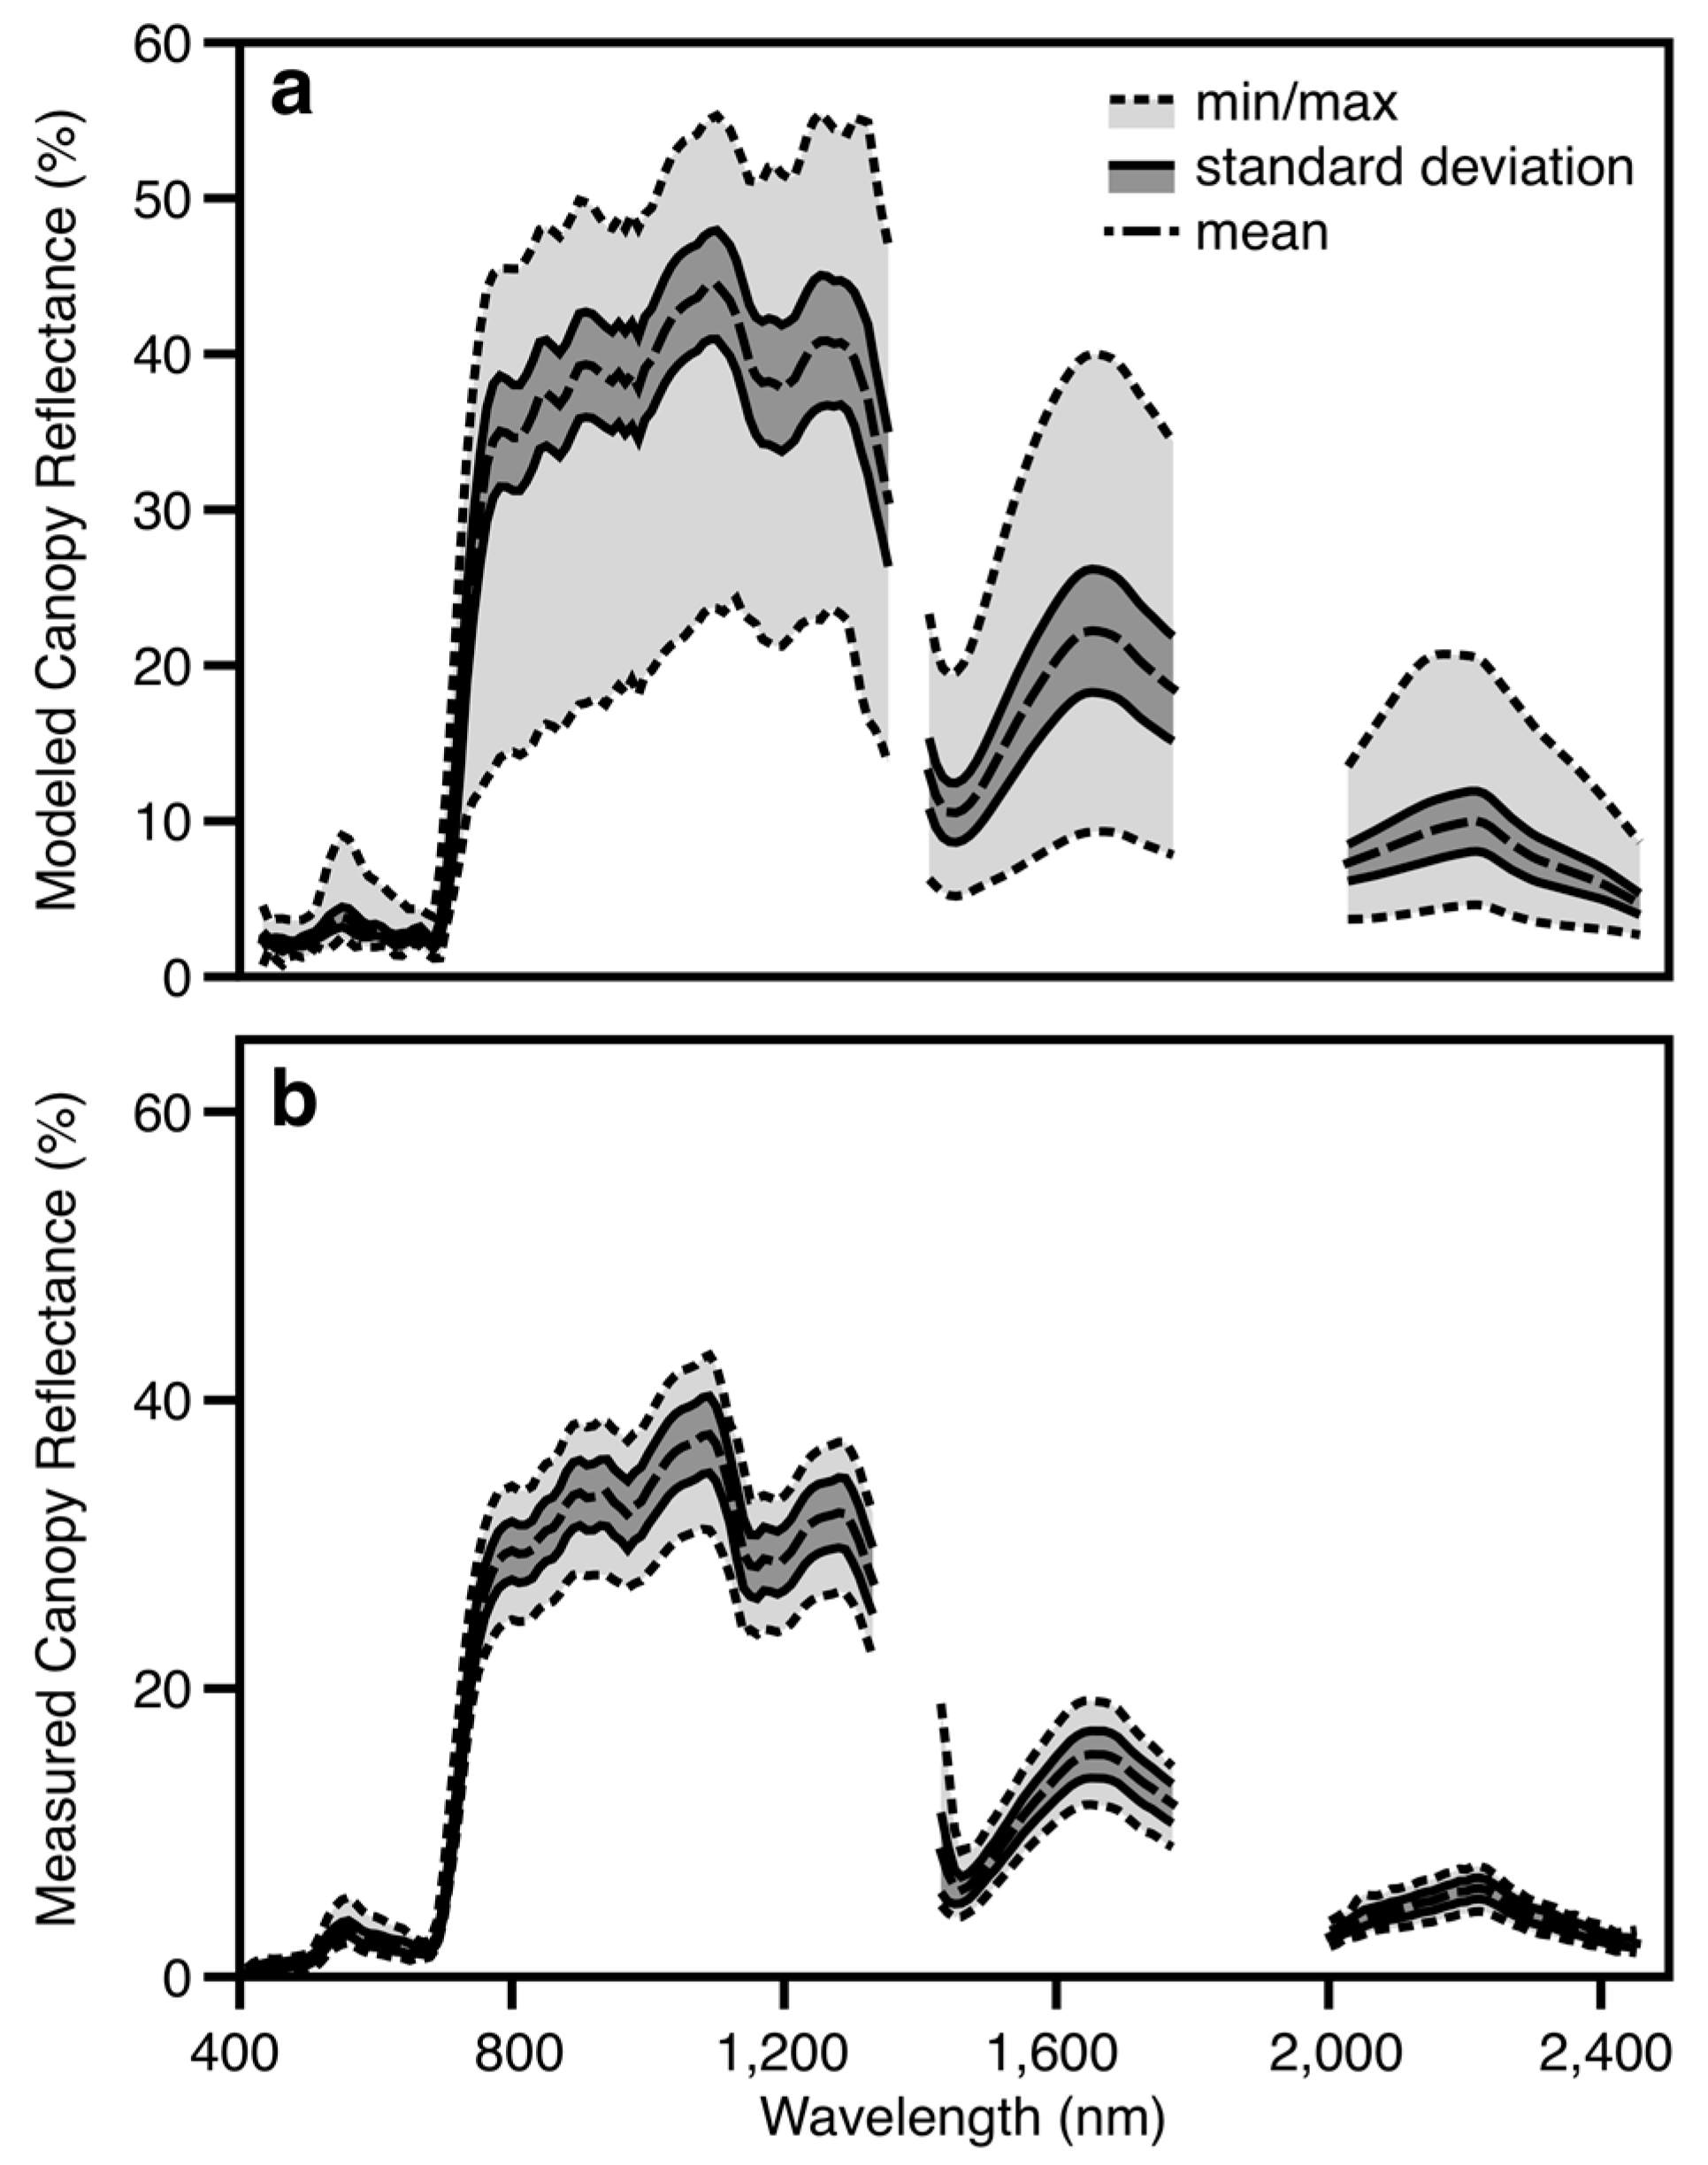
2.4. Canopy Reflectance Modeling
| Plant Growth-form | LAI | LAD 1 | Cv | Zeta |
|---|---|---|---|---|
| Trees | 2.0–8.0 | −0.4 to 0.4 −0.1 to 0.2 | 0.6–0.8 | 0.2–0.7 |
| Lianas | 1.0–5.0 | −0.1 to 0.3 0.3 to 0.6 | 0.7–0.9 | 0.1–0.3 |
| Palms | 1.0–5.0 | −0.8 to −0.2 | 0.7–0.9 | 0.1–0.3 |
| Vines | 1.0–3.0 | −0.1 to 0.3 0.3 to 0.6 | 0.7–0.9 | 0.1–0.3 |
| Hemi-epiphytes | 2.0–8.0 | −0.4 to 0.4 −0.1 to 0.2 | 0.6–0.8 | 0.2–0.6 |
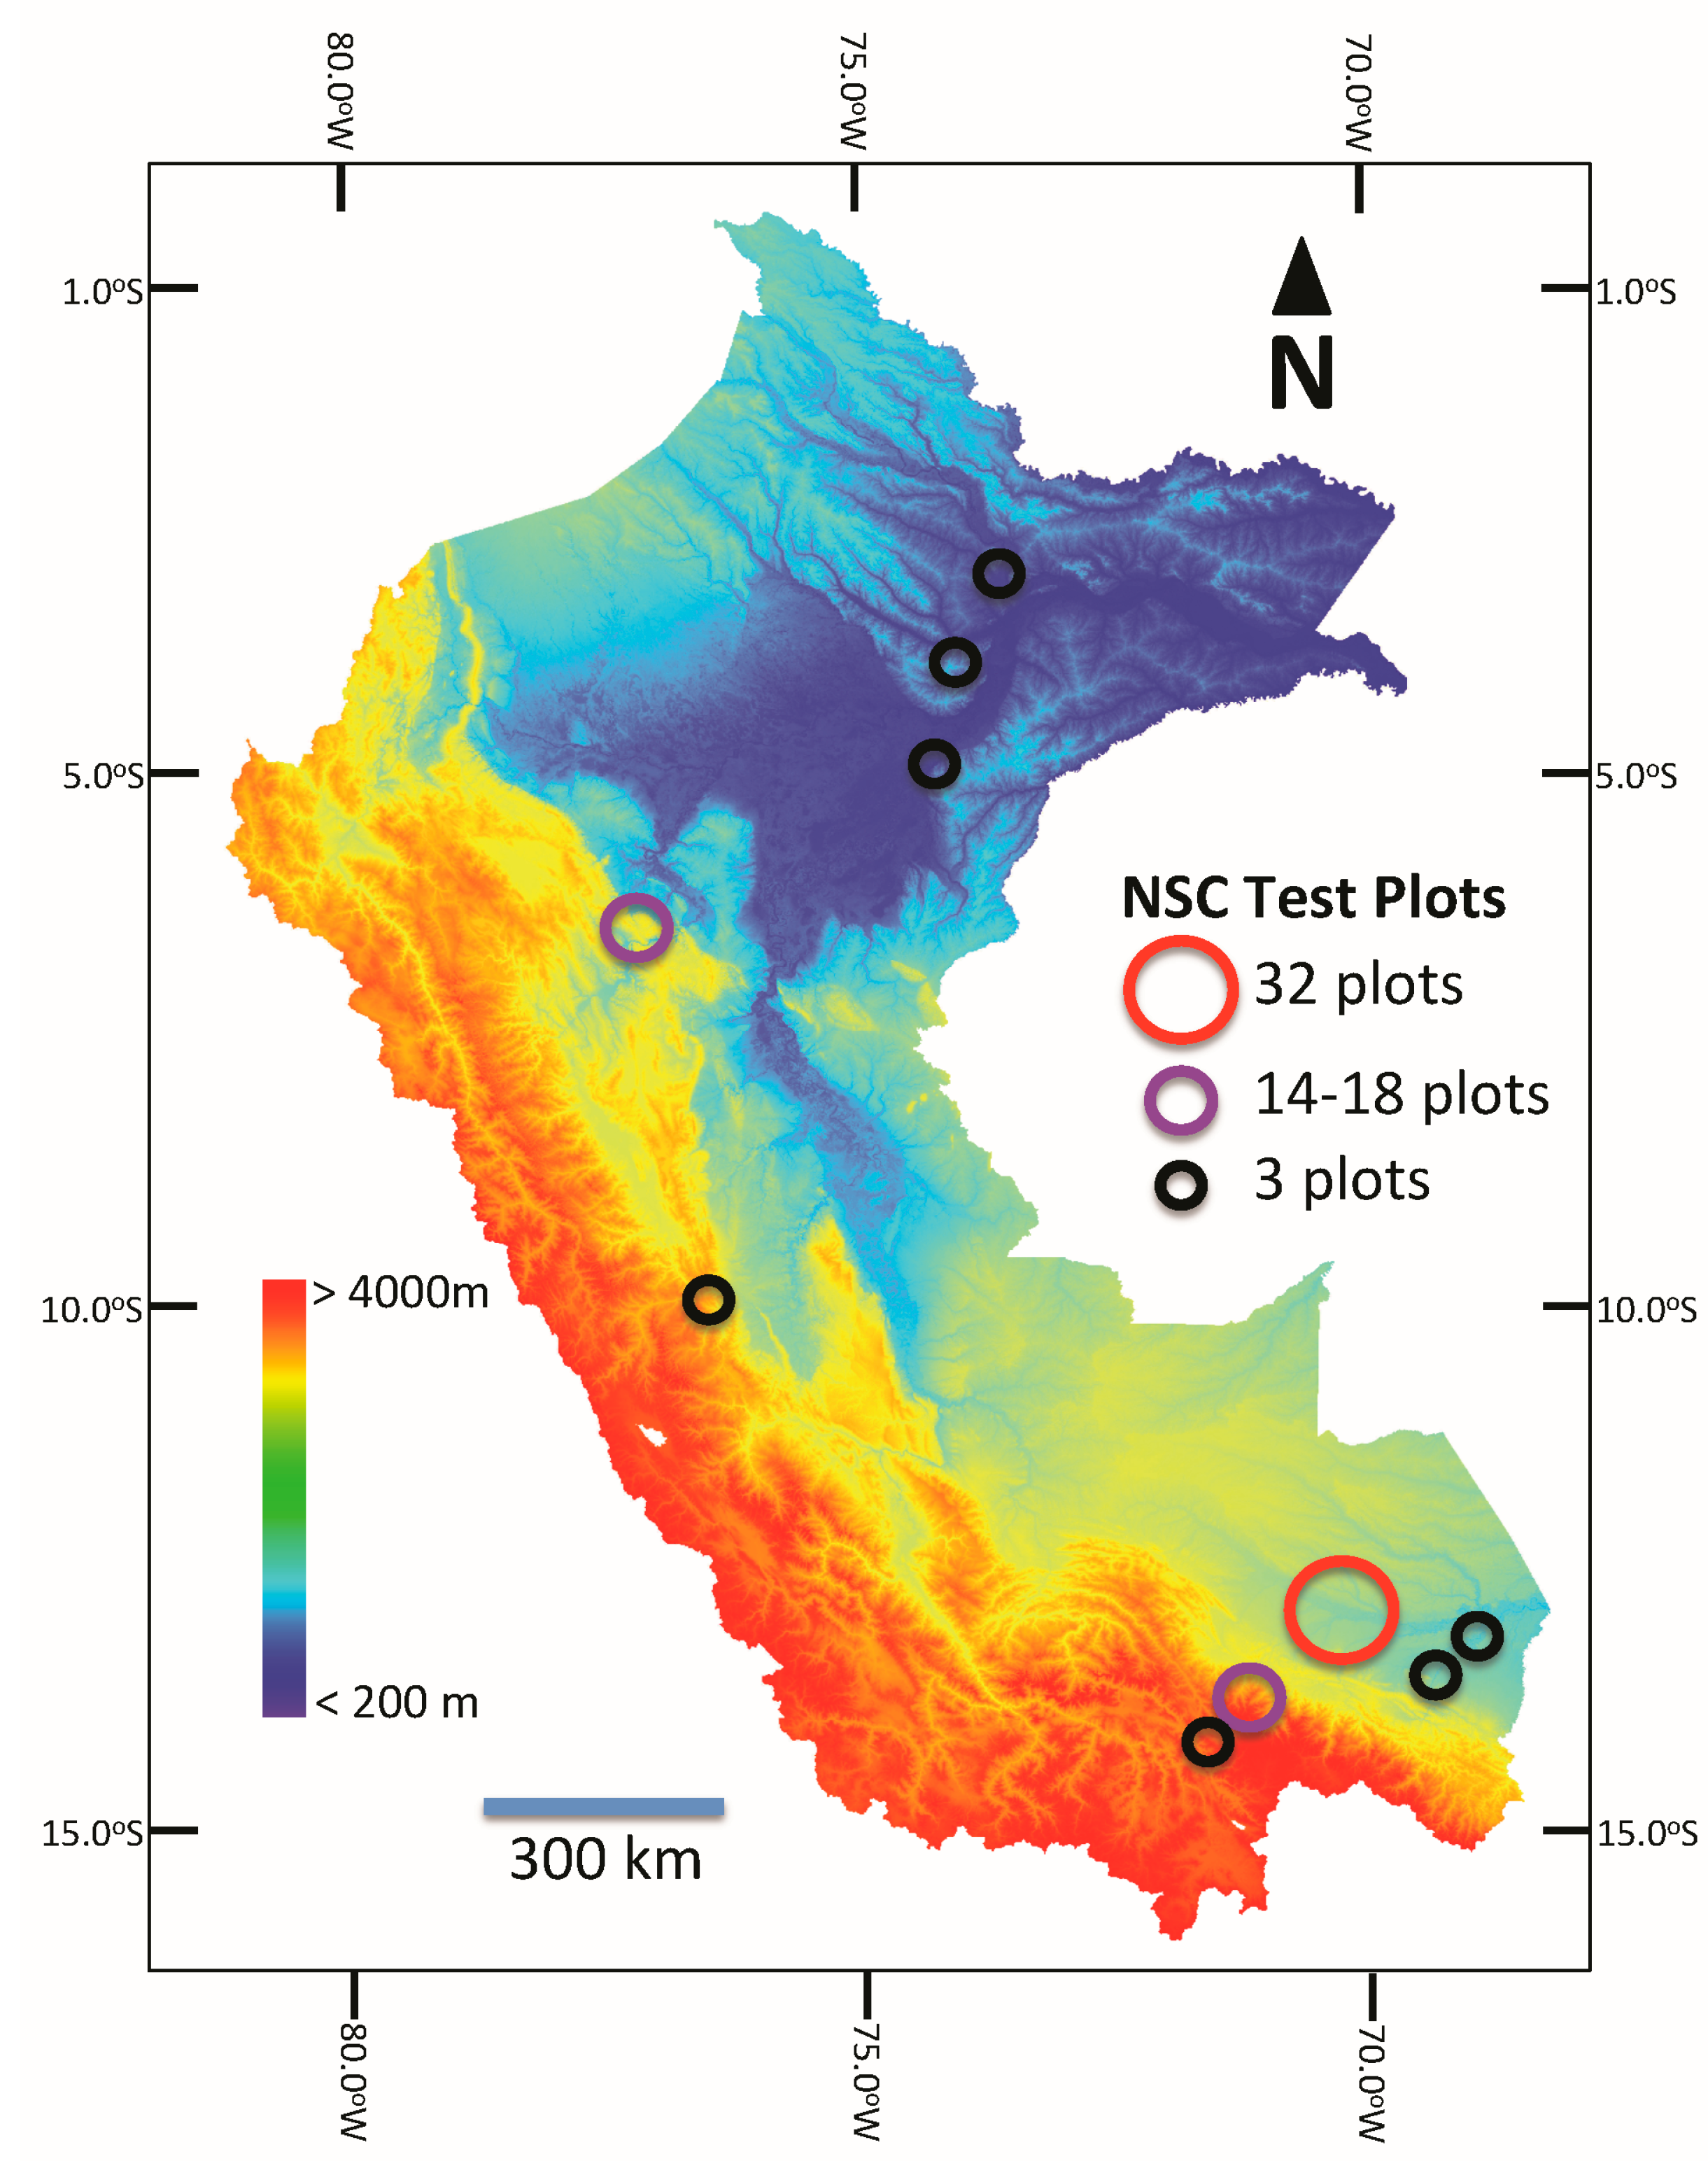
2.5. Airborne NSC Study

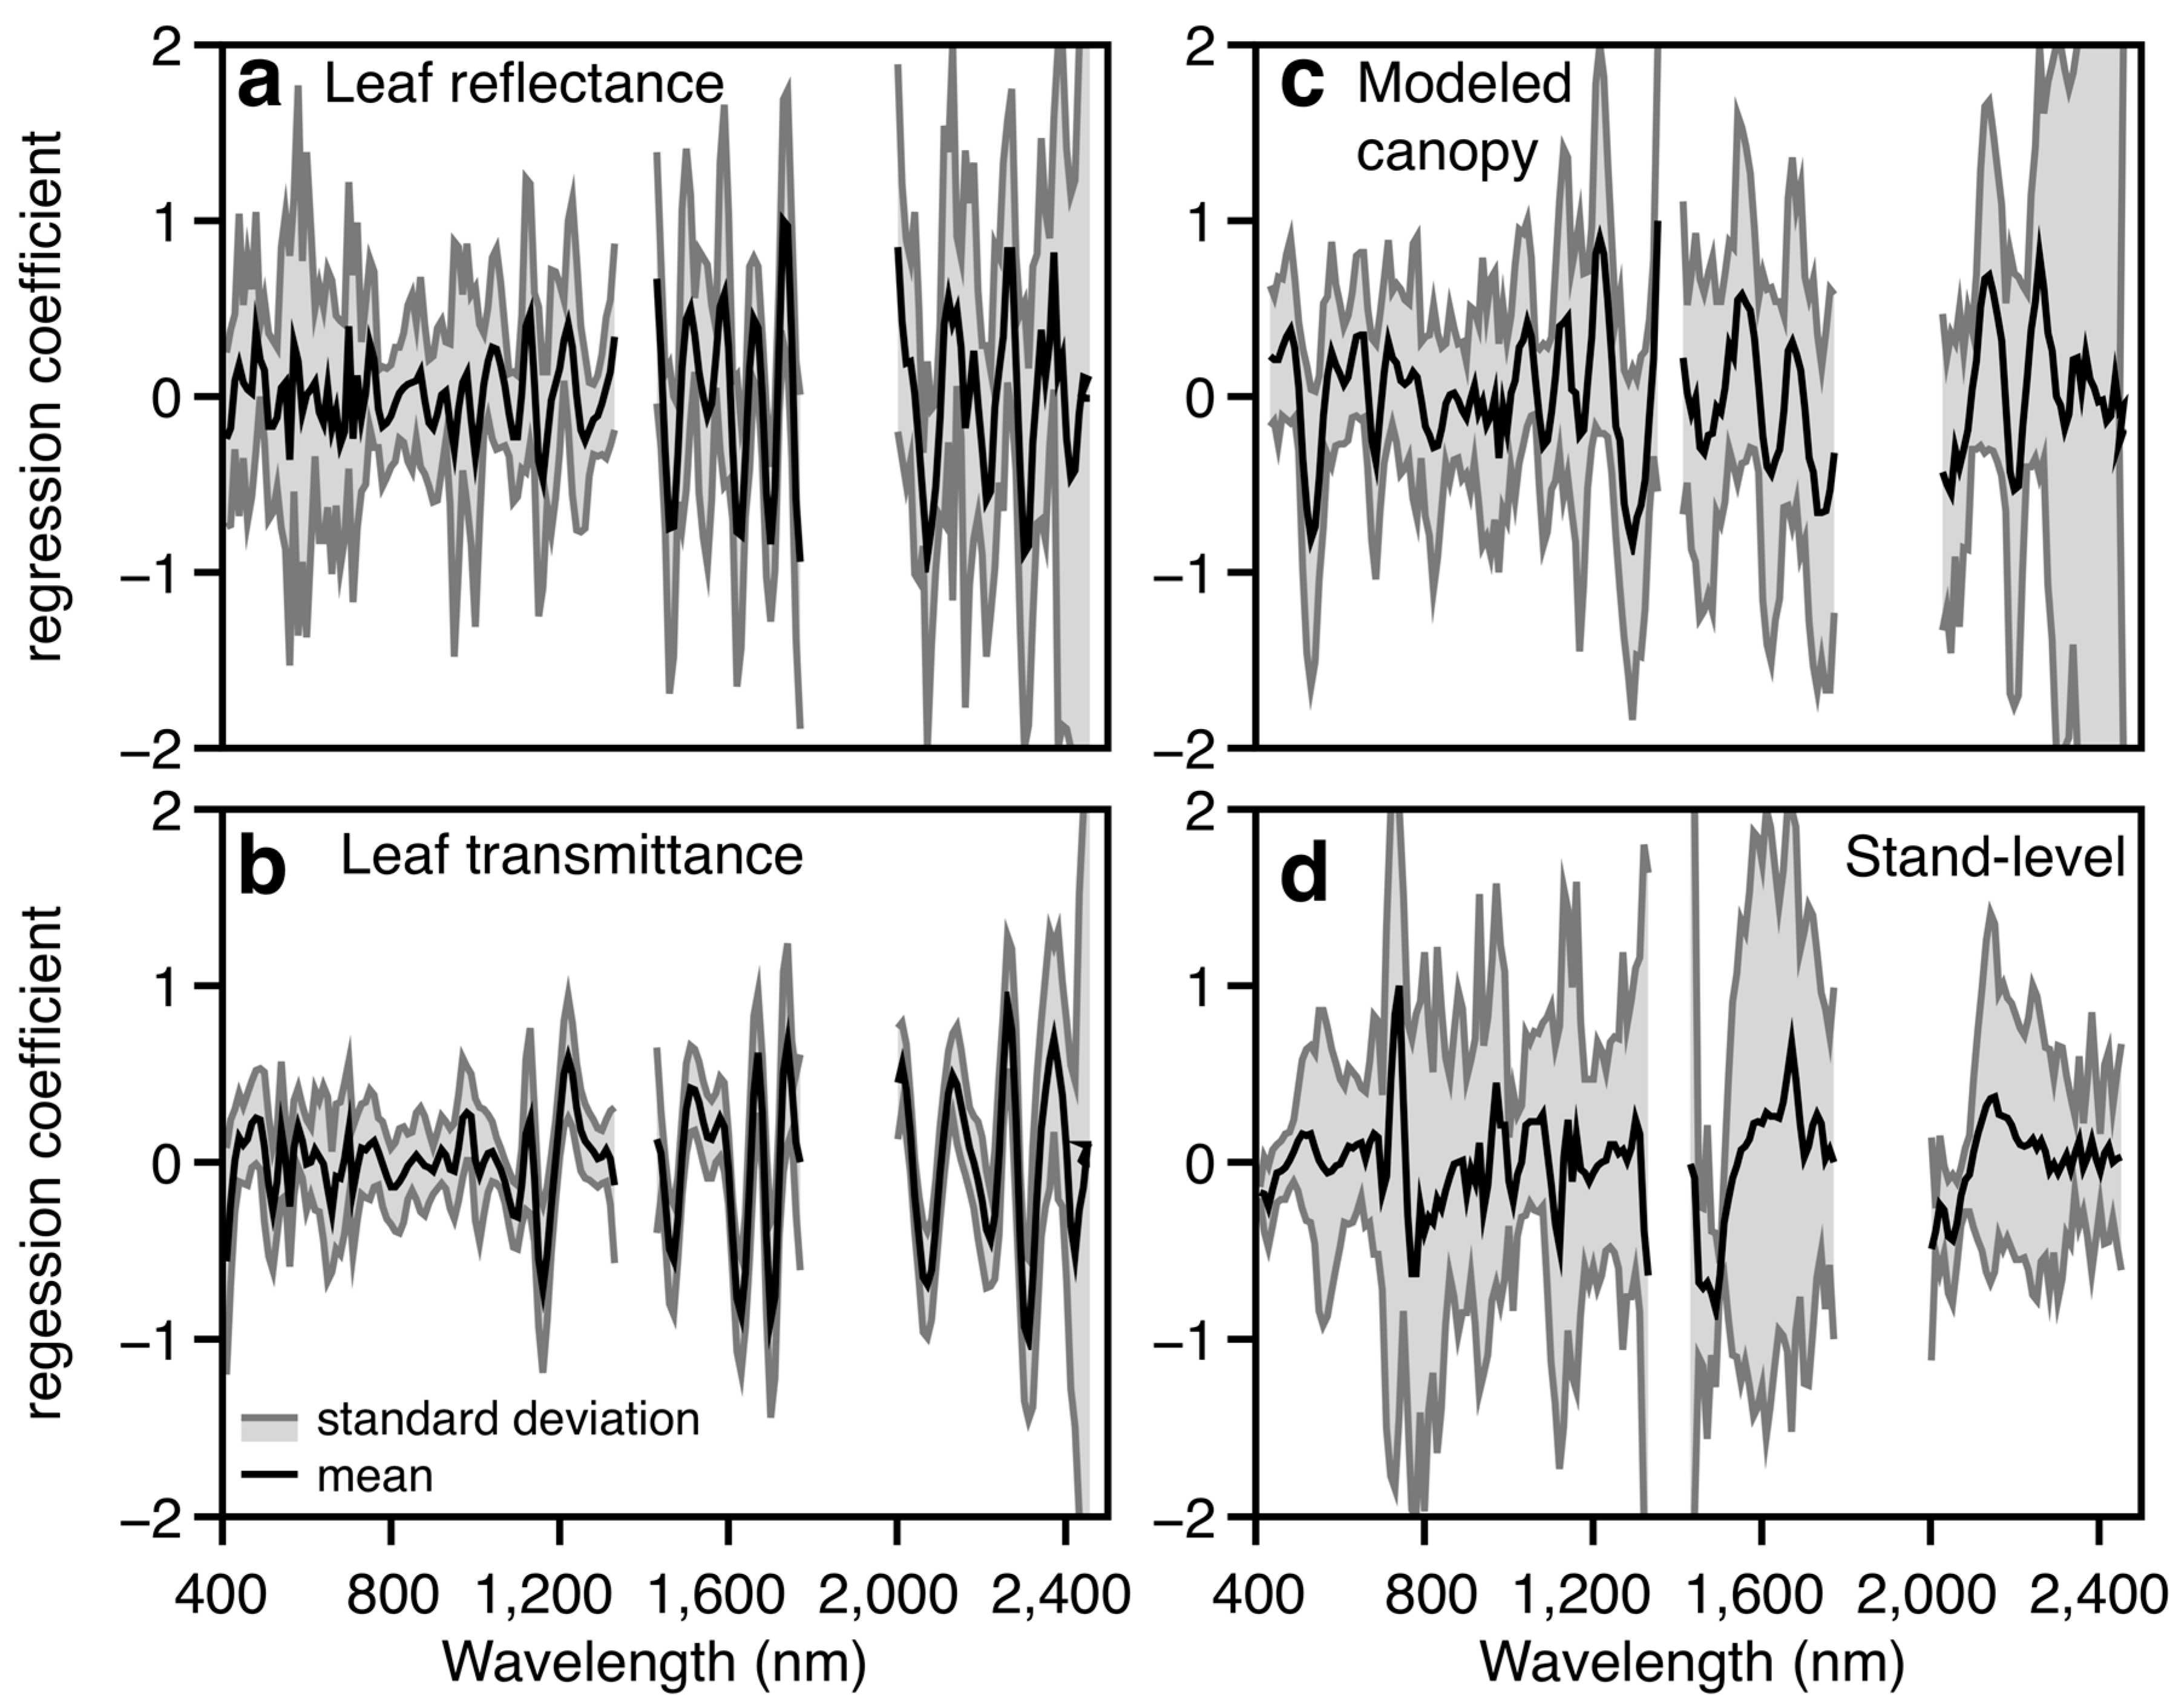
2.6. Chemometric Analyses
3. Results
3.1. Leaf-Level Performance

| Approach | Chemical Range | R2 | RMSE | %RMSE | Vectors |
|---|---|---|---|---|---|
| Leaf reflectance | 16.2–84.5 | 0.73 ± 0.06 | 5.9 ± 0.8 | 12.9; (9.1–15.6) | 24; (20–38) |
| Leaf transmittance | 16.2–84.5 | 0.69 ± 0.03 | 6.4 ± 0.5 | 13.9; (12.5–15.9) | 21; (17–26) |
| Canopy reflectance | 16.2–84.5 | 0.56 ± 0.09 | 7.4 ± 0.90 | 16.1; (11.4–19.4) | 13; (9–19) |
| Stand reflectance | 36.0–71.9 | 0.49 ± 0.14 | 4.4 ± 0.87 | 9.1; (9.2–12.6) | 4; (3–12) |
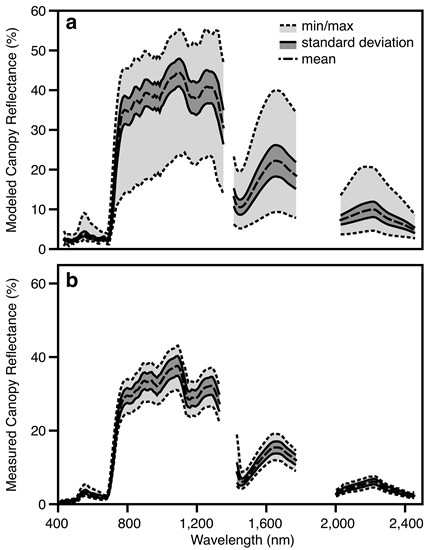
3.2. Canopy-Level Performance

3.3. Airborne Imaging Spectroscopy
4. Discussion
5. Conclusions
Acknowledgments
Author Contributions
Conflicts of Interest
Appendix
| Leaf Level | Modeled Canopy | Measured Stand-Level Canopy | ||||
|---|---|---|---|---|---|---|
| Wavelength | Leaf Reflectance | Leaf Tranmittance | Wavelength | Canopy Reflectance | Wavelength | Canopy Reflectance |
| Intercept | 43.92346158 | 44.09943433 | Intercept | 49.56582227 | Intercept | −154.9237312 |
| 409.68 | −371.3165126 | −919.2181631 | 433.67 | −133.9772842 | 409.31 | −378.8371125 |
| 419.68 | −228.6673269 | −529.911383 | 443.36 | 69.28851678 | 419.33 | −323.278948 |
| 429.69 | 56.99304407 | −135.8144438 | 453.06 | 64.55473098 | 429.34 | −364.7098297 |
| 439.70 | 252.1839902 | 366.6273342 | 462.76 | 91.50801732 | 439.36 | −236.7114492 |
| 449.70 | 151.0924843 | 136.6963453 | 472.47 | 119.5154075 | 449.37 | −55.19831014 |
| 459.71 | 383.5269807 | 484.0310369 | 482.18 | 150.4002381 | 459.39 | 15.85640461 |
| 469.72 | −532.7811941 | 545.345442 | 491.90 | 234.7742488 | 469.40 | 78.62211678 |
| 479.72 | 874.8150235 | 350.917737 | 501.62 | 86.41842172 | 479.42 | 120.5855001 |
| 489.73 | 822.4099553 | 173.4894125 | 511.35 | 8.246857264 | 489.43 | 175.8115229 |
| 499.74 | −175.7833749 | 27.35911747 | 521.08 | −189.3421036 | 499.45 | 220.9395279 |
| 509.74 | −317.9762259 | −192.7788036 | 530.81 | −269.1251103 | 509.46 | 210.191244 |
| 519.75 | −306.0900255 | −431.1836785 | 540.55 | −274.2991826 | 519.48 | 150.6738296 |
| 529.76 | −167.351235 | −240.2814429 | 550.29 | −123.6322331 | 529.49 | 101.5254057 |
| 539.76 | 143.9138163 | 395.8328311 | 560.04 | 92.04892792 | 539.51 | 76.44952998 |
| 549.77 | 374.1549401 | 57.48124938 | 569.79 | 94.54929241 | 549.52 | 45.34680455 |
| 559.78 | −1061.982882 | −604.6443121 | 579.55 | 208.2648986 | 559.54 | 25.00890073 |
| 569.78 | 322.4597226 | 81.14812637 | 589.31 | 134.7526353 | 569.55 | 24.16803965 |
| 579.79 | 1097.252175 | 451.6732106 | 599.08 | 66.2640756 | 579.57 | 47.18824022 |
| 589.80 | 245.0388146 | 408.9186842 | 608.85 | −55.51377327 | 589.58 | 83.08167905 |
| 599.80 | −607.0770945 | 48.72887079 | 618.62 | −75.85092513 | 599.60 | 82.39917972 |
| 609.81 | −378.816813 | −56.99428184 | 628.40 | −17.03735391 | 609.61 | 128.3267049 |
| 619.82 | 97.75052815 | 59.77830425 | 638.18 | −32.12081198 | 619.63 | 173.778067 |
| 629.82 | −106.6153207 | −9.505604153 | 647.97 | −50.92780089 | 629.64 | 195.5438373 |
| 639.83 | 14.72573507 | −92.36009547 | 655.29 | 11.62208161 | 639.66 | 214.9546168 |
| 649.84 | 297.9863014 | −197.5296171 | 665.09 | −27.56064832 | 649.67 | 260.5694842 |
| 659.84 | −303.162915 | −556.6519505 | 674.90 | −15.65527363 | 659.69 | −58.72666144 |
| 669.85 | −344.4751678 | −155.9677424 | 684.69 | −14.97514638 | 669.70 | −11.59788135 |
| 679.86 | −497.4206742 | 75.52539134 | 694.48 | −40.57359288 | 679.72 | −170.2091699 |
| 689.86 | −269.2332816 | −67.23979032 | 704.27 | −12.59050278 | 689.73 | −247.522385 |
| 699.87 | 656.962502 | 348.9920474 | 714.05 | 54.56084237 | 699.75 | −239.705834 |
| 709.88 | −435.3464835 | −285.6378627 | 723.83 | 83.71100952 | 709.76 | −136.6003647 |
| 719.88 | 223.2205287 | −84.4375331 | 733.60 | 45.40445656 | 719.78 | −45.58251118 |
| 729.89 | −87.0258821 | 191.5929311 | 743.36 | 58.55044007 | 729.79 | 2.736042706 |
| 739.90 | −192.0743113 | 100.6395645 | 753.12 | −8.086347346 | 739.81 | 66.49776933 |
| 749.90 | 477.7664756 | 116.8965368 | 762.88 | −53.38093568 | 749.82 | 37.1632202 |
| 759.91 | 644.2351532 | 251.9308119 | 772.63 | 12.60744724 | 759.84 | −29.33069299 |
| 769.92 | 91.44899258 | 220.1083154 | 782.37 | 118.8497702 | 769.85 | −63.95888037 |
| 779.92 | −479.0475033 | 46.04921125 | 792.11 | 37.4712146 | 779.87 | −74.93098304 |
| 789.93 | −529.3763639 | −184.3764745 | 801.85 | −86.76430524 | 789.88 | −46.20603431 |
| 799.94 | −391.9987476 | −374.1086586 | 811.58 | −112.3232265 | 799.90 | −51.7597739 |
| 809.94 | −129.0286866 | −361.8888455 | 821.30 | −126.9358054 | 809.91 | −46.18316548 |
| 819.95 | 196.9461251 | −256.366572 | 831.02 | 11.19585641 | 819.93 | −43.22734258 |
| 829.96 | 216.9529804 | −45.80192762 | 840.73 | 53.78026185 | 829.94 | −19.5644525 |
| 839.96 | 304.8075438 | 26.02803471 | 850.44 | 57.35391261 | 839.96 | −11.34007976 |
| 849.97 | 197.7626744 | 84.80551186 | 860.14 | −76.66158364 | 849.97 | −16.3196782 |
| 859.97 | 82.57576874 | 158.8608747 | 869.84 | −2.719827379 | 859.99 | 5.129842753 |
| 869.98 | 45.5682532 | 45.63869203 | 879.53 | −12.98552828 | 870.00 | 12.42068434 |
| 879.99 | −80.14214218 | −94.3029056 | 889.22 | 6.764800803 | 880.02 | −12.93440156 |
| 889.99 | −181.6138235 | −96.67063657 | 898.90 | 8.280011119 | 890.03 | −9.43695131 |
| 900.00 | −171.5954815 | −83.31427284 | 908.58 | 22.72116524 | 900.05 | −24.87391216 |
| 910.01 | −64.81621826 | 53.6327811 | 918.25 | −99.07303695 | 910.06 | 44.69227182 |
| 920.01 | −31.55516956 | 211.7780901 | 927.92 | −45.43664117 | 920.08 | 123.1759786 |
| 930.02 | 196.1039688 | 21.82398383 | 937.58 | −49.45697949 | 930.09 | −4.909074581 |
| 940.03 | −163.795639 | −255.7551743 | 947.23 | −31.80894597 | 940.11 | 12.09910326 |
| 950.03 | −706.7859755 | −377.7214634 | 956.88 | −37.39552131 | 950.12 | 259.5361108 |
| 960.04 | −293.5590555 | −63.5208901 | 966.53 | −38.20602646 | 960.14 | 217.2184419 |
| 970.05 | −388.6215367 | 689.0111029 | 976.17 | -36.7076795 | 970.15 | 224.4095154 |
| 980.05 | 538.40279 | 810.433792 | 985.81 | 19.09113554 | 980.17 | 268.1602899 |
| 990.06 | 50.519203 | 696.985289 | 995.44 | 73.0029157 | 990.18 | 312.1828414 |
| 1000.07 | −421.9882309 | −230.8351216 | 1005.06 | −29.84729617 | 1000.20 | −104.5367656 |
| 1010.07 | −269.1901213 | −358.8756365 | 1014.68 | −115.5968899 | 1010.21 | −188.2529108 |
| 1020.08 | −117.813784 | −89.79630257 | 1024.29 | −21.97010843 | 1020.23 | 17.75207205 |
| 1030.09 | 234.8164256 | 142.6136904 | 1033.90 | 61.37396794 | 1030.24 | 213.3349643 |
| 1040.09 | 410.8624577 | 253.4213368 | 1043.51 | 151.4882373 | 1040.26 | 368.4556968 |
| 1050.10 | 558.6637253 | 132.281373 | 1053.11 | 206.8744324 | 1050.27 | 335.3047203 |
| 1060.11 | 366.475188 | 70.4138447 | 1062.70 | 197.7358421 | 1060.29 | 342.982734 |
| 1070.11 | 243.3901684 | −89.81088982 | 1072.29 | 44.39081555 | 1070.30 | 337.2164587 |
| 1080.12 | −115.2303522 | −410.9955609 | 1081.87 | −71.0510886 | 1080.32 | 255.8050587 |
| 1090.13 | −513.7217052 | −673.9549008 | 1091.45 | −144.2378713 | 1090.33 | 60.78419766 |
| 1100.13 | −503.3266623 | −735.2226782 | 1101.02 | −175.982708 | 1100.35 | −80.1777783 |
| 1110.14 | 185.6157309 | -256.084212 | 1110.59 | 44.64300286 | 1110.36 | −118.7303193 |
| 1120.15 | 824.8568883 | 474.0861467 | 1120.15 | −79.57209073 | 1120.38 | −30.42124311 |
| 1130.15 | 706.7412998 | 631.9688998 | 1129.71 | 73.0245519 | 1130.39 | 132.0979241 |
| 1140.16 | −47.76023732 | −114.2367884 | 1139.26 | 220.0080285 | 1140.41 | 124.772645 |
| 1150.17 | −793.9397966 | −1198.363214 | 1148.81 | 146.2877695 | 1150.42 | 158.8058648 |
| 1160.17 | −745.6708347 | −1504.678781 | 1158.35 | 31.91104367 | 1160.44 | 136.1227516 |
| 1170.18 | −287.3397315 | −977.1440687 | 1167.88 | −142.3016634 | 1170.45 | 105.533777 |
| 1180.19 | 45.39977768 | −275.292423 | 1177.42 | −65.13435609 | 1180.47 | −198.6871093 |
| 1190.19 | 26.74717705 | 211.8166676 | 1186.94 | −91.04540926 | 1190.48 | −245.5642678 |
| 1200.20 | 329.1118015 | 629.4019605 | 1196.46 | 145.3901957 | 1200.50 | −248.8492534 |
| 1210.21 | 743.5419947 | 984.940179 | 1205.98 | 138.8085743 | 1210.51 | −166.1981497 |
| 1220.21 | 806.117307 | 1071.042637 | 1215.49 | 164.0774127 | 1220.53 | −150.0366876 |
| 1230.22 | 457.2073627 | 737.3979868 | 1224.99 | 271.7640207 | 1230.54 | −213.122067 |
| 1240.23 | −142.0063448 | 330.0453206 | 1234.49 | 39.18163026 | 1240.56 | −187.9744947 |
| 1250.23 | −543.5563157 | 146.9869822 | 1243.99 | 150.5001931 | 1250.57 | −163.8988272 |
| 1260.24 | −567.1012887 | 122.7306737 | 1253.47 | 26.67041061 | 1260.59 | −140.5466685 |
| 1270.25 | −264.606581 | 143.0742552 | 1263.34 | −4.733391691 | 1270.60 | −96.02582255 |
| 1280.25 | −184.7943348 | 95.37154226 | 1273.31 | −191.5538135 | 1280.62 | −42.15363218 |
| 1290.26 | −180.8847637 | 73.07818472 | 1283.29 | −290.6901333 | 1290.63 | −10.26607101 |
| 1300.26 | −90.07775773 | 131.1229029 | 1293.26 | −98.22080264 | 1300.65 | 36.6212788 |
| 1310.27 | 90.20361037 | 309.6023981 | 1303.23 | −43.45230966 | 1310.66 | 31.15060269 |
| 1320.28 | 161.8813349 | 178.7665172 | 1313.20 | 29.02486545 | 1320.68 | −16.79817654 |
| 1330.28 | 825.7565913 | −351.9536778 | 1323.17 | −127.8674268 | 1330.69 | −70.6390652 |
| 1430.35 | 1217.506187 | 410.0379124 | 1333.14 | −340.90711 | 1430.84 | −24.89417885 |
| 1440.36 | 364.840675 | −14.80275979 | 1343.11 | −428.3056273 | 1440.86 | −49.96475033 |
| 1450.36 | −658.4000286 | −584.856631 | 1353.08 | 802.2520087 | 1450.87 | −119.3043298 |
| 1460.37 | −1355.94315 | −1006.842005 | 1412.90 | 18.45498708 | 1460.89 | −174.8554044 |
| 1470.38 | −1252.940641 | −960.0889356 | 1422.87 | −80.83907119 | 1470.90 | −157.0907678 |
| 1480.38 | −533.9116164 | −424.473693 | 1432.84 | −6.09757958 | 1480.92 | −147.3426524 |
| 1490.39 | 387.0788578 | 197.1282446 | 1442.81 | 75.09399044 | 1490.93 | −171.8612035 |
| 1500.40 | 933.0515097 | 607.9026065 | 1452.78 | −64.0492756 | 1500.95 | −173.3175564 |
| 1510.40 | 1031.005246 | 754.8906859 | 1462.75 | −35.34963376 | 1510.96 | −180.1370826 |
| 1520.41 | 639.7832858 | 706.9938317 | 1472.71 | −63.16887986 | 1520.98 | −157.4391749 |
| 1530.42 | 96.34347324 | 574.9548229 | 1482.68 | −50.80736506 | 1530.99 | −136.987365 |
| 1540.42 | −189.0654619 | 392.9730658 | 1492.65 | −98.97882395 | 1541.01 | −115.2314186 |
| 1550.43 | −361.200949 | 161.7731701 | 1502.61 | −73.98580537 | 1551.02 | −96.66156239 |
| 1560.44 | −178.6693632 | 154.998368 | 1512.58 | −71.04244606 | 1561.04 | −83.42409227 |
| 1570.44 | 342.3061289 | 322.9407104 | 1522.55 | 120.6116297 | 1571.05 | −78.92745713 |
| 1580.45 | 967.4233718 | 535.4395096 | 1532.51 | 115.2604483 | 1581.07 | −64.5684128 |
| 1590.46 | 1169.502603 | 487.4268145 | 1542.48 | 97.45948869 | 1591.08 | −57.98930307 |
| 1600.46 | 418.0703692 | 11.643117 | 1552.44 | 344.4234532 | 1601.10 | −52.29878334 |
| 1610.47 | −758.7646897 | −737.6646856 | 1562.41 | 297.8169922 | 1611.11 | −43.22761703 |
| 1620.48 | −1458.921038 | −1435.475427 | 1572.38 | 147.228783 | 1621.13 | −34.71773851 |
| 1630.48 | −1282.885825 | −1632.853563 | 1582.34 | −3.979286894 | 1631.14 | −21.00074229 |
| 1640.49 | −354.9454306 | −1204.468722 | 1592.31 | −67.83980097 | 1641.16 | −8.324176442 |
| 1650.50 | 606.0061873 | −278.1329802 | 1602.27 | −117.3975702 | 1651.17 | 8.533159176 |
| 1660.50 | 812.9604732 | 722.4125758 | 1612.23 | −153.6002936 | 1661.19 | 29.78949512 |
| 1670.51 | 340.5055387 | 1212.004563 | 1622.20 | −186.0518129 | 1671.20 | 43.24976141 |
| 1680.52 | −147.7023668 | 551.7746707 | 1632.16 | −31.94937486 | 1681.22 | 39.1366824 |
| 1690.52 | −721.3004094 | −782.8080637 | 1642.13 | −88.37862942 | 1691.23 | 28.98373127 |
| 1700.53 | −1063.956987 | −1701.277706 | 1652.09 | 71.4347783 | 1701.25 | 28.32998623 |
| 1710.54 | −1021.160996 | −1411.708312 | 1662.05 | −35.17241089 | 1711.26 | 42.20150165 |
| 1720.54 | 6.498375354 | −159.7847524 | 1672.02 | 153.8420071 | 1721.28 | 50.44622904 |
| 1730.55 | 1506.761755 | 934.7928816 | 1681.98 | 17.02008587 | 1731.29 | 48.67695955 |
| 1740.56 | 2001.84034 | 1247.12711 | 1691.94 | 11.48737073 | 1741.31 | 35.38533728 |
| 1750.56 | 792.8495698 | 800.840925 | 1701.90 | −117.224093 | 1751.32 | 30.12835599 |
| 1760.57 | −1214.787386 | 198.8604001 | 1711.86 | −23.92446225 | 1761.34 | 33.86405036 |
| 1770.57 | −1624.124566 | 13.98091789 | 1721.83 | −118.81257 | 1771.35 | 39.34287819 |
| 2002.03 | 1468.02985 | 674.0373373 | 1731.79 | −81.48569054 | 2031.74 | −168.1982397 |
| 2012.03 | 561.4831546 | 1043.239315 | 1741.75 | −133.9368218 | 2041.76 | −256.4353296 |
| 2022.04 | 279.1126833 | 865.0245138 | 1751.71 | −53.68955725 | 2051.77 | −229.4068848 |
| 2032.05 | 288.9162004 | 465.6398897 | 1761.67 | −222.5379453 | 2061.79 | −216.1085252 |
| 2042.05 | 354.8780561 | −322.9279525 | 1771.63 | −89.06561924 | 2071.80 | −116.234245 |
| 2052.06 | −725.8204573 | −863.3993494 | 2028.37 | −41.38642304 | 2081.82 | −82.83329552 |
| 2062.07 | −1045.147746 | −1199.012465 | 2038.39 | 39.6466759 | 2091.83 | −71.22483251 |
| 2072.07 | −1428.854761 | −1392.963567 | 2048.41 | −95.08716004 | 2101.85 | −10.03137133 |
| 2082.08 | −1066.911147 | −1319.985558 | 2058.43 | −122.4432577 | 2111.86 | 19.73794294 |
| 2092.09 | −887.5673094 | −616.6957406 | 2068.45 | −173.3457587 | 2121.88 | 63.42453466 |
| 2102.09 | −168.1844618 | 13.93939541 | 2078.47 | −146.0312626 | 2131.89 | 80.01748509 |
| 2112.10 | 570.8179091 | 377.0661637 | 2088.48 | −186.4526505 | 2141.91 | 90.98833299 |
| 2122.11 | 1261.525272 | 778.0295598 | 2098.49 | −121.0580986 | 2151.92 | 105.7272038 |
| 2132.11 | 632.3631569 | 1161.737757 | 2108.50 | 22.81176134 | 2161.94 | 90.38333754 |
| 2142.12 | 574.7187805 | 639.1347964 | 2118.51 | 143.1007464 | 2171.95 | 86.59749841 |
| 2152.13 | 76.11790917 | 300.9941378 | 2128.51 | 99.37593363 | 2181.97 | 84.96181125 |
| 2162.13 | 92.69434539 | 249.2110435 | 2138.51 | 237.8748109 | 2191.98 | 67.64734018 |
| 2172.14 | 187.1006467 | 202.7932003 | 2148.51 | 229.0735066 | 2202.00 | 84.13533845 |
| 2182.15 | 748.6399275 | 246.9787361 | 2158.51 | 241.1260374 | 2212.01 | 64.51645446 |
| 2192.15 | −553.2831637 | 38.50347028 | 2168.50 | 29.29752352 | 2222.03 | 59.6410842 |
| 2202.16 | −734.7175539 | −324.3644638 | 2178.49 | −65.01128874 | 2232.04 | 70.06912197 |
| 2212.17 | −676.6531445 | −1061.113818 | 2188.48 | −92.03031921 | 2242.06 | 81.06354185 |
| 2222.17 | −982.810843 | −832.2084714 | 2198.47 | −126.5817693 | 2252.07 | 85.00666516 |
| 2232.18 | −125.3762175 | −609.0033076 | 2208.46 | −79.10724312 | 2262.09 | 86.68867079 |
| 2242.19 | 241.835186 | 115.1755888 | 2218.44 | −18.02558741 | 2272.10 | 78.18181046 |
| 2252.19 | 677.1287016 | 853.9901956 | 2228.42 | 15.19592898 | 2282.12 | 52.34591433 |
| 2262.20 | 1385.449441 | 1827.592724 | 2238.40 | 111.3126661 | 2292.13 | 85.49341794 |
| 2272.21 | 1337.826506 | 1569.501124 | 2248.38 | 212.2097671 | 2302.15 | 92.49323279 |
| 2282.21 | −88.74063332 | 312.4205493 | 2258.35 | 148.0641274 | 2312.16 | 92.68125205 |
| 2292.22 | −281.2954724 | −722.3030813 | 2268.32 | 70.3796506 | 2322.18 | 126.3079726 |
| 2302.22 | −1100.754704 | −1959.00414 | 2278.29 | −11.2907835 | 2332.19 | 87.48525986 |
| 2312.23 | −1993.553061 | −1621.390453 | 2288.26 | 138.9993526 | 2342.21 | 160.0424631 |
| 2322.24 | −252.8753957 | −1111.049991 | 2298.22 | 94.41060687 | 2352.22 | 216.9693838 |
| 2332.24 | −114.6922794 | −390.7161921 | 2308.18 | 8.420567335 | 2362.24 | 108.0718521 |
| 2342.25 | 1007.151283 | 124.2526096 | 2318.14 | −57.95639111 | 2372.25 | 198.6993561 |
| 2352.26 | 186.6086765 | 818.4063019 | 2328.10 | −89.67518112 | 2382.27 | 308.5381347 |
| 2362.26 | 368.286122 | 1228.437516 | 2338.06 | 166.1435471 | 2392.28 | 233.3352833 |
| 2372.27 | 1420.474875 | 1470.518086 | 2348.01 | 47.55116636 | 2402.30 | 199.913954 |
| 2382.28 | −15.20402847 | 476.3402157 | 2357.96 | −112.4039599 | 2412.31 | 328.566246 |
| 2392.28 | 487.8034804 | 875.0592421 | 2367.91 | −92.34934375 | 2422.33 | 440.5182622 |
| 2402.29 | −456.7426985 | −67.04033764 | 2377.86 | 6.825447361 | 2432.34 | 228.0424133 |
| 2412.30 | −761.5346907 | −438.338257 | 2387.80 | 40.47869299 | 2442.36 | 180.3819973 |
| 2422.30 | −716.306305 | −951.80626 | 2397.74 | 115.8280977 | 2452.37 | 331.5718859 |
| 2432.31 | 19.14664416 | −411.4209169 | 2407.68 | −52.10616099 | - | - |
| 2442.32 | 87.46256623 | −390.2173155 | 2417.62 | 35.37923776 | - | - |
| 2452.32 | 176.0899746 | 237.4730638 | 2427.55 | −117.2654779 | - | - |
| - | - | - | 2437.48 | 114.907234 | - | - |
| - | - | - | 2447.41 | −32.57342231 | - | - |
| - | - | - | 2457.34 | −42.84769343 | - | - |
References
- Hoch, G.; Richter, A.; Körner, C. Non-structural carbon compounds in temperate forest trees. Plant. Cell. Environ. 2003, 26, 1067–1081. [Google Scholar] [CrossRef]
- White, L.M. Carbohydrate reserves of grasses: A review. J. Range Manag. 1973, 26, 13–18. [Google Scholar] [CrossRef]
- Chapin, F.S.; Wardlaw, I.F. Effect of phosphorus deficiency on source-sink interactions between the flag leaf and developing grain in barley. J. Exp. Bot. 1988, 39, 165–177. [Google Scholar] [CrossRef]
- Würth, M.K.R.; Pelãez-Riedl, S.; Wright, S.J.; Körner, C. Non-structural carbohydrate pools in a tropical forest. Oecologia 2005, 143, 11–24. [Google Scholar] [CrossRef] [PubMed]
- Dietze, M.C.; Sala, A.; Carbone, M.S.; Czimczik, C.I.; Mantooth, J.A.; Richardson, A.D.; Vargas, R. Nonstructural carbon in woody plants. Ann. Rev. Plant. Biol. 2014, 65, 667–687. [Google Scholar] [CrossRef]
- O’Brien, M.J.; Leuzinger, S.; Philipson, C.D.; Tay, J.; Hector, A. Drought survival of tropical tree seedlings enhanced by non-structural carbohydrate levels. Nature Clim. Change 2014, 4, 710–714. [Google Scholar] [CrossRef]
- Malhi, Y.; Aragão, L.E.O.C.; Galbraith, D.; Huntingford, C.; Fisher, R.; Zelazowski, P.; Sitch, S.; McSweeney, C.; Meir, P. Exploring the likelihood and mechanism of a climate-change-induced dieback of the amazon rainforest. Proc. National Acad. Sci. 2009, 106, 20610–20615. [Google Scholar] [CrossRef]
- Nepstad, D.; Lefebvre, P.; Da Silva, U.L.; Tomasella, J.; Schlesinger, P.; Solorzano, L.; Moutinho, P.; Ray, D.; Benito, J.G. Amazon drought and its implications for forest flammability and tree growth: A basin-wide analysis. Glb. Change Biol. 2004, 10, 704–717. [Google Scholar] [CrossRef]
- O’Brien, M.J.; Burslem, D.F.R.P.; Caduff, A.; Tay, J.; Hector, A. Contrasting nonstructural carbohydrate dynamics of tropical tree seedlings under water deficit and variability. New Phytol. 2014, 205, 1083–1094. [Google Scholar] [CrossRef] [PubMed]
- Asner, G.P.; Martin, R.E.; Tupayachi, R.; Anderson, C.B.; Sinca, F.; Carranza-Jimenez, L.; Martinez, P. Amazonian functional diversity from forest canopy chemical assembly. Proc. National Acad. Sci. 2014, 111, 5604–5609. [Google Scholar] [CrossRef]
- Asner, G.P.; Martin, R.E.; Anderson, C.B.; Knapp, D.E. Quantifying forest canopy traits: Imaging spectroscopy versus field survey. Remote Sens. Environ. 2015, 158, 15–27. [Google Scholar] [CrossRef]
- Kokaly, R.F.; Asner, G.P.; Ollinger, S.V.; Martin, M.E.; Wessman, C.A. Characterizing canopy biochemistry from imaging spectroscopy and its application to ecosystem studies. Remote Sens. Environ. 2009, 113, S78–S91. [Google Scholar] [CrossRef]
- Ustin, S.L.; Roberts, D.A.; Gamon, J.A.; Asner, G.P.; Green, R.O. Using imaging spectroscopy to study ecosystem processes and properties. Bioscience 2004, 54, 523–534. [Google Scholar] [CrossRef]
- Curran, P.J. Remote sensing of foliar chemistry. Remote Sens. Environ. 1989, 30, 271–278. [Google Scholar] [CrossRef]
- Asner, G.P. Biophysical remote sensing signatures of arid and semi-arid regions. In Remote Sensing for Natural Resources, Management and Environmental Monitoring: Manual of Remote Sensing; Ustin, S.L., Ed.; Wiley & Sons: New York, NY, USA, 2004; Vol. 4, pp. 53–109. [Google Scholar]
- Asner, G.P.; Martin, R.E.; Knapp, D.E.; Tupayachi, R.; Anderson, C.; Carranza, L.; Martinez, P.; Houcheime, M.; Sinca, F.; Weiss, P. Spectroscopy of canopy chemicals in humid tropical forests. Remote Sens. Environ. 2011, 115, 3587–3598. [Google Scholar] [CrossRef]
- Asner, G.P.; Martin, R.E. Spectral and chemical analysis of tropical forests: Scaling from leaf to canopy levels. Remote Sens. Environ. 2008, 112, 3958–3970. [Google Scholar] [CrossRef]
- Jacquemoud, S.; Verhoef, W.; Baret, F.; Bacour, C.; Zarco-Tejada, P.J.; Asner, G.P.; Francois, C.; Ustin, S.L. Prospect plus sail models: A review of use for vegetation characterization. Remote Sens. Environ. 2009, 113, S56–S66. [Google Scholar] [CrossRef]
- Feret, J.-B.; Francois, C.; Asner, G.P.; Gitelson, A.A.; Martin, R.E.; Bidel, L.P.R.; Ustin, S.L.; le Maire, G.; Jacquemoud, S. Prospect-4 and 5: Advances in the leaf optical properties model separating photosynthetic pigments. Remote Sens. Environ. 2008. [Google Scholar] [CrossRef]
- Verhoef, W.; Bach, H. Coupled soil-leaf-canopy and atmosphere radiative transfer modeling to simulate hyperspectral multi-angular surface reflectance and toa radiance data. Remote Sens. Environ. 2007, 109, 166–182. [Google Scholar] [CrossRef]
- Asner, G.P.; Martin, R.E. Canopy phylogenetic, chemical and spectral assembly in a lowland amazonian forest. New Phytol. 2011, 189, 999–1012. [Google Scholar] [CrossRef] [PubMed]
- Scurlock, J.M.O.; Asner, G.P.; Gower, S.T. Worldwide Historical Estimates and Bibliography of Leaf Area Index, 1932–2000; ORNL Technical Memorandum, TM-2001/268; Oak Ridge National Laboratory: Oak Ridge, TN, USA, 2001. [Google Scholar]
- Asner, G.P.; Scurlock, J.M.O.; Hicke, J.A. Global synthesis of leaf area index observations: Implications for ecological and remote sensing studies. Glb. Ecol. Biogeogr. 2003, 12, 191–205. [Google Scholar] [CrossRef]
- Asner, G.P.; Knapp, D.E.; Boardman, J.; Green, R.O.; Kennedy-Bowdoin, T.; Eastwood, M.; Martin, R.E.; Anderson, C.; Field, C.B. Carnegie airborne observatory-2: Increasing science data dimensionality via high-fidelity multi-sensor fusion. Remote Sens. Environ. 2012, 124, 454–465. [Google Scholar] [CrossRef]
- Colgan, M.; Baldeck, C.; Féret, J.-B.; Asner, G. Mapping savanna tree species at ecosystem scales using support vector machine classification and brdf correction on airborne hyperspectral and lidar data. Remote Sens. 2012, 4, 3462–3480. [Google Scholar] [CrossRef]
- Haaland, D.M.; Thomas, E.V. Partial least-squares methods for spectral analyses. 1. Relation to other quantitative calibration methods and the extraction of qualitative information. Anal. Chem. 1988, 60, 1193–1202. [Google Scholar] [CrossRef]
- Gao, B.-C.; Goetz, A.F.H. Retrieval of equivalent water thickness and information related to biochemical components of vegetation canopies from aviris data. Remote Sens. Environ. 1995, 52, 155–162. [Google Scholar] [CrossRef]
- Chen, S.; Hong, X.; Harris, C.J.; Sharkey, P.M. Sparse modeling using orthogonal forest regression with press statistic and regularization. IEEE Trans. Syst. Man Cybern. 2004, 34, 898–911. [Google Scholar] [CrossRef]
- Sims, D.A.; Gamon, J.A. Relationships between leaf pigment content and spectral reflectance across a wide range of species, leaf structures and developmental stages. Remote Sens. Environ. 2002, 81, 337–354. [Google Scholar] [CrossRef]
- Curran, P.J.; Dungan, J.L.; Macler, B.A.; Plummer, S.E.; Peterson, D.L. Reflectance spectroscopy of fresh whole leaves for the estimation of chemical concentration. Remote Sens. Environ. 1992, 39, 153–166. [Google Scholar] [CrossRef]
- Vogelmann, T.C.; Nishio, J.N.; Smith, W.K. Leaves and light capture: Light propagation and gradients of carbon fixation within leaves. Trends Plant. Sci. 1996, 1, 65–70. [Google Scholar] [CrossRef]
- Roberts, D.A.; Nelson, B.W.; Adams, J.B.; Palmer, F. Spectral changes with leaf aging in Amazon caatinga. Trees 1998, 12, 315–325. [Google Scholar] [CrossRef]
- Ollinger, S.V. Sources of variability in canopy reflectance and the convergent properties of plants. New Phytol. 2011, 189, 375–394. [Google Scholar] [CrossRef] [PubMed]
- Asner, G.P. Biophysical and biochemical sources of variability in canopy reflectance. Remote Sens. Environ. 1998, 64, 234–253. [Google Scholar] [CrossRef]
- Jacquemoud, S.; Baret, F. Prospect—A model of leaf optical-properties spectra. Remote Sens. Environ. 1990, 34, 75–91. [Google Scholar] [CrossRef]
- Martin, M.E.; Plourde, L.C.; Ollinger, S.V.; Smith, M.-L.; McNeil, B.E. A generalizable method for remote sensing of canopy nitrogen across a wide range of forest ecosystems. Remote Sens. Environ. 2008, 112, 3511–3519. [Google Scholar] [CrossRef]
- Kerespi, I.; Toth, M.; Boross, L. Water-soluble carbohydrates in dried plant. J. Agric. Food Chem. 1996, 44, 3235–3239. [Google Scholar] [CrossRef]
- Doughty, C.E.; Goulden, M.L. Seasonal patterns of tropical forest leaf area index and CO2 exchange. J. Geophys. Res. 2008, 113. [Google Scholar] [CrossRef]
- Wessman, C.A.; Aber, J.D.; Peterson, D.L.; Melillo, J.M. Foliar analysis using near infrared reflectance spectroscopy. Can. J. For. Res. 1988, 18, 6–11. [Google Scholar] [CrossRef]
- Knyazikhin, Y.; Schull, M.A.; Stenberg, P.; Mõttus, M.; Rautiainen, M.; Yang, Y.; Marshak, A.; Latorre Carmona, P.; Kaufmann, R.K.; Lewis, P.; et al. Hyperspectral remote sensing of foliar nitrogen content. Proc. Natl. Acad. Sci. 2013, 110, E185–E192. [Google Scholar] [CrossRef] [PubMed]
- Aber, J.D.; Melillo, J.M. Terrestrial Ecosystems; Saunders College Publishing: Philadephia, PA, USA, 1991; p. 429. [Google Scholar]
© 2015 by the authors; licensee MDPI, Basel, Switzerland. This article is an open access article distributed under the terms and conditions of the Creative Commons Attribution license (http://creativecommons.org/licenses/by/4.0/).
Share and Cite
Asner, G.P.; Martin, R.E. Spectroscopic Remote Sensing of Non-Structural Carbohydrates in Forest Canopies. Remote Sens. 2015, 7, 3526-3547. https://doi.org/10.3390/rs70403526
Asner GP, Martin RE. Spectroscopic Remote Sensing of Non-Structural Carbohydrates in Forest Canopies. Remote Sensing. 2015; 7(4):3526-3547. https://doi.org/10.3390/rs70403526
Chicago/Turabian StyleAsner, Gregory P., and Roberta E. Martin. 2015. "Spectroscopic Remote Sensing of Non-Structural Carbohydrates in Forest Canopies" Remote Sensing 7, no. 4: 3526-3547. https://doi.org/10.3390/rs70403526
APA StyleAsner, G. P., & Martin, R. E. (2015). Spectroscopic Remote Sensing of Non-Structural Carbohydrates in Forest Canopies. Remote Sensing, 7(4), 3526-3547. https://doi.org/10.3390/rs70403526