Article

Human-Induced Landcover Changes Drive a Diminution of Land Surface Albedo in the Loess Plateau (China)

1
Satellite Environmental Center, Ministry of Environmental Protection, Beijing 100094, China
2
Institute of Geographic Sciences and Natural Resources Research, Chinese Academy of Sciences, Beijing 100101, China
3
Center for Spatial Analysis, University of Oklahoma, Norman, OK 73019, USA
*
Author to whom correspondence should be addressed.
Remote Sens. 2015, 7(3), 2926-2941; https://doi.org/10.3390/rs70302926
Submission received: 2 November 2014 / Revised: 17 February 2015 / Accepted: 3 March 2015 / Published: 12 March 2015

Abstract

:
A large decrease in the land surface albedo of the Loess Plateau was observed from 2000 to 2010, as measured using satellite imagery. In particular, ecological restoration program regions experienced a decrease in peak season land surface albedo exceeding 0.05. In this study, we examined the spatial and temporal patterns of variation during the peak season albedo in the Loess Plateau and analyzed its relationships with changes of anthropogenic and natural factors at the pixel level. Our analysis revealed that increasing grassland coverage due to returning rangeland to grassland could lead to a maximum albedo decrease of 0.030 in peak season. This result highlighted the human-induced land use change in driving the decreasing albedo on an annual scale. There was no significant correlation between precipitation change and albedo reduction. Precipitation could influence the spatial pattern of albedo in drought years by influencing the natural vegetation water requirement. However, the role of precipitation was not obvious in the ecological restoration program regions. This article demonstrates the substantial role that land use change could play in regional-scale albedo change and climate. Finally, some implications for the radiative forcing of land use change are discussed.

Graphical Abstract

1. Introduction

Land surface albedo is a fundamental earth surface physical parameter in climate change studies, as it determines the surface radiation budget and leads to a warming or cooling at the earth’s surface [1]. There are various factors that affect the surface albedo. Human-induced land cover changes disturb the earth surface energy balance by modifying the land surface albedo, which impacts regional and global climate systems [2]. Land surface albedo has long been recognized as a key radiative forcing factor from land cover changes [3]. Deforestation, agricultural and pastural expansion caused by human land use generally can lead to increased surface albedo [1]. Afforestation and reforestation activities could reduce surface albedo by absorbing more solar radiation [4]. Because of rapid urbanization, as observed by remote sensing, there are sharp changes in urban landscape pattern and composition [5,6,7]. Significant albedo changes in urban and surrounding areas have also been observed [8]. In addition, the snowmelt process can reduce surface albedo significantly, and its value may decrease from 0.6 to 0.2 in only 5 days [9]. Land cover and surface water change can also play substantial roles in continental-scale albedo trends [10]. These processes and the key role surface albedo plays in climate change have been confirmed in observation and climate-modeling studies [3,11,12,13].
Generally, climate estimation models have relatively low precision and coarse spatial resolution input parameters, which represent the key physical properties of the surface, like albedo. This means it is difficult to extract the main drivers and complex mechanisms for surface albedo variation, like human land-use changes, which may be ignored in climate analysis [14]. Secondly, the surface albedo in the existing climate models tends to be set as a fixed value for land cover types. Actually, albedo changes caused by land cover changes exhibit significant regional differences [14,15]. Thus constant parameters cannot detect dynamic changes in albedo information and spatial difference, and would reduce the representation of albedo in climate models [10,16,17,18]. Finally, a limited number of field sites could not depict the characteristics of the spatial and temporal continuum [19]. Therefore, the diversity of albedo could not be characterized in different regions [20].
Some researchers have considered the use of existing high-resolution remote sensing data to improve the accuracy of estimating the surface albedo in climate models [21,22,23]. However, these studies used the static LULC and ignored the time dynamic information on land cover change in inter-annual scales [24], such as urban sprawl, which can directly affect the land surface characteristics [25,26,27]. These knowledge gaps in the most important drivers of albedo change prevent the accurate estimation of albedo change at the regional scale. Therefore, to identify the main driving mechanisms of albedo change, quantitative estimation of realistic human-induced land cover change and the accurate variation of surface albedo in region scale are needed.
Loess Plateau is a climate transitional zone between arid and humid that exhibits complex responses and feedback for climate change. Because of the low cloud and high solar radiation conditions, the unique physical properties of the underlying surface of the Loess Plateau potentially have large impacts on the local climate and the global radiation budget in addition to a strong role in monsoon circulation [28,29]. Most studies about surface parameters change, energy balance and climate change in Loess Plateau are based on limited field experiments, which can reflect point scale problems well [29,30,31]. However, less work has been documented on the spatially continuous regional scale. In the past 10 years, large-scale ecological restoration programs in this region have changed the land surface dramatically [32,33,34], which contributes significantly to variation in surface albedo, and the effect on climate should not be ignored in decision-making for climate change mitigation [35].
The aim of this study is to attempt to discriminate between the anthropogenic causes and natural driving forces of surface albedo changes in the Loess Plateau, and to demonstrate the role of land use change in modifying regional land surface biophysical properties. Because the Loess Plateau is the region of China with the most serious soil erosion, the Chinese government has made great efforts to restore vegetation on the Loess Plateau to alleviate soil erosion, especially through the Grain to Green Program (GTGP) and the Returning Rangeland to Grassland Program (RRGP). The GTGP was initiated in 1999. The goal of the GTGP is to convert cropland on steep slopes to forests or grasslands. The RRGP was launched in 2003 to stop the accelerated degradation of the western grassland and promote grassland restoration. This article examines the spatial and temporal of surface albedo observed by satellite measurements in Loess Plateau, and quantificationally evaluates the albedo changes in the GTGP and RRGP regions. Then, the relationships between anthropogenic land use drivers and precipitation factors were analyzed at the pixel level.

2. Materials and Methods

2.1. Study Area

The Loess Plateau, located in the middle reaches of the Yellow River basin, north China (Figure 1), covers an area of approximately 624,000 km2 with an average annual air temperature of 4.3 °C–14.3 °C and average annual precipitation of 200–750 mm from the northwest to the southeast [36]. The plateau consists of entirely of two provinces (Shanxi and Ningxia) and parts of provinces: Inner Mongolia, Qinghai, Gansu, Shannxi and Henan (Figure 1).
Figure 1. The distribution map of land cover change in the Loess Plateau.
Remotesensing 07 02926 g001

2.2. Land Use and Land Cover Change

Land use and land cover change data on the Loess Plateau from 2000 to 2010 with spatial resolution of 30 m were determined following the standardized methodology outlined in [37,38]. A hierarchical classification system with 25 types of land use and land cover classes were further grouped into 6 aggregated classes consists of cropland, forest, grassland, water bodies, unused land and built-up areas. The comprehensive accuracy was more than 90% [37,38,39,40]. Our analysis involved three aggregated classes including cropland, forest and grassland, and three second-level classes—dense, moderate and sparse grassland—to find the role of ecological land use change in modifying regional land surface biophysical properties. Then land use changes between cropland, forest and grassland were identified and compared for 2000–2010. The main conversion types were returning cropland to forest and returning cropland to grassland due to the GTGP, and grassland coverage increase because of the RRGP (Figure 1). Until now, due to the ecological restoration programs, a large amount of steep cropland has been converted to forest and grassland coverage has improved remarkably [32,33,34].

2.3. Albedo Data and Composite Method

The MODIS shortwave white sky albedo (WSA) product (Collection 5 MCD43B3, 1000 m spatial resolution, 16-day composites) (https://lpdaac.usgs.gov/products/modis_products_table /mcd43b3) and the Normalized Difference Vegetation Index (NDVI) product (Collection 5 MOD13A2, 1000 m spatial resolution, 16-day composites) (https://lpdaac.usgs.gov/products/modis_products_table/mod13a2) in 2000–2010 were used to estimate the albedo. Surface albedo could be sensitive to vegetation cover change because vegetation had strong absorption in the visible band (0.3–0.7 μm) during the growing season. Thus this article referred to albedo as the “peak season albedo (PSA)”. Peak season albedo could effectively reflect the intrinsic relationship between the inter-annual albedo variations with the land cover change by avoiding vegetation seasonal fluctuation. The first step in the algorithm is the annual maximum NDVI time-flag (Flagmax-NDVI) at every pixel was extracted for each year. The Flagmax-NDVI mean a mark when the maximum NDVI value (NDVImax) appeared in time-series data. The formula was calculated as follows:
F l a g max N D V I = T i m e ( N D V I max )
The second step is generate annual PSA by taking the NDVI time-flag value which calculated from formula 1. If the Flagmax-NDVI was nodata in some pixels, the time closed albedo value was chosed. The formula was calculated as follows:
P S A = A l b e d o F l a g max N D V I
The MODIS product data (Albedo and NDVI) covering tiles H25V5, H26V4, H26V5, and H27V5 were used to mosaic the entire Loess Plateau region.

2.4. Other Data

NDVI and precipitation data were used to reflect the coupling mechanism with albedo changes. To explore the linkage of albedo and vegetation coverage, the NDVI was extracted from the month MODIS vegetation indexes product (MOD13A3) [41] within the Loess Plateau. Time series of embedded quality data were collected spanning the time interval between January 2000 and December 2010. Precipitation data were compiled from the Tropical Rainfall Measuring Mission (TRMM) 3B43 product [42], which merged other satellite data to produce a month precipitation estimate on a scale of 0.25° across the study area during the period of 2000–2010. To explore the spatial and temporal correlations between precipitation and albedo, annual precipitation trend was calculated. The meteorological station data including the annual precipitation were also collected, and the trend was calculated in every station to verify the trend calculated using TRMM data at the corresponding pixels where the station was located. The data were assembled from the National Climatic Centre of the China Meteorological Administration (http://cdc.cma.gov.cn/) at 58 station observations between 2000 and 2010 across the Loess Plateau.

2.5. Albedo Analysis Method

PSA pixels located in the main land use change regions were extracted in 2000–2010. At the regional scales, these data sets were analyzed by using a linear regression approach and the corresponding R-square were calculated. In addition, to further explore the mechanisms driving changes in land surface albedo, some interest regions where albedo had obvious change were selected to analyze time serious variation of albedo, precipitation and NDVI. Moreover, correlation coefficient significant test were also used in data analysis.

3. Results

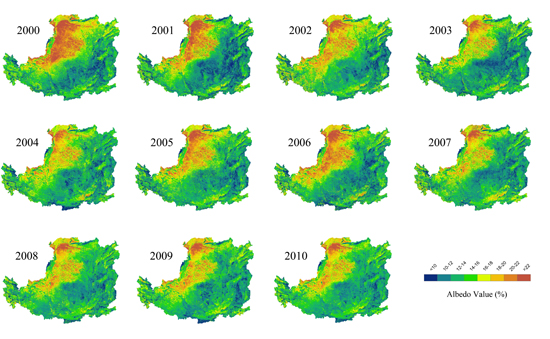
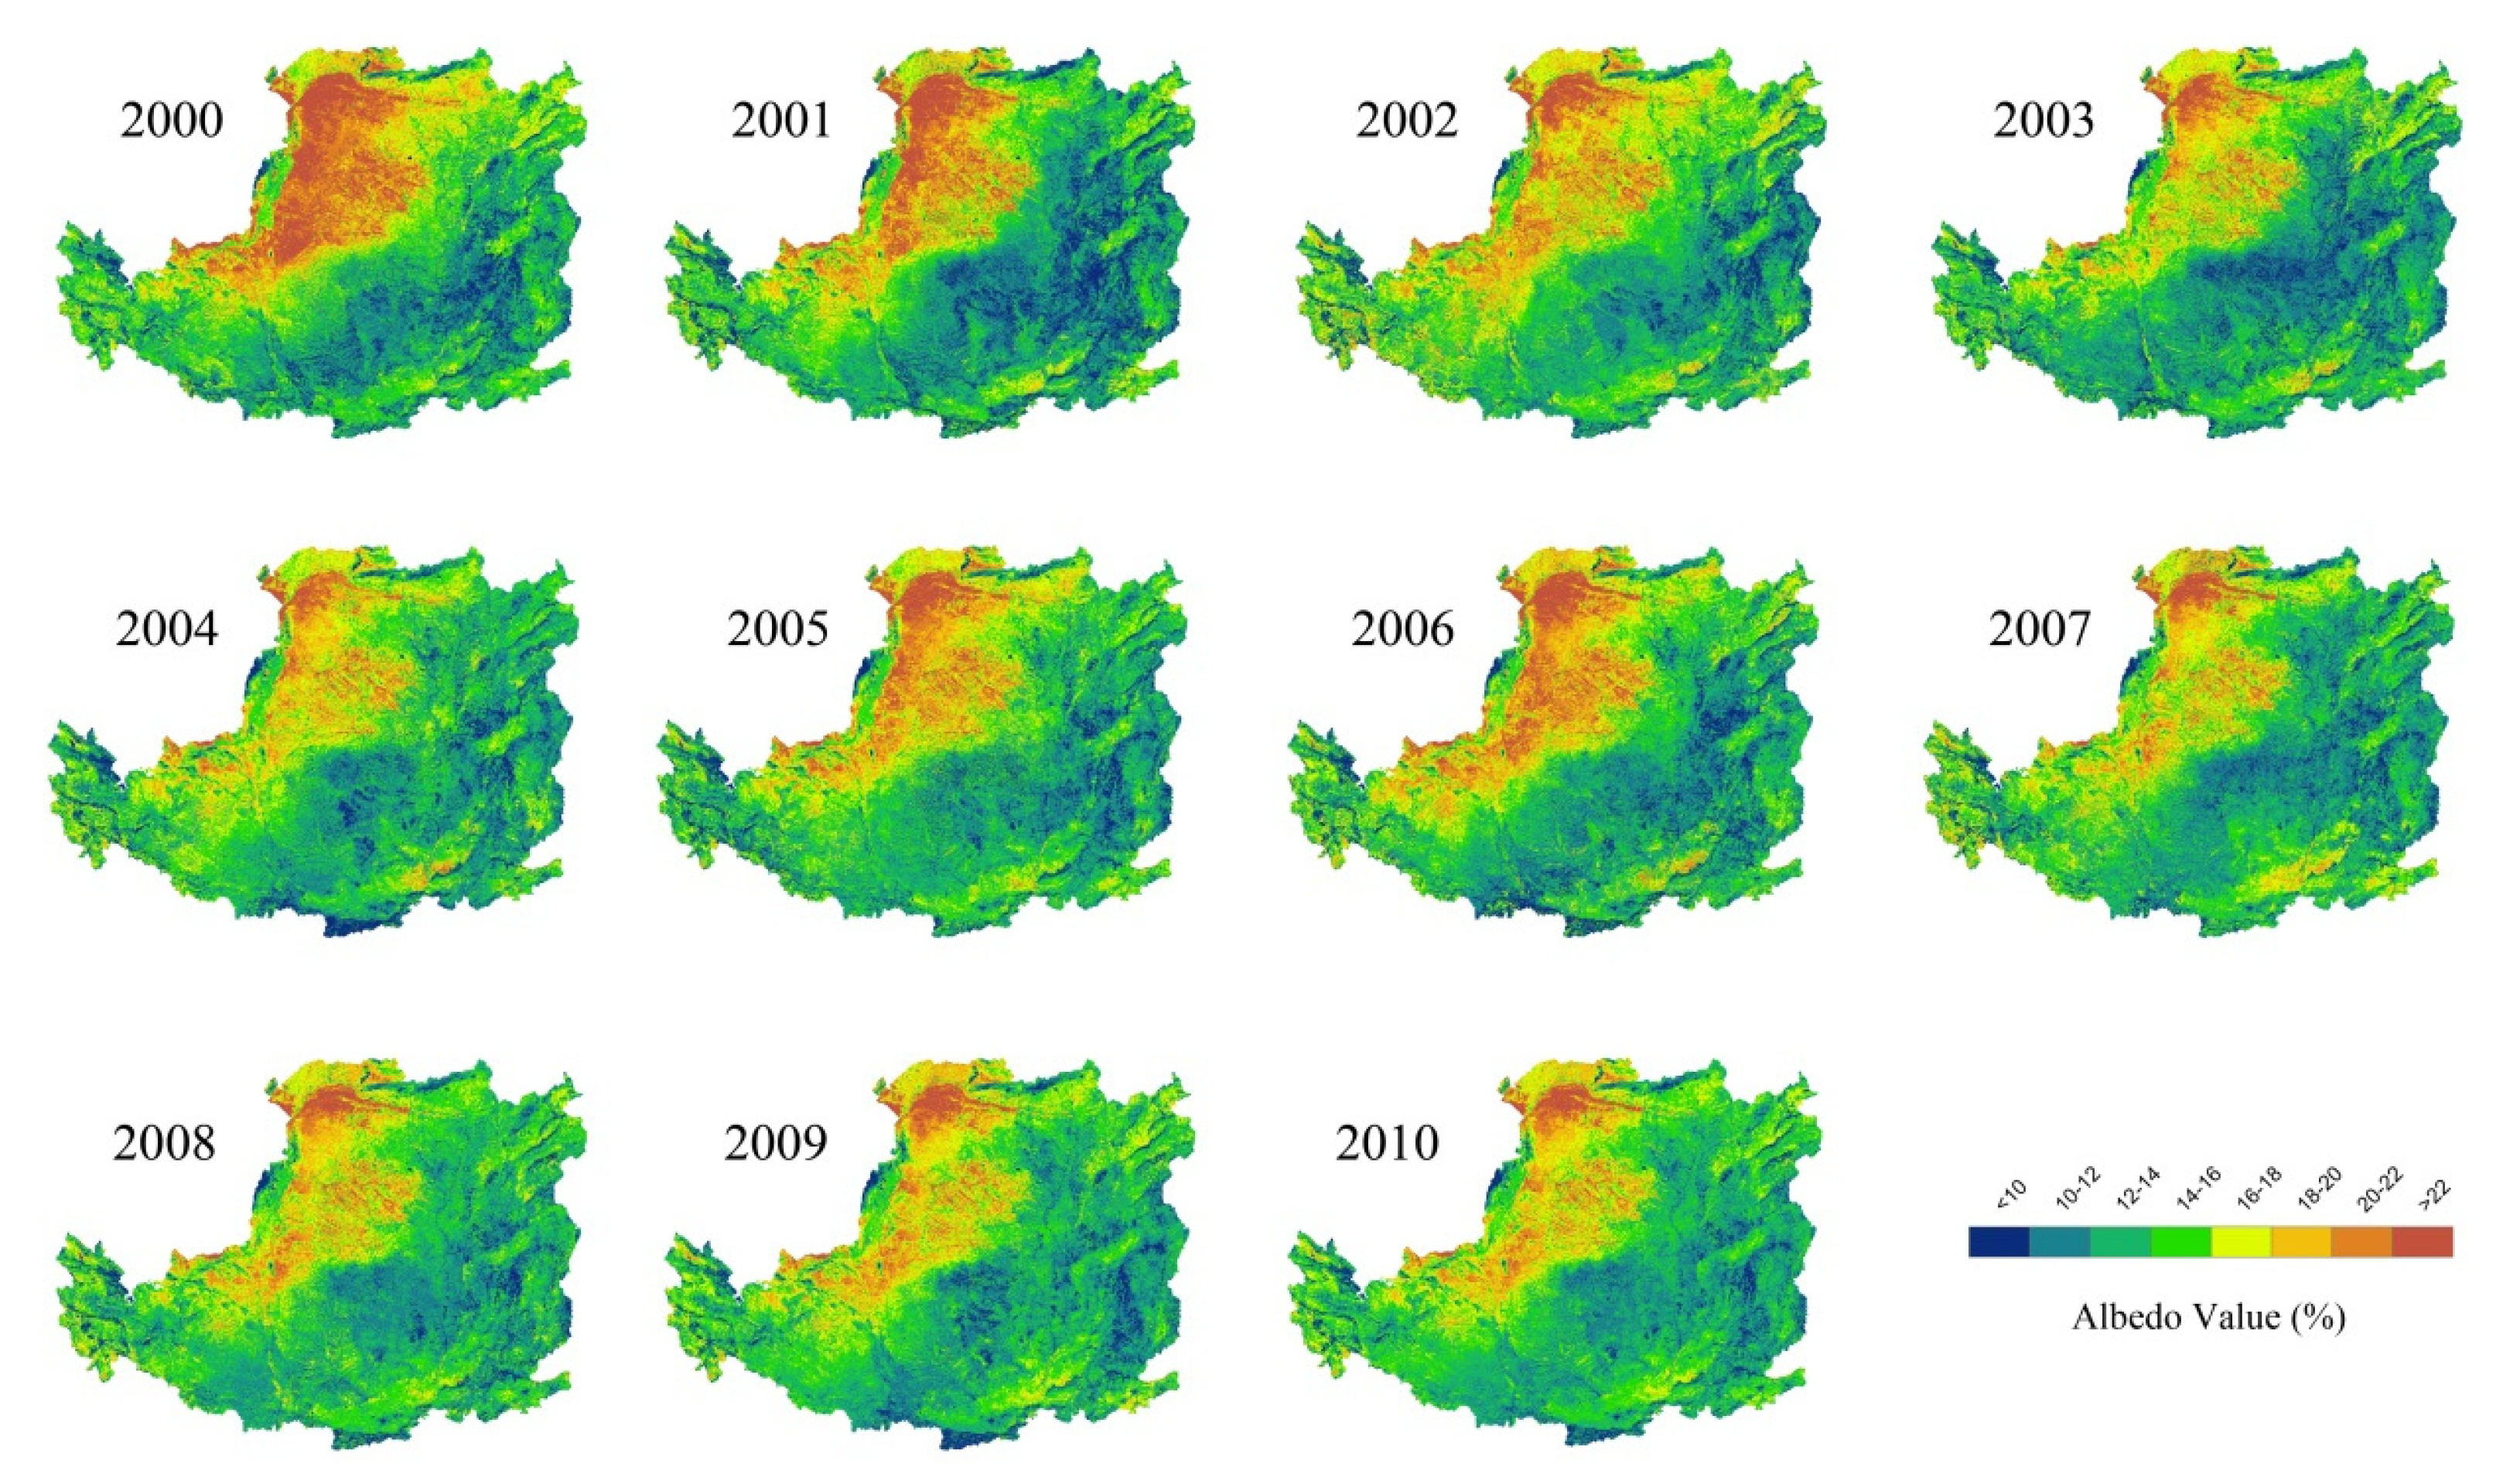
3.1. Spatial and Temporal Distribution of Albedo in the Loess Plateau from 2000 to 2010

Time-series analysis of peak season albedo from 2000 to 2010 indicated that the albedo had a relative decrease of 5.23% (reduced 0.0079) across the whole Loess Plateau (Figure 2), especially in the northwestern region. Between 2000 and 2010, the areas with PSA values greater than 20% had been reduced by 8.90% (~55,789 km2) over the study region. The mean PSA values across the whole Loess Plateau in 2000, 2005 and 2010 were 0.1511, 0.1450 and 0.1432, respectively. The decreasing rate of PSA during 2000–2005 was greater than that during 2005–2010.
Surface albedo of the whole Loess Plateau showed slight decrease, with the average reducing rate of 0.041% per year (Figure 3). The maximum decrease occurred in the northwest region with a rate exceeded 0.05% per year, where there are also cropland and pasture ecotones, such as Etuoke Qi, Shenmu country, Dongsheng district, and Linwu country. However, it showed a positive trend in some regions, such as the Hetao Plain and the Guanzhong Plain, which is the typical agricultural irrigation area along the Yellow River (Figure 3).

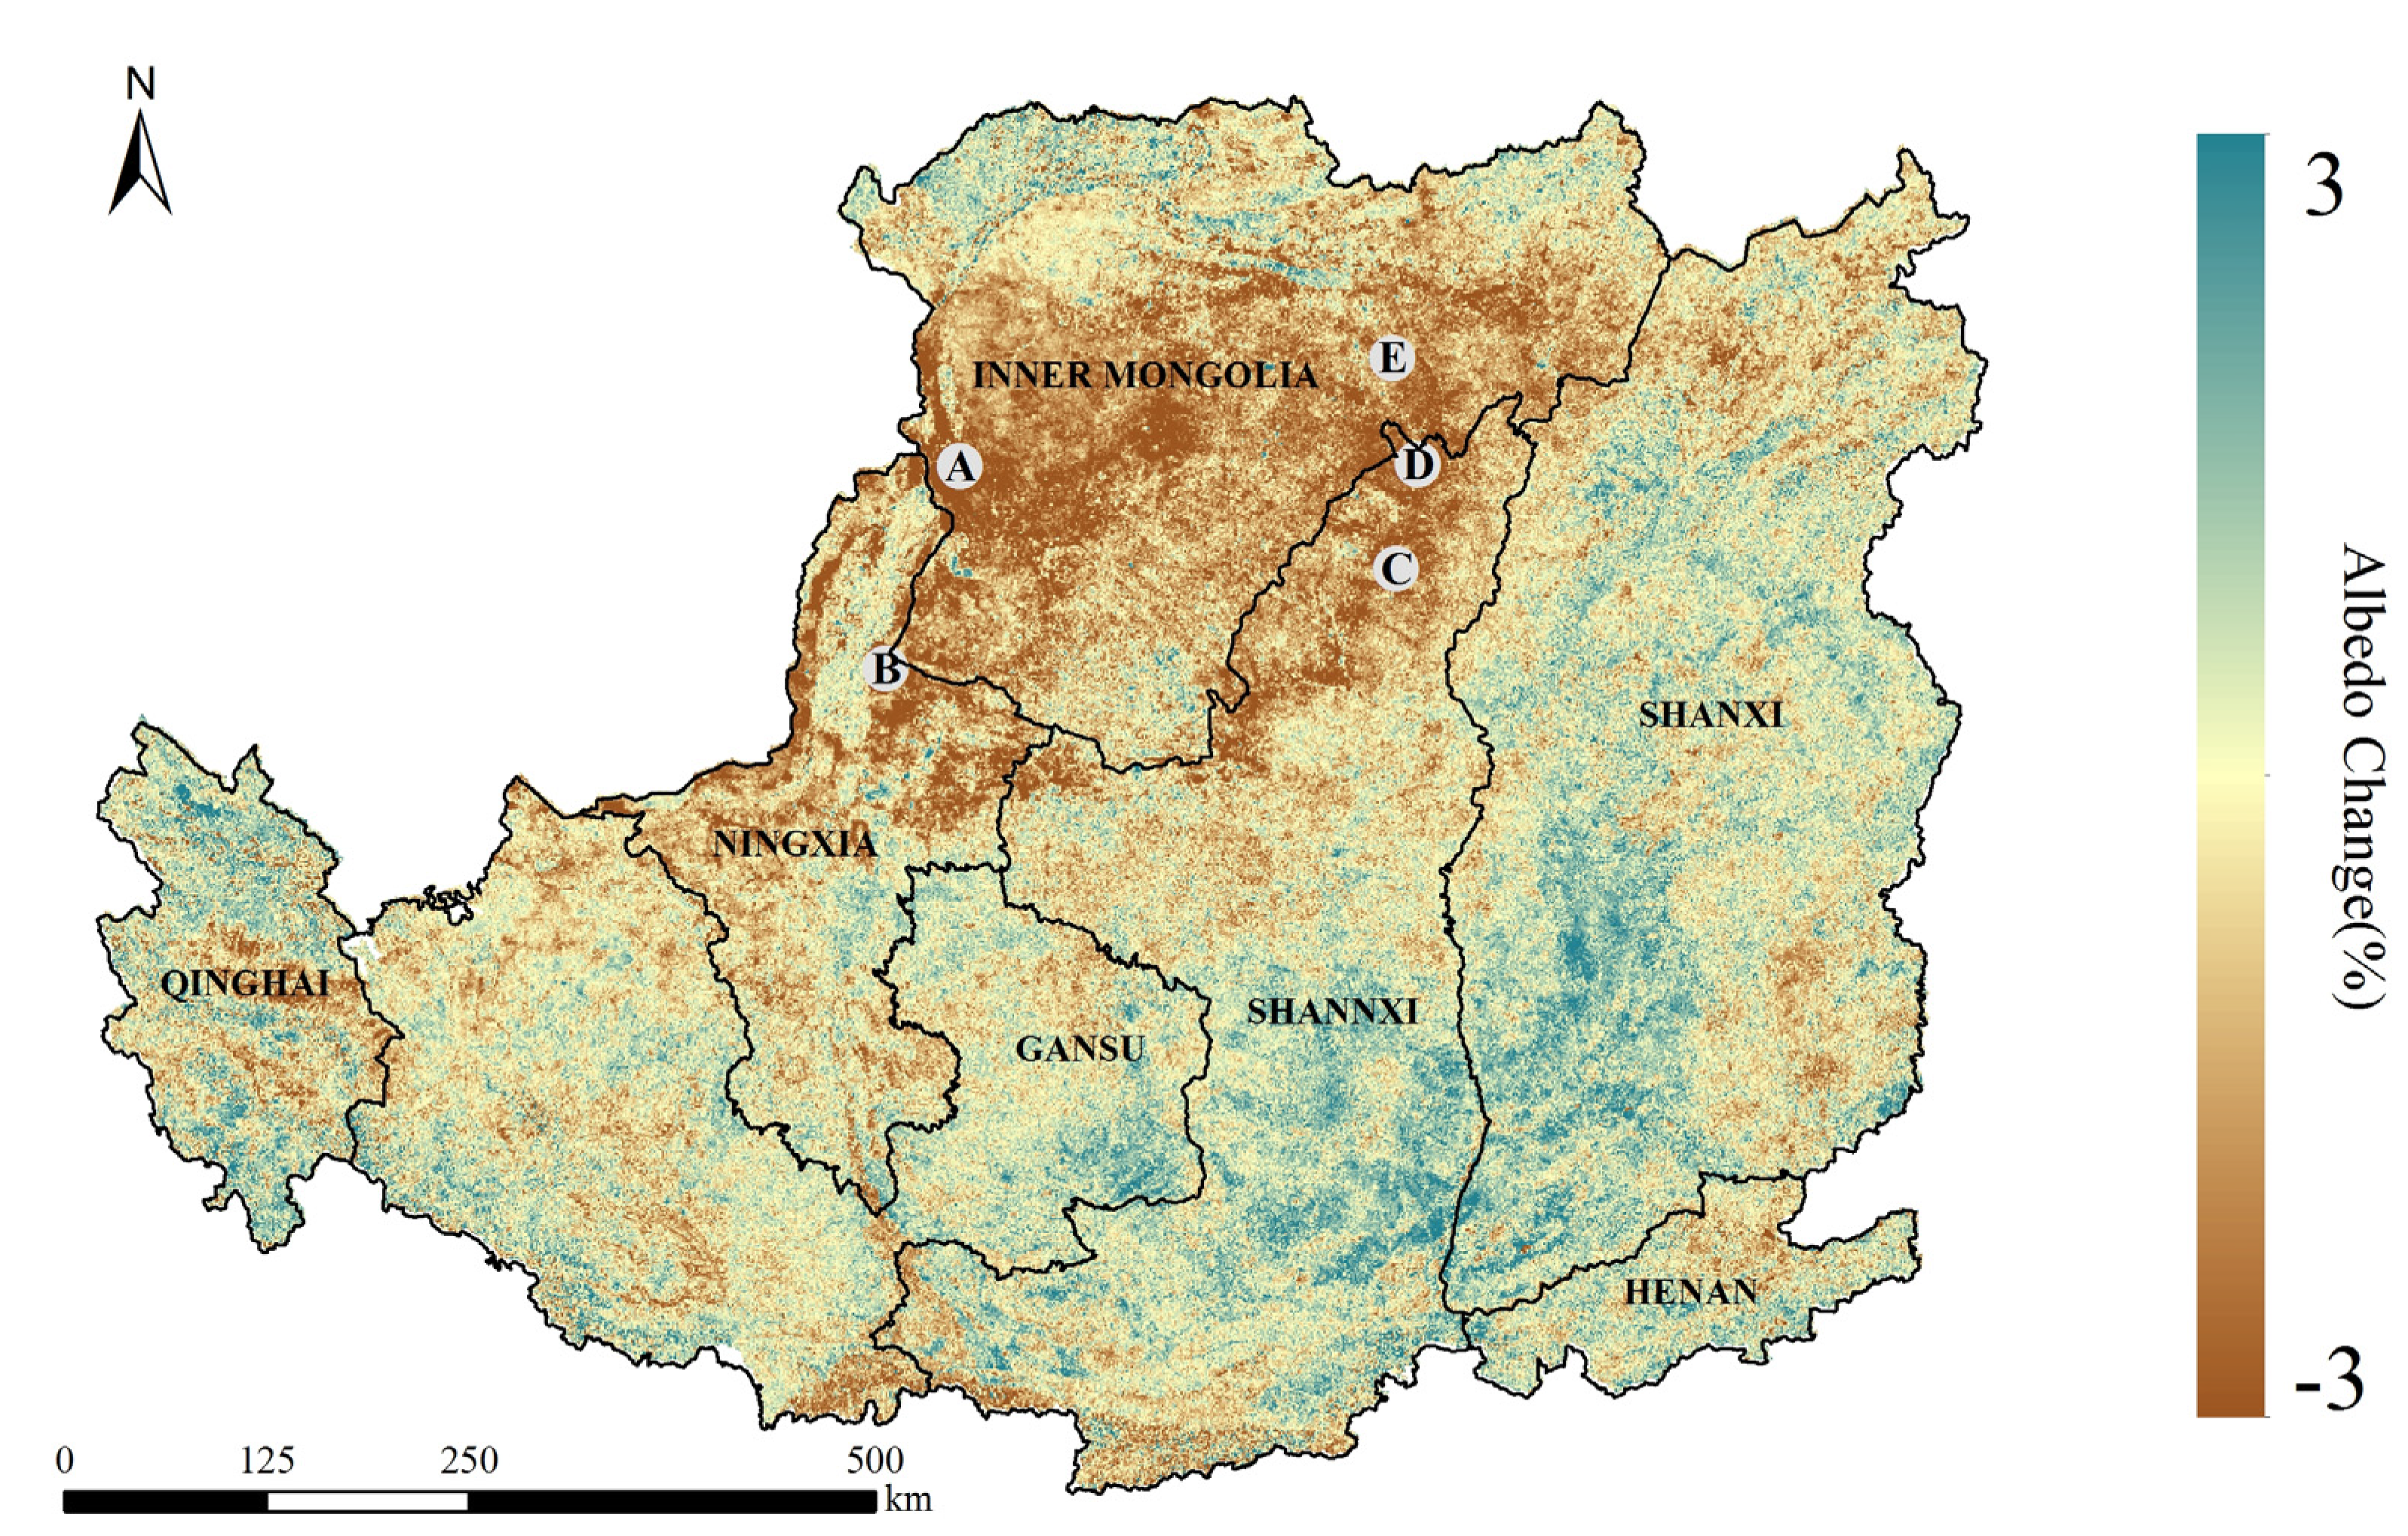
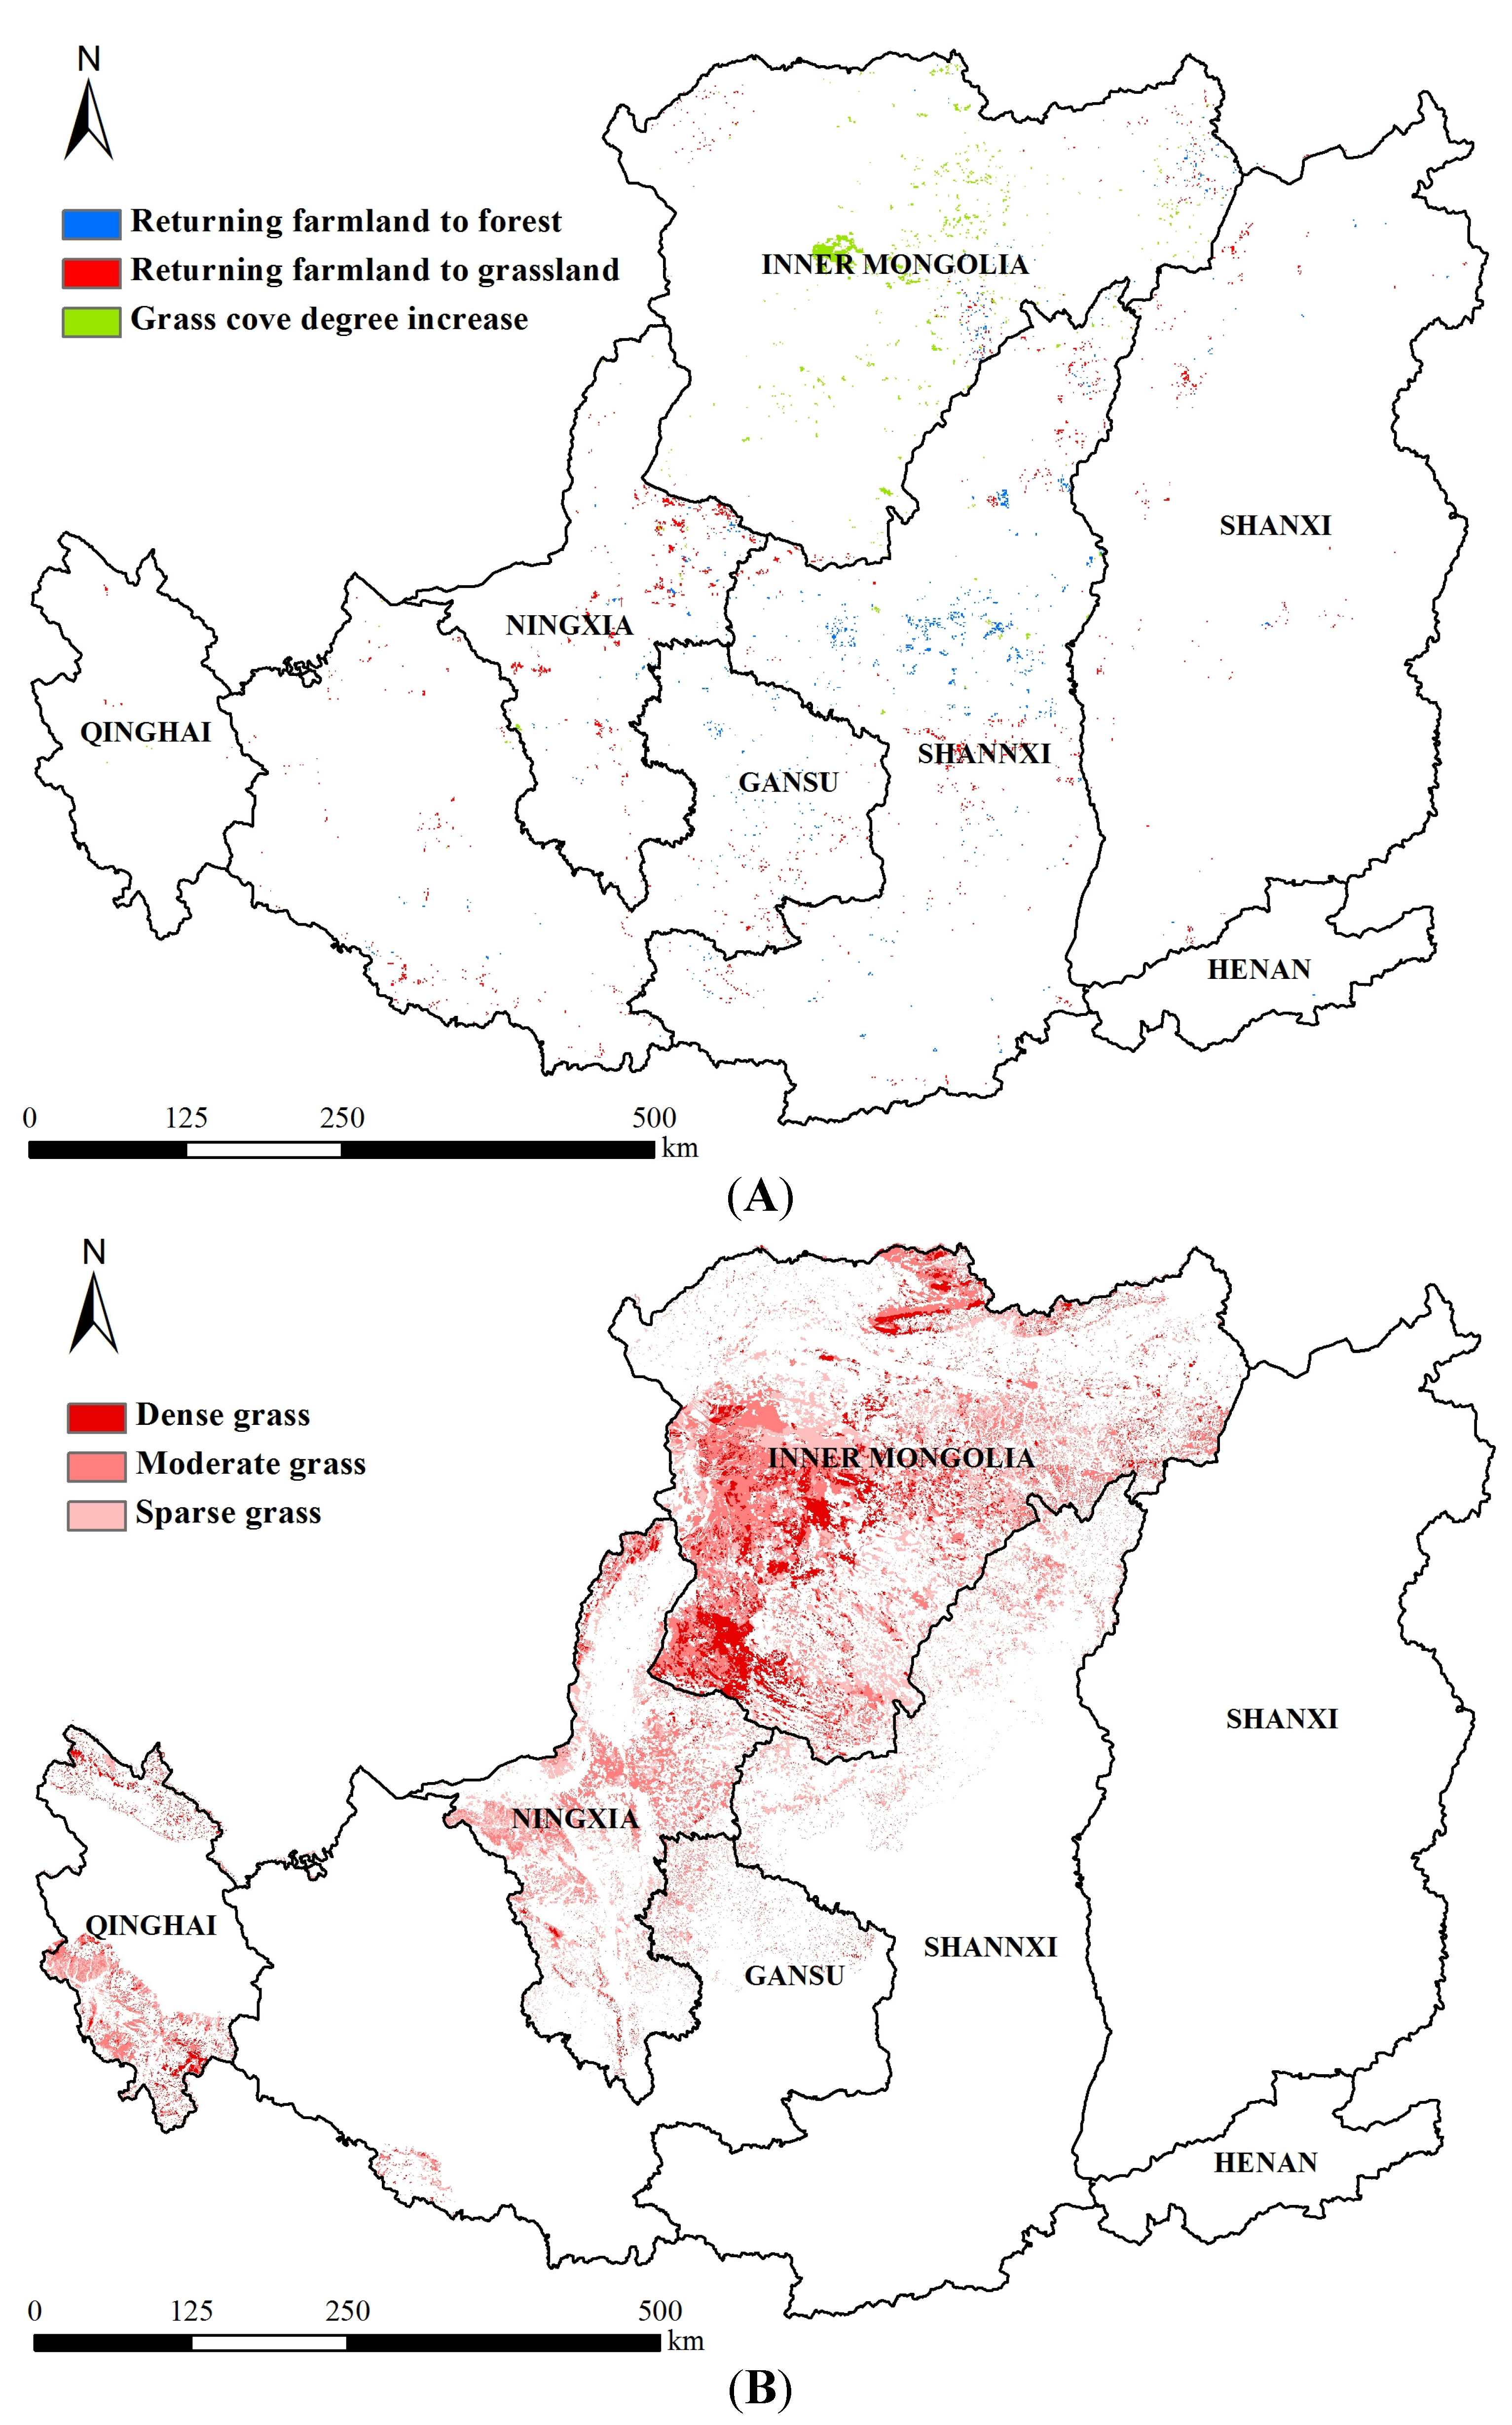
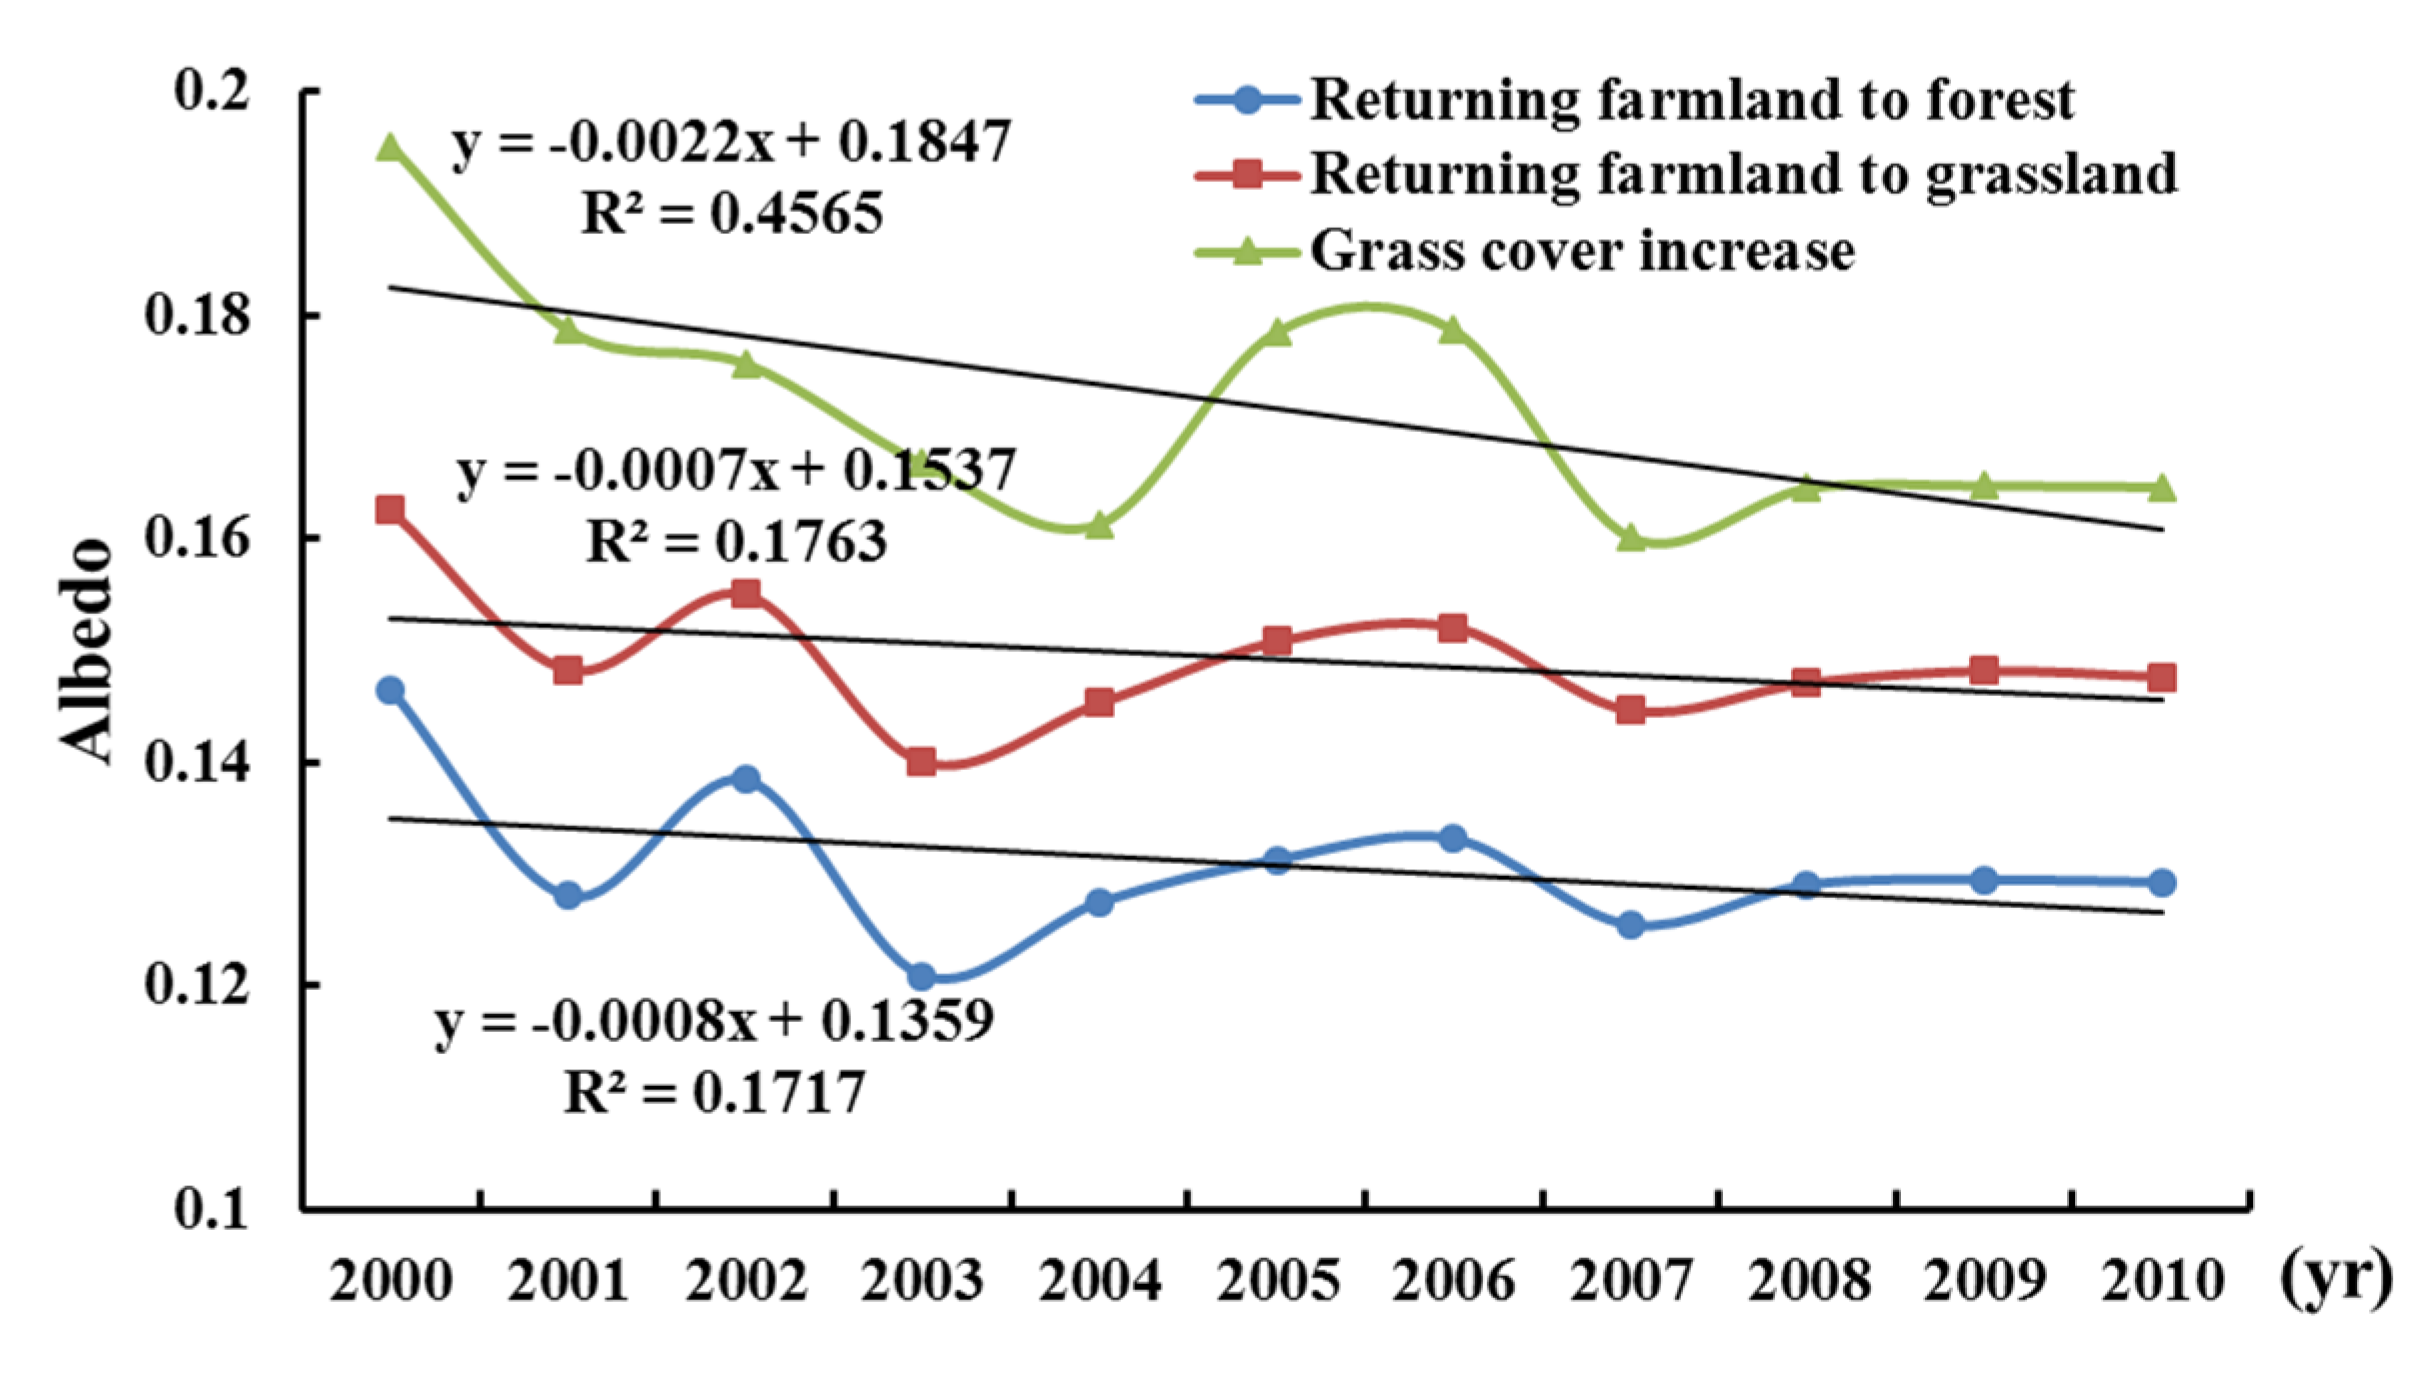
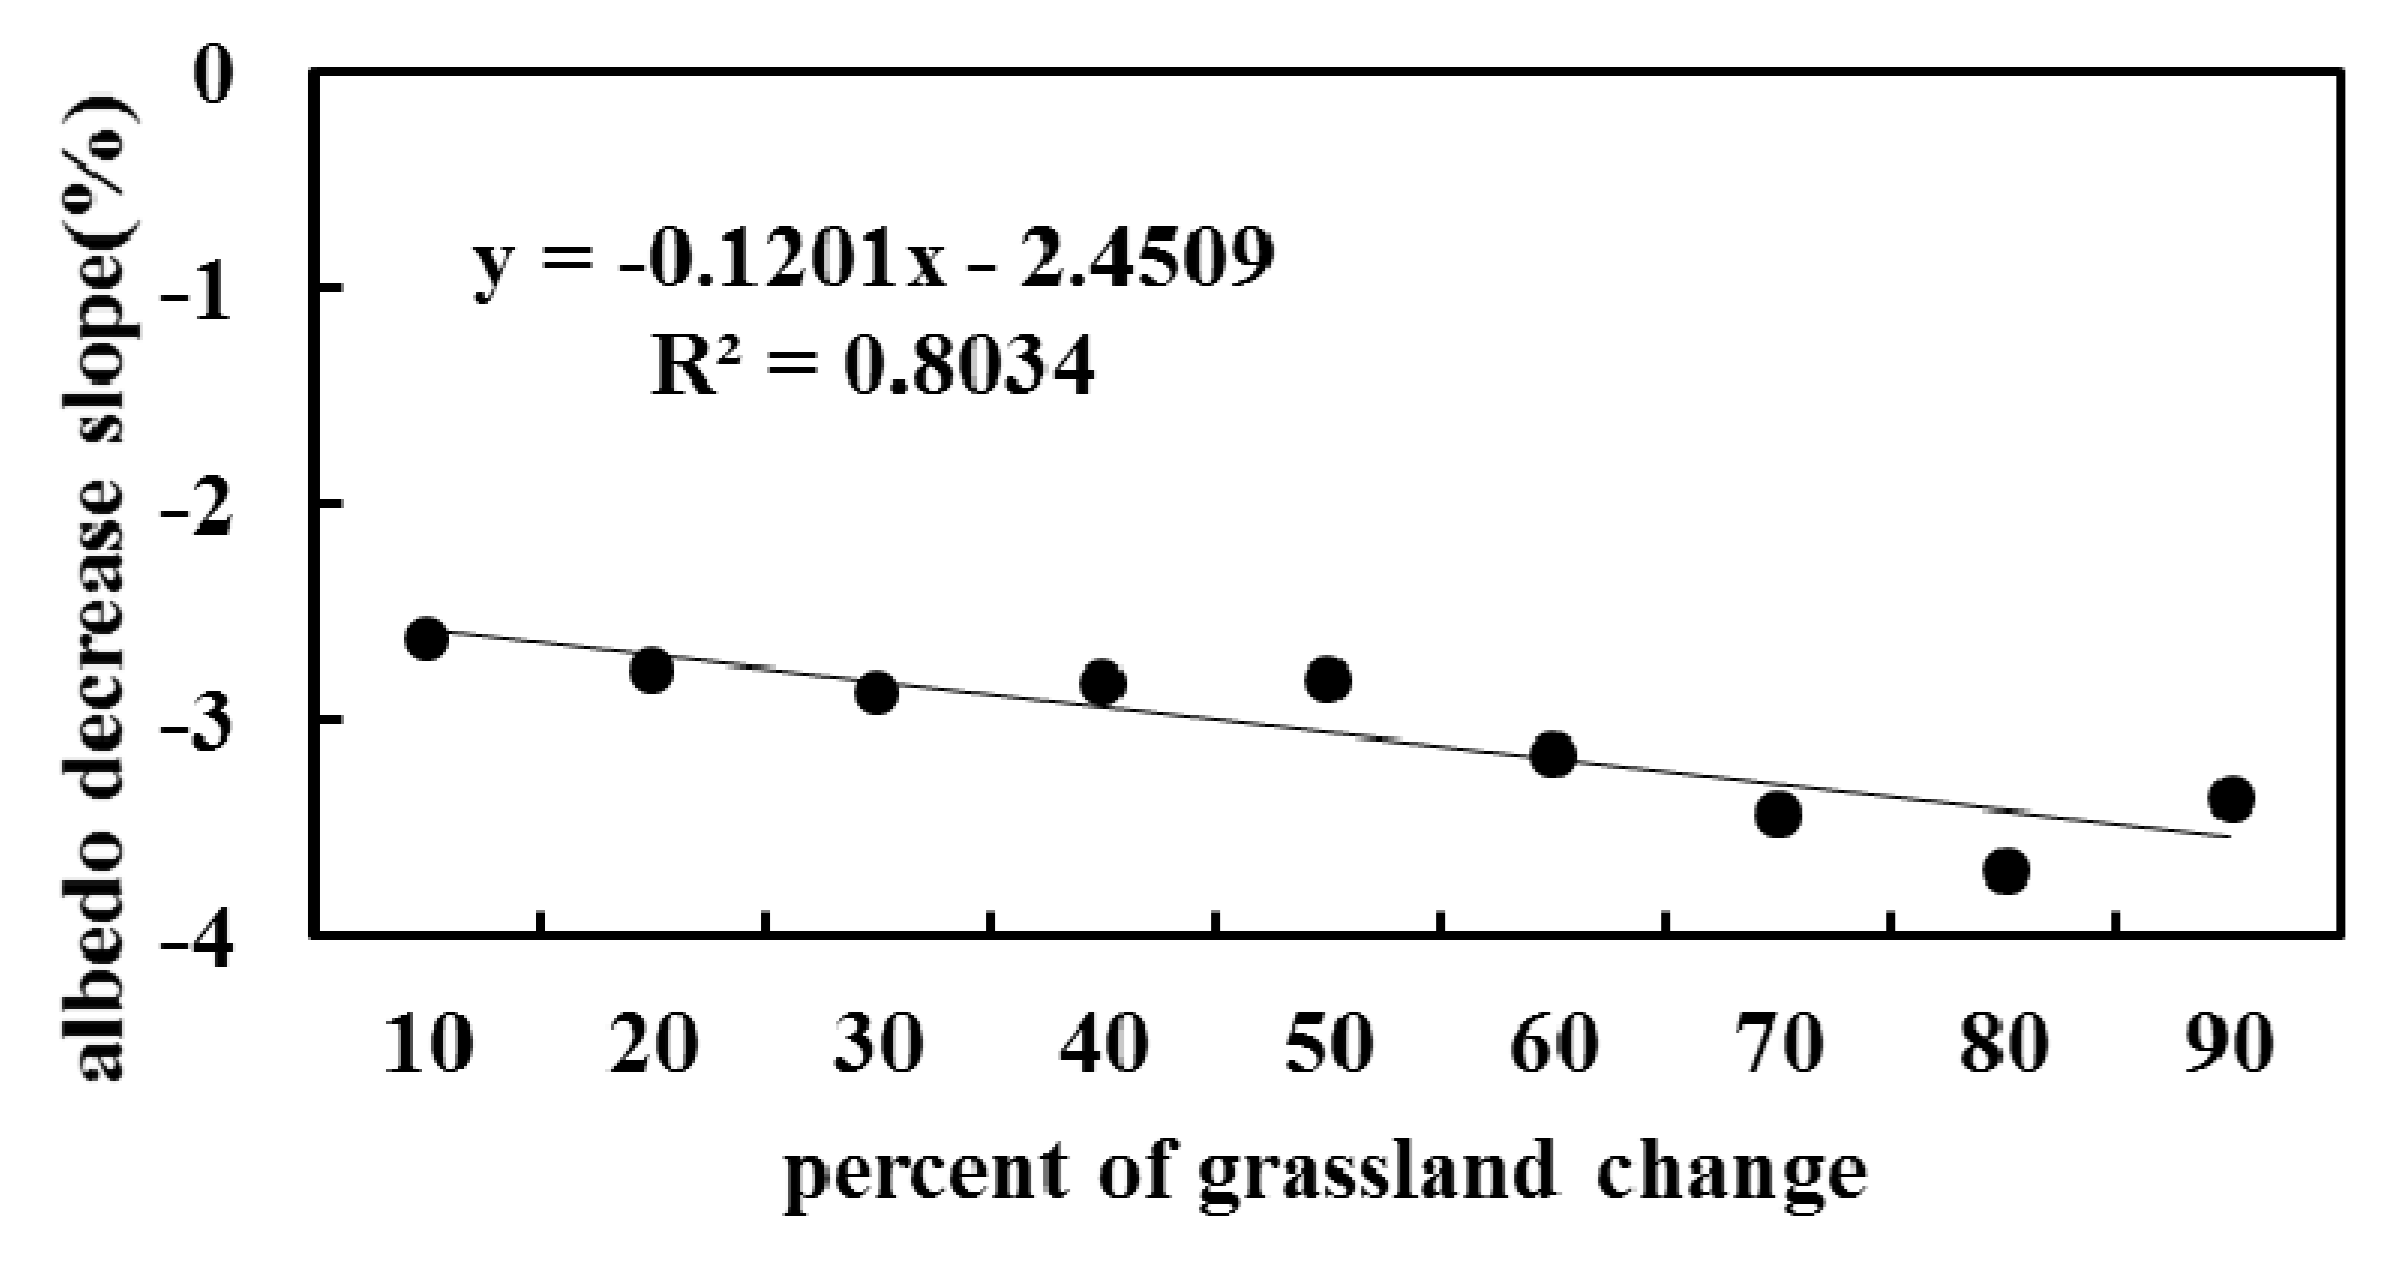
3.2. Effects of Land Use Change on Surface Albedo

Figure 4A showed that the area of cropland returning to grassland in the Loess Plateau reached 2482 km2 from 2000 to 2010. The cropland returning to forest was mainly distributed in central Loess Plateau. The area of increasing grassland coverage was about 1646 km2, mainly distributed in northern Loess Plateau. From Figure 4B, we can see the spatial extent of RRGF consists of all grassland in the arid and semiarid northwestern region of the Loess Plateau that has an annual precipitation of less than 400 mm, accounting for 25.40% of the Loess Plateau. Trends of annual PSA statistical analysis (Figure 5) showed that all the three types of land use change resulted in similar decreasing peak season albedo. The increasing grassland coverage led to a significantly decreasing PSA of about 0.030 (p < 0.05). Further analysis revealed the good linear correlation between albedo decrease slope and percent of grassland change (p < 0.01) (Figure 6). However, returning cropland to grassland and returning cropland to forest led to the PSA declining only by 0.015 and about 0.017, respectively. These findings were also consistent with the time series PSA variation in Figure 2.
Figure 2. Peak season albedo (PSA) spatial and temporal distributions in the Loess Plateau from 2000 to 2010.
Remotesensing 07 02926 g002
Figure 3. Peak season albedo changes from 2000 to 2010 across the Loess Plateau. Interest Regions: (A) Etuoke Qi. (B) Lingwu country. (C)Shenmu country. (D) North of Shenmu. (E) Dongsheng district.
Remotesensing 07 02926 g003
Figure 4. Spatial distributions of three types of land use change (A), and three degrees (dense, moderate and sparse coverage) of grassland (B) across the Loess Plateau from 2000 to 2010.
Remotesensing 07 02926 g004
During 2000–2010, the total vegetation coverage increased from 31.60% to 42.40%. Shannxi, Neimenggu and Ningxia province are major regions of GTGP and RRGF. In our analysis, forest had the lowest albedo value, and cropland and sparse coverage grassland had the highest albedo value (Figure 5 and Figure 6).
Figure 5. Trends of peak season albedo in regions with the three types of land use change from 2000 to 2010.
Remotesensing 07 02926 g005
Figure 6. Relationship between the percent of grassland coverage change and the percent PSA change across the RRGP region.
Remotesensing 07 02926 g006

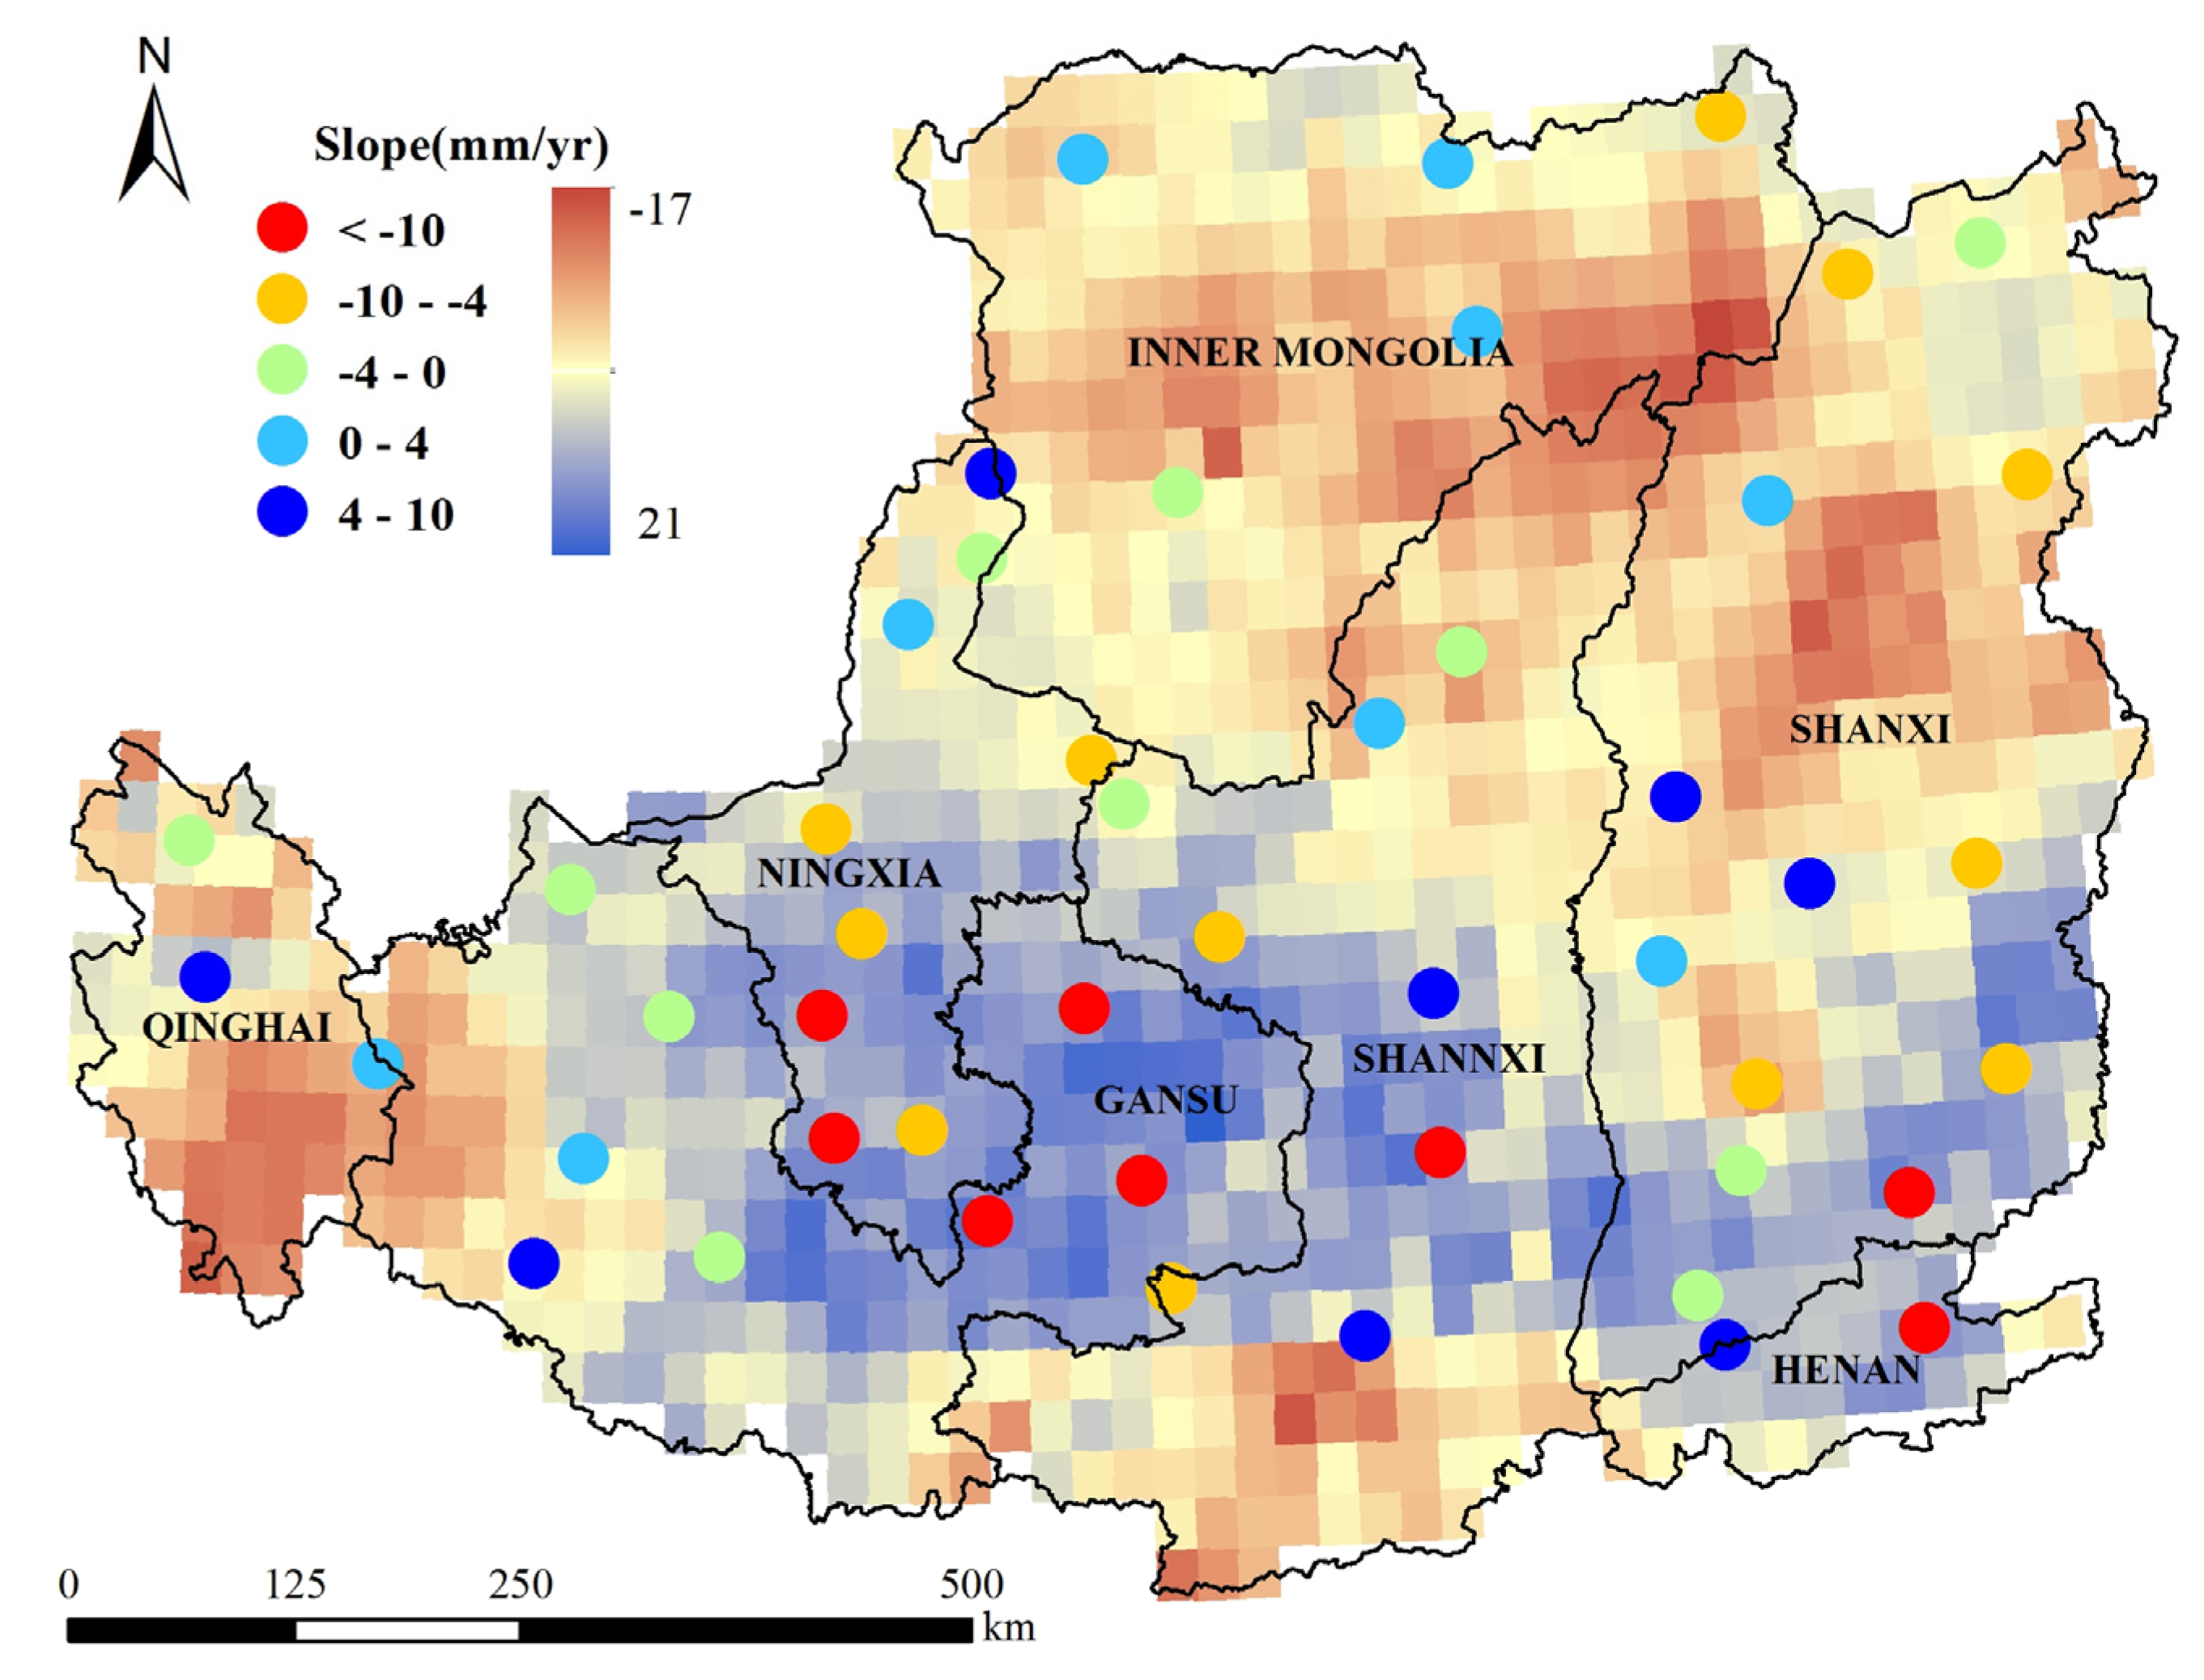
3.3. Effect of Annual Precipitation Change on Surface Albedo

Figure 7 showed that precipitation exhibited obvious spatial variations. Although there was an increasing trend in the northern region and a decreasing trend in the southern, the statisticall total trend for the whole region showed a weak increase of 1.55 mm∙yr−1. The 58-station observation analysis also found a weaker increasing trend of 0.44 mm∙yr−1.
The scatter plot suggested no relationship between precipitation and albedo (Figure 8), which indicated that precipitation variation could not explain the observed albedo decreases. More detailed quantitative analysis was needed related to test these hypotheses.

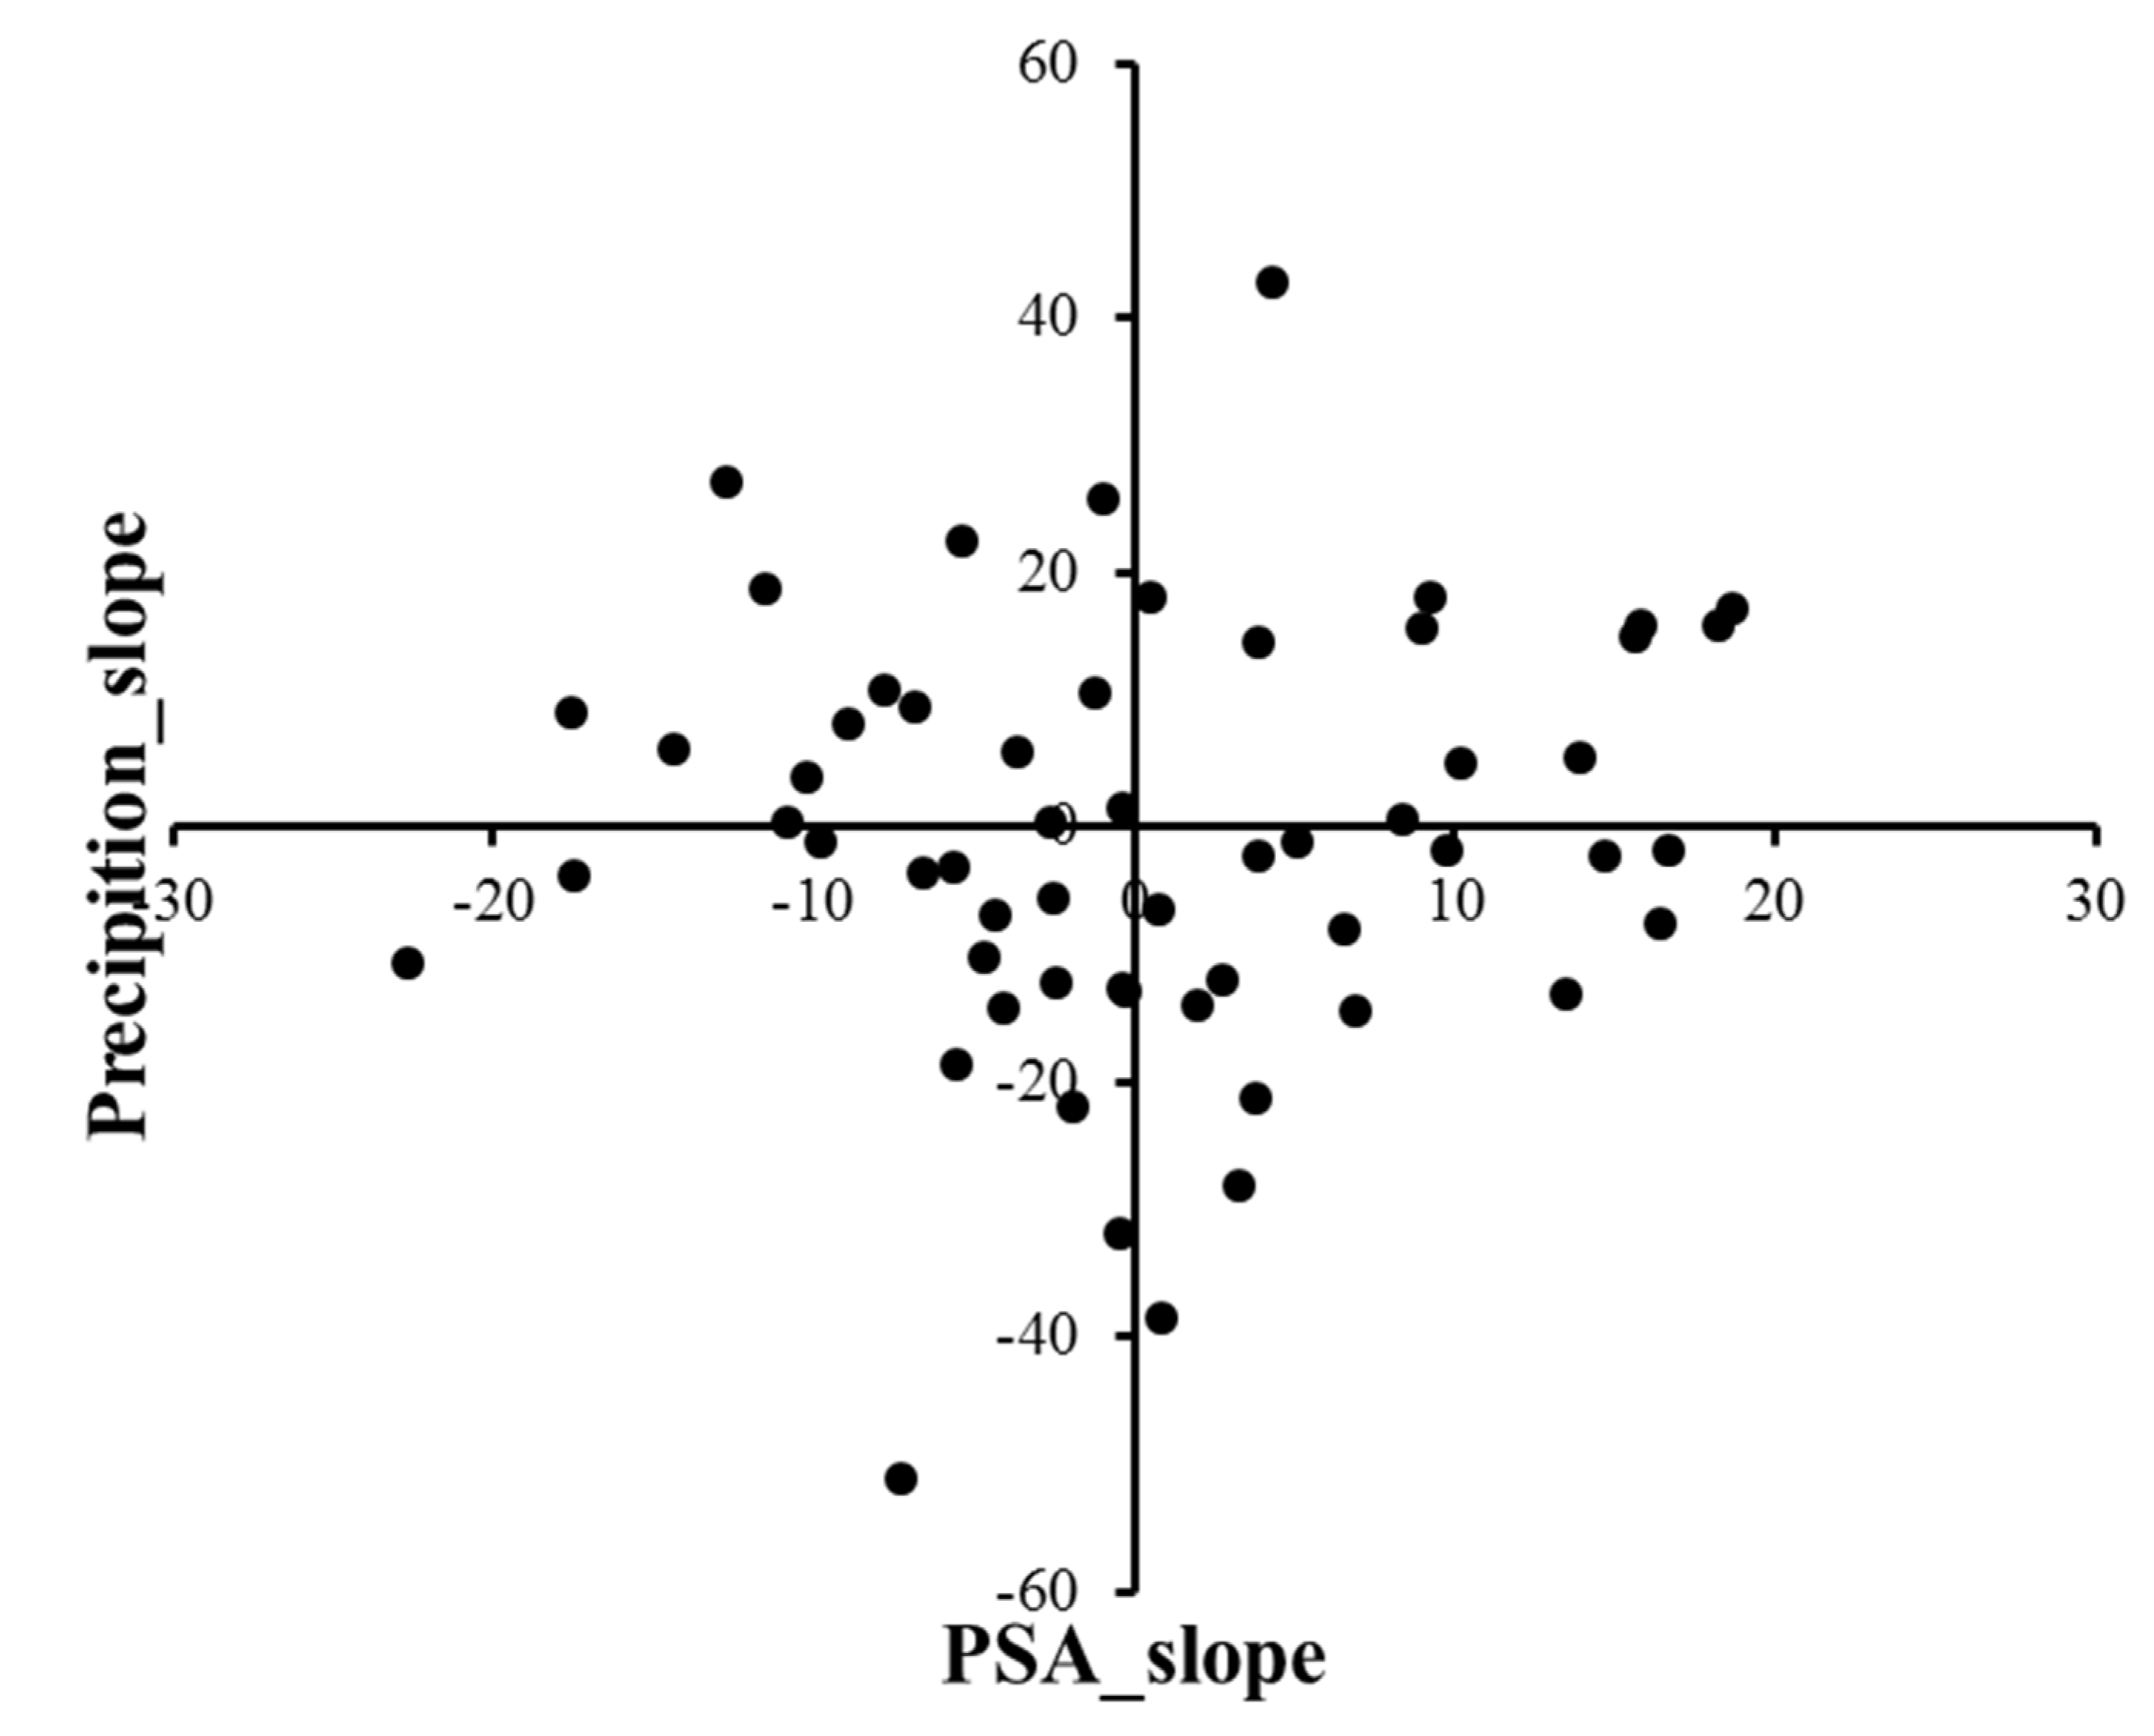
3.4. Relationships among Precipitation, Vegetation Coverage and Surface Albedo

The annual variations of precipitation, vegetation, and PSA in the five interest regions over the Loess plateau are illustrated in Figure 9. Overall, regions A and B had lower precipitation and higher PSA values than region C, D and E. This is reflected in the spatial distribution; precipitation could play an indirect role in the formation of regional-scale spatial patterns of the surface albedo of vegetation zones.
In Figure 9, interest region A and B showed NDVI dropped below 0.15, which was consistent with the annual precipitation anomalies during 2005–2006. Therefore, much of the bare soil exposed caused an abnormal increase in albedo. However, on a long-term scale, the NDVI gradually increased in the five regions from 2000 to 2010. During 2005, interest region C showed that although the precipitation significantly reduced, which is unfavorable to vegetation growth, the NDVI showed a recovery in growth and increased every year. Also, there was a small decrease in albedo (from 0.171 in 2004 to 0.170 in 2005). The whole albedo had a significant decrease (p < 0.001).
Figure 7. Trends of annual precipitation based on TRMM and station observation data across the Loess Plateau.
Remotesensing 07 02926 g007
Figure 8. Scatter map of the trends of albedo and precipitation in the 58 stations from 2000 to 2010.
Remotesensing 07 02926 g008
Figure 9. Time-series variation of monthly precipitation (mm), peak season albedo (%) and NDVI at five interest regions (3 × 3 pixels). The red bar indicates the drought year. The letters from A to E are interest Regions: (A) Etuoke Qi. (B) Lingwu country. (C)Shenmu country. (D) North of Shenmu. (E) Dongsheng district.
Remotesensing 07 02926 g009

4. Discussion

4.1. Restoration Programs and Albedo Decrease

Land use change could significantly change the biophysical properties of the surface and alter the albedo [43]. Because of intensive human activities and the complexity of the underlying surface, factors leading to albedo variations are difficult to understand and predict. For example, grazing might have an important impact on the albedo of grassland by reducing vegetation coverage and height [44]. This research suggests that land use could play an important role in albedo change through ecological restoration programs. However, the GTGP was mainly distributed in the steep cropland (>25 degree), and the RRGP was mainly conducted in the plains and demonstrated good spatial consistency. Therefore, the albedo trend in RRGP region was better than that in GTGP region at the 1 km pixel scale (Figure 4 and Figure 5). Furthermore, the rise in the grassland coverage reflects the improving effectiveness of RRGF, which could induce more apparent albedo decreases than the other two land cover change types.

4.2. Precipitation and Albedo

Figure 7 indicated that the water requirements of natural vegetation are met by precipitation in arid and semiarid regions. Generally, precipitation is an important limitation for plant growth in arid and semiarid areas, especially for grasslands [45]. Therefore, the grassland albedo was more sensitive to precipitation, which controls the growing season leaf area index and production of shallow-rooted growth forms in areas of seasonal water deficit [46]. However, there was no significant correlation between precipitation changes and albedo reductions over the decade (Figure 8), although precipitation could influence the albedo value in drought years (Figure 9, red pillars).
Figure 9 also showed that the gradual increase of the NDVI could cause a significant decrease of the albedo (A, C, D, E: p < 0.001; B: p < 0.01), although the precipitation showed a decreasing trend in the same period (Figure 9). This also confirmed that precipitation was related with albedo only on a short-term (monthly and annual) time scale [19]. Changes in vegetation cover represented the most direct and rapid reasons for albedo change. Therefore, albedo changes were highly sensitive to the low coverage of vegetation in the arid region. This phenomenon might be caused by the large difference of the albedo values between grassland and bare soil. Consequently, albedo change was not driven by precipitation, and ecological restoration programs had contributed to the decreasing albedo.

4.3. Uncertainties, Errors and Accuracies

Figure 9 indicated that the volatility of the albedo change showed its effect when caused by vegetation restoration was slower than the albedo change caused by vegetation clearing (deforestation, forest fire, flood, etc.). Our analysis of the PSA change was based on the decadal scale. Because the vegetation growth was a long-term process, the albedo decrease was more obvious in the first five years (Figure 2). This also reflects the fact that albedo change from land use change (cropland to forest or grassland, etc.) is more obvious than that from vegetation growing on an interannual scale. Also, the GTGP and RRGP had a greater extent of implementation during the first five years [47], which may be another cause.
To quantitatively calculate the land cover effects for climate change, an accuracy of 0.02–0.05 for albedo values within 5–10 years in climate and ecological models is required [48,49]. However, approximately 4.4% of the Loess Plateau exhibited an albedo decrease exceeding 0.05 from 2000 to 2010 (p < 0.01). Without this analysis, the relationship between albedo change drivers of land use (such as ecological restoration programs) and climate model estimates is tenuous. Realistic quantitative albedo decreases may promote our comprehension of what role land cover change could play in anthropogenic climatic modification. Nevertheless, whether there is a feedback mechanism such as the Charney hypothesis, which considers a large change of albedo from 0.14 to 0.35 associated with land cover change [50], decadal change analysis may be insufficient.
The effects of surface albedo change can be quantified through radiative forcing [2]. This could be used to compare the contribution of land cover change with other drivers of climate change [1]. However, the drivers of land-use-related radiative forcing remain poorly understood [1,51]. Our results suggested that the peak season albedo decreased by 0.0079 (about 5.23%) across the Loess Plateau. This variation was not uniform and depended on the types of land use change. If the average amount of shortwave energy reaching the top of the atmosphere (TOA) over the entire planet is assumed to be 341 W/m2 [52], the 0.0079 decrease of albedo could cause a 2.69 W/m2 reduction. According to the Cess Algorithm [53], this reduction would cause a minimum temperature reduction of 1.2 °C. Generally, snow has higher albedo value than other land cover types and can amplify the albedo change due to land use change [16]. Therefore, further research will consider the impact of snow and use the true surface solar radiation to analyze the radiative forcing related to these complex human-induced land use changes.

5. Conclusions

In this study, we examined the spatial and temporal pattern variations in the albedo in the Loess Plateau and analyzed its relationship with changes in anthropogenic and natural factors at the pixel level. The main finding of this study is that surface albedo change was correlated with changes in human-induced land cover across the Loess Plateau. This change was mainly due to the lower albedo from vegetation restoration programs associated with natural vegetation and dense grassland. Analysis revealed that grassland coverage changes could lead to a significant albedo decrease of 0.030 in peak season (p < 0.01). For the three types of land use change, grass cover increase showed the greatest correlation with albedo change (R2 = 0.80, p < 0.01). Although precipitation could play an indirect role in albedo decrease by influencing the natural vegetation water requirement in drought years, albedo decrease at the decadal scale was not driven by precipitation, but rather by the ecological restoration programs. Between 2000 and 2010, most of the areas in the ecological restoration program region underwent an albedo decrease that exceeded 0.05 during the peak season in the Loess Plateau. The analysis of MODIS albedo highlighted the role of human-induced land use change in driving the decreasing albedo on an annual scale. Our research demonstrated the substantial role that land use could play in regional scale albedo change. In addition to modelling albedo change from deforestation, we should improve the ability to model realistic land use change and complex albedo changes from ecological restoration during future climate studies, especially in arid and semi-arid regions.

Acknowledgments

This research was supported by the Ministry of Science and Technology (MOST) 973 Program (2010CB950902) and the National Natural Science Foundation (41371019). We thank the anonymous reviewers for their comments.

Author Contributions

Jun Zhai, Ronggao Liu, Jiyuan Liu and Lin Huang conceived and designed the experiments; Jun Zhai and Yuanwei Qin performed the experiments; Jun Zhai and Lin Huang analyzed the data; Ronggao Liu and Jiyuan Liu contributed reagents/materials/analysis tools; Jun Zhai and Lin Huang wrote the paper.

Conflicts of Interest

The authors declare no conflict of interest.

References

  1. Nabuurs, G.J.; Masera, O.; Andrasko, K.; Benitez-Ponce, P.; Boer, R.; Dutschke, M.; Elsiddig, E.; Ford-Robertson, J.; Frumhoff, P.; Karjalainen, T. IPCC Fourth Assessment Report: Climate Change 2007 (AR4); Cambridge University Press: Cambridge, UK, 2007. [Google Scholar]
  2. Betts, R.A. Biogeophysical impacts of land use on present-day climate: Near-surface temperature change and radiative forcing. Atmos. Sci. Lett. 2001, 2, 39–51. [Google Scholar] [CrossRef]
  3. Bonan, G.B. Forests and climate change: Forcings, feedbacks, and the climate benefits of forests. Science 2008, 320, 1444–1449. [Google Scholar] [CrossRef] [PubMed]
  4. Swann, A.L.; Fung, I.Y.; Levis, S.; Bonan, G.B.; Doney, S.C. Changes in Arctic vegetation amplify high-latitude warming through the greenhouse effect. Proc. Natl. Acad. Sci. USA 2010, 107, 1295–1300. [Google Scholar] [CrossRef] [PubMed]
  5. Jat, M.K.; Garg, P.K.; Khare, D. Monitoring and modelling of urban sprawl using remote sensing and GIS techniques. Int. J. Appl. Earth Obs. Geoinf. 2008, 10, 26–43. [Google Scholar] [CrossRef]
  6. Dewan, A.M.; Yamaguchi, Y.; Rahman, M.Z. Land use and land cover change in Greater Dhaka, Bangladesh: Using remote sensing to promote sustainable urbanization. Appl. Geogr. 2009, 29, 390–401. [Google Scholar] [CrossRef]
  7. Dewan, A.M.; Yamaguchi, Y.; Rahman, M.Z. Dynamics of land use/cover changes and the analysis of landscape fragmentation in Dhaka Metropolitan, Bangladesh. GeoJournal 2012, 77, 315–330. [Google Scholar] [CrossRef]
  8. Jun, Z.; Liu, R.G.; Liu, J.Y.; Zhao, G.S.; Huang, L. Radiative forcing over China due to albedo change caused by land cover change during 1990–2010. J. Geogr. Sci. 2014, 24, 789–801. [Google Scholar] [CrossRef]
  9. Grenfell, T.C.; Perovich, D.K. Seasonal and spatial evolution of albedo in a snow-ice-land-ocean environment. J. Geophys. Res.Oceans 2004, 109. [Google Scholar] [CrossRef]
  10. Loarie, S.R.; Lobell, D.B.; Asner, G.P.; Field, C.B. Land-cover and surface water change drive large albedo increases in South America. Earth Interact. 2011, 15, 1–16. [Google Scholar] [CrossRef]
  11. Georgescu, M.; Lobell, D.B.; Field, C.B. Direct climate effects of perennial bioenergy crops in the United States. Proc. Natl. Acad. Sci. USA 2011, 108. [Google Scholar] [CrossRef] [PubMed]
  12. Georgescu, M.; Miguez-Macho, G.; Steyaert, L.T.; Weaver, C.P. Climatic effects of 30 years of landscape change over the Greater Phoenix, Arizona, region: 1. Surface energy budget changes. J. Geophys. Res.: Atmos. 2009, 114. [Google Scholar] [CrossRef]
  13. Lee, X.; Goulden, M.L.; Hollinger, D.Y.; Barr, A.; Black, T.A.; Bohrer, G.; Bracho, R.; Drake, B.; Goldstein, A.; Gu, L.H.; et al. Observed increase in local cooling effect of deforestation at higher latitudes. Nature 2011, 479, 384–387. [Google Scholar] [CrossRef] [PubMed]
  14. Montenegro, A.; Eby, M.; Mu, Q.Z.; Mulligan, M.; Weaver, A.J.; Wiebe, E.C.; Zhao, M.S. The net carbon drawdown of small scale afforestation from satellite observations. Glob. Planet Chang. 2009, 69, 195–204. [Google Scholar] [CrossRef]
  15. Myhre, G.; Myhre, A. Uncertainties in radiative forcing due to surface albedo changes caused by land-use changes. J. Clim. 2003, 16, 1511–1524. [Google Scholar] [CrossRef]
  16. Jin, Y.F.; Schaaf, C.B.; Gao, F.; Li, X.W.; Strahler, A.H.; Zeng, X.B. How does snow impact the albedo of vegetated land surfaces as analyzed with MODIS data? Geophys. Res. Lett. 2002, 29. [Google Scholar] [CrossRef]
  17. Oleson, K.W.; Bonan, G.B.; Schaaf, C.; Gao, F.; Jin, Y.F.; Strahler, A. Assessment of global climate model land surface albedo using MODIS data. Geophys. Res. Lett. 2003, 30. [Google Scholar] [CrossRef]
  18. Zhou, Z.C.; Shangguan, Z.P.; Zhao, D. Modeling vegetation coverage and soil erosion in the Loess Plateau Area of China. Ecol. Model. 2006, 198, 263–268. [Google Scholar] [CrossRef]
  19. Fuller, D.O.; Ottke, C. Land cover, rainfall and land-surface albedo in West Africa. Clim. Chang. 2002, 54, 181–204. [Google Scholar] [CrossRef]
  20. Wang, S.S.; Davidson, A. Impact of climate variations on surface albedo of a temperate grassland. Agric. For. Meteorol. 2007, 142, 133–142. [Google Scholar] [CrossRef]
  21. Kvalevag, M.M.; Myhre, G.; Bonan, G.; Levis, S. Anthropogenic land cover changes in a GCM with surface albedo changes based on MODIS data. Int. J. Climatol. 2010, 30, 2105–2117. [Google Scholar] [CrossRef]
  22. Myhre, G.; Kvalevag, M.M.; Schaaf, C.B. Radiative forcing due to anthropogenic vegetation change based on MODIS surface albedo data. Geophys. Res. Lett. 2005, 32. [Google Scholar] [CrossRef]
  23. Tian, Y.; Dickinson, R.E.; Zhou, L.; Myneni, R.B.; Friedl, M.; Schaaf, C.B.; Carroll, M.; Gao, F. Land boundary conditions from MODIS data and consequences for the albedo of a climate model. Geophys. Res. Lett. 2004, 31. [Google Scholar] [CrossRef]
  24. Liang, X.Z.; Xu, M.; Gao, W.; Kunkel, K.; Slusser, J.; Dai, Y.; Min, Q.; Houser, P.R.; Rodell, M.; Schaaf, C.B. Development of land surface albedo parameterization based on Moderate Resolution Imaging Spectroradiometer (MODIS) data. J. Geophys. Res. 2005, 110, D11107. [Google Scholar] [CrossRef]
  25. Braimoh, A.K.; Onishi, T. Spatial determinants of urban land use change in Lagos, Nigeria. Land Use Policy 2007, 24, 502–515. [Google Scholar] [CrossRef]
  26. Dewan, A.M.; Yamaguchi, Y. Using remote sensing and GIS to detect and monitor land use and land cover change in Dhaka Metropolitan of Bangladesh during 1960–2005. Environ. Monit. Assess. 2009, 150, 237–249. [Google Scholar] [CrossRef] [PubMed]
  27. Mundia, C.N.; Aniya, M. Dynamics of landuse/cover changes and degradation of Nairobi City, Kenya. Land Degrad. Dev. 2006, 17, 97–108. [Google Scholar] [CrossRef]
  28. Rotenberg, E.; Yakir, D. Contribution of semi-arid forests to the climate system. Science 2010, 327, 451–454. [Google Scholar] [CrossRef] [PubMed]
  29. Wang, G.Y.; Huang, J.P.; Guo, W.D.; Zuo, J.Q.; Wang, J.M.; Bi, J.R.; Huang, Z.W.; Shi, J.S. Observation analysis of land-atmosphere interactions over the Loess Plateau of northwest China. J. Geophys. Res.: Atmos. 2010, 115. [Google Scholar] [CrossRef]
  30. Rotenberg, E.; Yakir, D. Distinct patterns of changes in surface energy budget associated with forestation in the semiarid region. Glob. Chang. Biol. 2011, 17, 1536–1548. [Google Scholar] [CrossRef]
  31. Wen, J.; Wang, L.; Wei, Z. An overview of the Loess Plateau mesa region land surface process field Experiment series (LOPEXs). Hydrol. Earth Syst. Sci. Discuss. 2009, 13, 945–951. [Google Scholar] [CrossRef]
  32. Cao, S.; Chen, L.; Yu, X. Impact of China’s Grain for Green Project on the landscape of vulnerable arid and semiarid agricultural regions: A case study in northern Shaanxi Province. J. Appl. Ecol. 2009, 46, 536–543. [Google Scholar] [CrossRef]
  33. Cao, S.; Zhong, B.; Yue, H.; Zeng, H.; Zeng, J. Development and testing of a sustainable environmental restoration policy on eradicating the poverty trap in China’s Changting County. Proc. Natl. Acad. Sci. USA 2009, 106, 10712–10716. [Google Scholar] [CrossRef] [PubMed]
  34. Xin, Z.B.; Xu, J.; Zheng, W. Spatiotemporal variations of vegetation cover on the Chinese Loess Plateau (1981–2006): Impacts of climate changes and human activities. Sci. China Ser. D Earth Sci. 2008, 51, 67–78. [Google Scholar] [CrossRef]
  35. Anderson-Teixeira, K.J.; Snyder, P.K.; Twine, T.E.; Cuadra, S.V.; Costa, M.H.; DeLucia, E.H. Climate-regulation services of natural and agricultural ecoregions of the Americas. Nat. Clim. Chang. 2012, 2, 177–181. [Google Scholar] [CrossRef]
  36. Sun, W.Y.; Shao, Q.Q.; Liu, J.Y; Zhai, J. Assessing the effects of land use and topography on soil erosion on the Loess Plateau in China. CATENA 2014, 121, 151–163. [Google Scholar] [CrossRef]
  37. Liu, J.Y.; Tian, H.Q.; Liu, M.L.; Zhuang, D.F.; Melillo, J.M.; Zhang, Z.X. China’s changing landscape during the 1990s: Large-scale land transformations estimated with satellite data. Geophys. Res. Lett. 2005, 32. [Google Scholar] [CrossRef]
  38. Liu, J.Y.; Liu, M.L.; Deng, X.Z.; Zhuang, D.F.; Zhang, Z.X.; Luo, D. The land use and land cover change database and its relative studies in China. J. Geogr. Sci. 2002, 13, 275–282. [Google Scholar]
  39. Liu, J.Y.; Liu, M.L.; Tian, H.Q.; Zhuang, D.F.; Zhang, Z.X.; Zhang, W.; Tang, X.M.; Deng, X.Z. Spatial and temporal patterns of China’s cropland during 1990–2000: An analysis based on Landsat TM data. Remote Sens. Environ. 2005, 98, 442–456. [Google Scholar] [CrossRef]
  40. Liu, J.Y.; Kuang, W.H.; Zhang, Z.X.; Xu, X.L.; Qin, Y.W.; Ning, J.; Zhou, W.C.; Zhang, S.W.; Li, R.D.; Yan, C.Z.; et al. Spatiotemporal characteristics, patterns, and causes of land-use changes in China since the late 1980s. J. Geogr. Sci. 2014, 24, 195–210. [Google Scholar] [CrossRef]
  41. Huete, A.; Didan, K.; Miura, T.; Rodriguez, E.P.; Gao, X.; Ferreira, L.G. Overview of the radiometric and biophysical performance of the MODIS vegetation indices. Remote Sens. Environ. 2002, 83, 195–213. [Google Scholar] [CrossRef]
  42. Huffman, G.J.; Adler, R.F.; Morrissey, M.M.; Bolvin, D.T.; Curtis, S.; Joyce, R.; McGavock, B.; Susskind, J. Global precipitation at one-degree daily resolution from multisatellite observations. J. Hydrometeorol. 2001, 2, 36–50. [Google Scholar] [CrossRef]
  43. Dickinson, R.E. Land surface processes and climate—Surface albedos and energy balance. Adv. Geophys. 1983, 25, 305–353. [Google Scholar]
  44. Xue, Y. The impact of desertification in the Mongolian and the Inner Mongolian grassland on the regional climate. J. Clim. 1996, 9, 2173–2189. [Google Scholar] [CrossRef]
  45. Fensholt, R.; Langanke, T.; Rasmussen, K.; Reenberg, A.; Prince, S.D.; Tucker, C.; Robert, J.S.; Quang, B.L.; Alberte, B.; Wessels, K.; et al. Greenness in semi-arid areas across the globe 1981–2007—An earth observing satellite based analysis of trends and drivers. Remote Sens. Environ. 2012, 121, 144–158. [Google Scholar] [CrossRef]
  46. Fuller, D.O.; Prince, S.D. Rainfall and foliar dynamics in tropical southern Africa: Potential impacts of global climatic change on savanna vegetation. Clim. Chang. 1996, 33, 69–96. [Google Scholar] [CrossRef]
  47. Henderson-Sellers, A.; Wilson, M.F. Surface albedo data for climatic modeling. Rev. Geophys. 1983, 21, 1743–1778. [Google Scholar] [CrossRef]
  48. Liu, J.; Ouyang, Z.; Yang, Y.; Xu, W.; Li, S. Evaluation of ecosystem service policies from biophysical and social perspectives: The case of China. Encycl. Biodivers. 2013, 3, 372–384. [Google Scholar]
  49. Sellers, P.; Meeson, B.; Hall, F.; Asrar, G.; Murphy, R.; Schiffer, R.; Bretherton, F.; Dickinson, R.; Ellingson, R.; Field, C. Remote sensing of the land surface for studies of global change: Models—Algorithms—Experiments. Remote Sens. Environ. 1995, 51, 3–26. [Google Scholar] [CrossRef]
  50. Charney, J.; Stone, P.H.; Quirk, W.J. Drought in Sahara-biogeophysical feedback mechanism. Science 1975, 187, 434–435. [Google Scholar] [CrossRef] [PubMed]
  51. Pielke, R.A., Sr.; Marland, G.; Betts, R.A.; Chase, T.N.; Eastman, J.L.; Niles, J.O.; Running, S.W. The influence of land-use change and landscape dynamics on the climate system: Relevance to climate-change policy beyond the radiative effect of greenhouse gases. In Capturing Carbon and Conserving Biodiversity: The Market Approach; Earthscan Publications Ltd.: London, UK, 2002; pp. 157–172. [Google Scholar]
  52. Trenberth, K.E.; Fasullo, J.T.; Kiehl, J. Earth’s global energy budget. Bull. Am. Meteorol. Soc. 2009, 90, 311–324. [Google Scholar] [CrossRef]
  53. Cess, R.D. Climate change: An appraisal of atmospheric feedback mechanisms employing zonal climatology. J. Atmos. Sci. 1976, 33, 1831–1843. [Google Scholar] [CrossRef]

