Article

Comparative Analysis of GF-1 WFV, ZY-3 MUX, and HJ-1 CCD Sensor Data for Grassland Monitoring Applications

1
International Institute for Earth System Science, Nanjing University, Nanjing 210093, China
2
Key Laboratory for Restoration and Reconstruction of Degraded Ecosystem in North-Western China of Ministry of Education, Ningxia University, Yinchuan 750021, China
3
Institute of Remote Sensing and Digital Earth, Chinese Academy of Sciences, Beijing 100101, China
*
Author to whom correspondence should be addressed.
Remote Sens. 2015, 7(2), 2089-2108; https://doi.org/10.3390/rs70202089
Submission received: 27 October 2014 / Revised: 19 January 2015 / Accepted: 9 February 2015 / Published: 13 February 2015

Abstract

:
The increasing number of Chinese sensor types used for terrestrial remote sensing has necessitated an additional effort to evaluate and standardize the data they acquire. In this study, we assessed the potential use of GF-1 WFV (Wild Field Camera), ZY-3 MUX (Multi-spectral camera), and HJ-1 CCD (Charge Coupled Device) sensor data for grassland monitoring by comparing spectral field measurements, vegetation coverage, and the leaf area index (LAI) of grassland stands with reflectance in the red and near-infrared bands and the Normalized Difference Vegetation Index (NDVI). Based on spectral field measurements, the characteristic differences of spectral response functions of the sensors were analyzed. Based on simulations using the SAIL bidirectional canopy reflectance model coupled with the PROSPECT leaf optical properties model (PROSAIL), we investigated the effects of changes in the sensors’ zenith angle caused by side sway. The following conclusions were drawn. (1) Differences in the adjusted coefficients of determination (R2) exist when comparing correlations between the reflectances from the three sensor types in different bands. The values of R2 are 0.556–0.893 and 0.819–0.850 for the infrared and red bands, respectively, and these data show a better correlation for the red band than for the infrared band. Fitted slope equations revealed inconsistencies in the data between the different sensor types. In the red band, GF-1 WFV and HJ-1 CCD data are the most consistent, but in the near-infrared band, GF-1 WFV and ZY-3 MUX data are the most consistent; (2) The correlation of NDVIs obtained from the different sensor types is high (R2 between 0.758 and 0.852); however, the consistency is low in that the NDVI based on GF-1 WFV data is significantly higher than that based on ZY-3 MUX and HJ-1 CCD data. In contrast, the mean difference is small between the NDVIs based on ZY-3 MUX and HJ-1 CCD; (3) Correlation analysis between ground grass-coverage and measured LAI data shows that the three sensor types are better at estimating coverage than the LAI, and that the GF-1 WFV sensor gave the best performance; (4) Changes in the sensors’ zenith angle caused by side sway were proven to have greater impact on reflectance and NDVI than the spectral response function; (5) For LAI values of 0–3, the NDVI changes significantly with increasing LAI, and differences between the three sensor types are obvious. For LAI > 3.5, the NDVI appears to experience a saturated tendency, which greatly reduces the differences between the sensors.

Graphical Abstract

1. Introduction

Grassland is one of the world’s most widely distributed vegetation types and it plays an important role in the global carbon cycle [1]. There are nearly 400 million ha of natural grassland in China, which account for 42.05% of the entire land area; this places China second in the global rank of countries with abundant grassland resources [2]. Grassland is an important part of ecological systems, but grassland vegetation parameters can be difficult to study given their strong spatial heterogeneity and temporal dynamics. Rapid access to the key parameters of regional grassland productivity is vital for grassland resource management, regulation of livestock product safety, and monitoring of regional carbon balances. Regardless of scale, remote sensing has become established as an important tool for estimating vegetation canopy parameters and their dynamic changes [3,4,5,6,7].
During the early twenty-first century, China developed and launched a variety of satellites, such as the China and Pakistan resources satellite (CBERS), the environment satellite (HJ-1A/1B), and the resources satellite (ZY-3) that are intended for studying different scales of land cover change, monitoring natural resources, and assessing environmental quality and changes in the ecological environment. As part of the “High-Resolution Earth Observation System”, many major projects are being implemented. The first optical satellite (GF-1) in the high-resolution satellite series has completed in-orbit tests and entered the stage of data acquisition. All in-orbit Chinese satellites constitute part of a joint mission intended to reduce the mean revisitation period to eight hours, which has obvious advantages in temporal resolution. However, for the same object, the consistency and correlation between image data obtained by the various sensors of the different platforms are affected by sensor orbit height, spatial resolution, spectral resolution, spectral response function, and other spatiotemporal differences in data acquisition. Further study is required to determine the best methods for acquiring accurate and continuous data of the temporal dynamics for a coverage area using the available multi-source remote sensing capability.
The differences and consistencies between image data acquired by different satellite sensors have been investigated by a number of studies in China and internationally. Gallo and Daughtry [8] analyzed the effects of using different wavelength bands of the Landsat MSS, Landsat TM, AVHRR, and SPOT sensors on the Normalized Difference Vegetation Index (NDVI) and the ratio vegetation index (RVI). Using 20-m-resolution Airborne Visible Infrared Imaging Spectrometer data acquired over forest cover, Teillet et al. [9] tested the sensitivity of the NDVI to the spectral and spatial characteristics of SPOT HRV, Landsat TM, NOAA AVHRR, EOS MODIS, and Envisat MERIS sensors. They showed that the obtained NDVI is affected significantly by differences in spectral bandwidths, especially in the red band. Changes in NDVI due to differences in spatial resolution between sensors depend on the spatial and spectral heterogeneity of the vegetation. Soudani et al. [10] assessed the potential use of IKONOS, ETM+, and SPOT HRVIR sensors for leaf area index (LAI) estimation in temperate coniferous and deciduous forest stands. They concluded that for bare soils or surfaces covered by very sparse vegetation, radiometric data acquired by IKONOS, SPOT, and ETM+ were similar, but for surfaces with dense vegetation, a negative offset of 10% for IKONOS NDVIs should be considered. Li et al. [11] analyzed both sensors’ spectral responses under simulated atmospheric conditions and the various NDVI values derived from 30 different satellites. Using linear regression analysis, they estimated the transfer parameters between any two different satellite NDVI values, and presented lookup tables of transfer parameters under atmospheric conditions for three surface visibility range values (10, 23, and 50 km). Li et al. [12] compared the spectral bands of ETM+ and OLI, and showed that OLI had higher values in the near-infrared band for vegetative land cover types, but lower values for non-vegetative types.
In summary, many studies have focused on verifying and evaluating the different resolution of sensor data outside China [10,12,13,14,15,16], but few studies have compared and examined the consistency of data from HJ-1 CCD and other sensors. Furthermore, few studies have considered the feasibility of using different sensors for the determination of LAI and coverage in grassland stands, and, as far as we are aware, there has been no attempt to analyze the effects on vegetation index caused by changes in sensors’ zenith angles due to side sway. An evaluation of the capabilities of different in-orbit Chinese satellites for monitoring vegetation, and an analysis of the main factors leading to data differences between satellites, will contribute to the application of satellite acquired data, and enhance the reliability of the multi-source remote sensing platform for the continuous monitoring of vegetation.
We compare and examine the consistency of the GF-1 WFV (Wild Field Camera), ZY-3 MUX (Multi-Spectral Camera), and HJ-1 CCD (Charge Coupled Device) sensors for grass monitoring. Furthermore, this work investigates the feasibility of using GF-1 WFV, ZY-3 MUX, and HJ-1 CCD images for the determination of LAI and biomass in grassland stands by analyzing the effects of the sensors’ spectral characteristics on the characterization of canopy reflectance behavior in the red and infrared bands. Finally, we analyze the effect of factors that cause differences between the data obtained by different sensors.

2. Materials

2.1. Study Sites

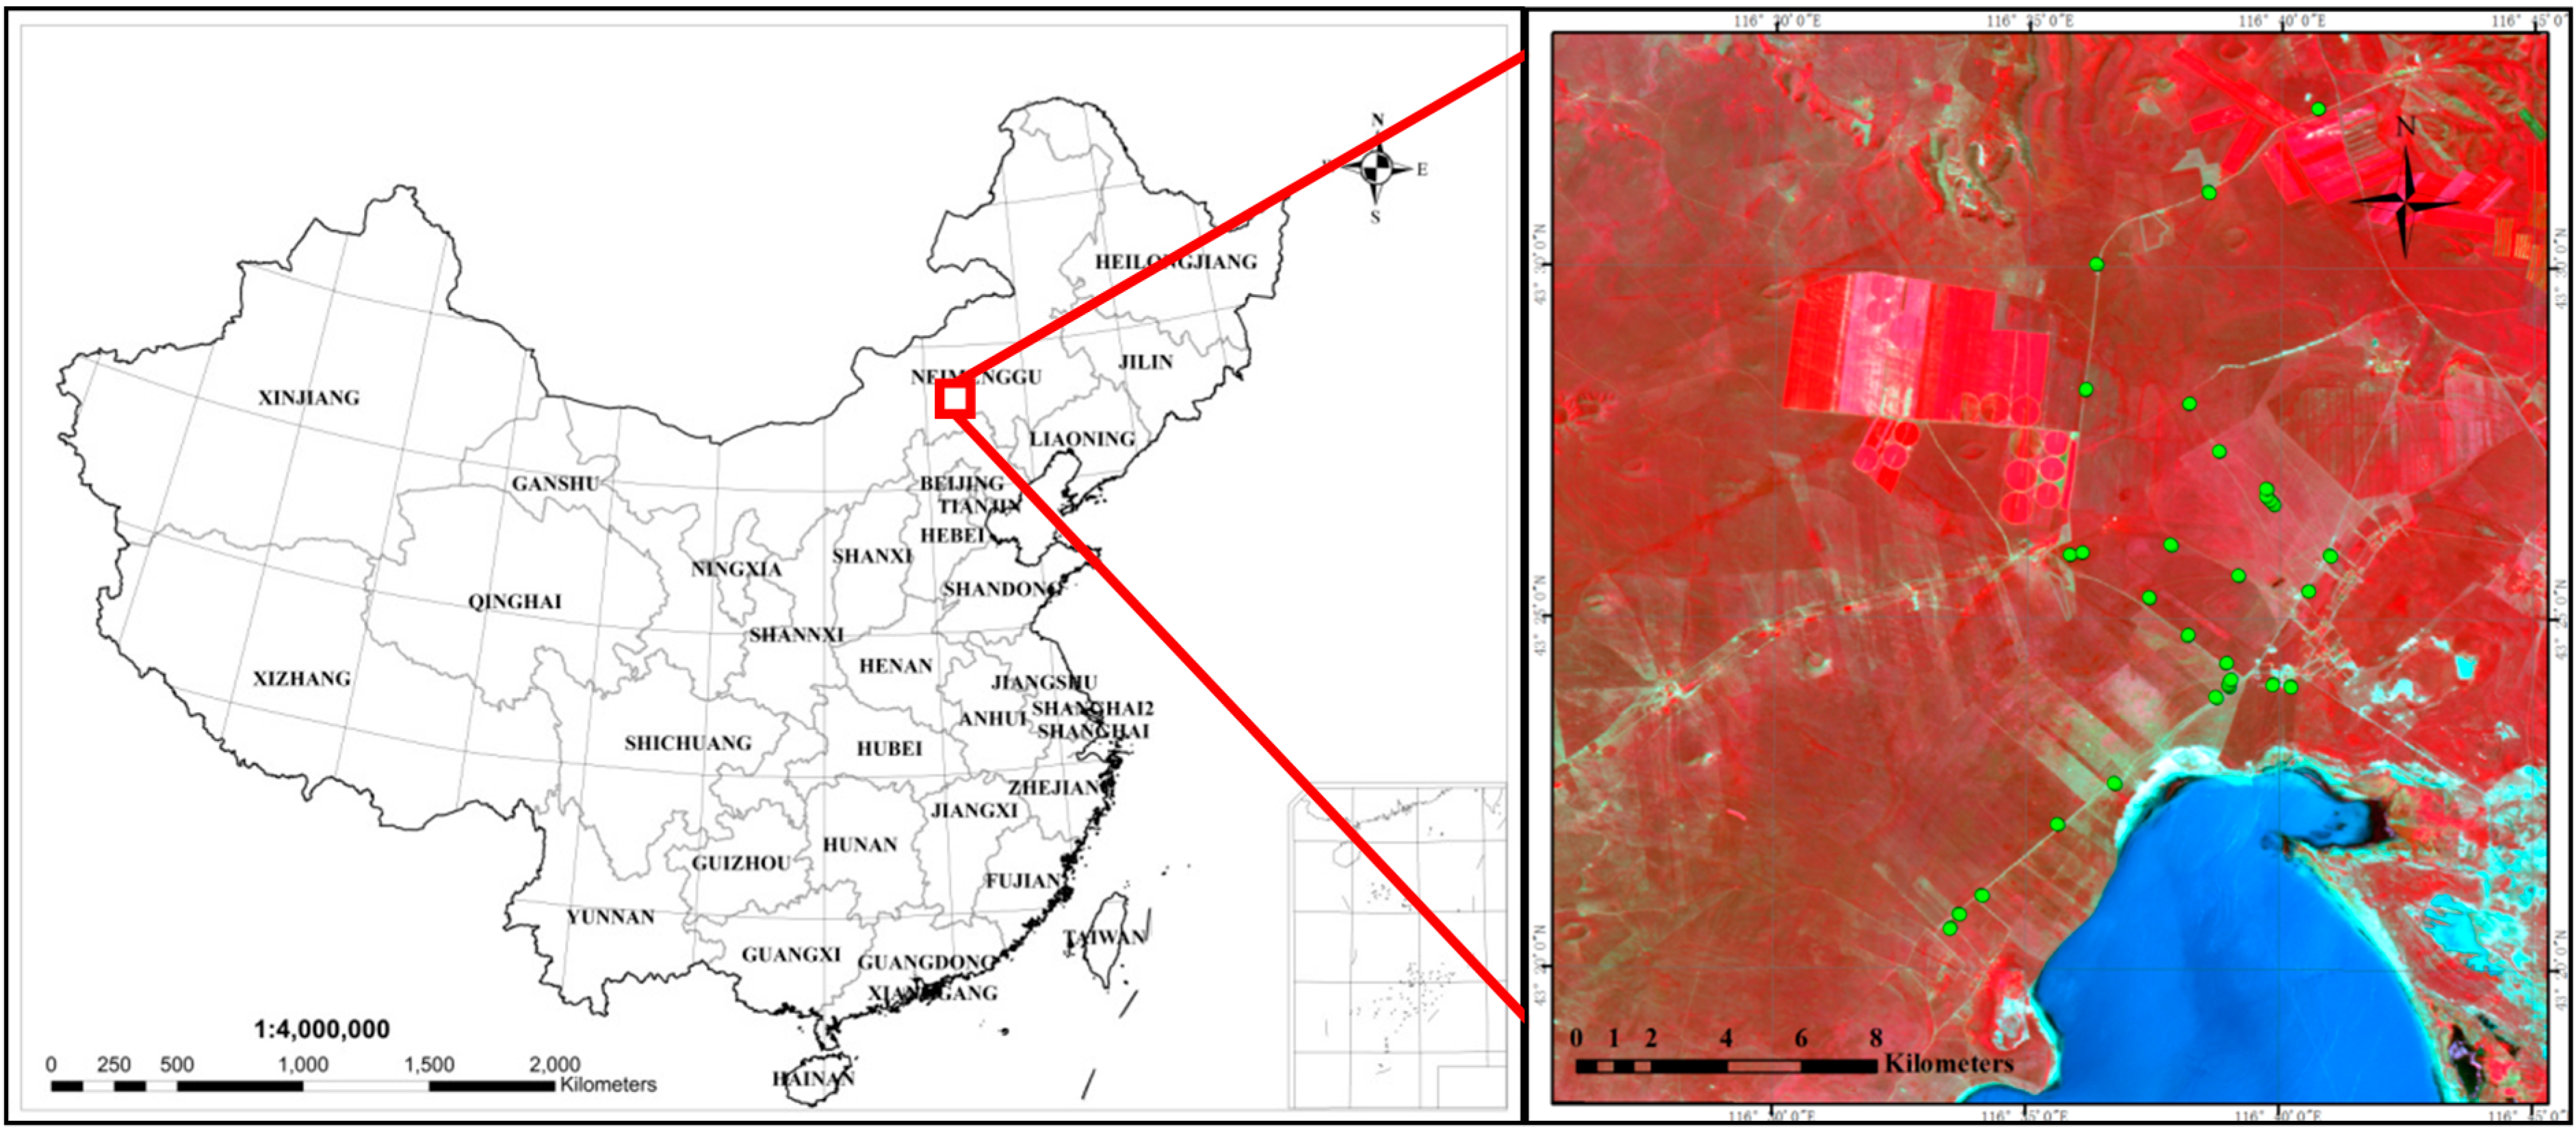
The selected test sites are situated in the Gongger prairie, which is located northwest of Chifeng in the northern central region of Inner Mongolia, China (43°26′N, 116°40′E; altitude 1236 m) (Figure 1). This area is the remote sensing test site for in-orbit calibration and authenticity tests, and it was established in 2006 by the Institute of Remote Sensing and Digital Earth, Chinese Academy of Sciences [17]. Its main landscape type is typical steppe that is composed mostly of Stipa krylovii Roshev, Stipa grandis, Leymus chinensis, Agropyron cristatum, and Artemisia frigida Willd. The climate is continental monsoon with an average annual temperature of 1 °C and average annual precipitation of 395.8 mm.
Figure 1. Locations of the study area and sample plots.
Remotesensing 07 02089 g001
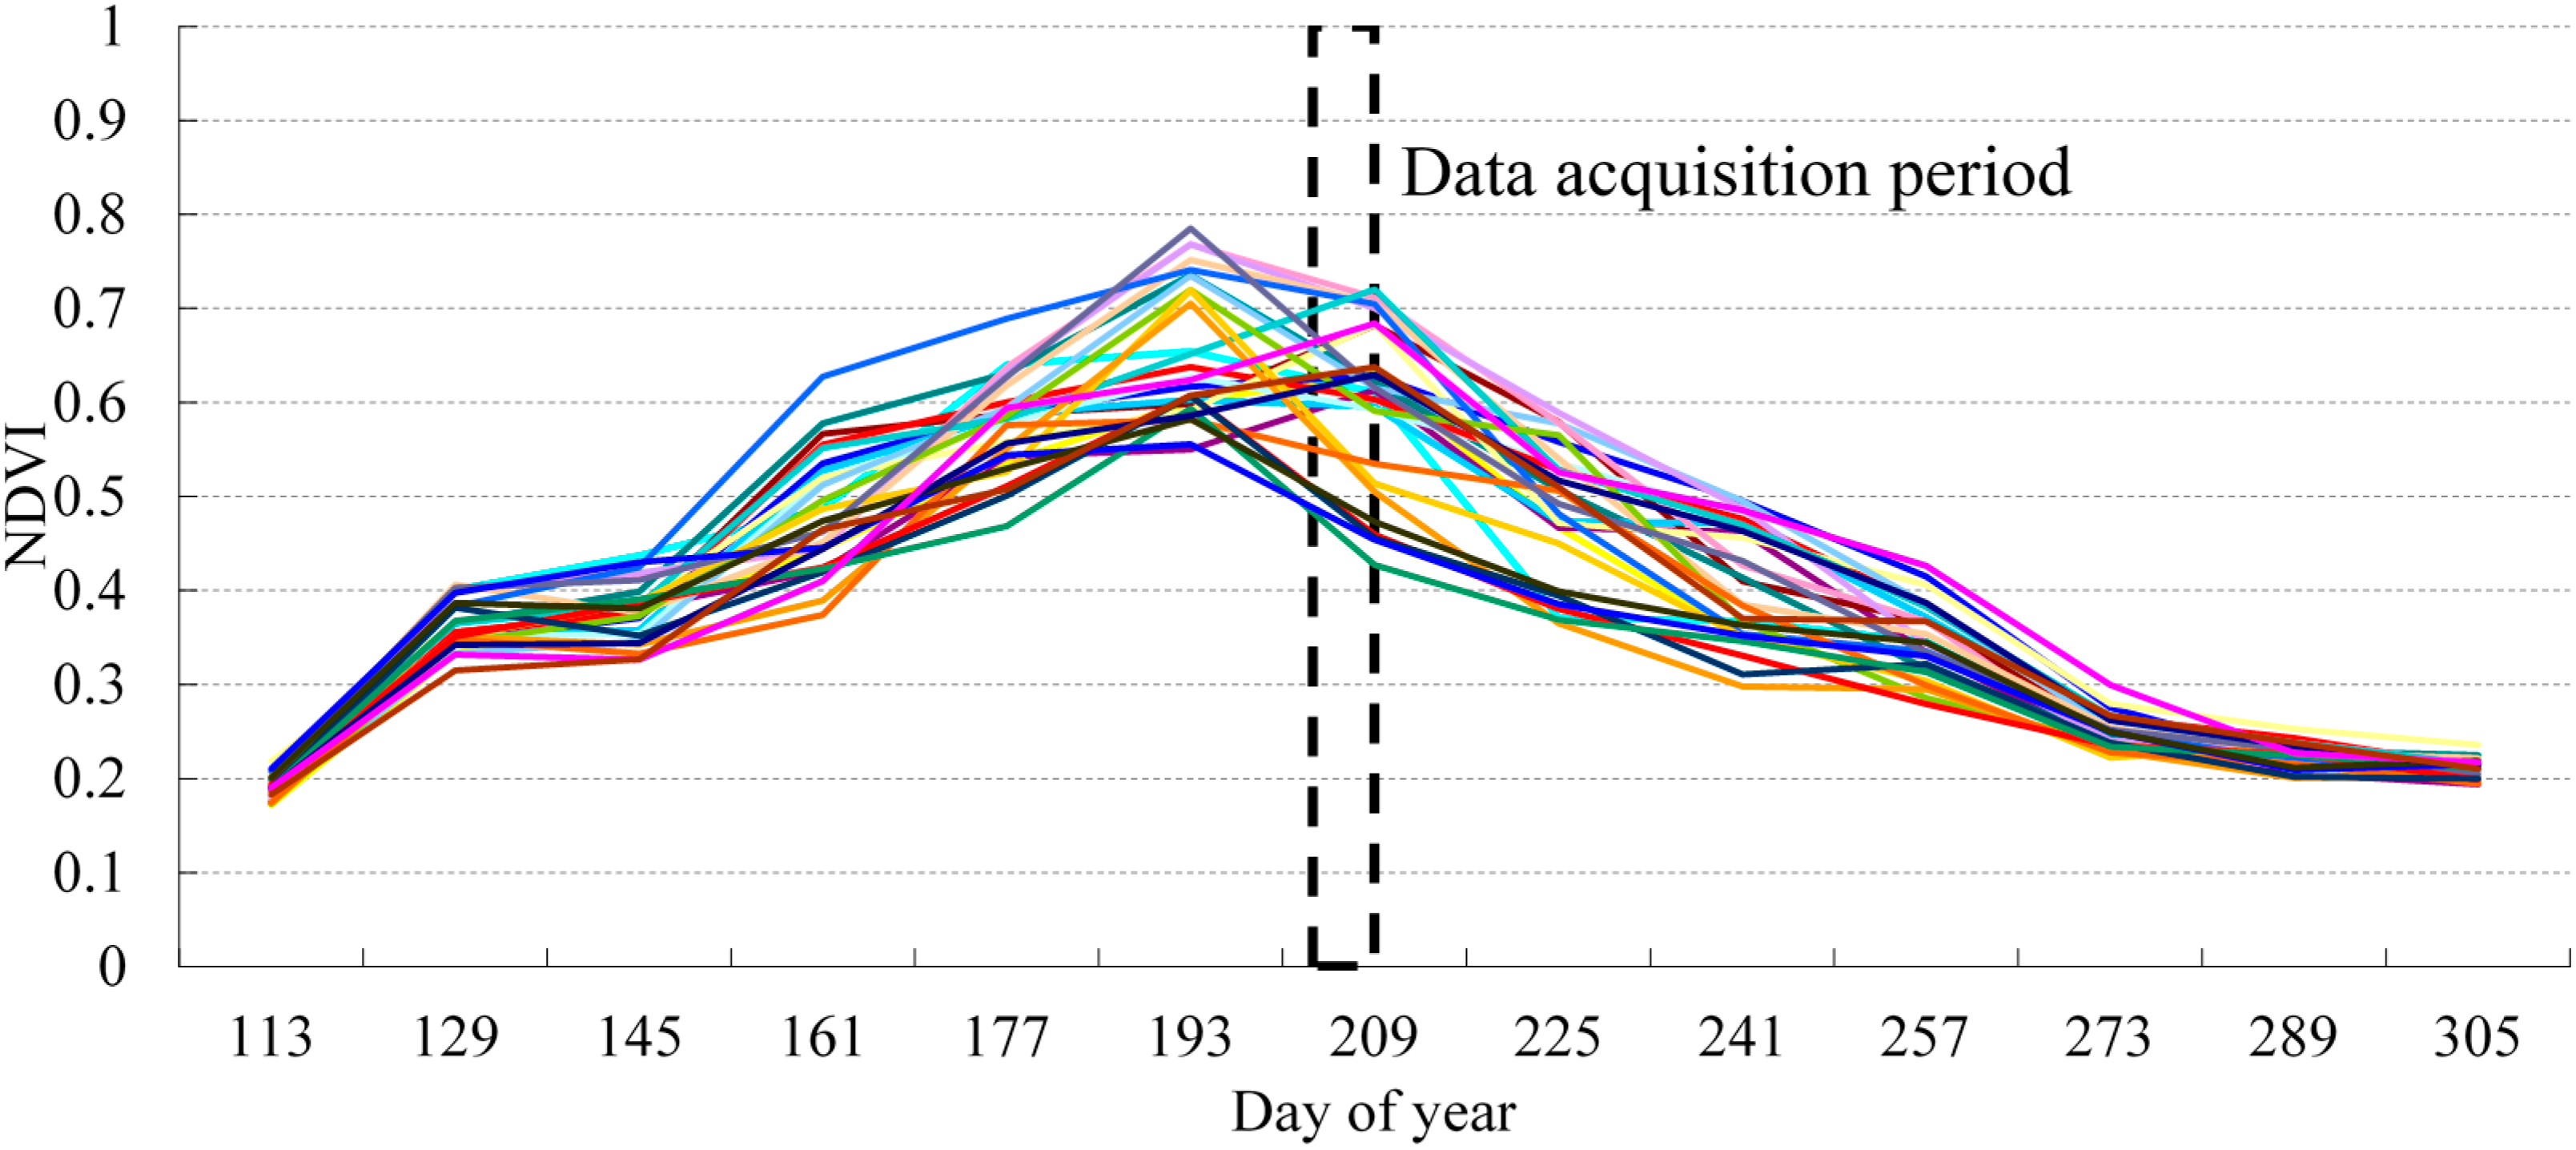
Figure 2. Time-series curves of 16-day composite MODIS 250 m NDVI for different sample plots in the 2013 growing season. The range of the dotted line indicates the data acquisition period.
Remotesensing 07 02089 g002

2.2. Sampling Plot Settings

Based on the results of the NDVI derived from HJ-1 CCD image data within 10 days prior to the monitoring and field investigations, 62 grassland plots (30 × 30 m) with different vegetation coverages were chosen. Seven quadrats (1 × 1 m) along the diagonal direction of each sample plot were then used for field measurements. The field measurements comprising grass hyperspectral reflectance, LAI, and vegetation coverage were performed from 31 July to 6 August 2013, and a MobileMapper™ CX GPS was used to record the GPS coordinates of the sampling points. From the perspective of vegetation phenology, the field measurement data recorded the most vigorous growth stage of the grassland in the research area, as illustrated by the time-series curves of 16-day composite MODIS (Moderate Resolution Imaging Spectroradiometer) 250-m NDVI of different sample plots in the 2013 growing season (Figure 2) [18].

2.3. Hyperspectral Reflectance Field Measurements

All hyperspectral reflectance field measurements were obtained under clear-sky conditions between 10:30 and 14:30 (Beijing local time), using an ASD Field Spec4 spectrometer (Analytical Spectral Devices, Boulder, CO, USA). This spectrometer records in the spectral range of 350–2500 nm. The spectral resolution was 10 nm between 350–700 nm, 8 nm between 700–1400 nm, and 30 nm between 1400–2500 nm. The field of view was 25° and the observation probes were 1.5 m above the grass canopy. A white board was referenced prior to recording the grass spectral reflectance in each quadrat. Five samples were averaged to obtain the measured hyperspectral reflectance data for each quadrant.

2.4. LAI and Vegetation Coverage Field Measurements

The LAI measurements were performed using a ground-based optical instrument, the Plant Canopy Analyzer (PCA) LAI-2000 (LI-COR Biosciences Inc., Lincoln, NE, USA). An LAI measurement taken by the instrument represents the plant’s “effective” LAI [19]. To avoid direct sunlight, all samples were collected just before sunset and just after sunrise under cloudy skies, and within 48 h of the hyperspectral reflectance measurements. A 270° view cap was used on the sensor to shield it from the operator and to minimize both the illumination conditions and boundary effects. A reference measurement was performed to log the blue diffuse light over the canopy before the observation of light transmission under the canopy. Three measurements were averaged to give the canopy LAI data for each quadrat [20].
Figure 3. Vegetation coverage interpretation.
Remotesensing 07 02089 g003
Grass coverage measurements were undertaken synchronously with the hyperspectral reflectance field measurements. A digital camera was placed above the grass canopy at a height suitable to frame the surface quadrat. All the photographs were clipped by the boundary of the quadrat frame and the vegetation coverage was derived by image classification (Figure 3).

2.5. Remote Sensing Image Acquisition

The key properties of the images used in this study can be seen in Table 1. The radiometric resolution of the GF-1 WFV and ZY-3 MUX sensors is higher than that of HJ-1 CCD by 2 bits, which enhances the hierarchy of each band and improves the detectability of changes in feature characteristics. The band range settings are identical for GF-1 WFV and ZY-3 MUX; HJ-1 CCD settings are identical for the red band, similar for the green and near-infrared bands, but narrower for the blue band. The HJ-1 CCD and ZY-3 MUX image data were obtained on 28 July 2013, but GF-1 WFV data was obtained on 30 July 2013; however, for grassland vegetation, these data can be treated as synchronous. The spatial and spectral characteristics and acquisition dates of the images are given in Table 1 and Table 2, respectively. To compute surface reflectance, atmospheric and geometric corrections of these remote sensing images must be made.
Table 1. Key properties of GF-1 WFV (Wilf Field Camera), HJ-1 CCD (Charge Coupling Device), and ZY-3 MUX (Multi-Spectral Camera).
SensorRevisitation Period (d)Spatial Resolution (m)Breadth (km)Radiometric Resolution (Bit)Band 1 (nm)Band 2 (nm)Band 3 (nm)Band 4 (nm)
GF-1 WFV416200 (1CCD)100.45–0.520.52–0.590.63–0.690.77–0.89
800 (4CCD)
HJ-1 CCD430360 (1CCD)80.41–0.520.52–0.600.63–0.690.76–0.90
700 (2CCD)
ZY-3 MUX55.852100.45–0.520.52–0.590.63–0.690.77–0.89
Table 2. Image acquisition information.
SensorDateTime/UTCSOLAR Zenith Angle (°)Solar Azimuth Angle (°)Sensor Zenith Angle (°)Sensor Azimuth Angle (°)
GF1-WFV2013-7-3003 h 42 min26.1747158.454.0402286.6640
HJ-1 CCD2013-7-2802 h 41 min33.036132.34816.7984283.5116
ZY3-MUX2013-7-2803 h 19 min27.5188147.6286.362311.1373

3. Methods

3.1. Remote Sensing Image Processing

3.1.1. Atmospheric Correction

Atmospheric correction is a vital for the application of quantitative remote sensing data. Its purpose is to eliminate the influence of the atmosphere and illumination on feature reflection. Atmospheric corrections can be performed based on the radiative transfer model, on the information of the image itself, and relative to atmospheric correction [21]. This paper used the FLAASH ([1 August 2013] http://exelisvis.com/docs/FLAASH.html) atmospheric correction package for atmospheric corrections. FLAASH operates within the 400–2500 nm wavelength range and it is based on the MODTRAN 4+ radiation transfer model. The required basic parameters were derived from the image header files and the China Center for Resources Satellite Data and Application (CRESDA) [22]. Within the FLAASH package, the options for a mid-latitude summer model and a rural aerosol model were chosen. Because the three sensors have a side-sway function, the setting of the zenith angle and azimuth information was incorporated into the correction process.

3.1.2. Geometric Correction

First, the geometric correction was applied to the ZY-3 MUX image. Homologous ground control points (GCPs), with a positional accuracy of about 1 m, were collected by the MobileMapper™ CX GPS. Image rectification was based on a quadratic polynomial transformation, and the geolocation error was about one pixel (ca. 5.8 m). After rectification, the image was radiometrically resampled at its initial spatial resolution using the nearest neighbor procedure, and set to the Universal Transverse Mercartor Grid System (UTM) projection and the WGS84 coordinate system. Then, this geometrically corrected ZY-3 MUX image served as a reference with which to correct the GF-1 WFV and HJ-1 CCD images according to the same procedure. The geolocation errors of the GF-1 WFV and HJ-1 CCD images were less than one pixel. Overall, the geometric errors of the GPS data and ZY-3 MUX, GF-1 WFV, and HJ-1 CCD images were <30 m, and thus, positional errors have little effect on our data analysis.

3.2. Computing Band Reflectance Based on the Spectral Response Function (SRF)
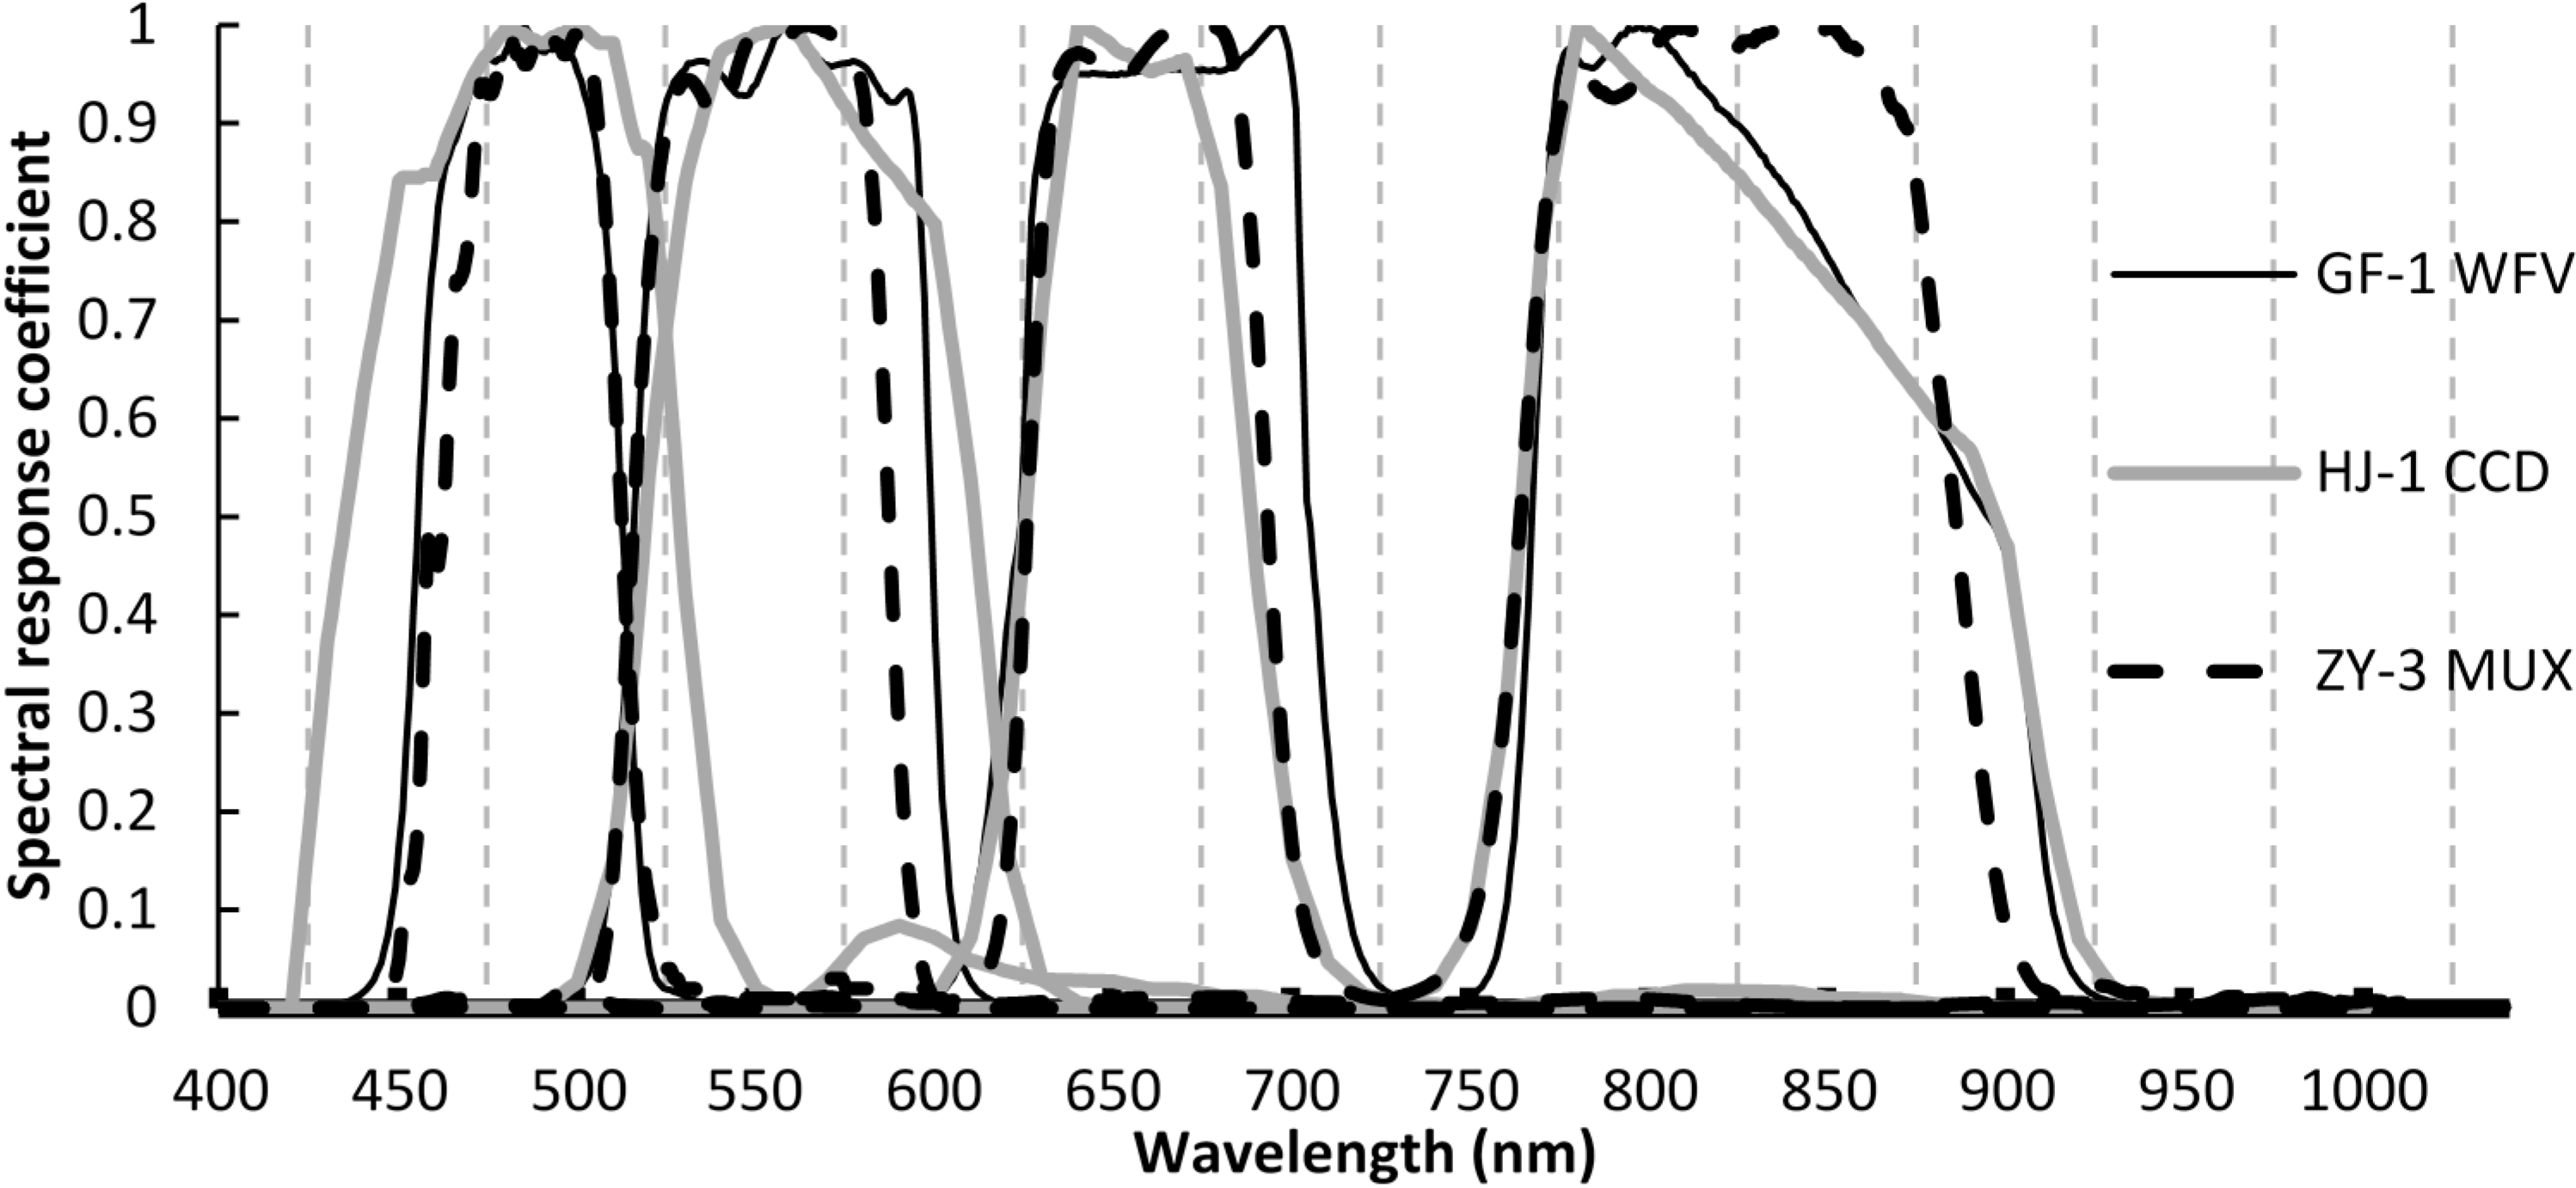
The band reflectance of the different sensors is affected by the characteristics of their components. The different responses in the particular spectral intervals can be described quantitatively by the spectral response coefficient (Figure 4). In order to explain accurately the differences between the three sensors, each spectral response coefficient was used to calculate the band reflectance, based on the measured canopy hyperspectral reflectance and simulated reflectance from the PROSAIL model. The band reflectance can be calculated as follows:
ρ s ( λ ) = λ min λ max ρ s ( λ i ) ψ ( λ i ) d λ λ min λ max ψ ( λ i ) d λ
where ρ s ( λ ) is the simulated band reflectance of the sensor, λ min and λ max are the lower and upper band wavelength limits, respectively, ρ s ( λ i ) is the measured or simulated hyperspectral reflectance for the i-th wavelength, and ψ ( λ i ) is the response coefficient of the different sensors for the i-th wavelength.
Figure 4. Spectral response functions for GF-1 WFV, HJ-1 CCD, and ZY-3 MUX.
Remotesensing 07 02089 g004

3.3. Vegetation Index

The NDVI is one of the most widely used spectral indices in the study of vegetation remote sensing [15,23,24,25]. This index reflects the absorption and reflection properties of the red and near-infrared bands of vegetation; it is closely related to parameters such as vegetation biomass, coverage, and LAI. Therefore, many satellite systems (e.g., NOAA/AVHRR, Terra/MODIS, SPOT/Vegetation) have been used to establish a long-term sequence of NDVI data as an important remote sensing product, both in China and internationally. Based on the steady accumulation of data from various types of sensor, China is developing various remote sensing products, including the NDVI, and therefore it is necessary to undertake a comparative study of the NDVIs acquired by the different sensors. The NDVI can be expressed as follows [26]:
NDVI = ( ρ NIR - ρ Red ) / ( ρ NIR + ρ Red )
where ρ Red and ρ NIR represent the red and near-infrared wavelength reflectance, respectively.

3.4. Simulations with PROSAIL

The side-sway imaging ability causes large differences between the angles of the three satellites’ sensors. In order to compare the characteristics of the NDVIs derived from the different sensors, we used the PROSAIL radiative transfer model to simulate grass canopy reflectance for the different satellite angles. PROSAIL is a combination of the canopy reflectance model, SAIL [27], and the leaf optical properties model, PROSPECT [28]. It simulates canopy reflectance as a function of many input parameters. Field measurements included collection of the required model parameters such as LAI, leaf chlorophyll content, and leaf angle. The LAI measurements were performed using an LAI-2000 analyzer (LI-COR Biosciences Inc., Lincoln, NE, USA). Leaf chlorophyll content measurements were performed using a SPAD-502 chlorophyll meter (MINOLTA. Inc., Tokyo, Japan) [29]. The SPAD values are unit-less and must be converted to leaf chlorophyll content (µg·cm−2). Markwell [30,31] provided an empirical calibration function that has been tested successfully over a wide range of species [32]. Leaf angle measurements were performed using a simple protractor. Furthermore, based on the parameters of the sensors’ operation, the zenith and azimuth angles of the sun and the sensors were calculated. All these parameters were input into the PROSAIL model to simulate the canopy reflectance of the three sensors with different side-sway angles. The PROSAIL model was used to assess whether changes in the side-sway angle affect the derived NDVIs.

3.5. Data Analysis

We focused on descriptive statistics to evaluate the comparative performance of different sensors. These methods include scatter plots, correlation analysis, standard deviation comparisons, and a two-directional estimated line fit.

4. Comparative Analysis of Different Sensors’ Data

4.1. Reflectance of Red and Near-Infrared Bands

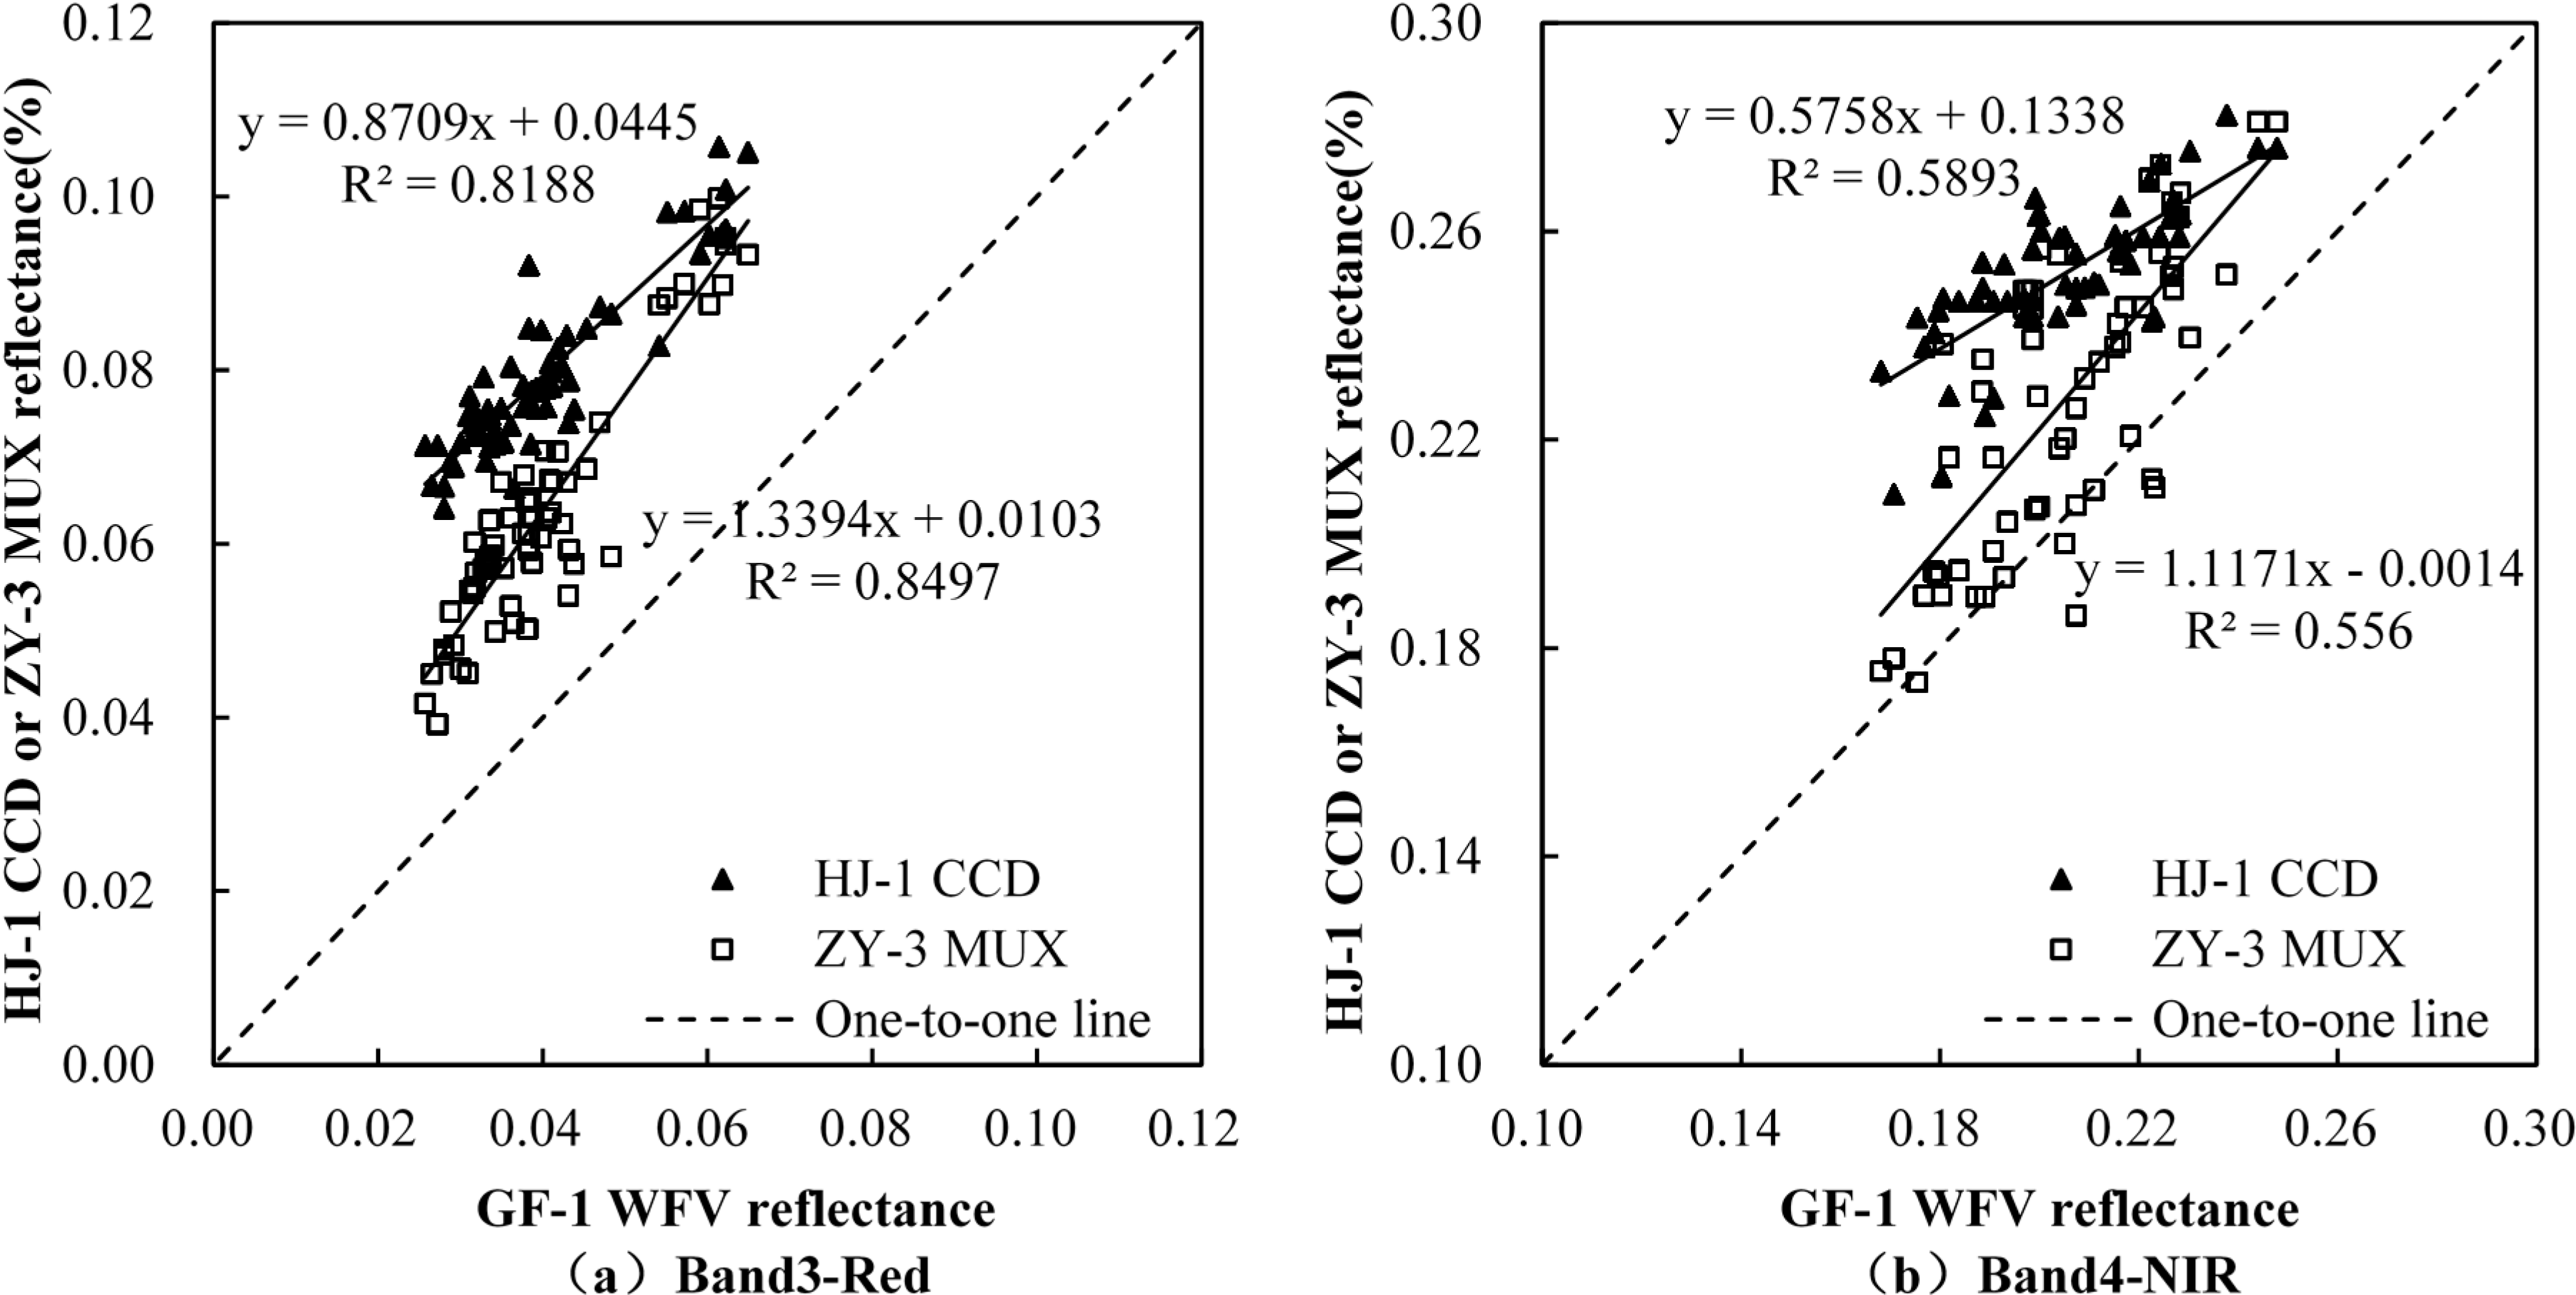
According to the corresponding image pixels of the grassland plot coordinates, the reflectance of the three sensors in the red and near-infrared bands were extracted for use in vegetation monitoring. Correlation analysis was used to compare and contrast the accuracy of the different sensors. The results of the correlations between GF-1 WFV and ZY-3 MUX or HJ-1 CCD are presented in Figure 5, and the associated adjusted determination coefficients (R2) for the red band are 0.8497 and 0.8818, respectively (Table 3), and 0.556 and 0.5893, respectively, for the near-infrared band. These values show that the reflectances derived from the three sensors are well correlated within the corresponding bands. The ranking of the sensors’ reflectance in the red and near-infrared bands from high to low is as follows: HJ-1 CCD > ZY-3 MUX > GF-1 WFV. The band reflectance of GF-1 WFV is significantly lower than ZY-3 MUX and HJ-1 CCD; specifically, the average reflectances from GF-1 WFV in the red band are 37.4% and 49.6% lower than ZY-3 MUX and HJ-1 CCD, respectively, and 9.9% and 18.4% lower than ZY-3 MUX and HJ-1 CCD, respectively, in the near-infrared band. In contrast, the difference between ZY-3 MUX and HJ-1 CCD reflectances is relatively small (Table 4). In terms of the fitted slope equation showing the increase in reflectance, the increase in amplitude of ZY-3 MUX over GF-1 WFV reflectances is faster than for HJ-1 CCD. Therefore, for large reflectance, the reflectance data of HJ-1 CCD and ZY-3 MUX are close in the red and near-infrared bands. The standard deviation of all statistical pixels in the red and near-infrared bands are ranked from high to low as follows: ZY-3 MUX > GF-1 WFV > HJ-1 CCD, which shows that the image quantitative classification is improved noticeably with increasing radiometric resolution.

4.2. NDVI

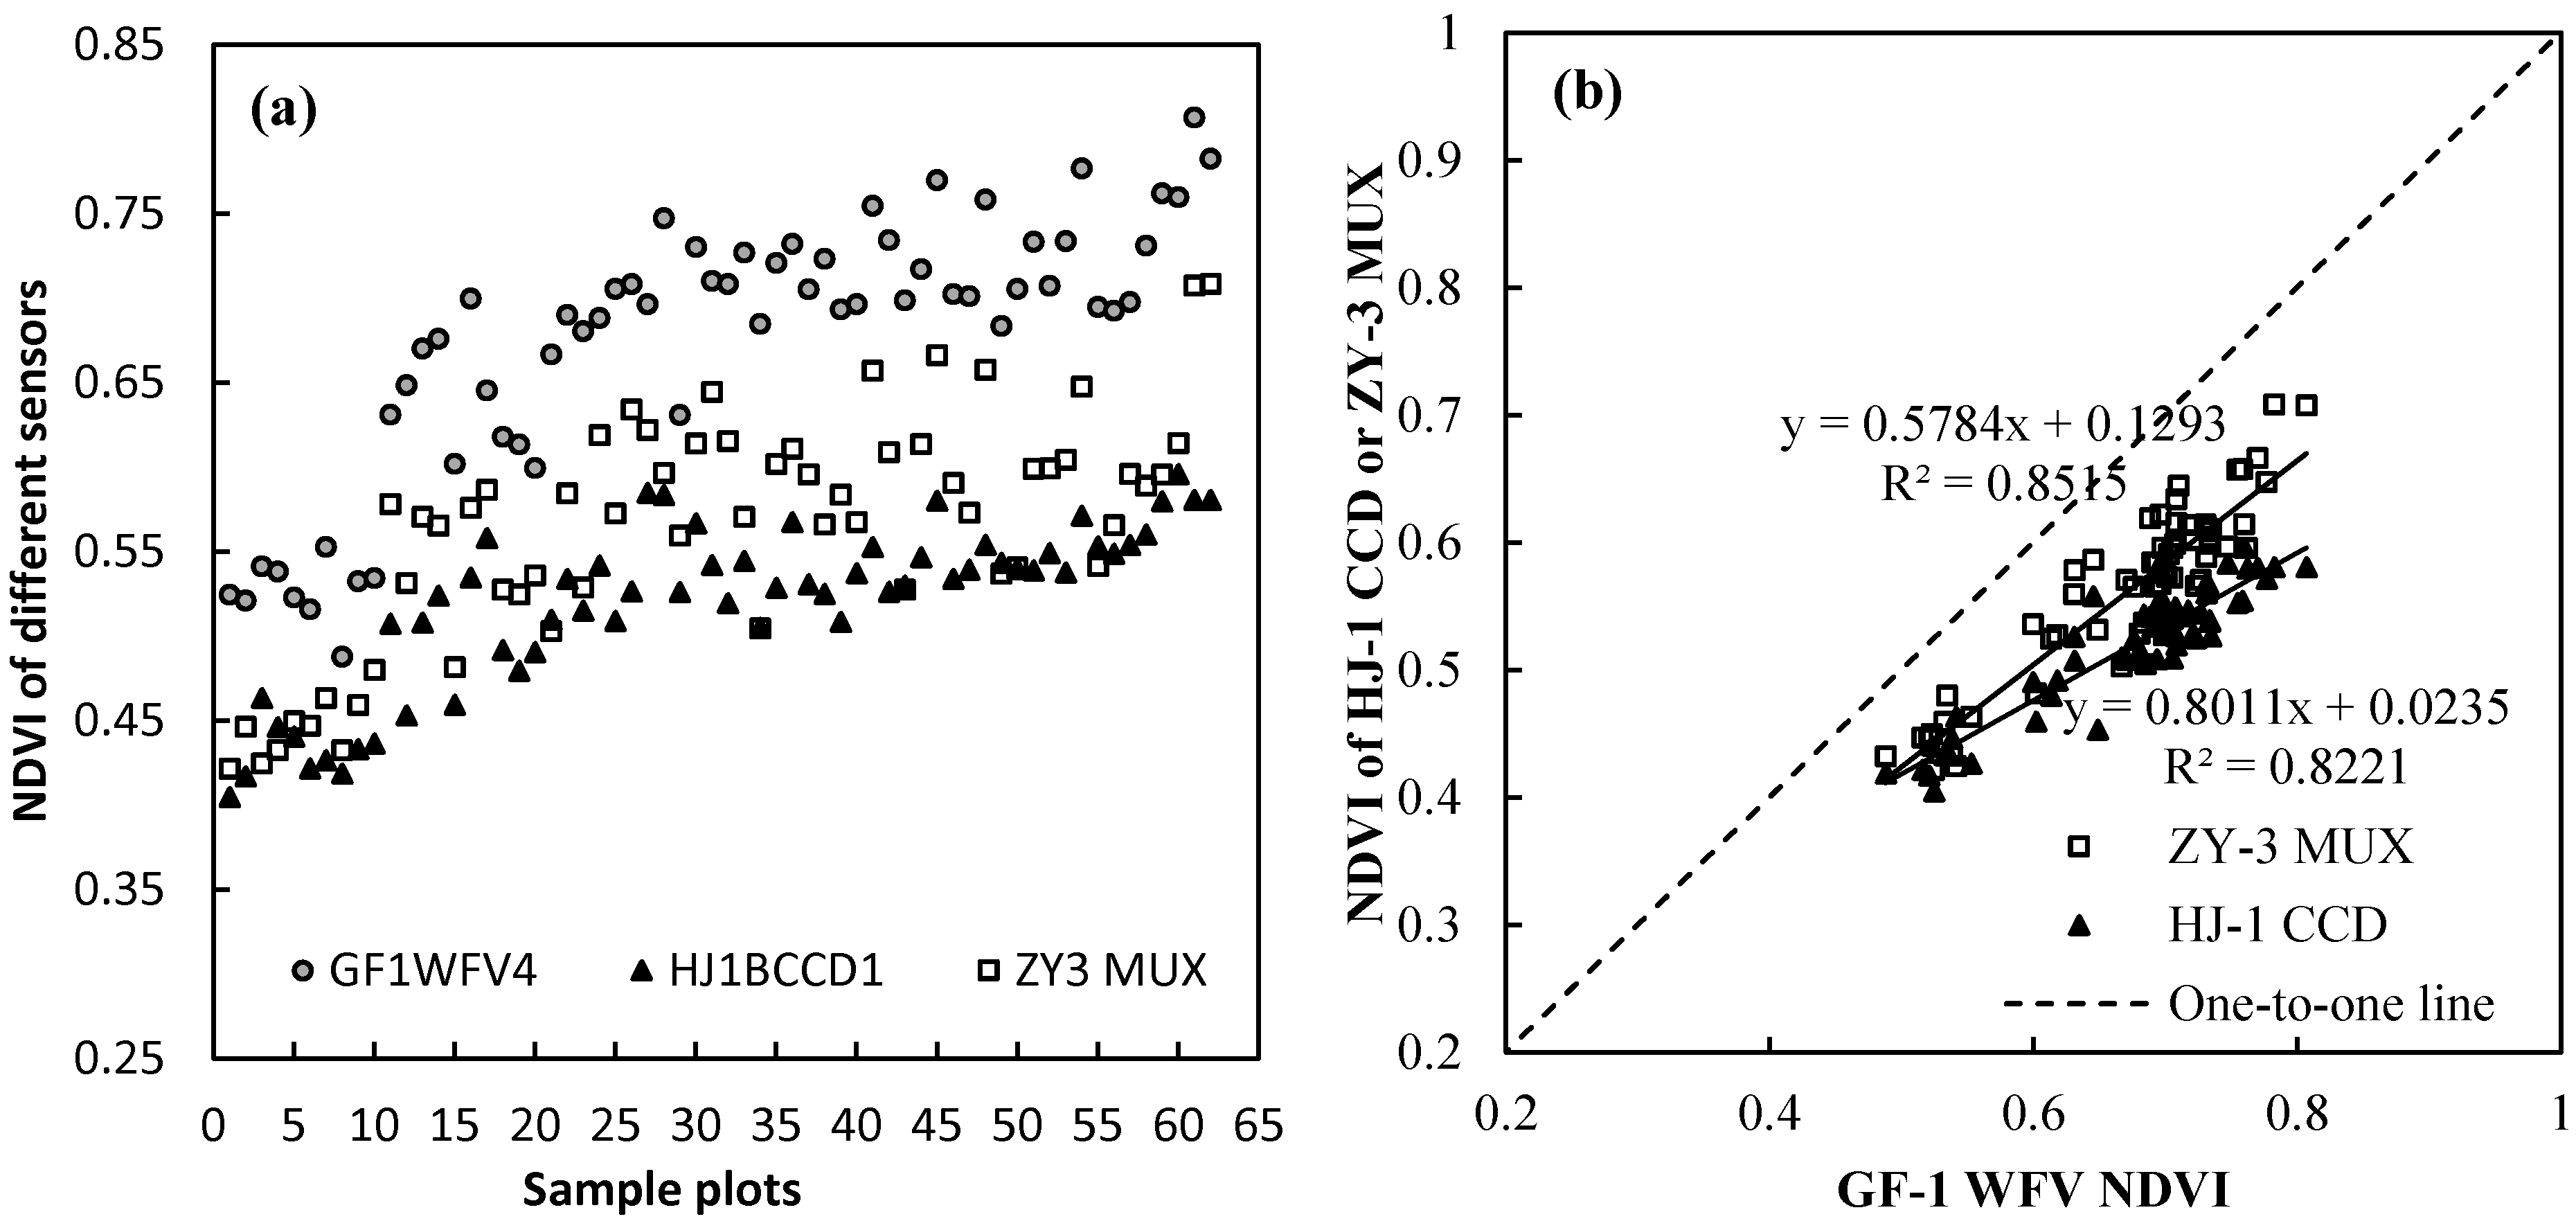
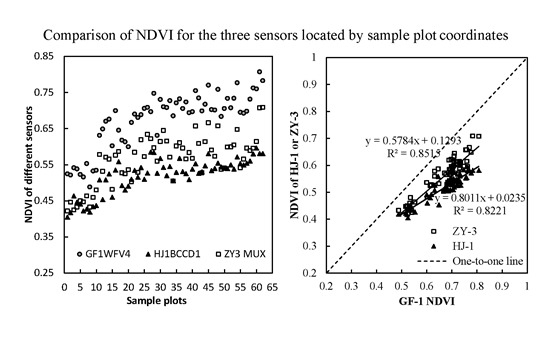
The NDVIs derived by the three sensors were computed and extracted based on the locations of the sample plot coordinates. The results of the comparison between GF-1 WFV and ZY-3 MUX or HJ-1 CCD are presented in Figure 6. The NDVIs from the different sensors are ranked from high to low as follows: GF-1 WFV > ZY-3 MUX > HJ-1 CCD. The NDVI of GF-1 WFV is significantly higher than ZY-3 MUX and HJ-1 CCD; the average NDVI is higher by 0.1107 and 0.1551, respectively, but the difference between values from ZY-3 MUX and HJ-1 CCD is relatively small (a difference of 0.0444) (Table 4). In terms of the results of the correlation analysis, GF-1 WFV and ZY-3 MUX, GF-1 WFV and HJ-1 CCD, and ZY-3 MUX and HJ-1 CCD are highly correlated with R2 values of 0.8515, 0.8221, and 0.7576, respectively (Table 3). In terms of fitting of the slope equation with regard to the increase of NDVI, the increase amplitude of GF-1 WFV is fastest, followed by ZY-3 MUX, and HJ-1 CCD is slowest. Therefore, the NDVIs of the three sensors in small values are closer than for large values, and the differences between GF-1 WFV, ZY-3 MUX, and HJ-1 CCD values increase significantly with increasing NDVI. The standard deviation of all statistical pixels ranked from high to low is as follows: GF-1 WFV > ZY-3 MUX > HJ-1 CCD. The standard deviations of GF-1 WFV and ZY-3 MUX are noticeably higher than HJ-1 CCD, which show that the quantitative classification for grassland is clearly improved with an increase of radiometric resolution.
Figure 5. Comparison of reflectance from the three sensors in the red (a) and near-infrared (b) bands located by sample plot coordinates.
Remotesensing 07 02089 g005
Table 3. Adjusted determination coefficients (R2) for Band 3 (Red), Band 4 (NIR), and NDVI of the three sensors located by sample plot coordinates.
Band 3 (Red)Band 4 (NIR)NDVI
GF-1 WFVHJ-1 CCDZY-3 MUXGF-1 WFVHJ-1 CCDZY-3 MUXGF-1 WFVHJ-1 CCDZY-3 MUX
GF-1 WFV1 1 1
HJ-1 CCD0.81881 0.58931 0.82211
ZY-3 MUX0.84970.749210.55600.440110.85150.75761
Table 4. Statistical results for Band 3 (Red), Band 4 (NIR), and NDVI of the three sensors located by sample plot coordinates.
SensorBand 3 (Red)Band 4 (NIR)NDVI
MaxMinMeanStd. DevMaxMinMeanStd. DevMaxMinMeanStd. Dev
GF-1 WFV0.0650.0260.0400.0100.2480.1680.2060.0190.8070.4880.6750.078
HJ-1 CCD0.1060.0640.0790.0100.2820.2100.2520.0140.5960.4050.5200.049
ZY-3 MUX0.1000.0390.0640.0150.2810.1730.2290.0280.7080.4220.5640.069
Figure 6. (a) NDVIs of the three sensors located by sample plot coordinates. (b) Correlations of NDVI for three sensors located by sample plot coordinates.
Remotesensing 07 02089 g006
Figure 7. Correlations of (a) grassland coverage or (b) LAI with NDVI for different sensors located by sample plot coordinates.
Remotesensing 07 02089 g007

4.3. Correlations of Grassland Coverage or LAI and NDVI of Different Sensors

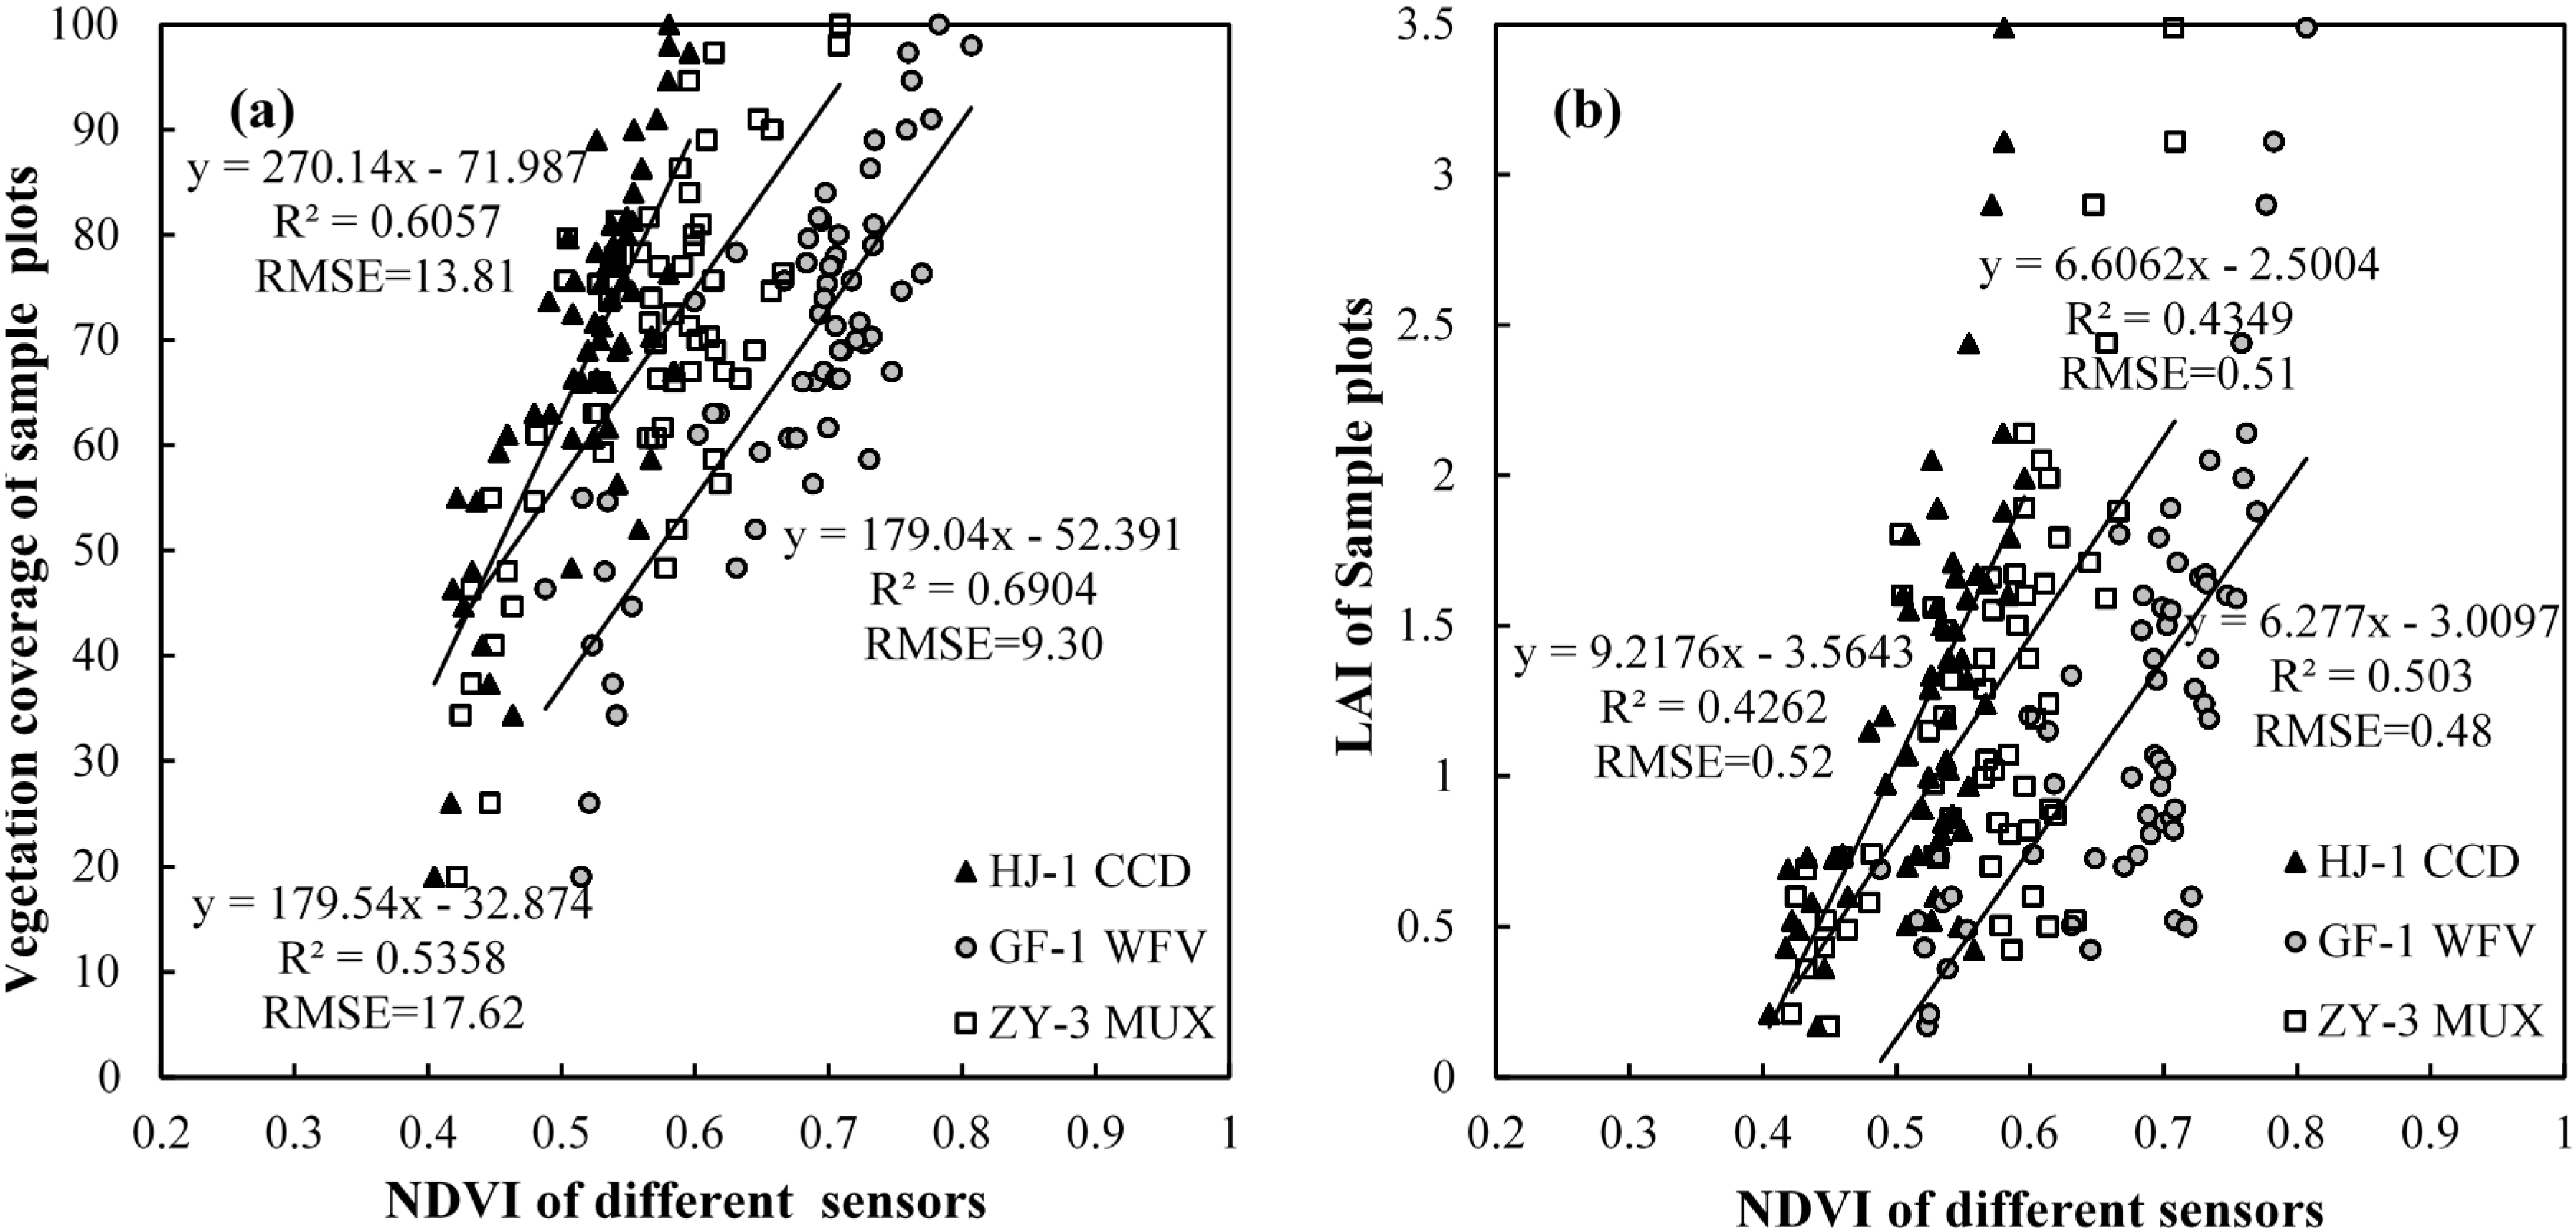
Figure 7a shows the relationships between NDVI and grassland coverage for the three sensors, all of which show positive correlations. The NDVI from GF-1 WFV is proven to have the closest correlation with grassland coverage, with a determination coefficient (R2) of 0.6904, followed by the NDVI from HJ-1 CCD, with an R2 value of 0.6057. The correlation between the ZY-3 MUX NDVI and grassland coverage was the weakest with an R2 value of 0.5358.
Figure 7b shows the relationships between NDVI and LAI for the three sensors, all of which demonstrate a weaker correlation than for NDVI and grassland coverage. This is similar to the results of previous studies that found broadband reflectance reduces the performance of LAI estimation for multispectral sensors [3,33,34]. The GF-1 WFV NDVI is proven to have the best correlation with grassland LAI with an R2 value of 0.503. The relationships between NDVI and LAI for ZY-3 MUX and HJ-1 CCD are similarly correlated, with R2 values of 0.4349 and 0.4262, respectively.

5. Effect Factors Analysis for Discrepancies among the Three Sensors

Previous studies have shown that numerous factors cause discrepancies between the different sensors, such as the sensor zenith angle, solar zenith angle, atmospheric conditions, spectral response function, atmospheric correction approach, geometric correction, and temporal variations [10,11,21,35]. For the two types of sensors that acquire data almost simultaneously, the difference in grass reflectance was mainly caused by discrepancies in the LAI, the spectral response function, and the sensor zenith angle [10,36,37,38,39]. In this study, there were only two days between acquisition dates and one hour between scan times for the images obtained by the three sensors and so, the solar zenith angles were very similar for all sensors. In addition, the atmospheric conditions were uniform, and the atmospheric correction was processed using the same approach. Therefore, in this study, the influence of temporal variations can be ignored with regard to grassland vegetation. Thus, the sensor zenith angle and spectral response function were identified as the main causes of the differences between the sensors. The effect of varying spectral response functions for the different sensors is similar to that observed in previous studies, which has been rigorously verified and discussed thoroughly based on simulated data using radiative transfer models [10,13,14]. However, the effect of the sensor zenith angle differs for the sensors used in this study, because previously studied sensors (e.g., IKONOUS, ETM+, ALI, and SPOT) have no side-sway imaging function.

5.1. Effects of the Spectral Response Function on Band Reflectance
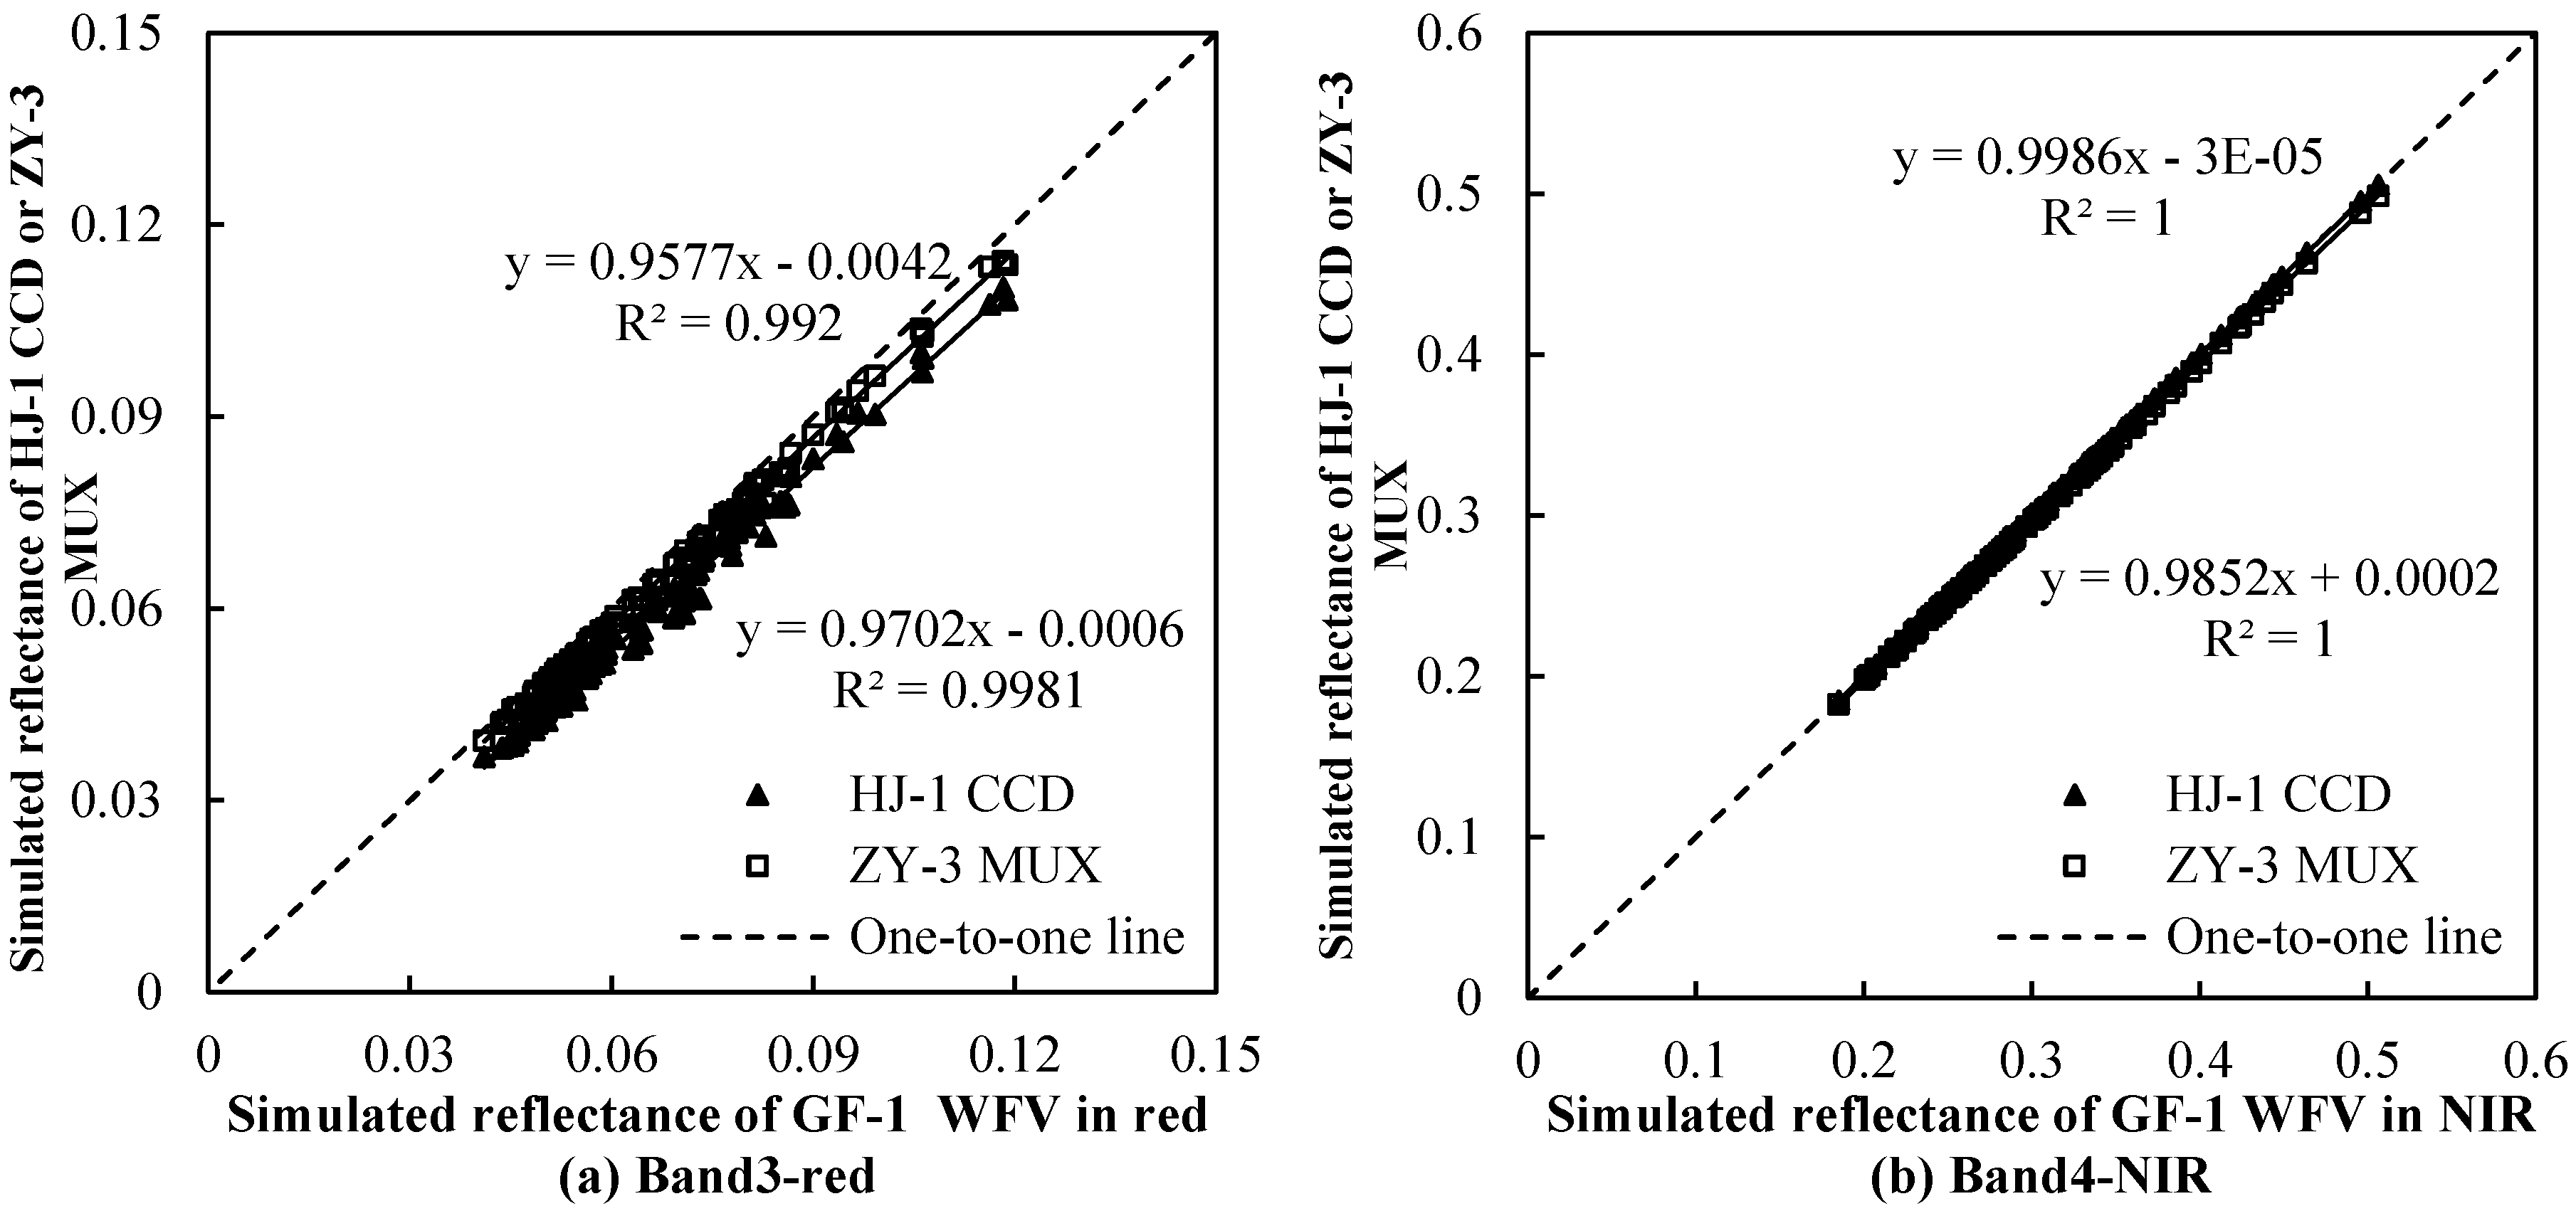
In order to assess the effects of varying spectral response functions in the red and near-infrared bands for the different sensors, Equation (1) was used to calculate the band reflectance based on the measured canopy hyperspectral reflectance. Then, a correlation analysis method was used to investigate the contrasts between the different sensors. The results of correlations between GF-1 WFV with ZY-3 MUX or HJ-1 CCD are presented in Figure 8. The adjusted determination coefficients (R2) for the red band are 0.9981 and 0.992, respectively, and all R2 values for the near infrared band are 1.0. All of the R2 values given in Table 5 are a little higher than those of IKONOS and ETM+ or SPOT presented in Soudani et al. [10]. These results show that the spectral response function has some influence on the band reflectance, but that the overall effect is small.
Figure 8. Effects of the spectral response function in the red (a) and near-infrared (b) bands for different sensors. Band reflectance was simulated based on the measured canopy hyperspectral reflectance.
Remotesensing 07 02089 g008
Table 5. Adjusted determination coefficients (R2) of Band 3 (Red), Band 4 (NIR), and NDVI of the three sensors simulated based on the measured canopy hyperspectral reflectance.
Band 3 (Red)Band 4 (NIR)NDVI
GF-1 WFVHJ-1 CCDZY-3 MUXGF-1 WFVHJ-1 CCDZY-3 MUXGF-1 WFVHJ-1 CCDZY-3 MUX
GF-1 WFV1 1 1
HJ-1 CCD0.99811 1.00001 0.99881
ZY-3 MUX0.99200.996111.00001.000010.99850.99991

5.2. Effects of the Spectral Response Function on NDVI
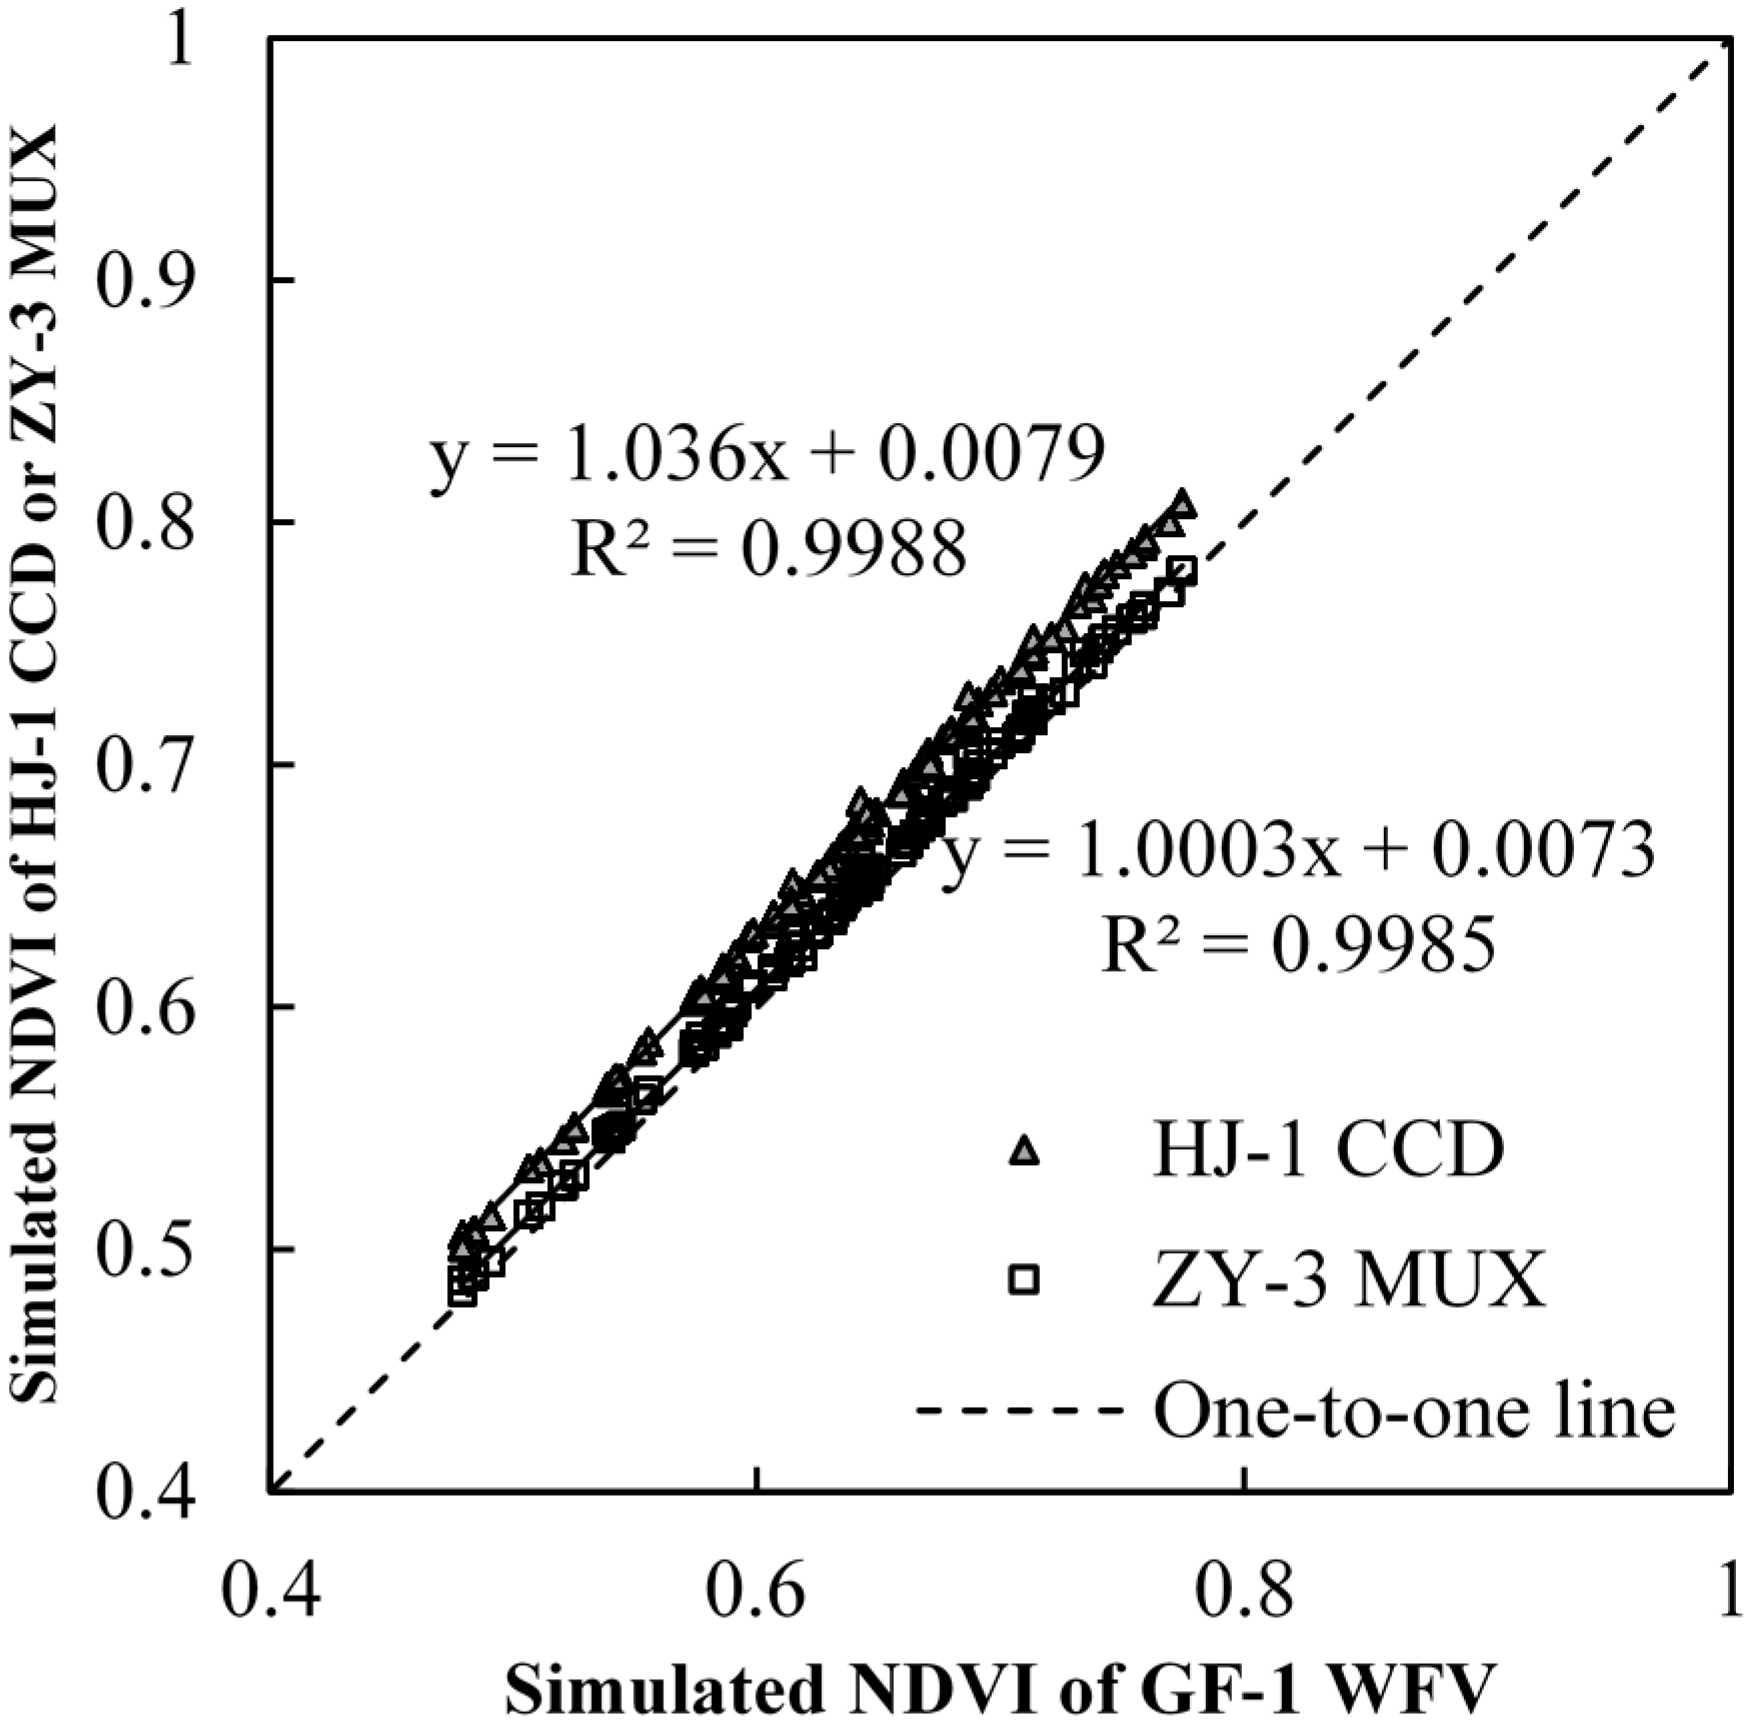
In order to assess the effects of varying spectral response functions on the NDVI from the different sensors, Equation (1) was used to calculate the band reflectance of the red and near-infrared bands based on the measured canopy hyperspectral reflectance. This was then input into Equation (2) to obtain the NDVI. The NDVI of HJ-1 CCD is higher than GF-1 WFV and ZY-3 MUX with average values that are 4.26% and 3.56% higher, respectively. However, the statistical indicators of ZY-1 and HJ-1 CCD show little difference. In terms of the correlation analysis, GF-1 WFV and ZY-3 MUX, GF-1 WFV and HJ-1 CCD, and ZY-3 MUX and HJ-1 CCD are highly correlated with R2 values of 0.9985, 0.9988, and 0.9999, respectively (Figure 9). All of the R2 values presented in Table 5 for NDVI are close to those of Steven et al. [40]. This result shows that the spectral response function has an influence on the range of NDVIs, but the overall differences between NDVIs from different sensors due to variations in the spectral response functions are small.
Figure 9. Effect of the spectral response function on NDVI for the different sensors. The NDVI was simulated based on the measured canopy hyperspectral reflectance.
Remotesensing 07 02089 g009

5.3. Effects of Sensors’ Zenith Angle Changes Caused by Side Sway on NDVI
Side-sway imaging is used in the multiple satellite observation system in China because it greatly improves data coverage, but it also creates problems regarding data consistency because of the sensors’ zenith angle. This angle is an issue of great importance in remote sensing, and a large number of measurements and modeling activities have confirmed the anisotropic reflectance of the Earth’s surface by using bidirectional reflectance distribution functions (BRDF). A BRDF is defined as a function of illumination and it gives a view of the geometry for surface scattering within a given band [41,42]. A variety of multi-angle satellite sensors, such as POLDER (Polarization and Directionality of the Earth’s Radiation Instrument), MODIS, and MISR (Multi-Angle Imaging Spectroradiometer) have been used to retrieve surface parameters such as vegetation structure using inversion techniques [42,43,44]. These studies have all been based on multi-angle data from a single sensor, but studies on the effect of zenith angle variations caused by the use of different sensors are rare.
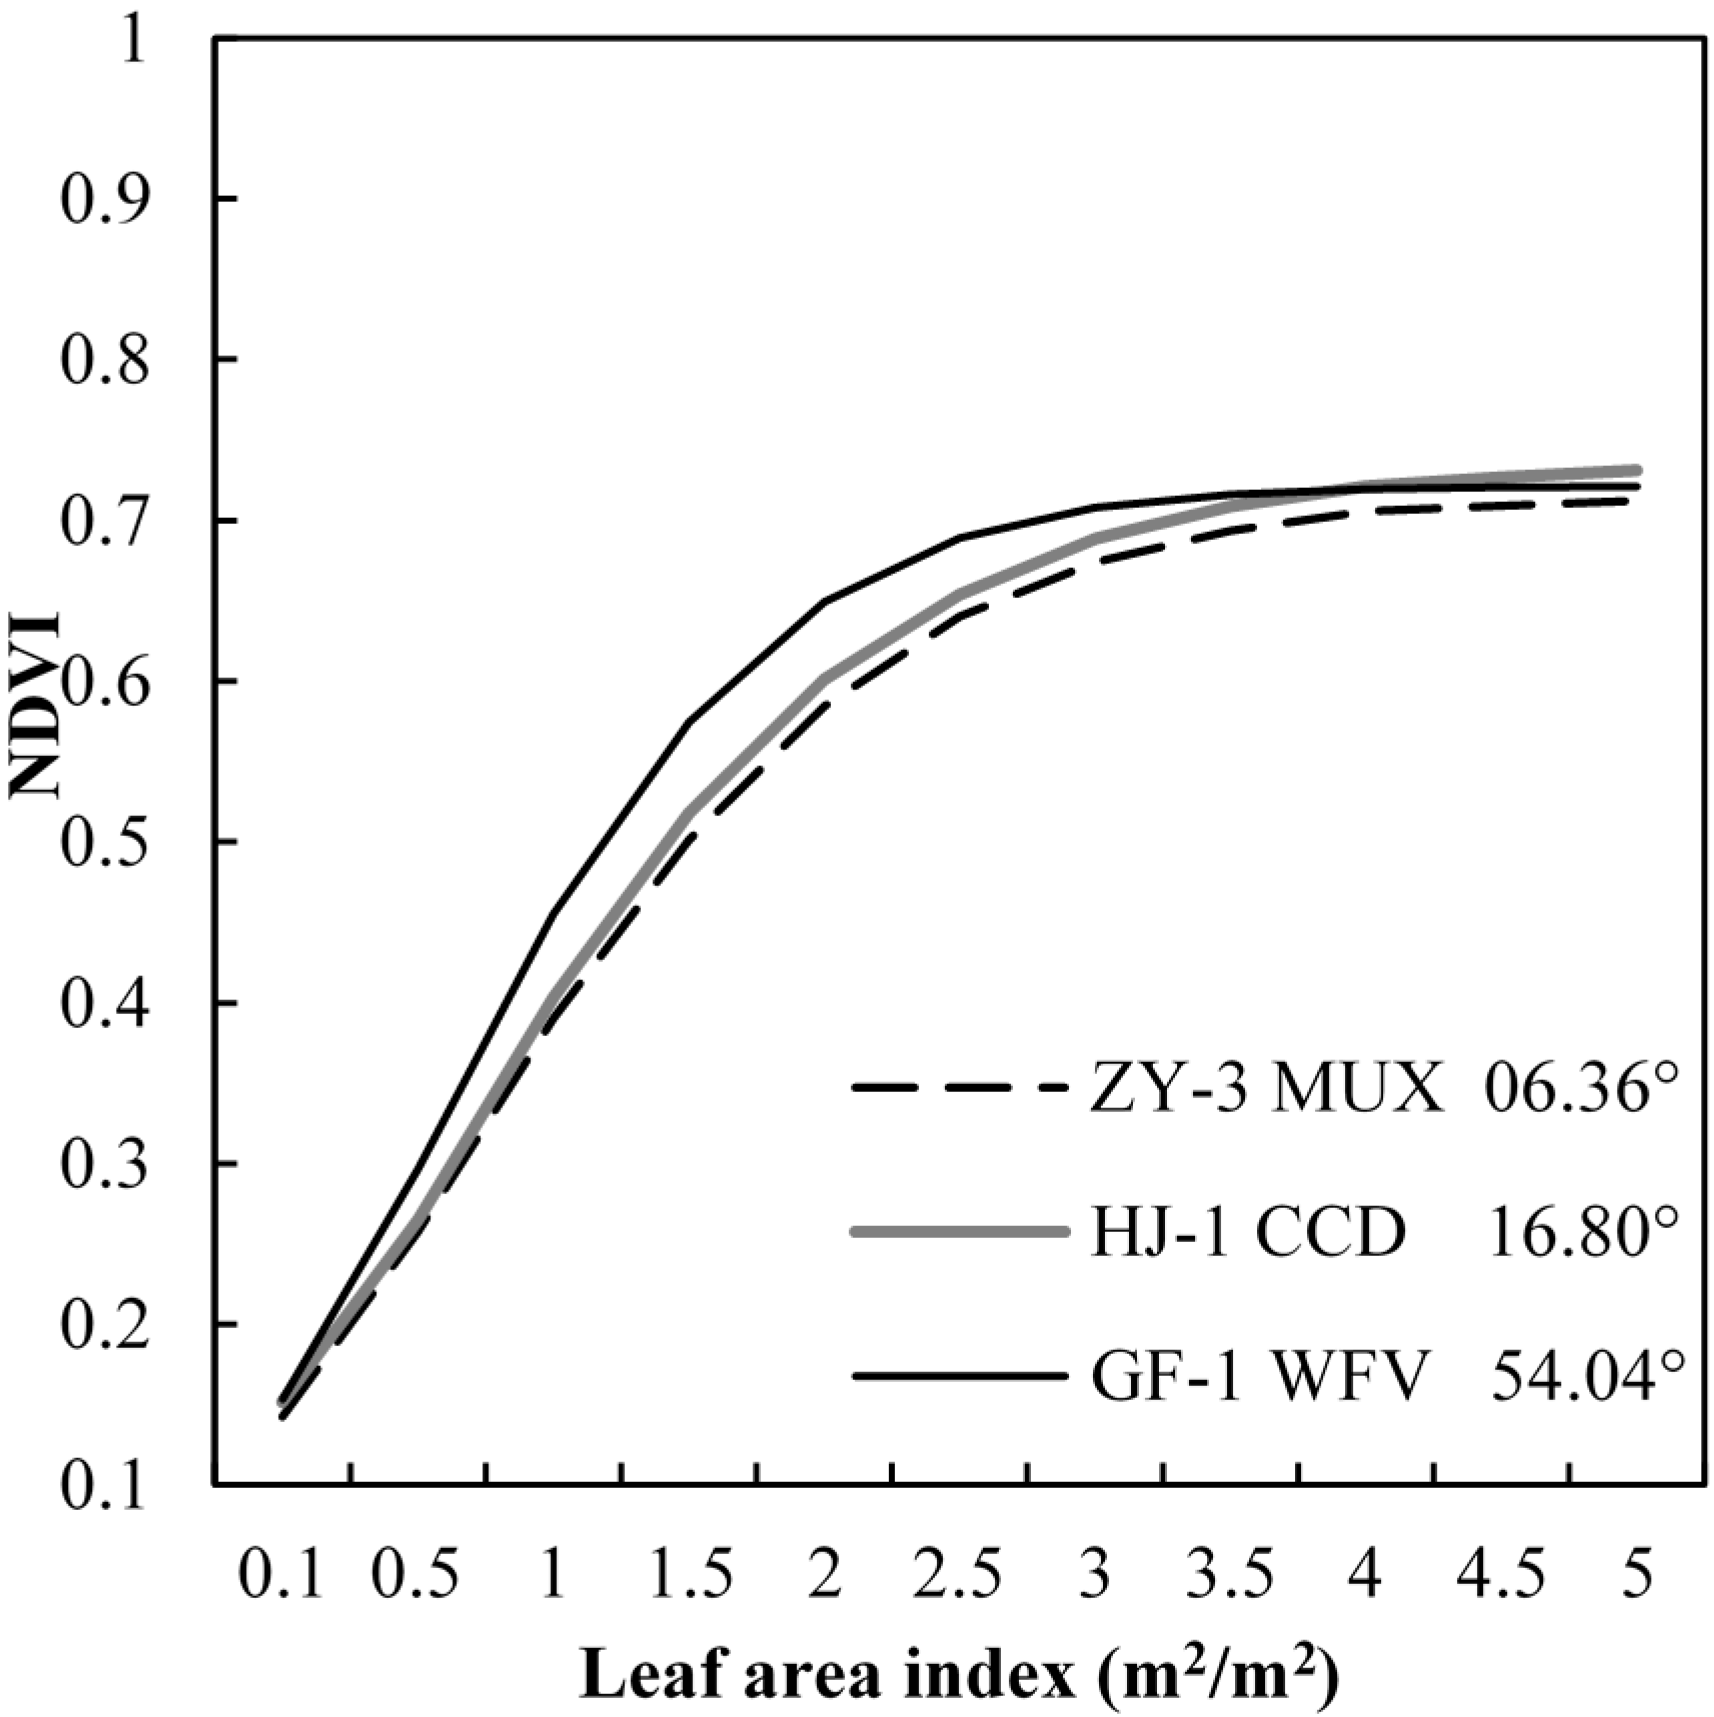
In order to compare further the characteristics of the NDVI from the different sensors, we used the PROSAIL radiative transfer model to simulate grass canopy reflectance with different satellite angles (θZY-3 = 6.36°, θHJ-1 = 16.80°, and θGF-1 = 54.04°) for LAI values of 0–5. Equation (1) was used to calculate the reflectance of the red and near-infrared bands based on the simulated grass canopy hyperspectral reflectance. This was then input into Equation (2) to obtain the NDVI. The results within the range of zenith angles relevant to this study are shown in Figure 10. It can be seen that the vegetation NDVI increases with increasing LAI, and that the range of increase varies depending on the LAI range. For LAI values ranging from 0 to 3, NDVI changes significantly with increasing LAI, and the differences between GF-1 WFV, ZY-3 MUX, and HJ-1 CCD values are caused by satellite zenith angle differences. For LAI values ranging from 0.5 to 1, the effect of the sensor zenith angle increases with increasing LAI; when LAI = 0.5, the GF-1 WFV NDVI is 11.9% and 14.89% greater than for ZY-3 MUX and HJ-1 CCD, respectively, but when LAI = 1, the GF-1 WFV NDVI is 12.85% and 16.60% greater than for ZY-3 MUX and HJ-1 CCD, respectively. For LAI values ranging from 1.5 to 3, the effect of the sensor zenith angle decreases with increasing LAI, when LAI = 1.5, the GF-1 WFV NDVI is 10.93% and 14.67% greater than for ZY-3 MUX and HJ-1 CCD, respectively, but when LAI = 3, the GF-1 WFV NDVI is 2.82% and 5.04% greater than for ZY-3 MUX and HJ-1 CCD, respectively. When LAI > 3.5, the NDVI values represent a saturated tendency, and the differences caused by the satellite angles are clearly reduced.
Figure 10. Effects of the sensor zenith angle on NDVI for different sensors. The NDVI was simulated based on PROSAIL and the spectral response function.
Remotesensing 07 02089 g010

6. Discussion

We evaluated the consistency and correlation of GF-1 WFV, HJ-1 CCD, and ZY-3 MUX sensor data for grassland monitoring applications by comparing spectral field measurements, vegetation coverage, and the leaf area index (LAI) of grassland stands with reflectance in the red and near-infrared bands and the Normalized Difference Vegetation Index (NDVI). The R2 values in the infrared band (0.556–0.893) and red band (0.819–0.850) showed that the correlation between sensors was higher for the red band than the infrared band. The correlation of NDVIs derived from the different sensor types was high (R2 between 0.758 and 0.852); however, the consistency was low in that the NDVI based on GF-1 WFV data was significantly higher than that based on ZY-3 MUX and HJ-1 CCD data.
Based on simulations using the PROSAIL model, the effects of changes in the sensors’ zenith angle have greater impact on reflectance and NDVI than that caused by the spectral response function. The correlation is better than those of IKONOS and ETM+ or SPOT presented in Soudani et al. [10]. However, there are many other factors that can impact different sensors and these were not discussed in this paper. The three sensors’ observation times were not completely synchronous, which must have been caused by spatial and temporal differences of the aerosol optical depth (AOD). Quality of the surface reflectance estimation is mainly dominated by knowledge of the AOD [45], especially in low surface reflectance regions where the aerosol radiative effect is stronger.
The phenology is an important characteristic of grassland vegetation during different periods [18]. However, in our study, the data from the three sensors were obtained by adjusting the satellites observation tasks, which has certain inherent difficulties for measurements at many periods during the year. Correlation analysis between ground grass-coverage and measured LAI data shows that the GF-1 WFV sensor gave the best performance, but its’ value is higher than those of the other two sensors, and the reason for this will require a more in-depth study to explain.

7. Conclusions

As an important means of earth observation, remote sensing not only provides users with radiation intensity data, but it can also produce high-level standardized data products to cover different areas. GF-1 WFV, HJ-1 CCD, and ZY-3 MUX are among the most important and frequently used sensors for terrestrial applications in China, and these are the main data sources for remote sensing products. However, for the same object, consistency and correlation are lacking between the different sensors’ image data. The best approaches to exploit the available multi-source remote sensing capability, so that accurate and continuous data on the temporal dynamics of grasslands can be acquired, represent a scientific issue that desires more consideration. Therefore, the inter-comparison of these three sensors is an important task that may reveal new perspectives regarding spatiotemporal analyses of changes in grassland.
Based on the field measurements of vegetation coverage and LAI of grassland stands, this study analyzed the capabilities of the three sensor types for monitoring grassland vegetation. The reflectances in the red and near-infrared bands and the NDVI from the three satellites were compared and the adjusted coefficients of determination (R2) revealed that differences exist between the reflectances from the three sensor types in different bands. The R2 values in the infrared band (0.556–0.893) and red band (0.819–0.850) showed that the correlation between sensors was higher for the red band than the infrared band. From the fitted slope equations, it was shown that differences exist in the consistency of data between the different sensor types. The consistency of data was highest between GF-1 WFV and HJ-1 CCD in the red band, whereas, in the near-infrared band, the consistency of data between GF-1 WFV and ZY-3 MUX was highest. The correlation of NDVIs derived from the different sensor types was high (R2 between 0.758 and 0.852); however, the consistency was low in that the NDVI based on GF-1 WFV data was significantly higher than that based on ZY-3 MUX and HJ-1 CCD data. In contrast, the mean difference between the NDVI based on ZY-3 MUX and HJ-1 CCD data was small. The correlation analysis between ground grass coverage and measured LAI data showed that the three sensor types estimated coverage better than the LAI, and that the GF-1 WFV sensor gave the best performance.
Based on field spectral measurements, the effects of the sensors spectral response characteristic difference function were analyzed. The results showed that the spectral response function has some influence on band reflectance, but that the overall effect is small.
Based on simulations using the SAIL bidirectional canopy reflectance model coupled with the PROSPECT leaf optical properties model (PROSAIL), the effects of changes in the sensors’ zenith angle caused by side sway were analyzed. This was found to have greater impact on reflectance and NDVI than that caused by the spectral response function. For LAI values of 0–3, NDVI values changed significantly with increasing LAI, and the differences between the three sensor types were large. For LAI > 3.5, NDVI appeared to reflect a saturated tendency, which greatly reduced the differences between the sensors.

Acknowledgments

This work was supported by a National Science and Technology Major Project of China (No. 30- Y20A01-9003-12/13), a National Major Scientific Research Projects for Global Change Research of China (2010CB951503), The Previous research of the National Key Basic Research Development Plan of China (2012CB723206), and the National Natural Science Foundation of China (41201438). The GF-1 WFV, ZY-3 MUX, and HJ-1 CCD image data were kindly provided by the China Center for Resource Satellite Data. We thank the Institute of Remote Sensing and Digital Earth, Chinese Academy of Sciences, for providing us with access to the remote sensing test site and offering support and help during the field observation process.

Author Contributions

Lei Wang had the original idea for the study and wrote the manuscript. Qingjiu Tian and Lei Wang conceived and designed the experiments. All authors performed field experiments together. Ranran Yang preprocessing of image data, contributed to the writing of the manuscript. Qingjiu Tian reviewed the manuscript. All authors read and approved the manuscript.

Conflicts of Interest

The authors declare no conflict of interest.

References

  1. Scurlock, J.; Hall, D. The global carbon sink: A grassland Perspective. Glob. Chang. Biol. 1998, 4, 229–233. [Google Scholar] [CrossRef]
  2. Xu, P. Grassland Resources Investigation and Planning Science; China Agriculture Press: Beijing, China, 2000. [Google Scholar]
  3. Chen, J.; Cihlar, J. Retrieving leaf area index of boreal conifer forests using Landsat TM images. Remote Sens. Environ. 1996, 55, 153–162. [Google Scholar] [CrossRef]
  4. Fang, H.; Liang, S. Retrieving leaf area index with a neural network method: Simulation and validation. IEEE Trans. Geosci. Remote Sens. 2003, 41, 2052–2062. [Google Scholar] [CrossRef]
  5. Anaya, J.A.; Chuvieco, E.; Palacios-Orueta, A. Aboveground biomass assessment in Colombia: A remote sensing approach. For. Ecol. Manag. 2009, 257, 1237–1246. [Google Scholar] [CrossRef]
  6. Brantley, S.T.; Zinnert, J.C.; Young, D.R. Application of hyperspectral vegetation indices to detect variations in high leaf area index temperate shrub thicket canopies. Remote Sens. Environ. 2011, 115, 514–523. [Google Scholar] [CrossRef]
  7. Tillack, A.; Clasen, A.; Kleinschmit, B.; Förster, M. Estimation of the seasonal leaf area index in an alluvial forest using high-resolution satellite-based vegetation indices. Remote Sens. Environ. 2014, 141, 52–63. [Google Scholar] [CrossRef]
  8. Gallo, K.P.; Daughtry, C.S.T. Differences in vegetation indices for simulated Landsat-5 MSS and TM, NOAA-9 AVHRR, and SPOT-1 sensor systems. Remote Sens. Environ. 1987, 23, 439–452. [Google Scholar] [CrossRef]
  9. Teillet, P.M.; Staenz, K.; Williams, D.J. Effects of spectral spatial and radiometric characteristics of remote sensing vegetation indices of forested regions. Remote Sens. Environ. 1997, 61, 139–149. [Google Scholar] [CrossRef]
  10. Soudani, K.; François, C.; le Maire, G.; le Dantec, V.; Dufrêne, E. Comparative analysis of IKONOS, SPOT, and ETM+ data leaf area index estimation in temperature coniferous and deciduous forest stands. Remote Sens. Environ. 2006, 102, 161–175. [Google Scholar] [CrossRef] [Green Version]
  11. Li, L.; Gu, X.F.; Ye, Z.T.; Yu, T.; Qiao, Y.L.; Meng, Q.Y.; Wang, Y.X. Characteristic difference analysis and transfer parameter determination for different satellites to detect NDVI values. Sci. China Earth Sci. 2012, 42, 238–245. [Google Scholar]
  12. Li, P.; Jiang, L.G.; Feng, Z.M. Cross-comparison of vegetation Indices derived from Landsat-7 enhanced Thematic Mapper Plus (ETM+) and Landsat-8 Operational Land Imager (OLI) sensors. Remote Sens. 2014, 6, 310–329. [Google Scholar] [CrossRef]
  13. Goward, S.N.; Davis, P.E.; Fleming, D.; Miller, L.; Townshend, J.R. Empirical comparison of Landsat 7 and IKONOS multispectral measurements for selected Earth Observation System (EOS) validation sites. Remote Sens. Environ. 2003, 88, 80–99. [Google Scholar] [CrossRef]
  14. Thenkabail, P.S.; Enclona, E.A.; Ashton, M.S.; Legg, C.; Jean de Dieu, M. Hyperion, IKONOS, ALI, and ETM+ sensors in the study of African rainforests. Remote Sens. Environ. 2004, 90, 23–43. [Google Scholar] [CrossRef]
  15. Van Leeuwen, W.J.D.; Orr, B.J.; Marsh, S.E.; Herrmann, S.M. Multi-sensor NDVI data continuity: Uncertainties and implications for vegetation monitoring applications. Remote Sens. Environ. 2006, 100, 67–81. [Google Scholar] [CrossRef]
  16. Xu, H.Q.; Zhang, T.J. Cross-comparison of ASTER and Landsat ETM+ multispectral Measurements for NDVI and SAVI vegetation indices. Spectrosc. Spect. Anal. 2011, 31, 1902–1907. [Google Scholar]
  17. Gao, H.L.; Gu, X.F.; Yu, T.; Gong, H.; Li, J.G. Method study and uncertainty analysis of calibration coefficients validation based on the Inner Mongolia test site. Sci. China Earth Sci. 2013, 43, 287–294. [Google Scholar]
  18. Hmiminaa, G.; Dufrênea, E.; Pontaillera, J.-Y.; Delpierrea, N.; Aubinetb, M.; Caquetd, B.; de Grandcourtd, A.; Burbane, B.; Flechardf, C.; Granierc, A.; et al. Evaluation of the potential of MODIS satellite data to predict vegetation phenology in different biomes: An investigation using ground-based NDVI measurements. Remote Sens. Environ. 2013, 132, 145–158. [Google Scholar] [CrossRef]
  19. Chen, J.M.; Black, T.A.; Adams, R.S. Evaluation of hemispherical photography for determining plant area index and geometry of a forest stand. Agric. For. Meteorol. 1991, 56, 129–143. [Google Scholar] [CrossRef]
  20. Darvishzadeh, R.; Atzberger, C.; Skidmore, A.; Schlerf, M. Mapping grassland leaf area index with airborne hyperspectral imagery: A comparison study of statistical approaches and inversion of radiative transfer models. ISPRS J. Photogramm. Remote Sens. 2011, 66, 894–906. [Google Scholar] [CrossRef]
  21. Hadjimitsis, D.G.; Clayton, C.R.I.; Hope, V.S. An assessment of the effectiveness of atmospheric correction algorithms through the remote sensing of some reservoirs. Int. J. Remote Sens. 2004, 25, 3651–3674. [Google Scholar] [CrossRef]
  22. China Center for Resources Satellite Data and Application. Landsat Introduction. Available online: http://www.cresda.com/n16/n1130/index.html (accessed on 6 January 2014).
  23. Myneni, R.B.; Hall, F.B.; Sellers, P.J.; Marshak, A.L. The interpretation of spectral vegetation indices. IEEE Trans. Geosci. Remote Sens. 1995, 33, 481–486. [Google Scholar] [CrossRef]
  24. Tucker, C.J. Red and photographic infrared linear combinations for monitoring vegetation. Remote Sens. Environ. 1979, 8, 127–150. [Google Scholar] [CrossRef]
  25. Huete, A.; Didan, K.; Miura, T.; Rodriguez, E.P.; Gao, X.; Ferreira, L.G. Overview of the radiometric and biophysical performance of the MODIS vegetation indices. Remote Sens. Environ. 2002, 83, 195–213. [Google Scholar] [CrossRef]
  26. Rouse, J.W.; Haas, R.H. Monitoring Vegetation Systems in the Great Plain with ERTS; NASA: Washington, DC, USA, 1973; Volume 1, pp. 309–317. [Google Scholar]
  27. Verhoef, W. Light scattering by leaf layers with application to canopy reflectance modeling: The SAIL model. Remote Sens. Environ. 1984, 16, 125–141. [Google Scholar] [CrossRef]
  28. Jacquemoud, S.; Baret, F. PROSPECT: A model of leaf optical properties spectra. Remote Sens. Environ. 1990, 34, 75–91. [Google Scholar] [CrossRef]
  29. Chlorophyll Meter SPAD-502; Minolta: Maarssen, The Netherlands, 2003.
  30. Markwell, J.; Osterman, J.C.; Mitchell, J.L. Calibration of Minolta SPAD-502 leaf chlorophyll meter. Photosynth. Res. 1995, 46, 467–472. [Google Scholar] [CrossRef] [PubMed]
  31. Darvishzadeh, R.; Skidmore, A.; Schlerf, M.; Atzberger, C. Inversion of a radiative transfer model for estimating vegetation LAI and chlorophyll in a heterogeneous grassland. Remote Sens. Environ. 2008, 112, 2592–2604. [Google Scholar] [CrossRef]
  32. Hawkins, T.; Gardiner, E.; Comer, G. Modeling the relationship between extractable chlorophyll and SPAD-502 readings for endangered plant species research. J. Nat. Conserv. 2009, 17, 123–127. [Google Scholar] [CrossRef]
  33. Zhao, D.; Huang, L.; Li, J.; Qi, J. A comparative analysis of broadband and narrowband derived vegetation indices in predicting LAI and CCD of a cotton canopy. ISPRS J. Photogramm. Remote Sens. 2007, 62, 25–33. [Google Scholar] [CrossRef]
  34. Heiskanen, J.; Rautiainen, M.; Stenberg, P.; Mõttus, M.; Vesanto, V. Sensitivity of narrowband vegetation indices to boreal forest LAI, reflectance seasonality and species composition. ISPRS J. Photogramm. Remote Sens. 2013, 78, 1–14. [Google Scholar] [CrossRef]
  35. Teillet, P.M.; Fedosejevs, G. On the dark target approach to atmospheric correction of remotely sensed data. Can. J. Remote Sens. 1995, 21, 374–387. [Google Scholar] [CrossRef]
  36. Epema, G.E. Atmospheric condition and its influence on reflectance of bare soil surfaces in southern Tunisia. Int. J. Remote Sens. 1992, 13, 853–868. [Google Scholar] [CrossRef]
  37. John, C.P. Calibration of satellite radiometers and the comparison of vegetation indices. Remote Sens. Environ. 1987, 21, 15–27. [Google Scholar] [CrossRef]
  38. Trishchenko, A.P.; Cihlar, J.; Li, Z. Effects of spectral response function on surface reflectance and NDVI measured with moderate resolution satellite sensors. Remote Sens. Environ. 2002, 81, 1–18. [Google Scholar] [CrossRef]
  39. Li, G.Q.; Li, X.B.; Li, G.M.; Wen, W.Y.; Wang, H.; Chen, L.H.; Yu, J.J.; Deng, F. Comparison of spectral characteristics between China HJ1-CCD and Landsat 5 TM imagery. IEEE J. Sel. Top. Appl. Earth Observ. Remote Sens. 2013, 6, 139–148. [Google Scholar] [CrossRef]
  40. Steven, M.D.; Malthus, T.J.; Baret, F.; Xu, H.; Chopping, M.J. Intercalibration of vegetation indices from different sensor systems. Remote Sens. Environ. 2003, 88, 412–422. [Google Scholar] [CrossRef]
  41. Nicodemus, F.E.; Richmond, J.C.; Hsia, J.J.; Ginsberg, W.I.; Limperis, T. Geometrical Considerations and Nomenclature for Reflectance; Institute for Basic Standards: Washington, DC, USA, 1977. [Google Scholar]
  42. Gao, F.; Schaaf, C.B.; Strahler, A.H.; Jin, Y.; Li, X. Detecting vegetation structure using a kernel-based BRDF Model. Remote Sens. Environ. 2003, 86, 198–205. [Google Scholar] [CrossRef]
  43. Pisek, J.; Ryu, Y.; Sprintsin, M.; He, L.M.; Oliphant, A.J.; Korhonen, L.; Kuusk, J.; Kuusk, A.; Bergstrom, R.; Verrelst, J.; et al. Retrieving vegetation clumping index from Multi-angle Imaging SpectroRadiometer (MISR) data at 275 m resolution. Remote Sens. Environ. 2013, 138, 126–133. [Google Scholar] [CrossRef]
  44. He, L.M.; Chen, J.M.; Pisek, J.; Schaaf, C.B.; Strahler, A.H. Global clumping index map derived from the MODIS BRDF product. Remote Sens. Environ. 2012, 119, 118–130. [Google Scholar] [CrossRef]
  45. Vermote, E.F.; Vermeulen, A. Atmospheric Correction Algorithm: Spectral Reflectances (MOD09) Version 4.0. Available online: http://modis.gsfc.nasa.gov/data/atbd/atbd_mod08.pdf (accessed on 10 February 2015).