Article

Validation of MODIS and GEOV1 fPAR Products in a Boreal Forest Site in Finland

by
Titta Majasalmi
1,*,
Miina Rautiainen
1,†,
Pauline Stenberg
1,† and
Terhikki Manninen
2
1
Department of Forest Sciences, University of Helsinki, P.O. Box 27, FI-00014 Helsinki, Finland
2
Finnish Meteorological Institute, P.O. Box 503, FI-00101 Helsinki, Finland
*
Author to whom correspondence should be addressed.
These authors contributed equally to this work.
Remote Sens. 2015, 7(2), 1359-1379; https://doi.org/10.3390/rs70201359
Submission received: 17 December 2014 / Accepted: 21 January 2015 / Published: 27 January 2015

Abstract

:
Remote sensing of the fraction of absorbed Photosynthetically Active Radiation (fPAR) has become a timely option to monitor forest productivity. However, only a few studies have had ground reference fPAR datasets containing both forest canopy and understory fPAR from boreal forests for the validation of satellite products. The aim of this paper was to assess the performance of two currently available satellite-based fPAR products: MODIS fPAR (MOD15A2, C5) and GEOV1 fPAR (g2_BIOPAR_FAPAR), as well as an NDVI-fPAR relationship applied to the MODIS surface reflectance product and a Landsat 8 image, in a boreal forest site in Finland. Our study area covered 16 km2 and field data were collected from 307 forest plots. For all plots, we obtained both forest canopy fPAR and understory fPAR. The ground reference total fPAR agreed better with GEOV1 fPAR than with MODIS fPAR, which showed much more temporal variation during the peak-season than GEOV1 fPAR. At the chosen intercomparison date in peak growing season, MODIS NDVI based fPAR estimates were similar to GEOV1 fPAR, and produced on average 0.01 fPAR units smaller fPAR estimates than ground reference total fPAR. MODIS fPAR and Landsat 8 NDVI based fPAR estimates were similar to forest canopy fPAR.

Graphical Abstract

1. Introduction

The fraction of absorbed Photosynthetically Active Radiation (fPAR) by green vegetation is a determinant of energy flows between the soil and atmosphere, and is one of the Essential Climate Variables (ECVs) according to international Global Climate Observing Systems-network (GCOS) [1]. fPAR also has a central role in global environmental monitoring because it is directly linked with ecosystem functioning, and is retrievable from space. According to the Light Use Efficiency (LUE) concept introduced by Monteith [2], if LUE is assumed to be relatively invariable within species, the net primary productivity of terrestrial ecosystems can be estimated from fPAR when the amount of incident PAR is known. fPAR is commonly estimated using remotely sensed data, as producing continuous global or continental fPAR maps is only possible via remote sensing techniques. Empirical methods for the retrieval of fPAR from space are commonly based on combinations of the reflectance of vegetation in the red and Near Infrared (NIR) spectral bands. In particular, the Normalized Difference Vegetation Index (NDVI) formulated by Rouse et al. [3] has long been used for the estimation of fPAR.
Several satellite-based fPAR products have been developed during the past decade. These products are crucial for estimating the seasonal and long-term courses of fPAR of forest areas. Recent studies have concentrated on the intercomparison and evaluation of different fPAR products over large areas, e.g., over Northern Eurasia [4], Europe [5], Australia [6], Scandinavia [7], Alaska [8,9], Iberia Peninsula [10], temperate forests in USA [11], tropical forests of Amazon [12] or over the entire globe [13,14]. There are large differences among fPAR products for forested biomes [5,6,10]. D’Odorico et al. [5] found, for example, that for Scandinavian and Russian boreal forests, MODIS fPAR (MCD product, C5: Collection five) overestimated fPAR by almost 0.5 units. In addition, they discovered that the same product displayed an anomalous peak in summertime fPAR values, and noted considerable disagreements between other fPAR products for July. In their study, the monthly mean fPAR varied from 0.45 up to 0.77 among different satellite-based fPAR products for European coniferous forests. Serbin et al. [15], in turn, studied fPAR of even-aged boreal forests located in Manitoba, Canada, and found that MODIS fPAR (C4 and C5) overestimated fPAR for early successional sites with young trees and underestimated it in late successional sites with old coniferous trees. In addition, they noted that MODIS fPAR (C5) produced larger seasonal variation in fPAR for needleleaf evergreen forests than what was estimated based on flux tower measurements. On the other hand, for a southern boreal forest site in Finland, satellite-based JRC-TIP (Joint Research Centre Two-stream Inversion Package) and ESA/JRC MGVI (European Space Agency/JRC Global Vegetation Index) estimates of summer fPAR produced very low values (~0.4) compared to ground measurements [5]. When no good quality fPAR products are available NDVI based products can be used to approximate fPAR (e.g., [7,8]). The advantage of this approach is the possibility to derive NDVI maps with higher spatial and temporal resolution than those of the existing fPAR products.
Several studies [4,5,13,14,16,17], have pointed out that the number and representativeness of ground reference data limit the development of remote sensing methods for estimating boreal forest fPAR. Recently, Weiss et al. [13] emphasized that ground reference sites with medium to high fPAR values are required to improve the accuracy assessment of global fPAR products. In addition, they underlined that in future studies the presence of green understory has to be taken into account when calculating the ground reference fPAR.
Only a few studies have had ground reference fPAR datasets, which could be used to validate satellite-based fPAR products. Steinberg et al. [8] studied satellite-based fPAR products for boreal forests in Alaska and concluded that if the contribution of ground cover vegetation (vegetation height < 10 cm) to total ground reference fPAR was ignored, MODIS fPAR overestimated fPAR for most of the year. D’Odorico et al. [5] used flux-tower data series of fPAR, and pointed out that flux-tower measurements may not be representative of radiation absorption at the forest stand or landscape levels, and that the problem is the most pronounced above sparse and heterogeneous forest canopies.
Ground reference fPAR is usually measured using four simultaneously logging sensors recording the downwelling and upwelling fluxes both below and above the forest canopy [18]. This configuration is rather simple, yet for tall canopies access to a tower is required to measure reflected and incident radiation above the canopy. However, for many forest areas there are no towers available. The lack of in situ fPAR measurements is mostly due to limitations in the number of sensor readings and spatial extent that can be covered in a reasonable period of time with available field instrumentation. However, a recently developed canopy spectral absorption model [19] may be used with gap fraction data to obtain estimates of fPAR for forest stands [20]. The strength of this fPAR model, as compared to more complex canopy radiation models, is the small number of input parameters, and that all model inputs are measurable or available through other simple models.
To date, it is not known how well the current satellite-based fPAR products estimate European boreal forest fPAR. The development of satellite-based fPAR retrieval methods is also hindered by the lack of ground reference data from coniferous and mixed forests. In addition, since the interannual variability of fPAR for mature boreal coniferous forest is known to be relatively small (e.g., [5]), the same field measurements may be used for several years to validate remotely sensed vegetation products (e.g., Leaf Area Index (LAI), land cover vegetation, phenology products), if no silvicultural operations have been carried out.
In this study, we validated peak-season fPAR products in a boreal forest site in Finland against ground reference fPAR estimated using two different measurement techniques, and a previously developed canopy absorption model [19,20]. Satellite-based fPAR estimates with three different spatial resolutions were used for the assessment: Two currently available fPAR products by MODIS and GEOV1 (1 km × 1 km), and two NDVI-based estimates of fPAR derived from MODIS surface reflectance product (0.25 km × 0.25 km) and one derived from a Landsat 8 image (30 m × 30 m).

2. Materials and Methods
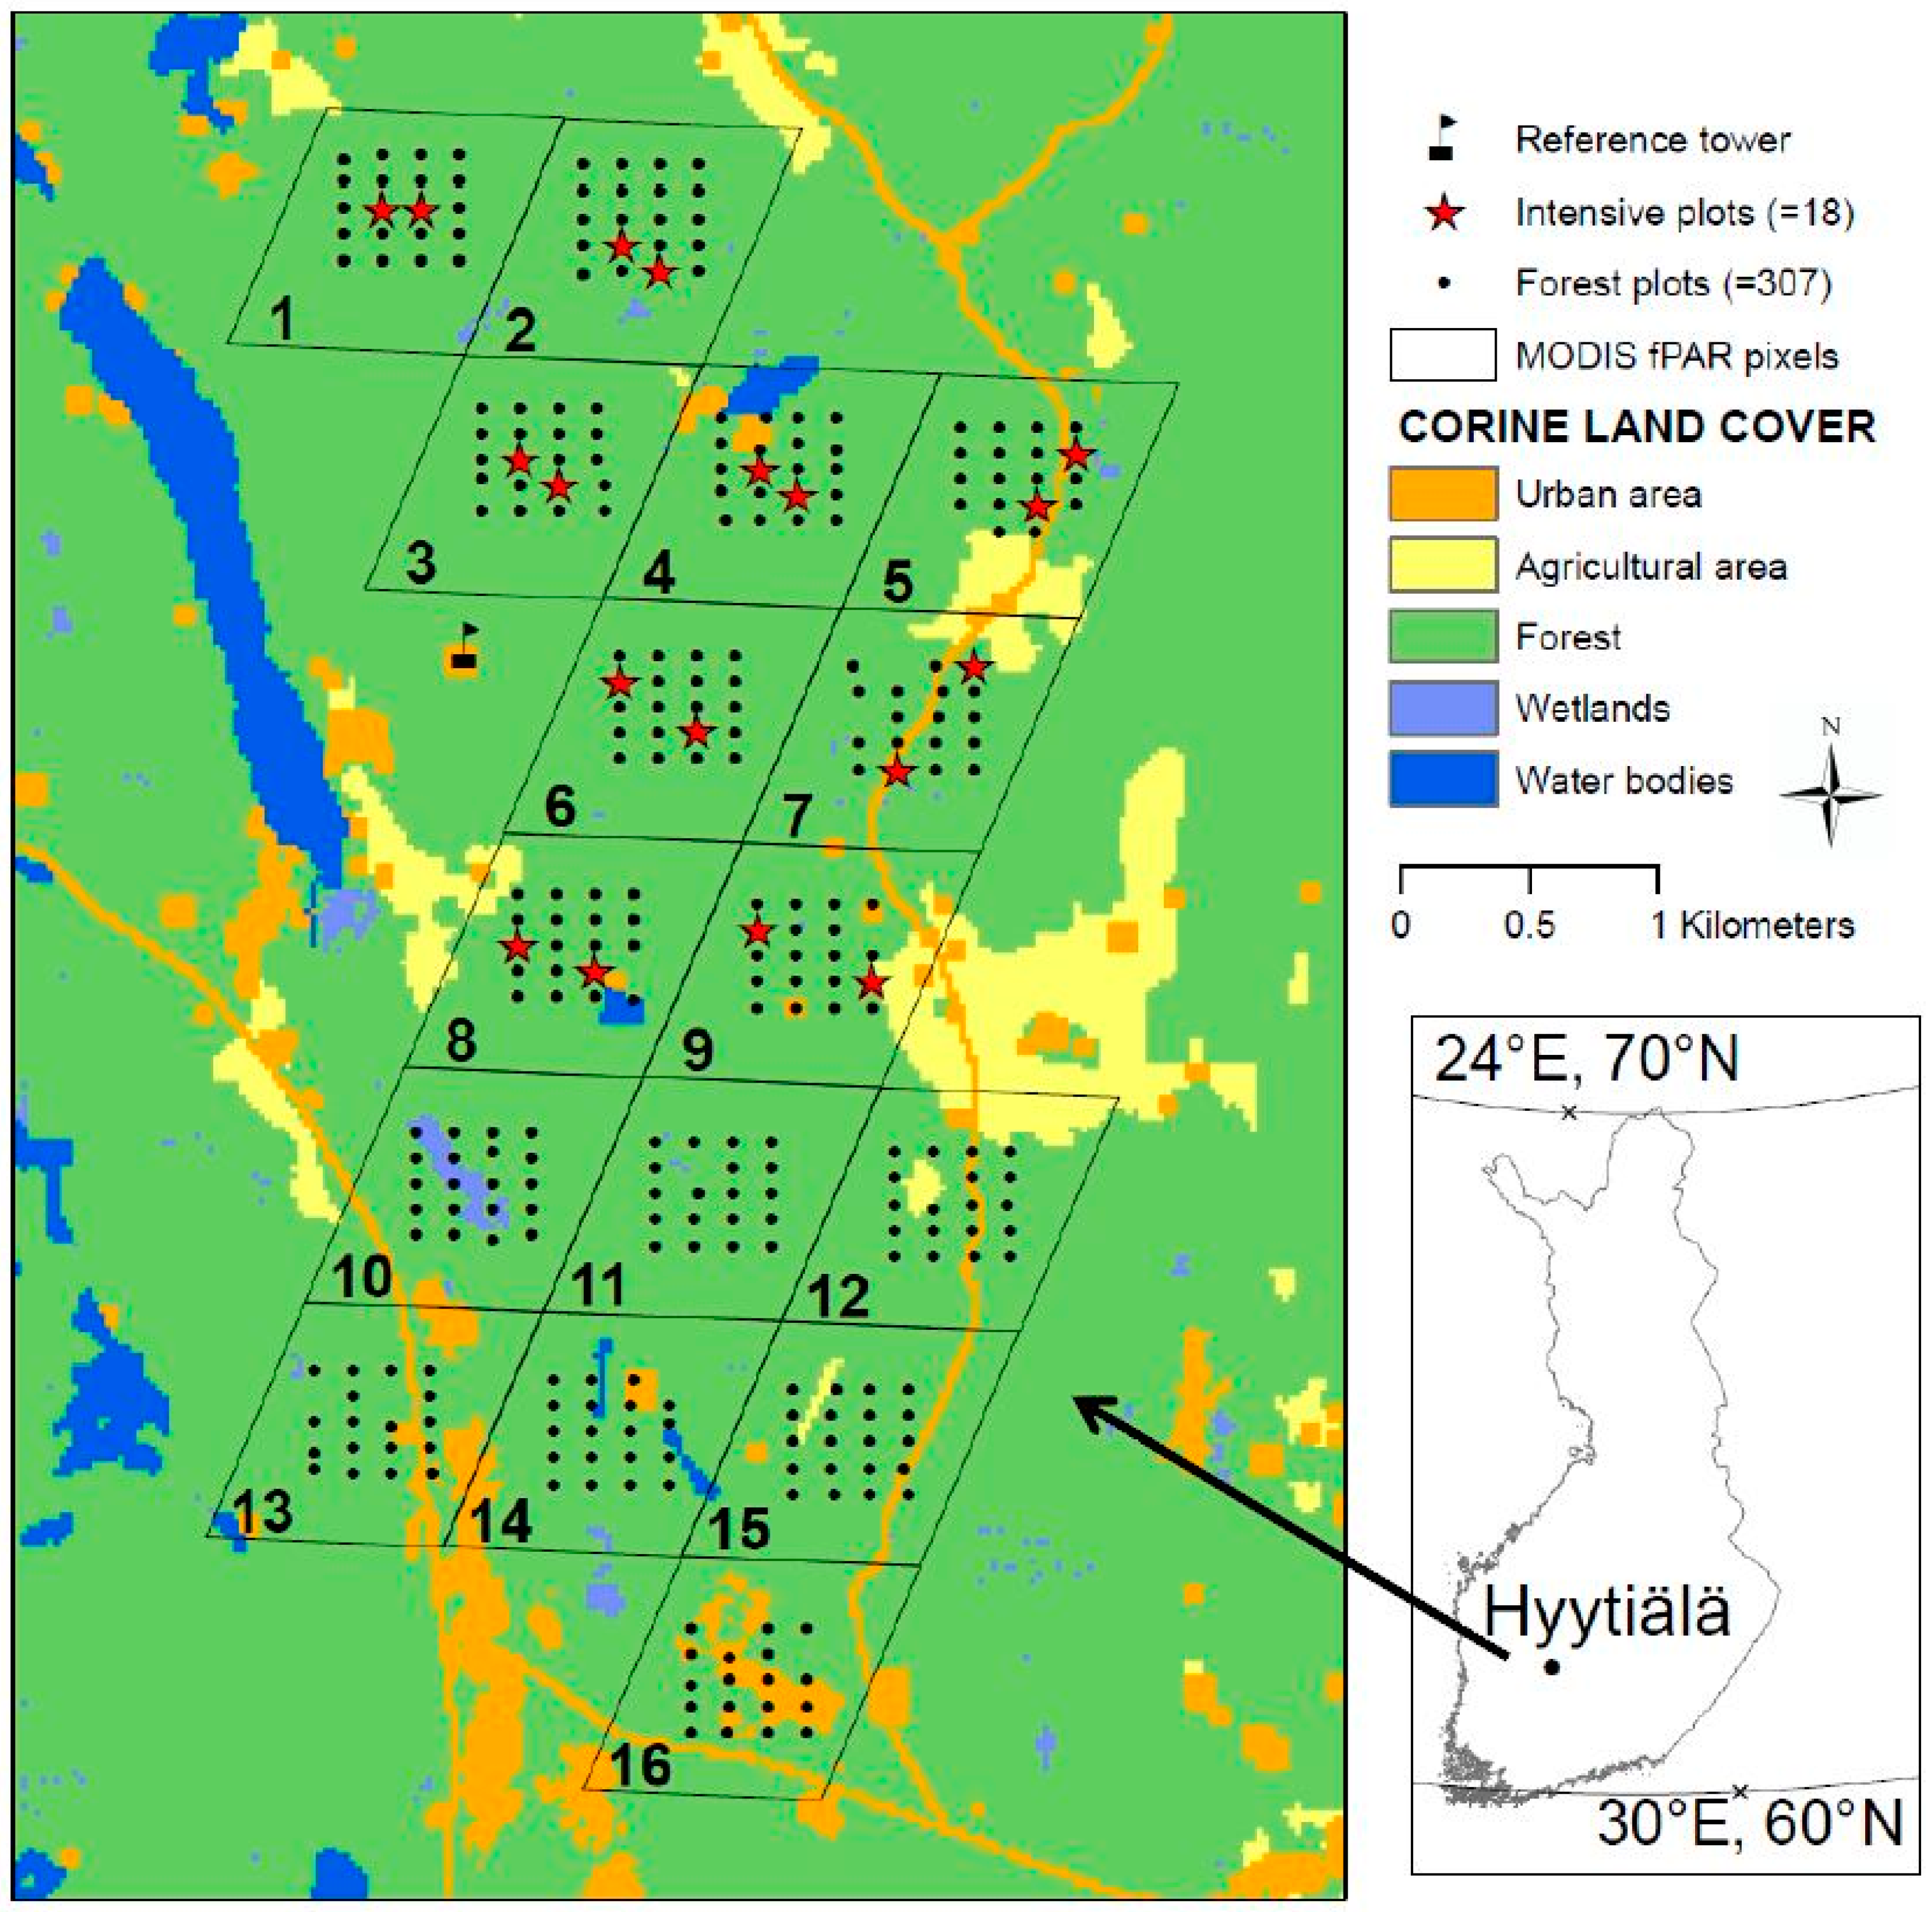
2.1. Study Site

Field measurements were performed at a boreal forest site located in the vicinity of Hyytiälä forestry field station in southern Finland (61º50′ N, 24º17′ E) between 24 June and 29 August 2013. The study area covered 16 MODIS fPAR pixels, and within each of these 1 km × 1 km pixels, a cluster of twenty plots was located according to a systematic sampling scheme (Figure 1). The total number of plots was 320, of which 307 were located in a forest. To locate the plots inside the MODIS fPAR pixels (Figure 1), the Coordination of Information on the Environment (CORINE) Land Cover database [21] with a spatial resolution of 25 m × 25 m produced by the Finnish Environment Institute was used before the field campaign to plan the field measurements and select pixels with the highest forest cover. CORINE is a cartographic European database consisting of 44 land cover classes. We also used CORINE to assess possible errors in MODIS land cover classification (MCD12Q1), because biome misclassification has been found to produce underestimates of LAI [22], and thus likely of fPAR. According to Fang et al. [22], coniferous forests have the highest risk of biome misclassification due to their relatively open canopy structure, which allows large contributions from understory and ground layer to forest reflectance. The percentage of forest cover within the pixels varied from 79% (pixel 16) to 100% (pixels 6 and 11), urban areas covered between 0 (pixels 1–3, 6 and 11) and 21% (pixel 16), agricultural areas between 0 and 14% (pixel 12), and wetlands and water bodies from 0 to 6% (pixel 10) (Figure 1). The distance between plots in a cluster was 100 m in the south-north direction and 150 m in the east-west direction. If the location of an individual plot did not fall within a forest but, e.g. in the middle of a road, it was moved in steps of 10 m (but not exceeding a total of 30 m) in one of the cardinal directions towards the forest. The grid of the extensive field measurements of both forest canopy and understory layer covered 30% (500 m × 600 m) of each MODIS pixel.
Figure 1. Sampling scheme. The study area covers 16 MODIS pixels; and the numbers in the lower left corners denote pixel ID. Pixel 16 has the smallest forest cover (79%).
Remotesensing 07 01359 g001
The forest plots were dominated by Scots pine (Pinus sylvestris L.), Norway spruce (Picea abies (L.) Karst), and Silver birch (Betula pendula Roth) (Table 1). The plots were classified as either pine, spruce or birch dominated if the basal area of the dominating tree species comprised more than 50% of stand total basal area (Table 1). To be used for more intensive canopy transmittance measurements, a set of 18 forest plots (hereafter called intensive plots) among the 307 forest plots was selected. The intensive plots were selected from the nine MODIS fPAR pixels closest to the reference tower (i.e., pixels 1–9, see Figure 1) in order to minimize the distance to the reference (above canopy) sensor, and to sample forests with different mixtures of tree species and development stages (Table 1 and Table 2). In general, the northern parts of the study area (MODIS pixels 1–9) are slightly more heterogeneous than the southern parts (pixels 10–16). The northern part has slightly larger LAI than the southern part, which may be explained by the decreasing fraction of spruce trees and increasing fraction of pine trees towards the south (Table 2). In addition, the northern part has pixels with both the smallest (pixels 2 and 3) and the largest number of deciduous trees (pixels 4, 7 and 9). Thus, MODIS pixels 1–9 represent the whole study area well.
The center of each plot (n = 307) was located using a GPS, and an extensive forest and understory inventory was conducted. Forest variables were collected using Bitterlich-sampling (i.e., sampling proportional to size of the breast-height-diameter of the trees). The basal area (ba) was measured from the plot center, and the diameter-at-breast-height (dbh) and tree height (h) were measured for the median basal area tree. In plots with small trees, the ba was estimated from the stem number and dbh. The understory layer was classified into one of four fertility classes: xeric, sub-xeric, mesic or herb-rich, and in each plot two 1 m × 1 m understory sub-plots were established 4 m west and 4 m east from the plot center. The fractional cover of the understory was estimated for three classes: (1) dwarf shrubs, (2) pteridophytes and herbaceous species, and (3) graminoids. Similarly, the ground layer was also estimated for three classes: (1) mosses, (2) lichens and (3) litter (including all non-photosynthetic materials) (Table 2). We used understory spectra measured in Hyytiälä around midsummer 2010 for the four different understory types [23]. The mean values of the forest variables and the fractional cover of understory and ground layers for MODIS fPAR pixels (Figure 1) are given in Table 2. The field measured coordinates were converted to the EUREF-FIN geographical coordinate system.
Table 1. Description of the forest plots (= 307) and intensive plots (= 18). Abbreviations: N = number of plots, ba = basal area (m2/ha), h = tree height (m), LAIe = estimate of the effective LAI by the LAI-2000 PCA.
SpeciesNbahLAI
RangeMeanRangeMeanRangeMean
Pine1240–36.014.01.4–28.617.00.3–3.91.9
Pine (intensive)83.8–22.016.24.5–20.815.80.9–2.92
Spruce1220–36.014.60.3–28.016.70.2–5.02.7
Spruce(intensive)619.0–36.026.310.8–24.018.13.0–3.63.3
Birch350–29.07.80.5–23.810.50.2–3.82.0
Birch (intensive)31.8–15.09.34.9–16.010.60.7–2.01.5
Mixed260–15.47.22.0–22.815.50.4–4.52.7
Mixed (intensive)1-12.5-17.0-2.2
Table 2. Upscaled mean values of forest variables for MODIS pixels (see Figure 1). Abbreviations: ba = basal area, h = tree height, LAIe = effective Leaf Area Index of tree canopy, Pine% = percentage of pine trees, Spruce% = percentage of spruce trees, Decid.% = percentage of deciduous trees, GG% = fractional cover (fc) of ground layer covered by green vegetation, Litter% = fc of ground covered by litter (and other woody material), and Ustory% = fc of understory species.
Pixel IDba (m2/ha)h (m)LAIePine%Spruce%Decid.%GG%Litter%Ustory%
112.613.82.917.174.78.339.960.120.8
210.816.52.150.044.75.245.050.037.8
320.720.72.734.561.63.964.335.829.1
410.714.22.321.742.735.718.881.338.1
59.613.42.268.319.112.635.464.631.7
616.316.92.815.162.222.737.662.435.6
711.313.52.318.845.535.744.455.338.2
813.513.62.328.949.821.440.060.047.0
99.616.72.428.336.934.834.365.738.0
1014.115.02.155.423.920.760.139.928.6
1112.816.32.517.371.511.346.453.637.1
1213.021.02.248.743.47.860.739.333.2
1310.012.82.037.439.623.037.459.627.2
149.615.02.036.242.421.547.452.632.6
1516.019.81.982.810.36.872.028.034.6
1615.216.01.784.81.313.962.632.926.9

2.2. Field Measurements of Canopy Transmittance

We measured canopy transmittances for all the 307 forest plots using the LAI-2000 Plant Canopy Analyzer (LI-COR, [24]). In addition, for the 18 intensive plots, canopy transmittance measurements were performed also using the Tracing Radiation and Architecture of Canopies (TRAC) instrument [25], which records transmitted direct solar radiation at PAR wavelengths.

2.2.1. LAI-2000 Measurements

The LAI-2000 measurements used to calculate the ground reference fPAR were conducted between 26 June and 17 July 2013, except the intensive deciduous plots which were measured on 28 August 2013 simultaneously with the TRAC measurements (Section 2.2.2.). The LAI-2000 measures diffuse sky irradiance (wavelength region 320–490 nm) in five zenith angle bands (ranges: 0º–13º, 16º–28º, 32º–43º, 47º–58º and 61º–74º) [24]. The measurements were performed when sun altitude was less than 16 degrees to restrict direct radiation from reaching the sensors. No view restrictor was used during field measurements. Two sensors were used simultaneously, one above and one below the forest canopy. The two sensors were intercalibrated before the measurements. The reference unit was located in the reference tower to log readings automatically every 15 s, while the other unit was operated manually inside the forest. Measurement height was 1.6 m to quicken LAI-2000 measurements in the field conditions (i.e., the person making the measurements was able to stay standing while taking the readings).
In each plot, eight measurement points were located using a modified version of the Validation of Land European Remote Sensing Instruments (VALERI, [26]) cross-scheme, so that the first four measurement points were located at four meters distance, and the next four measurement points at eight meters distance from the plot center in each cardinal-direction. This sampling scheme was chosen because it allows time-savings in the field measurements, while the accuracy and bias of the sampling scheme remain close to those of the original VALERI scheme (i.e., twelve measurement points in a cross form) [27]. The mean canopy transmittance for each plot was calculated as the ratio of means of below- and above- canopy sensor readings from the two LAI-2000 units. For validation of the forest canopy fPAR model a second order polynomial function was fitted to the measured canopy transmittance readings to obtain canopy transmittance, which corresponds to sun angle present during the TRAC measurements (see below). For ground reference calculations, on the other hand, canopy transmittance at zenith angle 32º–43º (“3th ring”) were used (see Section 2.3.1.).

2.2.2. TRAC Measurements

The TRAC measurements were conducted within three consecutive days 27–29 August 2013. The TRAC [25] comprises three LI-COR sensors, two of which point upwards to measure PAR transmittance of the canopy in the sun’s direction and one downwards to measure PAR reflected by the forest floor. TRAC measurements were performed using six 20-m long, parallel transects perpendicular to the sun and located 4 m apart from each other. We measured many small transects instead of long ones, since the average management compartment size in Finnish forest is only 1–2 ha, and also because sky conditions (e.g., sun angle and atmospheric transmittance) can be assumed to stay more constant during short measurement periods. Data were collected when the sun zenith angle was in the range of 52 to 60 degrees. The majority of TRAC measurements were conducted without detectable clouds close to the sun. However, in one of the intensive plots, the sky conditions were variable during the measurements. An extension arm was used to keep the sensors leveled and the measurement height (~0.7 m) constant. A metronome took care that the walking pace stayed at ~0.3 m/s.
The TRAC sensors were intercalibrated using a similar LI-COR sensor logging constantly on top of the reference tower located in the center of the Hyytiälä forest area. The reference tower sensor was used to obtain above canopy PAR readings while the TRAC was operated in the forest to measure the below canopy readings. During intercalibration of the PAR-sensors, the TRAC PAR sensors were located 0.6 m from the reference PAR sensor. The TRAC instrument was also turned upside down to calibrate the down-looking sensor. Calibration data were acquired for a total of 5 h and 40 min under different sky conditions.

2.3. Calculation of Ground Reference fPAR

2.3.1. fPAR from LAI-2000 Data

We estimated fPAR separately for the forest canopy (fPARCANOPY) (Equation (1)) and for the understory and ground layer (fPARUSTORY) (Equation (5)), which together form the forest total fPAR (fPARTOTAL) comparable to satellite products. The ground reference fPAR values were calculated for 6 July 2013 (Day Of Year (DOY) 187) and local time 12:37–13:30. From the LAI-2000 data, the modeled fraction of PAR absorbed by the canopy (fPARCANOPY) was calculated as [19,20]:
f P A R C A N O P Y ( θ ) = i 0 ( θ ) α C ( λ P A R ) + [ t 0 ( θ ) + i 0 ( θ ) ( 1 Q ) ω C ( λ P A R ) ] ρ G ( λ P A R ) i D α C ( λ P A R ) 1 Q ω C ( λ P A R ) i D ρ G ( λ P A R )
where αc(λPAR) and ωc(λPAR) denote canopy absorptance and scattering averaged over all PAR wavelengths, i0 is canopy interceptance, t0 is the zero order transmittance (gap fraction) in the direction of incoming radiation (i0 + t0 = 1), Q denotes the fraction of backwards scattered radiation, ρG is the reflectance from ground and understory, and iD is canopy diffuse interceptance. Values of t0(θ) and i0 were approximated using the gap fraction of the 3th ring of the LAI-2000. Coefficients αc and ωc, which sum up to i0, are linked to the recollision probability (p) and leaf single scattering albedo (ωL) through the equations [28]:
α C = 1 ω L 1 p ω L
and
ω C = ω L p ω L 1 p ω L
The photon recollision probability (p) was calculated using the formula of Stenberg [29]:
p = 1 i D L A I
where LAI is the “true” LAI. The canopy diffuse interceptance iD corresponds to 1-DIFN, where DIFN (diffuse non-interceptance) is a direct output of the LAI-2000 instrument, and the true LAI was calculated from the effective LAI provided by the instrument using shoot-level clumping factors of 0.59 for pine [30] and 0.64 for spruce [31]. Understory and ground reflectance (ρG) was based on previous measurements of understory spectra (see below) and the fraction of backwards scattering (Q) was calculated using the equation by Stenberg et al. [19].
The understory Hemispherical-Directional Reflectance Factors (HDRFs) in PAR were: 0.064 for herb-rich, 0.092 for mesic, 0.065 for sub-xeric and 0.083 for xeric plots. The understory HDRF data were collected between 29 June and 6 July 2010 [23]. The mean values of leaf albedo (ωL) in PAR were 0.149 for pine, 0.147 for spruce and 0.174 for birch. The albedo values were computed as the sum of the mean spectral reflectances and transmittances (for sun and shade foliage and over abaxial and adaxial surfaces) [32], which then were averaged over the PAR region (400–700 nm). For mixed stands, the optical properties of foliage were weighted using basal area of tree species.
fPARUSTORY was calculated assuming FCOVERUSTORY (fractional cover of understory vegetation in vertical direction) ≈ FiPARUSTORY (fraction of intercepted radiation in vertical direction by the understory vegetation) ≈ fPARUSTORY [6], and weighted using canopy transmittance in the sun’s direction (θs) at the moment of satellite overpass (satellites pass at the same local time 12:37–13:30):
f P A R U S T O R Y [ a c F C O V E R U + ( 1 a c F C O V E R U ) d e F C O V E R G ] t 0 ( θ s )
In Equation (5), FCOVERU represents the fractional cover of the understory species (a: dwarf shrubs, b: graminoids and c: pteridophytes + herbaceous species) and FCOVERG is the fractional cover of the ground layer species (d: moss and e: lichens) without litter. The fPAR for litter was assumed zero.

2.3.2. fPAR from TRAC

The fPARTRAC was approximated using two sets of measurements: (1) the average above canopy PAR obtained from a Delta sunshine sensor BF3 located on top of the reference tower (PARTOWER), and (2) the below canopy downwelling and upwelling fluxes of PAR obtained with the TRAC as [20]:
fPAR TRAC P A R T O W E R P A R T R A C ( ) P A R T O W E R + ρ G ( P A R T R A C ( ) P A R T O W E R ) ( 1 P A R T R A C ( ) P A R T O W E R )
where P A R T R A C ( ) is the downwelling flux and ρG was calculated as the ratio of the upwelling to the downwelling flux of PAR. Note that fPARTRAC by Equation (6) erroneously includes the fraction of upwards scattered PAR by the forest canopy, which was not measured. The equivalent modeled fraction is i0cPAR), and this quantity was therefore subtracted from fPARTRAC before comparison with the modeled fPARCANOPY (Section 3.1).
The upscaled mean values of forest variables for MODIS fPAR pixels are given in Table 2. Ground reference fPAR values were upscaled by calculating the mean fPAR of all the forest plots in each MODIS fPAR pixel (Figure 1).

2.4. Satellite-Based fPAR

First, two global satellite-based fPAR products with low spatial resolution (1 km × 1 km) data were compared to ground reference fPAR. Secondly, the performance of an NDVI-fPAR relationship [33] was used to estimate fPAR using MODIS (spatial resolution 0.25 km × 0.25 km) and Landsat 8 (spatial resolution 30 m × 30 m) data. The NDVI based approaches were included, because they allowed comparisons of fPAR estimates at different spatial scales. The spatial resolution of the Landsat 8 image corresponds to the small stand size (only 1–2 ha) of Finnish boreal forests.
Table 3. Descriptions of the satellite-based fPAR products.
Product detailsMODISGEOV1
fPAR definition:Green vegetation fPAR,Green vegetation fPAR,
instantaneous black-sky 10:30 AMinstantaneous black-sky ~10:15 AM
Sensor:MODIS TerraSPOT VEGETATION
Algorithm:Inversion of 3D radiative transfer modelTrained neural networks
Input:Top-of-canopy reflectanceTop-of-canopy reflectance
Prior data:Landcover map (MCD12)Fused and scaled CYCLOPES & MODIS
Parameterization:8 biomesGlobal
Spatial resolution:1 km1 km
Temporal resolution:8 days10 days
Composition period:8 days30 days
Statistical method:Maximum70 percentile
Reference:Myneni et al. [34]Baret et al. [35]
Data provider:NASA/Boston universityGeoland2
In this study, we used two global fPAR products: The MODIS fPAR product (MOD15A2, C5) and GEOV1 fPAR product (g2_BIOPAR_FAPAR) (Table 3). In addition, we used a daily MODIS surface reflectance product (MOD09GQ) and a Landsat 8 image (LC81890172013194LGN00) for DOY 194. We decided to use the MODIS surface reflectance product to calculate NDVI instead of directly using the Vegetation Index (VI) based product (MOD13), because the VI product has a relatively long (minimum of 16 days) composition period whereas the surface reflectance product is available more frequently. All fPAR products were based on satellite acquisitions from mid-June to mid-August (DOY: 164–228), which is referred to as the “peak-season” because vegetation was fully developed based on phenological observations (MetINFO, [36]). We used acquisitions obtained around noon.

2.4.1. MODIS and GEOV1 fPAR Products

We will compare two fPAR products, which are based on, at least partly, the same satellite data. This enables us to compare the performance of two different retrieval approaches.
As described in Knyazikhin et al. [33] and Myneni et al. [34], the MODIS fPAR retrieval is based on a radiative transfer model in which MODIS surface reflectances in red and NIR bands (MOD09/MYD09) are used with the land cover classification based on vegetation structure (MCD12Q1) to create a Look-Up Table (LUT) of biome specific canopy realizations. The retrieval uses a LUT approach where the observed and modeled canopy radiances for a suite of canopy structure and soil patterns (C5 has a total of 8 biomes) are compared (Table 3). If the main algorithm fails, a back-up algorithm, which is based on NDVI, is applied. The 8-day fPAR (MOD15A2) is composited from the respective daily candidates by selecting the maximum fPAR within the 8-day period to be included in the output file. We used only pixels, which were classified as good quality according to quality flags provided with the MODIS fPAR products. The MODIS fPAR product is in the following referred to as fPARMODIS.
The MODIS fPAR algorithm can be run using data from Terra or Aqua sensors or based on a combined dataset (MCD15A2, data from Terra and Aqua sensors). For the combined MODIS MCD product, the good quality data from Terra in our study comprised 25% of the peak-season pixels whereas the good quality data from Aqua amounted to only 14%. The difference in the sun zenith angle for Terra and Aqua overpasses was in the order of 10 degrees. We show data from Terra instead of the combined product because GEOV1 fPAR is acquired at the same time (after 10 am) and its development has partly been based on data from the MODIS Terra sensor. In addition, the earlier satellite overpass time of Terra resulted in a larger number of successful retrievals (because in the morning the sky may be less cloudy), and the image acquisition time is more similar to Landsat 8, which also favors the use of data from only Terra.
The GEOV1 fPAR product is fused and scaled from other global fPAR products (CYCLOPES, MODIS) [35]. The main advantage of the GEOV1 fPAR algorithm is that the MODIS land cover product is only implicitly used in training the neural networks, and thus, the effect of biome classification, which may introduce some spatial and temporal inconsistencies, is minimized [14]. The GEOV1 fPAR uses neural networks (trained using data from MODIS and CYCLOPES) to estimate fPAR from SPOT-VEGETATION data. The GEOV1 fPAR product is in the following referred to as fPARGEOV1.
The two fPAR products differ in two main aspects: the GEOV1 product is provided every 10 days although the composition period which is used to calculate the fPAR values is 30 days (Table 3), whereas the MODIS products are delivered every 8 days. Another large difference between the two fPAR products is that GEOV1 fPAR product is calculated selecting the 70 percentile of the cumulative fPAR distribution of daily values within the composition period instead of the 8-day maximum fPAR (as MODIS does).

2.4.2. NDVI Based fPAR Estimation

We chose the NDVI because it is claimed to be better correlated with fPAR than other vegetation indices (e.g., [37]) and allows comparisons between different spatial scales. Two sets of NDVI values were calculated using the daily surface reflectance product (MOD09GQ) and a Landsat 8 image (LC81890172013194LGN00) for DOY 194, because for both good quality data were available for that day. The NDVI maps were transformed into fPAR using Equation (7), which was obtained by us in this study fitting a polynomial function (R2 = 0.99) to MODIS NDVI-fPAR values for biome number 6 for needleleaf trees [33] (Table 2 and Table 3, p.49):
f P A R = 3.0989 N D V I 3 + 5.0182 N D V I 2 1.1929 N D V I + 0.1915
The MODIS NDVI-fPAR relationship has been calibrated using the same radiative transfer model that is used for calculating fPARMODIS. Later MODIS surface reflectance based fPAR is referred to as fPARMOD09GQ and Landsat 8 image based fPAR to as fPARLANDSAT.
The MODIS surface reflectance product is provided in an atmospherically corrected format, so no additional corrections were made. The Landsat 8 image, on the other hand, was corrected for atmospheric effect using the Dark Object Subtraction (DOS) method using a lake located next to the study area. The scene center time was 09:37 am. The Landsat 8 image was filtered using a traversing 3 × 3 filter to smoothen the raster cell values. The raster cell values were extracted to plots and the plot values were averaged for the MODIS 1 km × 1 km pixels. All fPAR variables used in this study are listed in Table 4.
Table 4. Description of the fPAR variables.
AbbreviationDefinitionReference
Ground-based:
fPARTRACMeasured ground-based fPAR using TRACLeblanc et al. [25]
fPARCANOPYModeled ground reference fPAR for the tree canopyStenberg et al. [19], Majasalmi et al. [20]
fPARUSTORYModeled ground reference fPAR for the green understory and ground layerPicket-Heaps et al. [6]
fPARTOTALGround reference fPAR (fPARCANOPY + fPARUSTORY)
Satellite-based:
fPARMODISMODIS LAI/fPAR product (MOD15A2)Knyazikhin et al. [33], Myneni et al. [34]
fPARGEOV1GEOV1 fPAR product (BioPar FAPAR)Baret et al. [35]
fPARMOD09GQfPAR calculated using MODIS surface reflectance product (MOD09GQ) and NDVI-fPAR relationshipKnyazikhin et al. [33]
fPARLANDSATfPAR calculated using Landsat 8 image and NDVI-fPAR relationshipKnyazikhin et al. [33]

3. Results

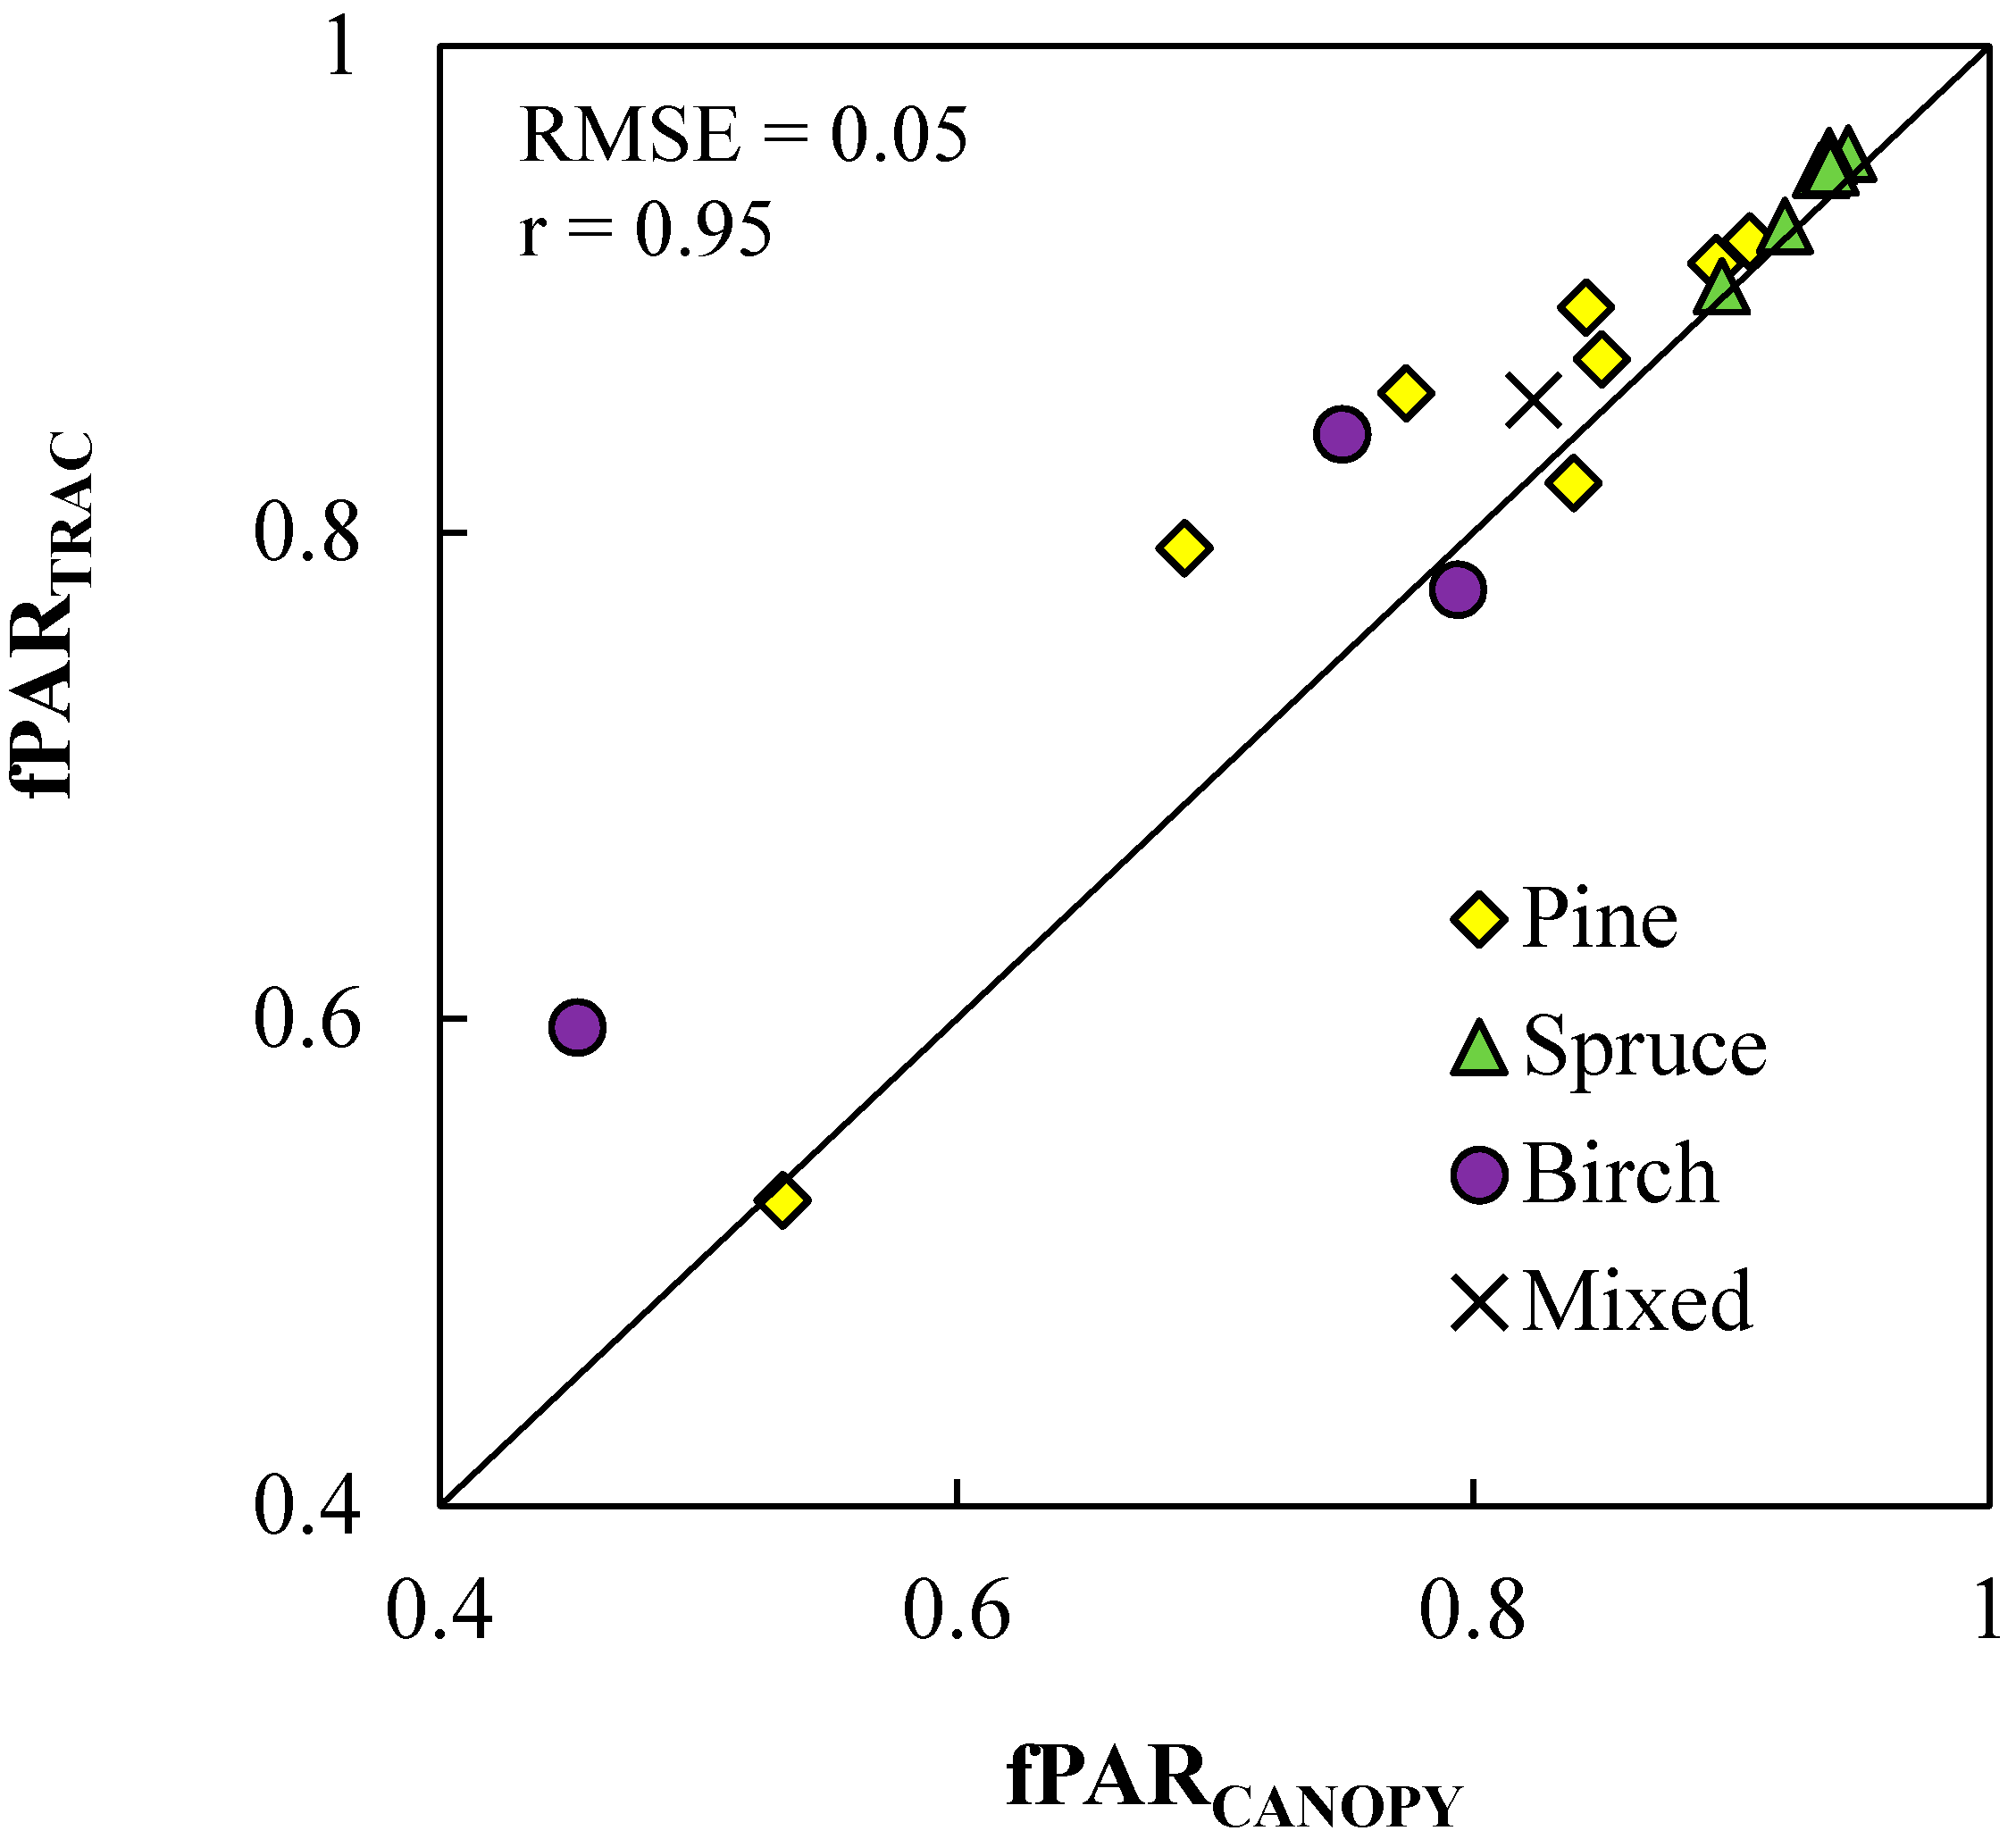
3.1. Comparison of Ground-Based Methods for fPAR

First, we compared the measured and modeled values of tree canopy fPAR, which was later used to validate the satellite-based fPAR products together with a separate model for understory fPAR. The modeled fPARCANOPY correlated well with fPARTRAC (r = 0.95) but was almost systematically smaller (Figure 2). In the spruce stands, fPARCANOPY was the largest and varied the least. Pine and birch dominated stands, on the other hand, showed more variation in fPARCANOPY. The birch-dominated outlier (with fPARCANOPY = 0.45 and fPARTRAC = 0.60) is a juvenile stand (median tree height only 5 m), and the underestimation of fPARCANOPY may have been caused by the measurement height (1.6 m ≈ 20% of median tree height) of the LAI-2000, possibly leaving out part of the canopy. Some uncertainty in fPARTRAC might also be attributed to the variable sky conditions prevailing in this plot during the measurements.
Figure 2. Comparison of modeled (fPARCANOPY) and measured (fPARTRAC) ground-based estimates of fPAR.
Remotesensing 07 01359 g002

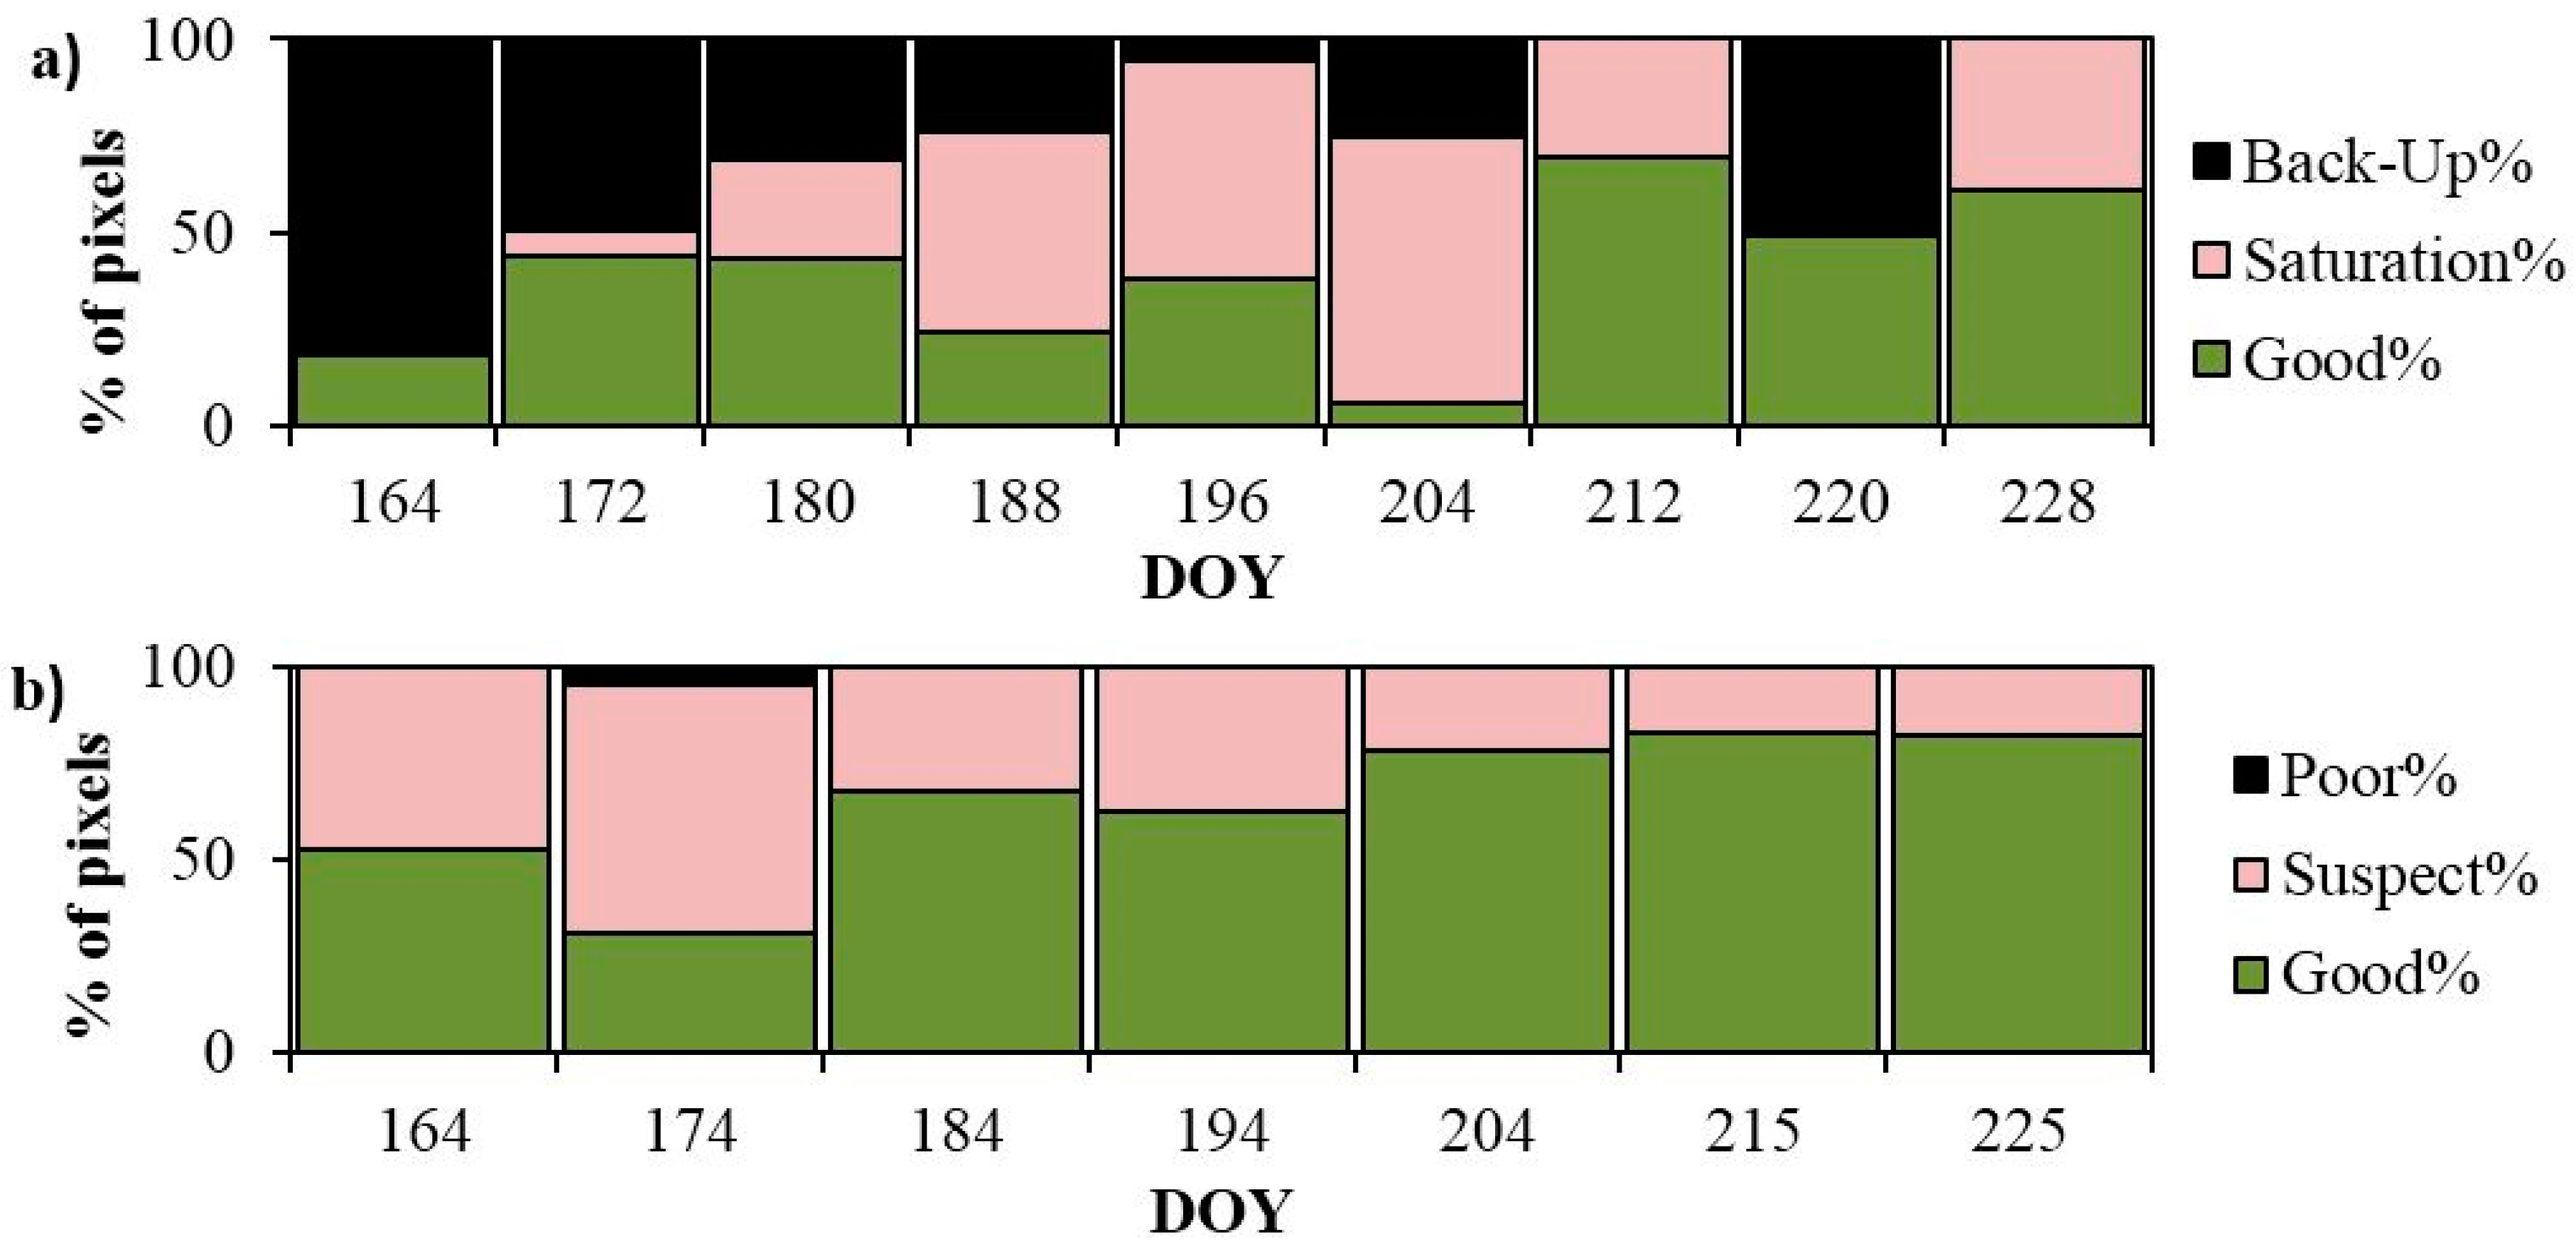
3.2. Quality Analysis of Satellite-Based fPAR Products

We investigated the temporal courses of the quality layer information of the fPARMODIS and fPARGEOV1 composites over the peak-season (DOYs 164–228). For fPARMODIS, the good quality retrieval percentage for the 16 pixels varied between 6% and 70%, and the saturation percentage between 0 (= no saturation) and 69% (Figure 3a). The percentage of back-up algorithm retrievals varied from 0 to 82%. For fPARGEOV1, the good quality retrieval percentage varied between 31% and 83%, and the range of second quality pixels (labelled as “Suspect%”, and corresponding to MODIS “Saturation%”) varied between 17% and 64% (Figure 3b), relatively similarly as for fPARMODIS. In the fPARGEOV1 data set, poor quality pixels occurred only once during the peak-season on DOY 174. Based on quality layer information, the most reliable satellite-based estimates of fPAR were acquired in the second half of the peak-season (DOYs ~ 212–228) (Figure 3).
Next, MODIS fPAR pixels were classified into three classes according to dominating tree species (>50% Pine, >50% Spruce, else Mixed forest) in order to investigate the temporal course of fPAR over differently structured forests. The temporal variation in fPARMODIS was of similar magnitude for all species groups and much larger than that of fPARGEOV1, which showed a smooth temporal course (Figure 4). The within-composite standard deviation for fPAR is provided with the fPARMODIS and fPARGEOV1 products and ranged from 0.04 for fPARGEOV1 and 0.03 for fPARMODIS to 0.12 for both products. The average standard deviation was 0.07 for fPARMODIS and 0.08 for fPARGEOV1. The drops in fPARMODIS values at DOYs 180, 188 and 220 (Figure 4), which occurred for all groups, can only be partly explained by small sample size (see Figure 3). Quality assurance information provided with the MODIS fPAR product was used to explain some of the variability observed within the fPARMODIS values. According to the quality assurance information significant clouds were present in one pixel at DOY 180, but the sky was “clear” for six other good quality pixels. At DOY 164 two pixels out of three had “mixed cloud present in pixel”. One pixel had “mixed cloud present in pixel” at DOY 212 and 220 composites, but most (DOY 212: 10/11 and 220: 7/8) of the good quality pixels were classified clear. Based on quality assurance information all the pixels were classified as “Main retrieval method used, best result possible (no saturation)”, which is why we cannot explain the observed anomalies. A similar drop did not occur in fPARGEOV1 values (Figure 4b).
Figure 3. Quality layer information averaged over the 16 MODIS pixels for (a) fPARMODIS (b) fPARGEOV1 over the peak-season (DOY = Day Of Year).
Remotesensing 07 01359 g003
Figure 4. Temporal variation of MODIS and GEOV1 fPAR values. (a) fPARMODIS. (b) fPARGEOV1. Symbols show the group mean value according to dominating tree species and error bars show the group mean within-composite standard deviation.
Remotesensing 07 01359 g004aRemotesensing 07 01359 g004b

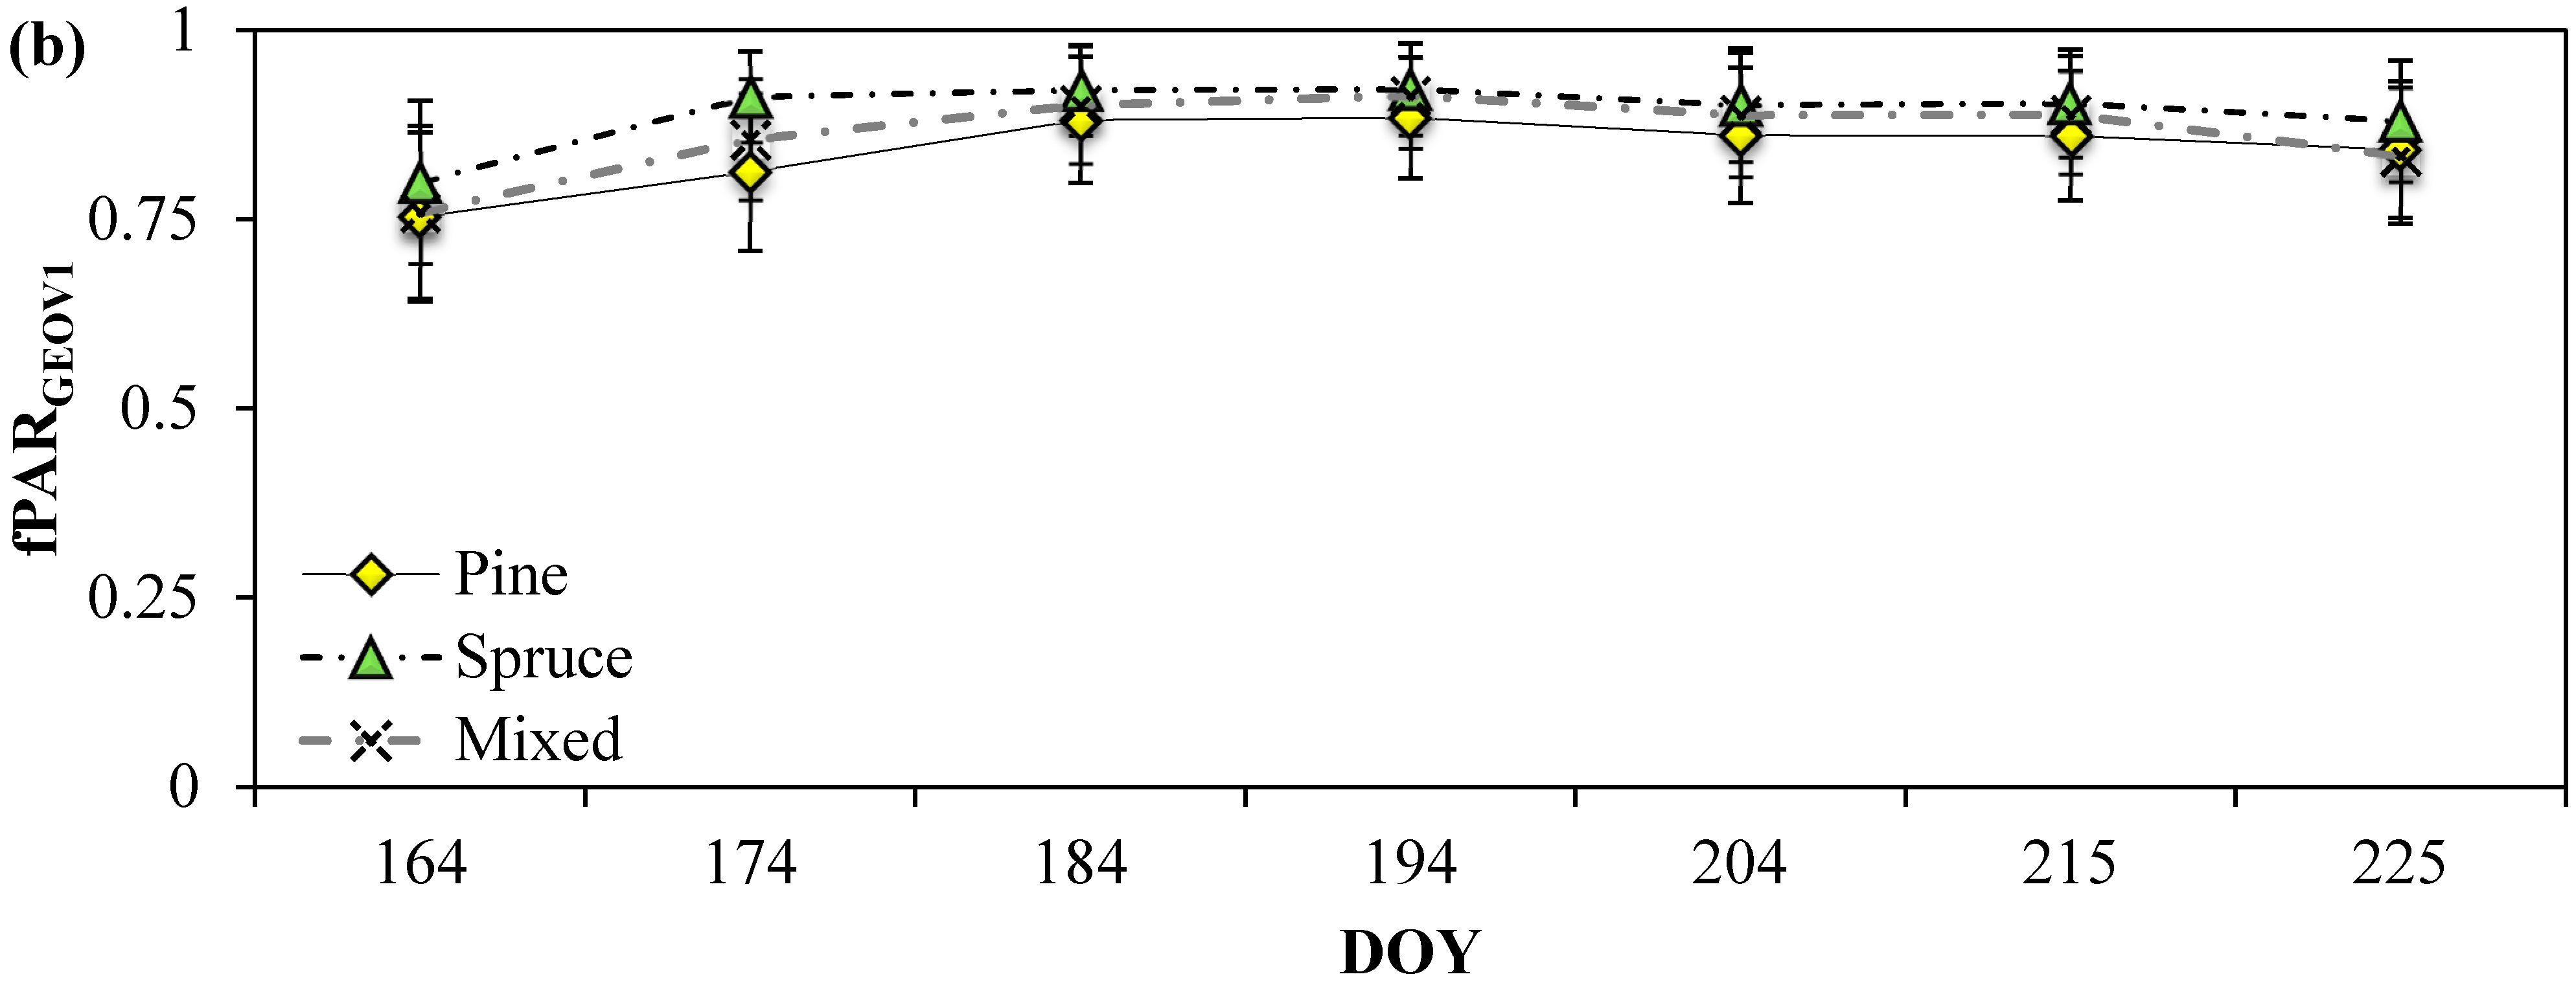
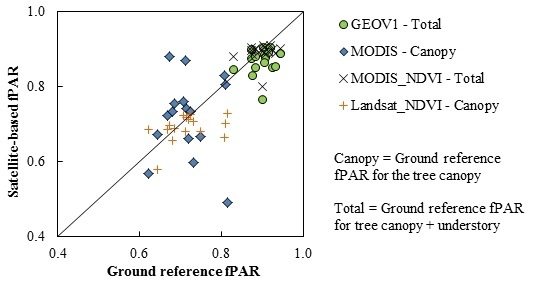
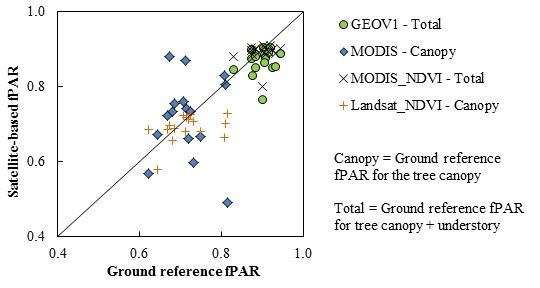
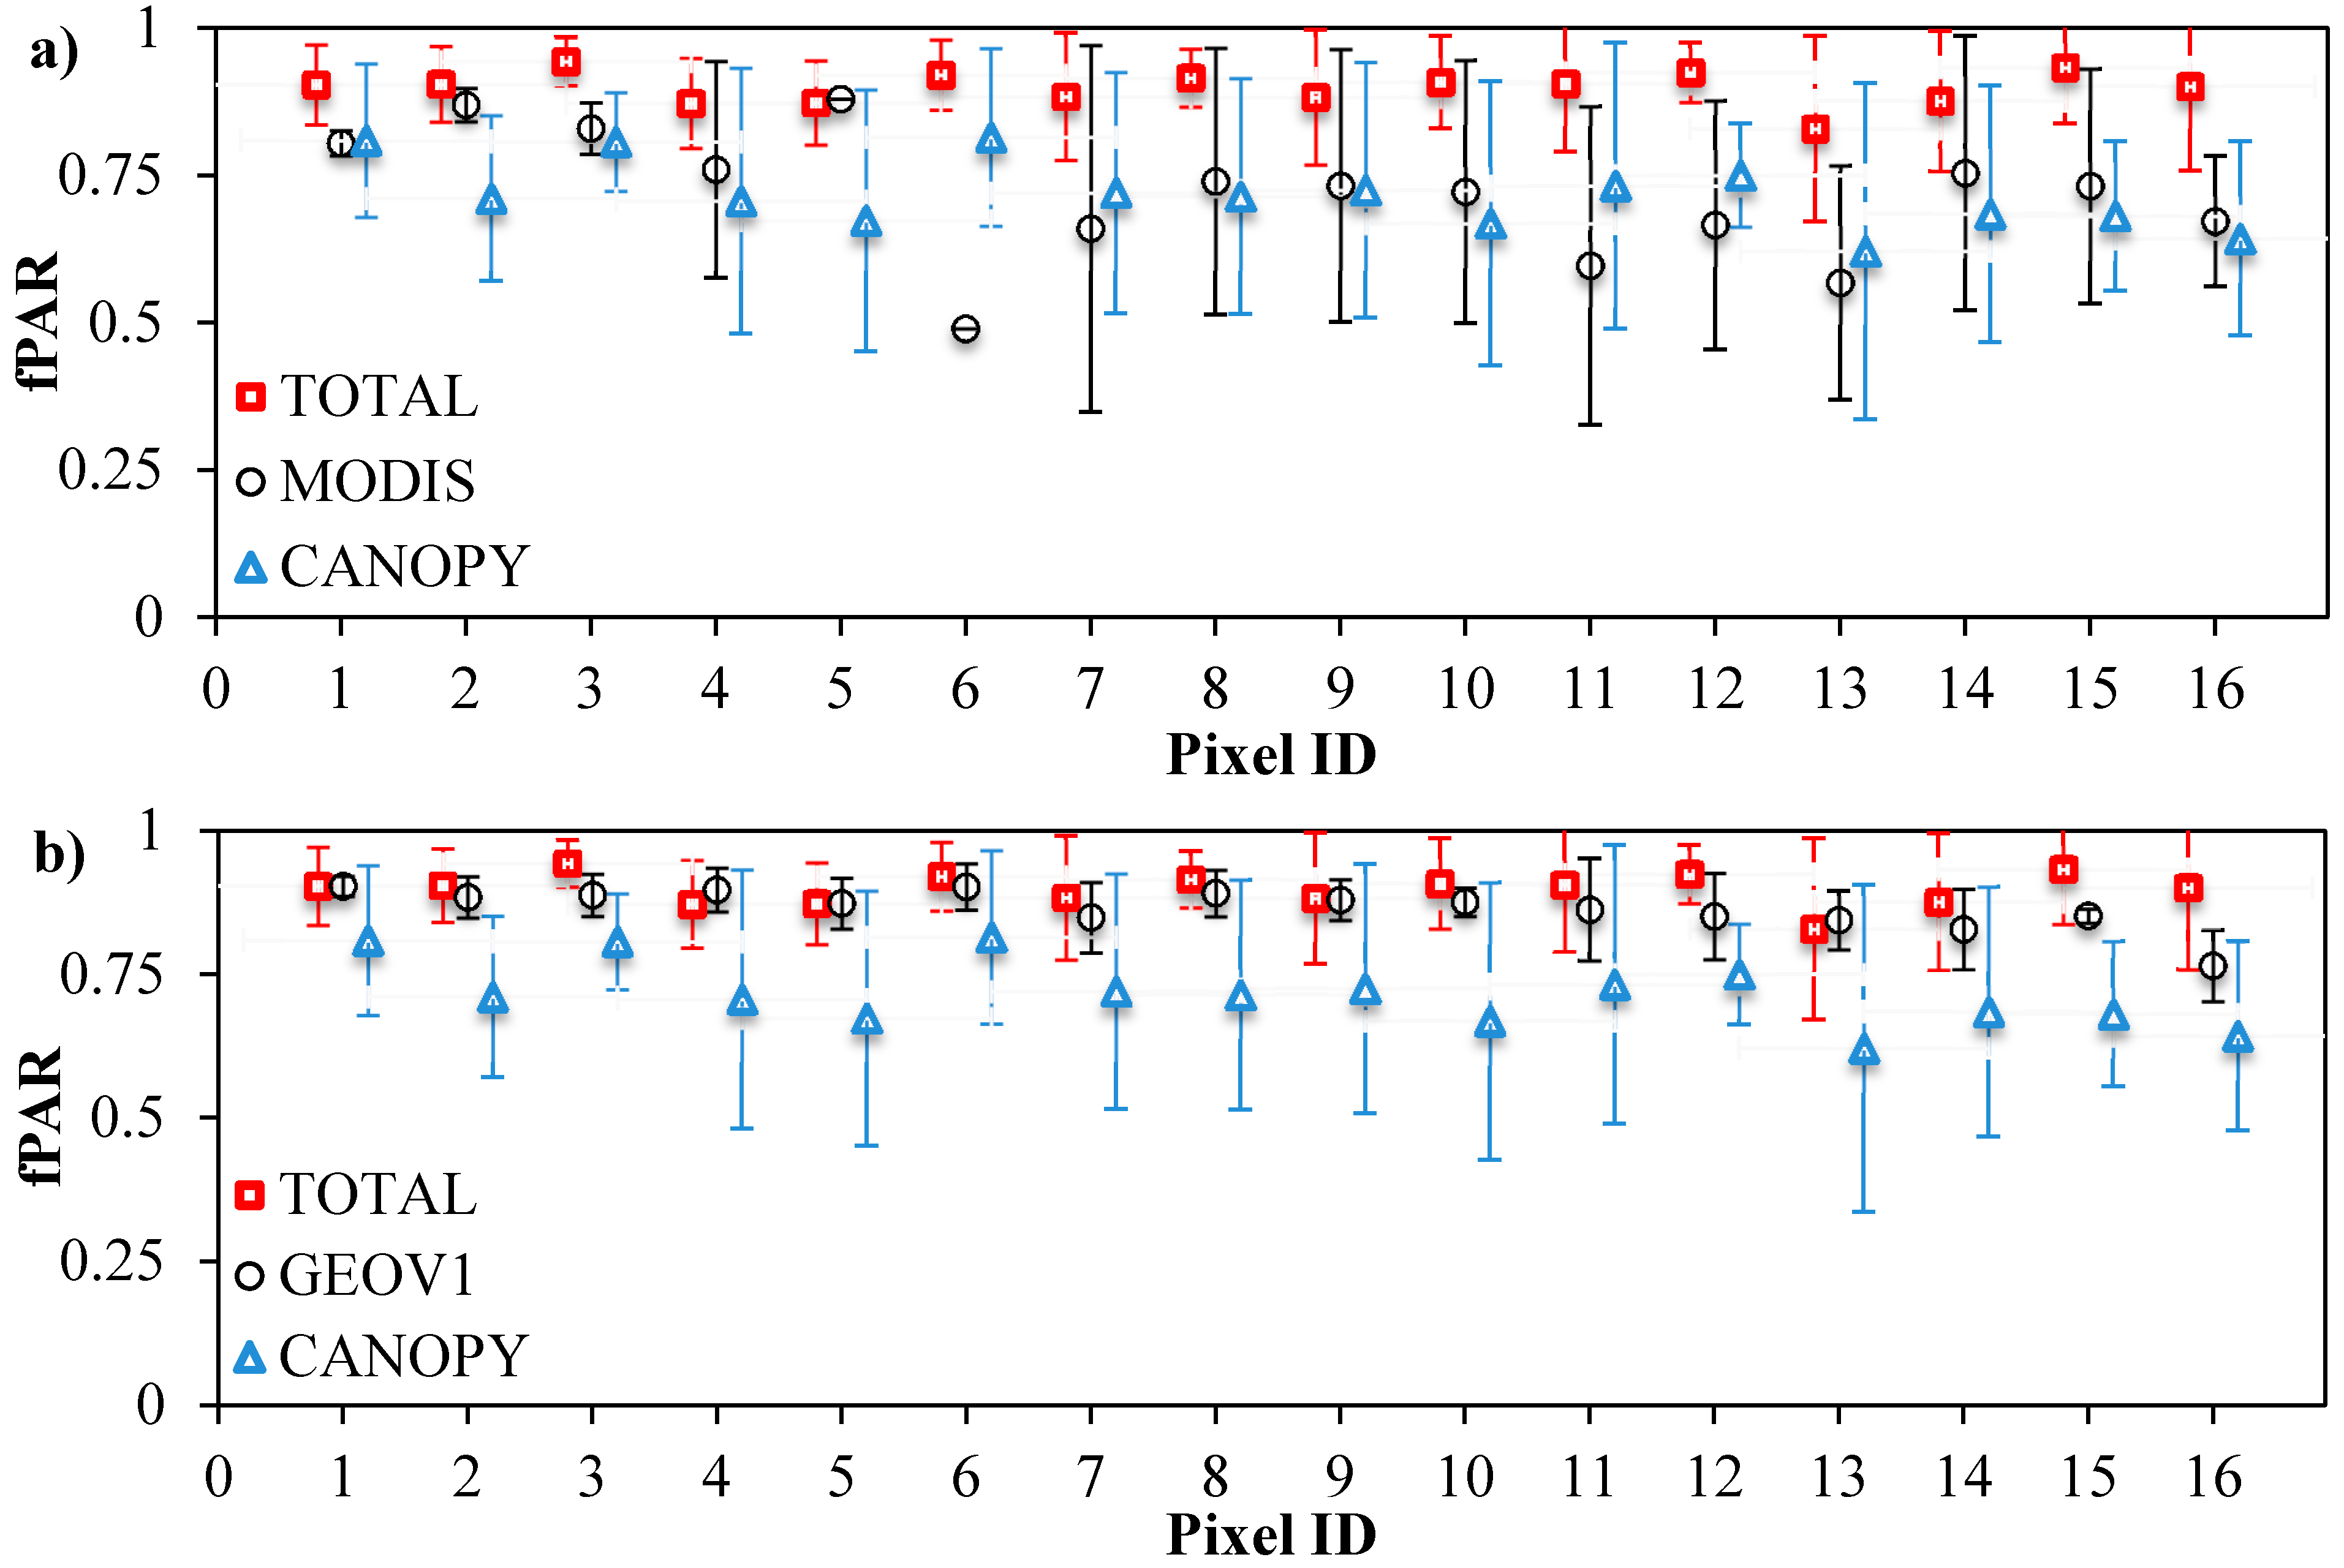
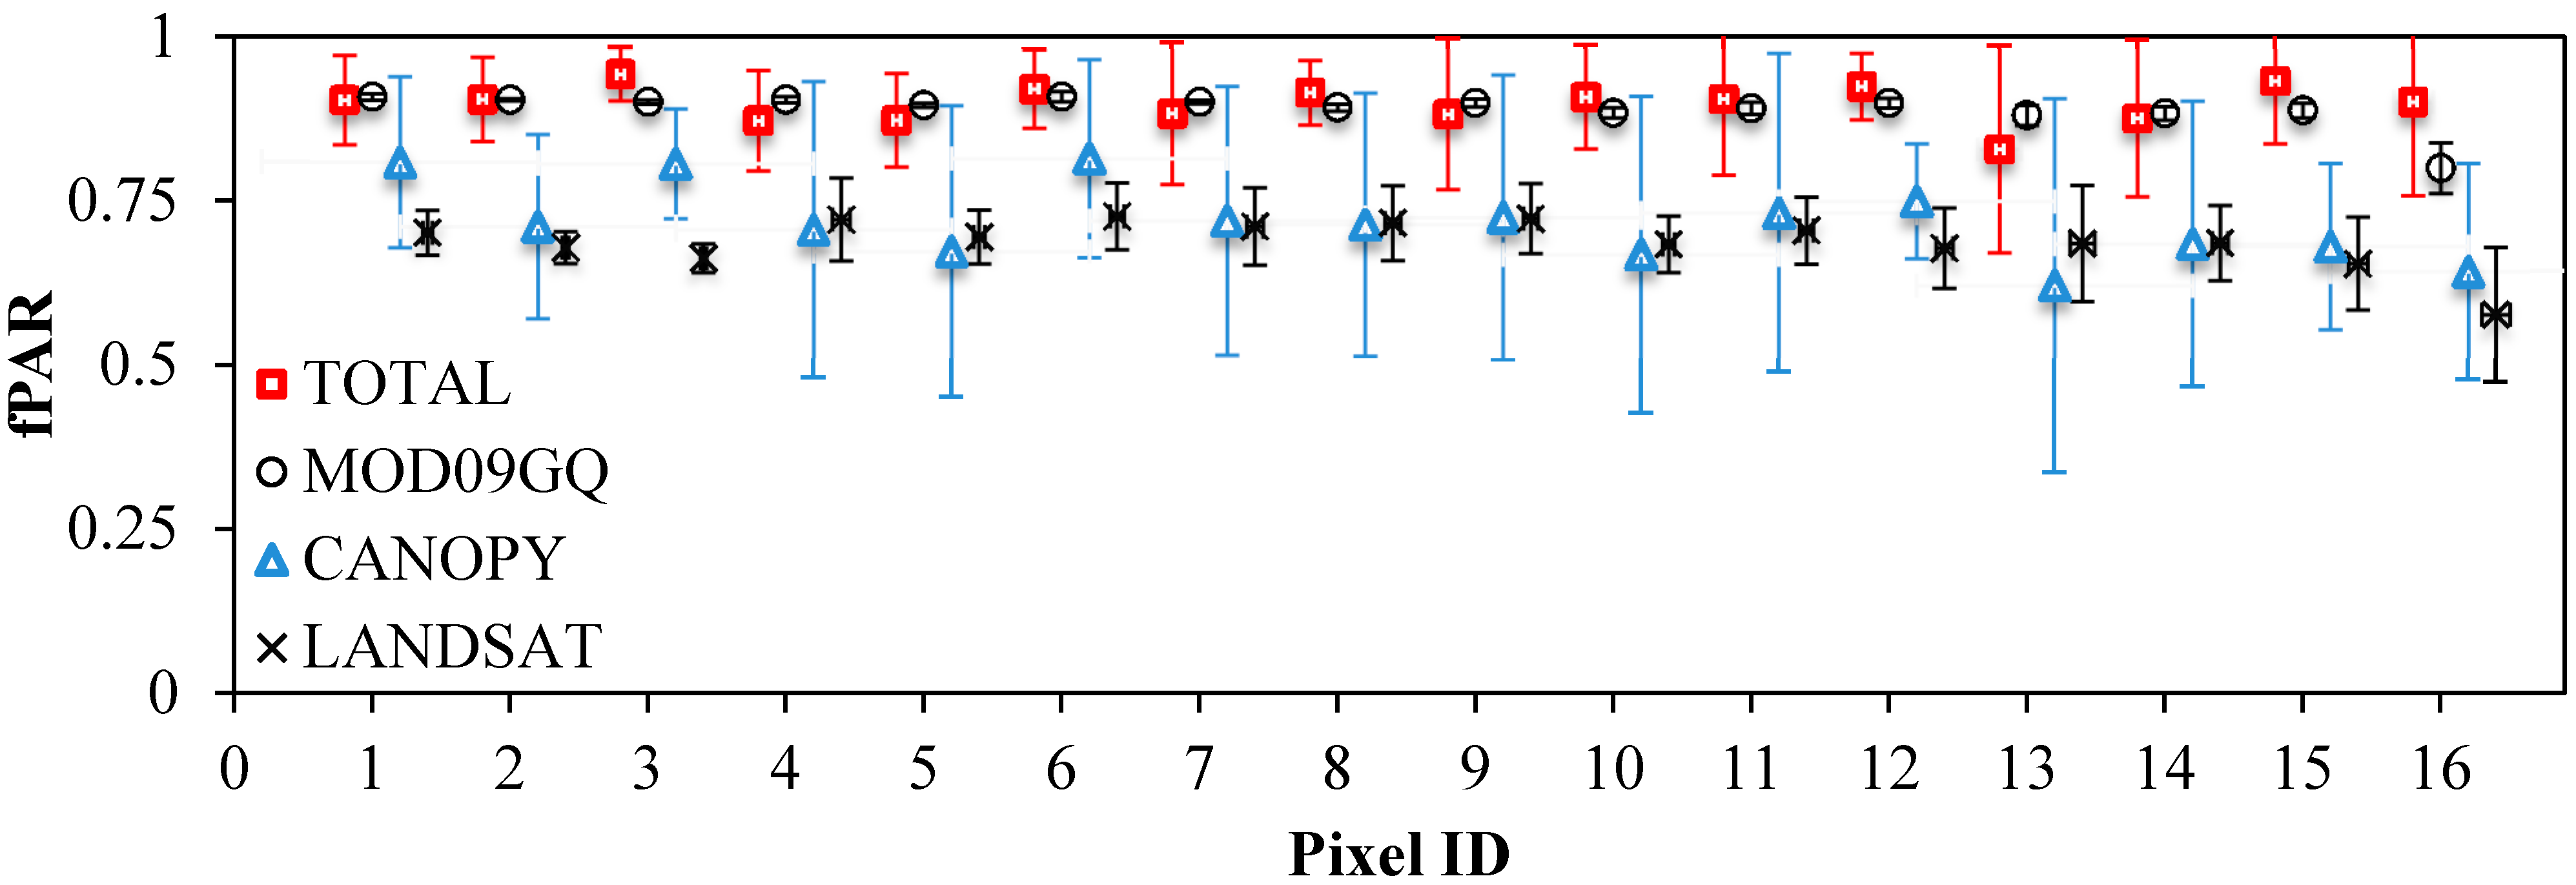
3.3. Validation of fPAR Products

We investigated the spatial variation and temporal courses of the peak-season (DOYs 164–228) fPARMODIS and fPARGEOV1 composites (Figure 5). Only pixels that were classified as good quality were included. fPARMODIS values were small compared to ground reference fPAR values: The mean peak-season fPARMODIS was 0.72 (mean standard deviation = 0.16). The ground reference average fPARTOTAL was 0.90 (standard deviation = 0.10) and fPARCANOPY was 0.72 (standard deviation = 0.19) (Figure 5a). Based on the RMSE, fPARMODIS was more similar to fPARCANOPY (RMSE = 0.12, r = 0.00) than to fPARTOTAL (RMSE = 0.21, r = 0.11). There was relatively large composite-to-composite variation in fPARMODIS values for the 16 MODIS pixels during the peak-season, and for two fPARMODIS pixels (pixels 5 and 6) only one good quality retrieval during the peak-season was available.
fPARGEOV1 values demonstrated much less spatial variation than fPARMODIS values (Figure 5b). The range of peak-season fPARGEOV1 values (minimum fPAR = 0.64, maximum fPAR= 0.94) was smaller than the range of fPARMODIS values (minimum fPAR = 0.29, maximum fPAR = 0.90). The mean peak-season fPARGEOV1 was 0.87 and the mean standard deviation of fPARGEOV1 values was only one third (average standard deviation 0.05 fPAR units) of that of fPARMODIS values. The difference between fPARGEOV1 and fPARTOTAL (RMSE = 0.05) was smaller than between fPARGEOV1 and fPARCANOPY (RMSE = 0.16), but the correlation between fPARGEOV1 and fPARCANOPY was higher (r = 0.62) than between fPARGEOV1 and fPARTOTAL (r = 0.19). Note also that fPARGEOV1 had a larger number of good quality pixels than fPARMODIS and the standard deviations were smaller than fPARMODIS. In general, ground reference total fPAR values were more similar to fPARGEOV1 than fPARMODIS values, and the fPARGEOV1 values were on average 0.15 fPAR units larger than fPARMODIS.
Figure 5. Validation of satellite-based fPAR by 1 km × 1 km MODIS fPAR pixels (X-axis): (a) fPARMODIS and (b) fPARGEOV1. The symbols show the mean fPAR for each pixel during the peak-season (DOYs 164–228) and the error bars describe the composite-to-composite (“temporal”) standard deviation of the peak-season fPAR. The ground reference fPAR values correspond to DOY 187. Ground-based “TOTAL” fPAR is the sum of forest canopy fPAR (“CANOPY”) and understory fPAR, and the error bars show the (“spatial”) standard deviation of the ground reference fPAR values within the 1 km × 1 km fPAR pixels.
Remotesensing 07 01359 g005
Next, we compared the NDVI based fPAR estimates with ground-based estimates of fPAR at DOY 194. This date was selected because we had field measurements from both sides of that date, and a good quality MODIS surface reflectance product and Landsat 8 image and available for DOY 194. The mean NDVI for the study area calculated from the MODIS surface reflectance product was 0.84 and the standard deviation between the 16 MODIS pixels was 0.03. Landsat NDVIs were smaller than MODIS NDVI (the mean NDVI = 0.65), but had the same standard deviation as MODIS.
MODIS NDVI based fPAR (fPARMOD09GQ) was on average 0.89, and was on average 0.01 fPAR units smaller than the ground reference fPARTOTAL (Figure 6). fPARMOD09GQ was more similar to fPARTOTAL (RMSE = 0.04, r = 0.09) than to fPARCANOPY (RMSE = 0.18, r = 0.57). fPARLANDSAT values were on average 0.21 fPAR units smaller than fPARTOTAL (RMSE = 0.22, r = −0.20) and 0.03 units smaller than fPARCANOPY values (RMSE = 0.06, r = 0.39). The mean of fPARLANDSAT pixel values was 0.69 (standard deviation 0.06). Thus, fPARLANDSAT values were closer to fPARCANOPY than to fPARTOTAL.
Figure 6. Validation of NDVI-fPAR relationship using a MODIS surface reflectance product (“MOD09GQ”, 0.25 km × 0.25 km) and a Landsat 8 image (“LANDSAT”, 0.09 km × 0.09 km) for DOY 194. The ground reference fPAR values correspond to DOY 187. Results are averaged for the MODIS 1 km × 1 km pixels and the error bars show the standard deviations of ground and satellite-based fPAR values for the 1 km × 1 km fPAR pixels.
Remotesensing 07 01359 g006

4. Discussion

The aim of this paper was to compare and validate currently available satellite-based methods to estimate peak-season (from mid-June to mid-August) fPAR in a boreal forest. First, we compared the measured and modeled in situ fPAR for forest canopy fPAR. The modeled and measured canopy fPAR agreed fairly well (RMSE = 0.05, r = 0.95), but the modeled fPARCANOPY was almost systematically smaller. Underestimation of fPARCANOPY may have occurred due to the 1 m difference in measurement heights of the LAI-2000 and TRAC devices, especially in the juvenile stands. In the plot with the largest discrepancy between fPARCANOPY and fPARTRAC the unstable sky conditions during the TRAC measurements may also have played a role.
The fact that fPARTOTAL varied less than fPARCANOPY for the study area indicates that the understory layer develops concurrently with the forest canopy layer by adapting its structure in accordance with the prevailing light conditions. Our results also highlight the important role of understory species in forming the fPARTOTAL of a forest. Including the understory vegetation into the estimates of forest canopy fPAR improved the fit between ground and satellite-based fPAR for fPARGEOV1 and fPARMOD09GQ and produced the smallest RMSEs among all comparisons. Unlike the case with fPARMODIS in this study, Serbin et al. [15] noted that taking understory vegetation into account, while validating the same MODIS fPAR product, yielded better agreement between ground and satellite-based values of fPAR. Also Iwata et al. [9] reported that stand level fPAR increased on average by 0.1 fPAR units as the contribution of the moss layer to total fPAR was taken into account. In this study, a larger contribution of understory and ground layer species to the total fPAR was observed because in addition to moss, our stands also comprised other understory species (e.g., dwarf shrubs, pteridophytes and herbaceous species, and graminoids). In the MODIS pixels of our study, fPARUSTORY ranged from 0.09 to 0.26, being on average 0.18.
fPARGEOV1 is a relatively new global product, and so far, only few intercomparison studies have been carried out for it. fPARMODIS, on the other hand, has been investigated intensively during the last decade, and for that reason is commonly used as a benchmark for other satellite-based fPAR products. Based on this study, fPARGEOV1 provided good quality estimates for two thirds of the pixels in each composition period and demonstrated improved performance compared to fPARMODIS. fPARGEOV1 has previously been found to produce systematically larger fPAR estimates than fPARMODIS (C5) for coniferous forests (the difference in RMSE ~0.13) [14]. In this study, a slightly larger difference in RMSEs (= 0.16) between the fPARGEOV1 and fPARMODIS products was observed. fPARGEOV1 was designed to have improved temporal continuity compared to earlier satellite-based fPAR products, and based on the results shown in this study the product managed to fulfil this goal. However, as the fPARGEOV1 composition procedure is based on using the 70-percentile fPAR of the composition period instead of the maximum fPAR (as the fPARMODIS algorithm does), it may be less sensitive to fast changes in vegetation cover. Nevertheless, in areas where little variation in short periods of time is usually expected (as in European boreal forests due to slow growing and long-living coniferous trees), fPARGEOV1 seems to be a suitable option for monitoring forests.
To highlight the uniqueness of our ground reference data and our results, we shortly discuss the limitations of the ground reference data that is currently available from boreal forests in, for example, Finland. We downloaded the ground reference fPAR estimates using the new On Line Interactive Validation Exercise (OLIVE) platform [13,38]. Although there are four ground reference sites (called “DIRECT”, site numbers: 12, 62, 72 and 81) in Finland, good quality data are lacking: the data are measured outside the growing season (Hyytiälä, DIRECT 81), there is no fPAR data available (Ruokolahti, DIRECT 12), the fPAR is unusually low (Hirsikangas, DIRECT 62) or the data are not representative of typical forest structures (Rovaniemi, DIRECT 72). In addition, the data describing Finnish boreal forests is old (acquired 10–15 years ago), and thus, may not be used to validate new satellite-based products in the 2010’s due to e.g., intensive forest management operations.
The biome classification used by the MODIS fPAR algorithm is similar to the CORINE land cover classification. Only five of our forest plots were classified as water (located in MODIS fPAR pixel number 1) and nine were classified as savannah (located in MODIS fPAR pixel 15) according to the MODIS land cover classification (MCD12Q1, type 3, LAI/fPAR). A similar observation has also been reported previously: Iwata et al. [9] noted that the MODIS land cover classified burned black spruce stands as evergreen coniferous forests, and that the incorrect LUT used for fPAR inversion explained the observed large discrepancies between MODIS fPAR and field measurements. In this study, the number of plots classified as evergreen coniferous forest was 249, deciduous broadleaved forest 44 (pixels: 4, 7, 8, 9, 14), savannah 5 (pixel 15), and water 9 (pixel 1) (Note, the land cover classification used by the MODIS fPAR algorithm has spatial resolution of 0.25 km, instead of 1 km). We noticed, however, that the misclassification of MODIS land cover did not cause any apparent shifts in fPAR values as compared to fPAR values obtained based on correct land cover classification. The reason for this is that the MODIS fPAR values for water (0.79 (DOY 172) and 0.82 (DOY 212)) and savannah (0.79 (DOY 172), 0.38 (DOY 180), 0.85 (DOY 196), 0.82 (DOY 212), 0.84 (DOY 228) were similar to MODIS fPAR for plots classified as forest.
Although NDVI is relatively insensitive to the changes in boreal forest foliage biomass, due to saturation of the signal at high LAI values [39], it may potentially be used to quantify boreal forest fPAR. Olofsson and Eklundh [7] also noted a linear relationship between daily NDVI and fPAR (R2 = 0.82) and concluded that seasonally adjusted NDVI may be used to estimate fPAR over forested areas in Scandinavia. Based on our study, the MODIS NDVI-fPAR relationship is applicable also in Finland during the peak-season whenever good quality NDVI data are available. The standard deviation of MODIS NDVI values between the MODIS fPAR pixels was only 0.03 NDVI units.
fPARLANDSAT and fPARMODIS values were more similar to fPARCANOPY than to fPARTOTAL whereas fPARGEOV1 and fPARMOD09GQ agreed better with fPARTOTAL. Although we cannot explain why fPARMODIS and fPARLANDSAT corresponded better with fPARCANOPY, the result is promising from the perspective of predicting forest growth and productivity, which use the radiation absorbed by the tree canopy as input. However, to produce separate estimates of the total and forest canopy fPAR, fine spatial resolution data and multiangular satellite measurements are needed in order to separate the amount of radiation reflected by the understory from total forest reflectance [40]. Higher spatial resolution fPAR products are also required to improve existing models for net primary productivity [41]. At present, a new global LAI product, based on medium spatial resolution Landsat data, is being prepared by NASA [42], and thus, a fine spatial resolution fPAR product could also be developed. In addition, platforms such as OLIVE [13] could be expanded to cover also finer spatial resolution satellite data, which would allow more sites with measurements to validate the satellite-based fPAR products.

5. Conclusions

For our boreal study site, the ground reference total fPAR (i.e., canopy + understory fPAR) agreed better with GEOV1 fPAR than with MODIS fPAR, which showed much more temporal variation during the peak-season (i.e., from mid-June to mid-August) than GEOV1 fPAR. At the chosen intercomparison date in peak growing season, MODIS NDVI based fPAR estimates were similar to GEOV1 fPAR, and produced on average 0.01 fPAR units smaller fPAR estimates than ground reference total fPAR. MODIS fPAR and Landsat 8 NDVI based fPAR estimates were, in contrast, similar to forest canopy fPAR.

Acknowledgments

The authors thank Petr Lukeš for scientific collaboration, and Bruno Smets and Tim Jakobs for helping with the Geoland products. We also thank Anni-Sofia Hoppi and Johanna Karjalainen for collecting forest inventory data. This study was funded by the Academy of Finland.
The MODIS fPAR (MOD15A2, MCD15A2), Surface reflectance product (MOD09GQ ), and Land cover (MCD12Q1), and Landsat (LC81890172013194LGN00.tar.gz), data products were obtained through the online Data Pool at the NASA Land Processes Distributed Active Archive Center (LP DAAC), USGS/Earth Resources Observation and Science (EROS) Center, Sioux Falls, South Dakota (https://lpdaac.usgs.gov/data_access). Landsat 8 data available from the U.S. Geological Survey. GEOV1 fPAR products (g2_BIOPAR_FAPAR) were obtained through Geoland 2 expert portal:http://www.geoland2.eu/portal/order/PrepareOperation.do?serviceId=BB808F80&operation=Search. The product was generated by the land service of Copernicus, the Earth Observation program of the European Commission. The research leading to the current version of the product has received funding from various European Commission Research and Technical Development programs. The product is provided by VITO and based on VEGETATION data ((c) CNES). Spectral data for Pine spruce and birch may be downloaded from the SPECCHIO Online Spectral Database: http://specchio.ch/campaign_overview.php.

Author Contributions

Titta Majasalmi is the principal author of this manuscript and contributed at all stages: planned and did the field work, analyzed the data and wrote majority of the manuscript. Miina Rautiainen, Pauline Stenberg and Terhikki Manninen participated in writing the manuscript.

Conflicts of Interest

The authors declare no conflicts of interest. The founding sponsors had no role in the design of the study; in the collection, analyses, or interpretation of data; in the writing of the manuscript, and in the decision to publish the results.

References

  1. Global Climate Observing System (GCOS). Update on Progress Made by Space Agencies Involved in Global Observations in Their Coordinated Response to Relevant Needs of the Global Climate Observing System and the Convention. Available online: http://www.wmo.int/pages/prog/gcos/documents/SBSTA37_misc14_CEOS.pdf (accessed on 3 December 2014).
  2. Monteith, J.L. Solar radiation and productivity in tropical ecosystems. J. Appl. Ecol. 1972, 9, 747–766. [Google Scholar] [CrossRef]
  3. Rouse, J.W.; Haas, R.H.; Schell, J.A.; Deering, D.W. Monitoring vegetation systems in the Great Plains with ERTS. Technical Presentations. In Third Earth Resources Technology Satellite-1 Symposium; NASA SP-351. NASA: Washington, DC, USA, 1974; pp. 309–317. [Google Scholar]
  4. McCallum, I.; Wagner, W.; Schmullius, C.; Shvidenko, A.; Obersteiner, M.; Fritz, S.; Nilsson, S. Comparison of four global FAPAR datasets over Northern Eurasia for the year 2000. Remote Sens. Environ. 2010, 114, 941–949. [Google Scholar]
  5. D’Odorico, P.; Gonsamo, A.; Pinty, B.; Gobron, N.; Coops, N.; Mendez, E.; Schaepman, M.E. Intercomparison of fraction of absorbed photosynthetically active radiation products derived from satellite data over Europe. Remote Sens. Environ. 2014, 142, 141–154. [Google Scholar] [CrossRef]
  6. Pickett-Heaps, C.; Canadell, J.; Briggs, P.; Gobron, N.; Haverd, V.; Paget, M.; Pinty, B.; Raupach, M. Evaluation of six satellite-derived Fraction of Absorbed Photosynthetic Active Radiation (FAPAR) products across the Australian continent. Remote Sens. Environ. 2014, 140, 241–256. [Google Scholar] [CrossRef]
  7. Olofsson, P.; Eklundh, L. Estimation of absorbed PAR across Scandinavia from satellite measurements. Part II: Modeling and evaluating the fractional absorption. Remote Sens. Environ. 2007, 110, 240–251. [Google Scholar]
  8. Steinberg, D.C.; Goetz, S.J.; Hyer, E.J. Validation of MODIS FPAR products in boreal forests of Alaska. IEEE Trans. Geosci. Remote Sens. 2006, 44, 1818–1828. [Google Scholar] [CrossRef]
  9. Iwata, H.; Ueyama, M.; Iwama, C.; Harazono, Y. A variation in the fraction of absorbed photosynthetically active radiation and a comparison with MODIS data in burned black spruce forests of interior Alaska. Polar Sci. 2013, 7, 113–124. [Google Scholar] [CrossRef]
  10. Martínez, B.; Camacho, F.; Verger, A.; García-Haro, F.J.; Gilabert, M.A. Intercomparison and quality assessment of MERIS, MODIS and SEVIRI FAPAR products over the Iberian Peninsula. Int. J. Appl. Earth Obs. Geoinf. 2013, 21, 463–476. [Google Scholar] [CrossRef]
  11. Steinberg, D.C.; Goetz, S.J. Assessment and extension of the MODIS FPAR products in temperate forests of the eastern United States. Int. J. Remote Sens. 2009, 30, 169–187. [Google Scholar] [CrossRef]
  12. Senna, M.C.; Costa, M.H.; Shimabukuro, Y.E. Fraction of photosynthetically active radiation absorbed by Amazon tropical forest: A comparison of field measurements, modeling, and remote sensing. J. Geophys. Res. 2005, 110. [Google Scholar] [CrossRef]
  13. Weiss, M.; Baret, F.; Block, T.; Koetz, B.; Burini, A.; Scholze, B.; Lecharpentier, P.; Brockmann, C.; Fernandes, R.; Plummer, S.; et al. On Line Validation Exercise (OLIVE): A web based service for the validation of medium resolution land products. Application to FAPAR products. Remote Sens. 2014, 6, 4190–4216. [Google Scholar]
  14. Camacho, F.; Cernicharo, J.; Lacaze, R.; Baret, F.; Weiss, M. GEOV1: LAI, FAPAR essential climate variables and FCOVER global time series capitalizing over existing products. Part 2: Validation and intercomparison with reference products. Remote Sens. Environ. 2013, 137, 310–329. [Google Scholar]
  15. Serbin, S.P.; Ahl, D.E.; Gower, S.T. Spatial and temporal validation of the MODIS LAI and fPAR products across a boreal forest wildfire chronosequence. Remote Sens. Environ. 2013, 133, 71–84. [Google Scholar] [CrossRef]
  16. Combal, B.; Baret, F.; Weiss, M.; Trubuil, A.; Mace, D.; Pragnere, A.; Myneni, R.; Knyazikhin, Y.; Wang, L. Retrieval of canopy biophysical variables from bidirectional reflectance using prior information to solve the ill-posed inverse problem. Remote Sens. Environ. 2003, 84, 1–15. [Google Scholar] [CrossRef]
  17. Gobron, N.; Pinty, B.; Aussedat, O.; Taberner, M.; Faber, O.; Mélin, F.; Levergne, T.; Robustelli, M.; Snoeij, P. Uncertainty estimates for the FAPAR operational products derived from MERIS—Impact of top-of-atmosphere radiance uncertainties and validation with field data. Remote Sens. Environ. 2008, 112, 1871–1883. [Google Scholar] [CrossRef]
  18. Mõttus, M.; Sulev, M.; Baret, F.; Lopez-Lozano, R.; Reinart, A. Photosynthetically active radiation: Measurement and modeling. In Encyclopedia of Sustainability Science and Technology; Meyers, R., Ed.; Springer: New York, NY, USA, 2012; pp. 7900–7932. [Google Scholar]
  19. Stenberg, P.; Lukeš, P.; Rautiainen, M.; Manninen, M. A new approach for simulating forest albedo based on spectral invariants. Remote Sens. Environ. 2013, 137, 12–16. [Google Scholar] [CrossRef]
  20. Majasalmi, T.; Rautiainen, M.; Stenberg, P. Modeled and measured fPAR in a boreal forest: Validation and application of a new model. Agr. Forest Meteorol. 2014, 189–190, 118–124. [Google Scholar]
  21. CORINE Land Cover 2006. Coordination of Information on the Environment. Available online: http://www.eea.europa.eu/publications/COR0-landcover (accessed on 3 December 2014).
  22. Fang, H.; Li, W.; Myneni, R.B. The impact of potential land cover misclassification on MODIS leaf area index (LAI) estimation: A statistical perspective. Remote Sens. 2013, 5, 830–844. [Google Scholar] [CrossRef]
  23. Rautiainen, M.; Mōttus, M.; Heiskanen, J.; Akujärvi, A.; Majasalmi, T.; Stenberg, P. Seasonal reflectance dynamics of common understory types in a northern European boreal forest. Remote Sens. Environ. 2011, 115, 3020–3028. [Google Scholar] [CrossRef]
  24. LI-COR. LAI-2000 Plant Canopy Analyzer: Instruction Manual. Available online: ftp://ftp.licor.com/perm/env/LAI-2000/Manual/LAI-2000_Manual.pdf (accessed on 3 December 2014).
  25. Leblanc, S.G.; Chen, J.M.; Kwong, M. Tracing Radiation and Architecture of Canopies. TRAC Manual. Version 2.1.3. Available online: http://faculty.geog.utoronto.ca/Chen/Chen’s%20homepage/PDFfiles/tracmanu.pdf (accessed on 3 December 2014).
  26. VALERI. Validation of Land European Remote Sensing Instruments. Available online: http://w3.avignon.inra.fr/valeri/ (accessed on 3 December 2014).
  27. Majasalmi, T.; Rautiainen, M.; Stenberg, P.; Rita, H. Optimizing sampling scheme for LAI-2000 measurements in a boreal forest. Agr. Forest Meteorol. 2012, 154–155, 38–43. [Google Scholar]
  28. Smolander, S.; Stenberg, P. Simple parameterizations of the radiation budget of uniform broadleaved and coniferous canopies. Remote Sens. Environ. 2005, 94, 355–363. [Google Scholar] [CrossRef]
  29. Stenberg, P. Simple analytical formula for calculating average photon recollision probability in vegetation canopies. Remote Sens. Environ. 2007, 109, 221–224. [Google Scholar] [CrossRef]
  30. Smolander, S.; Stenberg, P.; Linder, S. Dependence of light interception efficiency of Scots pine shoots on structural parameters. Tree Physiol. 1994, 14, 971–980. [Google Scholar] [CrossRef] [PubMed]
  31. Stenberg, P.; Linder, S.; Smolander, H. Variation in the ratio of shoot silhouette area to needle area in fertilized and nonfertilized Norway spruce trees. Tree Physiol. 1995, 15, 705–712. [Google Scholar] [CrossRef] [PubMed]
  32. Lukeš, P.; Stenberg, P.; Rautiainen, M.; Mõttus, M.; Vanhatalo, K.M. Optical properties of leaves and needles for boreal tree species in Europe. Remote Sens. Lett. 2013, 4, 667–676. [Google Scholar] [CrossRef]
  33. Knyazikhin, Y.; Glassy, J.; Privette, J.L.; Tian, Y.; Lotsch, A.; Zhang, Y.; Wang, Y.; Morisette, J.T.; Votava, P.; Myneni, R.B.; et al. MODIS Leaf Area Index (LAI) and Fraction of Photosynthetically Active Radiation Absorbed by Vegetation (FPAR) Product (MOD15) Algorithm, Theoretical Basis Document. Available online: http://modis.gsfc.nasa.gov/data/atbd/atbd_mod15.pdf (accessed on 3 December 2014).
  34. Myneni, R.B.; Hoffman, S.; Knyazikhin, Y.; Privette, J.L.; Glassy, J.; Tian, Y.; Wang, Y.; Song, X.; Zhang, Y.; Smith, G.R.; et al. Global products of vegetation leaf area and fraction absorbed PAR from year one of MODIS data. Remote Sens. Environ. 2002, 83, 214–231. [Google Scholar]
  35. Baret, F.; Weiss, M.; Lacaze, R.; Camacho, F.; Makhmara, H.; Pacholcyzk, P.; Smets, B. GEOV1: LAI and FAPAR essential climate variables and FCOVER global time series capitalizing over existing products. Part1: Principles of development and production. Remote Sens. Environ. 2013, 137, 299–309. [Google Scholar] [CrossRef]
  36. MetINFO Phenological Observations. Available online: http://www.metla.fi/metinfo/fenologia/index-en.htm (accessed on 3 December 2014).
  37. Chen, J. Evaluation of vegetation indices and a modified simple ratio for boreal applications. Can. J. Remote Sens. 1996, 22, 229–242. [Google Scholar] [CrossRef]
  38. CEOS Cal/Val Portal. Available online: http://calvalportal.ceos.org/web/olive (accessed on 3 December 2014).
  39. Stenberg, P.; Rautiainen, M.; Manninen, T.; Voipio, P.; Smolander, H. Reduced simple ratio better than NDVI for estimating LAI in Finnish pine and spruce stands. Silva Fenn. 2004, 38, 3–14. [Google Scholar] [CrossRef]
  40. Pisek, J.; Rautiainen, M.; Heiskanen, J.; Mõttus, M. Retrieval of seasonal dynamics of forest understory reflectance in a Northern European boreal forest from MODIS BRDF data. Remote Sens. Environ. 2012, 117, 464–468. [Google Scholar] [CrossRef]
  41. Eenmäe, A.; Nilson, T.; Lang, M. A note on meteorological variables related trends in the MODIS NPP product for Estonia. Forest. Stud. 2011, 55, 60–63. [Google Scholar]
  42. Ganguly, S.; Nemani, R.R.; Zhang, G.; Hashimoto, H.; Milesi, C.; Michaelis, A.; Wang, W.; Votava, P.; Samanta, A.; Melton, F.; et al. Generating global leaf area index from Landsat: Algorithm formulation and demonstration. Remote Sens. Environ. 2012, 122, 185–202. [Google Scholar]

