Article

Multi-Sensor As-Built Models of Complex Industrial Architectures

Electricité De France Lab, 1 Avenue du Général de Gaulle, 92140 Clamart, France
*
Author to whom correspondence should be addressed.
Remote Sens. 2015, 7(12), 16339-16362; https://doi.org/10.3390/rs71215827
Submission received: 30 June 2015 / Revised: 18 November 2015 / Accepted: 23 November 2015 / Published: 4 December 2015

Abstract

:
In the context of increased maintenance operations and generational renewal work, a nuclear owner and operator, like Electricité de France (EDF), is invested in the scaling-up of tools and methods of “as-built virtual reality” for whole buildings and large audiences. In this paper, we first present the state of the art of scanning tools and methods used to represent a very complex architecture. Then, we propose a methodology and assess it in a large experiment carried out on the most complex building of a 1300-megawatt power plant, an 11-floor reactor building. We also present several developments that made possible the acquisition, processing and georeferencing of multiple data sources (1000+ 3D laser scans and RGB panoramic, total-station surveying, 2D floor plans and the 3D reconstruction of CAD as-built models). In addition, we introduce new concepts for user interaction with complex architecture, elaborated during the development of an application that allows a painless exploration of the whole dataset by professionals, unfamiliar with such data types. Finally, we discuss the main feedback items from this large experiment, the remaining issues for the generalization of such large-scale surveys and the future technical and scientific challenges in the field of industrial “virtual reality”.

Graphical Abstract

1. Introduction

1.1. Industrial Context

In order to fulfill the need for as-built datasets to help workers in complex buildings in their daily jobs, large and multi-sensor surveys now have to be considered at the whole building size. Unfortunately, many current tools (including sensors, processing programs and visualization applications) have not been designed for such large surveys of complex indoor facilities.
Until today, the major uses with as-built data in the industry are related to the description of the actual shape of only a part of the facility, with its obstacles and free spaces with centimeter accuracy, to help maintenance planning, handling, storage, replacement or changing important components in that specific part of the plant; see Figure 1. The next step in the field of 3D surveying of facilities consists both of scaling up the current state of the art, without compromising data quality, and in dedicating as-built datasets to new users, who are not experts in CAD or terrestrial laser scanner (TLS) data.
Figure 1. Review of three breakthrough projects (1993–2014) of as-built reconstruction from laser scanning data of industrial facilities at Electricité de France (EDF) [1]: (a) first water tank (1993); (b) first turbine hall (2009); (c) first reactor building (2014).
Remotesensing 07 15827 g001

1.2. Contributions

The contributions of this paper, which is an enhanced and detailed version of [1], are the following:
  • The state of the art of tools and methods for the acquisition, processing and georeferencing of as-built datasets dedicated to the specific conditions of complex indoor facilities, Subsection 2.1 and Subsection 2.2;
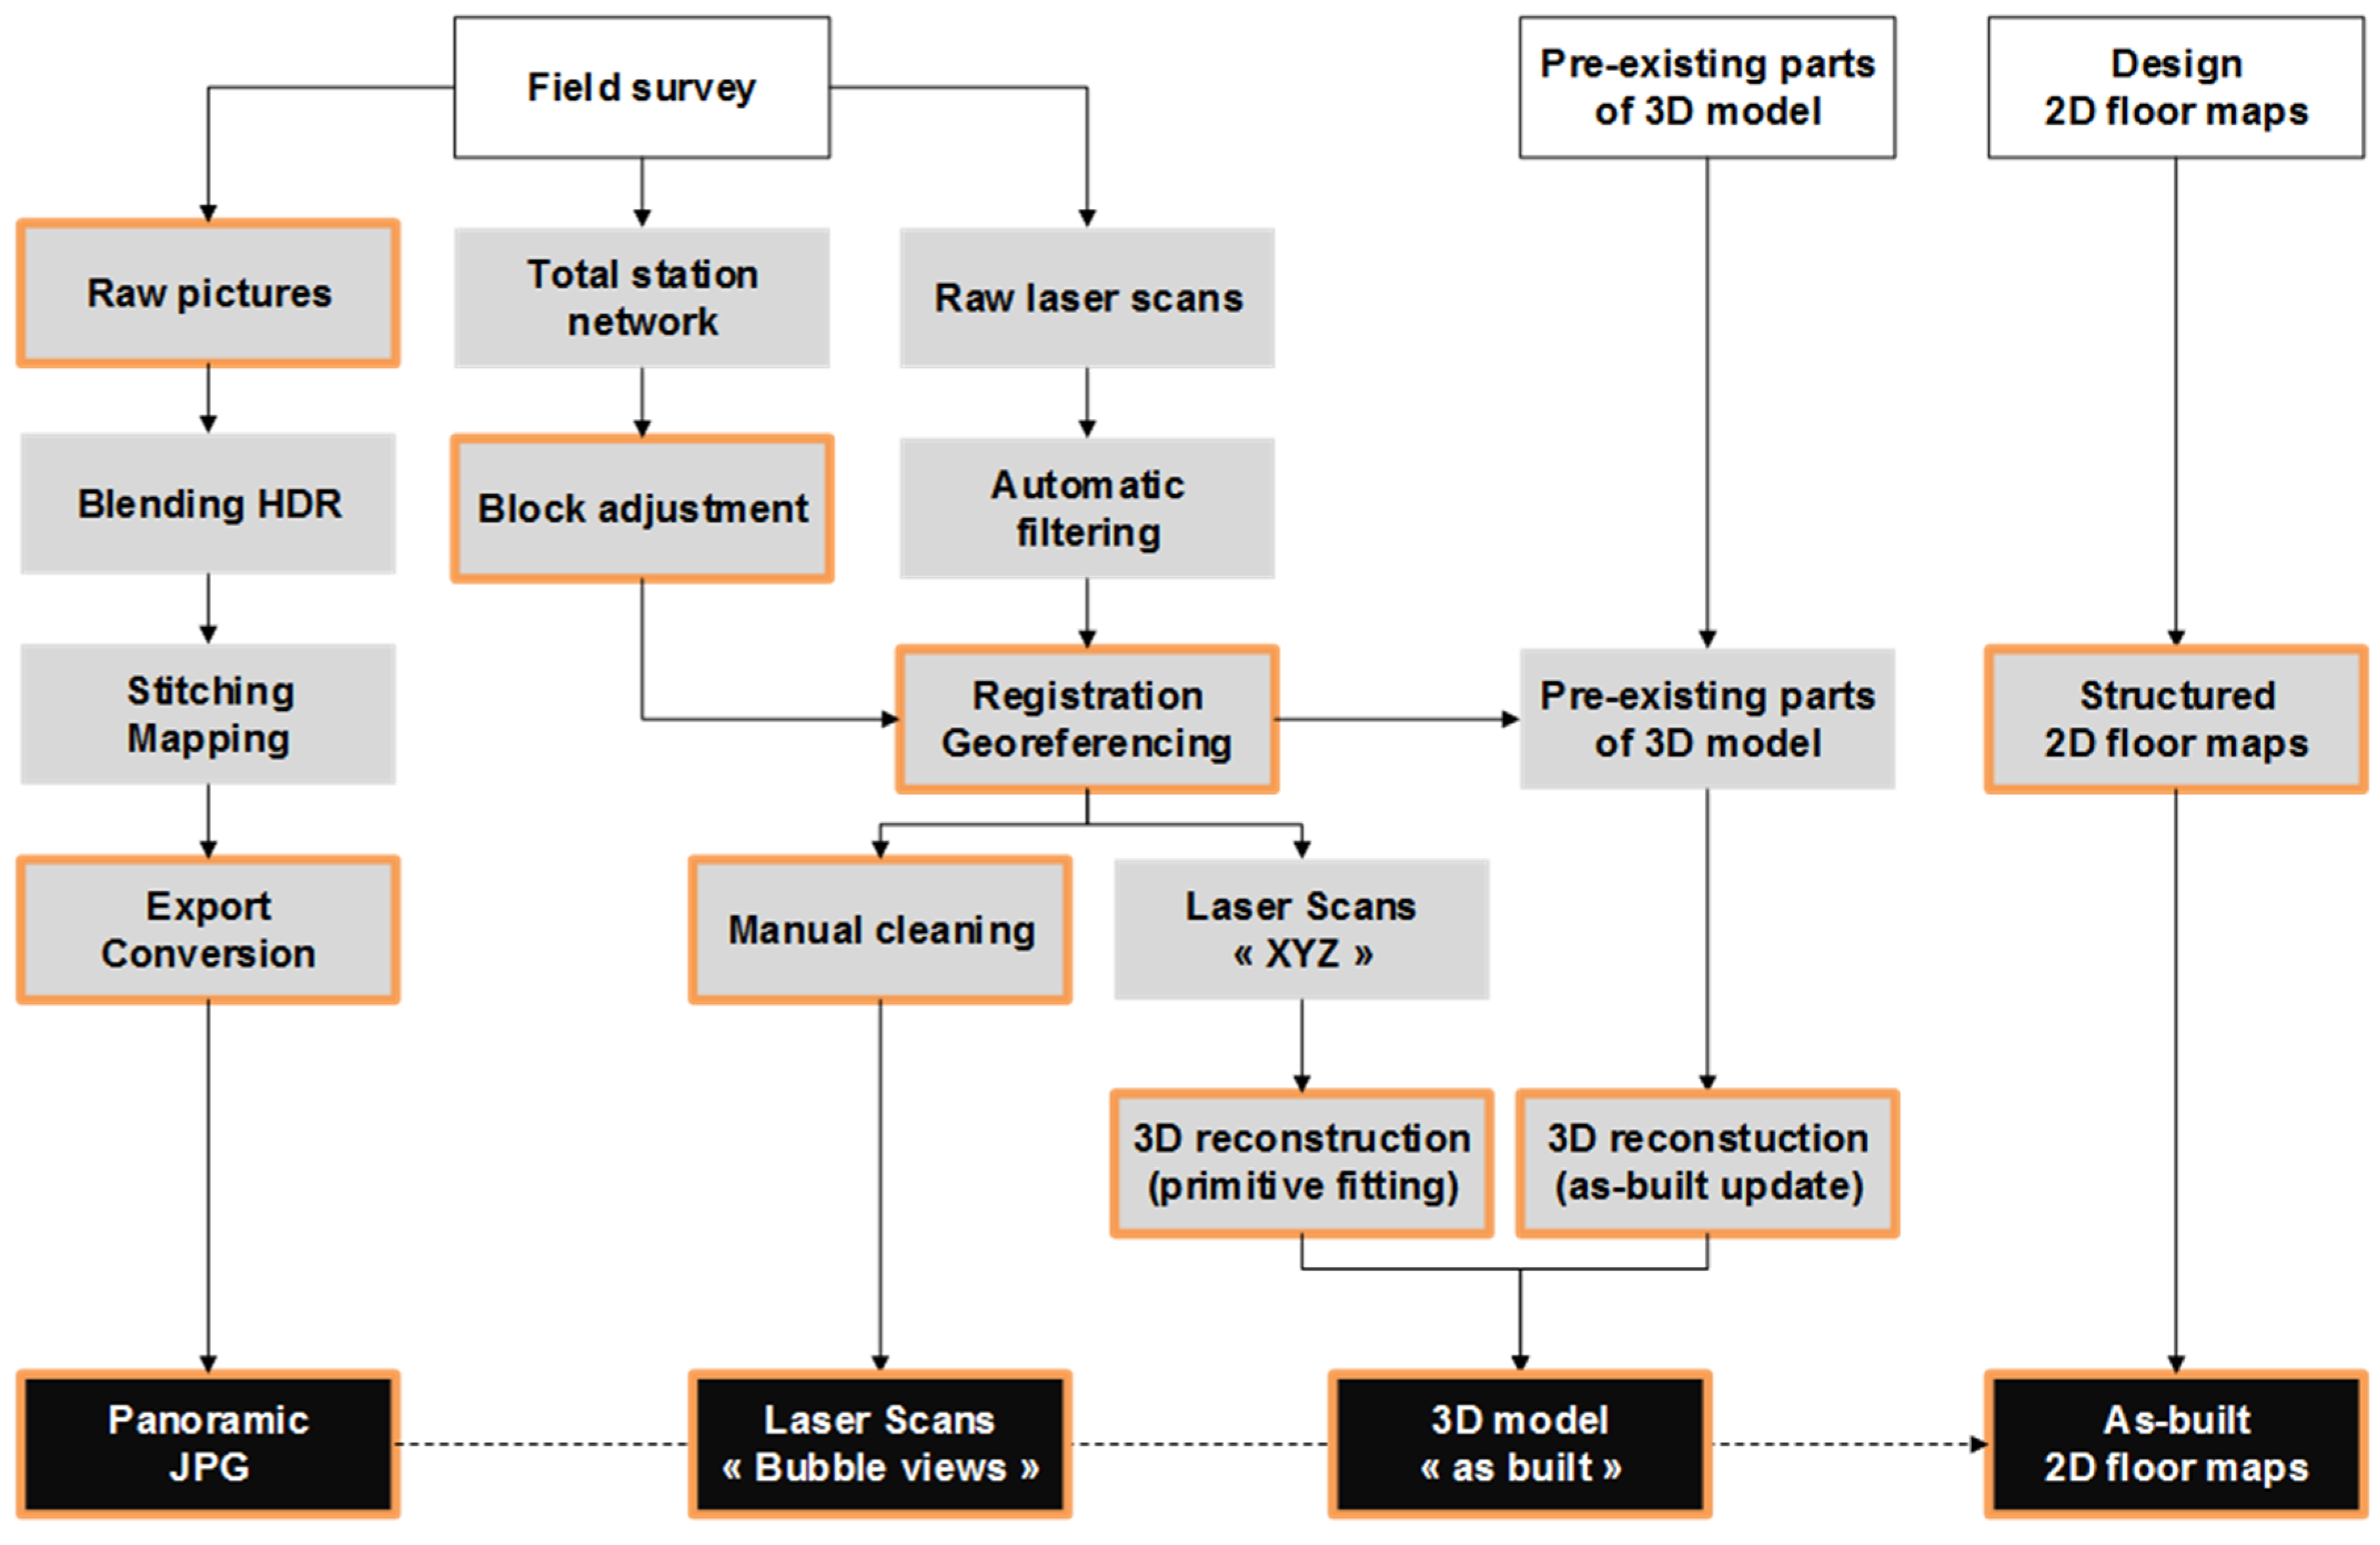
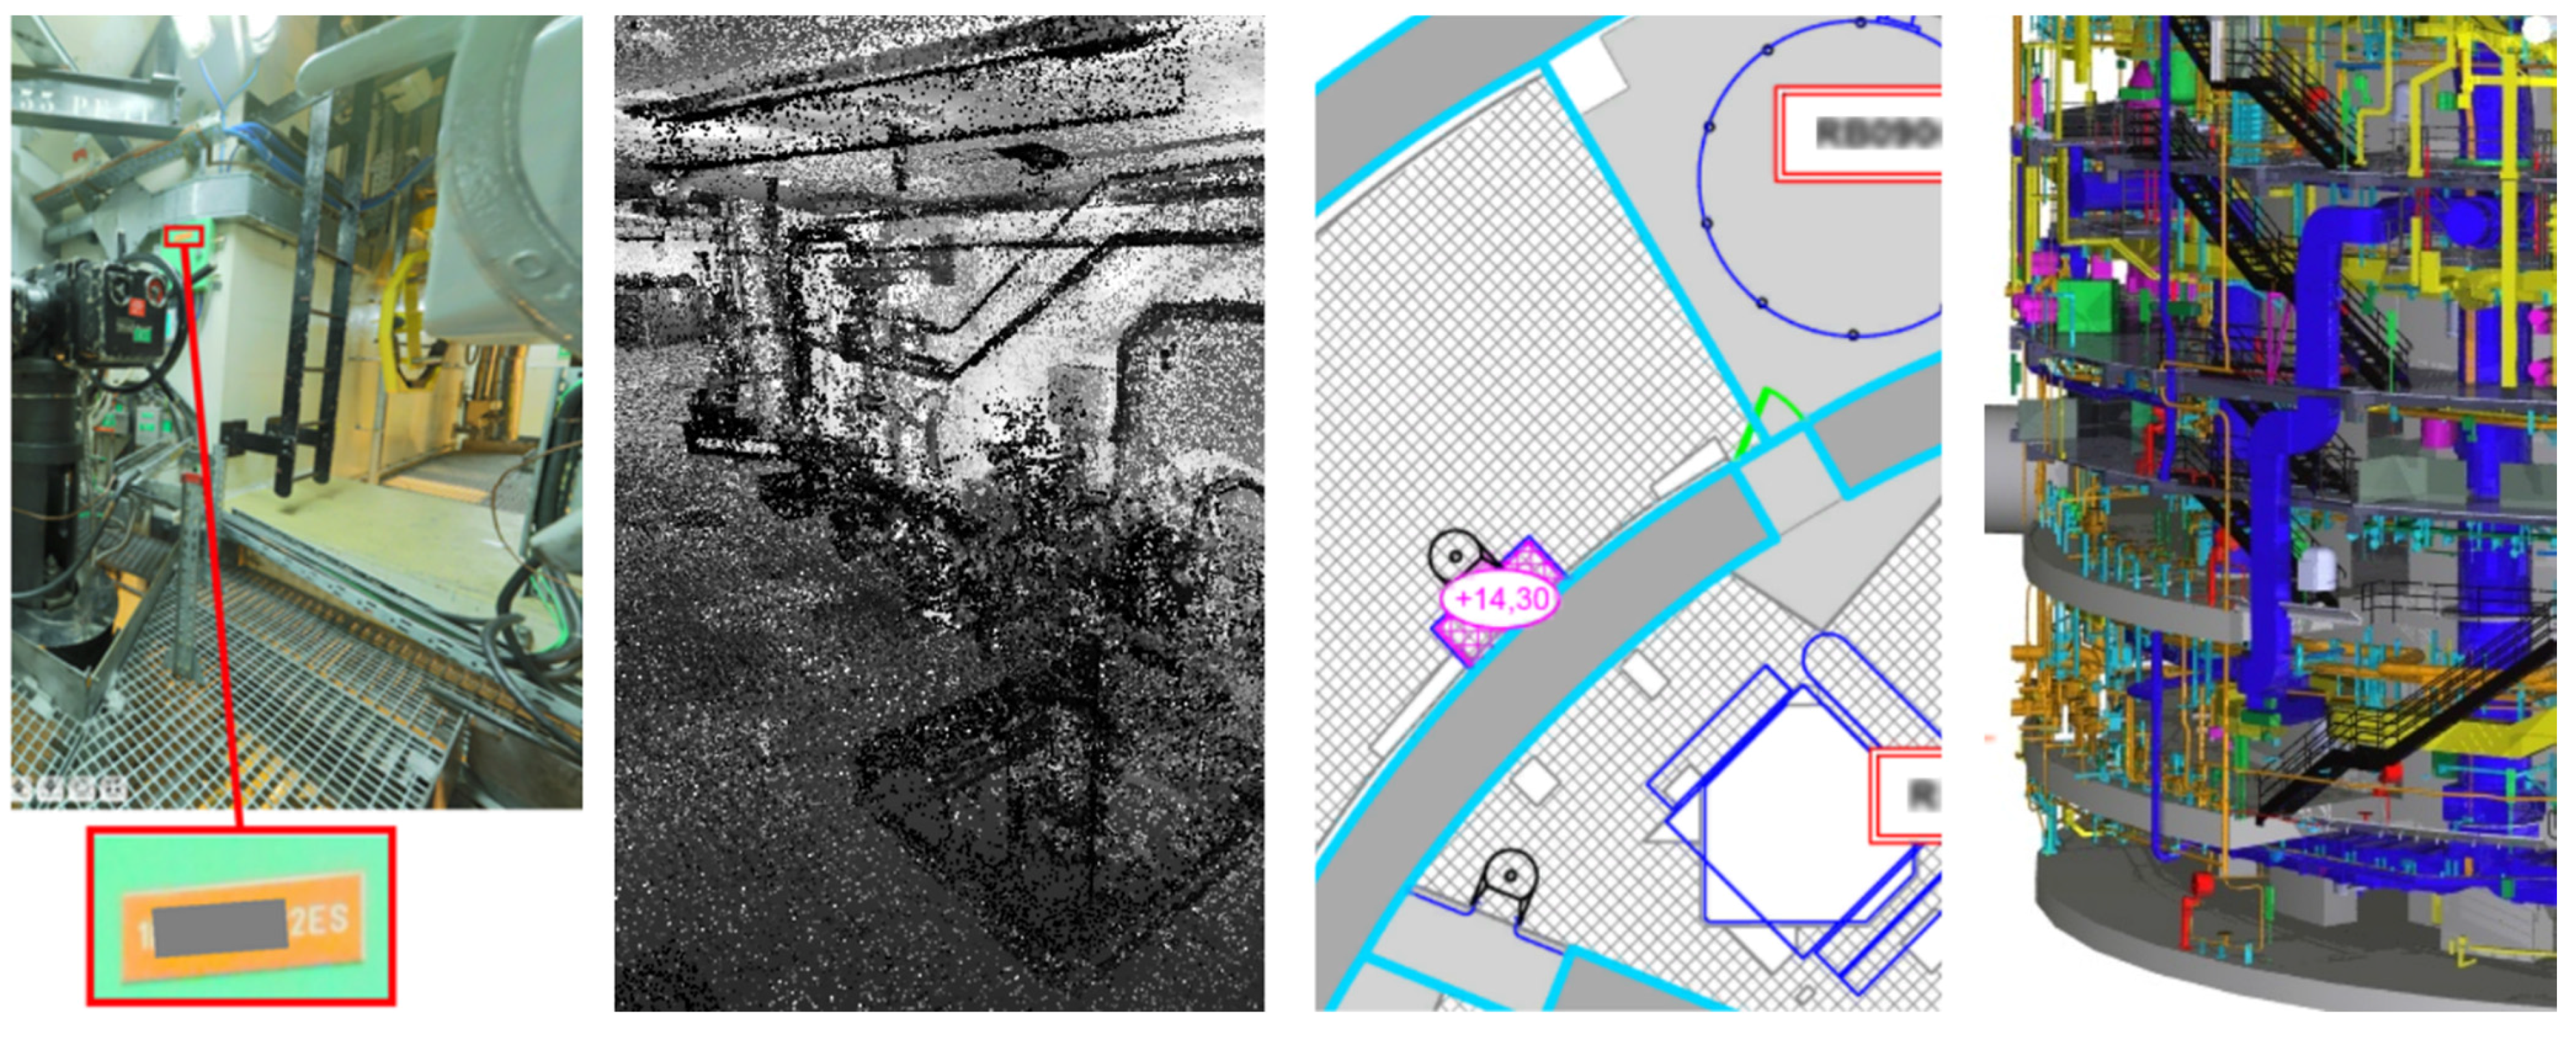
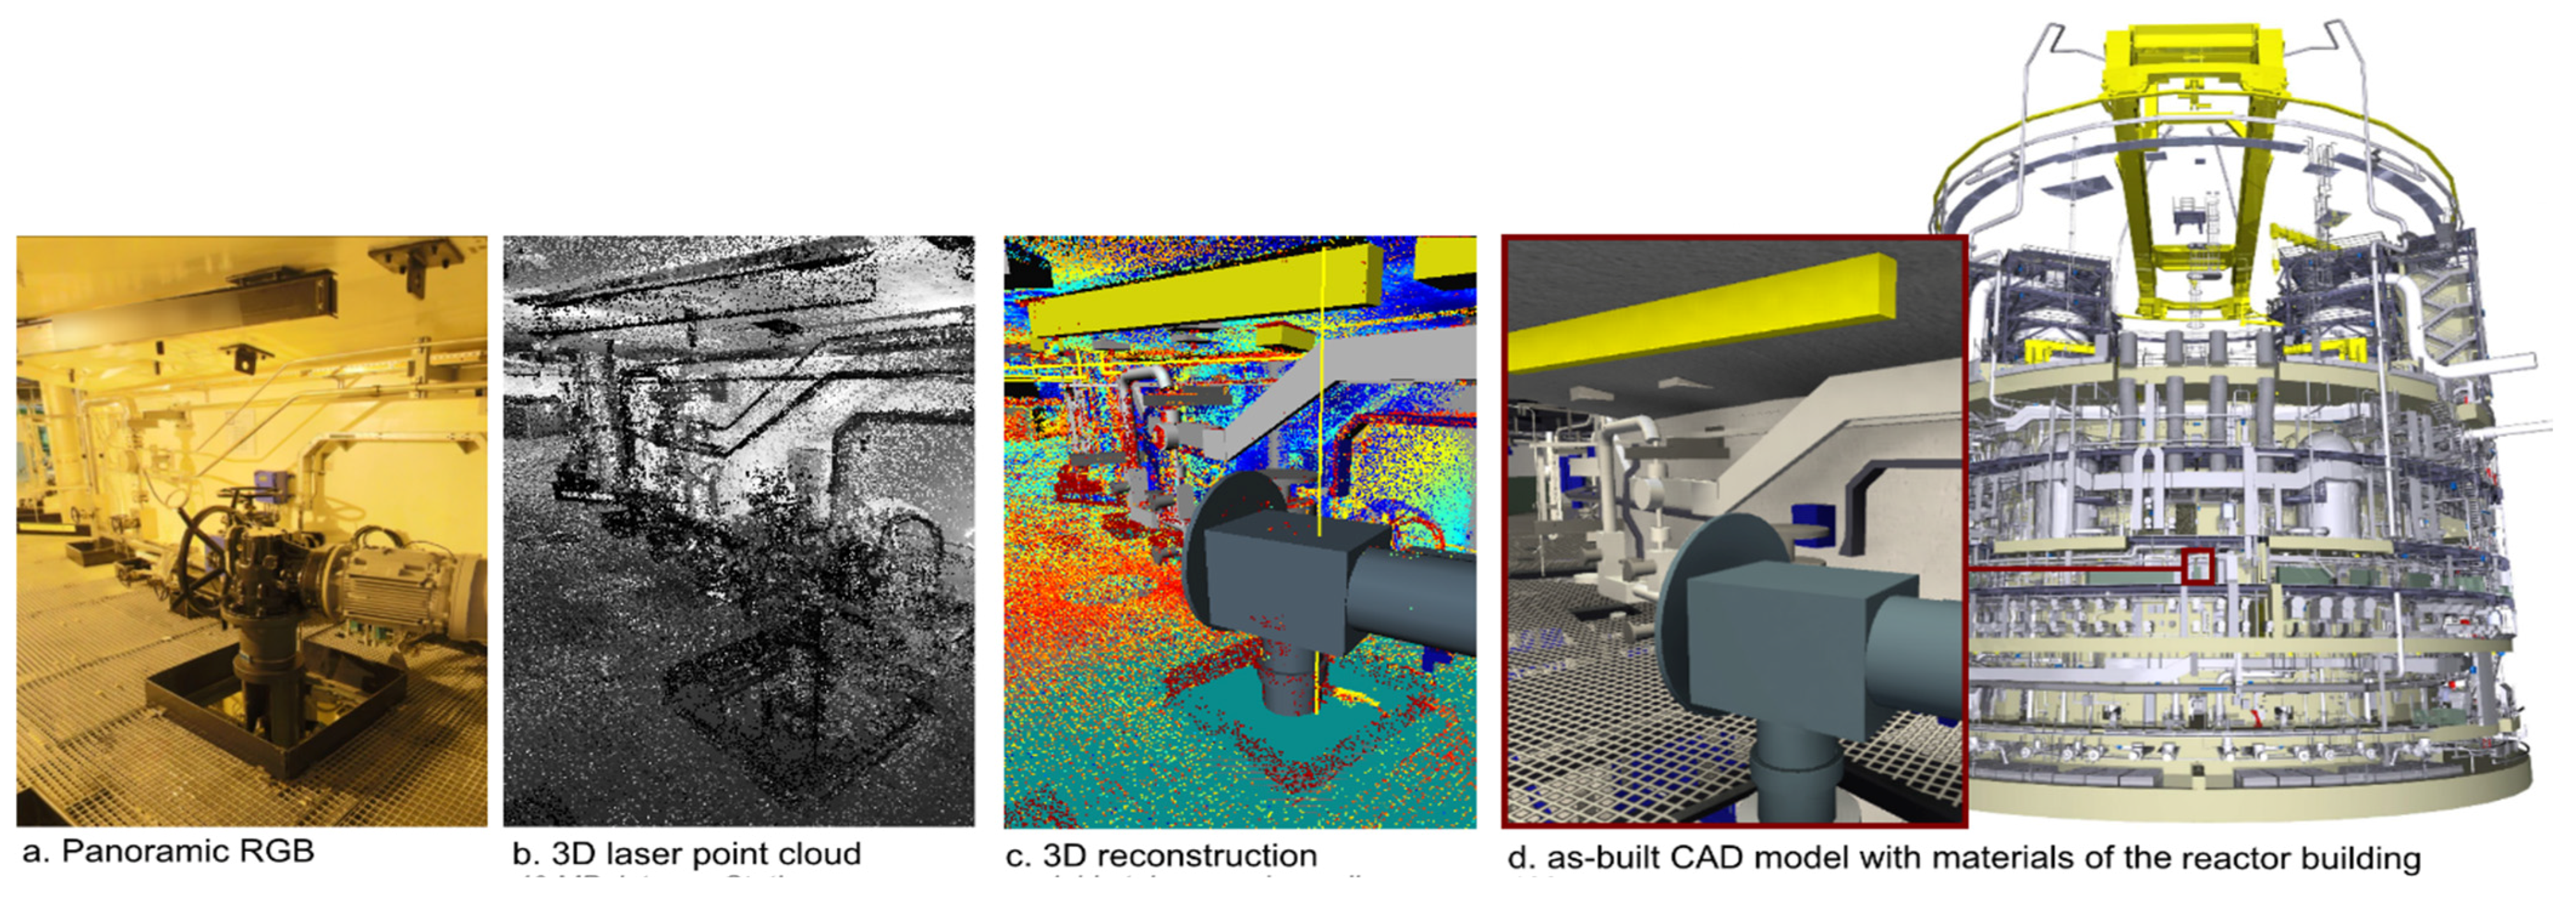
  • The proposition of a global method for multi-sensor acquisition and processing to represent complex architecture, Subsection 2.3 and Figure 2;
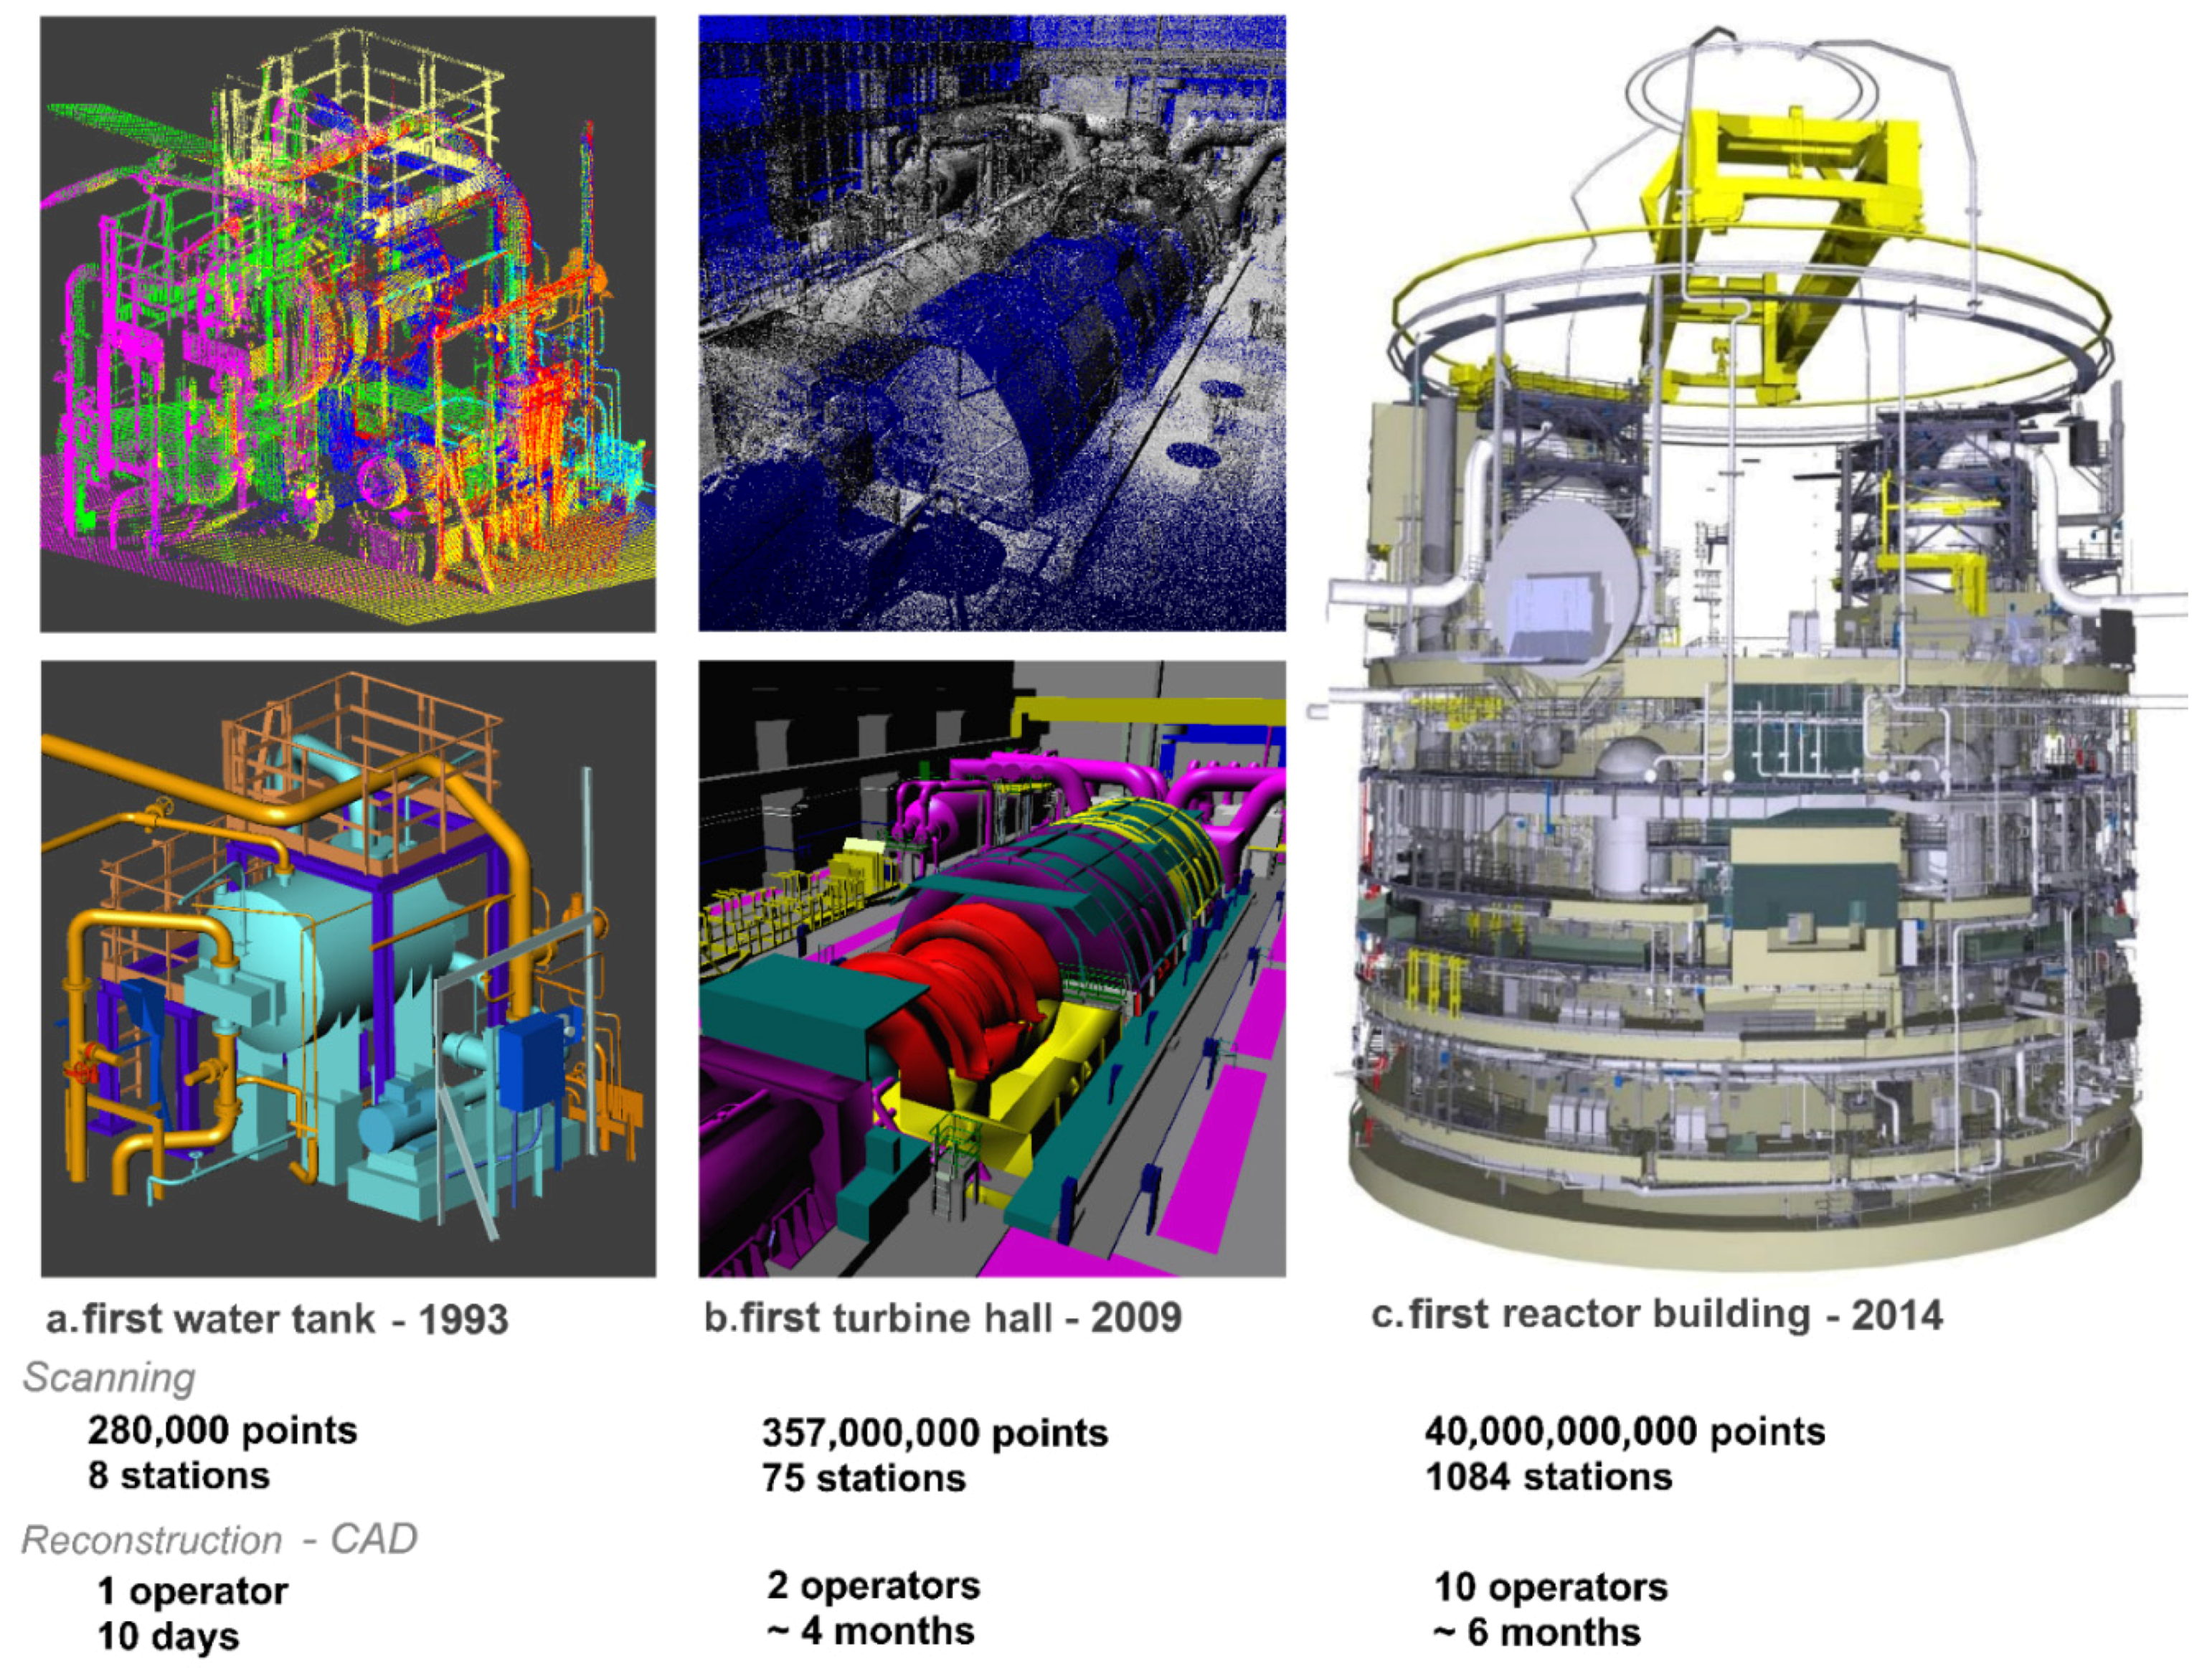
  • Settings, processes and feedback from a large-scale multi-sensor scanning survey experiment on a whole 1300-megawatt nuclear reactor building (1000+ stations of both TLS and panoramic images) with a highlight of the role of the human beings in the process, Section 3;
  • A new interactive tool for pose estimation of panoramic images, Section 4;
  • Recommendations and examples for developing dedicated applications for virtual tours of complex architectures using multiple data types in order to increase the value of the dataset and answer users’ requirements, Section 5;
  • An overview of the remaining bottlenecks and challenges in view of the generalization of large, dense, multi-sensor scanning surveys, Section 6.
Figure 2. Global framework of as-built data production in the experiment. White boxes are the initial data sources; grey boxes are intermediate data versions; and black boxes are the datasets that composed the virtual replica of a complex building. Orange outlines represent stronger control procedures in the data production process.
Remotesensing 07 15827 g002

2. State of the Art in 3D Surveying for the Industry

2.1. Scanning Industrial Interiors, a 20-Year-Old Challenge

As shown in Figure 3, power facilities are a specific subset of industrial environments, in their shapes (congested, with a huge number of objects, whose manufactured geometries correspond to a set of 3D primitives, like cylinders, boxes, etc.), their surfaces (objects sometimes very reflective or with very dark albedos) and accessibility (on-site restricted access time, difficult temperature and vibration conditions). The geometric complexity of these scenes led to the development of dedicated acquisition and processing tools, such as terrestrial laser scanning in the 1990s [2], used very often since then, see Figure 1a. These methods have been used until today to help maintenance workers, by providing a description of the geometry of key areas of the facilities.
Unfortunately, and because of the specific nature of industrial environments, many developments intended for the 3D laser scanning of non-industrial objects have not solved all of the issues arising in the large-scale dense scanning survey of whole industrial scenes with multiple floor heights. These main issues are the speed of surveying (since the plant is only accessible a couple of weeks in the year), the accuracy of the raw points for a large spectrum of albedos (with both mirror-like and dark surfaces in the same scene), the accuracy of registration and referencing (the 2.58σ global geometric tolerance is ±2 cm) and, also, the productivity of 3D reconstruction (up to 100.000 objects for one single building).
Figure 3. Specific issues of a power facility: (a) rooms are often very congested; (b) objects can be very dark and (c) stainless objects can be clean and then very reflective; (d) often coexisting in one place.
Remotesensing 07 15827 g003
In an industrial context, many users are not experienced users of laser scanner or CAD data. Furthermore, geometry alone is not sufficient to meet all maintenance needs and to represent all of the complexity of the architecture and the details of a power plant. These observations lead to the following requirements for the tools and methods used in these new standards in the production and use of as-built datasets for the maintenance of facilities:
(1)
Multi-sensor datasets that describe both the geometry and appearance of a facility;
(2)
Fast and accurate sensors, responsive to harsh albedos or very reflective surfaces;
(3)
Automated pipelines for conversions and formatting;
(4)
Large-scale efficient tools for registration and processing;
(5)
User-friendly diagnostic tools to achieve high quality requirements on large and complex datasets;
(6)
Dedicated solutions for the intuitive exploration and use of multi-sensor datasets.

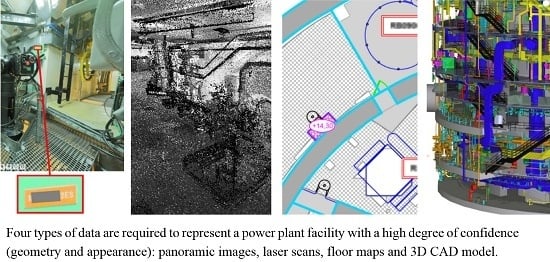
2.2. Requirement Engineering for As-Built Datasets of Complex Architectures

In order to represent a complex facility, the requirement engineering of several jobs, through meetings and discussions, to estimate the optimal value of the dataset produced, has led to the conclusion that the following data types must be produced together; see Figure 4:
(1)
Panoramic images, in order to be able to read each equipment tag that might be visible up to 5 m from the main pathways in the facility, as well as to understand the overall architecture of the building;
(2)
Georeferenced terrestrial laser scans, in order to deliver local sub-centimeter geometric accuracy on distance measurements, as well as global 3D locations with less than 2 cm of deviation from the ground truth (2.58σ tolerance);
(3)
2D floor maps, with all elements relative to the structure of the building (walls, floors, ladders, stairs, etc.), as well as landmarks to help pedestrians navigate the plant;
(4)
3D, as-built CAD models with categories, to capture empty areas or open walking spaces with less than 5 cm of error (2.58σ tolerance), as well as the shape of the main equipment of the facility.
Figure 4. Four types of data are required to represent a power plant facility with a high degree of confidence (geometry and appearance): panoramic images, laser scans, floor maps and 3D CAD model.
Remotesensing 07 15827 g004
In order to match these requirements, one must define relevant specification criteria for each type of data, as presented in Table 1.
Then, the tools and methods that might meet all of these criteria were selected using the experience of survey teams that should submit sample datasets to prove their expertise (from either previous surveys or small-scale experiments in similar conditions). The initial estimates of costs and delays were extrapolated to the building scale thanks to a deep analysis of these previous acquisitions.
Finally, to ensure the consistency of results for initial user needs, the dataset was fully checked, using a Level 2 control procedure and then reworked until quality standards were achieved. Finally, user feedback showed the validity of such approaches.
Table 1. Criteria of a multi-sensor survey of a building with complex architecture.
Type of DataCriteria
Panoramic imagescompleteness, location of stations, field of view, resolution and noise level of digital images, white balance and high dynamic range (HDR), naming, approximate poses, vertical estimation and mapping
Georeferenced and cleaned laser scanscompleteness, location of stations, block structure of sub-networks, targets for registration, reference targets for georeferencing, field of view, resolution, signal and total station traverse survey
2D floor mapscompleteness, geometry, naming and formatting
3D as-built CAD modelcompleteness, categories of objects, type of shapes, geometric accuracies by category, names and structure

2.3. State of the Art of Large-Scale Dense Scanning Surveys

Recent breakthroughs offer the prospect of large-scale and multi-sensor scanning surveys that comply with the previously defined technical requirements and tolerances, from acquisition and processing to data integration in dedicated software, developed specifically for maintenance work in a power plant. As will be shown in this section, new developments in data acquisition in the past five years have mainly improved the speed rate, with almost no gain in accuracy. The real benefit for scaling up dense scanning surveys consists of the improvement in data storage, visualization and processing.

2.3.1. Panorama Acquisition

Regarding panoramic image acquisition, current 360° video cameras allow fast acquisition of equirectangular images; the state-of-the-art highest resolution panoramic systems use 44 sensors to produce videos with a resolution of 9000 × 2400 pixels at a rate of 30 frames per second [3]. However, static tripod-mounted motorized heads with full frame digital single lens cameras (DLSR) can generate higher resolutions (gigapixels) panoramas, for example half a billion pixels in five minutes [4], with a high automation rate in stitching. This resolution allows reading labels up to 5 m, and the high dynamic range (HDR) rendering can deal with high contrast and poor lightning conditions.

2.3.2. 3D Point Cloud Acquisition and Registration

Regarding 3D georeferenced point cloud acquisition, some noticeable improvements have come from robotic and computer vision research programs on fast 3D scanning indoors, such as range sensors [5], backpack scanning systems [6], handheld [7] or mounted on mobile platforms in various shapes and sizes [8,9]. However, these systems, either for local precision [5,6,7] or global georeferencing errors [9], deal mostly with decimeter accuracy. Moreover, many indoor localization and mapping systems require planar objects and/or straight corridors to reduce drift using elaborate algorithms, such as “iterate closest point + inertial measurement unit + planar” proposed in [6]. For labyrinthine and crowded indoors, a fusion of several techniques may be available in a few years, including indoor localization systems based on inertial sensors (the state of the art may be found in the EVAAL indoor positioning competition—Evaluating Ambient Assisted Living Systems Through Competitive Benchmarking—won in 2015 by [10]), graph-SLAM (simultaneous localization and mapping) sensor positioning [11], efficient loop closure [12] and robust detection of features for geo-referencing [13].
Currently, phase-based terrestrial laser scanners are better sensors for small distances, and acquisition rate and can for instance capture 50 million points of mid-range measurements in approximately five minutes (<1 m–50 m). Regarding local accuracy, errors in depth measurements are under 1 cm in that range on most object surfaces [14]. However, the surfaces of some industrial objects do not correspond to the calibration standard ranges (very short distances, low albedos, high reflectance properties and low incidence angles), leading to significant consumption of the error budget [15]. A proportion of these errors can be filtered out automatically [16] (comet-tailed effect, outliers), although another proportion, often quite considerable, can only be removed through manual segmentation (multi-reflections on specular surfaces, in particular).
Regarding global accuracy, the fine registration of large laser scanner datasets is an open and active research topic. For complex buildings, cloud-to-cloud automatic approaches, such as ICP and variants, cannot be used for several reasons. First, due to the proximity of objects, a small relative change in scanner position induces strong differences on point clouds. Thus, cloud-to-cloud constraints cannot, by definition, lead to accurate and trustworthy results in complex scenes. Secondly, these approaches cannot take into account datum constraints for data referencing without a great loss of automation. Finally, these approaches are neither efficient nor robust for very large datasets (many hundreds of stations) [17]. Currently, only target-based registration paired with a total station survey for datum referencing allows the fine registration of hundreds of laser scans (3σ = ±2 cm) on the scale of 10-floor buildings.

2.3.3. 3D CAD Reconstruction

Recent improvements in processing tools for 3D reconstructions from large point clouds (tens of billions) have made possible the “as-built” reconstruction of a full mock-up. First, the data storage cost has increased by a factor of 25 in the last decade [18], while the data USB external transfer rate has increased by a factor of 20 [19], and internal SSD now reaches 500 Mb/s. However, if dozens of laser scans requires gigabytes, thousands of laser scans require terabytes. To improve both file storage, versioning and processing, data structures have been developed [20] and implemented in many commercial software. Other great improvements have been made for visualizing and manipulating a billion point clouds, for example using QuadTrees [21], such as implemented in the WebGL renderer PoTree [22], with real-time shaders, like Eye Dome Lightning [23], also implemented in the open source software CloudCompare.
Looking back, 3D CAD models have been used for planning maintenance operations of industrial installations since the 1990s [2]. Depending on the requirements, several formats can be used depending on the requirements of the industry. In the architectural, engineering and construction (AEC) industry, building information models (BIM) have recently attained widespread attention. These BIM models can be really valuable when they are used in the whole lifecycle of a building [24], from construction monitoring [25] to decommissioning [26], but are used for new rather than for existing buildings [27]. In the power plant industry, PDMS from Aveva has been a leading plant design model for more than 30 years [28]. For power plants designed before the 1980s, only 2D plans were created.
As detailed in [29], there is an obvious need for automated or semi-automated methods for the production of as-built BIMs; the current process for creating parametric BIM from a point cloud is largely a manual procedure, which is time consuming and lacks quality controls. Indeed, primitive-based 3D CAD models can still be reconstructed from point clouds with a better productivity than BIM [30], and most objects of a power plant can be considered as a combination of primitive geometries (due to a series effect of the design and part manufacturing process, except for molding large metal equipment). Though recent automatic algorithms for primitive fitting perform better with increasing sampling resolution, they are still far from a 2.58σ tolerance of detection and fitting [31]. To achieve centimeter accuracy on more than 99% of the reconstructed objects, human interaction is required for either initial segmentation or picking initial points for region growing. To assess this accuracy, several tools must be used: visual inspection and a cloud to shape distance computation. Finally, the primitive-based CAD models can also be displayed in the usual rendering engines of virtual reality [32].

3. Experiment of a Multi-Sensor Survey in a 1300-MW Nuclear Reactor

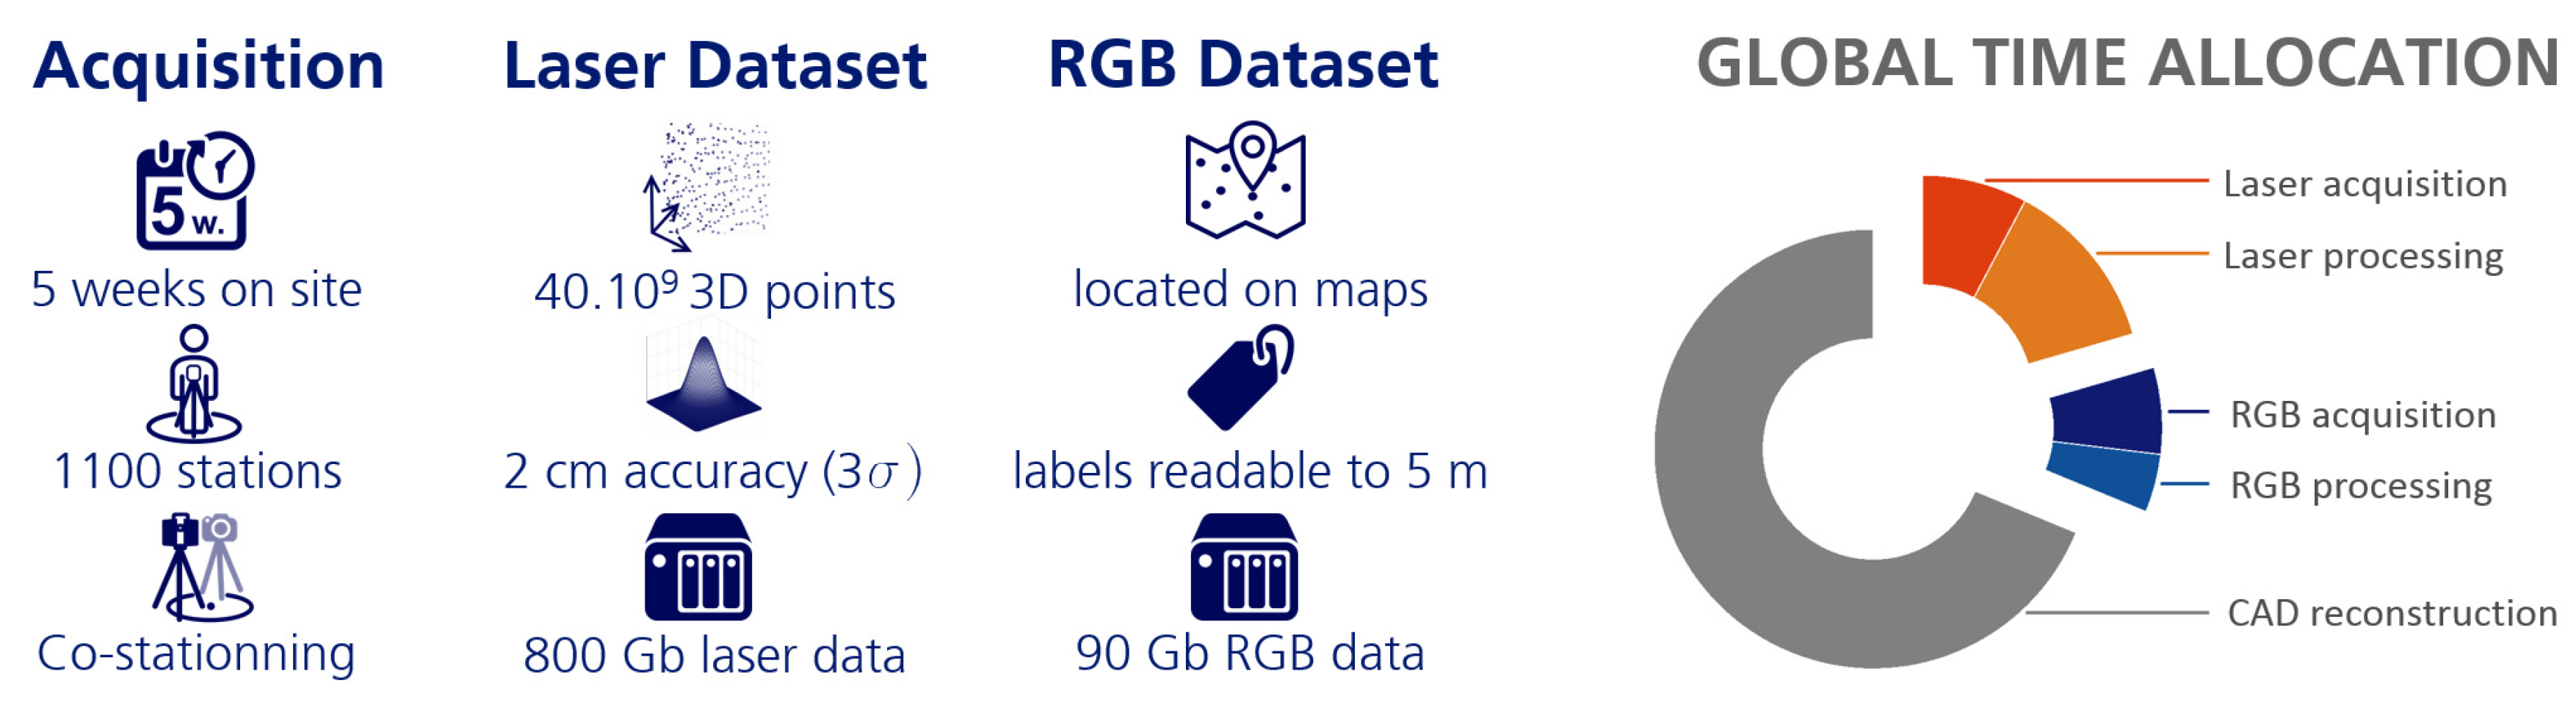
3.1. Goals and Context of the Experiment

In the wake of several research projects that contributed to the development of tools and methods for dense scanning [33], reconstruction [34] or registration [17] and also tools for the visualization of complex datasets [23], EDF carried out the first very large-scale experiment in the most complex building in a 1300-MW nuclear power plant facility: a reactor building.
The goal was to assess the effective performance (quality, cost and speed) of current tools and best practices through a major research project launched in 2013, in order to make a decision on the generalization of the multi-sensor scanning of power plants and highlight remaining bottlenecks to target lock ups. Another goal was to maximize the benefits of this dataset to the company, especially by sharing it with as many users as possible, to assist them in their daily work.
Therefore, to meet the needs of many maintenance procedures and operations, a dense multi-sensor survey (total stations, laser scanning and panoramic RGB) was carried out during the summer of 2013, using the technical specifications detailed above; Subsection 2.2; see Figure 5.

3.2. A Level 2 Procedure for the Quality Control of Large Datasets

We mentioned several definitions of tolerances and quality requirements to reach high-quality data production. In order to reach these requirements, it is necessary to use specific procedures for the quality control of large, as-built datasets (laser scans, RGB panoramic or 3D CAD models). These Level 2 procedures are a standard for quality monitoring and for detecting non-conforming materials. Our experiment demonstrated their usefulness. To enhance dataset quality, we therefore implemented it in the following manner:
  • Level 1: the data creator checks 100% of the dataset and documents it;
  • Level 2: the project data manager performs spot checks both on areas of interest and randomly on the whole dataset.
Due to the significant number of human actions involved in the processes and the size of the dataset, at least two iterations are generally needed to reach quality levels.
Figure 5. (a) Scale of the reactor in a power plant facility, a cylindrical building with 11 floors; (b) 1000+ TLS stations and targets for referencing appear as a very complex 3D network: green spheres are reference points; red spheres are TLS stations; and blue lines are the sights of registration targets from TLS stations.
Remotesensing 07 15827 g005

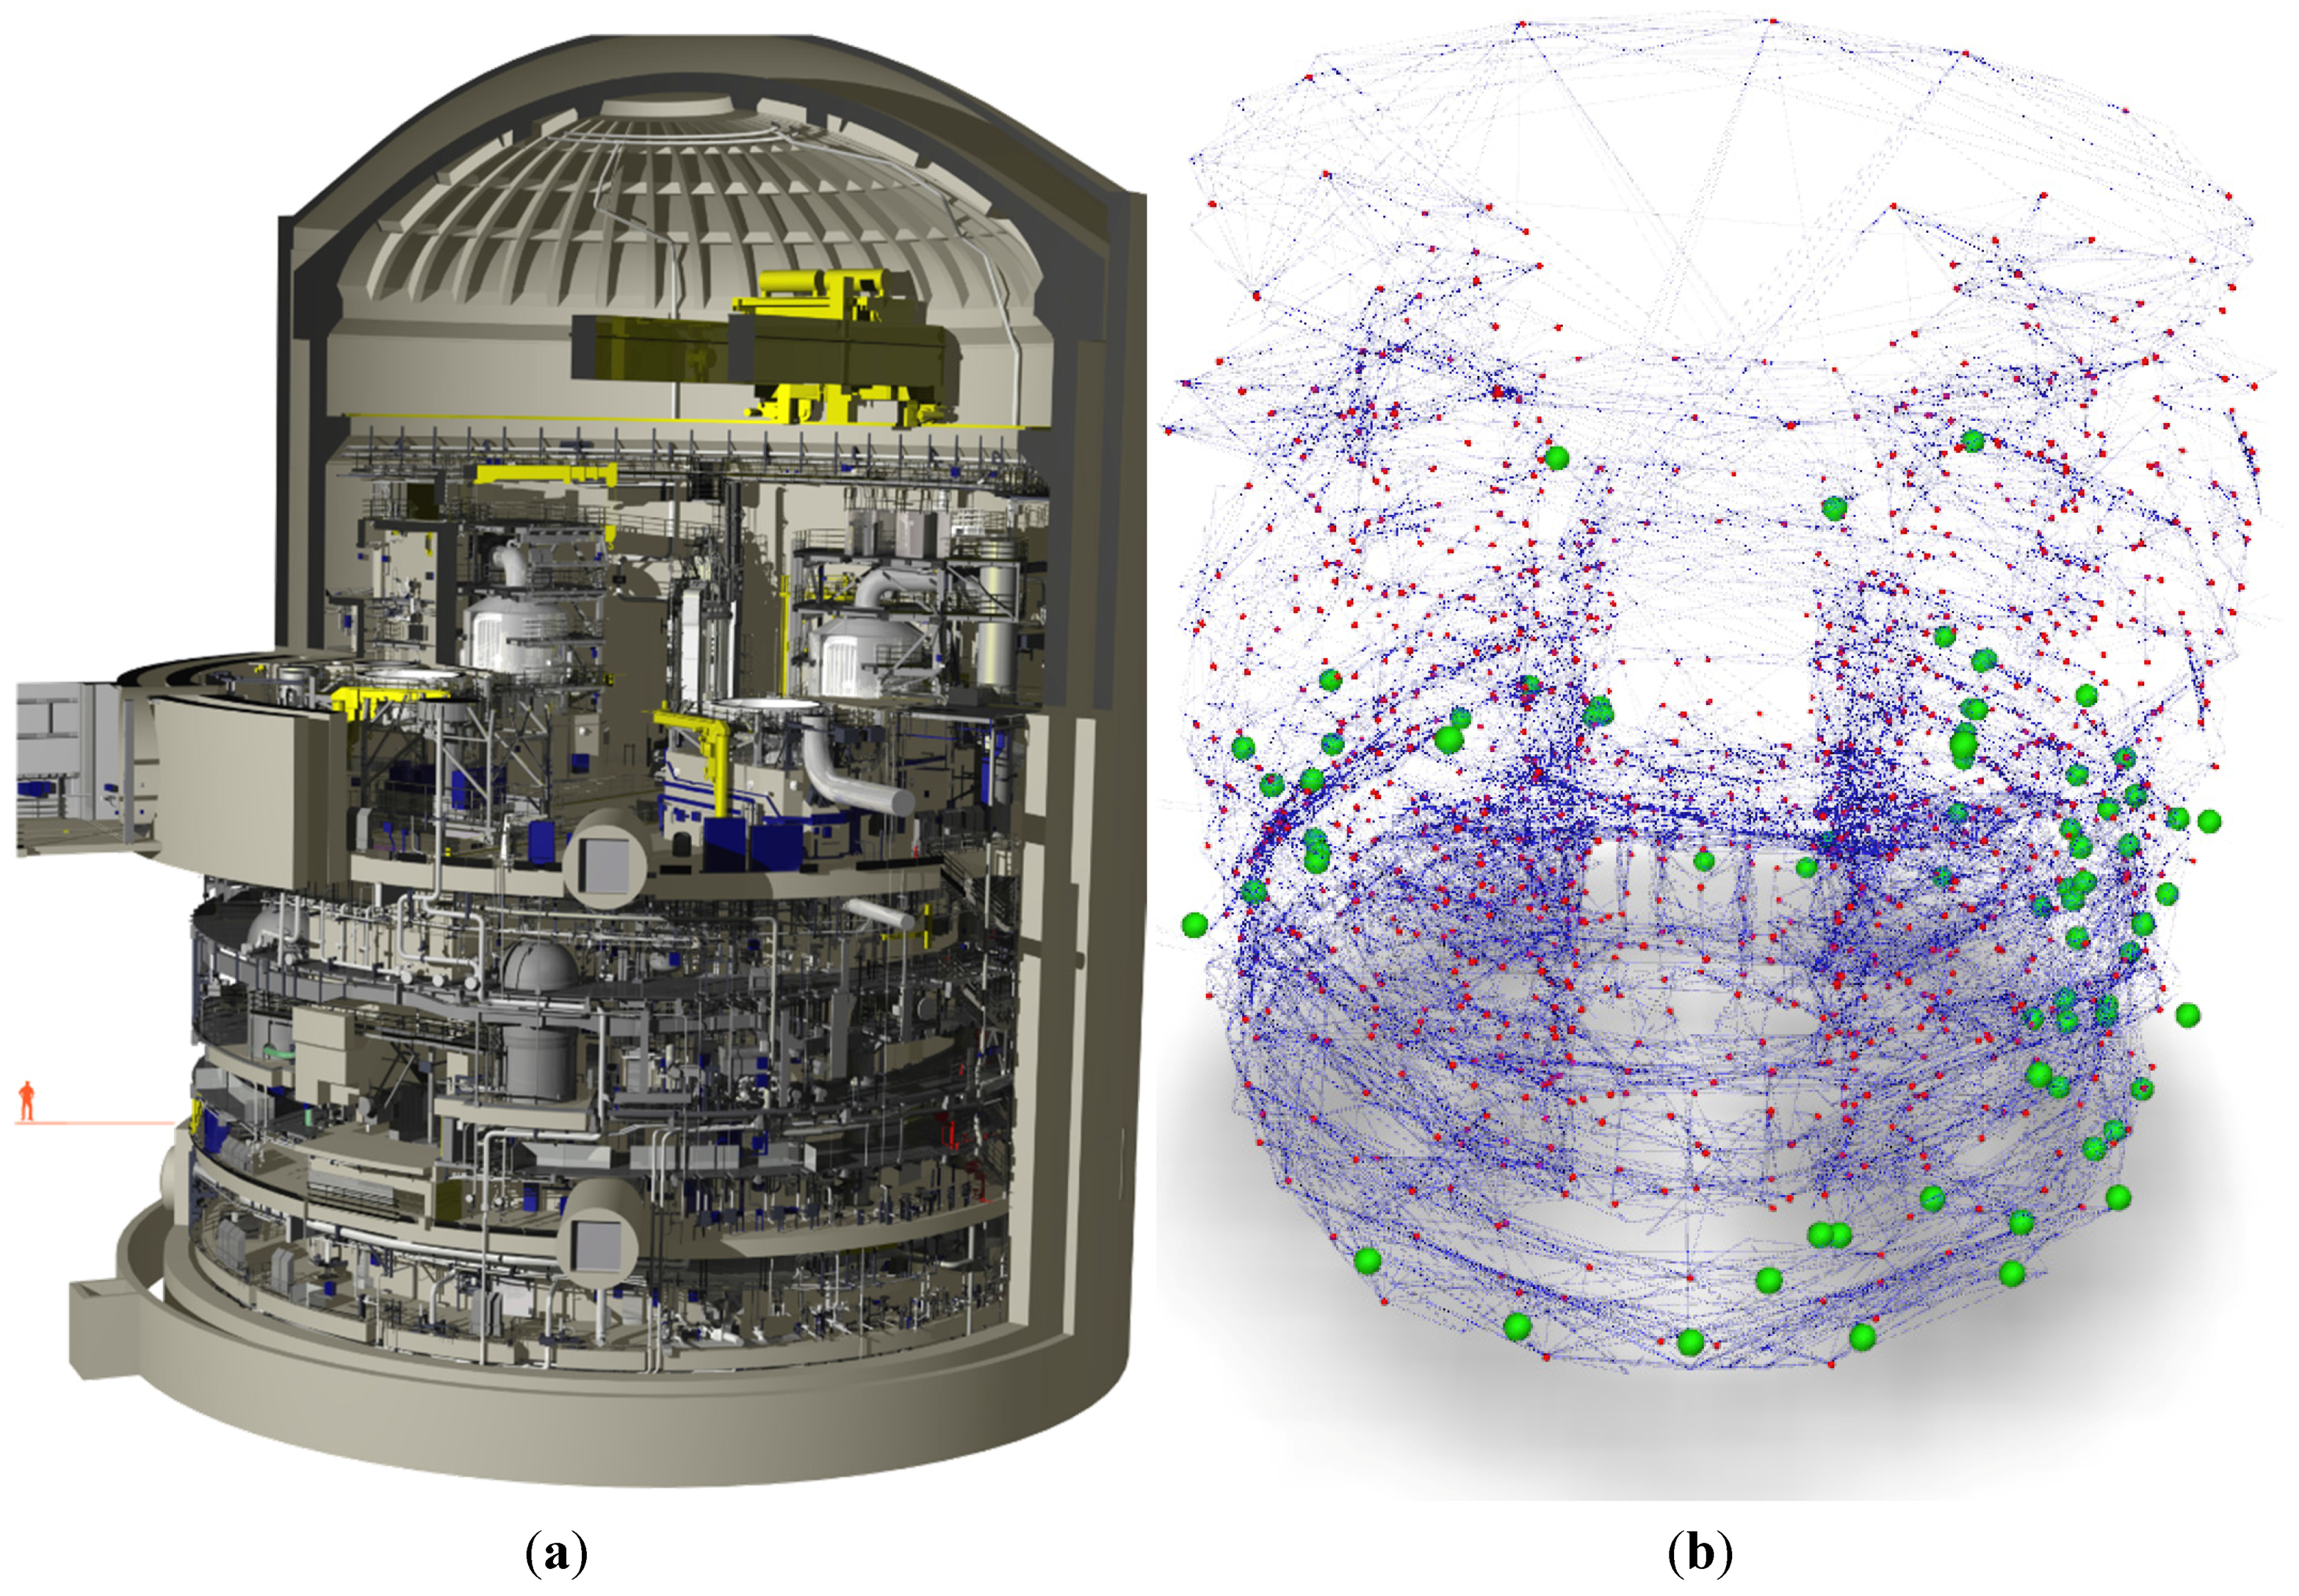
3.3. Description of the Data Acquisition

The reactor building, whose shape is cylindrical, consists of eleven floors with additional floor heights in each of them. Moreover, the majority of the 100+ rooms in the building is particularly congested, and many of them are only accessible through ladders. Regarding the environmental conditions, exploring and scanning such environments is constrained by poor lighting, access restrictions and congestion due to the equipment and the civil works of the plant itself. During this specific experiment, due to the many maintenance operations occurring in the shutdown period, the building was exceptionally accessible for five weeks (35 days), but we expect the available survey time to be reduced by 50% in the future (17 days). Key numbers for the multi-sensor scanning survey are shown in Figure 6. The global framework for data production is shown in Figure 2.
Figure 6. Key numbers in the multi-sensor scanning survey of a nuclear reactor building [1]; the main order of magnitude that may be highlighted is the number of stations: more than 1000 stations (for more details, see [35]). The relative time allocation is shown on the graph; CAD reconstruction is the main budget.
Remotesensing 07 15827 g006
Discussion on on-site acquisition: As detailed in [35], this acquisition phase demonstrated the feasibility of such surveys thanks to some specific evolutions and developments of the tools and methods to take into account the up scaling. To succeed, a large number of sensors and operators (five laser-scanning surveyors with Leica HDS 6100 and Leica HDS 7000 and three photographers with Canon EOS 5D Mark III with motorized panoramic heads) is required. However, as mentioned above, we expect to have only half the time to carry out the survey, i.e., in the future, twice the number of sensors and operators will have to be sent to a site, creating additional stress on current methodologies and synchronization between operators.
Discussion on processing TLS data: This experiment also underlined some constraints on scaling up the current post-processing tools and methods in terms of quality, time or cost (fine registration of large laser scanner datasets, quality monitoring and validation tools, issues for formats, storage and data sharing). To illustrate the complexity of the fine registration of laser scans in complex architectures, we show in Figure 5a view of the 3D network used in the adjustment. This experiment, mostly performed with a Leica Cyclone, underlined the lack of robustness of weighted least squares in such large blocks and the need to work with 3D topographic networks instead of 2.5D. Unfortunately, even state-of-the-art registration tools implement a basic version of the least squares algorithm and lack tools for blunder detection, error propagation and quality monitoring.
The main issues regarding the processing of TLS data are the following:
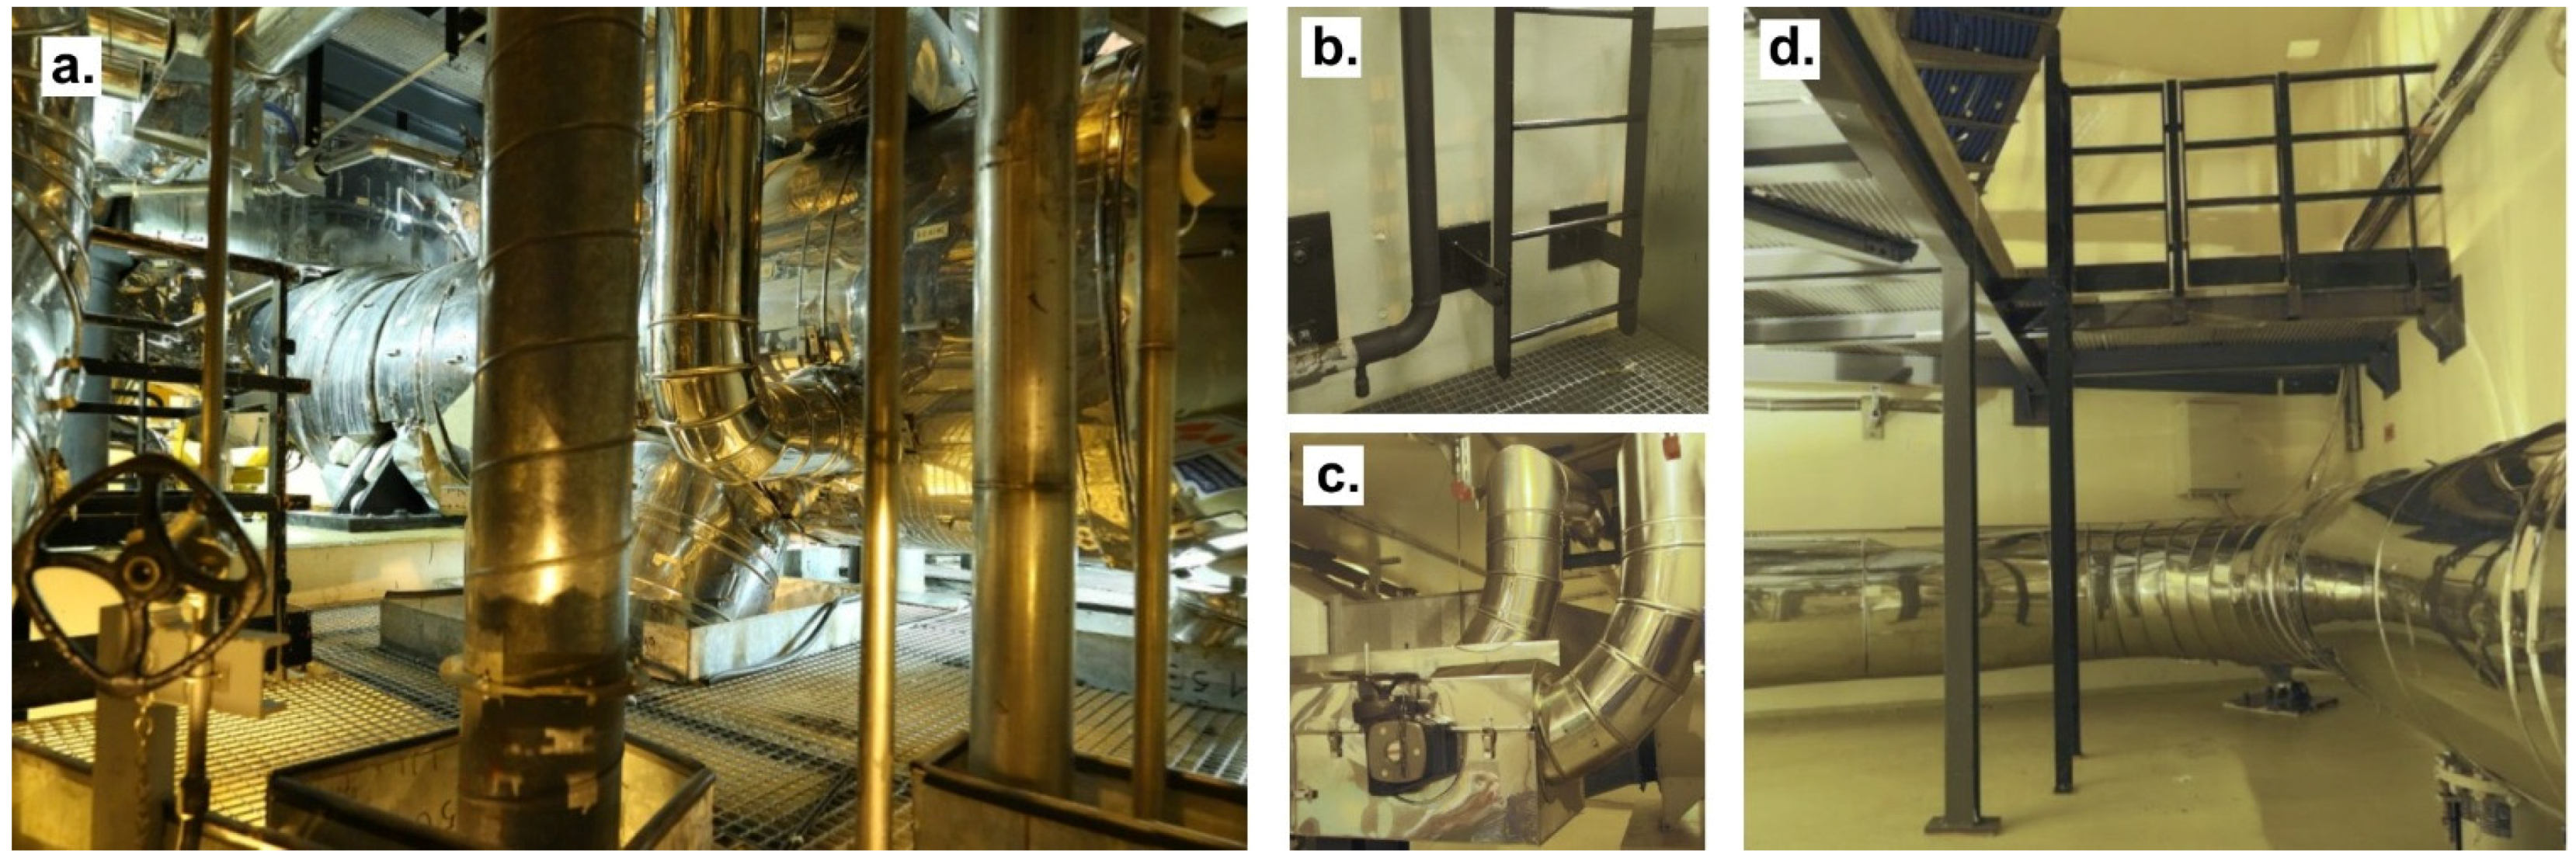
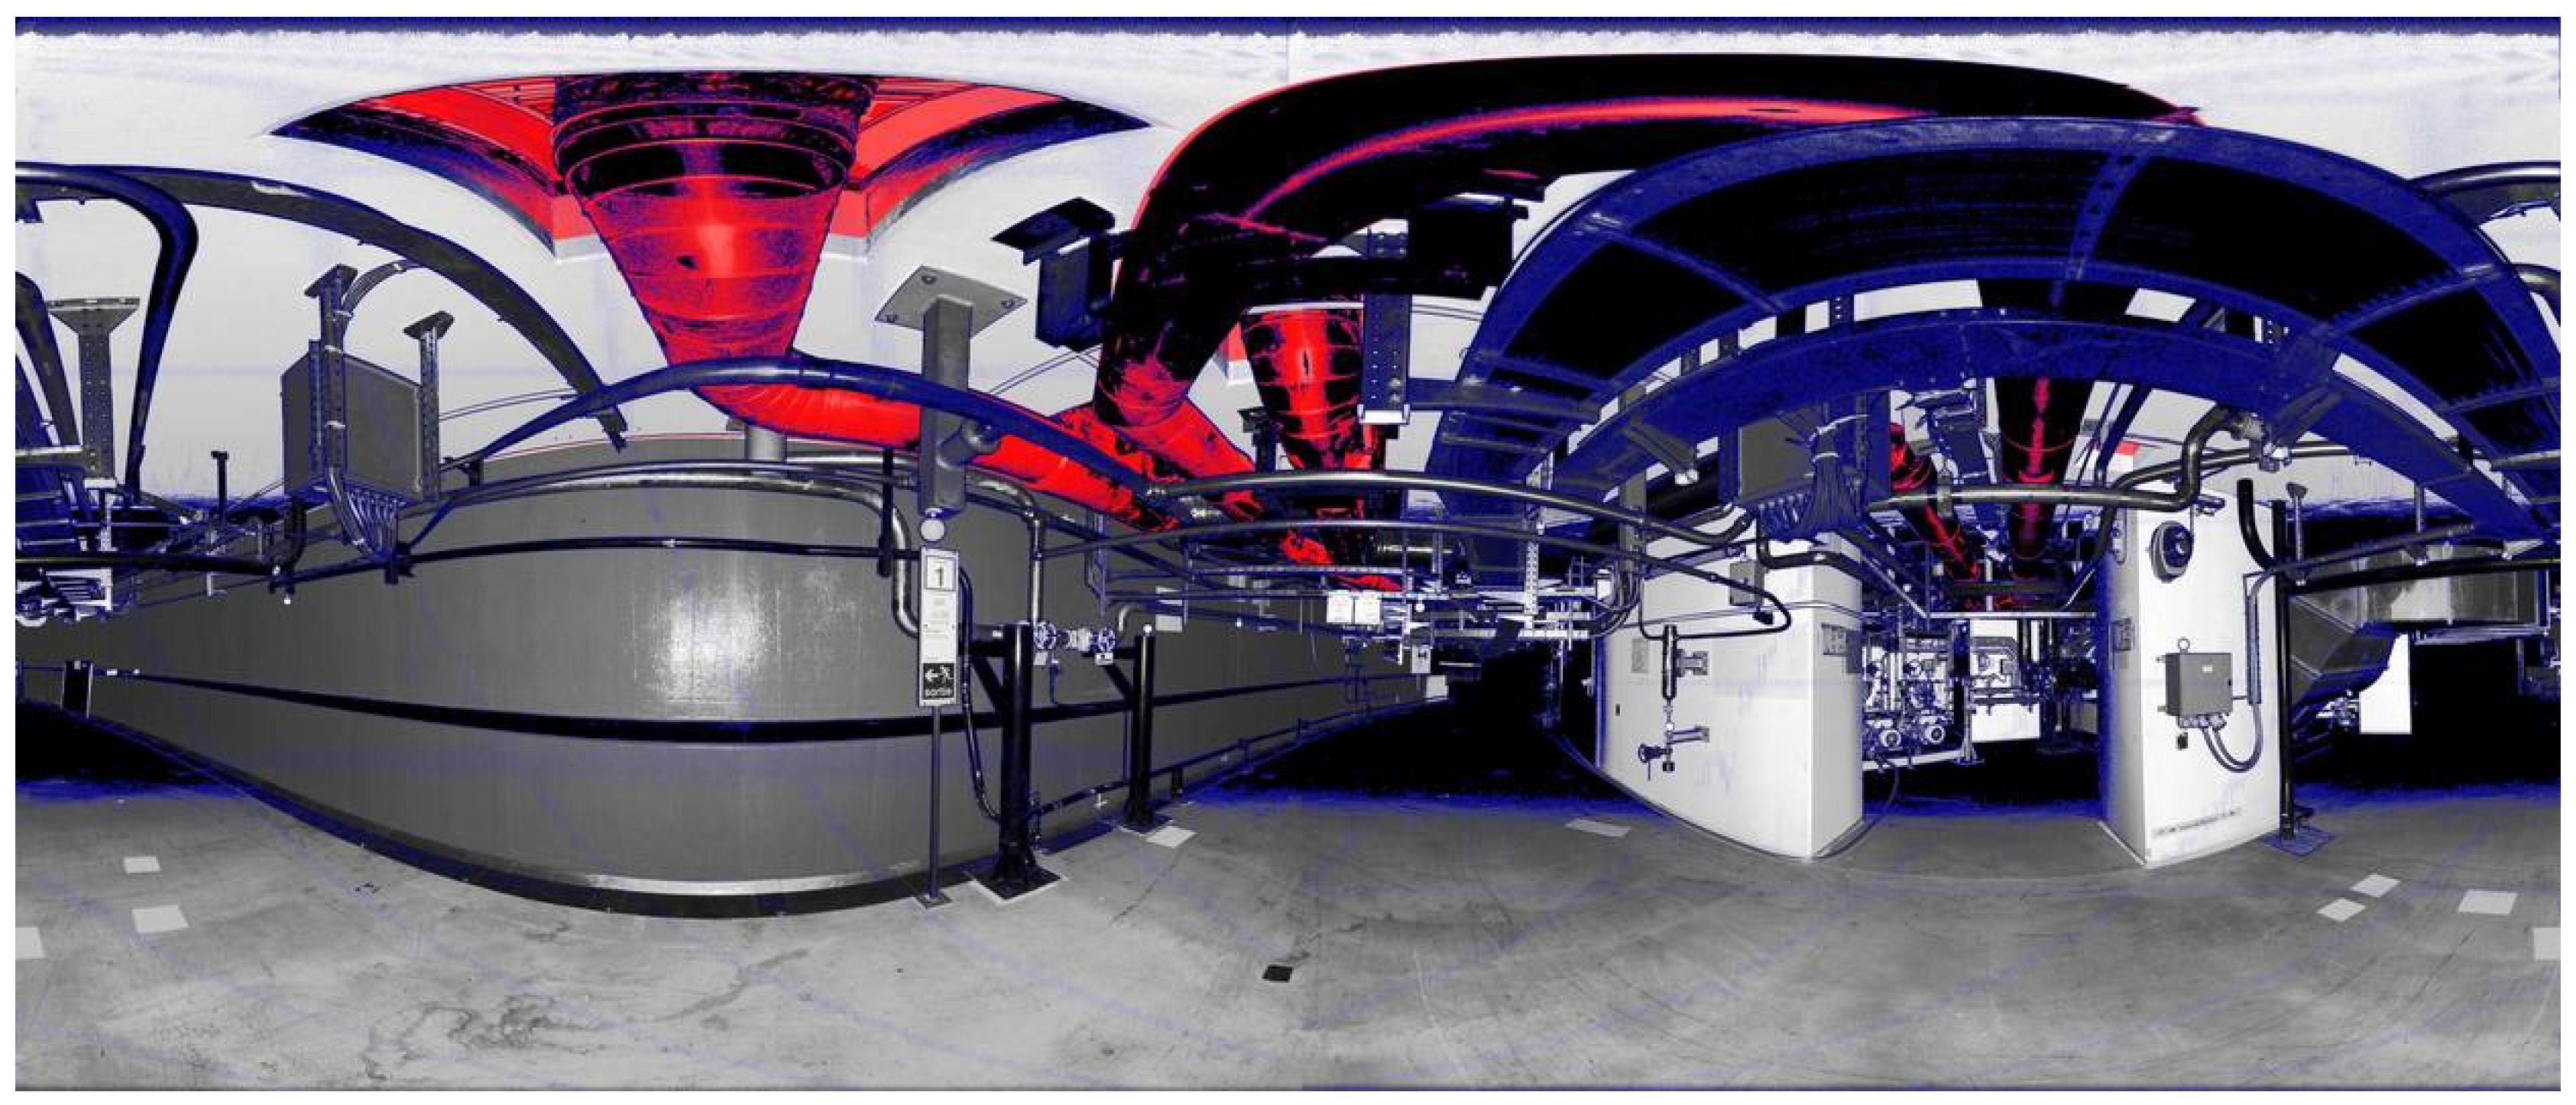
  • Several tests on TLS sensors have shown that, even today, the scanning of dark surfaces is not efficient, and the reflective surfaces lead to billions of erroneous 3D points that cannot be filtered by current firmware or software. These points are certainly an issue for 3D reconstructions, but mostly for taking measurements of so-called “bubble views” or station-based views where no feedback on the real position of 3D points is given. Our solution consisted of developing an efficient interface to perform a manual segmentation of these outliers Figure 7.
  • Without better algorithms for the fine referencing of TLS dataset and large 3D networks, the only way to comply with a global 2.58σ tolerance of 2 cm accuracy overall, the dataset consists of creating sub-networks with fewer than 200 stations, independently referenced to the external reference system. This constraint implies thorough planning on site for placing and surveying targets. Recent developments have shown that we can expect better results in automation and quality by bundler snooping (moving targets) and the use of robust estimation well known from geodesists [36].
Figure 7. An example of blunder removal in a 3D scan. Blue: 3D points filtered automatically. Red: 3D points manually segmented (the average segmentation time is 6.5 minutes per station).
Remotesensing 07 15827 g007
Discussion on processing panoramic images: The level of automation and the quality of output using modern stitching software, such as the one we used, Kolor AutoPanoPro, are very good. However, some issues still have to be addressed:
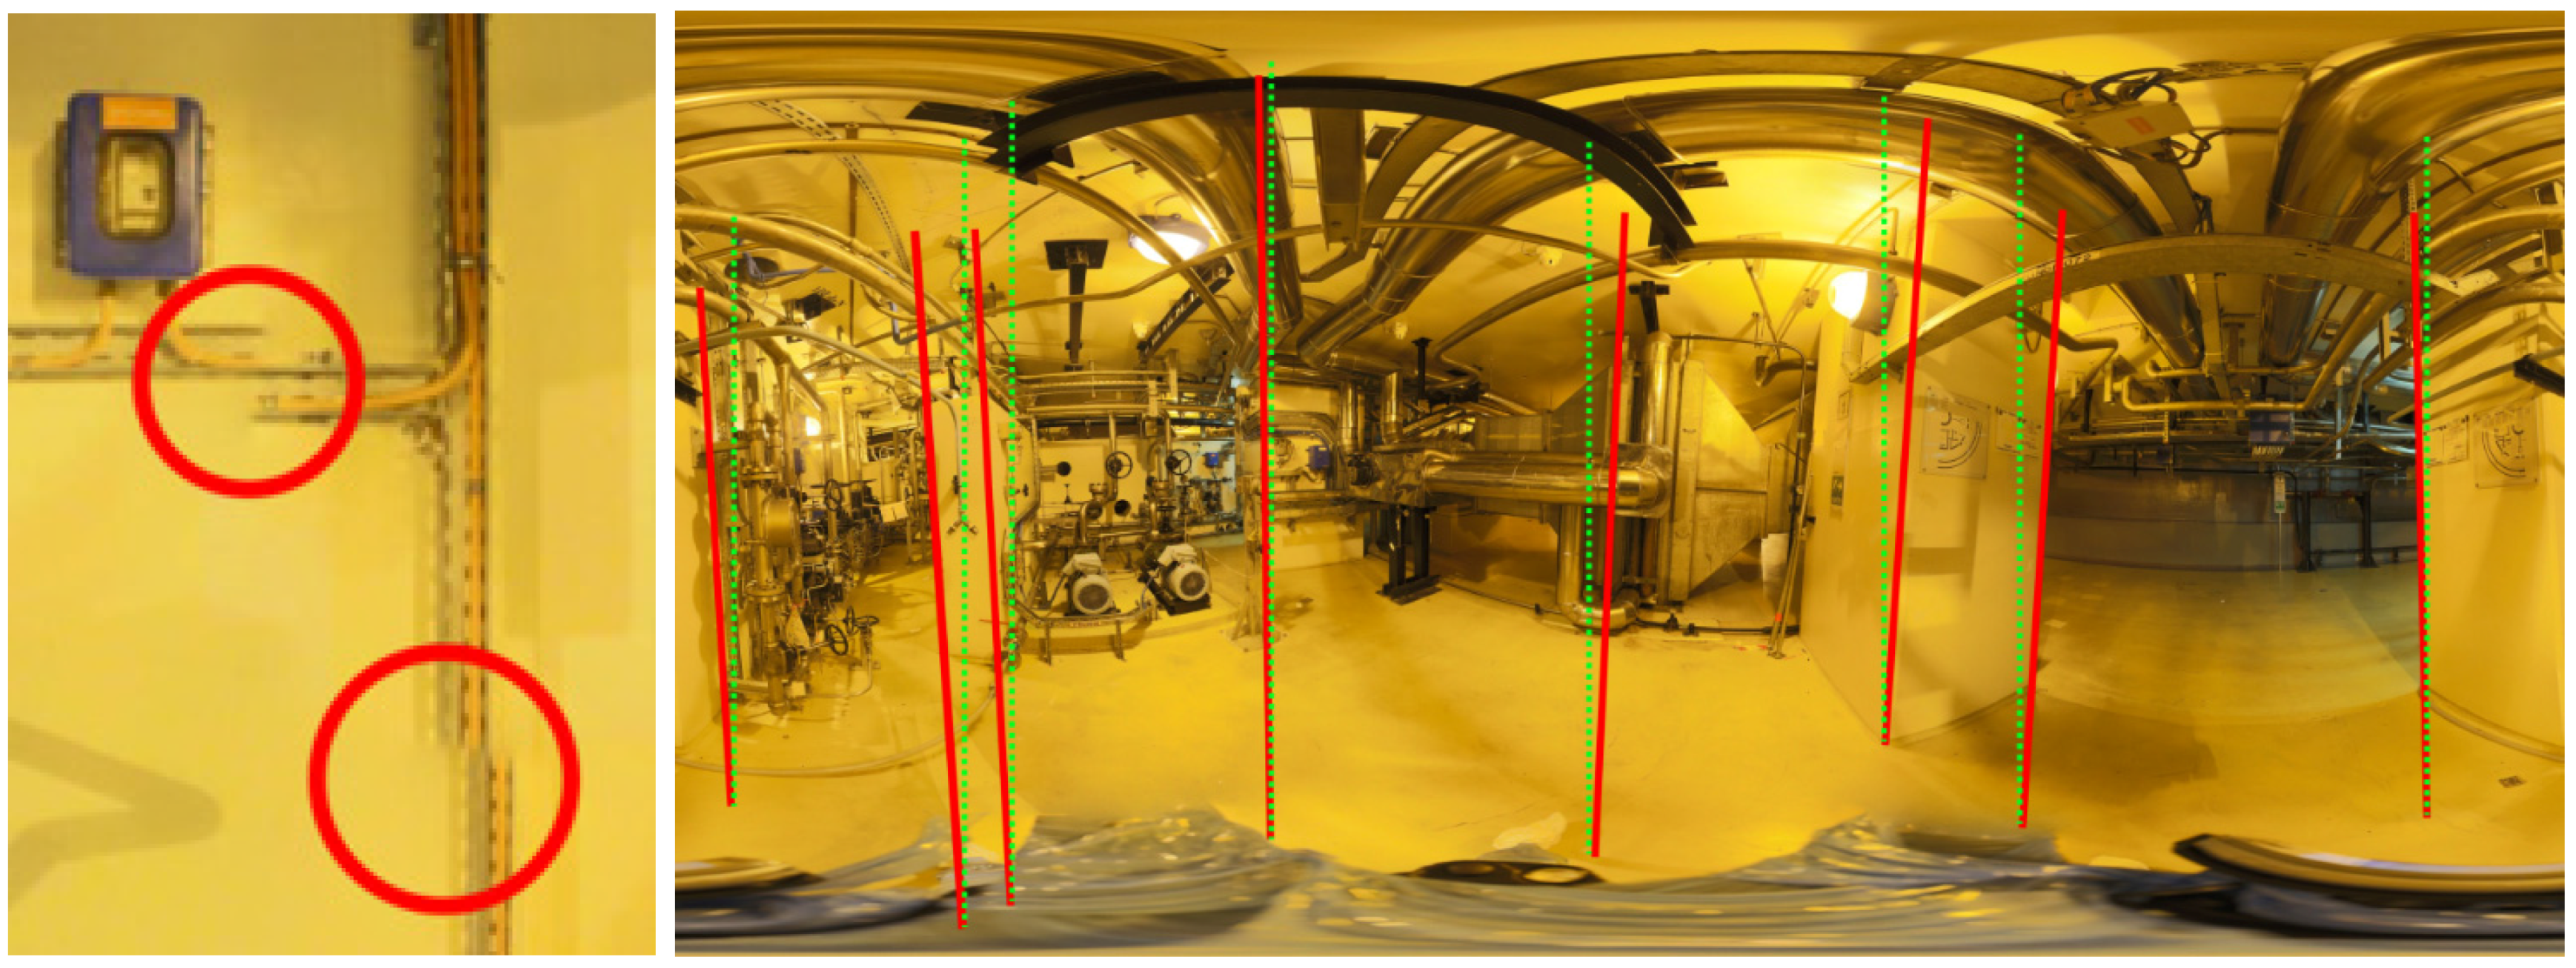
  • When dealing with 450 Mpixel images of indoor scenes, the field of view of a single picture is quite small and can lead to a lack of feature points when only uniform objects, such as a painted wall, are visible in the picture. The Level 2 control procedure has led to the reopening of 20% of the panoramic stitches for editing;
  • Another recurrent error in panoramic images consists of estimating verticality, based on the images. In congested environments, default settings can lead to errors of up to 20° in that estimate. We recommend either the use of leveled panoramic heads with custom settings for estimating the relative position of unit images or the use of vertical definition tools through the software interface;
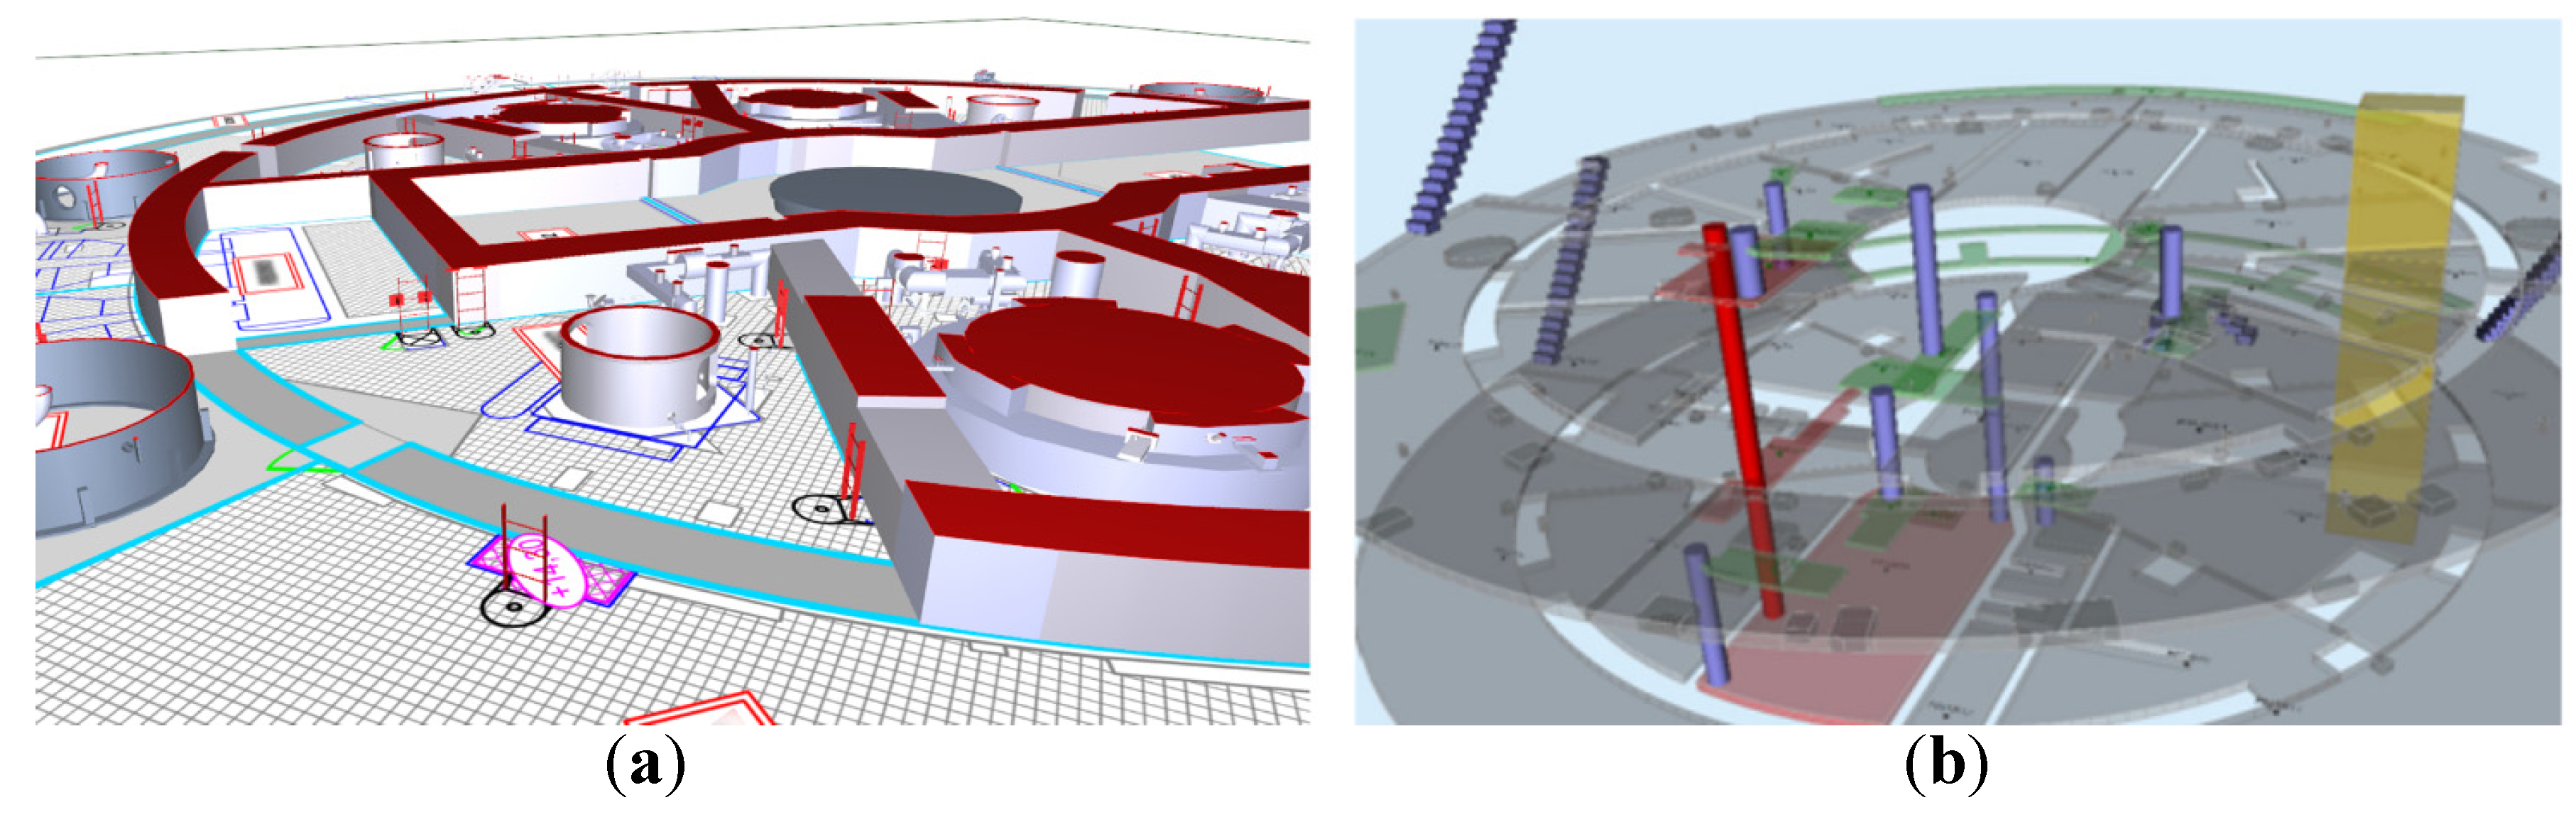
  • A major issue is the registration of the panoramic images on the external reference frame; see Figure 8. As will be discussed later on, the fine registration of panoramic images is valuable in assisting with the quality control of 3D reconstructions and offers a better user experience when browsing the dataset. We will address this issue later in this paper.
Discussion on restructuring and updating 2D floor maps: A global model of the plant is key data for designing the structure of the dataset, unifying the names of the objects and performing an analysis on it. By constructing a graph of the various objects and their relationships (adjacency, verticality, inclusion, etc.), it makes it possible to answer questions like “What are the panoramic images taken in the rooms adjacent to a specific one?” or “Can I access a specific location in the building without taking ladders?”
This entire graph database was built using structured 2D floor plans, updated using the 3D dataset: walls, grounds, ladders, stairs and many others; cf. Figure 9a. These as-built floor plans were then automatically processed to extract all of the required information and to build a “topological graph”, describing several properties of the installation (shape, location, names, types, navigation, access, etc.), as well as rendering specific maps using style sheets. A previous example of this kind of approach can be seen in [37]. This graph is then used in the software applications that we developed, in order to answer queries on the semantic, geometric or topological properties of the building and its components; cf. Figure 9b.
Figure 8. Typical issues in panoramic images. A lack of texture can lead to glitches in the final image (Left). The estimated vertical may have to be refined manually because horizon estimation algorithms can fail up to 15° (Right).
Remotesensing 07 15827 g008
Regarding the processing steps for the floor maps, the pipeline is as follows:
(1)
Redraw existing floor maps in AutoCAD, following specific drawing rules and using only two types of objects: polylines and blocks (manual);
(2)
Compare the 3D as-built model and panoramic images to floor plans in a specific tool developed in Unity3D, to update them in AutoCAD (manual);
(3)
Convert polygons of floor maps to Scalable Vector Graphics (SVG) files (automatic) and export the blocks to XLS using EXTATTBE in AutoCAD (automatic);
(4)
In a dedicated C# tool, instantiate a class model of objects of the building:
  • For each floor:
    • import SVG and XLS to instantiate a relational model of the building (floors, ladders, walls, etc.), including controls to check with respect to the drawing rules,
    • using a Clipper Library clipping algorithm [38] and threshold, compute relations between objects, such as adjacency, inclusion, etc.
  • For each pair of floors:
    • Connect objects, such as elevators, ladders, stairs,
    • Using Clipper Library, compute vertical relationships between objects.
(5)
Export the instantiated building model to a topological graph in XML, with a description of the building model in XML Schema Definition (XSD).
Discussion on the 3D CAD reconstruction based on the TLS point cloud: A large dataset of 40 billion 3D points was used to reconstruct an as-built 3D CAD model of the facility (see Figure 10). The main part of the 3D reconstruction was produced using Trimble RealWorks Version 8.x (80% of the final CAD model); some objects from a pre-existing CAD model were adjusted in Dassault Systems SolidWorks, as well as other equipment that could not be modeled as a combination of primitive shapes (see Subsection 2.3.3). As illustrated in Figure 6, the 3D reconstruction was the main line in the budget of the data production. In order to meet end users’ needs, the quality levels of the 3D data produced had to be defined in accordance with their intended uses: maintenance task planning (including the associated logistics: access, scaffolds, handling areas), worker safety and virtual tour for low accessibility rooms by inexperienced professionals.
Figure 9. 2D as-built floor maps (a) updated using the 3D as-built dataset, laser scans and panoramic images; (b) An interactive Virtual Reality Modeling Language (VRML) visualization of a semantic, geometric and topological representation of the building, based on the as-built floor maps [1].
Remotesensing 07 15827 g009
Figure 10. The dense data sources used for as-built reconstruction of the nuclear reactor building from point clouds: (a) 1025 panoramic images with 450 million of pixels; (b) 1085 laser scans with 40 million 3D points; (c) 3D reconstruction of 25 types of objects with specific rules (fitting tolerances and naming encodings) and (d) as-built CAD model with 100 rooms and 100,000 3D objects.
Remotesensing 07 15827 g010
The consequences of this multiplicity of needs led to a detailed specification for 3D reconstruction tasks depending on the object type among the 25 categories used: fitting tolerances, naming and methods (cloud least-square fitting, region growing cloud-shape fitting, cloud snapping and copies). The use of precisely georeferenced panoramic RGB images was very valuable in the reconstruction process to help with understanding complex areas.
In order to deal with the huge amount of work and to reduce the time of data delivery, the 3D CAD reconstruction had to be split and parallelized by sectors and then allocated to half a dozen CAD operators for almost a year (10 months). To achieve and certify the quality of the reconstructed as-built model, a Level 2 check procedure was carried out by two independent operators and led to further iterations and re-working (approximately 10% of the total effort). This validation was performed using mesh-cloud distance computations, by using software originally developed by EDF R&D and Telecom ParisTech (CloudCompare [33]) and “out-of-core” technologies to display a maximum number of points for the visual inspection in Trimble RealWorks 8.x, guided by the analysis of an SQL database storing the standard deviation of each reconstructed geometry (~80,000 objects).

3.4. Summary of Tool Development during the Project

Many tools (hardware and software) were used to produce both the data and end-user applications. Some of them were satisfactory, but many had to be improved during the project.
Acquisition and stitching of RGB panoramic images: Canon EOS 5D cameras with a Dr Clauss motorized head were used. For stitching, mapping and blending, Kolor AutoPano was used, and XNview MP was very useful for batch conversions, resampling and renaming. None of the tools were improved.
Acquisition and processing of the TLS dataset: Leica HDS 6000 and 7000 with total stations were used. The Z+F software was used to convert and filter scans. Specific settings were added to that software for improve the results. For registering scans, Leica Cyclone was used. For manual segmentation, we had to add new features in Trimble RealWorks, used to remove noise that could not be filtered out (mirrors).
Floor plan editing and processing: Floor plans were edited in AutoCAD, and a specific tool had to be implemented in Unity3D to compare them to the as-built 3D CAD model. All of the processing, converting and analysis steps required to create the “topological graph” were made in a custom tool developed in C#, using Clipper Library, based on a Vatti clipping algorithm [38].
3D as-built CAD reconstruction and conversions: For main walls and civils works, Dassault Systems SolidWorks was used. For all of the other objects, Trimble Realworks was used and had to be improved to increase productivity (shortcuts, color palette, debugging fitting tools, etc.), as well as quality, by developing a dedicated SQL plug-in to store metadata for each 3D object (“was the object fitted or manually adjusted?”, “is the object a copy?”, etc.). For two-level control procedures, Hexagon 3DReshaper and CloudCompare were used. CloudCompare was specially enhanced for this project. In addition to the edition and conversion features offered by SAP Visual Enterprise Authors, we developed advanced scripts using Windows PowerShell.

4. Example of Specific Development to Reach Quality Expectations for Referencing Panoramic Images Precisely

During acquisition, panoramic images were roughly located on a map and oriented to the north. However, many usage examples have underlined the need for estimated correct pose in these images (dataset navigation, 3D reconstruction quality check through overlay, etc.). We propose several solutions, using either the TLS dataset, the 2D floor maps or the 3D CAD reconstruction model.

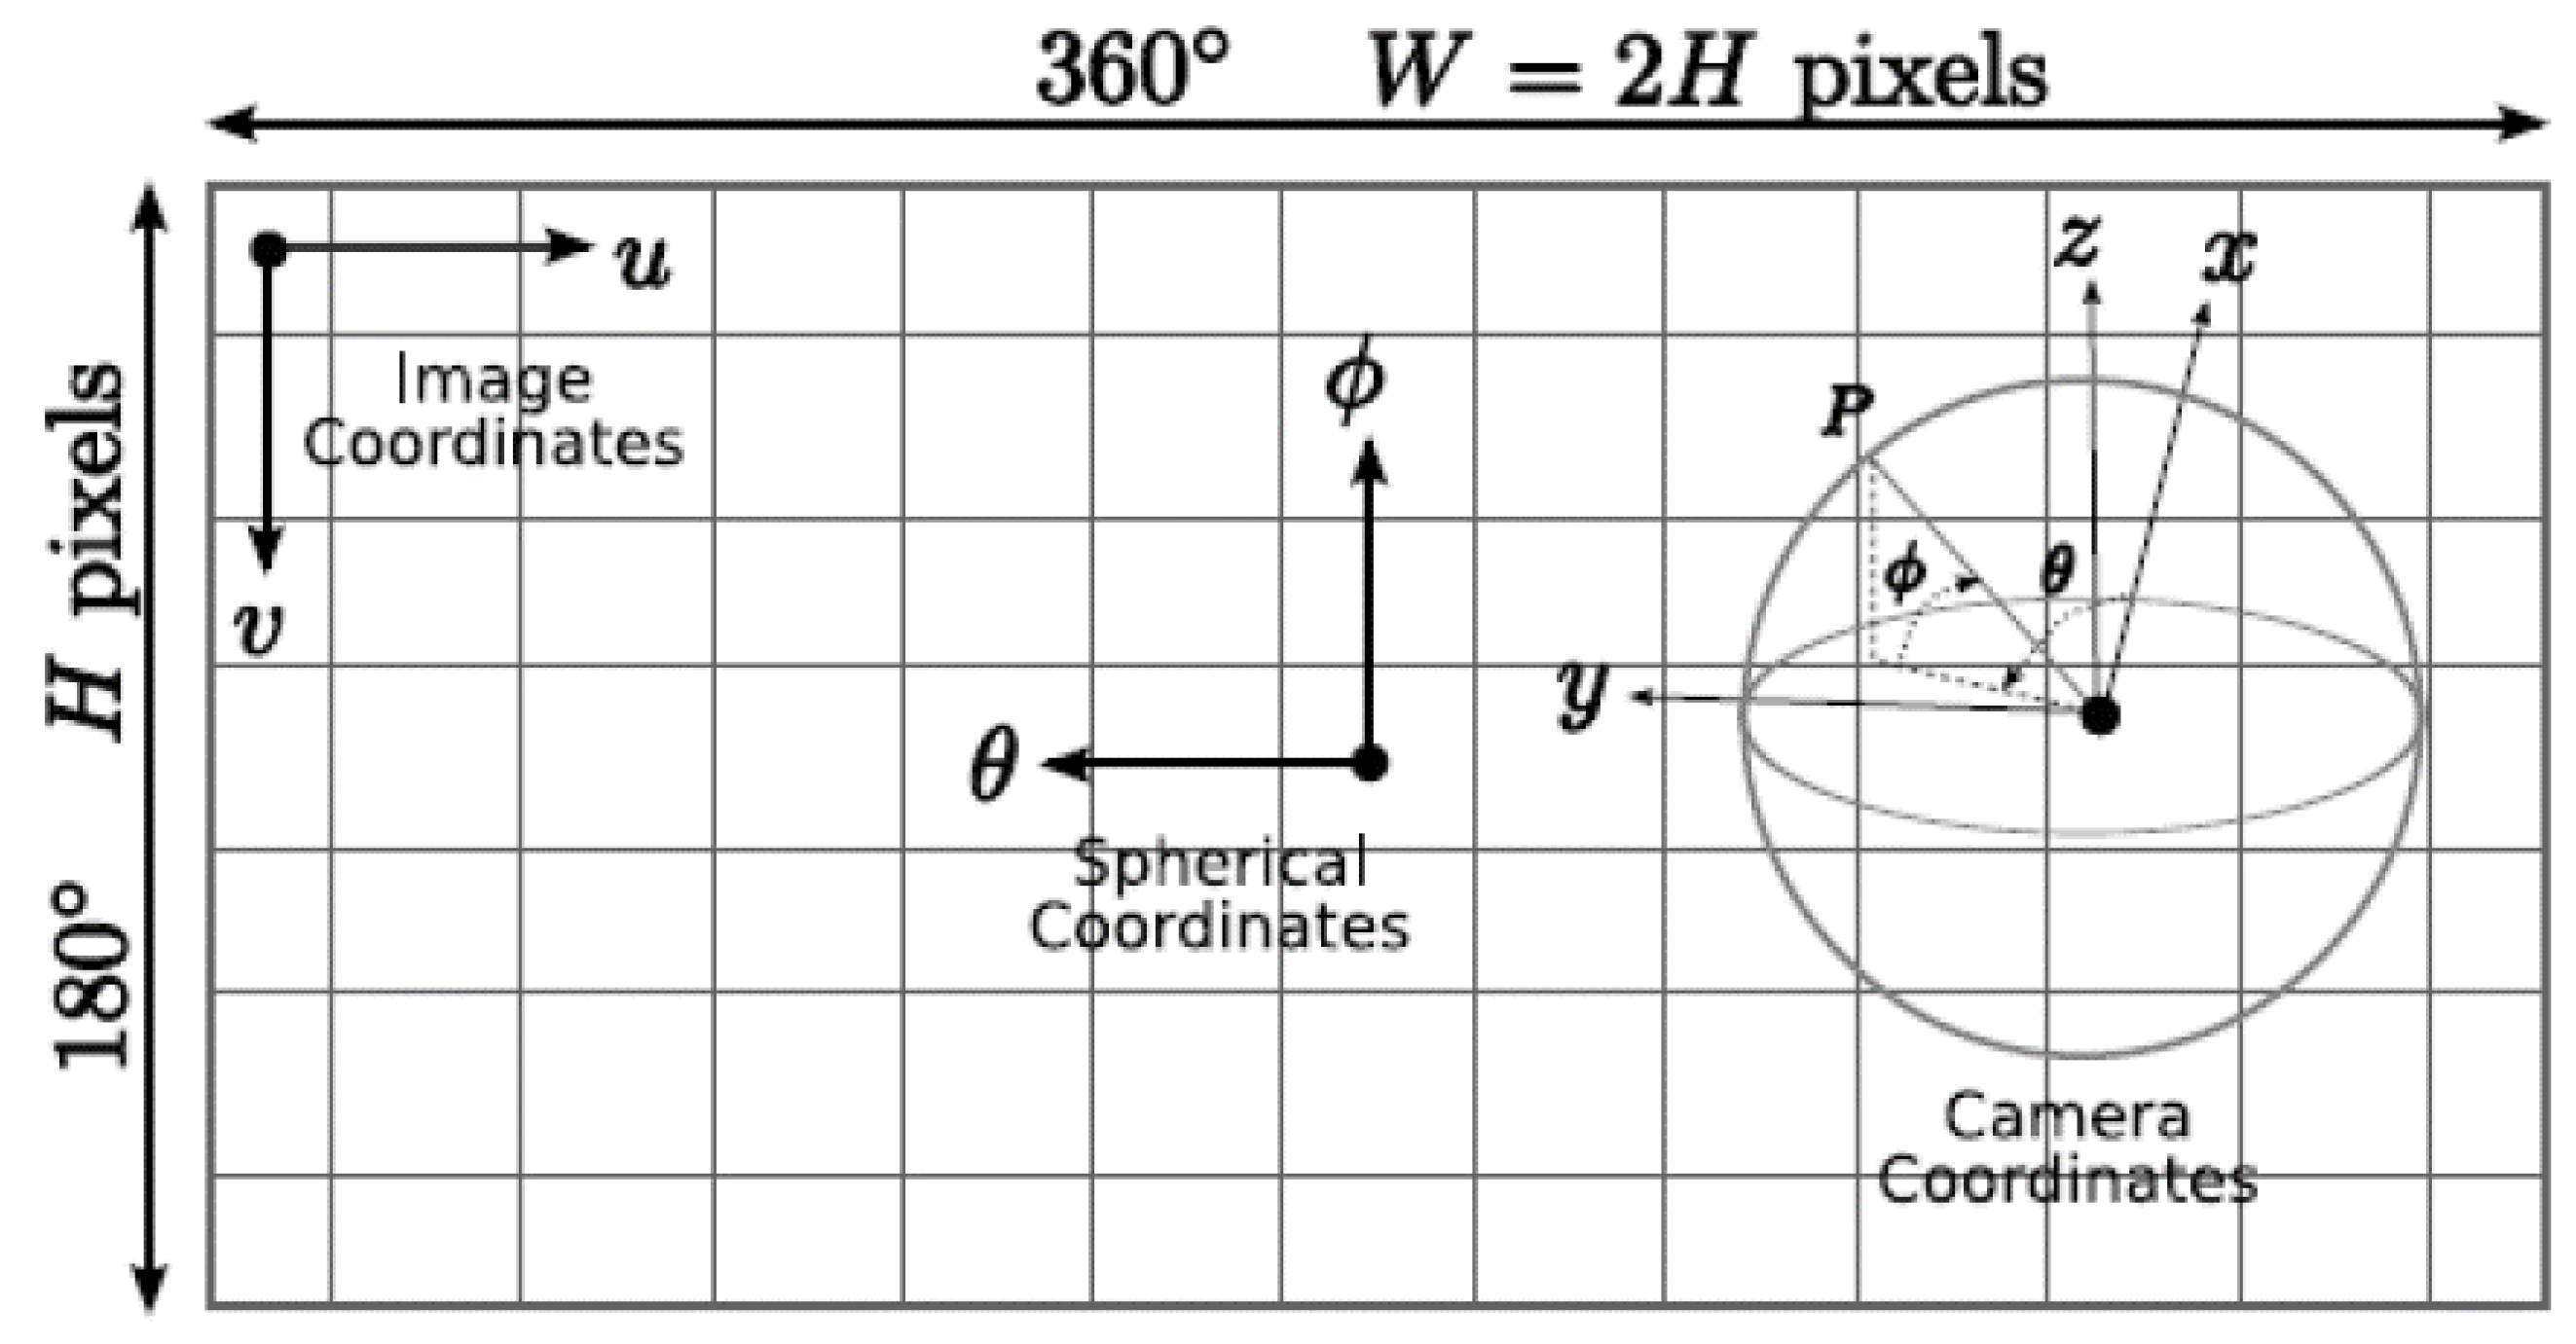
4.1. Camera Model for Panoramic Images

Using an equirectangular projection where the z axis of the reference frame is aligned with the meridians of the panorama (see Figure 11), the spherical coordinates of a pixel can be given using the following relations:
θ = W 2 u W π [ π , π [   ϕ = H 2 v 2 H π [ π 2 , π 2 [
If we represent these pixels on the surface of the sphere, the point mi = (xi, yi, zi) can be calculated from its coordinates (θi, ϕi) using the following relations:
m i = ( c o s ( ϕ ) . c o s ( θ ) , c o s ( ϕ ) . s i n ( θ ) , s i n ( ϕ ) )
The epipolar constraints between two images I1 and I2, with a relative pose composed of a translation three-vector t and a 3 × 3 rotation matrix R, are given for a corresponding pair of points from the two images:
m 2 T E m 1 = 0   where   E = [ t ] × R   is   the   essential   matrix
[t]× is the anti-symmetric matrix induced by the vector product. The locus of epipolar constraint transforms from lines (pinhole cameras) to circles in the case of spherical panoramas.
Figure 11. Spherical image and coordinate axes.
Remotesensing 07 15827 g011

4.2. Pose Estimate Using Constraints between Image Pixels and 3D Points from Laser Scans

For the external pose estimate, i.e., the absolute pose of the panoramic image in the global reference frame, we can use matching feature points between pixels in the image and real world points (for example, from a 3D laser scan of a close station). Thus, the problem is the following, given points mi, the coordinates of the corresponding pixels on the sphere, and Mi, the homogeneous coordinates of 3D:
a i m i = R M i + t = ( R | t ) ( M i 1 ) = P M i ( h o m o g e n . )   where   a i   is   a   scale   factor   for   each   point   i
This can be turned to a linear system problem Ah = 0 as follows, where pj is the j-th row of:
A h = ( M 1 T 0 0 x 1 0 0 0 0 M 1 T 0 y 1 0 0 0 0 0 M 1 T z 1 0 0 0 M 2 T 0 0 0 x 1 0 0 0 M 2 T 0 0 y 1 0 0 0 0 M 0 T 0 0 x 3 0 ) ( p 1 T p 2 T p 3 T a 11 a 22 ) = 0
We solve this linear system by choosing h as the last column of V where A + UDVT is the singular value decomposition of A. Taking the 12 entries of h, we obtain Pest (estimated P), which differs from P by a scale factor k, that can be solved through:
k = | | P e s t M i | | a 2 i
we can choose k as the average value computed from n points.
In our case, panoramas are “vertical”, which simplifies the extraction of the only non-zero rotation angle κ (using Tait–Bryan angles) and t values from P. Thus, to solve pose estimation, we need a few reliable and well-distributed matching pairs. This can be done manually or automatically using a feature point extraction algorithm and more robust estimating schemes. However, achieving stable results in matching and pose estimates for the whole dataset is tedious, and manual editing requires a dedicated interface. In the next two sections, we propose interfaces for using either 2D maps or 3D as-built CAD models instead of feature point-based methods.

4.3. Partial Pose Estimate of Panoramic Images Using 2D Floor Maps

A user-oriented approach was implemented to get a first “independent” estimate of parameters (tx, ty) and (κ) of a vertical panoramic image by using 2D floor maps. Using a user interface with a synchronization of the panoramic view and its position with the camera orientation on the 2D floor map, the procedure followed by the operator is:
(1)
Move (tx, ty) panoramic using near and identifiable details of the floor maps by estimating the ratio of distances (doors, holes in floors, etc.);
(2)
Orient (κ) using far landmarks of the floor maps;
(3)
Check at +90° and +180° and iterate the first two steps until the best estimate.
This method was applied to the entire dataset (1025 panoramic images), and 95% of the images were moved or oriented (970); see Figure 12. The average processing and control time for one panoramic image is 1 min 50 s.
Figure 12. User interface of the partial pose estimation tool. The camera position, orientation and field of view of the panoramic image are synchronized with the floor map (Top). A central cross helps the sighting of landmarks; Key numbers of the corrections using 2D maps (1025 images) (Bottom).
Remotesensing 07 15827 g012

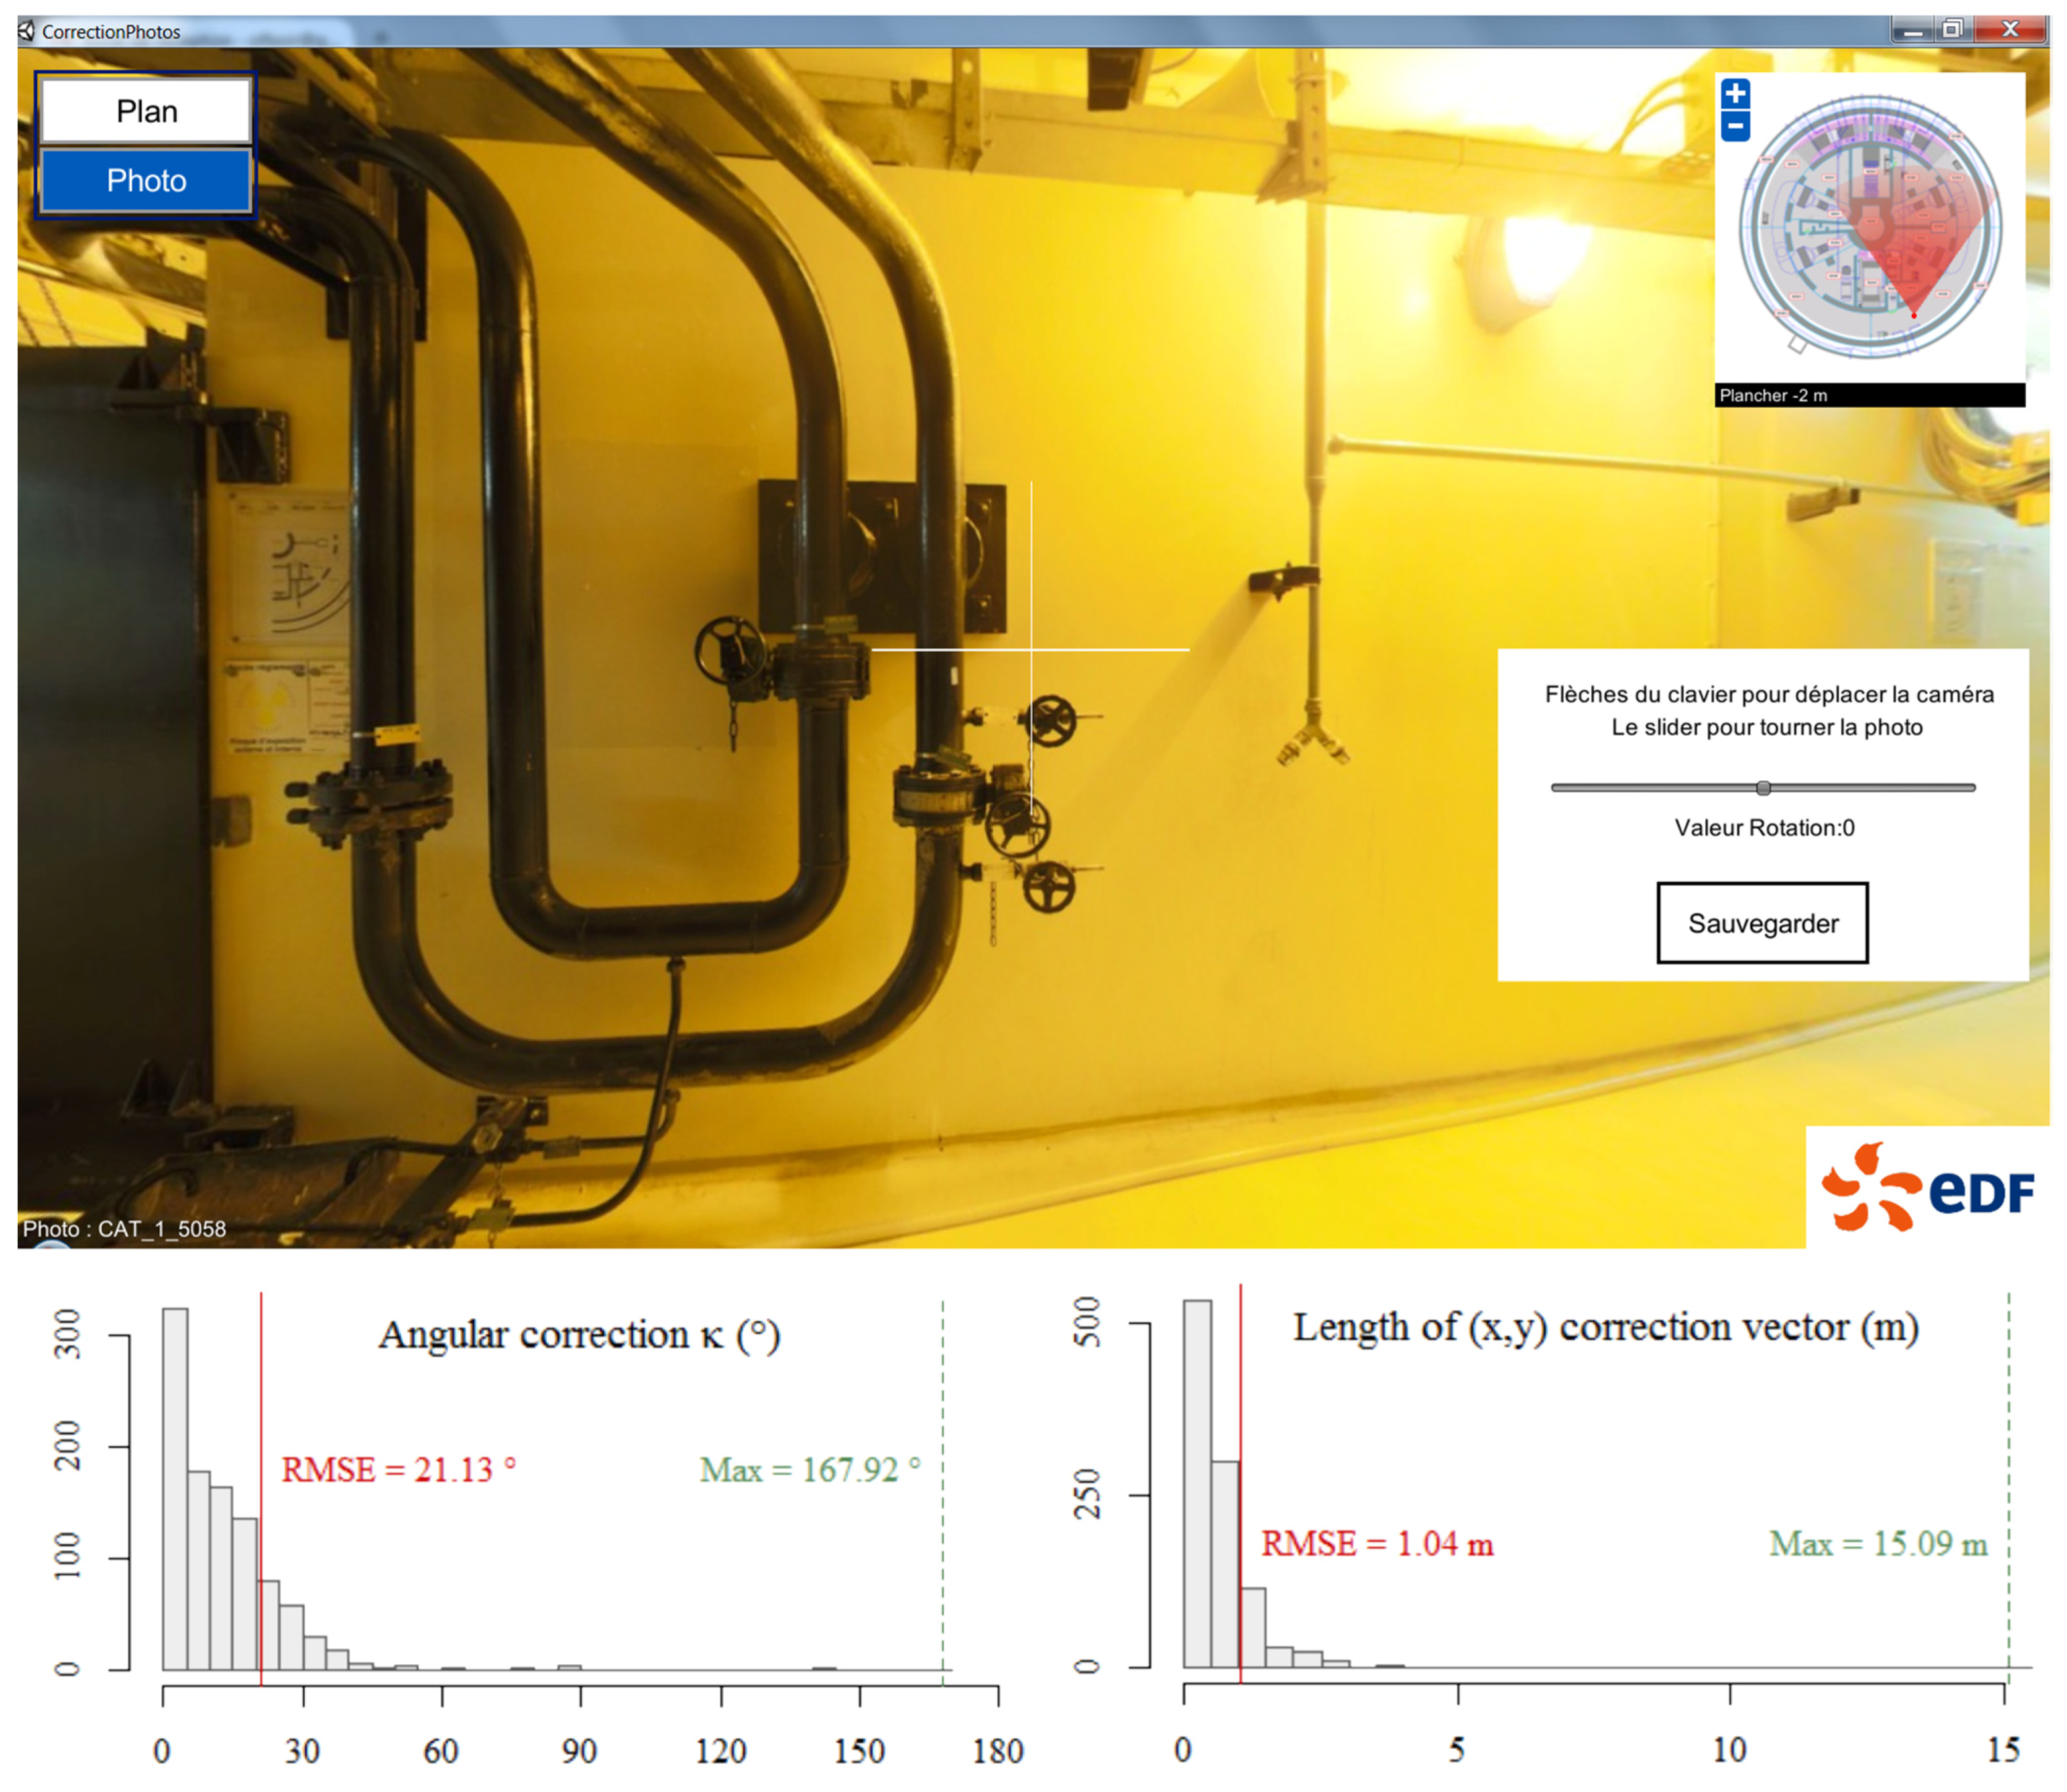
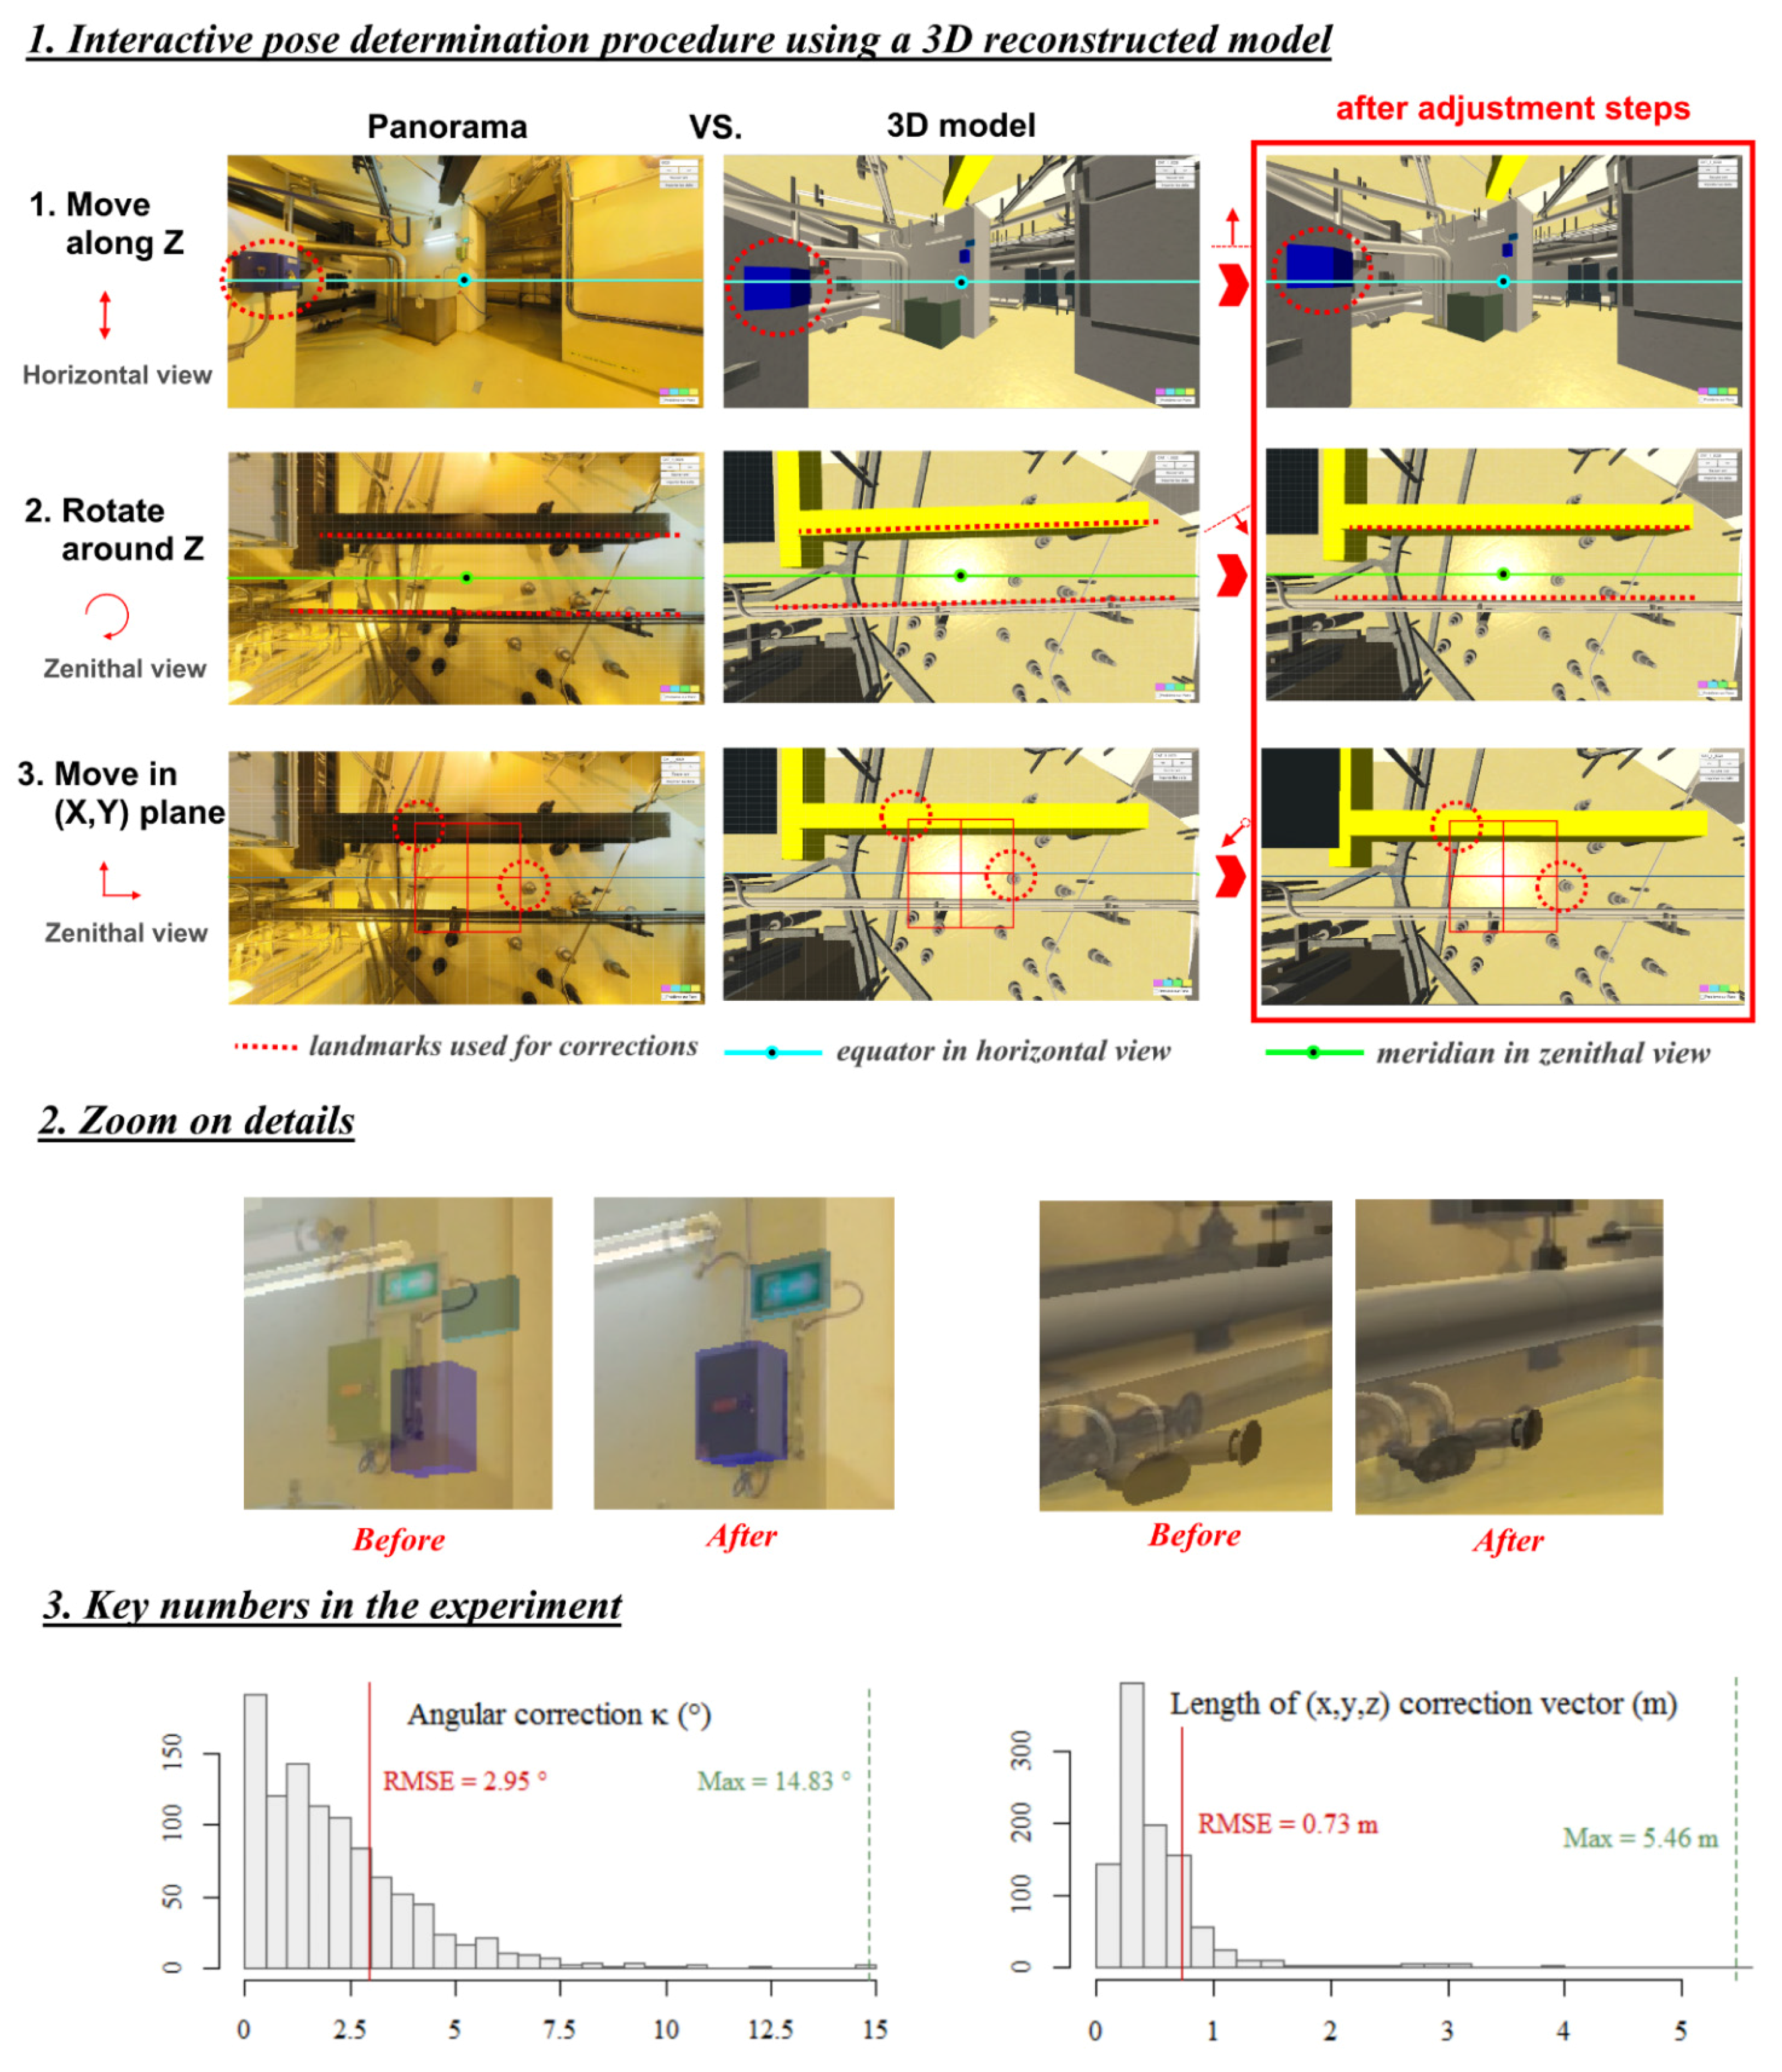
4.4. Full Pose Estimate of Panoramic Images Using the 3D As-Built Dataset

Another user-oriented approach was developed to refine the whole pose (including tz) of the panoramic images (tx, ty, tz) and (κ) given the hypothesis of verticality (ω = 0, ϕ = 0). Using a user interface with a synchronization of the panoramic view and its position with the camera orientation in the 3D model and using switches for overlay and transparency, the procedure followed by the operator consists of independently correcting the four parameters of the pose; see Figure 13:
(1)
Move (tz) panoramic using landmarks of the 3D model that cross the equator of the panoramic in the image (boxes, stairs, guardrail, etc.); front view;
(2)
Align (κ) panoramic using parallel objects of the 3D model to any meridian of the panoramic in the image (pipes, beams, etc.); zenith view;
(3)
Move (tx, ty) panoramic using landmarks on the ceiling of the 3D model to align them to the zenith of the image; zenith view;
(4)
Check horizontally for any issue at +90° and +180° and iterate the first three steps until the best estimate; an incorrect estimate of the vertical when mapping the panorama is the main source of a poor estimate of the pose of the panoramic, and such a panoramic should be corrected.
This method was applied to the entire dataset after the first estimate on 2D floor maps (1025 panoramic images). During this process, we moved and oriented 100% of the images (1025). The average processing and control time for one panoramic image is 30 s for low corrections and 1 min 30 s–2 min for more difficult images.

4.5. Overall Feedback on the Experiment and Discussion on Future Large Scanning Surveys

Even for a company with over 20 years’ experience in the field of as-built documentation, a multi-sensor and dense scanning survey on the scale of an entire 11-floor building remains a challenge, for which tools and methods have not yet been designed.
In addition to the several recommendations and choices that were set out in the previous paragraphs, our experiment highlighted some specific aspects of large and multi-sensor scanning surveys in complex architectures. For these projects that respond to the growing need for as-built data for professionals, we recommend:
  • specifying needs, requirements and constraints in detail. On the scale of a building, every misunderstanding or fuzzy specification may have a severe impact on costs, quality or durations;
  • documenting every step in the process and performing quality monitoring from the beginning, to help both fixing non-conforming data and enriching the dataset for future use;
  • parallelizing the tasks as much as possible (acquisition and post-processing); when the data production time increases, the number of non-qualities increases significantly.
Regarding remaining bottlenecks, we have mentioned several technical brakes on the generalization of current tools and methods for large and complex buildings, regarding raw data acquisition and processing. We have also discussed the three areas of 3D reconstruction: costs, duration and quality. Since the real requirement is the third one, the first two areas must be viewed as secondary in achieving the dataset in industrial processes. The low level of automation and the low quality of acquisition sensors and tools are the actual brakes on generalization. However, by performing rigorous quality monitoring and control, each dataset can be produced with a high degree of confidence. In such large projects, traceability is one of the keys to quality management. The Figure 2 gives a global overview of the whole framework of as-built data production; we can see that many steps are required, including many tools and human interactions. As shown, also, many control procedures are required to reach and certify a quality level. Indeed, the main drawback for achieving expected quality levels is the difficult inter-validation of data sources. To perform such a quality control policy, the dataset has to be merged, compared and visualized altogether. Nevertheless, due to the limitations of current tools and formats, this fusion and exhaustive checking of multi-source datasets remains very tedious.
Figure 13. User interface and procedure for fully estimating the pose of panoramic images in reference to a 3D model (Top); Equator, meridians and central dots help with the alignment and correction of parameters. Zoom on specific details (before/results) (Middle); Key numbers in the corrections using the 3D model (1025 images) (Bottom).
Remotesensing 07 15827 g013

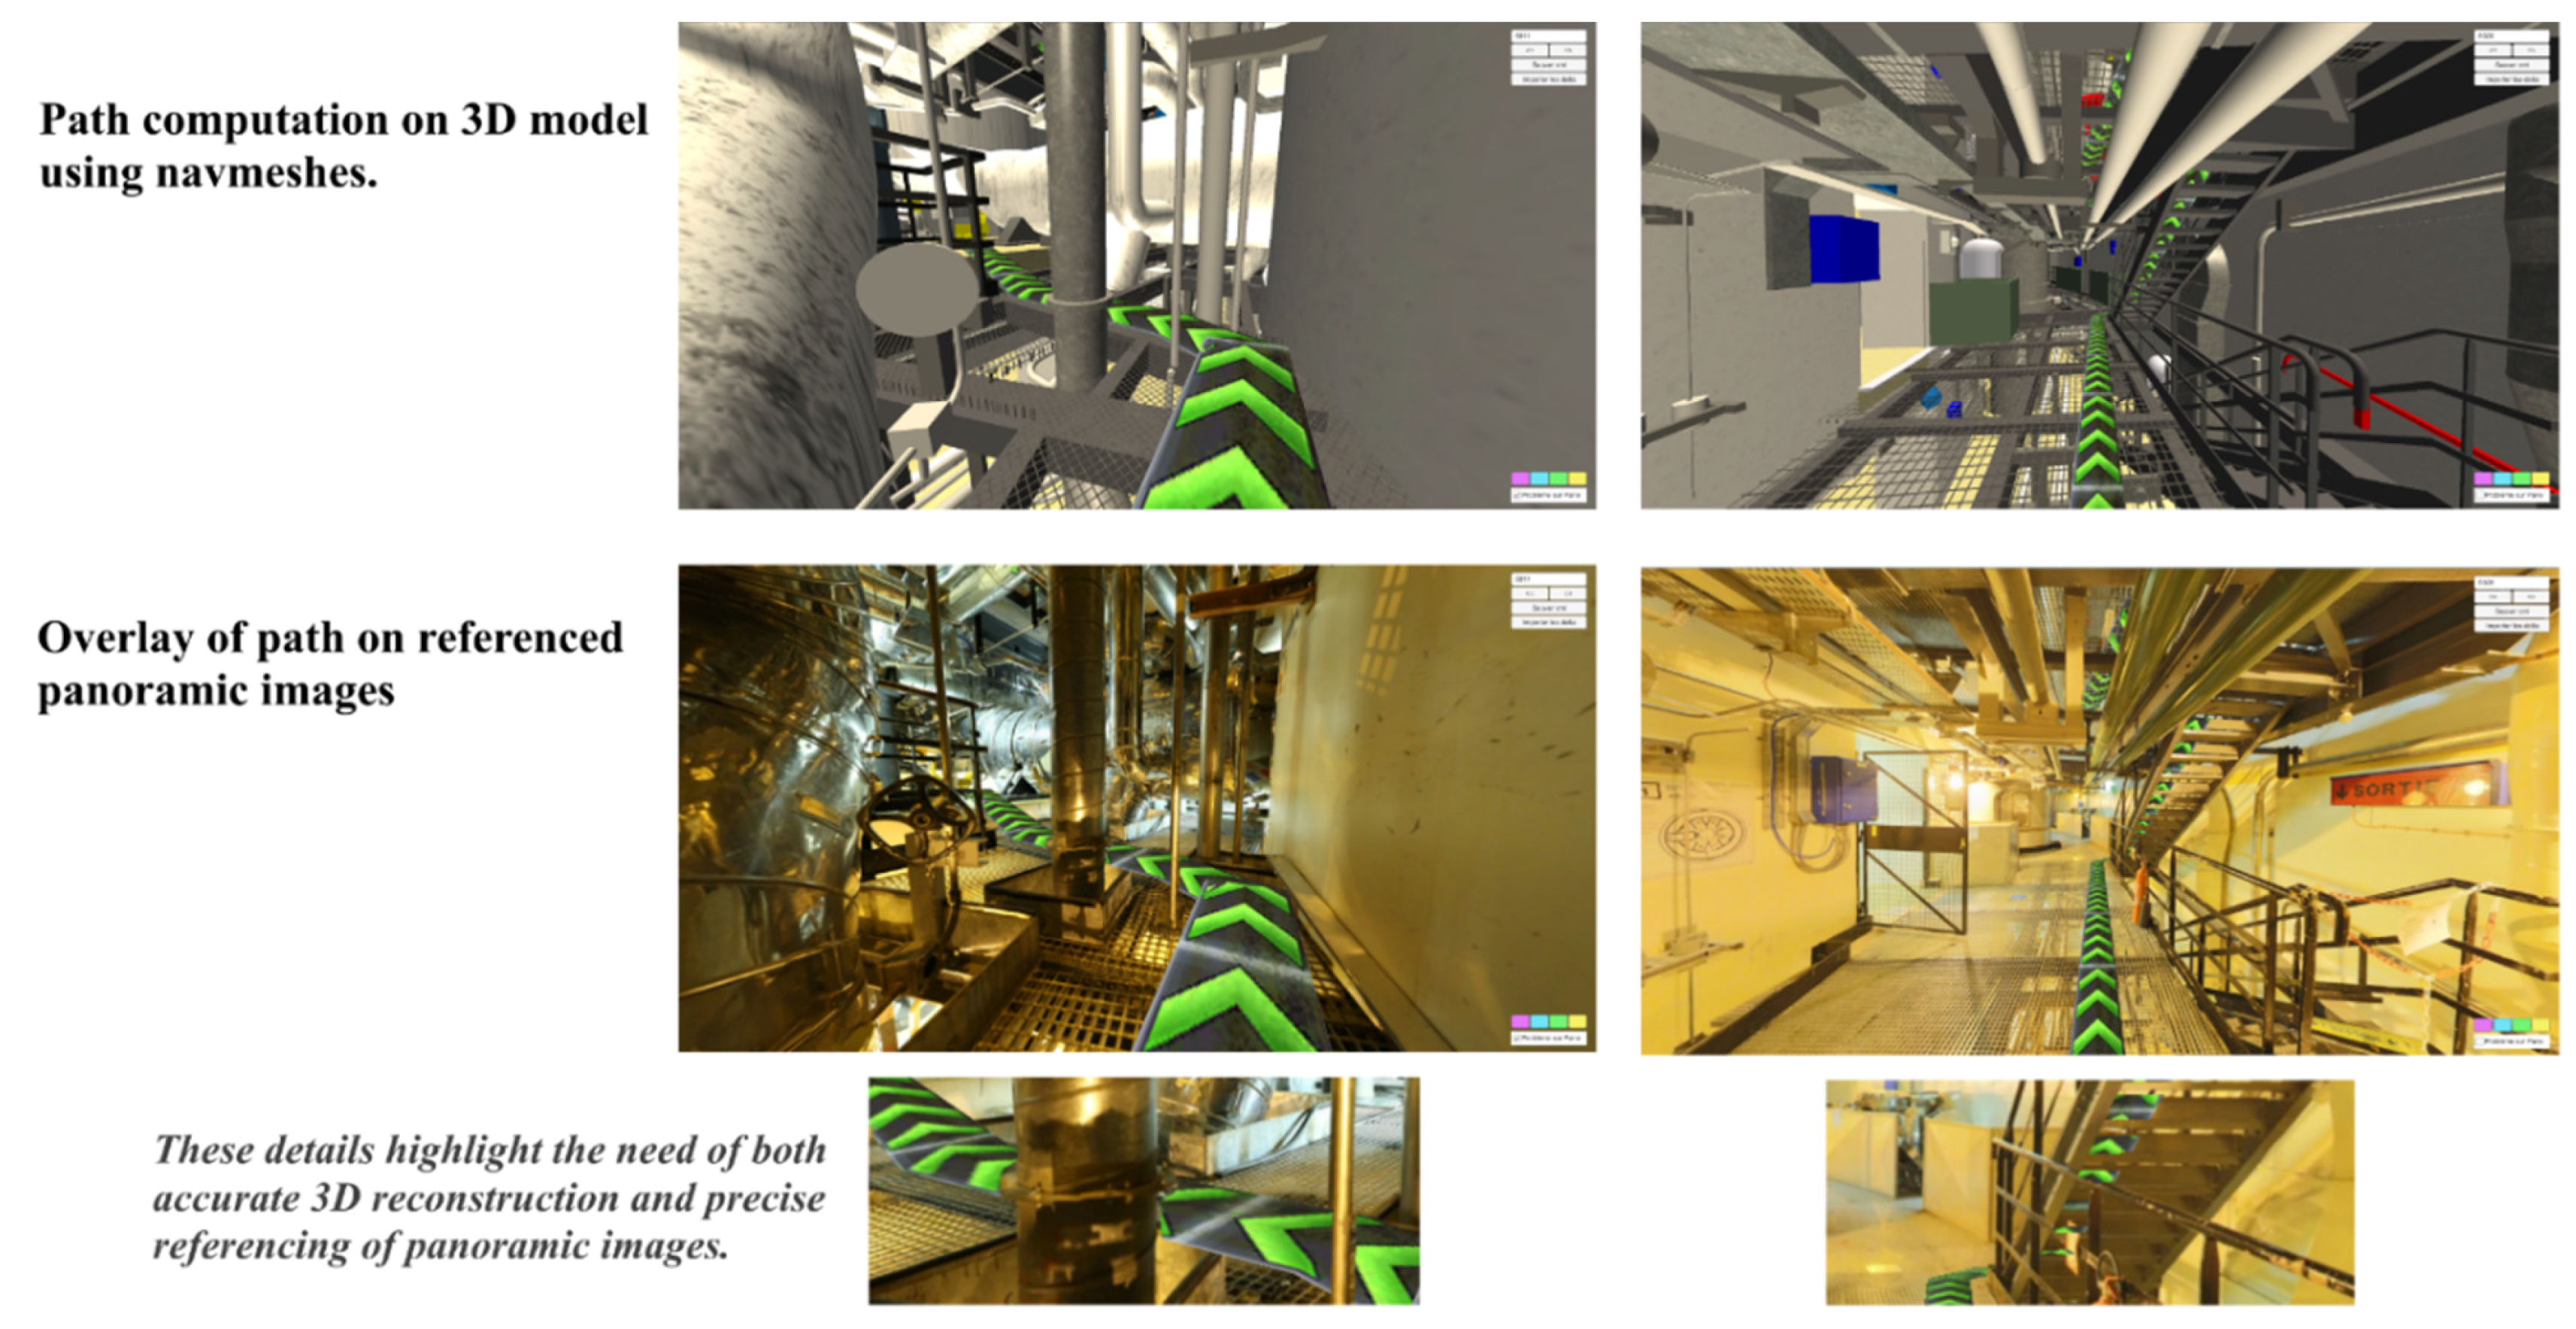
5. Developing New Software Applications to Increase the Value of the Dataset

In the previous sections, we have detailed the challenges in producing data to represent a complex building. Due to that complexity and the intended uses, multiple data types are required: high resolution panoramic RGB, laser scans, 3D as-built CAD models and 2D floor plans. Once the dataset is complete, issues remain for visualization and exploration, taking into account that users may not be familiar with these various data types.

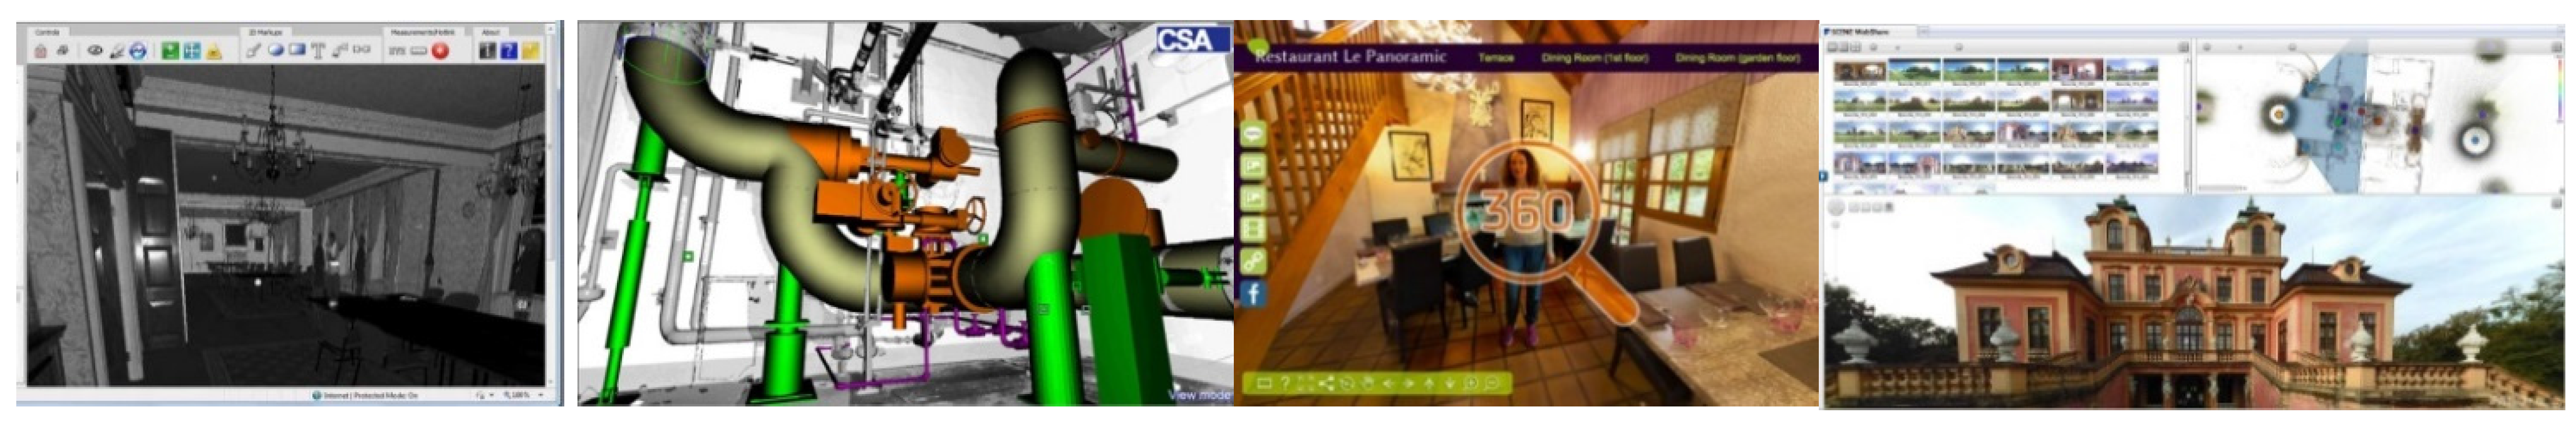
5.1. State of the Art of Multi-Data Visualization for Complex Architectures

By its nature, each data source represents only one aspect of the reality of the plant and only meets some needs among many. The co-visualization of the multiple data sources is therefore required to assist and help workers with finding answers in their daily jobs. In recent years, several solutions have been proposed for the problem of multi-source, as-built data visualization; see Figure 14:
  • virtual tours with floor plans and panoramic RGB [39];
  • navigation through several spherical laser views;
  • navigation and path calculation in 3D environments, for instance in 3D video games or 2.5D cartography services, such as Google Maps indoors.
Figure 14. Examples of user interfaces that can be found today for virtual tours: Leica TrueView, CSA VirtualTours, Kolor PanoTour, Faro WebShare.
Remotesensing 07 15827 g014
However, none of these solutions integrates all of the data sources required to represent some complex buildings, such as nuclear reactor buildings, and easily navigate the large dataset. Indeed, apart from the constraints of technical integration, the complexity of the plant itself is an issue for virtual navigation (multiple levels with dozens of rooms and vertical junctions) and requires a specific interaction design to handle it.

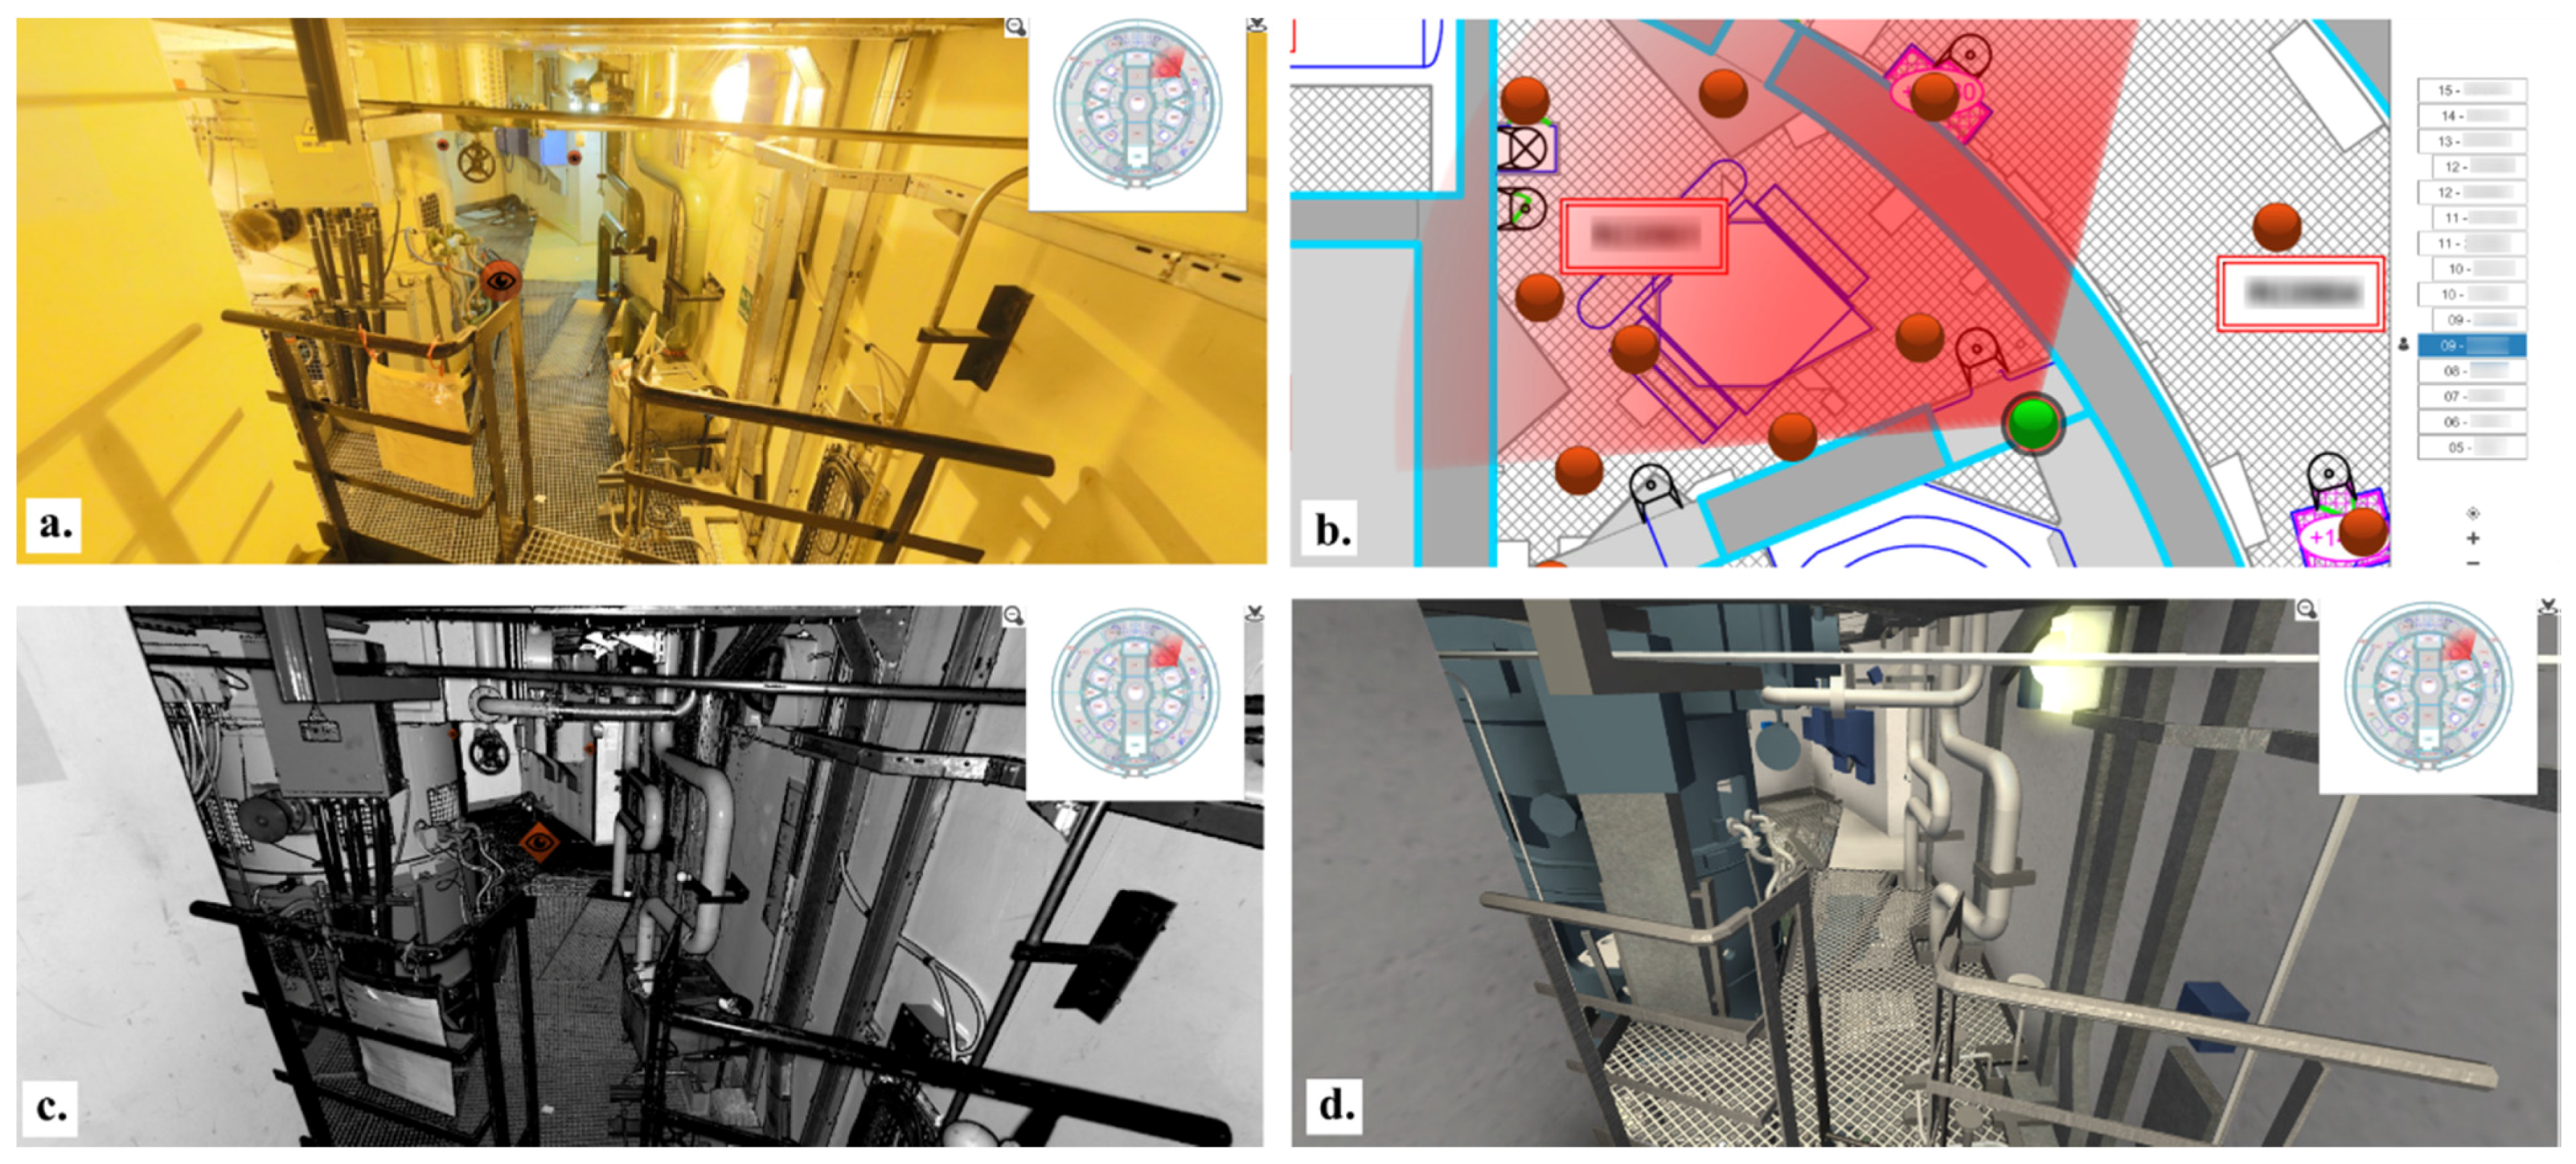
5.2. Rules for the Development of Virtual Tours of a Complex Building

Our first goal is to develop an application that can be of value to many people working in nuclear plants, taking into account that the targeted building is rarely accessible. Potential values include several scenarios. The first scenario consists of improving the productivity of maintenance operations through a virtual preparation stage that takes into account the spatial constraints of the environment; this requires the collaboration of different teams based on a shared representation of the environment (e.g., mechanical workers defining their scaffolding needs). The second scenario aims to improve accuracy and to reduce delays in engineering studies to prepare for modifications and revamping to the plant, with reduced on-site time for the teams. The third and last scenario consists of helping many recently-hired workers to become familiar with their working environment more rapidly, through dedicated training sessions, including tutoring courses.
These few scenarios illustrate the variety of user profiles that should be considered for the common view, which we wish to design. Many of them are not familiar with the handling of as-built datasets, and their use of the tool we developed may be very occasional, which reinforces the need for user-friendly and simple interfaces, as well as taking into account human perception in the design [40,41].
To address this problem, several principles have been selected for the development of navigation interaction within our applications, developed using the game engine Unity 3D. The first principle consists of the multi-view synchronization across a multi-source dataset, with the possibility at any time of moving from one view to another without losing user position/orientation (shared, unique position of the user in the environment), as shown in Figure 15. The second principle consists of the ability to explore the building in its horizontal and vertical dimensions (through stairs and ladders, as well as trapdoors and removable slatted floors), which is required by tasks, such as handling heavy equipment. The last principle consists of developing all tools and functionalities in a project interface for a better user data management: marks, snapshots, distance measurements with guidance instruction and path computations.
Figure 15. Multi-source data exploration and navigation in a complex building: visualization and station-based transitions of (a) panoramic images and (b) laser scans; (c) 2D map view of all stations and synchronized mini-maps and (d) first-person pedestrian navigation in the 3D model, including climbing ladders, taking stairs and crouching.
Remotesensing 07 15827 g015
For instance, we estimate that in the synchronized, multi-view experience, spherical photographs need to be positioned in the virtual environment with a 2.58σ tolerance of 50 cm and 5°. This accuracy range seems sufficient to help users to focus on their task, by not being disturbed by some inaccuracies in the transitions when switching between views. Furthermore, the verticality of the panoramic images must be known with an error below 3°; otherwise, navigation becomes very uncomfortable.
In addition to the navigation features, we provide users with specific interactions with the dataset. Each feature has been designed according to the users’ needs. To implement them, we carried out several iterations with users to overcome technical feasibility issues and create genuinely powerful and smart tools. Among these, we can mention distance measurements on 3D CAD models (perpendicular to the normal unit vectors, vertically constrained or free), annotations and snapshots in every data view, interactive cutaways of walls and user data management and sharing. In all of these developments, a large amount of feedback has been collected in a quick response development process to achieve optimum user benefit.
Figure 16. A procedure for improving the quality of distance measurement in laser scans. The user must (a) choose between measurement types and (b) control his/her own measurement by a double picking; then (c) check the result in “bubble view” and finally (d) in the 3D model.
Remotesensing 07 15827 g016

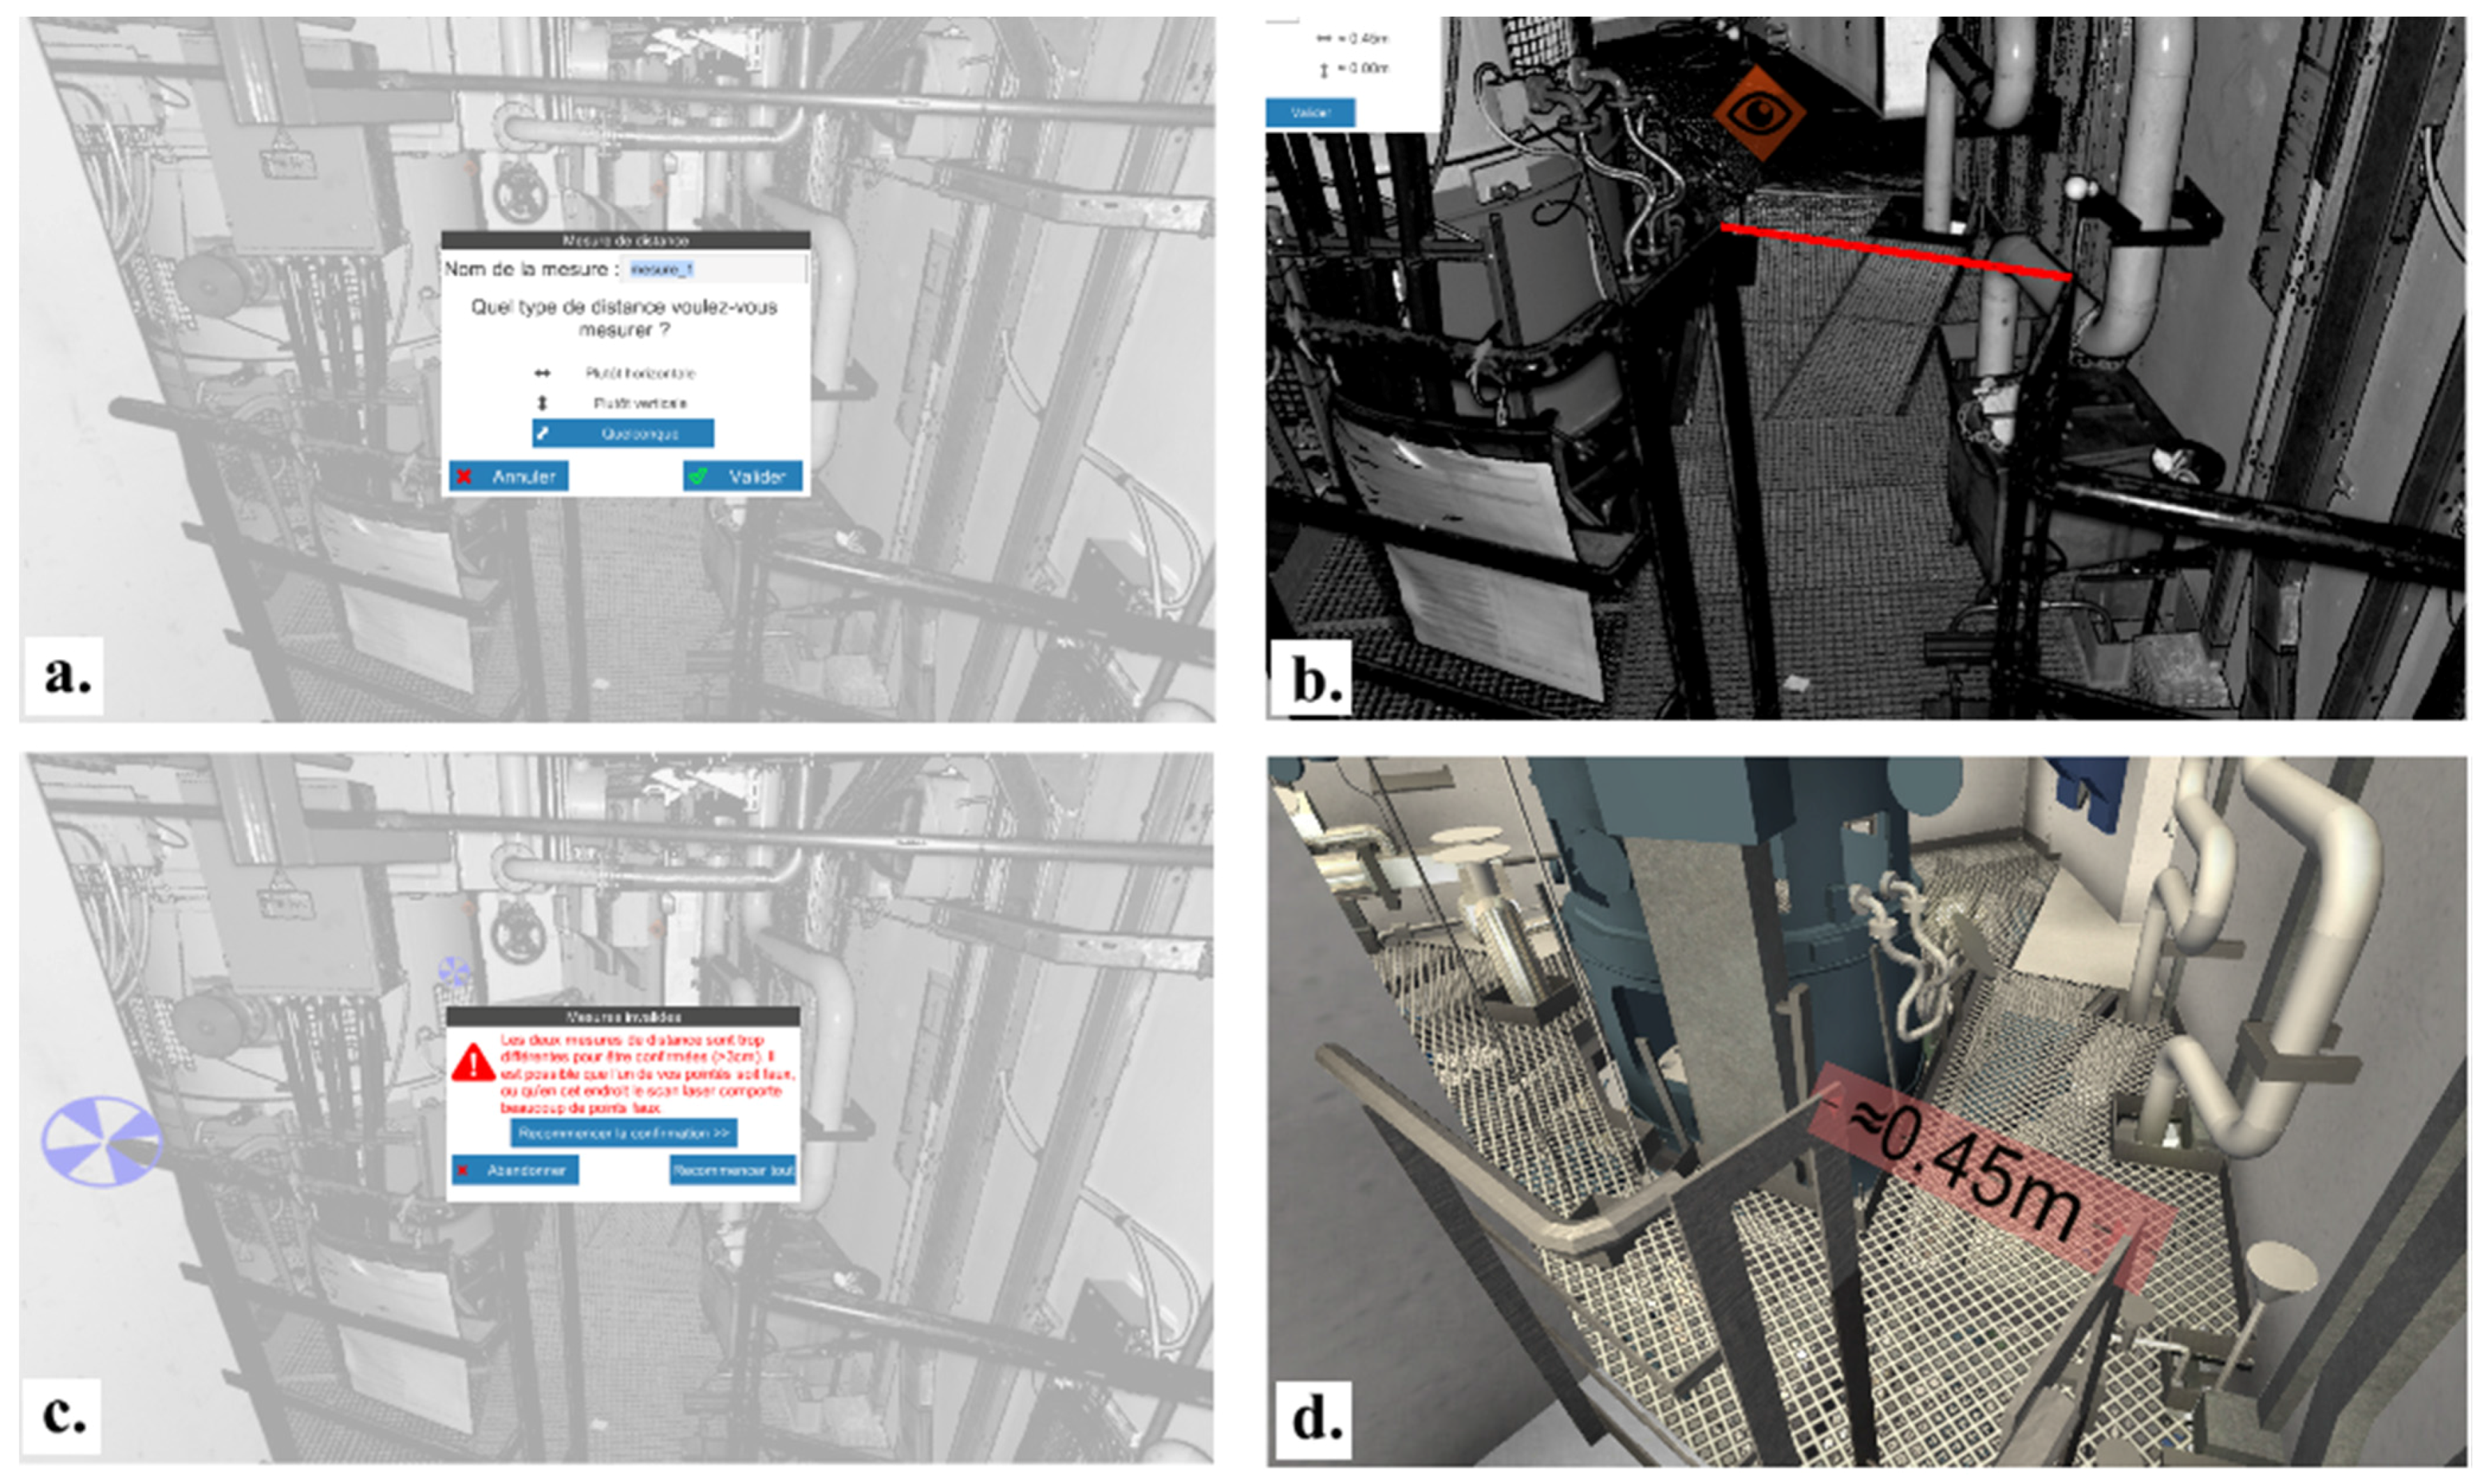
5.3. A Framework for Taking Measurements on Laser Scans for Non-Expert Users

So-called “bubble views” of laser scans are often used to measure distances. However, for non-familiar users, two main issues should be avoided. Firstly, errors in range measurement (reflective surfaces, for instance) impact the distance value; hence, many distance measurements should be checked more than once and interpreted with caution, although most users ignore the typical error budget of a laser scan. A manual segmentation process is highly recommended to remove as many noisy points as possible, to comply with the definition of tolerances. Secondly, wrong picks on edges can lead to wrong distance measurements, whereas in spherical view, no feedback can be returned. To decrease the rate of wrong measurements, we have developed a specific procedure, as detailed below.
To reduce the occurrence of false measurements in a laser scan, even after removing outliers, we propose the following procedure (see Figure 16):
(1)
choose a type of measurement from “almost horizontal”, “almost vertical” and “oblique”
(2)
pick two points in the laser scan to define the distance to be measured.
If the picked segment is “consistent” with the type of measurement, then:
(3)
pick the two points in the laser scan again.
If the measured distance is “similar” to the previous one:
(4)
the measurement is displayed on the laser scan with centimeter accuracy; it can be checked against the reconstructed 3D model.

5.4. An Example of Advanced Technological Features Using a Georeferenced Dataset

The quality of the entire dataset allows the development of advanced features, such as path overlay on panoramic images. Paths are computed on navmeshes, using Autodesk GameWare, and can be overlaid in real-time on panoramic images; see Figure 17.
Figure 17. 3D pedestrian path (using navmeshes) overlay on panoramic images.
Remotesensing 07 15827 g017

6. Conclusions and Future Work

The professional use of as-built models has recently increased significantly, resulting in two major challenges: scaling up dense and multi-sensor scanning surveys to a whole building and sharing this dataset with a very large audience.
In this paper, we reviewed the state of the art of scanning tools and methods for industrial installations. Then, we proposed a global methodology for acquisition and processing of multi-sensor datasets to represent complex architectures. To face the lack of automation to reach high quality in modelling multi-floor plants, we detailed the optimal contribution of human beings in the process. We then assessed this methodology in a large-scale experiment of modelling the 11 floors of a 1300-megawatt nuclear reactor building. From the acquisition of 1000+ co-stations (RGB panoramic and laser scans) to a 3D as-built reconstruction, the project has involved many contributors for almost a year and a half. At every step, quality requirements have put stress on tools and methods and led to the implementation of Level 2 quality controls. We finally presented new tools that have been developed to help many professionals in their daily jobs by allowing them to explore a complete digital plant easily using different types of data.
We can summarize the contribution made by our work in three points:
  • We assessed the feasibility, as well as underlined the current complexity of tools and methods used in a multi-sensor scanning of industrial environments (1000+ stations). Issues remain to reduce the effort in the production of such models.
  • We have highlighted human beings’ contribution in the data production (from interactive tools to quality management and control).
  • We have shown how the value of such datasets can be increased by developing multi-source data visualization and navigation applications in multi-floor plants with recommendations for general principles applied to virtual tours of complex architectures.
Based on these findings and experiments, future work is already planned, with a view toward reducing the significance of the remaining issues:
  • Improve data referencing procedures and algorithms to ensure confidence in quality levels, across all of the datasets.
  • Develop new tools for data cross-validation and consistency across a multi-source dataset.
However, some serious bottlenecks seem farther removed from the current state of the art:
  • How could we significantly increase (benefit >50% of current cost) the productivity of 3D as-built CAD (or BIM) models from very large point clouds (hundreds of billions)?
  • Which procedures and resources should be employed to update a large multi-sensor dataset and detect errors or inconsistencies between two epochs?

Acknowledgments

The authors would like to thank the reviewers and copy editors, whose helpful comments led to a better paper overall. The authors also want to thank all the involved teams in this project, with a special mention to survey teams (photographers and surveyors), CAD operators and software developers.

Author Contributions

Jean-François Hullo and Guillaume Thibault conceived and designed the tools and the methods of data acquisition and processing. Christian Boucheny and Arnaud Mas conceived and designed the end-user application. Fabien Dory developed tools for 3D path computations and panoramic pose estimation.

Conflicts of Interest

The authors declare no conflict of interest.

References

  1. Hullo, J.-F.; Thibault, G.; Boucheny, C. Advances in multi-sensor scanning and visualization of complex plants: The utmost case of a reactor building. ISPRS Arch. Photogramm. 2015, 1, 163–169. [Google Scholar] [CrossRef]
  2. Pot, J.; Thibault, G.; Levesque, P. Techniques for CAD reconstruction of “as-built” environments and application to preparing for dismantling of plants. Nucl. Eng. Des. 1997, 178, 135–143. [Google Scholar] [CrossRef]
  3. Depraz, F.; Popovic, V.; Ott, B.; Wellig, P.; Leblebici, Y. Real-time object detection and tracking in omni-directional surveillance using GPU. In Proceedings of the 2015 SPIE Target and Background Signatures, Toulouse, France, 21 September 2015.
  4. Kopf, J.; Uyttendaele, M.; Deussen, O.; Cohen, M. Capturing and viewing gigapixel images. ACM Trans. Gr. 2007, 26, 93. [Google Scholar] [CrossRef]
  5. Khoshelham, K.; Elberink, S.O. Accuracy and resolution of kinect depth data for indoor mapping applications. Sensors 2012, 12, 1437–1454. [Google Scholar] [CrossRef] [PubMed]
  6. Chen, G.; Kua, J.; Shum, S.; Naikal, N.; Carlberg, M.; Zakhor, A. Indoor localization algorithms for a human-operated backpack system. In Proceedings of the 5th International Symposium 3D Data Conference on Visualization, and Transmission, Paris, France, 17–20 May 2010.
  7. Bosse, M.; Zlot, R.; Flick, P. Zebedee: Design of a spring-mounted 3-d range sensor with application to mobile mapping. IEEE Trans. Robot. 2012, 28, 1104–1119. [Google Scholar] [CrossRef]
  8. Adán, A.; Quintana, B.; Vázquez, A.S.; Olivares, A.; Parra, E.; Prieto, S. Towards the automatic scanning of indoors with robots. Sensors 2015, 15, 11551–11574. [Google Scholar] [CrossRef] [PubMed]
  9. Zlot, R.; Bosse, M. Efficient large-scale three-dimensional mobile mapping for underground mines. J. Field Robot. 2014, 31, 758–779. [Google Scholar] [CrossRef]
  10. Li, Y.; Zhang, P.; Lan, H.; Yuan, Z.; Niu, X.; El-Sheimy, N. Real-time indoor navigation using smartphones. In Proceedings of IPIN 2015 Conference on Evaal Indoor Navigation Competition, Banff, AB, Canada, 13–16 October 2015.
  11. De la Puente, P.; Rodriguez-Losada, D. Feature based graph-SLAM in structured environments. Auton. Robot. 2014, 37, 243–260. [Google Scholar] [CrossRef]
  12. Labbe, M.; Michaud, F. Online global loop closure detection for large-scale multi-session graph-based slam. In Proceedings of the 2014 IEEE/RSJ International Conference on Intelligent Robots and Systems, Chicago, IL, USA, 14–18 September 2014.
  13. Ji, S.; Shi, Y.; Shan, J.; Shao, X.; Shi, Z.; Yuan, X.; Ynag, P.; Wu, W.; Tang, H.; Shibasaki, R. Particle filtering methods for georeferencing panoramic image sequence in complex urban scenes. ISPRS J. Photogramm. 2015, 105, 1–12. [Google Scholar] [CrossRef]
  14. Barras, V.; Delley, N.; Chapotte, G. Analyses aux limites des scanners laser terrestres. XYZ Rev. Assoc. Fr. Topogr. 2013, 137, 19–26. [Google Scholar]
  15. Voegtle, T.; Wakaluk, S. Effects on the measurements of the terrestrial laser scanner HDS 6000 (Leica) caused by different object materials. In Proceedings of the 2009 ISPRS Work on Laser Scanning, Paris, France, 1–2 September 2009.
  16. Tang, P.; Huber, D.; Akinci, B. A comparative analysis of depth-discontinuity and mixed-pixel detection algorithms. In Proceedings of the IEEE Sixth International Conference on 3-D Digital Imaging and Modeling, Montreal, QC, Canada, 21–23 August 2007.
  17. Hullo, J.-F.; Thibault, G.; Grussenmeyer, P.; Landes, T.; Bennequin, D. Probabilistic feature matching applied to primitive based registration of TLS data. In Proceedings of the XXII ISPRS Congress on Annals of the Photogrammetry, Remote Sensing and Spatial Information Sciences, Melbourne, Australia, 25 August–1 September 2012.
  18. Komorowski, M. A History of Storage Cost. Available online: http://www.mkomo.com/cost-per-gigabyte-update (accessed 30 October 2015).
  19. Wikipedia. List of Device Bit Rates. Available online: https://en.wikipedia.org/wiki/List_of_device_bit_rates (accessed 4 October 2015‎).
  20. Elseberg, J.; Borrmann, D.; Nüchter, A. One billion points in the cloud—An octree for efficient processing of 3D laser scans. ISPRS J. Photogramm. 2013, 76, 76–88. [Google Scholar] [CrossRef]
  21. Scheiblauer, C. Interactions with Gigantic Point Clouds. Ph.D. Thesis, Institute of Computer Graphics and Algorithms, Vienna, Austria, 2014. [Google Scholar]
  22. Schütz, M. Potree, A Free Open-Source WebGL Based Point Cloud Renderer for Large Point Clouds. SCANOPY Project. Available online: https://github.com/potree/potree (accessed 30 October 2015).
  23. Boucheny, C. Interactive Scientific Visualization of Large Datasets: Towards a Perceptive-Based Approach. Ph.D. Thesis, Université Joseph Fourier, Grenoble, France, 2009. [Google Scholar]
  24. Azhar, S. Building information modeling (BIM): Trends, benefits, risks, and challenges for the AEC industry. Leadersh. Manag. Eng. 2011, 11, 241–252. [Google Scholar] [CrossRef]
  25. Golparvar-Fard, M.; Peña-Mora, F.; Savarese, S. Automated progress monitoring using unordered daily construction photographs and IFC-based building information models. J. Comput. Civil. Eng. 2012, 29, 04014025. [Google Scholar] [CrossRef]
  26. Jung, I.; Kim, W. Analysis of the possibility of required resources estimation for nuclear power plant decommissioning applying BIM. In Proceedings of the KNS 2014 Spring Meeting, Jeju, Korea, 28–30 May 2014.
  27. Volk, R.; Stengel, J.; Schultmann, F. Building Information Modeling (BIM) for existing buildings—Literature review and future needs. Automat. Constr. 2014, 38, 109–127. [Google Scholar] [CrossRef]
  28. Trickett, K.G.; Chaney, J.C. PDMS: Plant Layout and Piping Design; Gulf Publishing Company: Houston, TX, USA, 1982. [Google Scholar]
  29. Tang, P.; Huber, D.; Akinci, B.; Lipman, R.; Lytle, A. Automatic reconstruction of as-built building information models from laser-scanned point clouds: A review of related techniques. Automat. Constr. 2010, 19, 829–843. [Google Scholar] [CrossRef]
  30. Son, H.; Kim, C.; Kim, C. 3D reconstruction of as-built industrial instrumentation models from laser-scan data and a 3D CAD database based on prior knowledge. Automat. Constr. 2015, 49, 193–200. [Google Scholar] [CrossRef]
  31. Kang, Z.; Li, Z. Primitive fitting based on the efficient multiBaySAC algorithm. PLoS ONE 2015, 10, e0117341. [Google Scholar] [CrossRef] [PubMed]
  32. Whyte, J.; Bouchlaghem, N.; Thorpe, A.; McCaffer, R. From CAD to virtual reality: Modelling approaches, data exchange and interactive 3D building design tools. Automat. Constr. 2000, 10, 43–55. [Google Scholar] [CrossRef]
  33. Girardeau-Montaut, D.; Roux, M.; Marc, R.; Thibault, G. Change detection on points cloud data acquired with a ground laser scanner. ISPRS Arch. Photogramm. 2005, 36, 30–35. [Google Scholar]
  34. Bey, A.; Chaine, R.; Marc, R.; Thibault, G.; Akkouche, S. Reconstruction of consistent 3D CAD models from point cloud data using a priori CAD models. In Proceedings of the 2011 ISPRS Workshop on Laser Scanning, Calgary, AB, Canada, 29–31 August 2011.
  35. Hullo, J.-F.; Thibault, G. Scaling up close-range surveys: A challenge for the generalization of as-built data in industrial applications. ISPRS Arch. Photogramm. 2014, 1, 293–299. [Google Scholar] [CrossRef]
  36. Wicki, F. Robust estimator for the adjustment of geodetic networks. In Proceedings of the First International Symposium on Robust Statistics and Fuzzy Techniques in Geodesy and GIS, Zurich, Switzerland, 12–16 March 2001.
  37. Whiting, E. Geometric, Topological & Semantic Analysis of Multi-Building Floor Plan Data. Master’s Thesis, Massachusetts Institute of Technology, Deptment of Architecture, Cambridge, MA, USA, 2006. [Google Scholar]
  38. Vatti, B.R. A generic solution to polygon clipping. Commun. ACM 1992, 35, 56–63. [Google Scholar] [CrossRef]
  39. Koehl, M.; Scheider, A.; Fritsch, E.; Fritsch, F.; Rachebi, A.; Guillemin, S. Documentation of historical building via virtual tour: the complex building of baths in Strasbourg. In Proceedings of the XXIV International CIPA Symposium on Archives of the Photogrammetry, Remote Sensing and Spatial Information Sciences, Strasbourg, France, 2–6 September 2013.
  40. Thibault, G.; Pasqualotto, A.; Vidal, M.; Droulez, J.; Berthoz, A. How does horizontal and vertical navigation influence spatial memory of multifloored environments? Atten. Percept. Psychophys. 2013, 75, 10–15. [Google Scholar] [CrossRef] [PubMed]
  41. Dollé, L.; Droulez, J.; Bennequin, D.; Berthoz, A.; Thibault, G. How the learning path and the very structure of a multifloored environment influence human spatial memory? Adv. Cogniti. Psychol. 2015, in press. [Google Scholar]

