
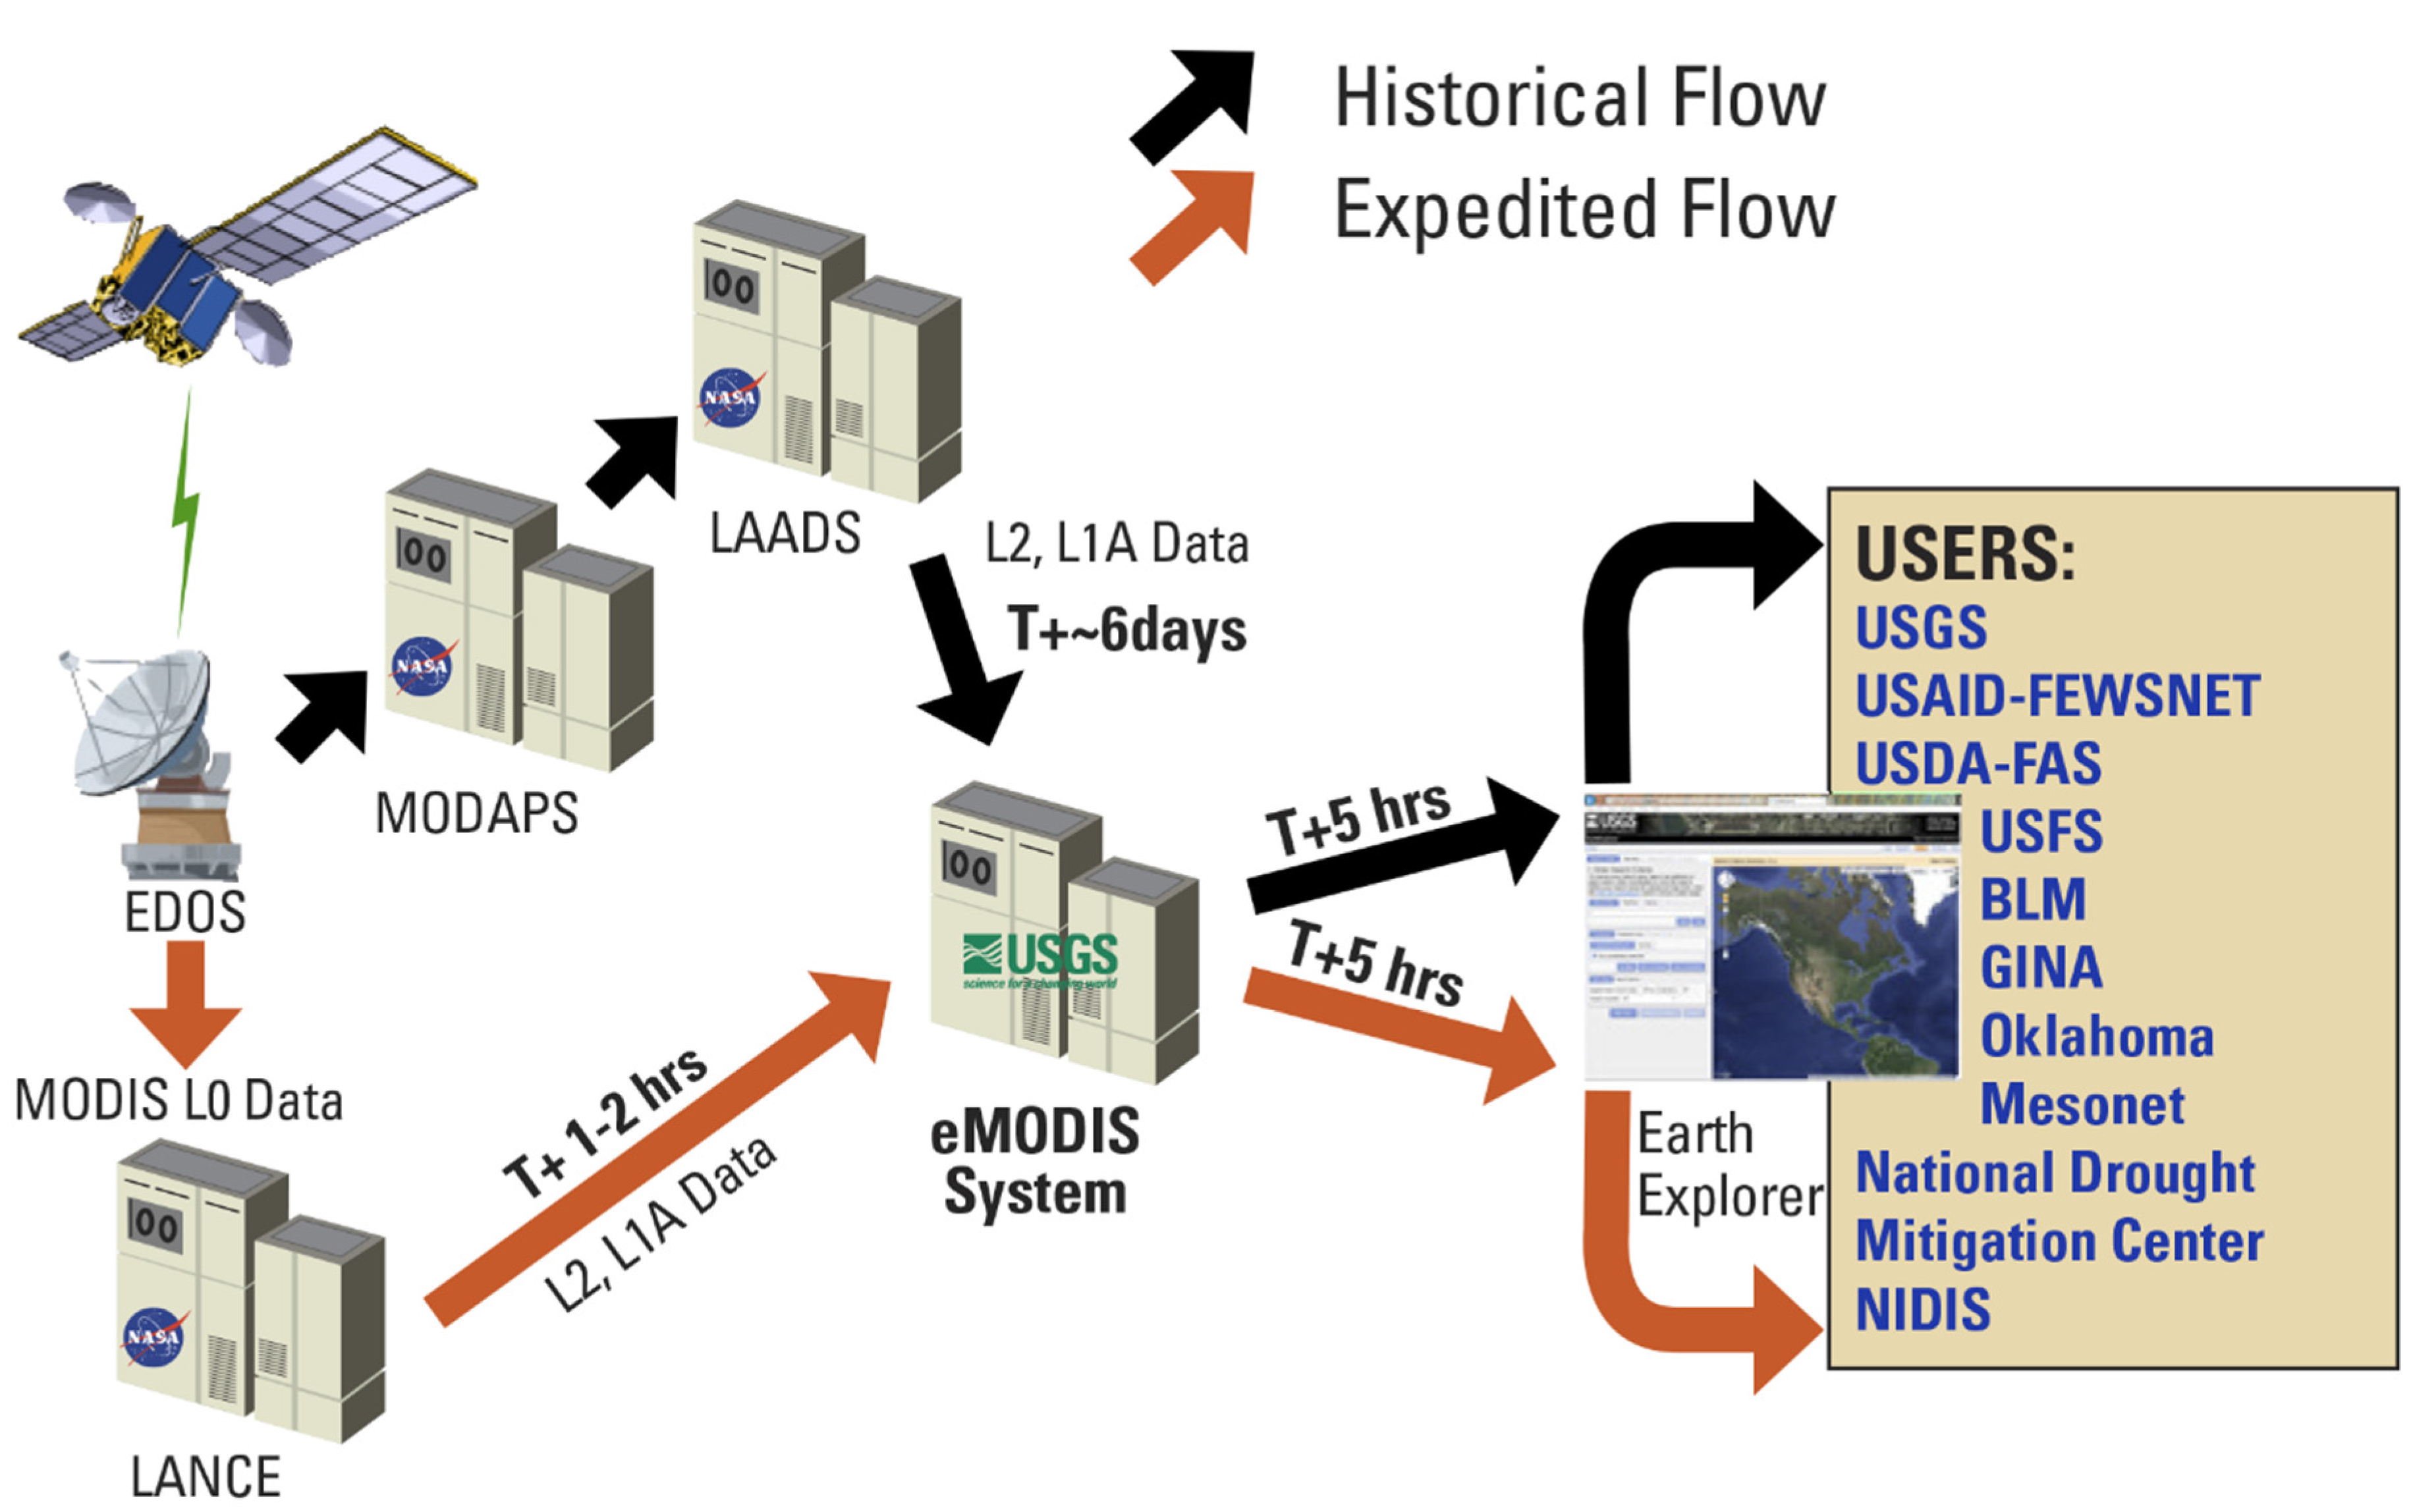
Application-Ready Expedited MODIS Data for Operational Land Surface Monitoring of Vegetation Condition

 , ,
, ,
Abstract
:
1. Introduction


| Characteristics | Standard MODIS | eMODIS |
|---|---|---|
| Product Latency | 6–10 days | 6–10 h |
| Image Geometric Processing | Sinusoidal grid, requires resampling, reprojection | Single resampling, directly from swath |
| Coverage | Tiled coverage | Tailored map coverage (national or continental) |
| Composite Interval | 16-day composite periods | 7-day composite period |
| Format | HDF-EOS | Geotiff |
Objectives
2. Materials and Methods
2.1. eMODIS NDVI Composites: Input Data, Processing, and Data Products
| Input Products | Product Name | Collection Version |
|---|---|---|
| MODIS/Terra or Aqua Surface Reflectance 5-Min L2 Swath | MOD09_L2 or MYD09_L2 | 5 |
| MODIS/Terra or Aqua Geolocation Fields 5-Min L1A Swath 1 km | MOD03_L1A or MYD03_L1A | 5 |
| MODIS/Terra or Aqua Cloud Mask and Spectral Test Results 5-Min L2 Swath 250 m and 1 km | MOD35_L2 or MYD35_L2 | 5 |
- The band quality information in the level-2 surface reflectance data (MOD09 or MYD09) is used to determine pixel quality. Only the pixels labelled “ideal quality” in the “250 m Reflectance Band Quality” layer are used.
- Observations with negative surface reflectance values are assigned an exclusion flag to remove them from the compositing process. Pixels with no positive values during the product interval are filled using a second pass that retrieves a negative reflectance as best available.
- The solar zenith angle is acquired from the 1000 m geolocation input file (MOD03 or MYD03). Any pixels acquired at sun angles greater than 83° are eliminated as composite candidates.
- The cloud mask input file (MOD35_L2 or MYD35_L2) is used to minimize the overall presence of cloudy observations in the composite product. The first three bits in the first byte (band) of the “Cloud Mask and Spectral Test Results” layer are used for general cloud assessment based on whether or not the pixel’s cloud state was determined, and whether a determined state was clear or cloudy. The preferred selection is a pixel labeled as “Determined” and “Probably Clear” or “Confident Clear”.
- If an observation was “Not determined,” or is “Determined” but “Cloudy” or “Uncertain,” then it is treated as cloudy. If there were no clear pixels available in the seven-day record, the pixel from the latest acquisition was used, regardless of its cloud state. Having determined which pixels were of ideal quality, contained positive reflectance values, were acquired at acceptable sun angles, and were cloud-free, the filtering process selected the two pixels containing the highest (maximum) NDVI values. The next step checked the two remaining pixels for snow cover, which is read from the sixth bit in the first byte in the cloud mask input file. If one of the two highest NDVI observations was flagged as snowy, it was eliminated from the selection process and the single remaining pixel was used in the final composite. If neither or both values were snowy, the pixels were examined for their position from nadir.
- The view angle (distance from nadir) finally determined which observation is used in the composite. The sensor zenith angle taken from the 1000 m geolocation input file (MOD03 or MYD03) was resampled for the 250 m and 500 m products and reviewed to determine which of the remaining observations was closest to nadir view and selected for the final composite.
2.2. Standard MODIS (MOD/MYD09) Products: Input Data, Processing, and Data Products
- Score 0: Observation with fill values for data;
- Score 1: Observation with bad data derived from a faulty or poorly corrected L1B pixel;
- Score 2: Observation with high view angle (60 degrees or more);
- Score 3: Observation with high solar zenith angle (85 degrees or more);
- Score 4: Observation flagged as cloudy;
- Score 5: Observation flagged as containing cloud shadow;
- Score 6: Observation flagged as uncorrected;
- Score 7: Observation flagged as containing the default level of aerosols;
- Score 8: Observation flagged as containing the highest level of aerosols; and
- Score 9: Good observation which meets none of the above criteria.
2.3. Temporal NDVI Filtering
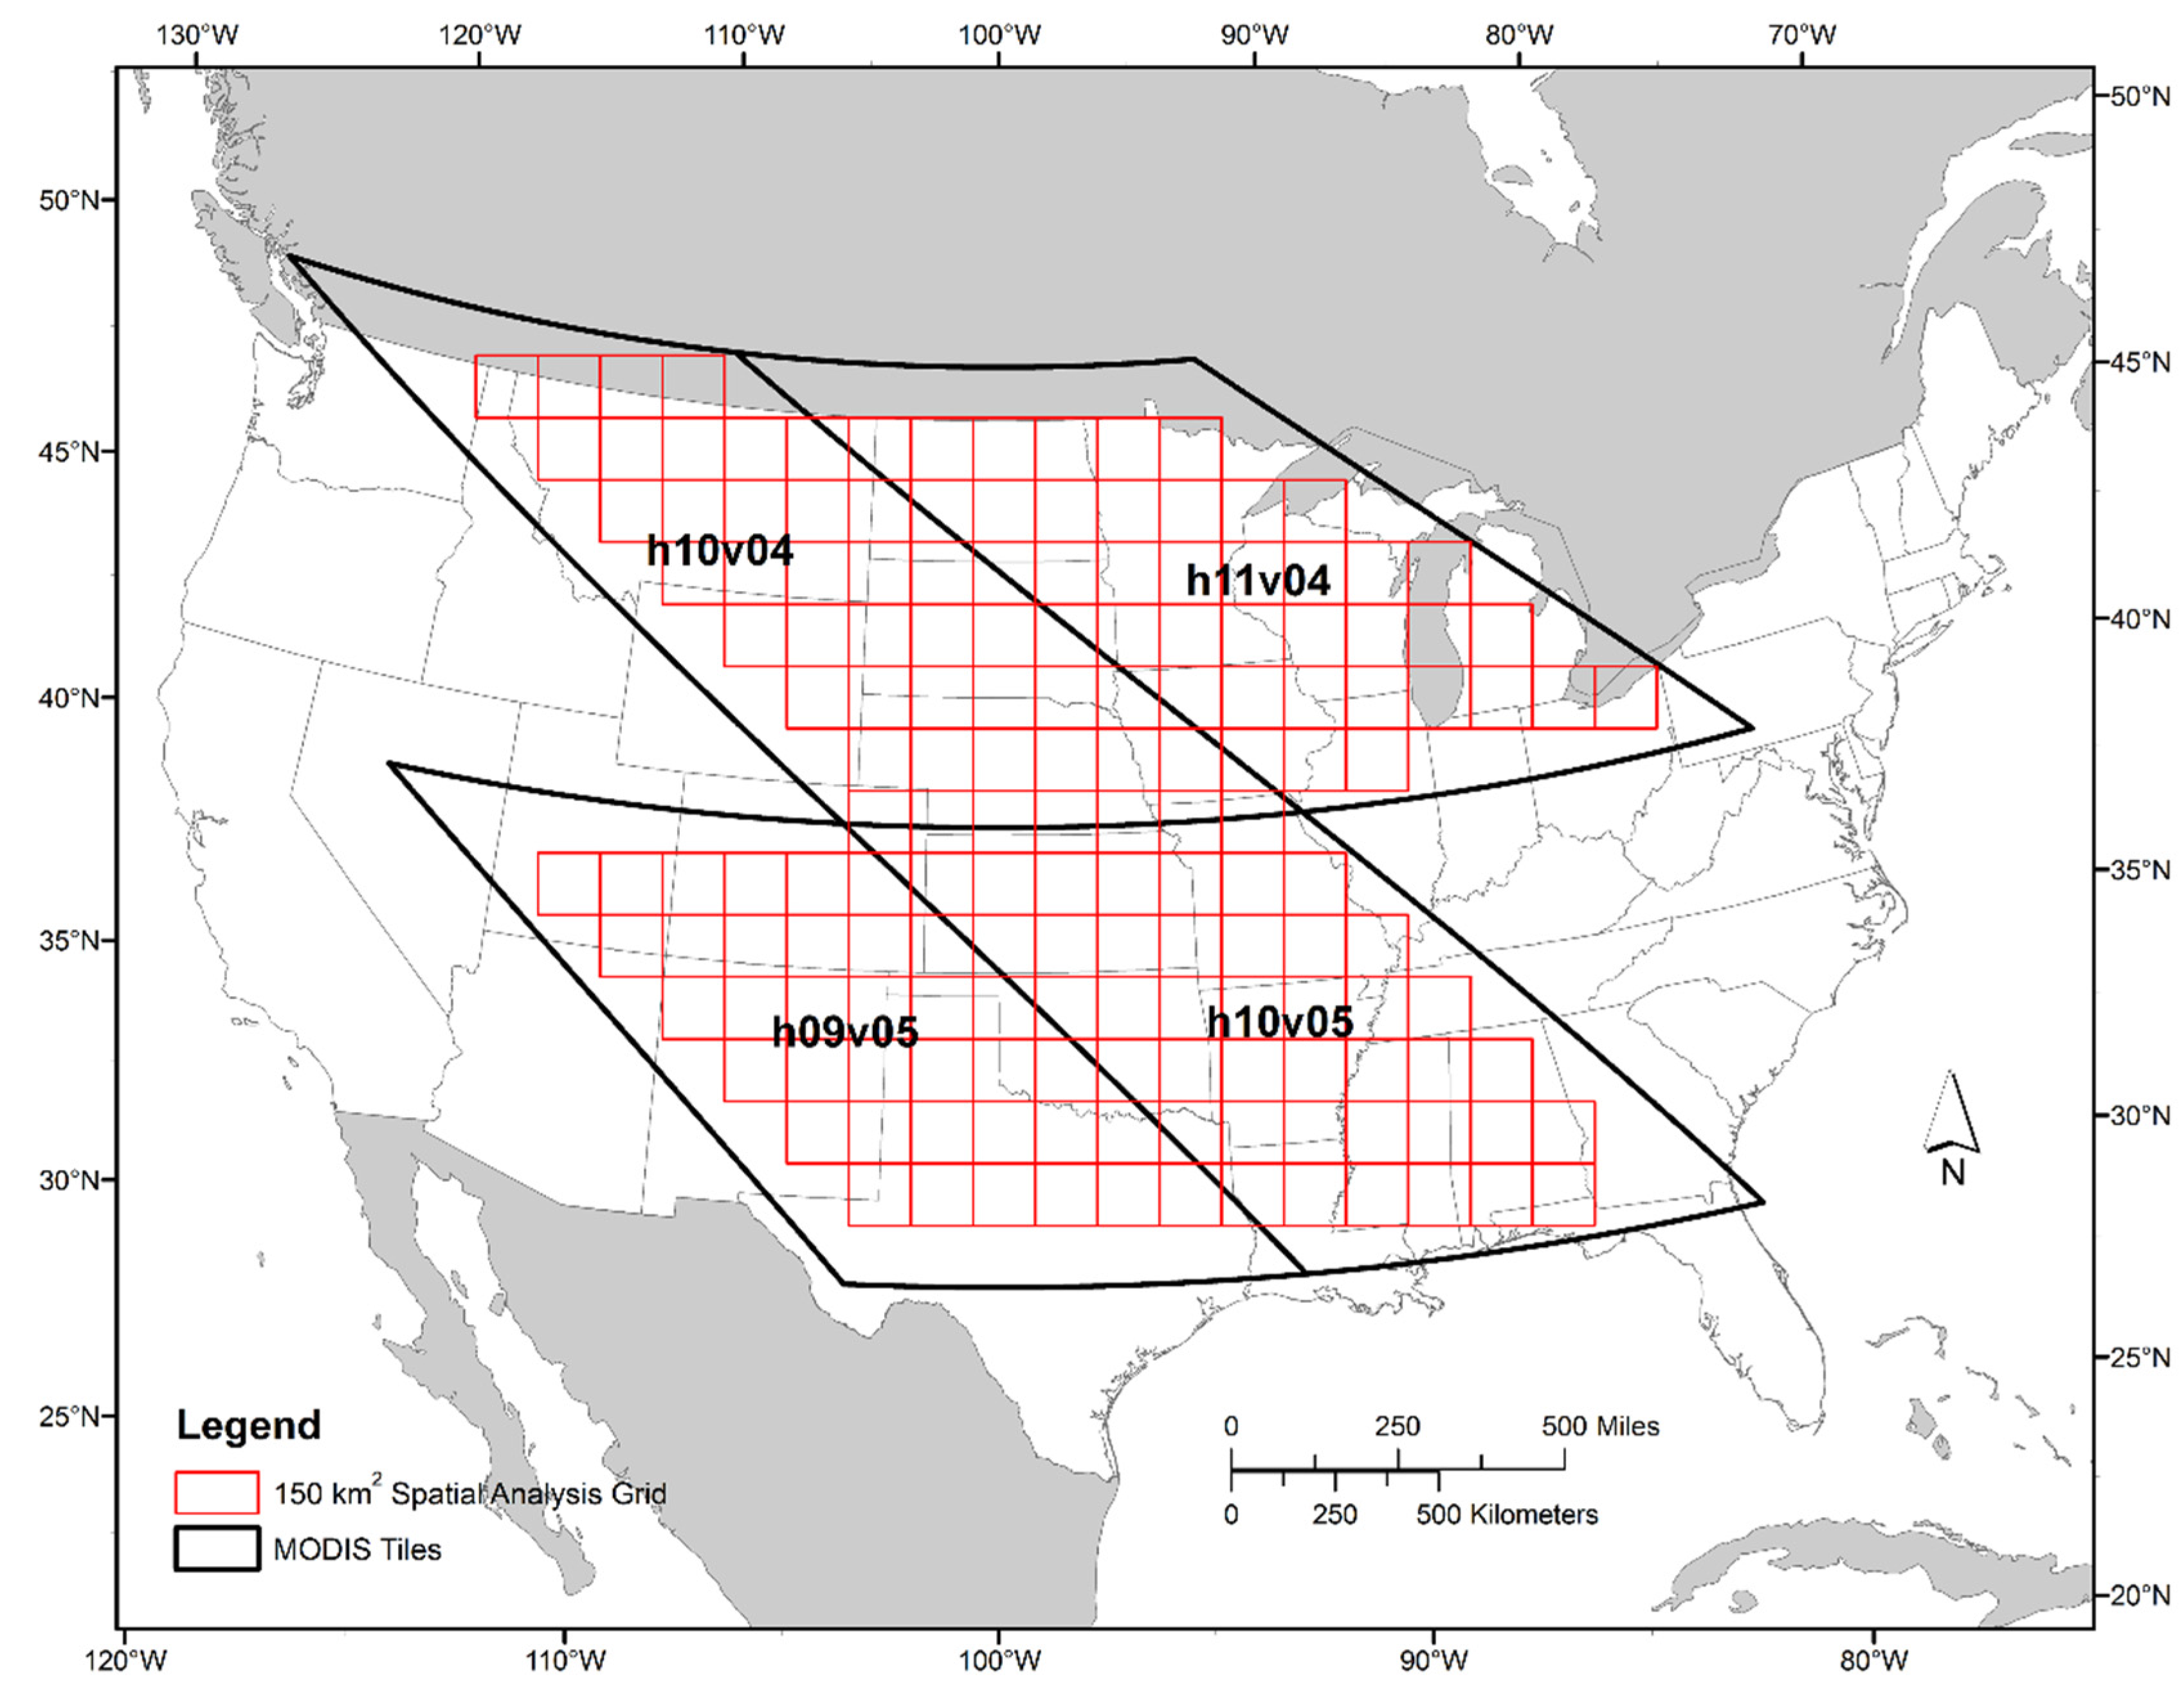
2.4. Study Area
- Standard Terra MODIS (STM): Collection 5 MOD09Q1 (Terra Surface Reflectance Bands 1–2 Tile 250 m 8 day) (source: https://lpdaac.usgs.gov/data_access/)
- Standard Aqua MODIS (SAM): Collection 5 MYD09Q1 (Aqua Surface Reflectance Bands 1–2 Tile 250 m 8 day) (source: https://lpdaac.usgs.gov/data_access/)
- Terra eMODIS (TeM) 250 m (source: http://earthexplorer.usgs.gov/)
- Aqua eMODIS (AeM) 250 m (source: http://earthexplorer.usgs.gov/)

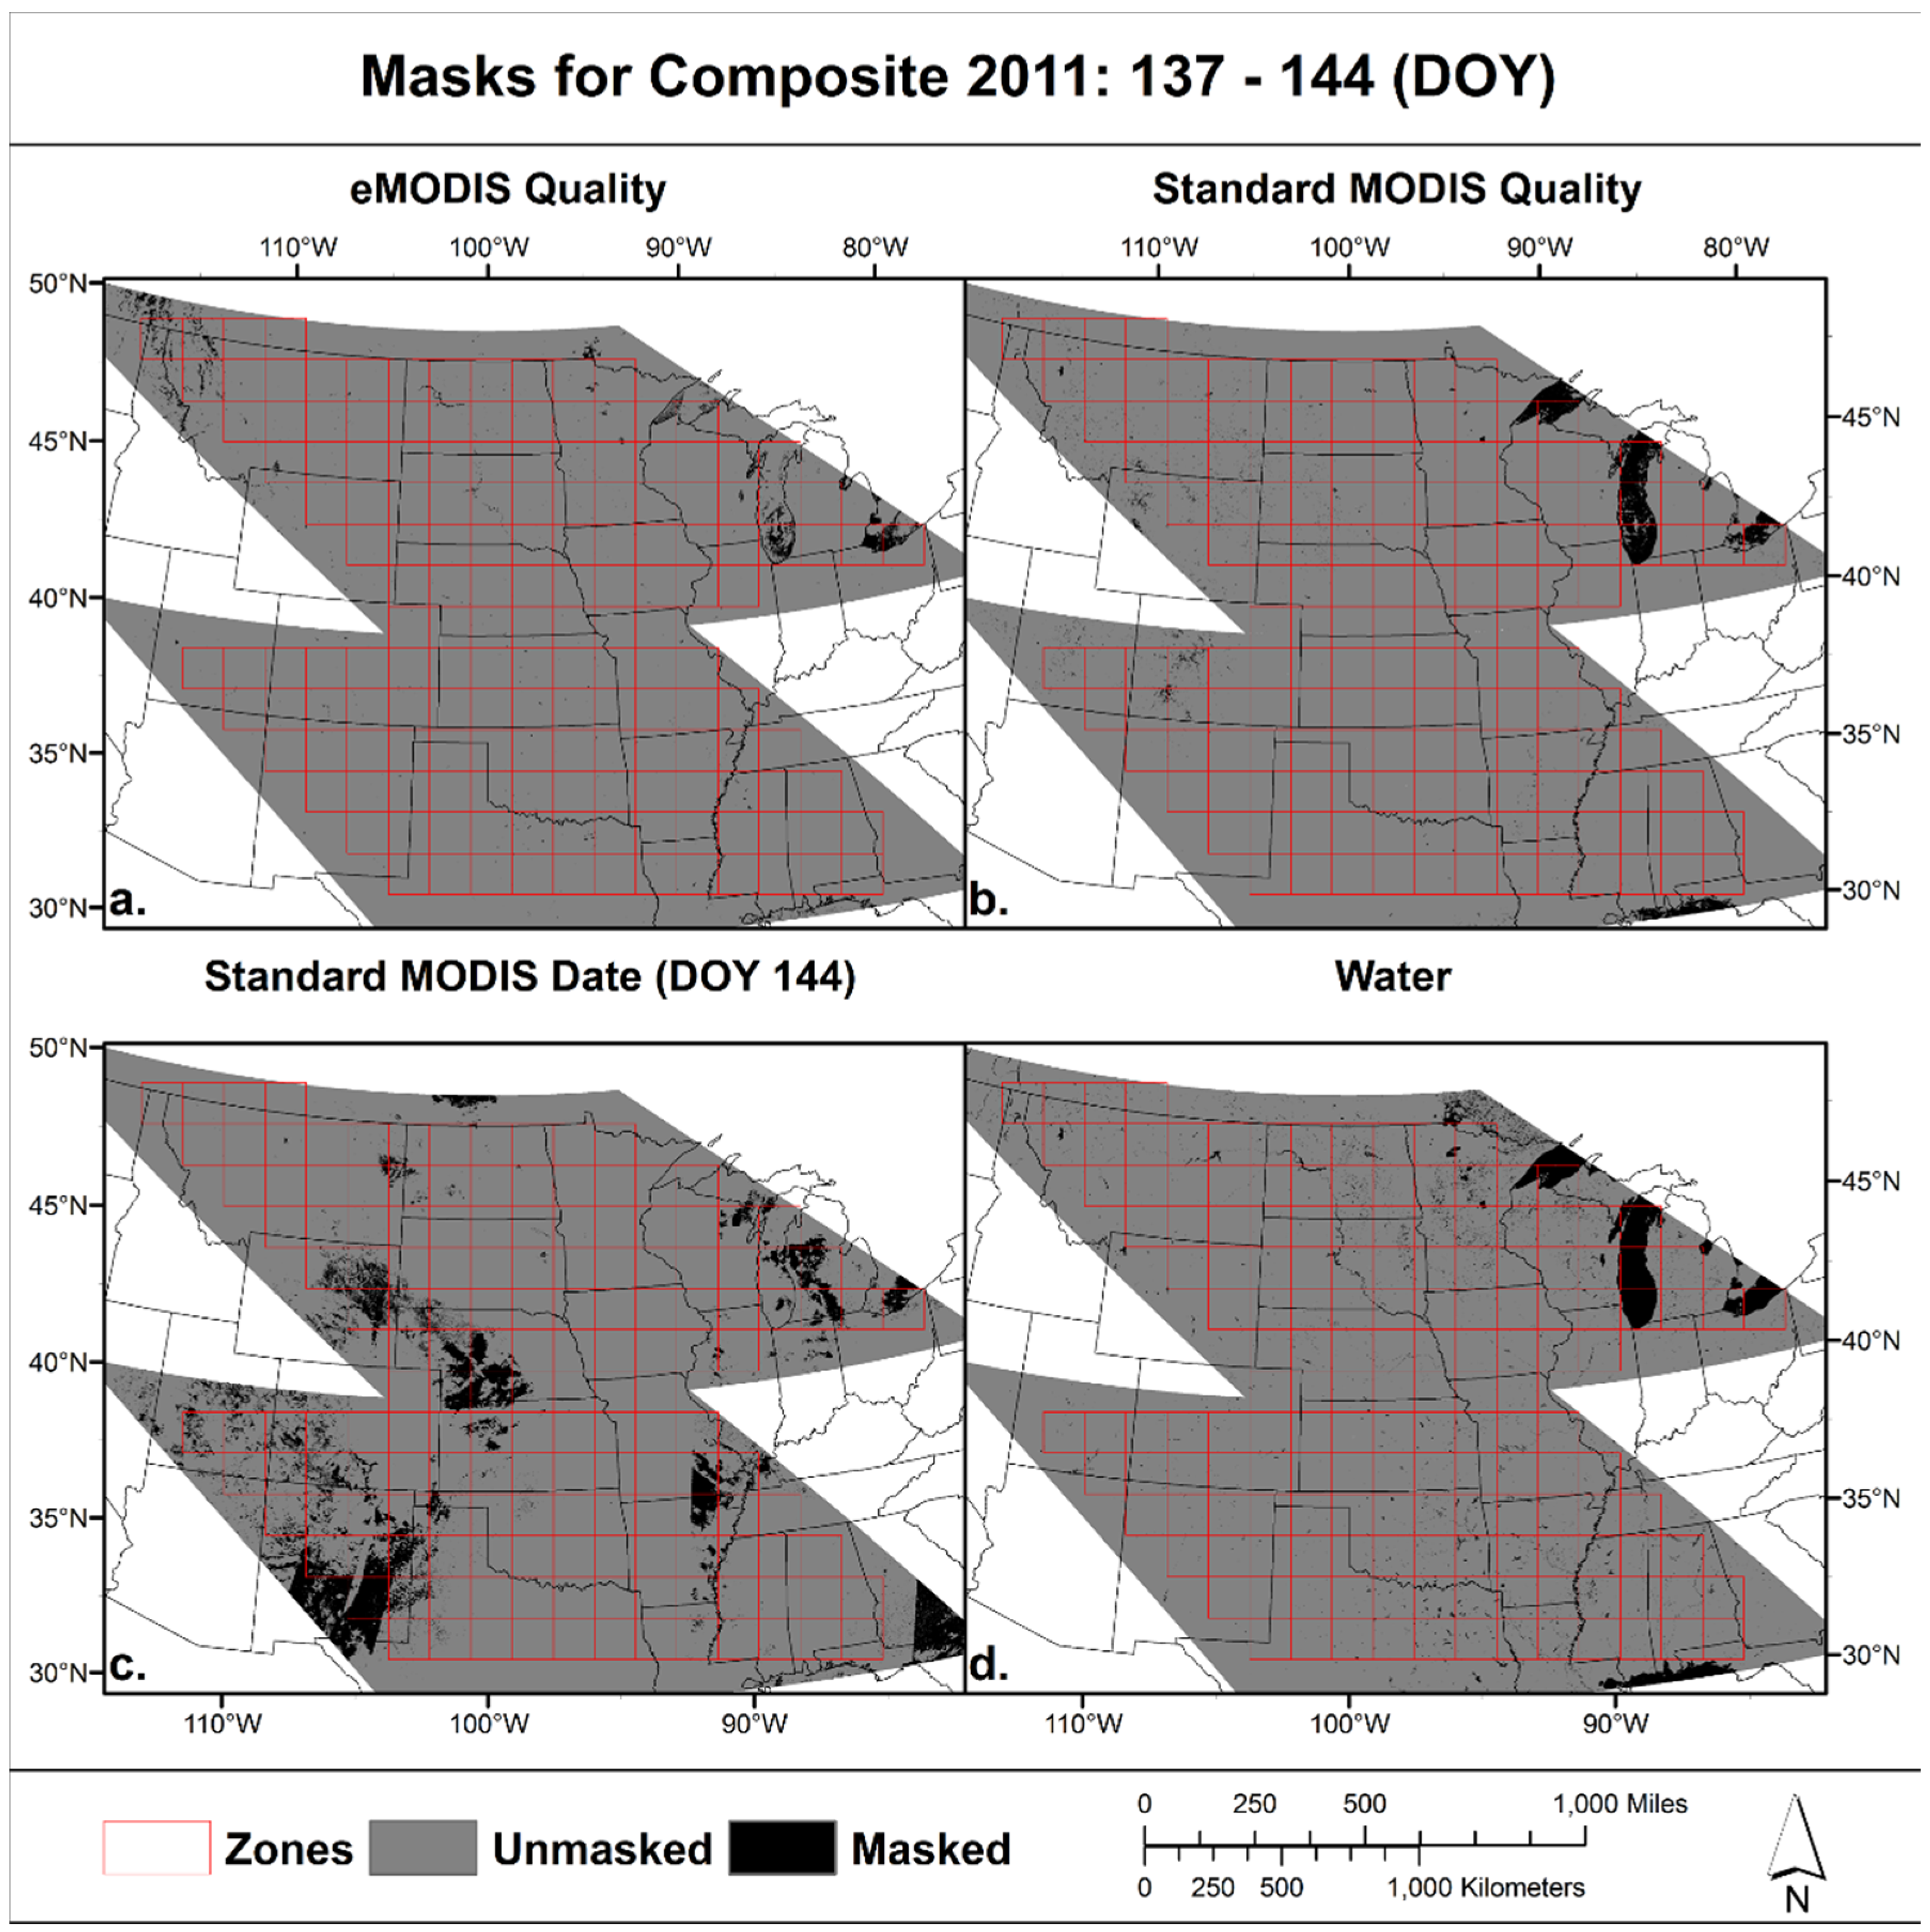
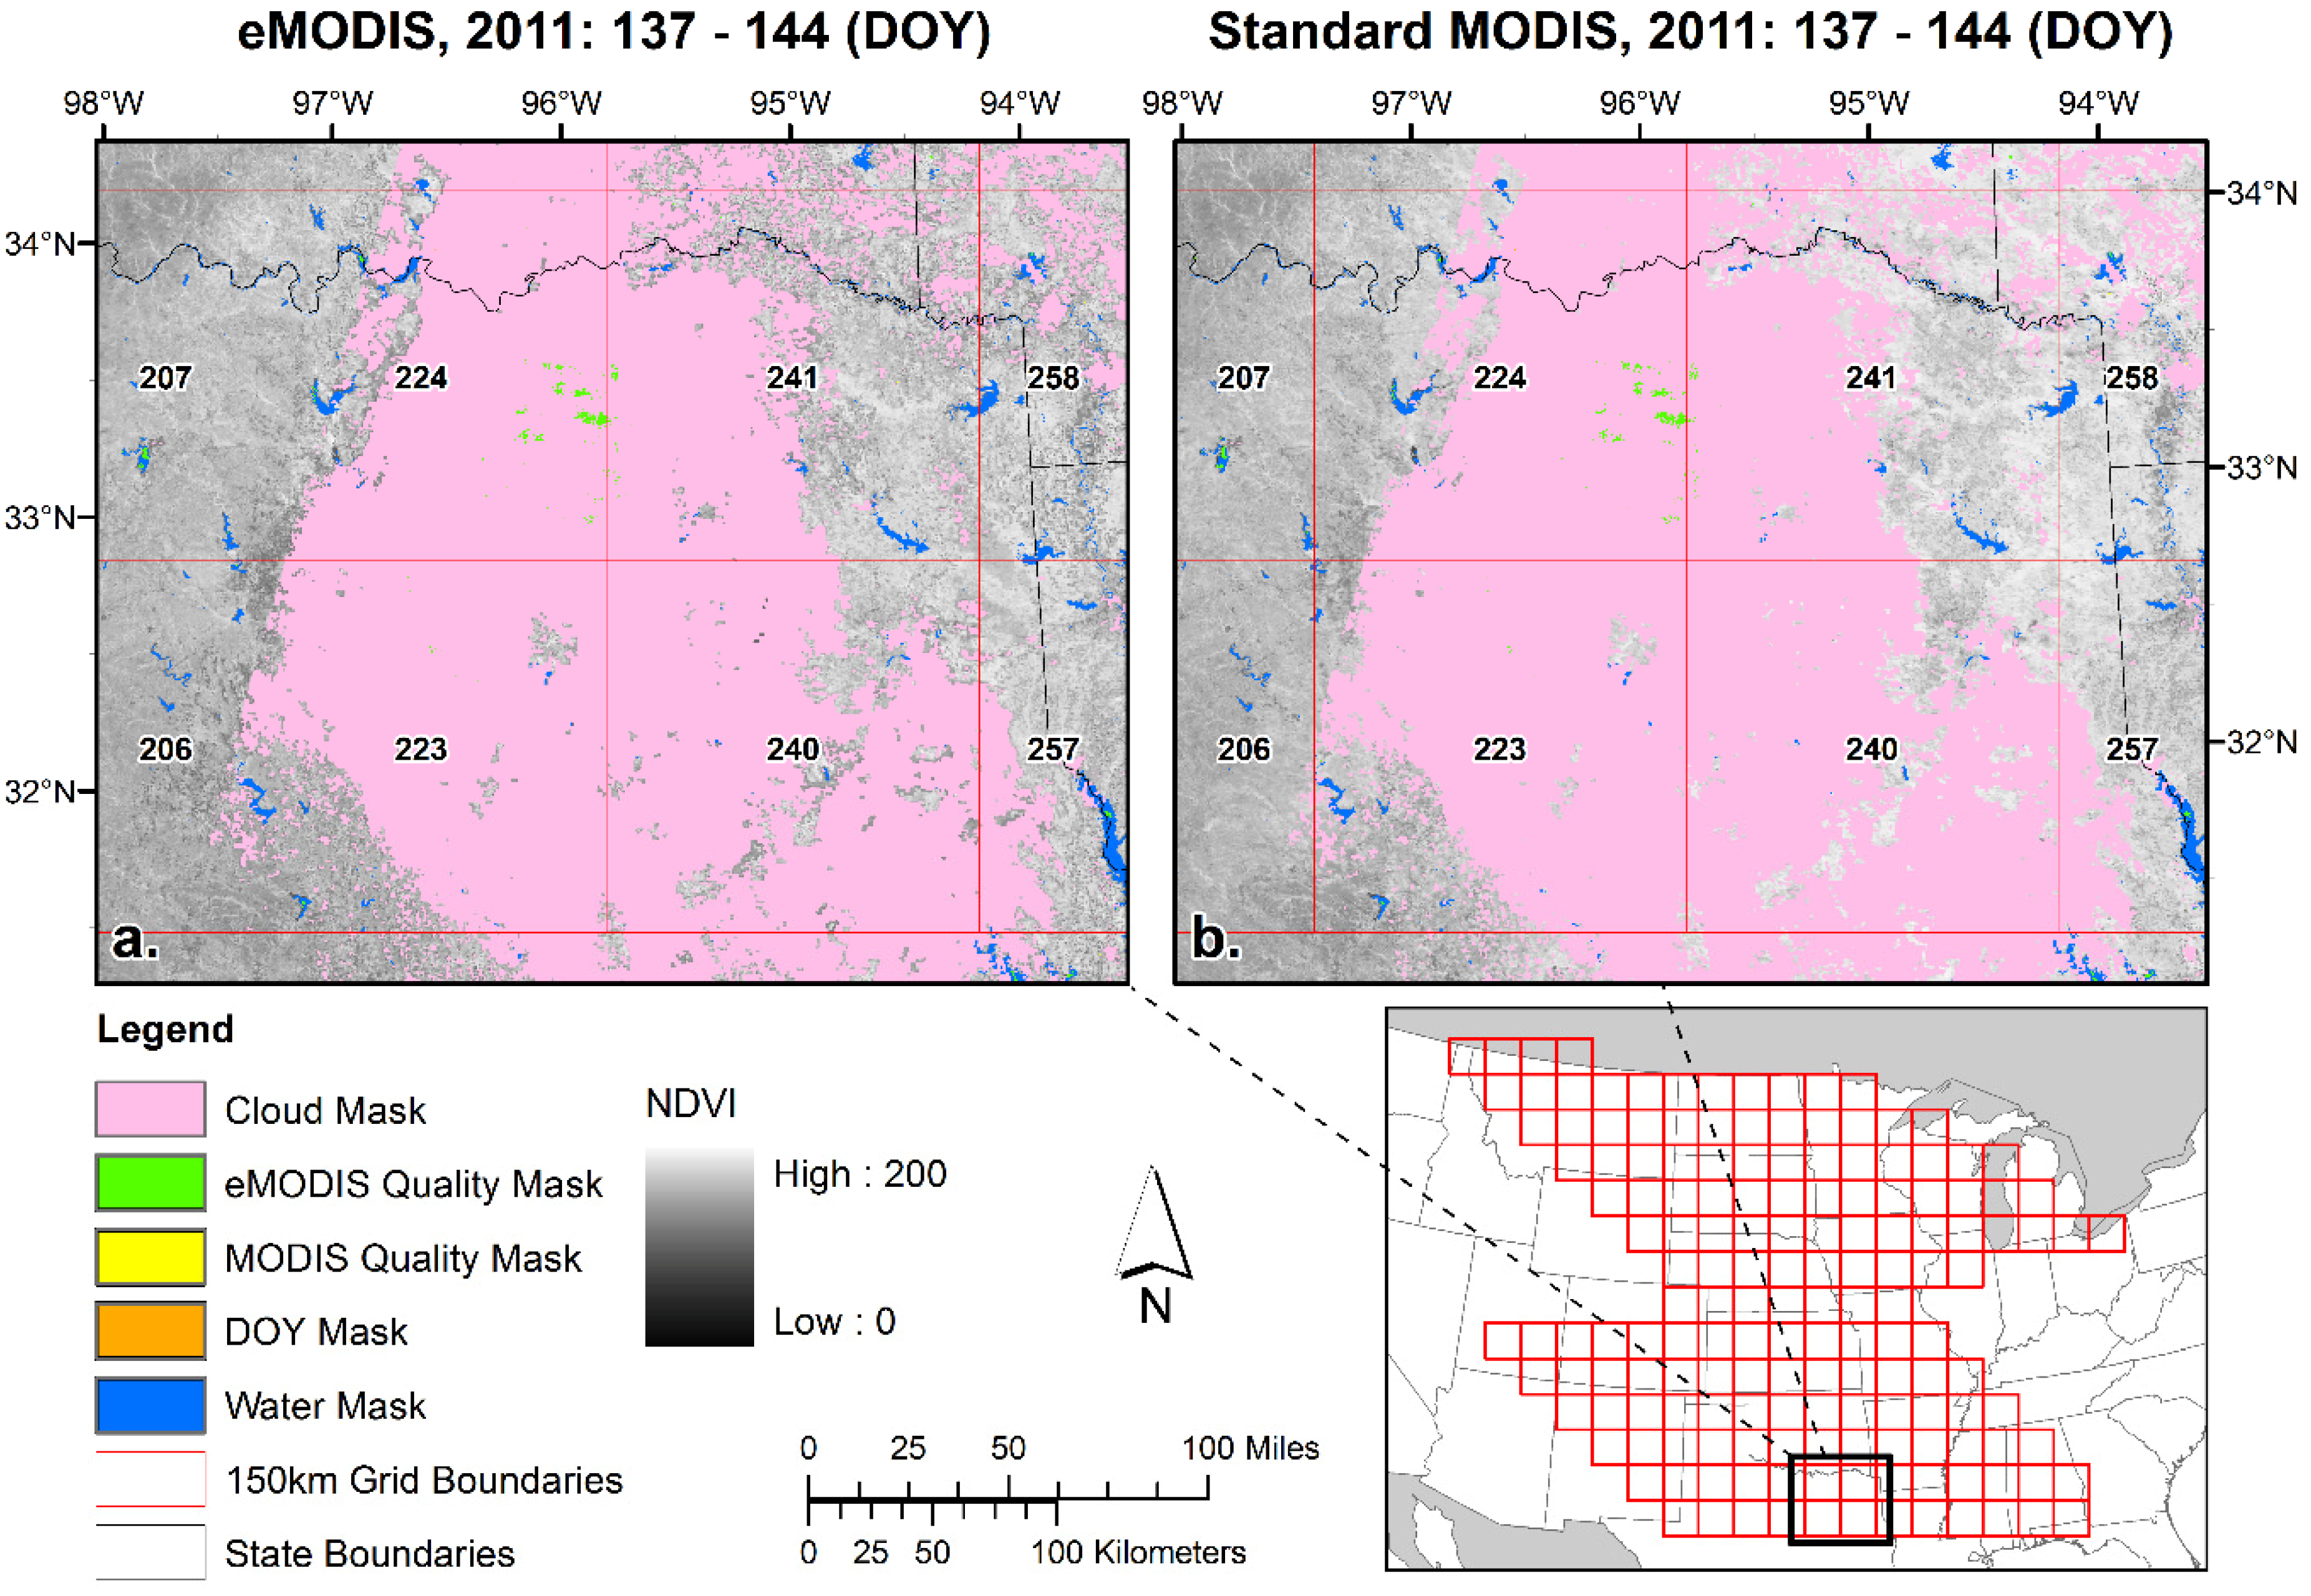
2.5. Data Post-Processing
- eMODIS Quality: Only data classified as “good” quality (value = 0) in the eMODIS quality layer were considered in the comparison. All other data quality values were masked out. The source for eMODIS quality data was the quality image file that is bundled with the eMODIS weekly NDVI.
- Standard MODIS Quality: Only data classified as best quality in the MODIS quality layer were considered in the comparison. All other data quality values were masked out. The source for the quality data is the accompanying quality band in the HDFEOS file. Pixels with quality value of “4096” were retained and all other quality values were masked.
- Standard MODIS Acquisition Date: Only data acquired during the seven day period where eMODIS and MODIS have temporal overlap were considered in the comparison. The non-concurrent acquisition dates were masked out.
- Water: Only non-water areas were considered in the comparison. All water areas were masked out. The source for the water mask was MOD44W (downloaded from https://lpdaac.usgs.gov/dataset_discovery/modis/modis_products_table/mod44w/).
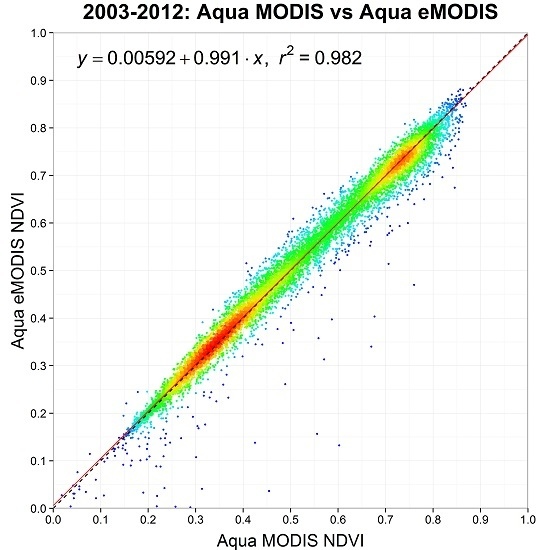
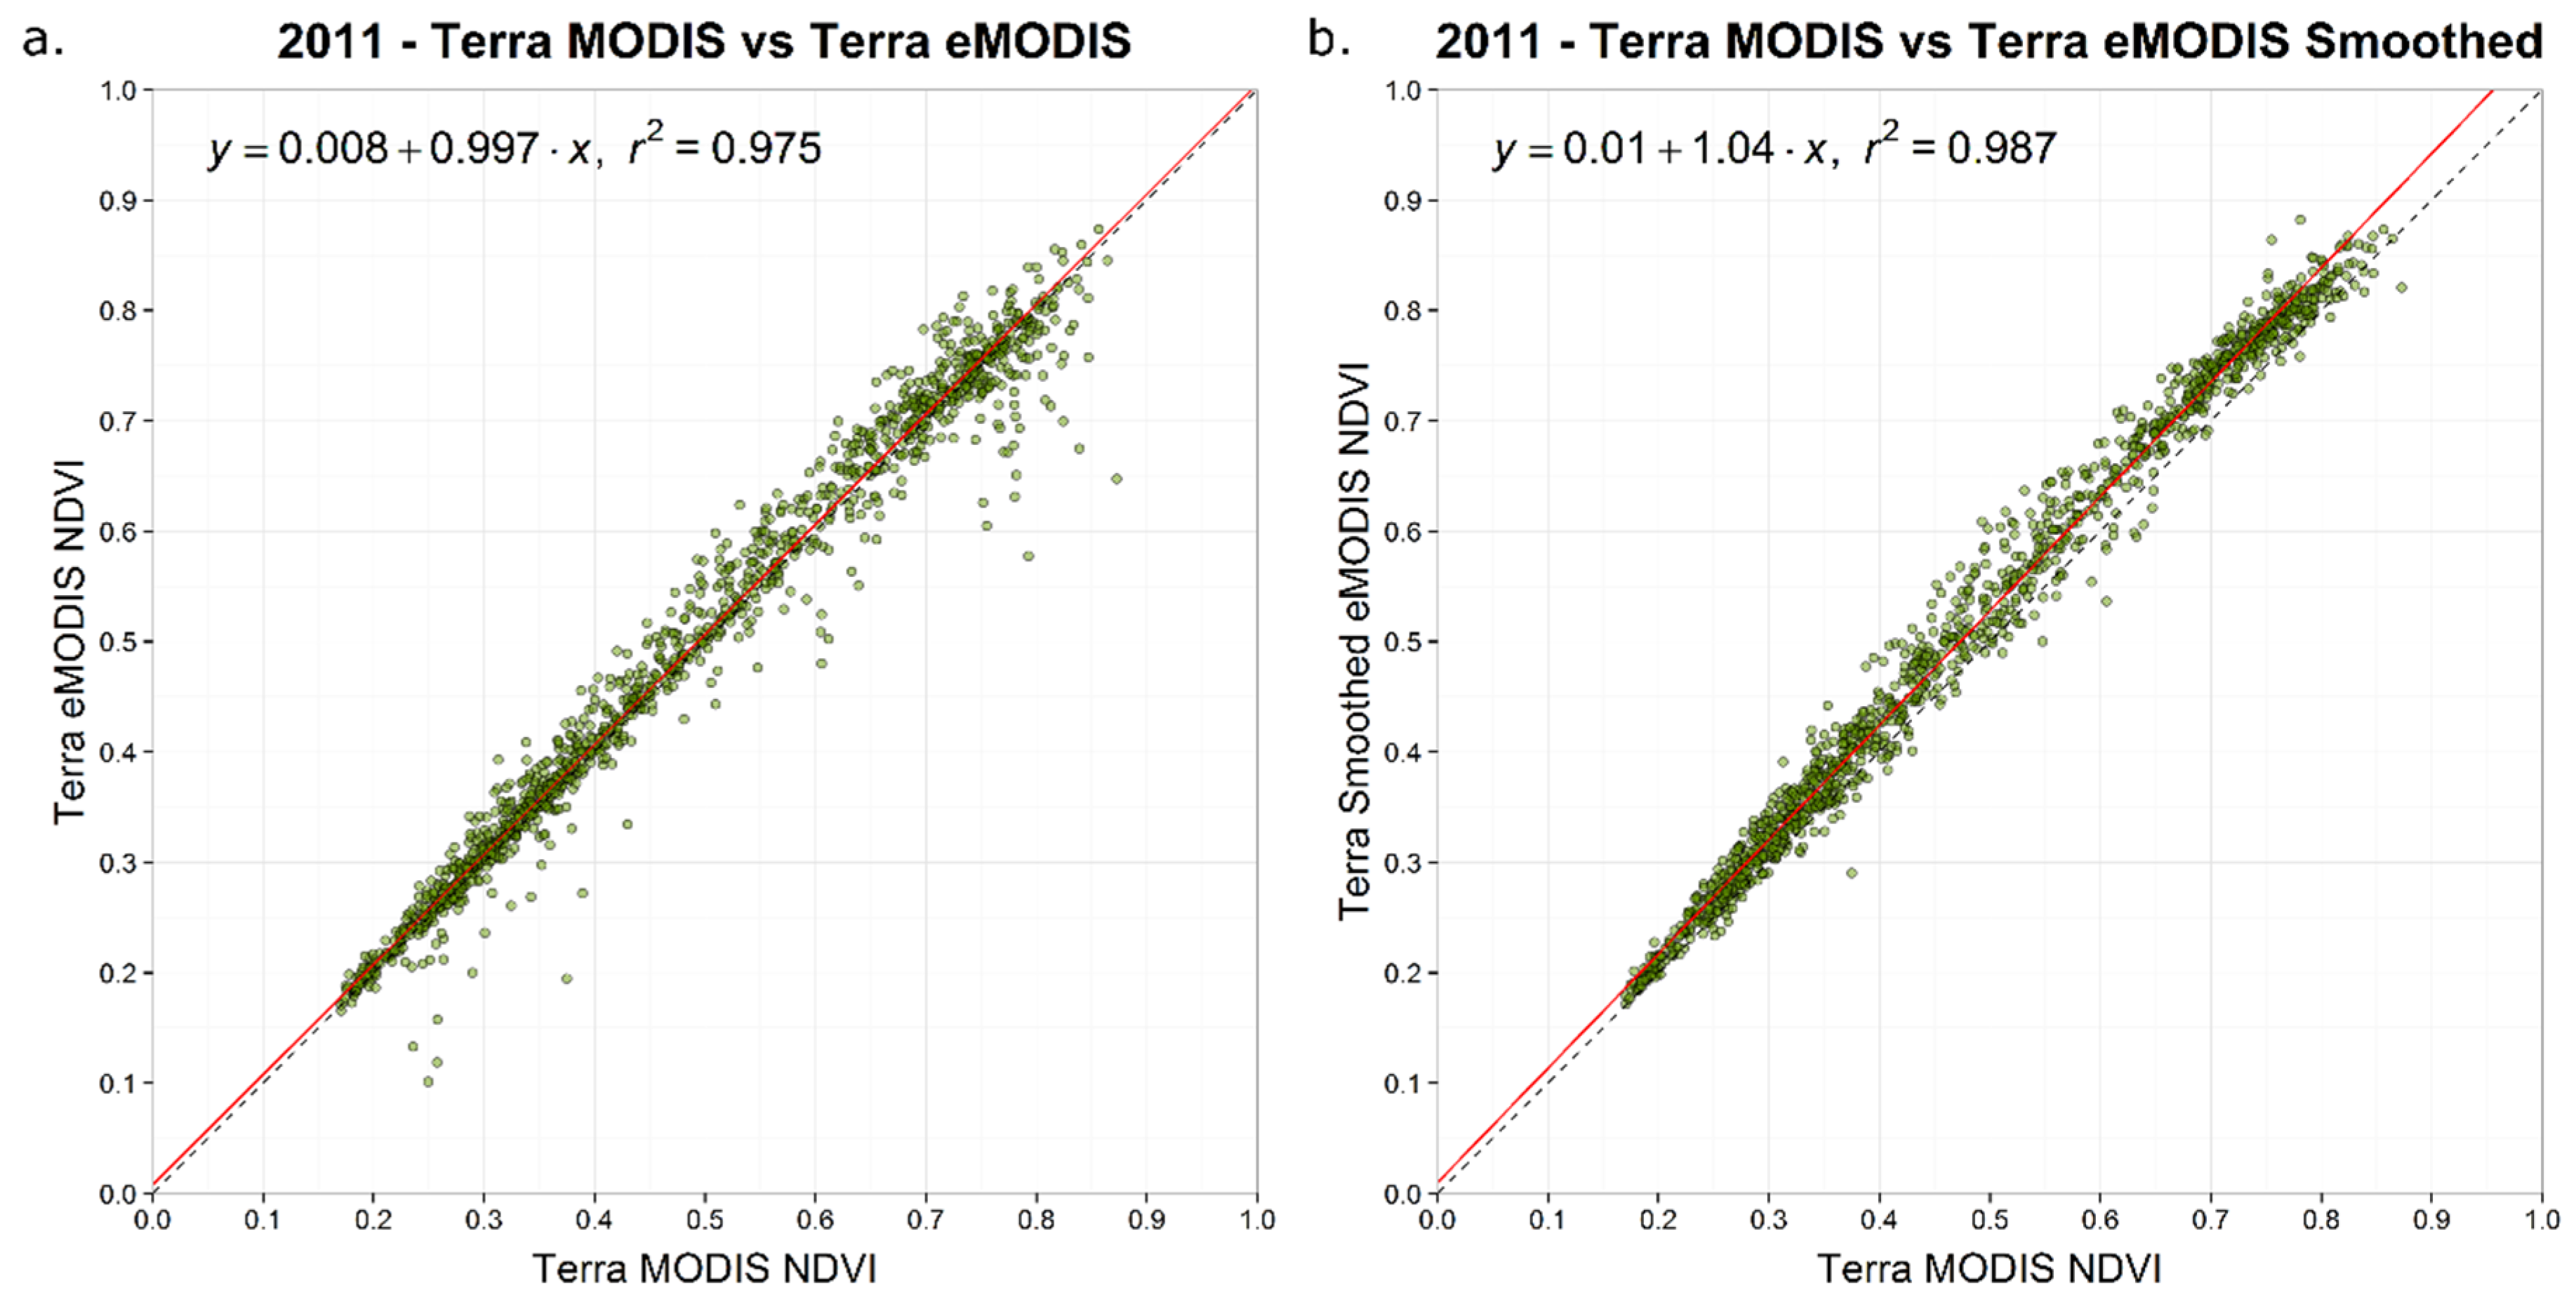
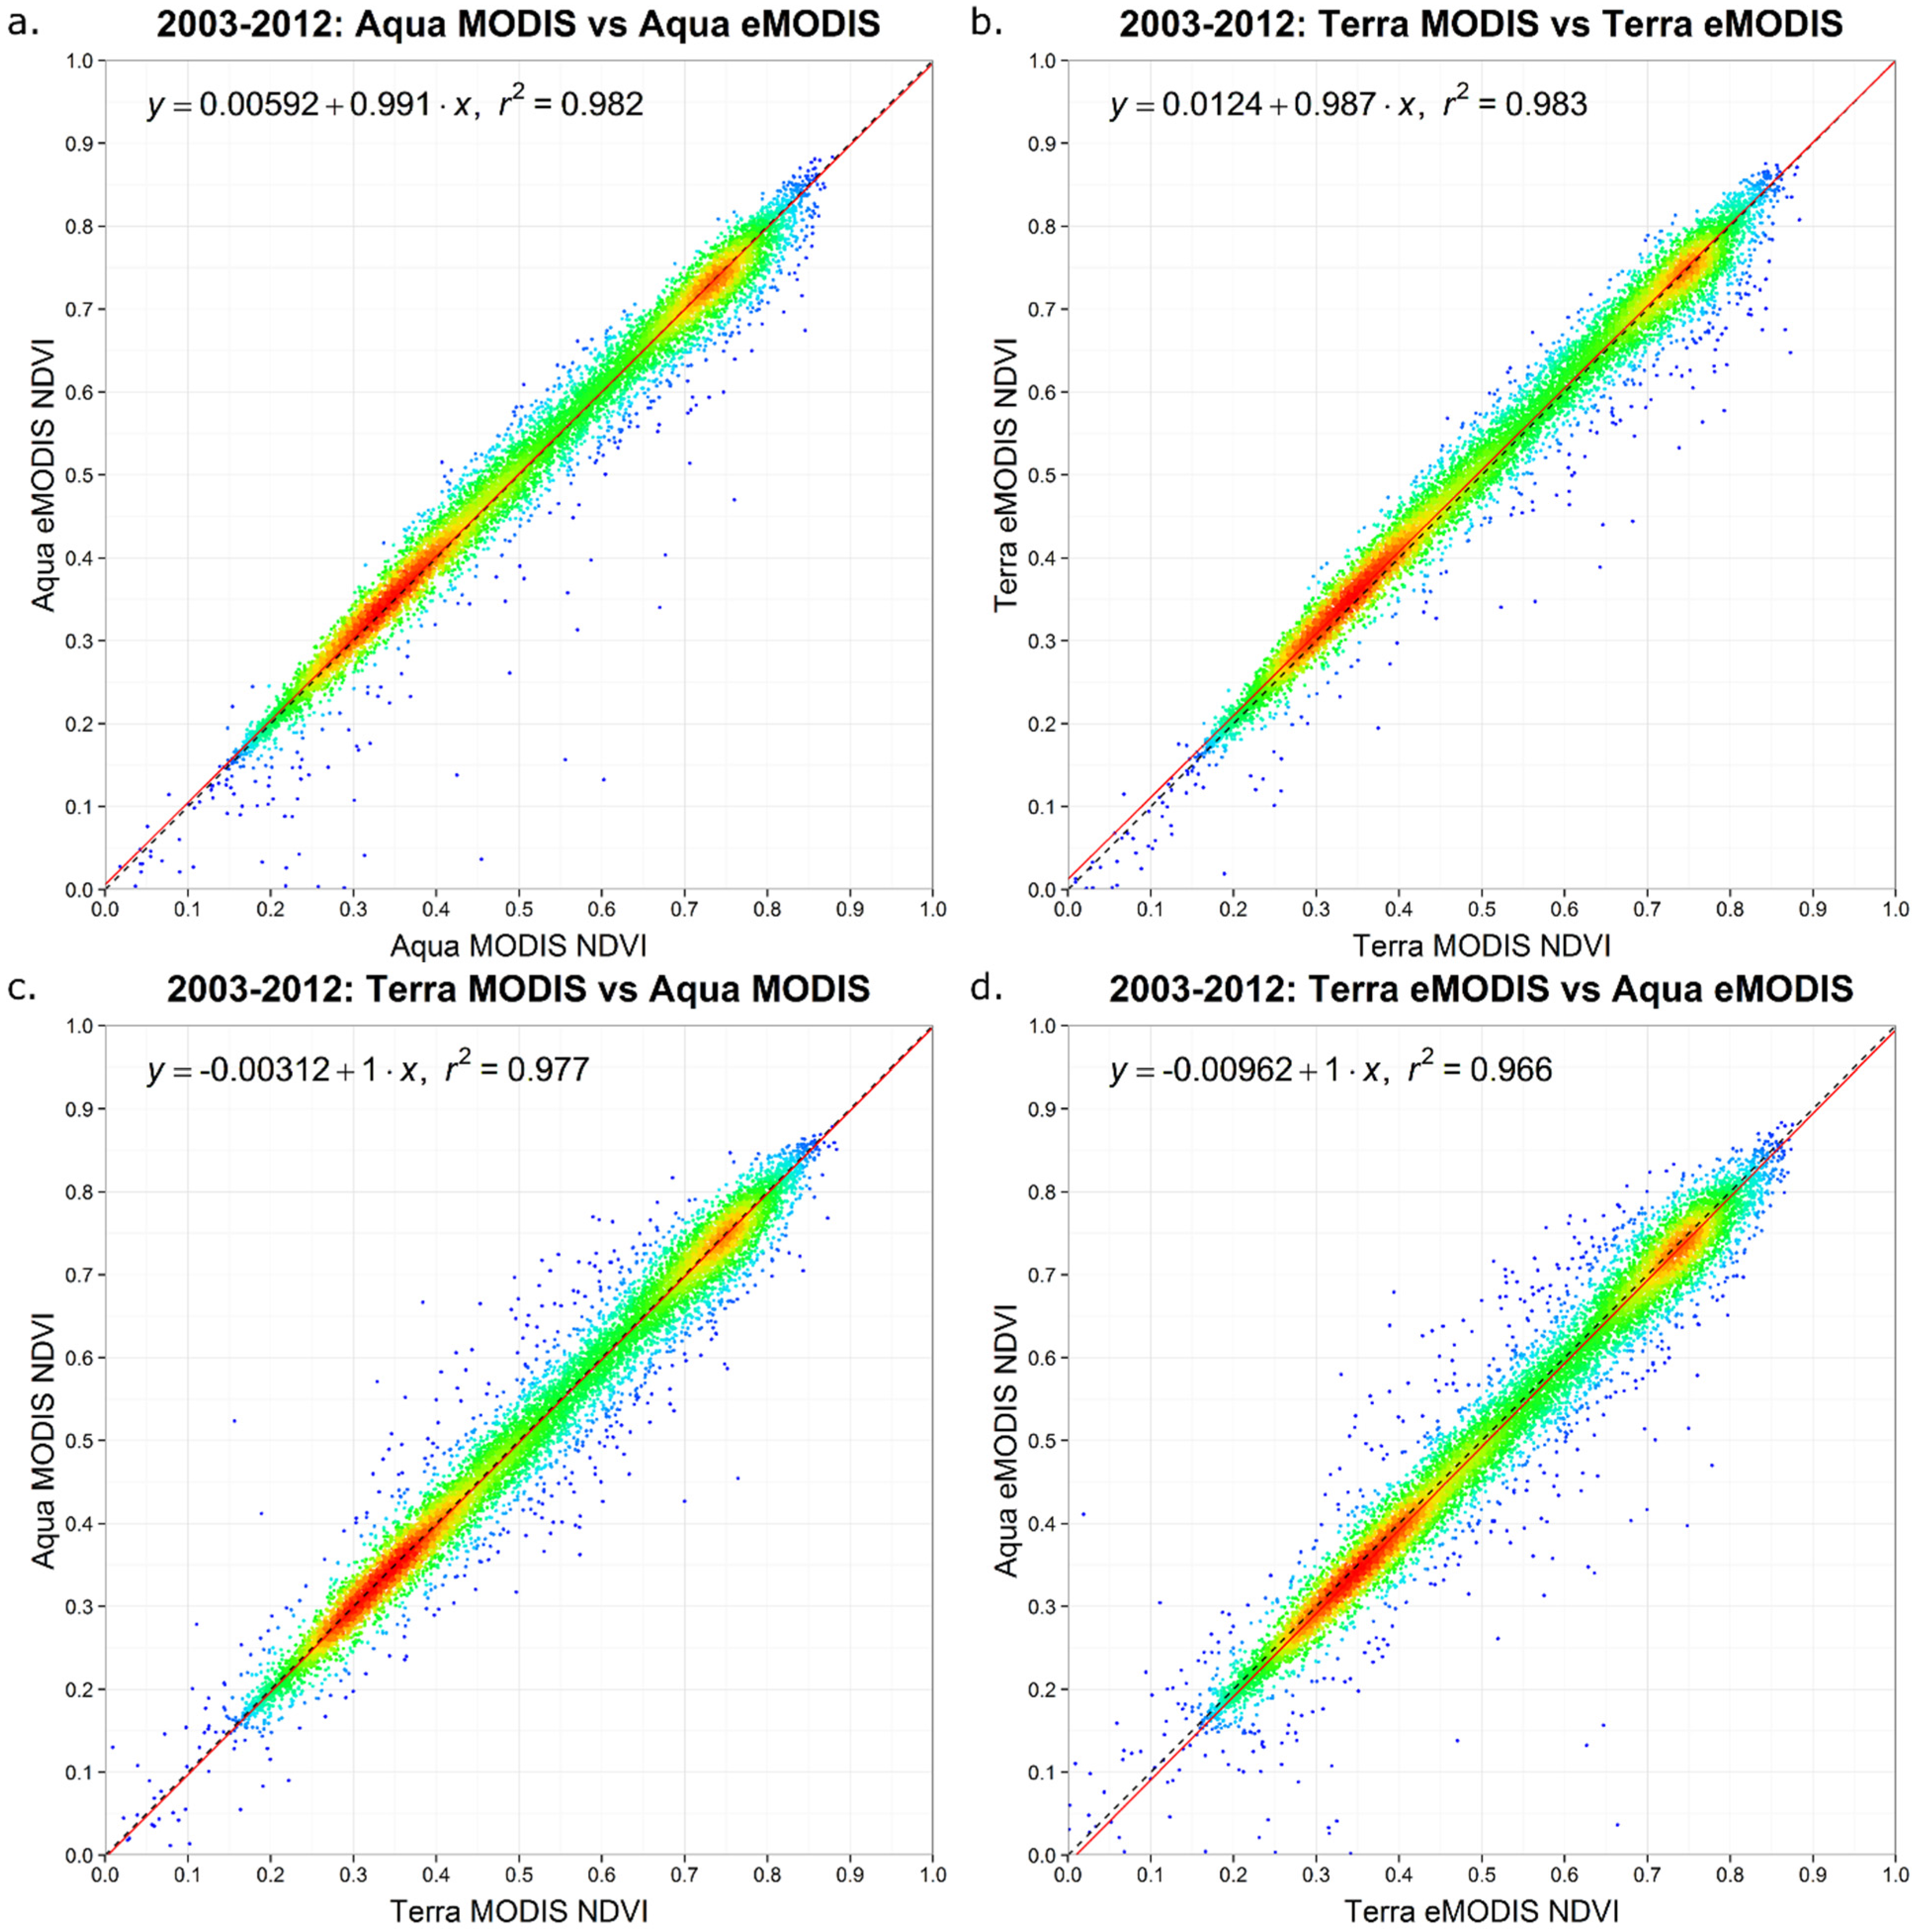
3. Results and Discussion
| Regression and Agreement between Standard MODIS and eMODIS NDVI | ||||
|---|---|---|---|---|
| Data | Standard MODIS vs. eMODIS (Aqua) | Standard MODIS vs. eMODIS (Terra) | Standard MODIS (Aqua) vs. Standard MODIS (Terra) | eMODIS (Aqua) vs. eMODIS (Terra) |
| GM regression | a = 0.0059; b = 0.9908 | a = 0.0124; b = 0.9875 | a = 0.0031; b = 1.0010 | a = 0.0096; b = 1.0043 |
| r2 | 0.9821 | 0.9829 | 0.9770 | 0.9660 |
| AC | 0.9818 | 0.9824 | 0.9770 | 0.9660 |
| RMSD | 0.0252 | 0.0253 | 0.0287 | 0.0351 |
| RMPDs | 0.0022 | 0.0066 | 0.0026 | 0.0075 |
| RMPDu | 0.0251 | 0.0244 | 0.0285 | 0.0343 |

4. Conclusions
Supplementary Files
Supplementary File 1Acknowledgments
Author Contributions
Conflicts of Interest
References
- Atzberger, C. Advances in remote sensing of agriculture: Context description, existing operational monitoring systems and major information needs. Remote Sens. 2013, 5, 949–981. [Google Scholar] [CrossRef]
- Davies, D.K.; Ilavajhala, S.; Wong, M.M.; Justice, C.O. Fire information for resource management system: Archiving and distributing MODIS active fire data. IEEE Trans. Geosci. Remote Sens. 2009, 47, 72–79. [Google Scholar] [CrossRef]
- Hammer, D.; Kraft, R.; Wheeler, D. Alerts of forest disturbance from MODIS imagery. Int. J. Appl. Earth Obs. Geoinf. 2014, 33, 1–9. [Google Scholar] [CrossRef]
- Vrieling, A.; Meroni, M.; Shee, A.; Mude, A.G.; Woodard, J.; de Bie, C.A.J.M.; Rembold, F. Historical extension of operational NDVI products for livestock insurance in Kenya. Int. J. Appl. Earth Obs. Geoinf. 2014, 28, 238–251. [Google Scholar] [CrossRef]
- Brown, J.F.; Wardlow, B.; Tadesse, T.; Hayes, M.; Reed, B.C. The Vegetation Drought Response Index (VegDRI): A new integrated approach for monitoring drought stress in vegetation. GISci. Remote Sens. 2008, 45, 16–46. [Google Scholar] [CrossRef]
- Hargrove, W.W.; Spruce, J.P.; Gasser, G.E.; Hoffman, F.M. Toward a national early warning system for forest disturbances using remotely sensed canopy phenology. Photogramm. Eng. Remote Sens. 2009, 1150–1156. [Google Scholar]
- Carlson, J.D.; Burgan, R.E.; Engle, D.M.; Greenfield, J.R. The Oklahoma fire danger model: An operational tool for mesoscale fire danger rating in Oklahoma. Int. J. Wildland Fire 2002, 11, 183–191. [Google Scholar] [CrossRef]
- Townshend, J.R.G.; Justice, C. Towards operational monitoring of terrestrial systems by moderate-resolution remote sensing. Remote Sens. Environ. 2002, 83, 351–359. [Google Scholar] [CrossRef]
- Xie, Y.; Xiong, X.; Qu, J.J.; Che, N.; Summers, M.E. Impact analysis of MODIS band-to-band registration on its measurements and science data products. Int. J. Remote Sens. 2011, 32, 4431–4444. [Google Scholar] [CrossRef]
- Jenkerson, C.; Maiersperger, T.; Schmidt, G. eMODIS: A User-Friendly Data Source; Open-File Report 2010-1055; U.S. Geological Survey: Reston, VA, USA, 2010. [Google Scholar]
- Eidenshink, J. A 16-year time series of 1 km AVHRR satellite data of the conterminous United States and Alaska. Photogramm. Eng. Remote Sens. 2006, 72, 1027–1035. [Google Scholar] [CrossRef]
- Ji, L.; Wylie, B.; Ramachandran, B.; Jenkerson, C. A comparative analysis of three different MODIS NDVI datasets for Alaska and adjacent Canada. Can. J. Remote Sens. 2010, 36, S149–S167. [Google Scholar] [CrossRef]
- Verbyla, D. Comparison of eMODIS and MOD/MYD13A2 NDVI products during 2012–2014 spring green-up periods in Alaska and northwest Canada. Int. J. Appl. Earth Obs. Geoinf. 2014, 36, 83–86. [Google Scholar] [CrossRef]
- Vermote, E.F.; El Saleous, N.Z.; Justice, C.O. Atmospheric correction of MODIS data in the visible to middle infrared: First results. Remote Sens. Environ. 2002, 83, 97–111. [Google Scholar] [CrossRef]
- Vermote, E.F.; Kotchenova, S.Y.; Ray, J.P. MODIS Surface Reflectance User’s Guide, Version 1.3; MODIS Land Surface Reflectance Science Computing Facility: Greenbelt, MD, USA, 2011. [Google Scholar]
- Jönsson, P.; Eklundh, L. Seasonality extraction by function fitting to time-series of satellite sensor data. IEEE Trans. Geosci. Remote Sens. 2002, 40, 1824–1832. [Google Scholar] [CrossRef]
- Chen, J.; Jönsson, P.; Tamura, M.; Gu, Z.; Matsushita, B.; Eklundh, L. A simple method for reconstructing a high-quality NDVI time-series data set based on the Savitzky-Golay filter. Remote Sens. Environ. 2004, 91, 332–344. [Google Scholar] [CrossRef]
- Swets, D.L.; Reed, B.; Rowland, J.R.; Marko, S.E. A weighted least-squares approach to temporal smoothing of NDVI. In Proceedings of the 1999 ASPRS Annual Conference: From Image to Information, Portland, OR, USA, 17–21 May 1999.
- Funk, C.; Budde, M. Phenologically-tuned MODIS NDVI-based production anomaly estimates for Zimbabwe. Remote Sens. Environ. 2009, 113, 115–125. [Google Scholar] [CrossRef]
- Boyte, S.P.; Wylie, B.K.; Major, D.J.; Brown, J.F. The integration of geophysical and enhanced moderate resolution imaging spectroradiometer normalized difference vegetation index data into a rule-based, piecewise regression-tree model to estimate cheatgrass beginning of spring growth. Int. J. Digit. Earth 2015, 8, 116–130. [Google Scholar] [CrossRef]
- Reed, B.C.; Brown, J.F.; VanderZee, D.; Loveland, T.R.; Merchant, J.W.; Ohlen, D.O. Measuring phenological variability from satellite imagery. J. Veg. Sci. 1994, 5, 703–714. [Google Scholar] [CrossRef]
- Wylie, B.K.; Fosnight, E.A.; Gilmanov, T.G.; Frank, A.B.; Morgan, J.A.; Haferkamp, M.R.; Meyers, T.P. Adaptive data-driven models for estimating carbon fluxes in the Northern Great Plains. Remote Sens. Environ. 2007, 106, 399–413. [Google Scholar] [CrossRef]
- Wylie, B.K.; Zhang, L.; Bliss, N.; Ji, L.; Tieszen, L.L.; Jolly, W.M. Integrating modelling and remote sensing to identify ecosystem performance anomalies in the boreal forest, Yukon River Basin, Alaska. Int. J. Digit. Earth 2008, 1, 196–220. [Google Scholar] [CrossRef]
- Whitcraft, A.K.; Vermote, E.F.; Becker-Reshef, I.; Justice, C.O. Cloud cover throughout the agricultural growing season: Impacts on passive optical earth observations. Remote Sens. Environ. 2015, 156, 438–447. [Google Scholar] [CrossRef]
- Wilson, A.M.; Parmentier, B.; Jetz, W. Systematic land cover bias in Collection 5 MODIS cloud mask and derived products—A global overview. Remote Sens. Environ. 2014, 141, 149–154. [Google Scholar] [CrossRef]
- Gu, Y.; Brown, J.; Miura, T.; van Leeuwen, W.J.; Reed, B. Phenological classification of the United States: A geographic framework for extending multi-sensor time-series data. Remote Sens. 2010, 2, 526–544. [Google Scholar] [CrossRef]
- Kimball, J.S.; McDonald, K.C.; Zhao, M. Spring thaw and its effect on terrestrial vegetation productivity in the Western Arctic observed from satellite microwave and optical remote sensing. Earth Interact. 2006, 10, 1–22. [Google Scholar] [CrossRef]
- Wang, C.; Cao, R.; Chen, J.; Rao, Y.; Tang, Y. Temperature sensitivity of spring vegetation phenology correlates to within-spring warming speed over the Northern Hemisphere. Ecol. Indic. 2015, 50, 62–68. [Google Scholar] [CrossRef]
- Wang, D.; Morton, D.C.; Masek, J.; Wu, A.; Nagol, J.; Xiong, X.; Levy, R.; Vermote, E.; Wolfe, R.E. Impact of sensor degradation on the MODIS NDVI time series. Remote Sens. Environ. 2012, 119, 55–61. [Google Scholar] [CrossRef]
- Justice, C.O.; Román, M.O.; Csiszar, I.; Vermote, E.F.; Wolfe, R.E.; Hook, S.J.; Friedl, M.; Wang, Z.; Schaaf, C.B.; Miura, T.; et al. Land and cryosphere products from Suomi NPP VIIRS: Overview and status. J. Geophys. Res. Atmos. 2013, 118, 9753–9765. [Google Scholar] [CrossRef] [PubMed]
© 2015 by the authors; licensee MDPI, Basel, Switzerland. This article is an open access article distributed under the terms and conditions of the Creative Commons by Attribution (CC-BY) license (http://creativecommons.org/licenses/by/4.0/).
Share and Cite
Brown, J.F.; Howard, D.; Wylie, B.; Frieze, A.; Ji, L.; Gacke, C. Application-Ready Expedited MODIS Data for Operational Land Surface Monitoring of Vegetation Condition. Remote Sens. 2015, 7, 16226-16240. https://doi.org/10.3390/rs71215825
Brown JF, Howard D, Wylie B, Frieze A, Ji L, Gacke C. Application-Ready Expedited MODIS Data for Operational Land Surface Monitoring of Vegetation Condition. Remote Sensing. 2015; 7(12):16226-16240. https://doi.org/10.3390/rs71215825
Chicago/Turabian StyleBrown, Jesslyn F., Daniel Howard, Bruce Wylie, Aaron Frieze, Lei Ji, and Carolyn Gacke. 2015. "Application-Ready Expedited MODIS Data for Operational Land Surface Monitoring of Vegetation Condition" Remote Sensing 7, no. 12: 16226-16240. https://doi.org/10.3390/rs71215825
APA StyleBrown, J. F., Howard, D., Wylie, B., Frieze, A., Ji, L., & Gacke, C. (2015). Application-Ready Expedited MODIS Data for Operational Land Surface Monitoring of Vegetation Condition. Remote Sensing, 7(12), 16226-16240. https://doi.org/10.3390/rs71215825