
Sentinel-2 for Mapping Iron Absorption Feature Parameters


Abstract
:
1. Introduction

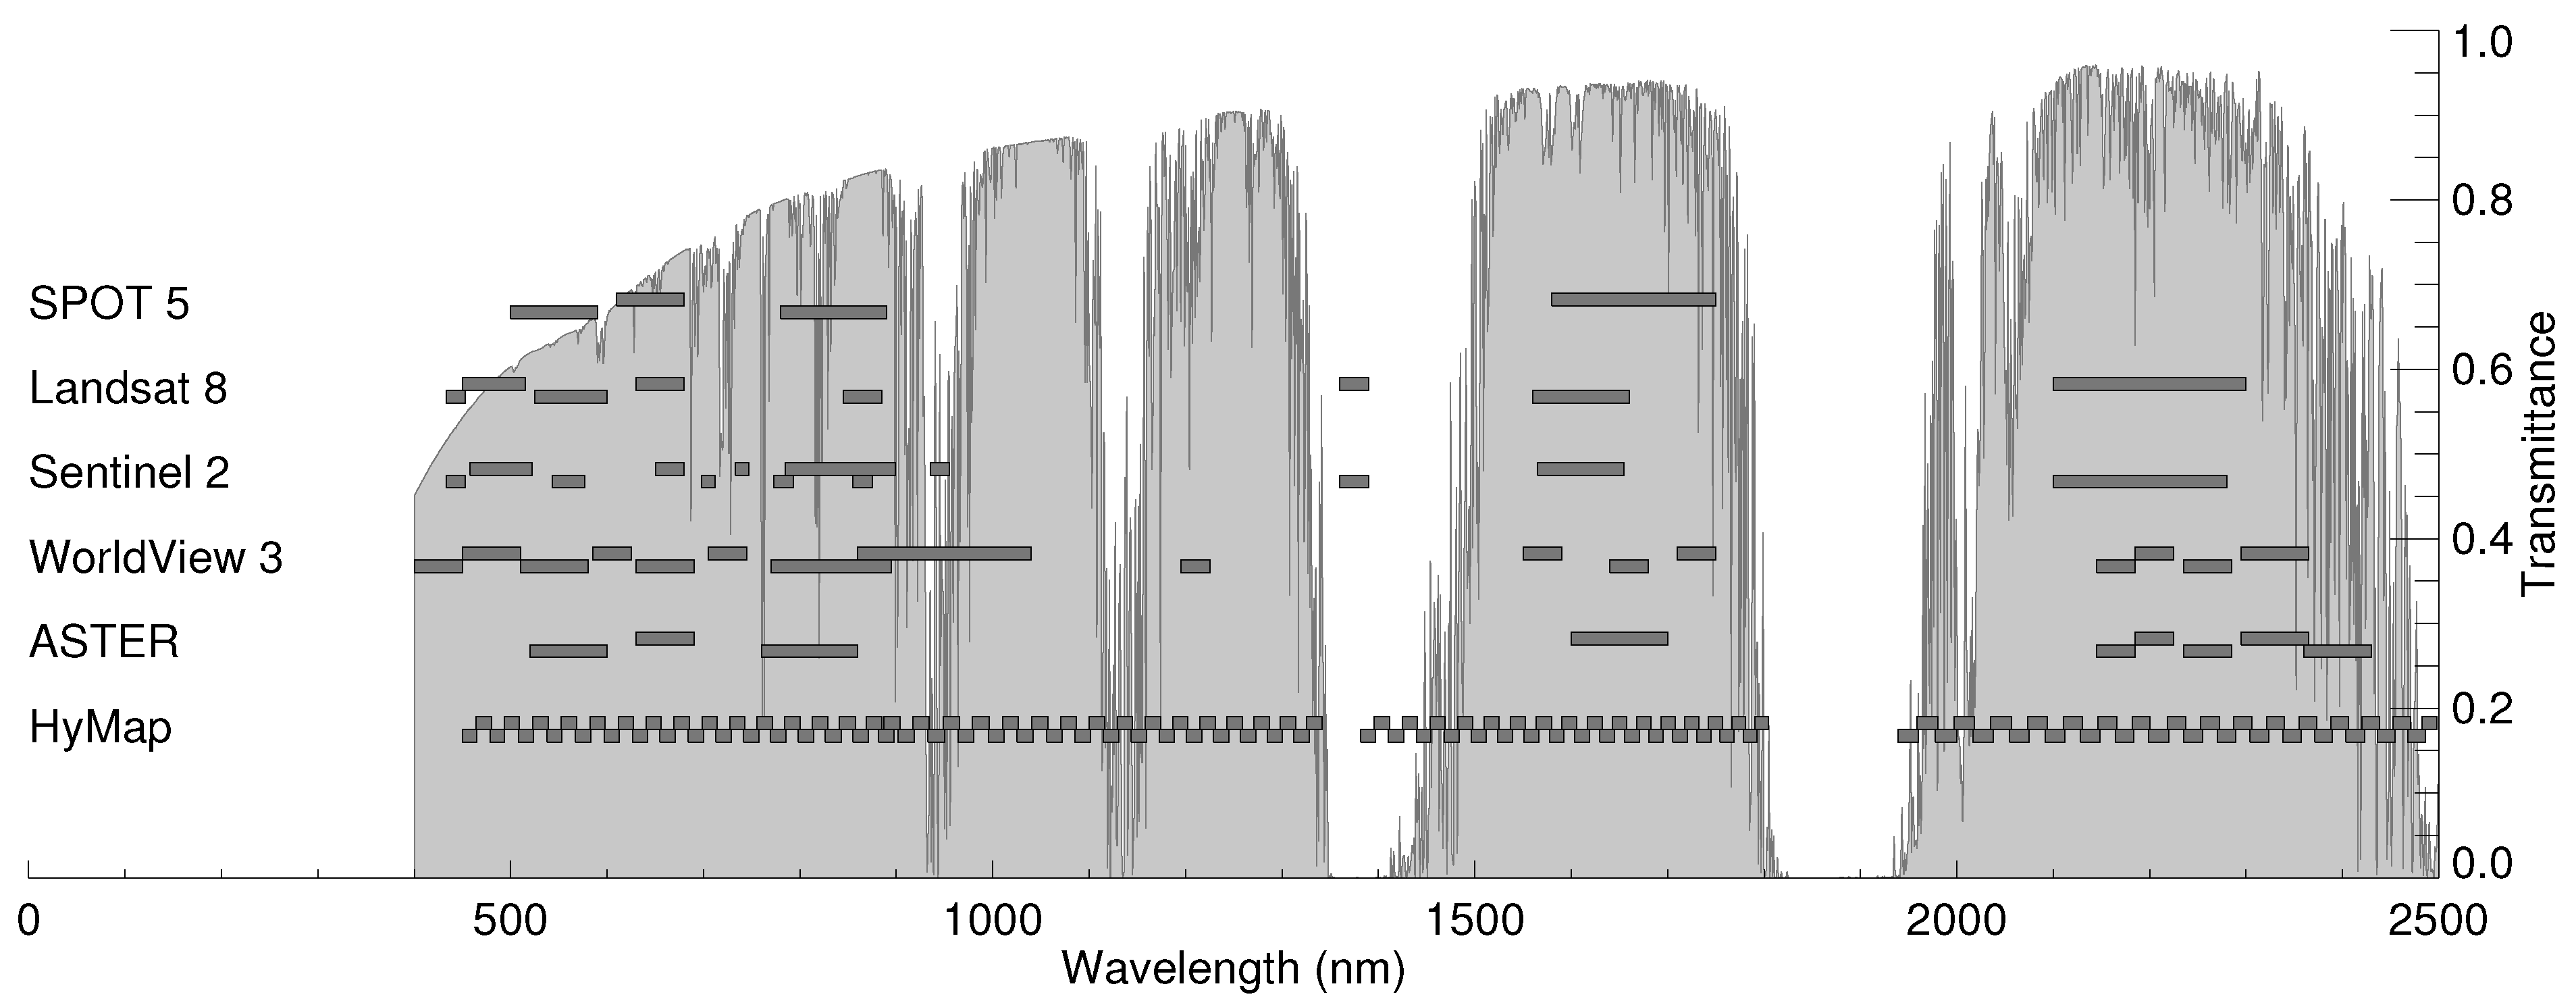
| # | λ | Δλ | R | Heritage | Purpose |
|---|---|---|---|---|---|
| 1 | 443 | 20 | 60 | ALI, LS8, MODIS | Atmospheric correction (aerosol scattering) |
| 2 | 490 | 65 | 10 | LS7, LS8, MERIS | Vegetation senescing, carotenoid, browning and soil background; atmospheric correction (aerosol scattering) |
| 3 | 560 | 35 | 10 | LS7, LS8, MERIS, SPOT5 | Green peak, sensitive to total chlorophyll in vegetation |
| 4 | 665 | 30 | 10 | LS7, LS8, MERIS | Max. chlorophyll absorption |
| 5 | 705 | 15 | 20 | MERIS | Red edge position; consolidation of atmospheric corrections/fluorescence baseline. |
| 6 | 740 | 15 | 20 | MERIS | Red edge position; atmospheric correction; retrieval of aerosol load |
| 7 | 783 | 20 | 20 | ALI, MERIS | Leaf area index; edge of the NIR plateau |
| 8 | 842 | 115 | 10 | LS7, LS8, SPOT5 | Leaf area index |
| 8a | 865 | 20 | 20 | ALI, LS8, MERIS | NIR plateau, sensitive to total chlorophyll, biomass, Leaf area index and protein; water vapour absorption reference; retrieval of aerosol load and type |
| 9 | 945 | 20 | 60 | MERIS, MODIS | Atmospheric correction (water vapour absorption) |
| 10 | 1375 | 30 | 60 | LS8, MODIS | Atmospheric correction (detection of thin cirrus) |
| 11 | 1610 | 90 | 20 | LS7, LS8, SPOT5 | Sensitive to lignin, starch and forest above ground biomass; snow/ice/cloud separation |
| 12 | 2190 | 180 | 20 | LS7, LS8 | Assessment of Mediterranean vegetation conditions; distinction of clay soils for monitoring of soil erosion; distinction between live biomass, dead biomass and soil, e.g., for burn scars mapping |

2. Method and Study Area
2.1. The Parabola Fitting Technique
- wx the interpolated reflectance value at position x;
- x wavelength position in nm;
- a,b,c coefficients of the parabola function.
2.2. Optimizing With a Spectral Library
2.3. Application to Synthetic Sentinel-2 Imagery
- VIS 0.45–0.89 μm, 15–16 nm, 15 nm;
- NIR 0.89–1.35 μm, 15–16 nm, 15 nm;
- SWIR1 1.40–1.80 μm, 15–16 nm, 13 nm;
- SWIR2 1.95–2.48 μm, 18–20 nm, 17 nm.
- an original image with 22 Hymap bands at the original 5 m spatial resolution;
- a synthetic image with 22 Hymap bands resampled to 60 m spatial resolution;
- a synthetic image with 4 Sentinel-2 bands at the original 5 m spatial resolution;
- a synthetic image with 4 Sentinel-2 bands resampled to 60 m spatial resolution.
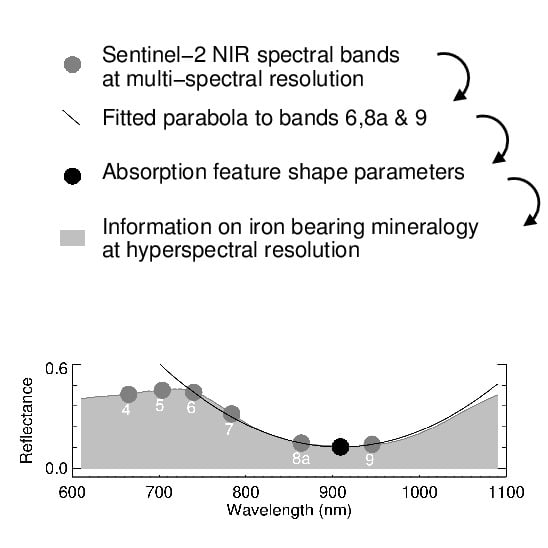
2.4. Mapping Absorption Feature Parameters
- wmin the interpolated wavelength position at minimum reflectance;
- a,b coefficients of the parabola function.
- dmin the interpolated depth of absorption feature.
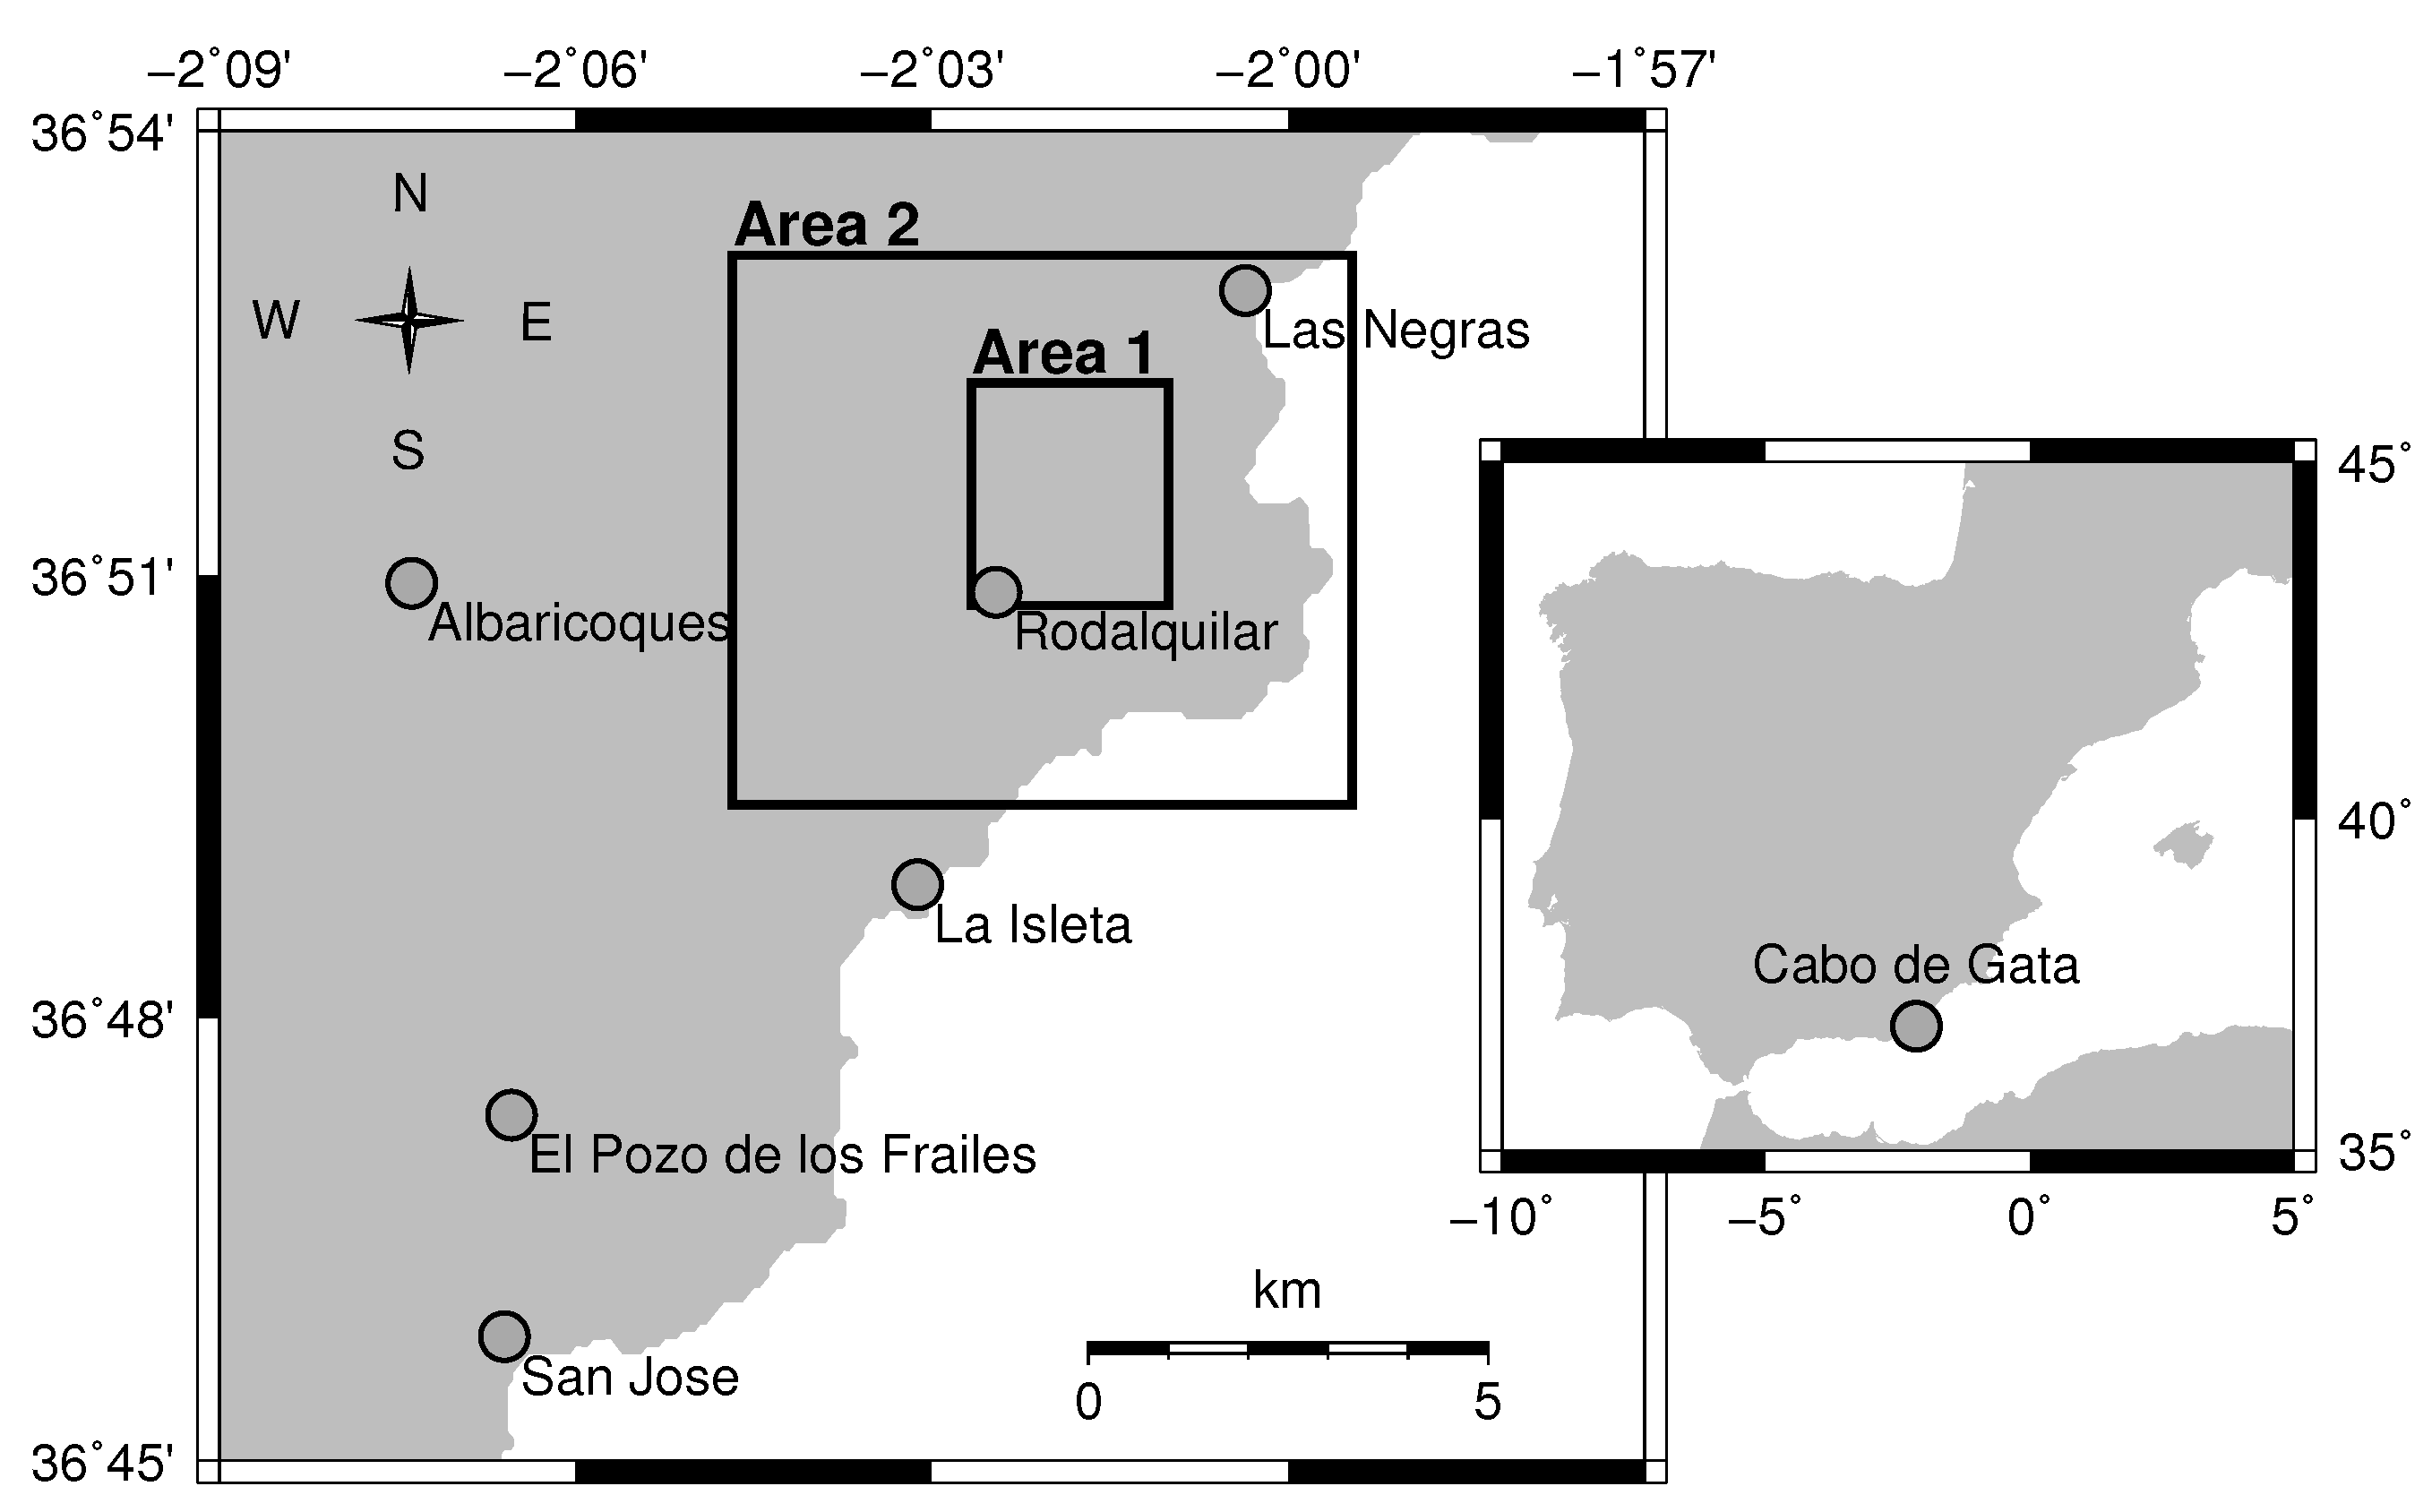
2.5. Study Area
3. Results
3.1. Validating Against Library Spectra
3.2. Application to Imagery

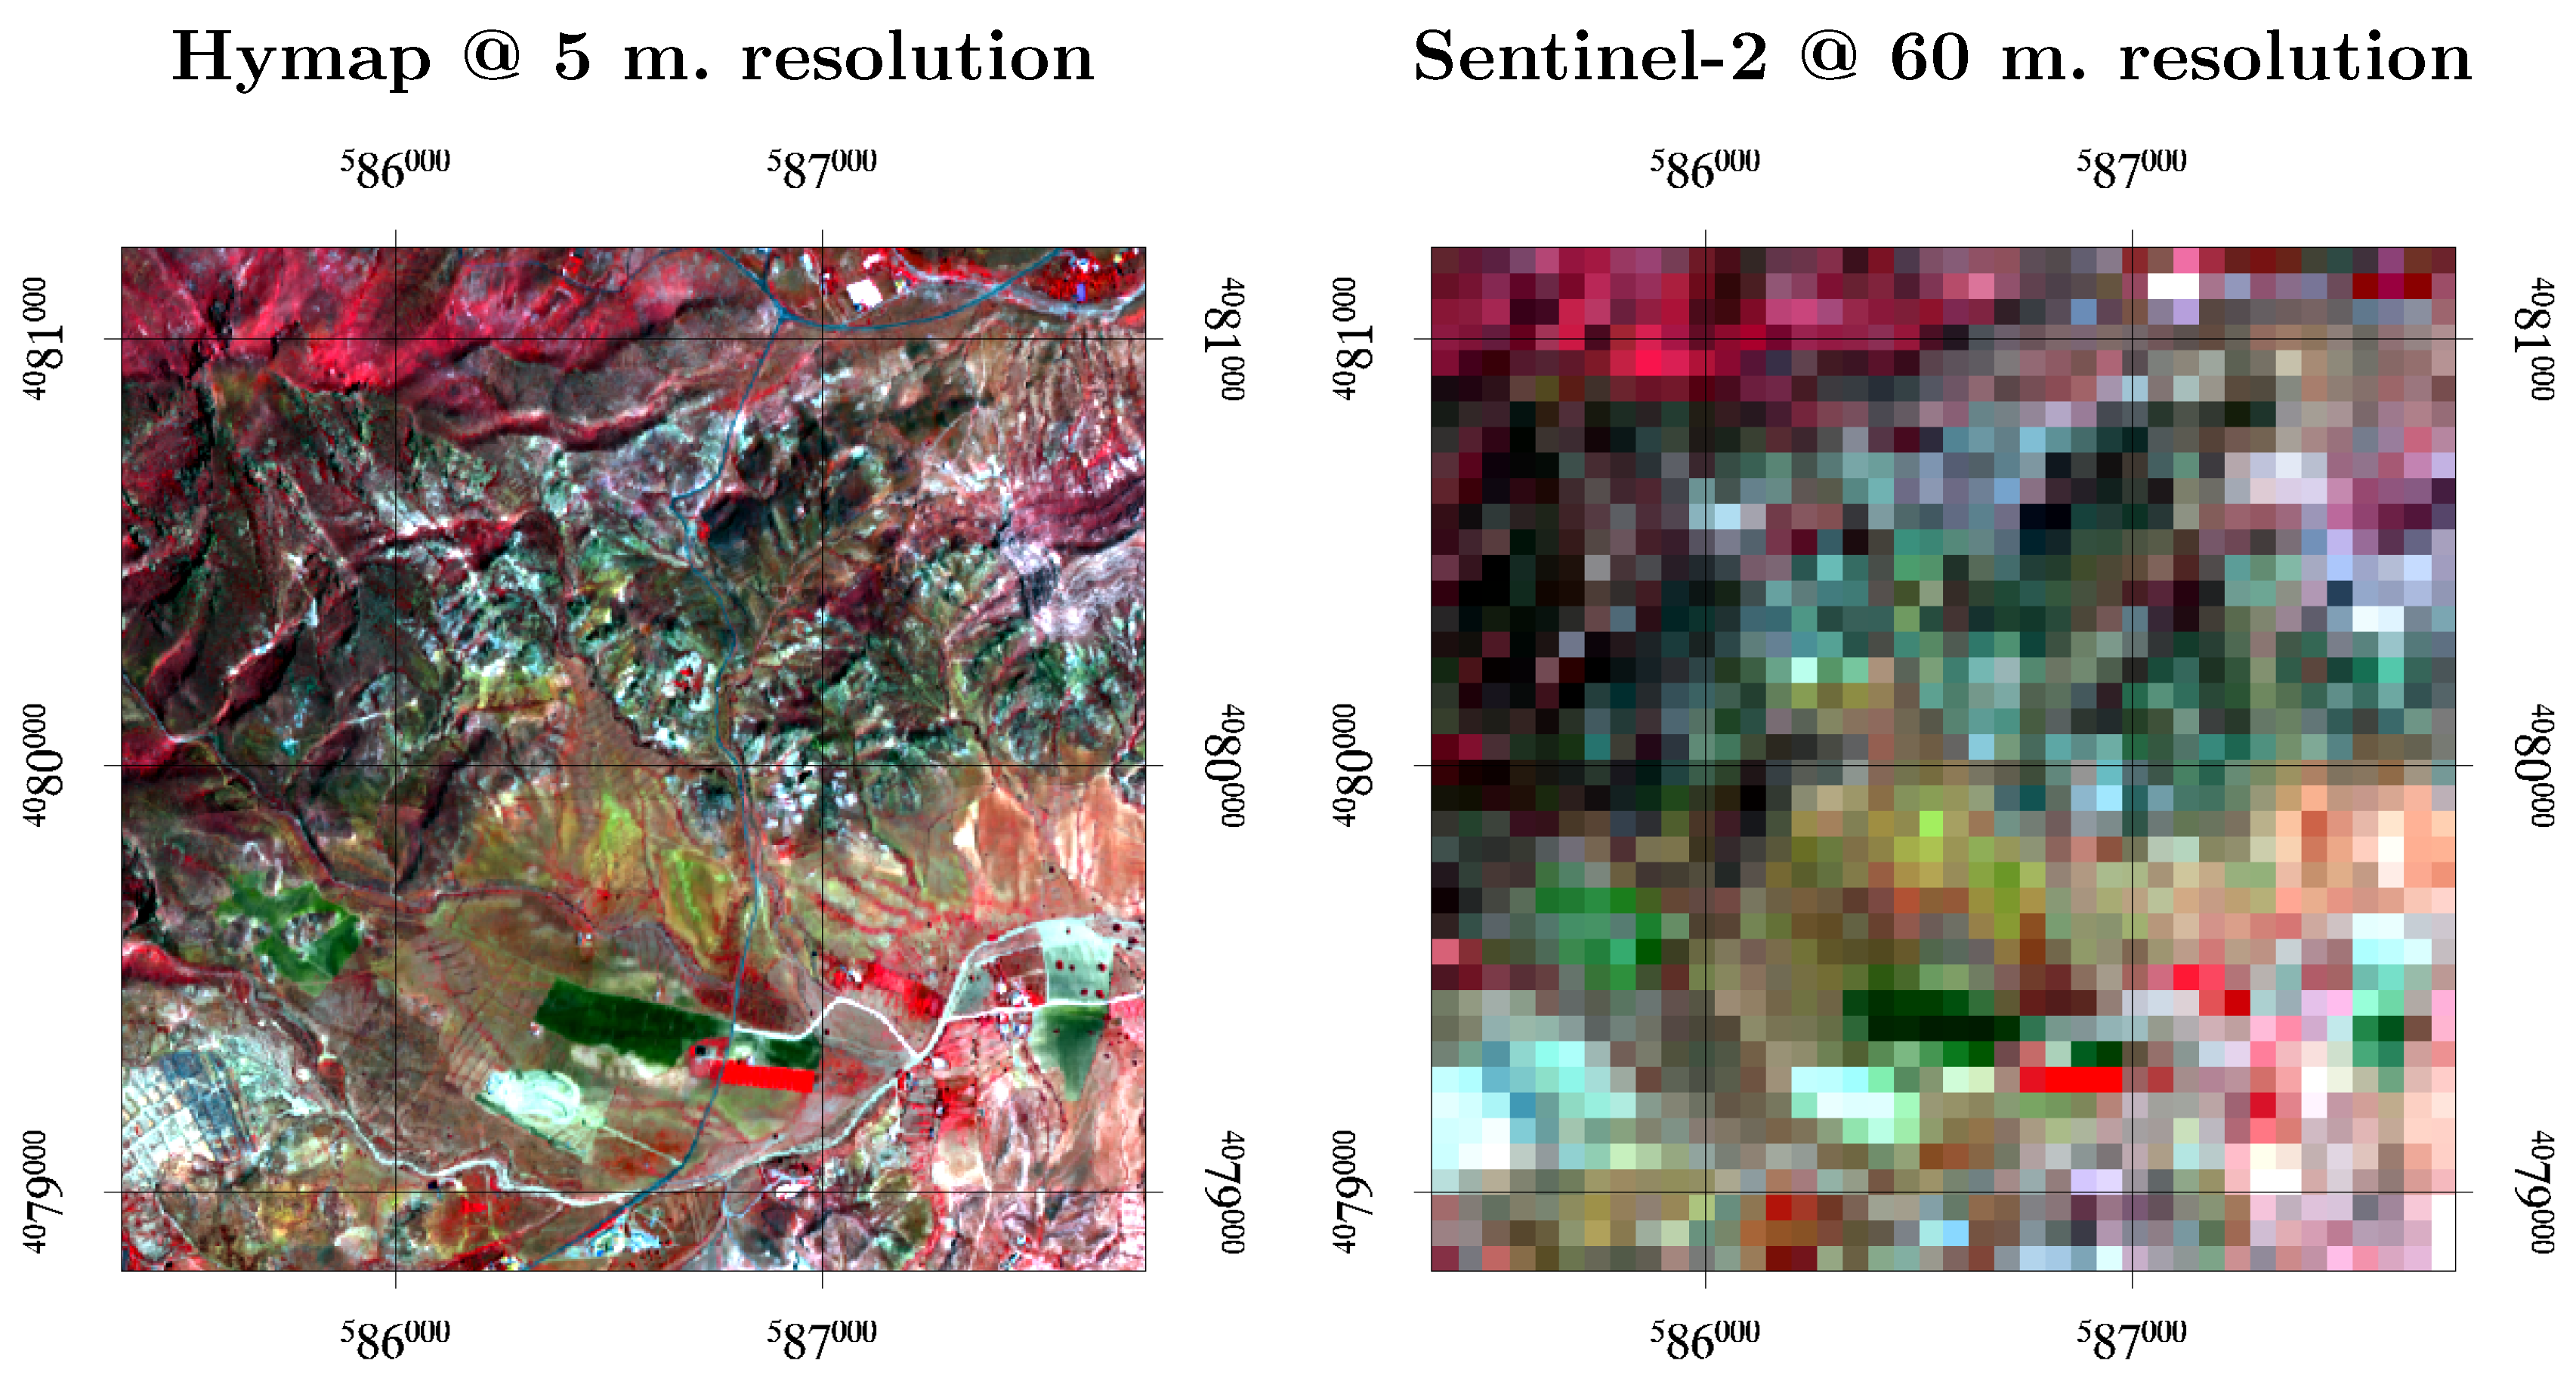
 high. The area covered by these 4 images is shown in Figure 4. The scatterplots in Figure 6c,f–i show the differences between the images with a colorramp low
  high: Scatterplots c and f show the impact of spectral degradation only; scatterplots g and h show the impact of degrading the 5 m spatial resolution to 60 m; and scatter-plot i shows the combined effect of spectral and spatial degradation.
high. The area covered by these 4 images is shown in Figure 4. The scatterplots in Figure 6c,f–i show the differences between the images with a colorramp low high: Scatterplots c and f show the impact of spectral degradation only; scatterplots g and h show the impact of degrading the 5 m spatial resolution to 60 m; and scatter-plot i shows the combined effect of spectral and spatial degradation.
high: Scatterplots c and f show the impact of spectral degradation only; scatterplots g and h show the impact of degrading the 5 m spatial resolution to 60 m; and scatter-plot i shows the combined effect of spectral and spatial degradation.
high. The area covered by these 4 images is shown in Figure 4. The scatterplots in Figure 6c,f–i show the differences between the images with a colorramp low high: Scatterplots c and f show the impact of spectral degradation only; scatterplots g and h show the impact of degrading the 5 m spatial resolution to 60 m; and scatter-plot i shows the combined effect of spectral and spatial degradation. high. The area covered by these 4 images is shown in Figure 4. The scatterplots in Figure 7c,f–i show the differences between the images with a colorramp low high: Scatterplots c and f show the impact of spectral degradation only; scatterplots g and h show the impact of degrading the 5 m spatial resolution to 60 m; and scatter-plot i shows the combined effect of spectral and spatial degradation.
high. The area covered by these 4 images is shown in Figure 4. The scatterplots in Figure 7c,f–i show the differences between the images with a colorramp low high: Scatterplots c and f show the impact of spectral degradation only; scatterplots g and h show the impact of degrading the 5 m spatial resolution to 60 m; and scatter-plot i shows the combined effect of spectral and spatial degradation.
high. The area covered by these 4 images is shown in Figure 4. The scatterplots in Figure 7c,f–i show the differences between the images with a colorramp low high: Scatterplots c and f show the impact of spectral degradation only; scatterplots g and h show the impact of degrading the 5 m spatial resolution to 60 m; and scatter-plot i shows the combined effect of spectral and spatial degradation.
4. Discussion
5. Conclusions
Acknowledgements
Author Contributions
Conflicts of Interest
References
- Berger, M.; Moreno, J.; Johannessen, J.A.; Levelt, P.F.; Hanssen, R.F. ESA’s sentinel missions in support of Earth system science. Remote Sens. Environ. 2012, 120, 84–90. [Google Scholar] [CrossRef]
- Drusch, M.; Del Bello, U.; Carlier, S.; Colin, O.; Fernandez, V.; Gascon, F.; Hoersch, B.; Isola, C.; Laberinti, P.; Martimort, P.; et al. Sentinel-2: ESA’s optical high-resolution mission for GMES operational services. Remote Sens. Environ. 2012, 120, 25–36. [Google Scholar]
- European Space Agency. GMES Sentinel-2 Mission Requirements Document; Technical Report Issue 2 Revision 1; European Space Agency, March, 2010. Available online: http://esamultimedia.esa.int/docs/GMES/Sentinel-2_MRD.pdf (accessed on 22 September 2015).
- van der Meer, F.D.; van der Werff, H.M.A.; van Ruitenbeek, F.J.A. Potential of ESA’s Sentinel-2 for geological applications. Remote Sens. Environ. 2014, 148, 124–133. [Google Scholar] [CrossRef]
- Atzberger, C.; Richter, K. Spatially constrained inversion of radiative transfer models for improved LAI mapping from future Sentinel-2 imagery. Remote Sens. Environ. 2012, 120, 208–218. [Google Scholar] [CrossRef]
- Richter, K.; Atzberger, C.; Vuolo, F.; Weihs, P.; D’Urso, G. Experimental assessment of the Sentinel-2 band setting for RTM-based LAI retrieval of sugar beet and maize. Can. J. Remote Sens. 2009, 35, 230–247. [Google Scholar] [CrossRef]
- Richter, K.; Hank, T.B.; Vuolo, F.; Mauser, W.; D’Urso, G. Optimal exploitation of the Sentinel-2 spectral capabilities for crop leaf area index mapping. Remote Sens. 2012, 4, 561–582. [Google Scholar] [CrossRef]
- Clevers, J.G.P.W.; Gitelson, A.A. Remote estimation of crop and grass chlorophyll and nitrogen content using red-edge bands on Sentinel-2 and -3. Int. J. Appl. Earth Obs. Geoinfor. 2013, 23, 344–351. [Google Scholar] [CrossRef]
- Frampton, W.J.; Dash, J.; Watmough, G.; Milton, E.J. Evaluating the capabilities of Sentinel-2 for quantitative estimation of biophysical variables in vegetation. ISPRS J. Photogramm. Remote Sens. 2013, 82, 83–92. [Google Scholar] [CrossRef]
- Verrelst, J.; Munoz, J.; Alonso, L.; Delegido, J.; Rivera, J.P.; Camps-Valls, G.; Moreno, J. Machine learning regression algorithms for biophysical parameter retrieval: Opportunities for Sentinel-2 and -3. Remote Sens. Environ. 2012, 118, 127–139. [Google Scholar] [CrossRef]
- Delegido, J.; Verrelst, J.; Meza, C.M.; Rivera, J.P.; Alonso, L.; Moreno, J. A red-edge spectral index for remote sensing estimation of green LAI over agroecosystems. Eur. J. Agron. 2013, 46, 42–52. [Google Scholar] [CrossRef]
- D’Odorico, P.; Gonsamo, A.; Damm, A.; Schaepman, M.E. Experimental evaluation of Sentinel-2 spectral response functions for NDVI time-series continuity. IEEE Trans. Geosci. Remote Sens. 2013, 51, 1336–1348. [Google Scholar] [CrossRef]
- Salama, M.S.; Radwan, M.; van der Velde, R. A hydro-optical model for deriving water quality variables from satellite images (HydroSat): A case study of the Nile River demonstrating the future Sentinel-2 capabilities. Phys. Chem. Earth 2012, 50–52, 224–232. [Google Scholar] [CrossRef]
- Hedley, J.; Roelfsema, C.; Koetz, B.; Phinn, S. Capability of the Sentinel 2 mission for tropical coral reef mapping and coral bleaching detection. Remote Sens. Environ. 2012, 120, 145–155. [Google Scholar]
- van der Meer, F.D.; van der Werff, H.M.A.; van Ruitenbeek, F.J.A.; Hecker, C.A.; Bakker, W.H.; Noomen, M.F.; van der Meijde, M.; Carranza, E.J.M.; de Smeth, J.B.; Woldai, T. Multi- and hyperspectral geologic remote sensing: A review. Int. J. Appl. Earth Obs. 2012, 14, 112–128. [Google Scholar] [CrossRef]
- Abrams, M. The advanced spaceborne thermal emission and reflection radiometer (ASTER): Data products for the high spatial resolution imager on NASA’s Terra platform. Int. J. Remote Sens. 2000, 21, 847–859. [Google Scholar] [CrossRef]
- Cooper, B.L.; Salisbury, J.W.; Killen, R.M.; Potter, A.E. Midinfrared spectral features of rocks and their powders. J. Geophys. Res.-Planets 2002, 107, 1–17. [Google Scholar] [CrossRef]
- Salisbury, J.W.; Walter, L.S.; Vergo, N. Availability of a library of infrared (2.1–25.0 μm) mineral spectra. Am. Mineral. 1989, 74, 938–939. [Google Scholar]
- Hunt, G. Spectral signatures of particulate minerals in the visible and near-infrared. Geophysics 1977, 42, 501–513. [Google Scholar] [CrossRef]
- Goetz, A.F.H.; Rowan, L.C. Geologic remote-sensing. Science 1981, 211, 781–791. [Google Scholar] [CrossRef] [PubMed]
- Yamaguchi, Y.; Kahle, A.B.; Tsu, H.; Kawakami, T.; Pniel, M. Overview of advanced spaceborne thermal emission and reflection radiometer (ASTER). IEEE Trans. Geosci. Remote Sens. 1998, 36, 1062–1071. [Google Scholar] [CrossRef]
- Abrams, M.; Hook, S.J. Simulated ASTER data for geologic studies. IEEE Trans. Geosci. Remote Sens. 1995, 33, 692–699. [Google Scholar] [CrossRef]
- Mars, J.C.; Rowan, L.C. Spectral assessment of new ASTER SWIR surface reflectance data products for spectroscopic mapping of rocks and minerals. Remote Sens. Environ. 2010, 114, 2011–2025. [Google Scholar] [CrossRef]
- Cudahy, T.; Hewson, R. ASTER geological case histories: Porphyry-skarn-epithermal, iron oxide Cu-Au and Broken Hill Pb-Zn-Ag. In Procedings of 2002 General Meeting of the Geological Remote Sensing Group: ASTER Unveiled, Burlington House, London, UK, 5–7 December 2002.
- Kruse, F.A.; Perry, S.L. Mineral mapping using simulated Worldview-3 short-wave-infrared imagery. Remote Sens. 2013, 5, 2688–2703. [Google Scholar] [CrossRef]
- Ben-Dor, E.; Irons, J.; Epema, G. Soil reflectance. In Remote Sensing for the Earth Sciences: Manual of Remote Sensing; Rencz, A., Ed.; John Wiley & Sons Inc.: New York, NY, USA, 1999; pp. 111–188. [Google Scholar]
- Bartholomeus, H.; Epema, G.; Schaepman, M. Determining iron content in Mediterranean soils in partly vegetated areas, using spectral reflectance and imaging spectroscopy. Int. J. Appl. Earth Obs. 2007, 9, 192–203. [Google Scholar] [CrossRef]
- Andrews Deller, M. Facies discrimination in laterites using Landsat Thematic Mapper, ASTER and ALI data—Examples from Eritrea and Arabia. Int. J. Remote Sens. 2006, 27, 2389–2409. [Google Scholar] [CrossRef]
- Mielke, C.; Boesche, N.; Rogass, C.; Kaufmann, H.; Gauert, C.; de Wit, M. Spaceborne mine waste mineralogy monitoring in South Africa, applications for modern push-broom missions: Hyperion/OLI and EnMAP/Sentinel-2. Remote Sens. 2014, 6, 6790–6816. [Google Scholar] [CrossRef]
- van der Meer, F.D. Analysis of spectral absorption features in hyperspectral imagery. Int. J. Appl. Earth Sci. 2004, 5, 55–68. [Google Scholar] [CrossRef]
- van Ruitenbeek, F.; Bakker, W.; van der Werff, H.; Zegers, T.; Oosthoek, J.; Omer, Z.; Marsh, S.; van der Meer, F. Mapping the wavelength position of deepest absorption features to explore mineral diversity in hyperspectral images. Planet. Space Sci. 2014, 101, 108–117. [Google Scholar] [CrossRef]
- Rodger, A.; Laukamp, C.; Haest, M.; Cudahy, T. A simple quadratic method of absorption feature wavelength estimation in continuum removed spectra. Remote Sen. Environ. 2012, 118, 273–283. [Google Scholar] [CrossRef]
- Clark, R.; Swayze, G.; Wise, R.; Livo, E.; Hoefen, T.; Kokaly, R.; Sutley, S. USGS Digital Spectral Library Splib06a; Digital Data Series 231; U.S. Geological Survey, 2007. Available online: http://speclab.cr.usgs.gov/spectral.lib06/ (accessed on 22 September 2015).
- Schlapfer, D.; Richter, R. Geo-atmospheric processing of airborne imaging spectrometry data. Part 1: Parametric orthorectification. Int. J. Remote Sens. 2002, 23, 2609–2630. [Google Scholar] [CrossRef]
- Richter, R.; Schlapfer, D. Geo-atmospheric processing of airborne imaging spectrometry data. Part 2: Atmospheric/topographic correction. Int. J. Remote Sens. 2002, 23, 2631–2649. [Google Scholar] [CrossRef]
- Xu, Y.; Lin, Q.; Shao, Y.; Wang, L. Extraction mechanism of Alteration Zones using ASTER imagery. In Proceedings of International Geoscience and Remote Sensing Symposium (IGARSS), Anchorage, AK, USA, 20–24 September 2004.
- Rytuba, J.J.; Arribas, A.; Cunningham, C.G.; McKee, E.H.; Podwysocki, M.H.; Smith, J.G.; Kelly, W.C. Mineralized and unmineralized calderas in Spain. Part II, evolution of the Rodalquilar caldera complex and associated gold-alunite deposits. Miner. Deposita 1990, 25, S29–S35. [Google Scholar] [CrossRef]
- Arribas, A.; Cunningham, C.; Rytuba, J.; Rye, R.; Kelly, W.; Podwysocki, M.; McKee, E.; Tosdal, R. Geology, geochronology, fluid inclusions, and isotope geochemistry of the Rodalquilar gold alunite deposit, Spain. Econ. Geol. Bull. Soc. Econ. Geol. 1995, 90, 795–822. [Google Scholar] [CrossRef]
- Bedini, E.; van der Meer, F.; van Ruitenbeek, F. Use of HyMap imaging spectrometer data to map mineralogy in the Rodalquilar caldera, southeast Spain. Int. J. Remote Sens. 2009, 30, 327–348. [Google Scholar] [CrossRef]
- Debba, P.; Carranza, E.J.M.; Stein, A.; van der Meer, F.D. Deriving optimal exploration target zones on mineral prospectivity maps. Math. Geosci. 2009, 41, 421–446. [Google Scholar] [CrossRef]
- van der Werff, H.; van Ruitenbeek, F.; van der Meijde, M.; van der Meer, F.; de Jong, S.; Kalubandara, S. Rotation-variant template matching for supervised hyperspectral boundary detection. IEEE Geosci. Remote Sens. Lett. 2007, 4, 70–74. [Google Scholar] [CrossRef]
- Van der Meer, F. Indicator kriging applied to absorption band analysis in hyperspectral imagery: A case study from the Rodalquilar epithermal gold mining area, SE Spain. Int. J. Appl. Earth Obs. 2006, 8, 61–72. [Google Scholar] [CrossRef]
- Nagler, P.; Inoue, Y.; Glenn, E.; Russ, A.; Daughtry, C. Cellulose absorption index (CAI) to quantify mixed soil-plant litter scenes. Remote Sens. Environ. 2003, 87, 310–325. [Google Scholar] [CrossRef]
© 2015 by the authors; licensee MDPI, Basel, Switzerland. This article is an open access article distributed under the terms and conditions of the Creative Commons Attribution license (http://creativecommons.org/licenses/by/4.0/).
Share and Cite
Van der Werff, H.; Van der Meer, F. Sentinel-2 for Mapping Iron Absorption Feature Parameters. Remote Sens. 2015, 7, 12635-12653. https://doi.org/10.3390/rs71012635
Van der Werff H, Van der Meer F. Sentinel-2 for Mapping Iron Absorption Feature Parameters. Remote Sensing. 2015; 7(10):12635-12653. https://doi.org/10.3390/rs71012635
Chicago/Turabian StyleVan der Werff, Harald, and Freek Van der Meer. 2015. "Sentinel-2 for Mapping Iron Absorption Feature Parameters" Remote Sensing 7, no. 10: 12635-12653. https://doi.org/10.3390/rs71012635
APA StyleVan der Werff, H., & Van der Meer, F. (2015). Sentinel-2 for Mapping Iron Absorption Feature Parameters. Remote Sensing, 7(10), 12635-12653. https://doi.org/10.3390/rs71012635