
Diverse Responses of Remotely Sensed Grassland Phenology to Interannual Climate Variability over Frozen Ground Regions in Mongolia


Abstract
:
1. Introduction
2. Materials and Methods
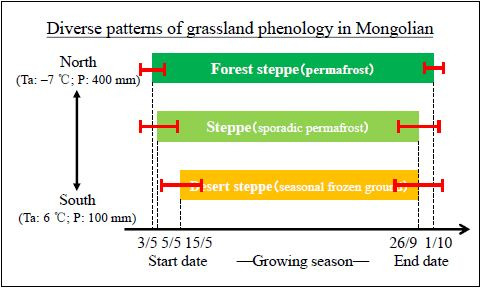
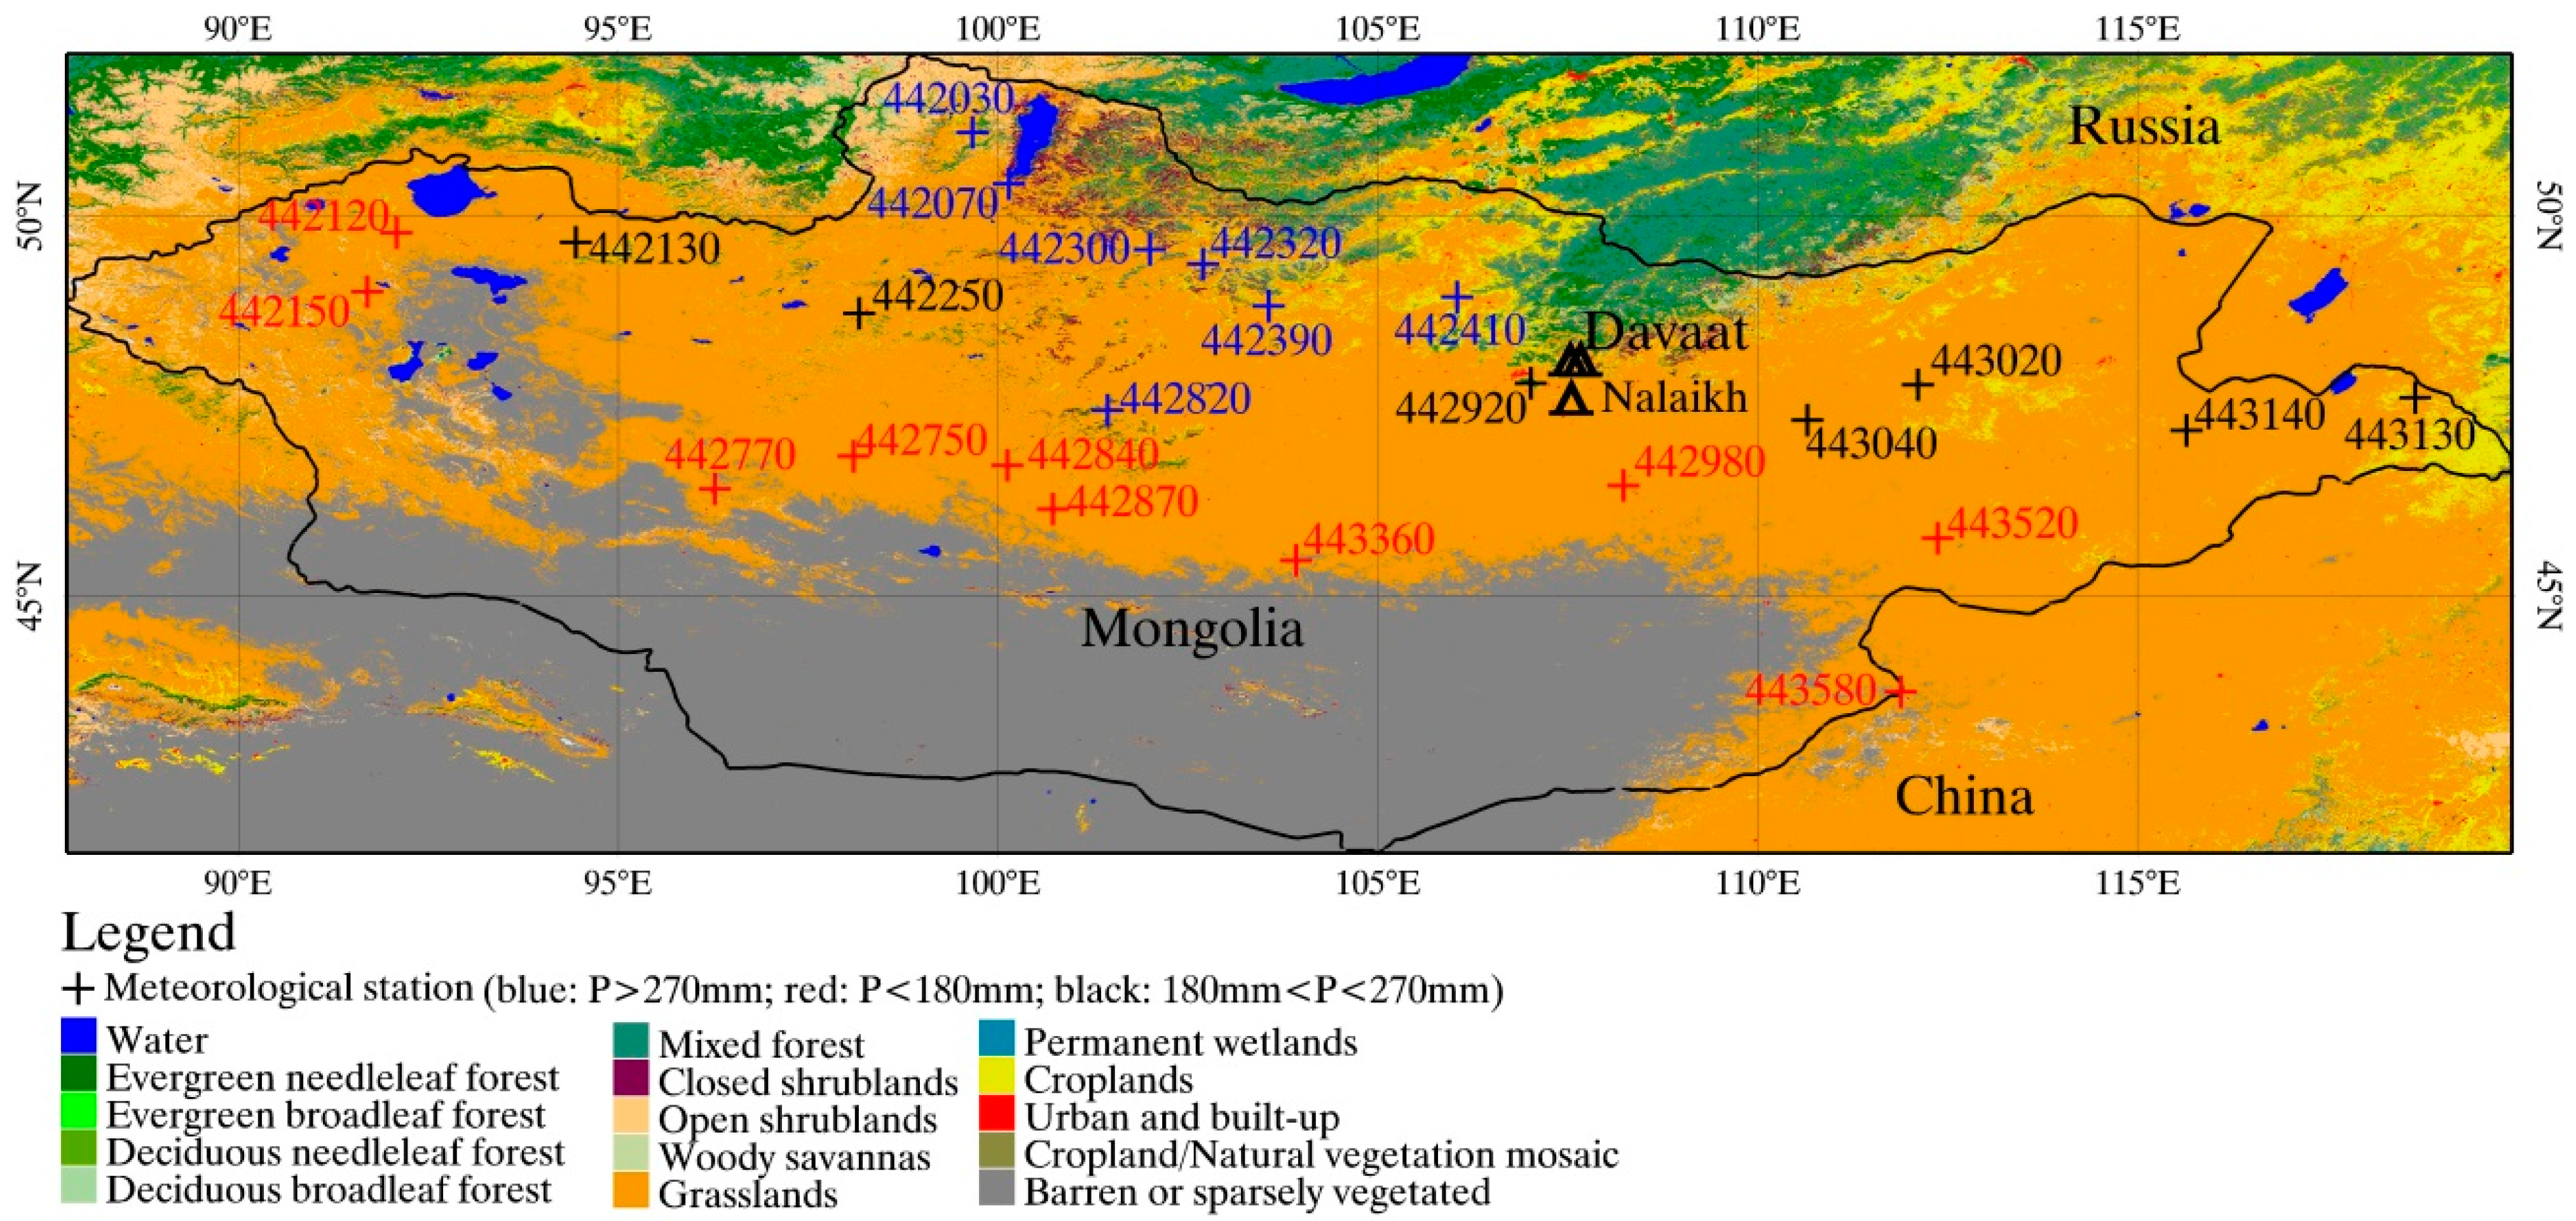
2.1. Study Area and Sites Used

| Grassland/Frozen Ground Type | Station ID | Station Name | Lat. (°) | Lon. (°) | Ele. (m) | ANN-Ta (°C) | ANN-P (mm/year) |
|---|---|---|---|---|---|---|---|
| FS/2P | 442030 | Rinchinlhumbe | 51.117 | 99.667 | 1583 | −6.2 ± 0.8 | 273.8 ± 62.1 |
| FS/2P | 442070 | Hatgal | 50.433 | 100.150 | 1668 | −3.6 ± 0.8 | 281.1 ± 80.3 |
| FS/1P | 442300 | Tarialan | 49.567 | 102.000 | 1235 | 0.5 ± 0.7 | 306.6 ± 65.7 |
| FS/1P | 442320 | Hutag | 49.383 | 102.700 | 938 | 0.3 ± 0.9 | 295.7 ± 54.8 |
| FS/1P | 442390 | Bulgan | 48.800 | 103.550 | 1208 | −0.1 ± 0.7 | 270.1 ± 43.8 |
| FS/1P | 442410 | Baruunharaa | 48.917 | 106.067 | 807 | 0.4 ± 0.9 | 284.7 ± 91.3 |
| FS/0P | 442820 | Tsetserleg | 47.450 | 101.467 | 1691 | 1.7 ± 0.7 | 310.3 ± 54.8 |
| ST/2P | 442130 | Baruunturuun | 49.650 | 94.400 | 1232 | −2.3 ± 1.0 | 211.7 ± 25.6 |
| ST/2P | 442250 | Tosontsengel | 48.733 | 98.200 | 1723 | −5.0 ± 0.9 | 222.7 ± 84.0 |
| ST/1P | 442920 | Ulaanbaatar | 47.917 | 106.867 | 1306 | −0.7 ± 0.7 | 251.9 ± 62.1 |
| ST/1P | 443020 | Bayan-ovoo | 47.783 | 112.117 | 926 | 0.9 ± 0.9 | 200.8 ± 40.2 |
| ST/1P | 443040 | Underkhaan | 47.317 | 110.633 | 1033 | 0.4 ± 0.9 | 219.0 ± 62.1 |
| ST/1P | 443130 | Khalkh-gol | 47.617 | 118.617 | 688 | 0.4 ± 0.8 | 270.1 ± 47.5 |
| ST/0P | 443140 | Matad | 47.167 | 115.633 | 907 | 2.1 ± 0.8 | 193.5 ± 76.7 |
| DS/2P | 442120 | Ulaangom | 49.800 | 92.083 | 939 | −1.9 ± 1.0 | 135.1 ± 40.1 |
| DS/2P | 442750 | Bayanbulag | 46.833 | 98.083 | 2255 | −3.1 ± 0.9 | 127.8 ± 58.4 |
| DS/2P | 442840 | Galuut | 46.700 | 100.133 | 2126 | −3.3 ± 1.1 | 142.4 ± 32.9 |
| DS/1P | 442150 | Omno-gobi | 49.017 | 91.717 | 1590 | −0.3 ± 1.1 | 131.4 ± 51.1 |
| DS/1P | 442770 | Altai | 46.400 | 96.250 | 2181 | −0.4 ± 0.8 | 157.0 ± 51.1 |
| DS/1P | 442870 | Bayanhongor | 46.133 | 100.683 | 1859 | 0.9 ± 0.7 | 175.2 ± 73.0 |
| DS/0P | 442980 | Choir | 46.450 | 108.217 | 1286 | 1.9 ± 0.8 | 153.3 ± 87.6 |
| DS/0P | 443360 | Saikhan-ovoo | 45.450 | 103.900 | 1316 | 3.3 ± 0.8 | 113.2 ± 51.1 |
| DS/0P | 443520 | Bayandelger | 45.733 | 112.367 | 1101 | 3.0 ± 0.8 | 160.6 ± 69.4 |
| DS/0P | 443580 | Zamyn-uud | 43.733 | 111.900 | 964 | 5.1 ± 0.7 | 135.1 ± 29.2 |

2.2. Data Used
2.3. Analytical Methods
3. Results
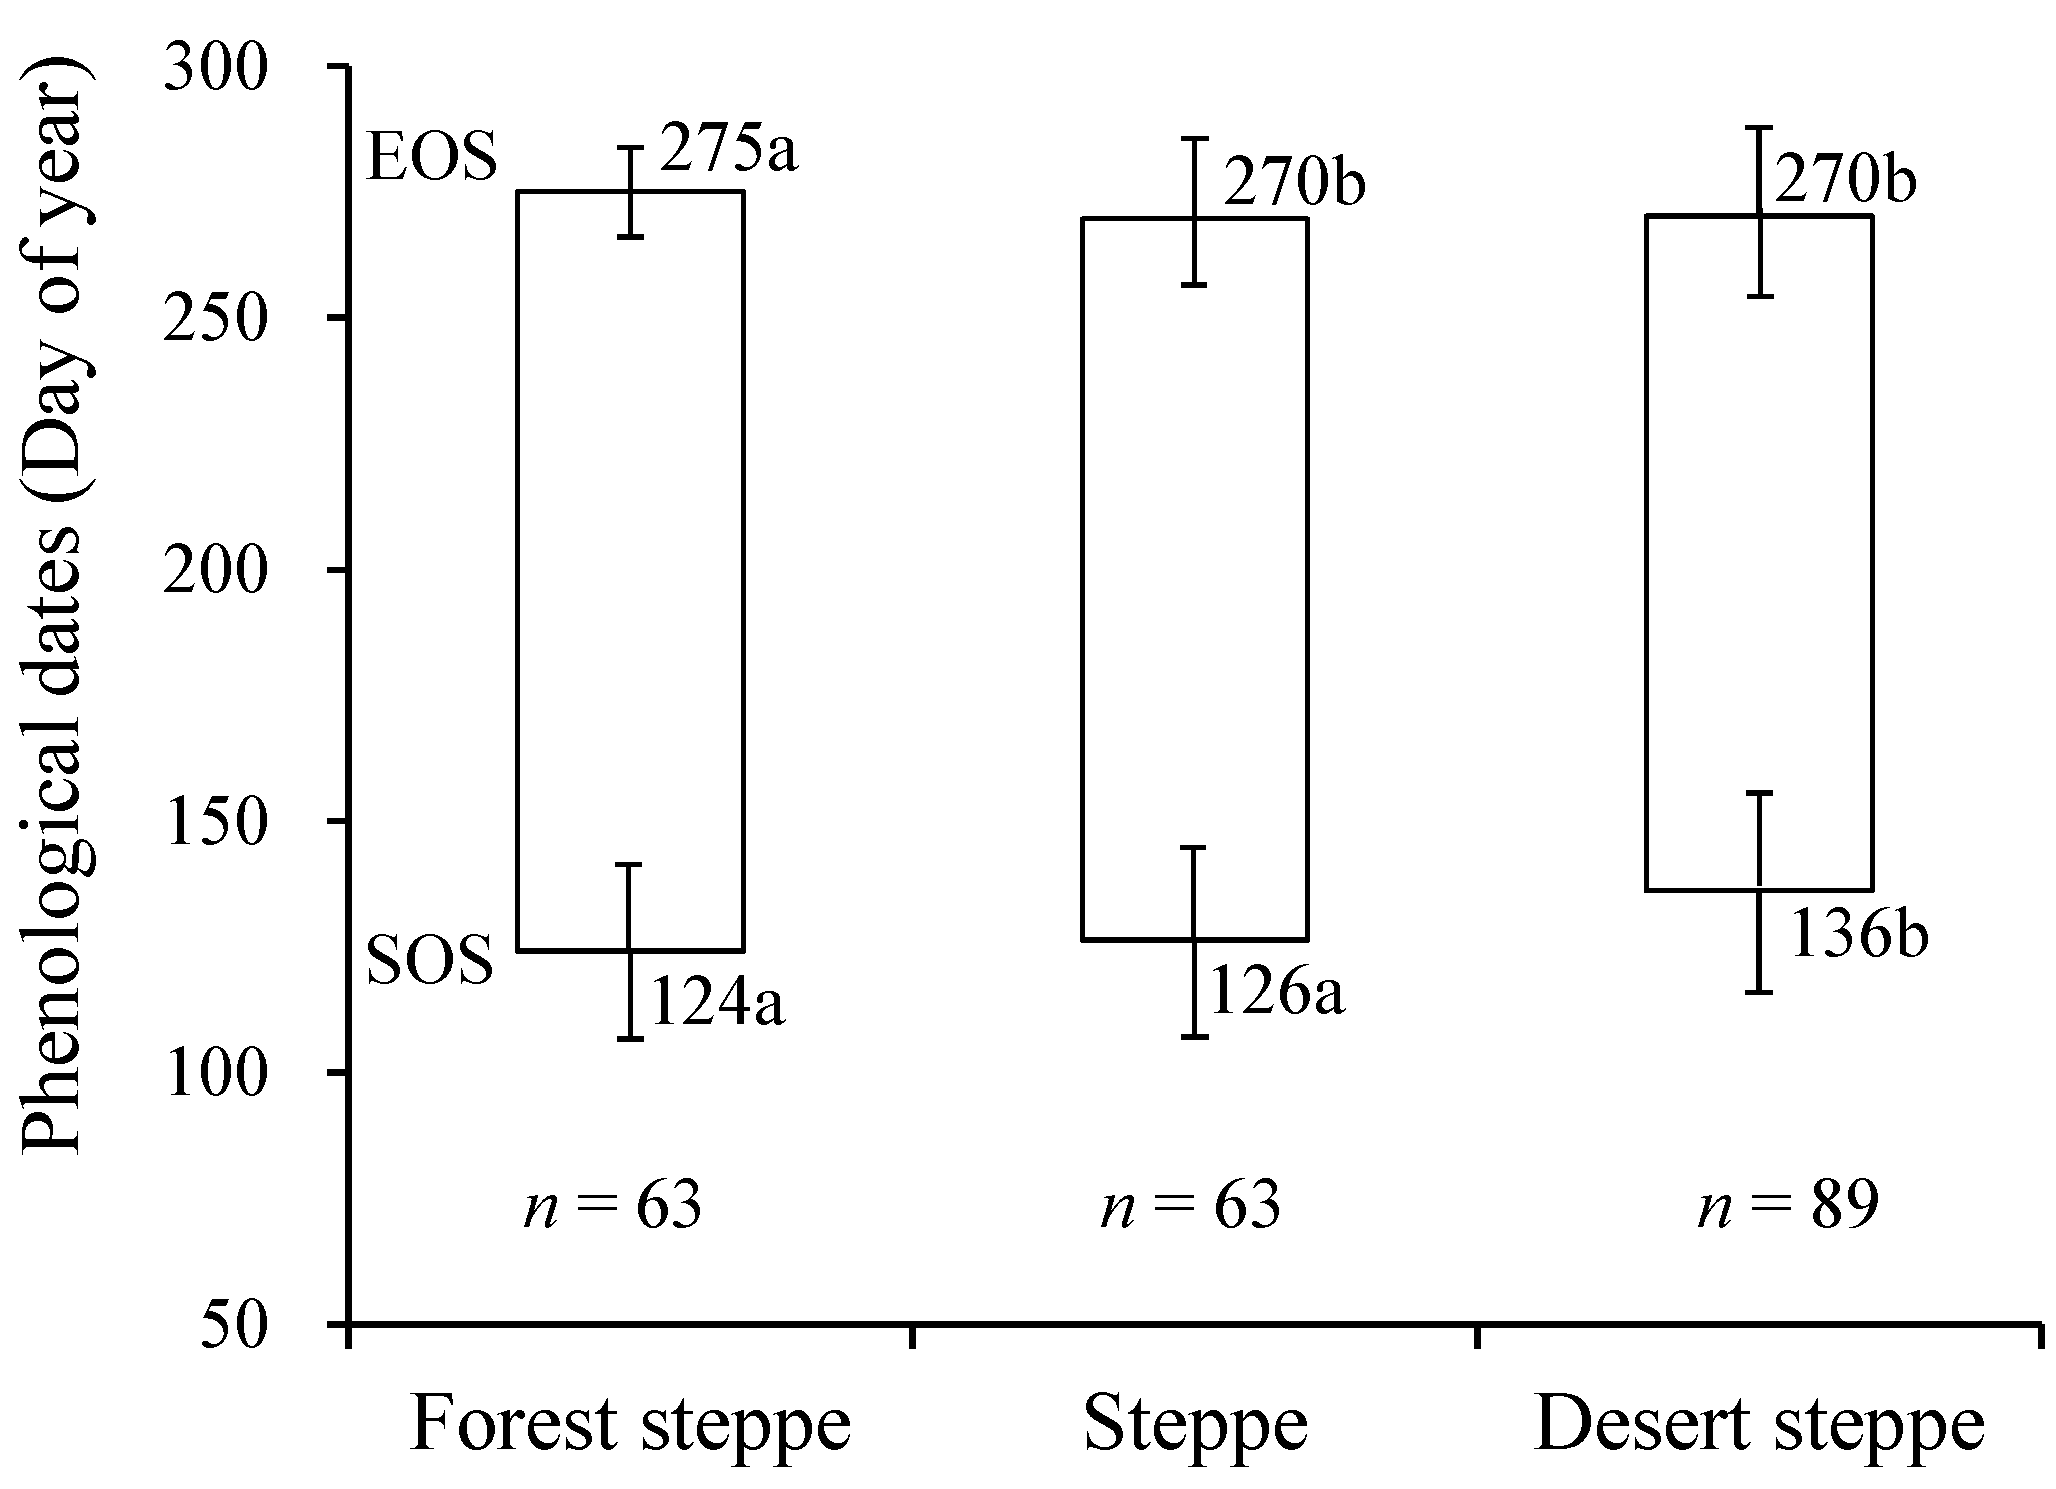
3.1. MODIS SOS and EOS of Grasslands with a Dry and Cold Climate across Mongolia

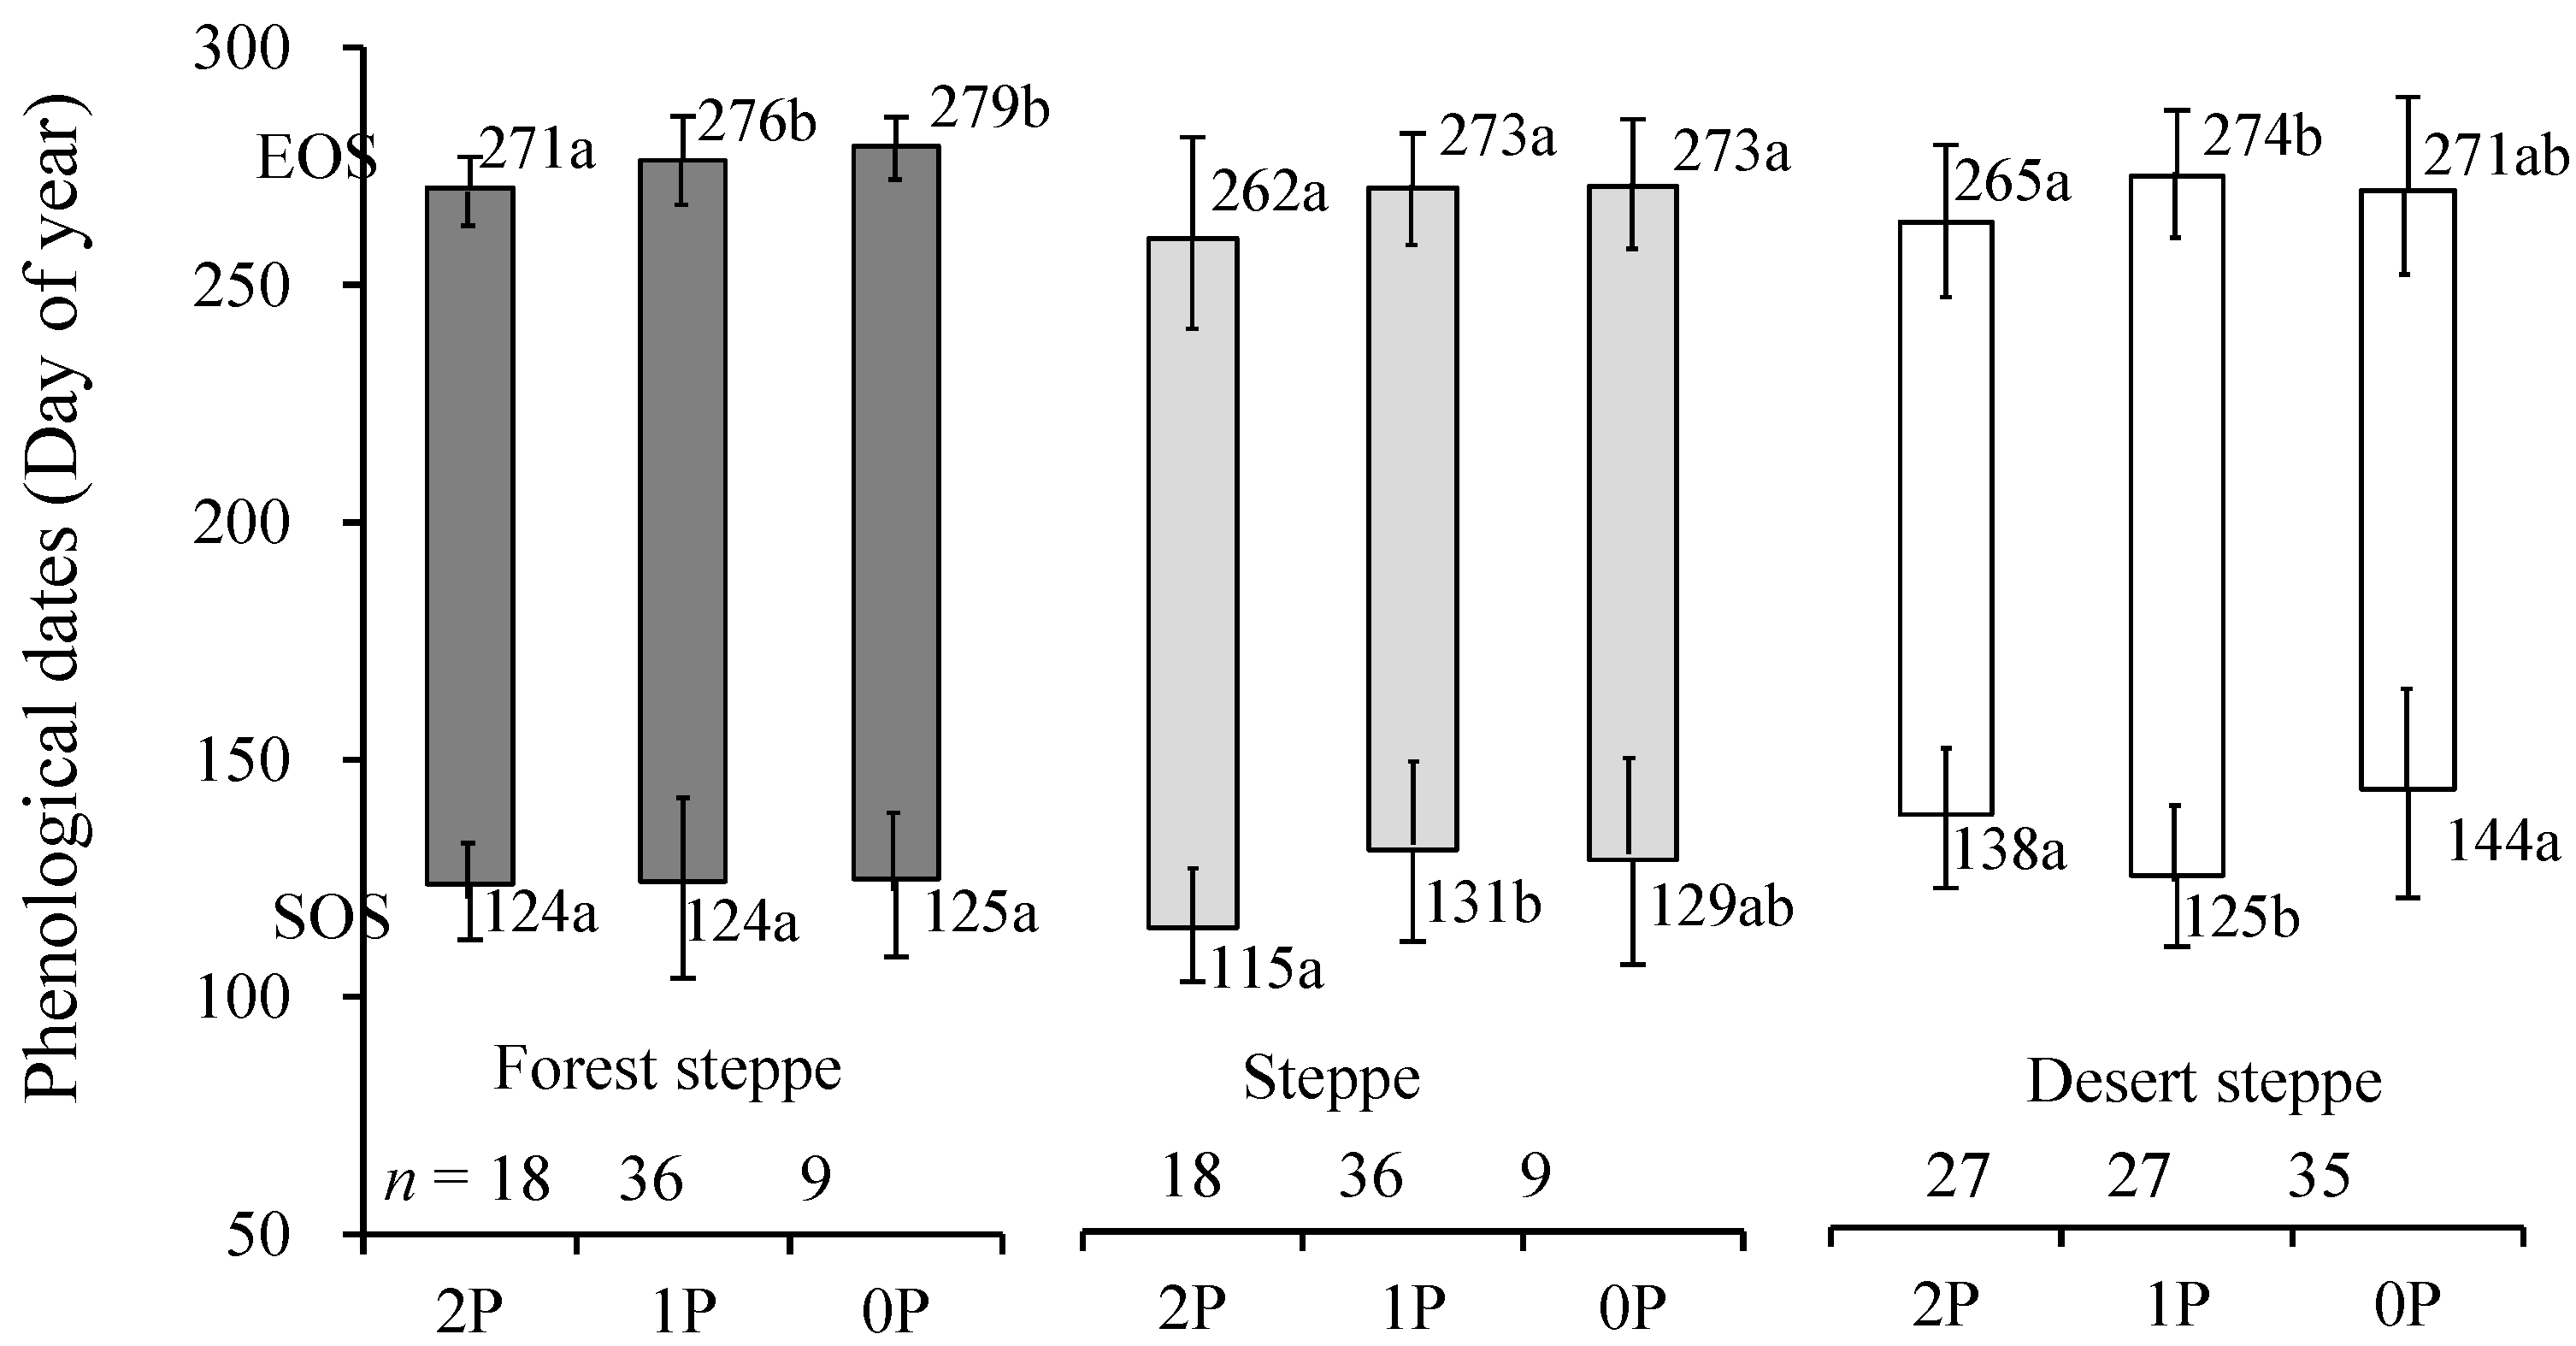
3.1.1. SOS of Grasslands over Various Frozen Ground Regions

3.1.2. EOS of Grasslands over Various Frozen Ground Regions
3.2. Driving Factors of Interannual Changes in SOS and EOS in Mongolia
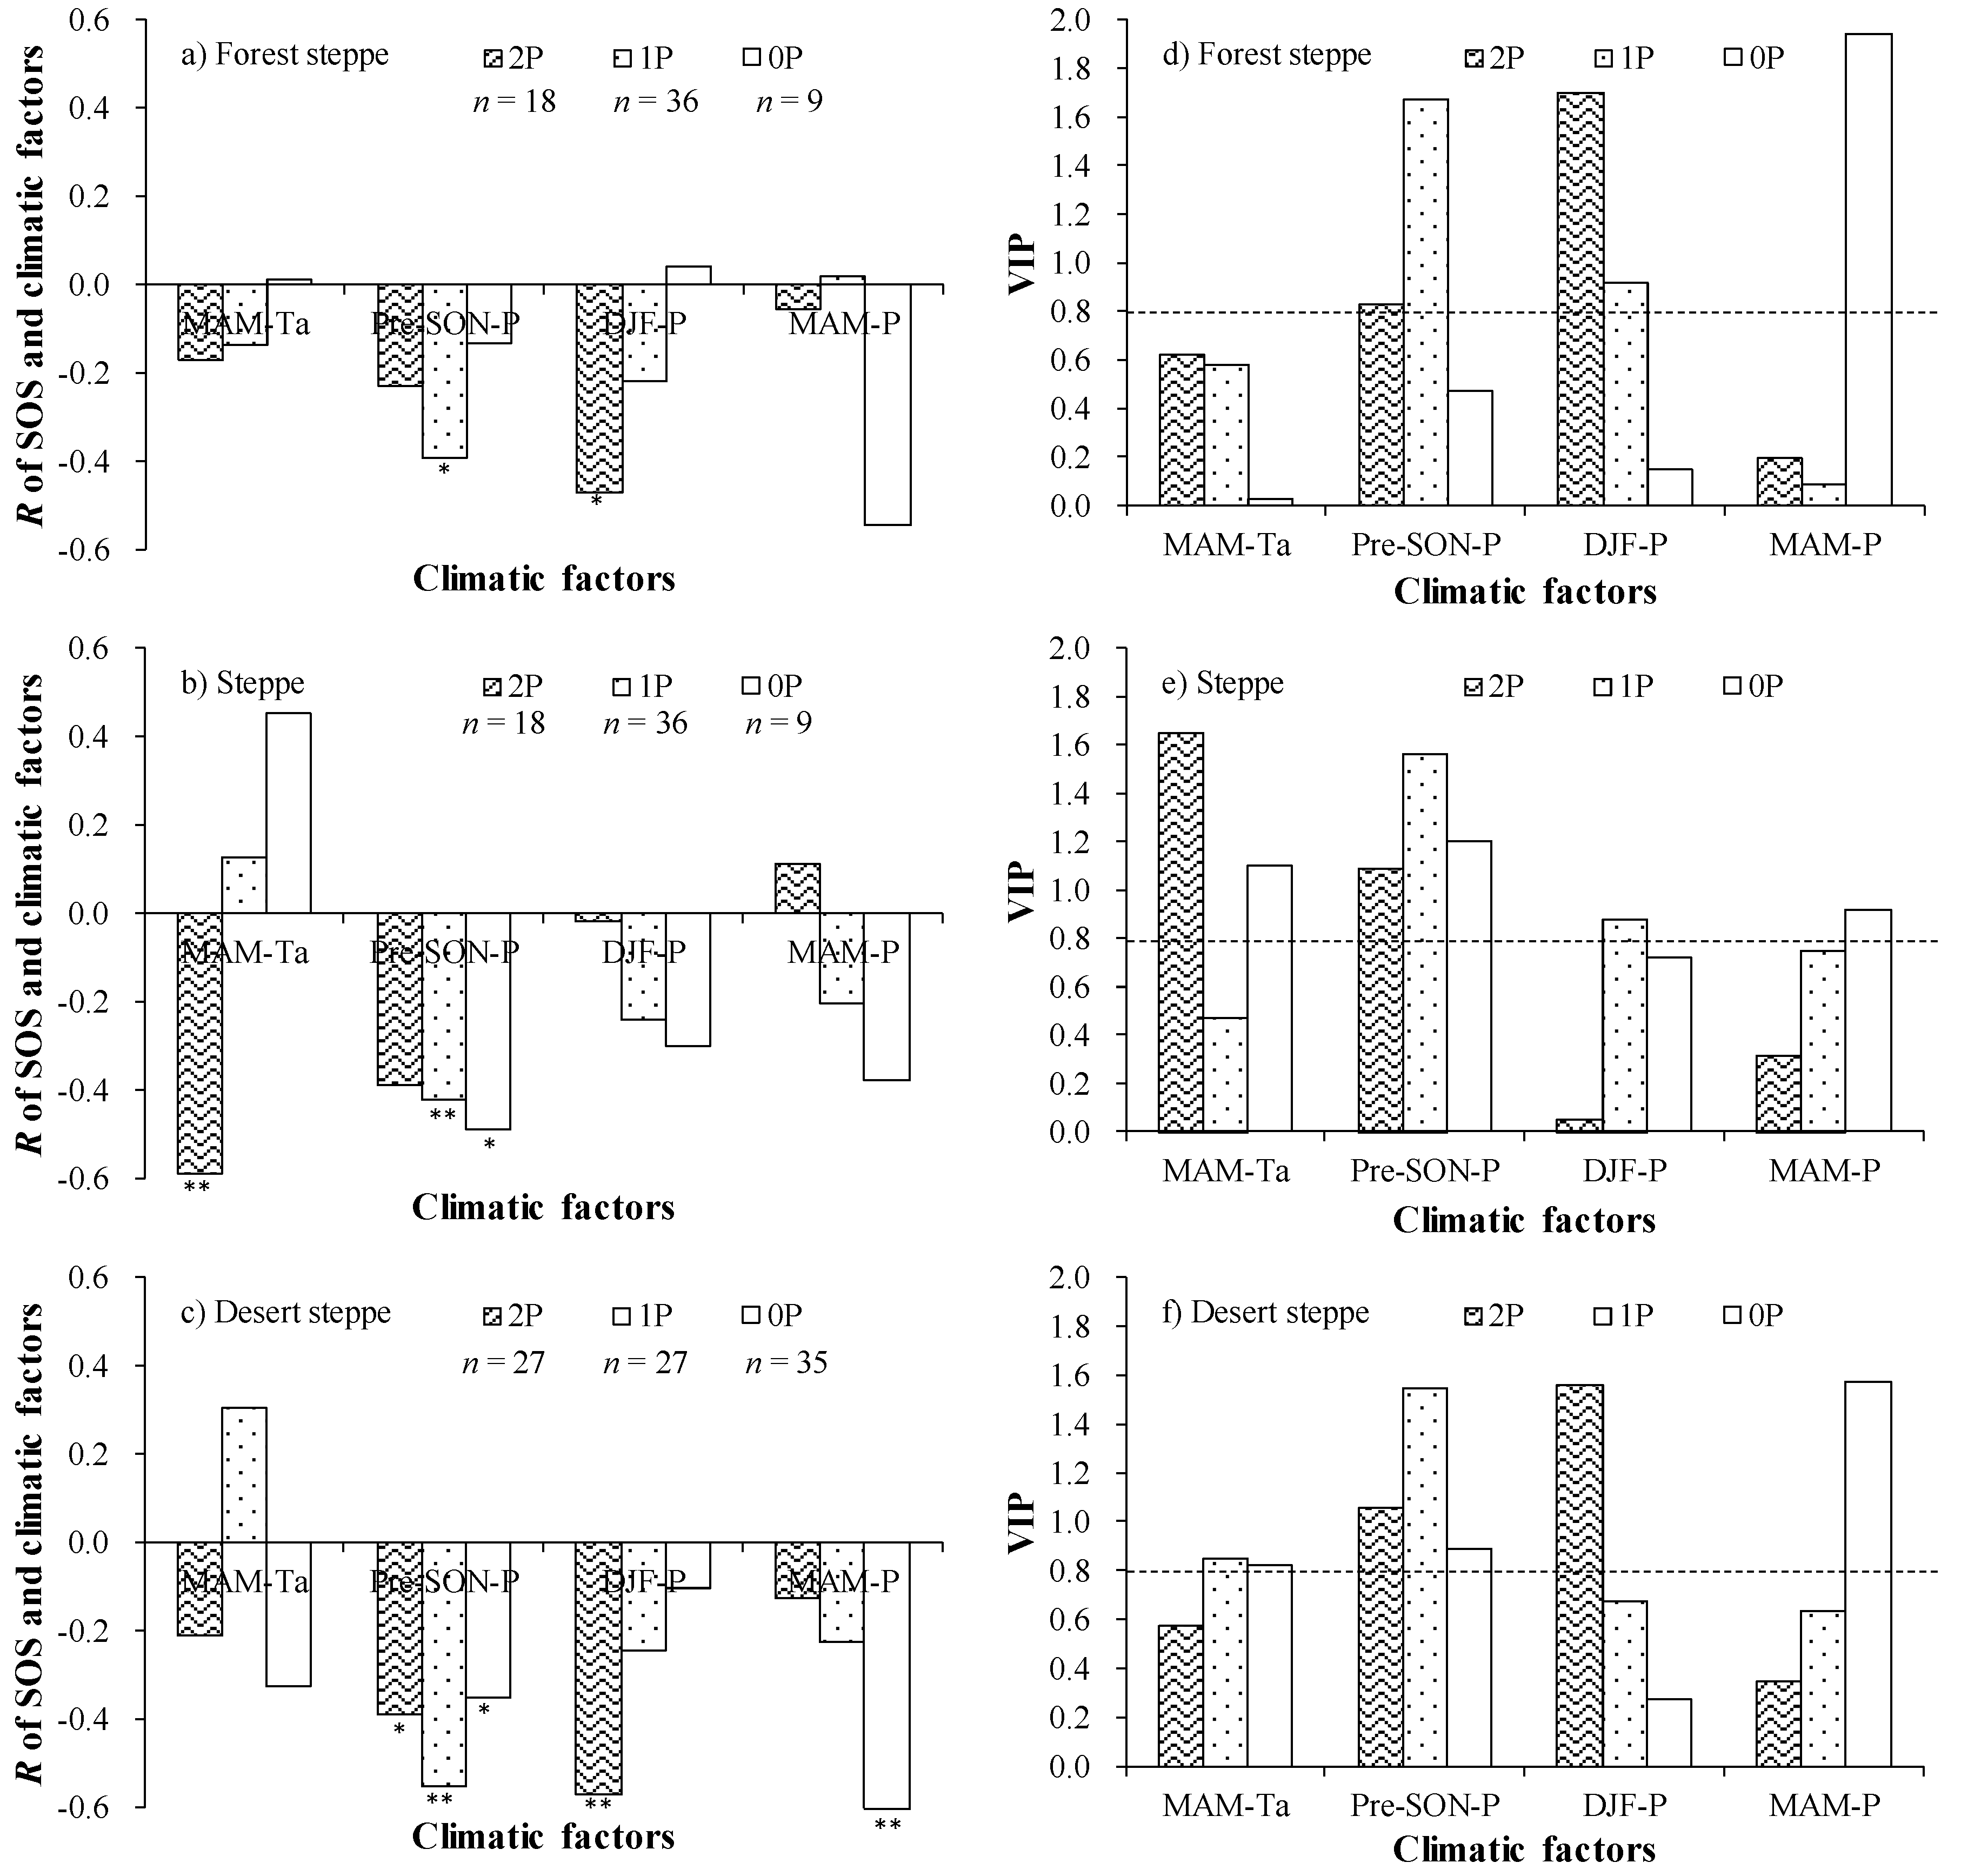
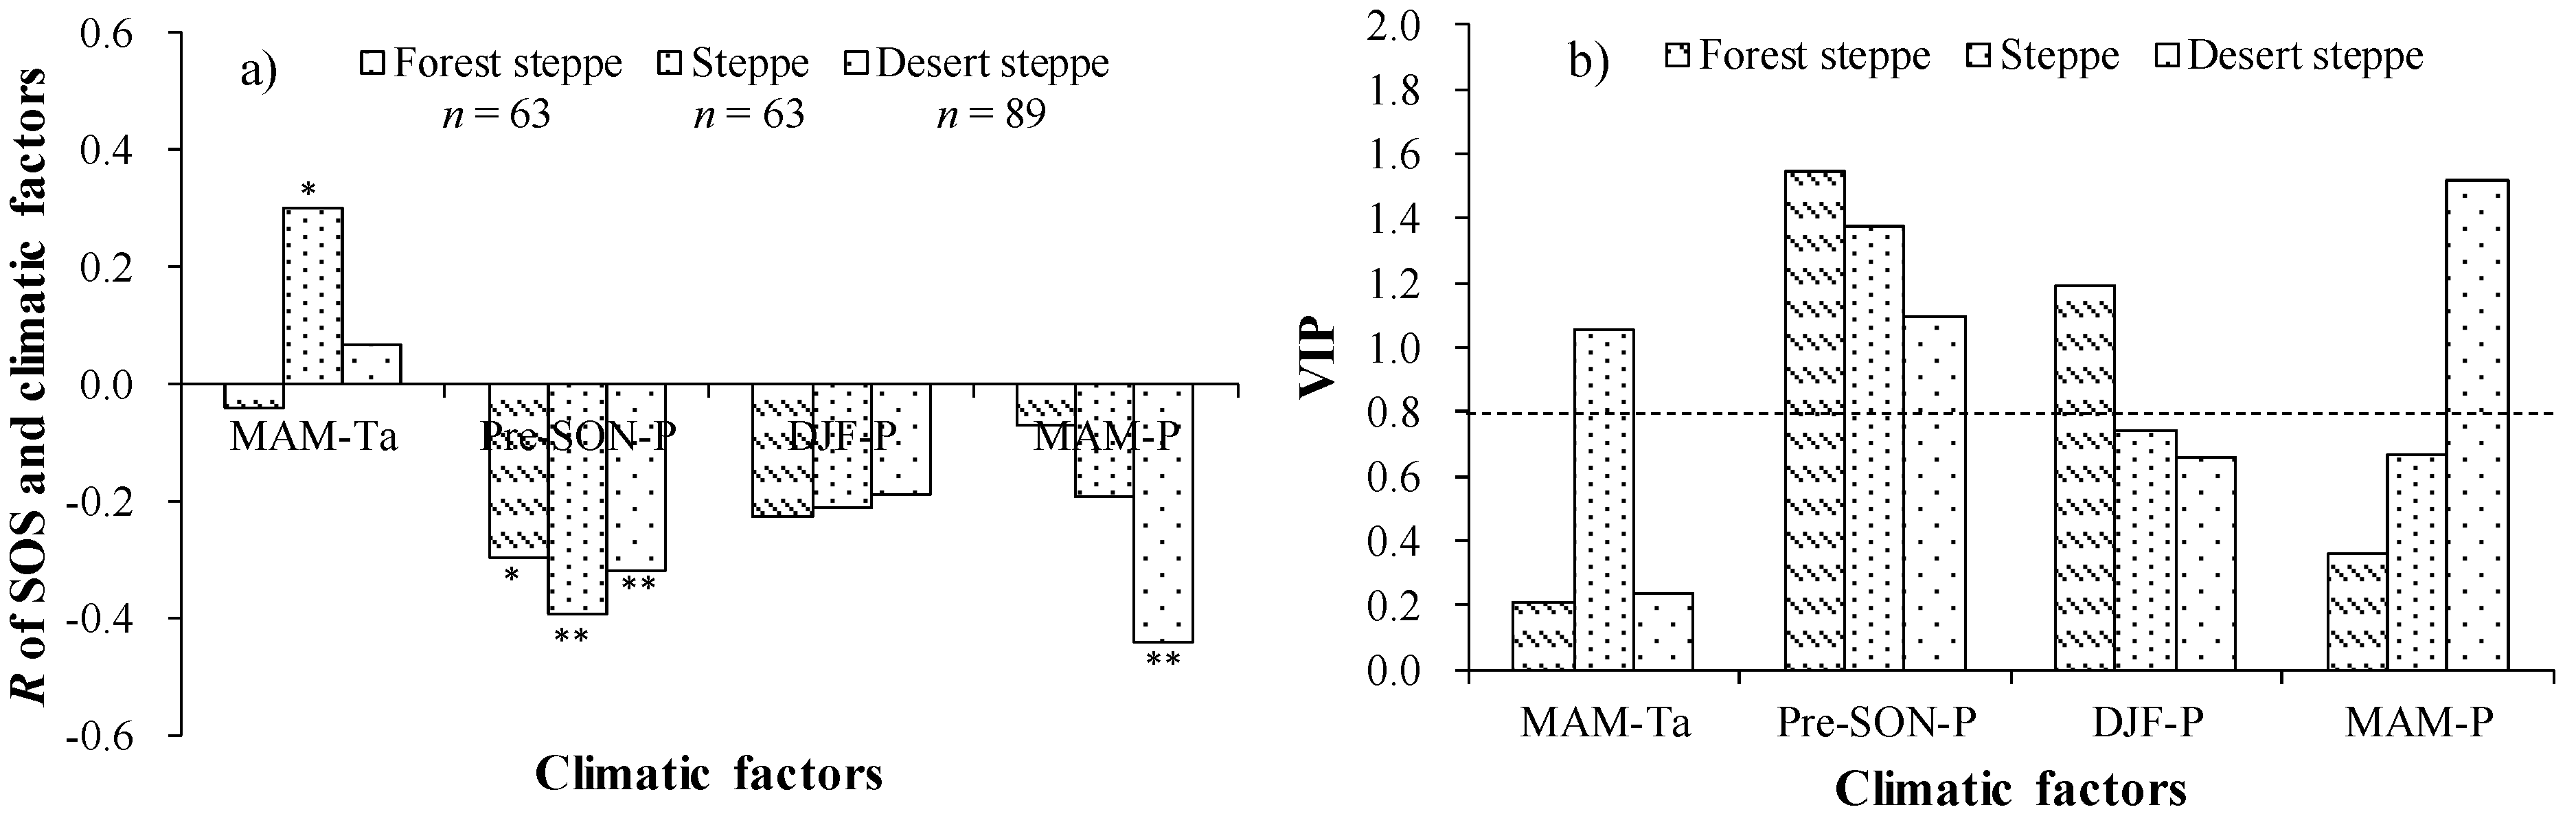
3.2.1. Driving Factors of Interannual Changes in SOS

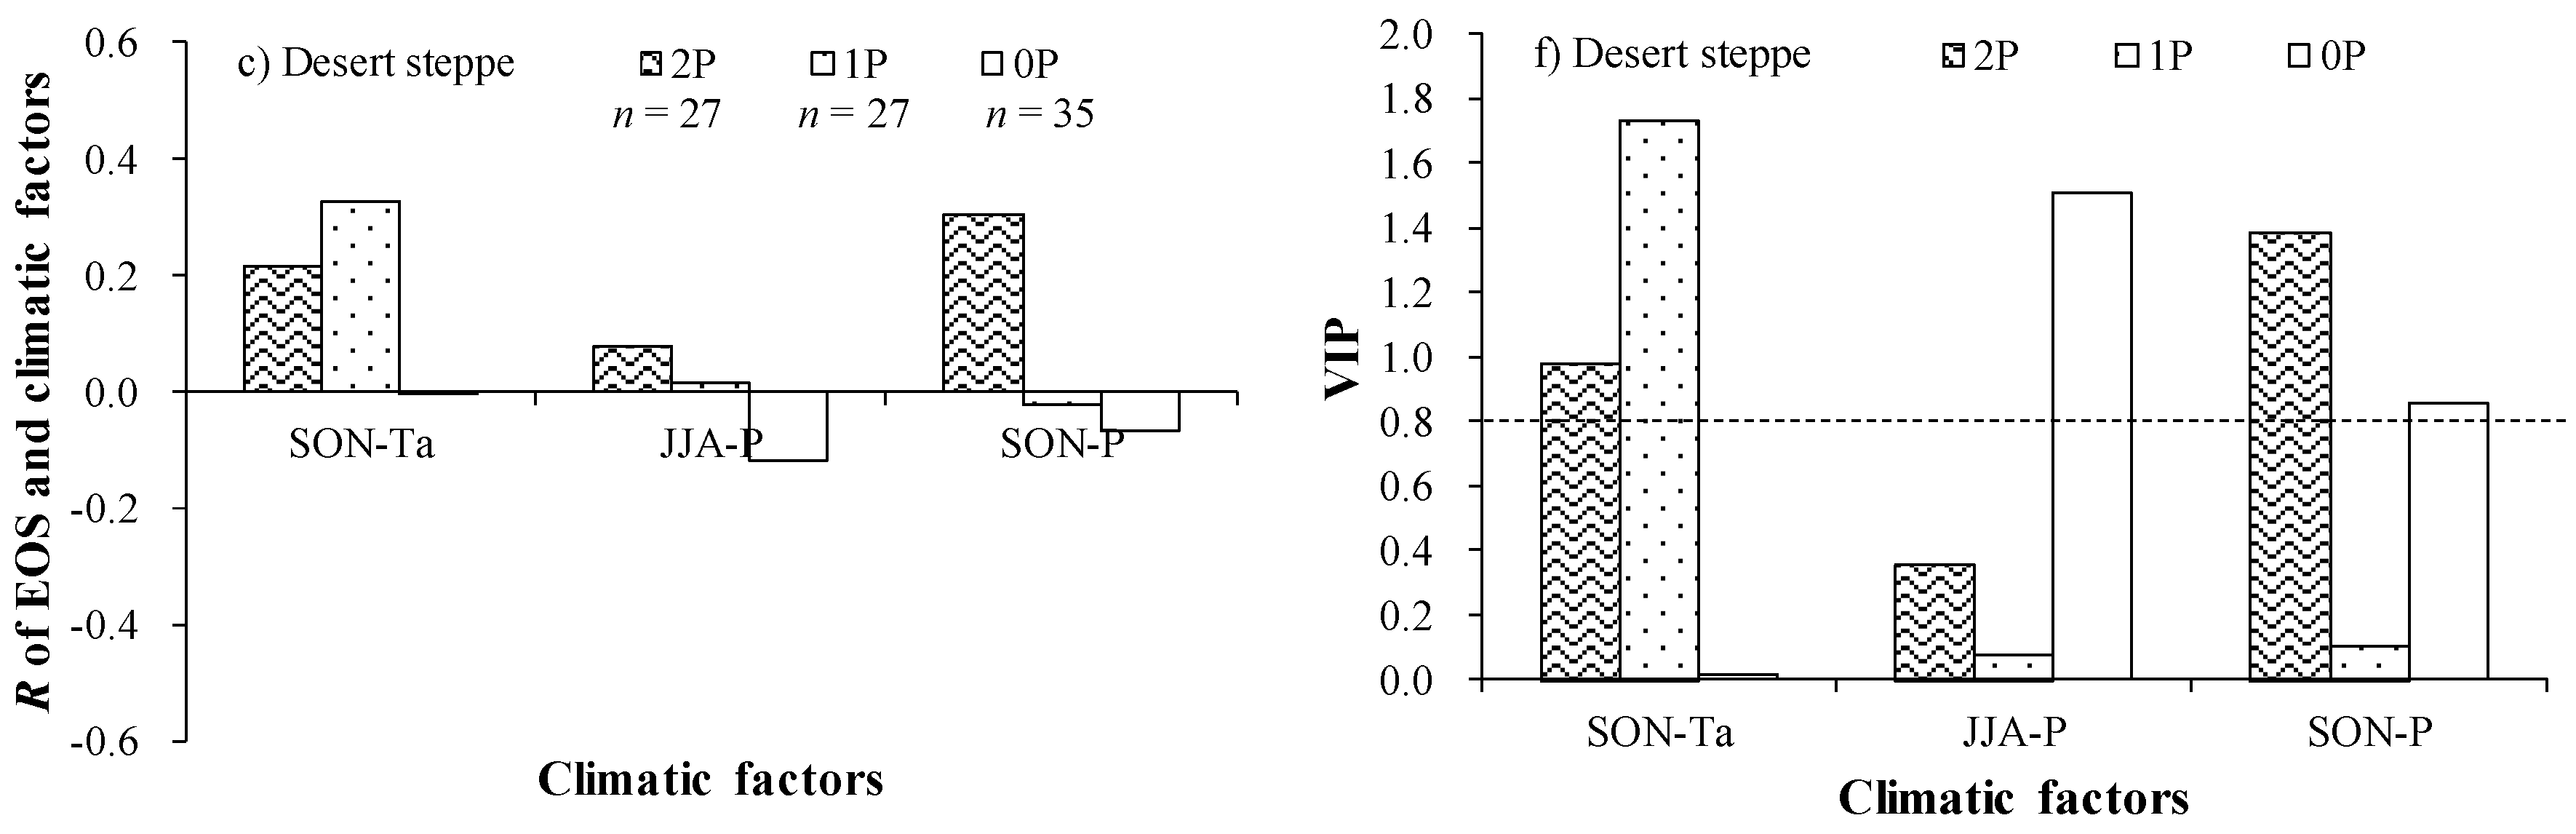
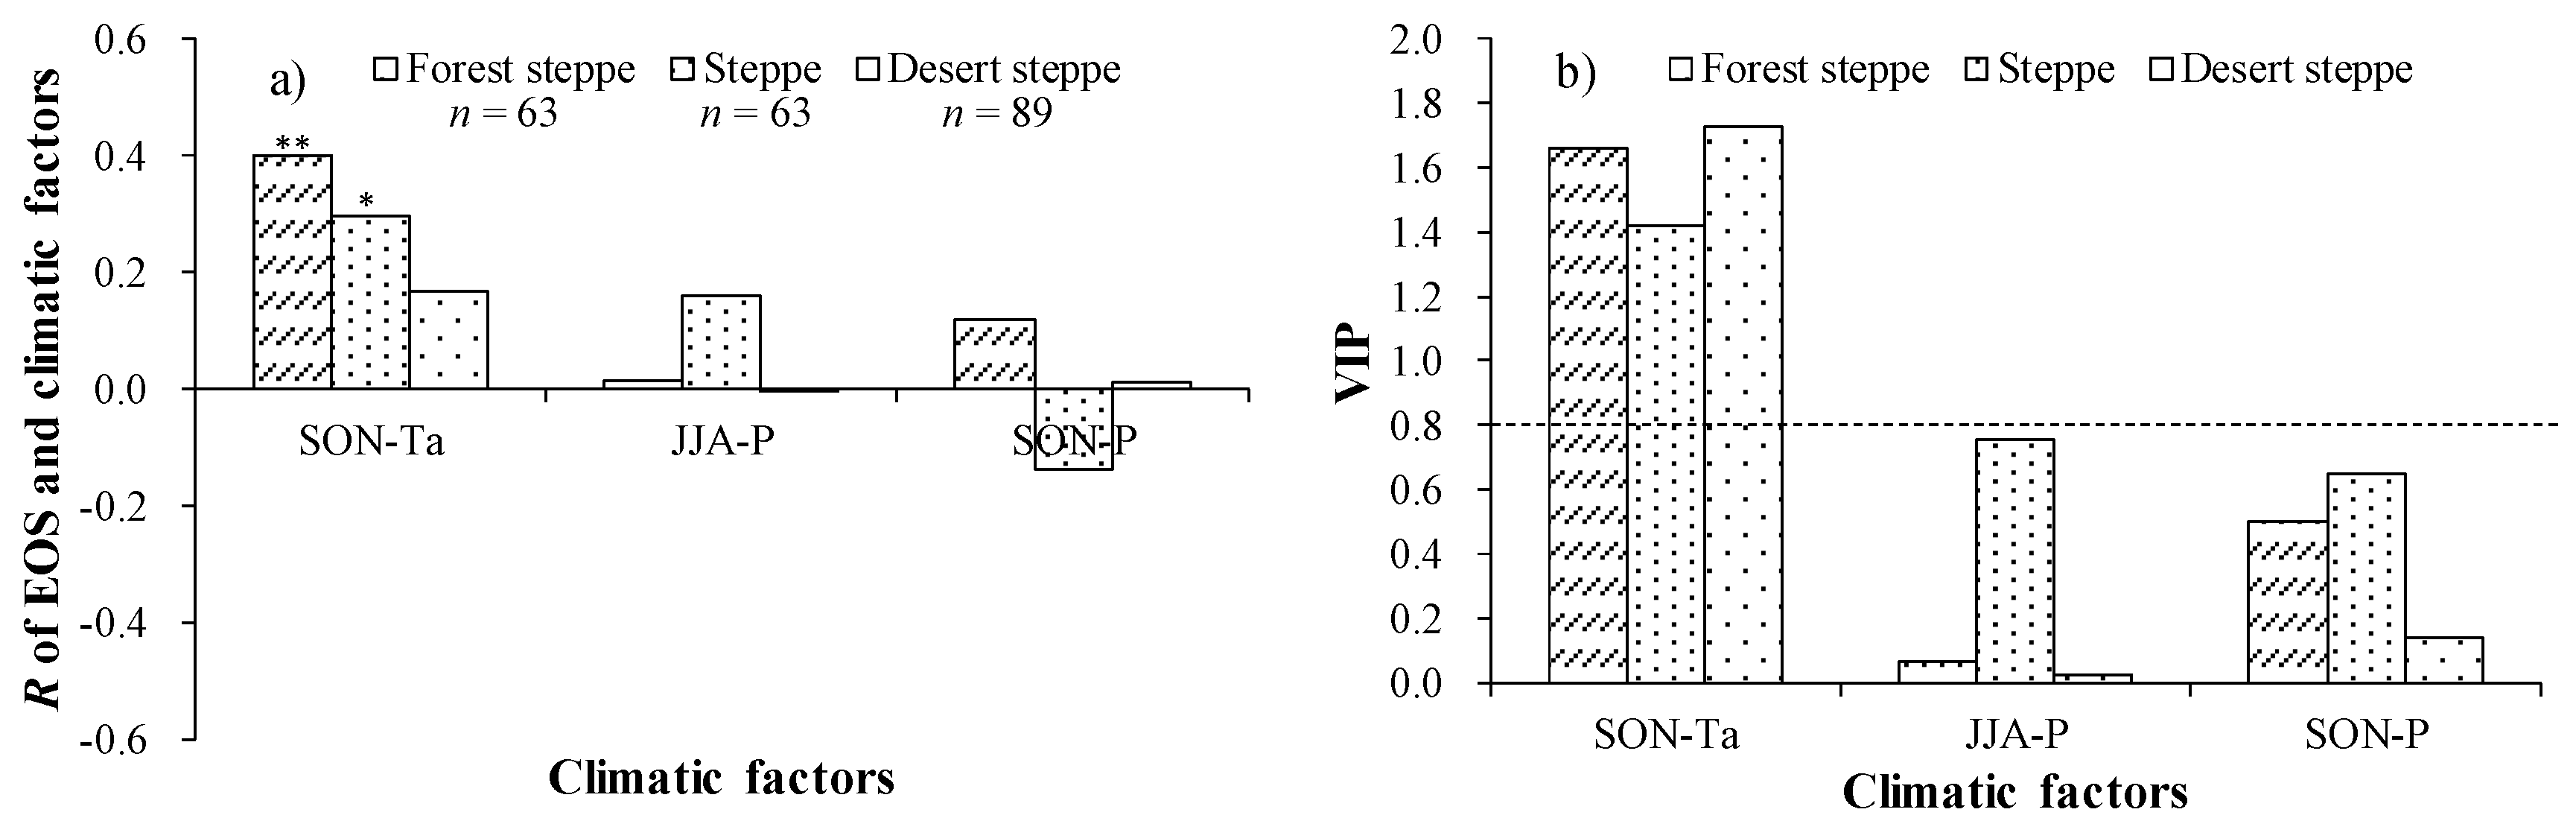
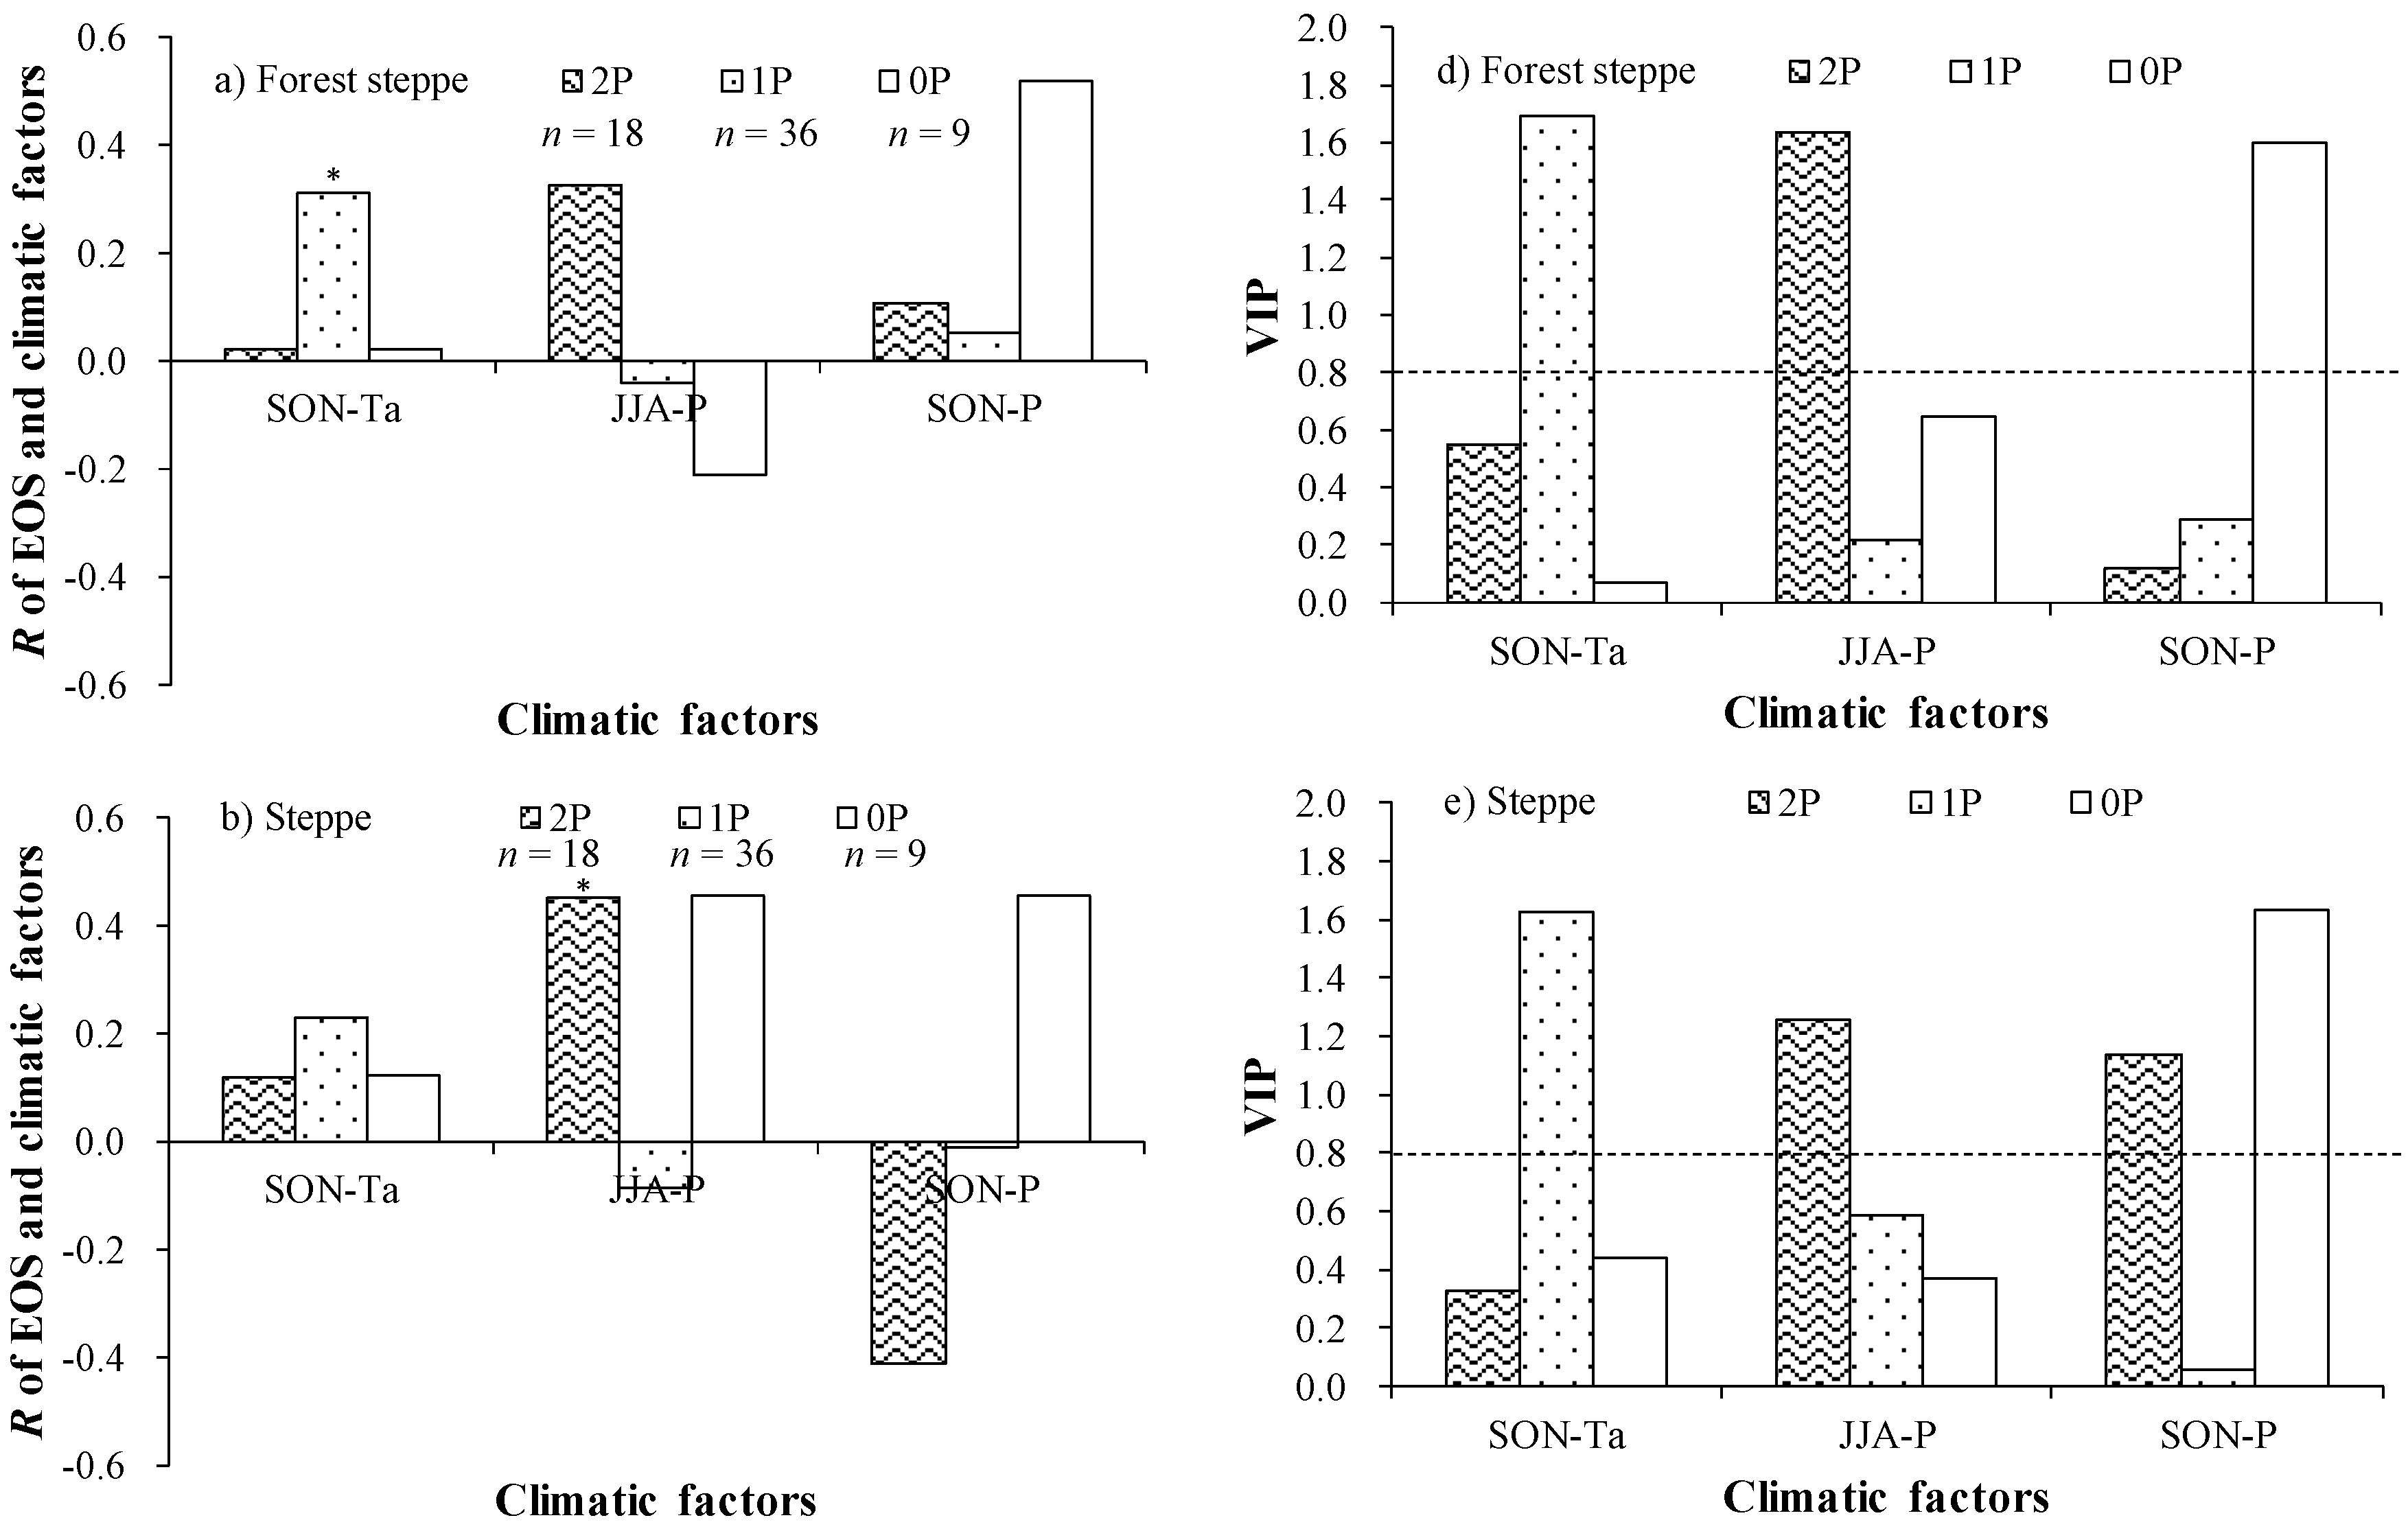
3.2.2. Driving Factors of Interannual Changes in EOS

4. Discussions
4.1. Uncertainties in the MODIS Phenology Product for Grasslands and in the Use of Seasonal Means of Climatic Factors
4.2. Dominant Climatic Factor Affecting SOS and EOS of Dry and Cold Grasslands

4.3. The Role of Frozen Ground in Regulating SOS
4.4. Perspectives on Grassland Ecosystem, Permafrost Degradation, and Climate Change in Mongolia
| Site | Nalaikh Steppe Site | Davaat Steppe Site | Davaat Forest Steppe Site | |||
|---|---|---|---|---|---|---|
| ANN-Ta (°C) | −2.8 | −4.2 | −5.2 | |||
| ANN-P (mm/year) | 260 | 270 | 276 | |||
| ALD (m) | 3.5 | 2.5 | 2.0 | |||
| Year | SOS | EOS | SOS | EOS | SOS | EOS |
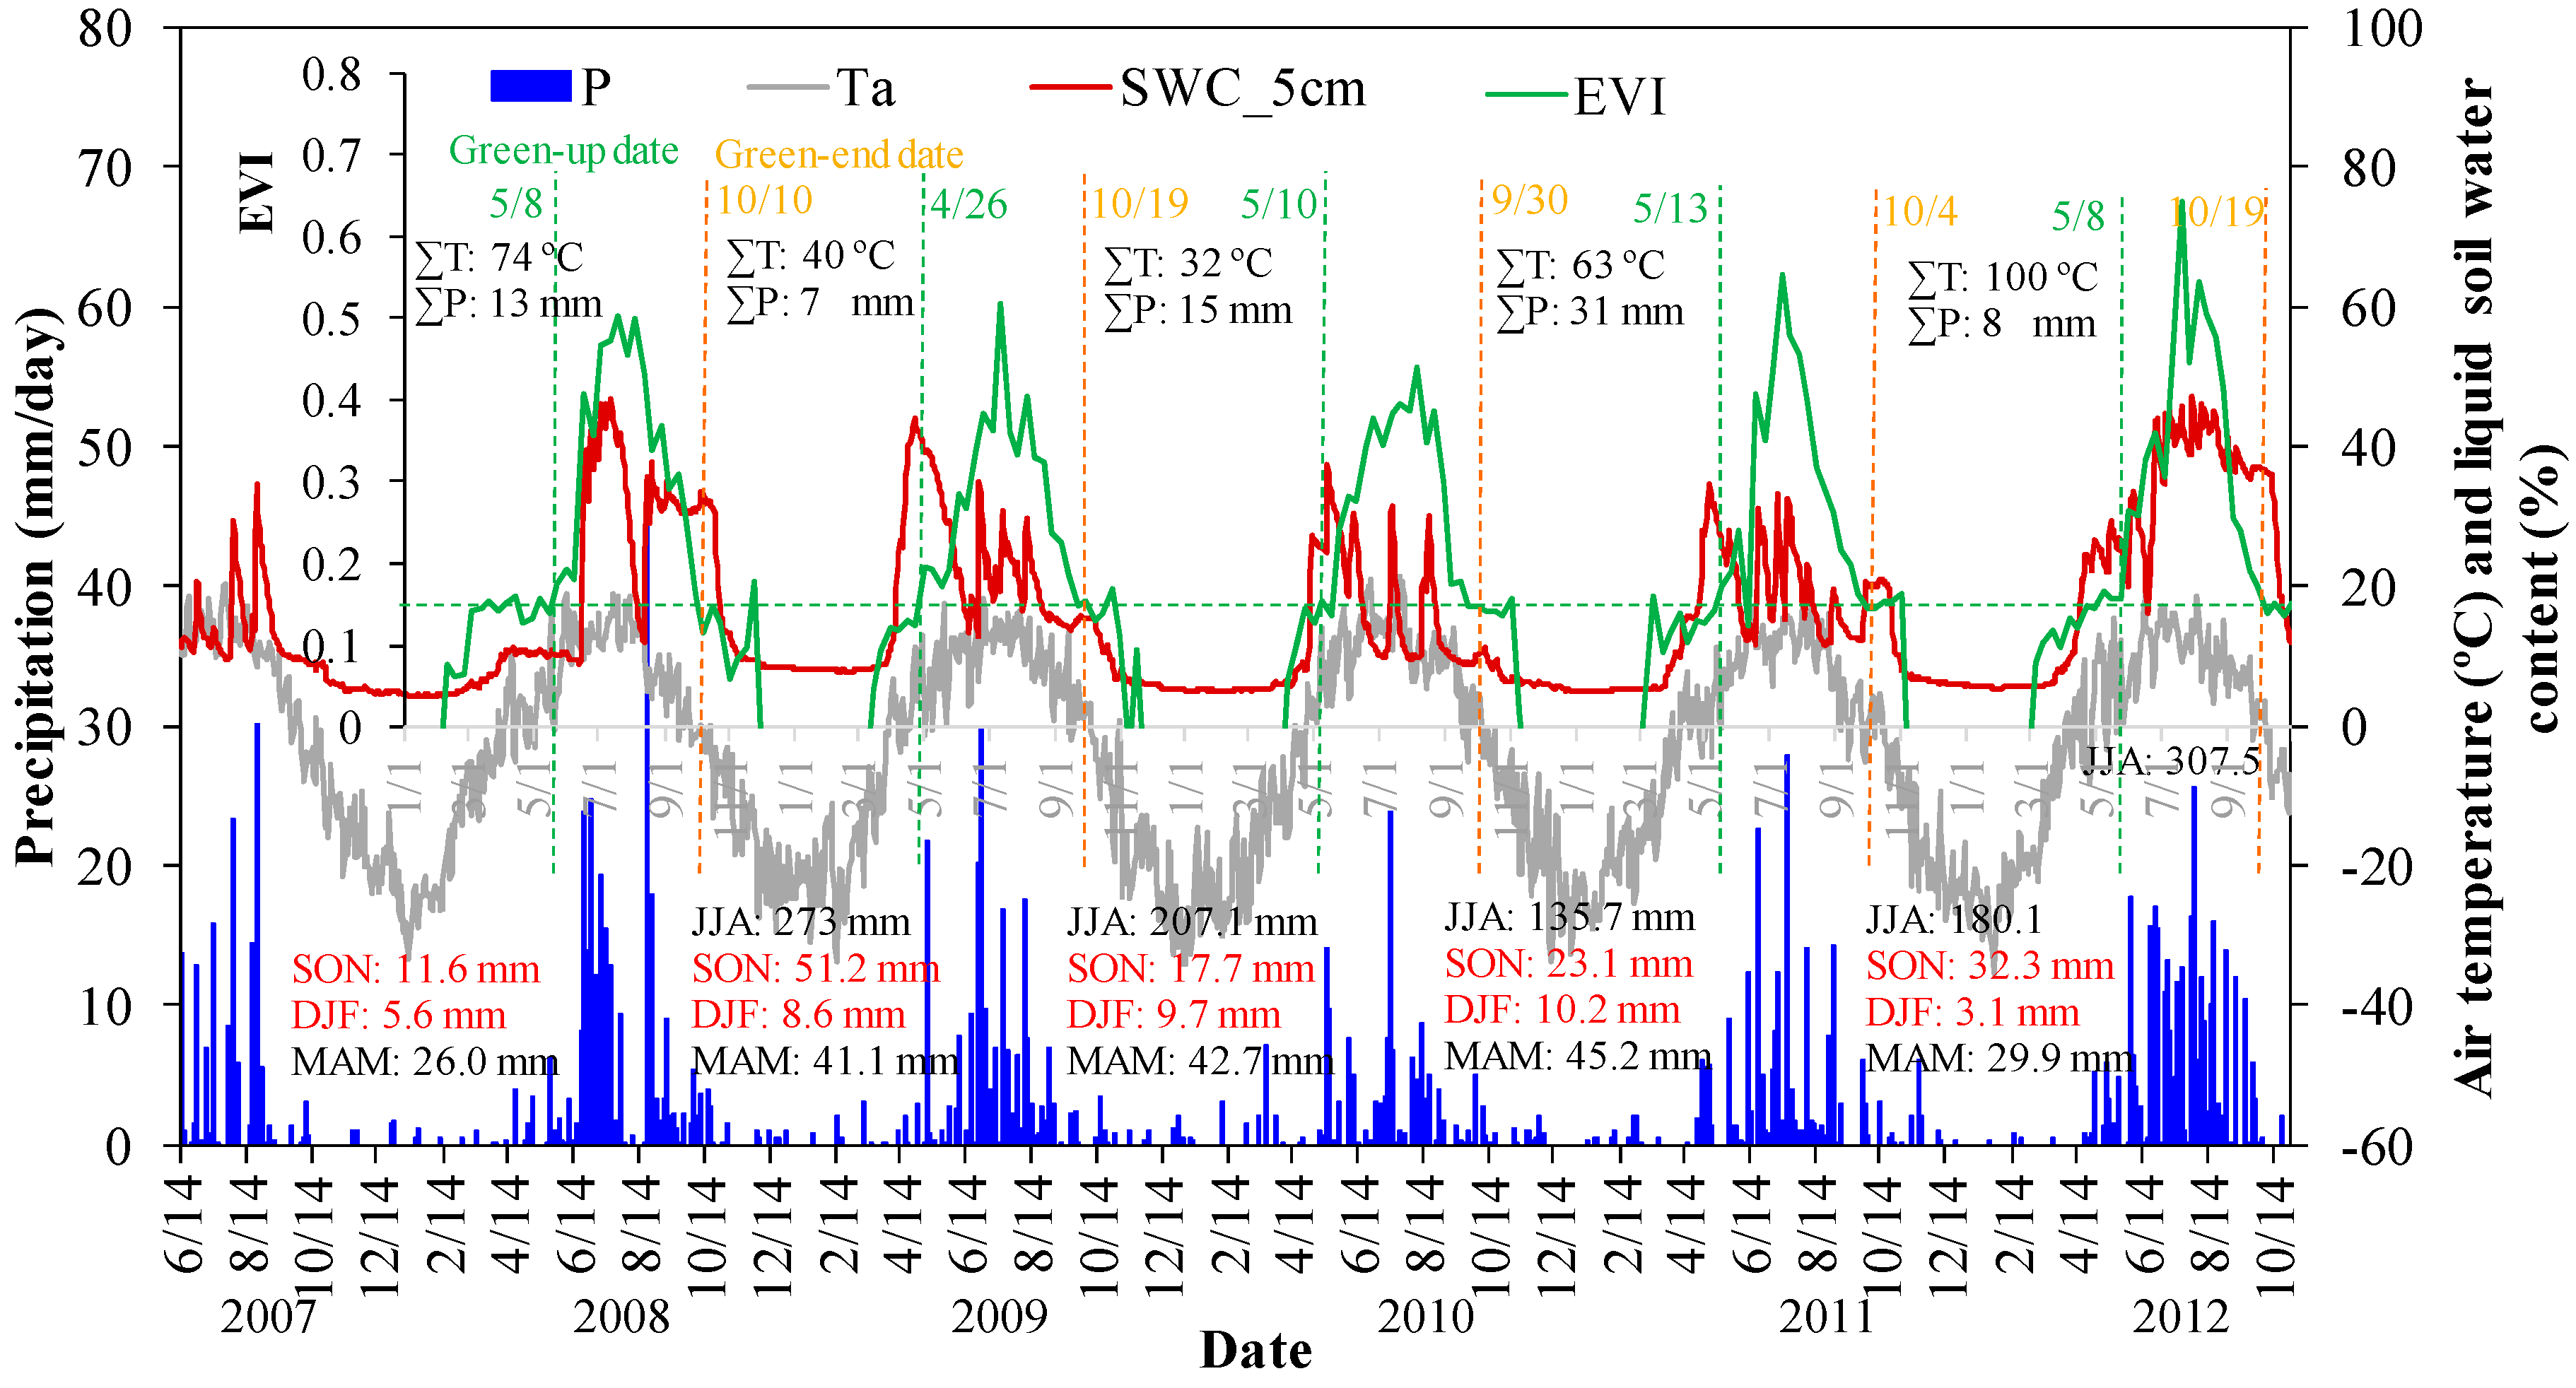
| 2008 | - | - | 5/8 | 10/10 | 5/9 | 10/12 |
| 2009 | 4/23 | 10/14 | 4/26 | 10/19 | 4/23 | 10/18 |
| 2010 | 4/28 | 10/6 | 5/10 | 9/30 | 5/3 | 10/4 |
| 2011 | 5/4 | 10/3 | 5/13 | 10/4 | 5/1 | 10/4 |
| 2012 | 5/31 | 10/26 | 5/8 | 10/19 | 4/22 | 10/19 |
| Mean | 5/6 | 10/12 | 5/7 | 10/10 | 4/29 | 10/11 |
| Stdv (days) | 16.9 | 10.3 | 6.5 | 8.6 | 7.1 | 7.3 |
5. Conclusions
Acknowledgments
Author Contributions
Conflicts of Interest
References
- Myneni, R.B.; Keeling, C.D.; Tucker, C.J.; Asrar, G.; Nemani, R.R. Increased plant growth in the northern high latitudes from 1981 to 1991. Nature 1997, 386, 698–702. [Google Scholar] [CrossRef]
- Korner, C.; Basler, D. Phenology under global warming. Science 2010, 327, 1461–1462. [Google Scholar] [CrossRef] [PubMed]
- Schwartz, M.D. Green-wave phenology. Nature 1998, 394, 839–840. [Google Scholar] [CrossRef]
- Jeong, S.J.; Ho, C.H.; Gim, H.J.; Brown, M.E. Phenology shifts at start vs. end of growing season in temperate vegetation over the northern hemisphere for the period 1982–2008. Glob.Change Biol. 2011, 17, 2385–2399. [Google Scholar] [CrossRef]
- Menzel, A.; Sparks, T.H.; Estrella, N.; Koch, E.; Aasa, A.; Ahas, R.; Alm-Kubler, K.; Bissolli, P.; Braslavska, O.; Briede, A.; et al. European phenological response to climate change matches the warming pattern. Glob.Change Biol. 2006, 12, 1969–1976. [Google Scholar] [CrossRef]
- Penuelas, J.; Rutishauser, T.; Filella, I. Phenology feedbacks on climate change. Science 2009, 324, 887–888. [Google Scholar] [CrossRef] [PubMed]
- Lhomme, J.P.; Mougou, R.; Mansour, M. Potential impact of climate change on durum wheat cropping in Tunisia. Clim.Change 2009, 96, 549–564. [Google Scholar] [CrossRef]
- Ibanez, I.; Primack, R.B.; Miller-Rushing, A.J.; Ellwood, E.; Higuchi, H.; Lee, S.D.; Kobori, H.; Silander, J.A. Forecasting phenology under global warming. Philos. Trans. R. Soc. Lond. B Biol. Sci. 2010, 365, 3247–3260. [Google Scholar] [CrossRef] [PubMed]
- Yu, H.Y.; Xu, J.C.; Okuto, E.; Luedeling, E. Seasonal response of grasslands to climate change on the Tibetan Plateau. PLoS One 2012, 7. [Google Scholar] [CrossRef] [PubMed]
- Yu, H.; Luedeling, E.; Xu, J. Winter and spring warming result in delayed spring phenology on the Tibetan Plateau. Proc. Natl. Acad. Sci. U.S.A. 2010, 107, 22151–22156. [Google Scholar] [CrossRef] [PubMed]
- Shen, M. Spring phenology was not consistently related to winter warming on the Tibetan Plateau. Proc. Natl. Acad. Sci. U.S.A. 2011, 108, E91–E92. [Google Scholar] [CrossRef] [PubMed]
- White, M.A.; Thornton, P.E.; Running, S.W. A continental phenology model for monitoring vegetation responses to interannual climatic variability. Glob. iogeochem. Cy. 1997, 11, 217–234. [Google Scholar] [CrossRef]
- Lesica, P.; Kittelson, P.M. Precipitation and temperature are associated with advanced flowering phenology in a semi-arid grassland. J. Arid Environ. 2010, 74, 1013–1017. [Google Scholar] [CrossRef]
- Shinoda, M.; Ito, S.; Nachinshonhor, G.U.; Erdenetsetseg, D. Phenology of Mongolian grasslands and moisture conditions. J. Meteorol. Soc. Jpn. 2007, 85, 359–367. [Google Scholar] [CrossRef]
- Cong, N.; Piao, S.L.; Chen, A.P.; Wang, X.H.; Lin, X.; Chen, S.P.; Han, S.J.; Zhou, G.S.; Zhang, X.P. Spring vegetation green-up date in China inferred from SPOT NDVI data: A multiple model analysis. Agr. Forest Meteorol. 2012, 165, 104–113. [Google Scholar] [CrossRef]
- Yu, F.F.; Price, K.P.; Ellis, J.; Shi, P.J. Response of seasonal vegetation development to climatic variations in Eastern Central Asia. Remote Sens. Environ. 2003, 87, 42–54. [Google Scholar] [CrossRef]
- Jin, Z.N.; Zhuang, Q.L.; He, J.S.; Luo, T.X.; Shi, Y. Phenology shift from 1989 to 2008 on the Tibetan Plateau: An analysis with a process-based soil physical model and remote sensing data. Clim. hange 2013, 119, 435–449. [Google Scholar] [CrossRef]
- Liu, H.; Tian, F.; Hu, H.C.; Hu, H.P.; Sivapalan, M. Soil moisture controls on patterns of grass green-up in Inner Mongolia: An index based approach. Hydrol. Earth Syst. Sci. 2013, 17, 805–815. [Google Scholar] [CrossRef]
- Batima, P. Climate Change Vulnerability and Adaptation in the Livestock Sector of Mongolia—A Final Report Submitted to Assessments of Impacts and Adaptations to Climate Change (AIACC). Available online: http://sedac.ciesin.columbia.edu/aiacc/progress/FinalRept_AIACC_AS06.pdf (accessed on 1 November 2014).
- Shen, M.; Tang, Y.; Chen, J.; Zhu, X.; Zheng, Y. Influences of temperature and precipitation before the growing season on spring phenology in grasslands of the central and eastern Qinghai-Tibetan Plateau. Agri. Forest Meteorol. 2011, 151, 1711–1722. [Google Scholar] [CrossRef]
- Li, R.P.; Zhou, G.S. A temperature-precipitation based leafing model and its application in Northeast China. PLoS One 2012, 7. [Google Scholar] [CrossRef] [PubMed]
- Sharkhuu, N. Occurrence of frost heaving in the Selenge river basin, Mongolia. Permafrost Periglac. 1999, 10, 187–192. [Google Scholar] [CrossRef]
- Nelson, F.E.; Outcalt, S.I. A computational method for prediction and regionalization of permafrost. Arctic Alpine Res. 1987, 19, 279–288. [Google Scholar] [CrossRef]
- Wu, T.H.; Wang, Q.C.; Zhao, L.; Batkhishig, O.; Watanabe, M. Observed trends in surface freezing /thawing index over the period 1987–2005 in Mongolia. Cold Reg. Sci. Technol. 2011, 69, 105–111. [Google Scholar]
- Zhang, X.Y.; Friedl, M.A.; Schaaf, C.B. Global vegetation phenology from moderate resolution imaging spectroradiometer (MODIS): Evaluation of global patterns and comparison with in situ measurements. J. Geophys. Res. Biogeo. 2006, 111. [Google Scholar] [CrossRef]
- Ganguly, S.; Friedl, M.A.; Tan, B.; Zhang, X.Y.; Verma, M. Land surface phenology from MODIS: Characterization of the Collection 5 global land cover dynamics product. Remote Sens. Environ. 2010, 114, 1805–1816. [Google Scholar] [CrossRef]
- Eriksson, L.; Johansson, E.; Kettaneh-Wold, N.; Trygg, J.; Wikström, C.; Wold, S. Multi- and Megavariate Data Analysis—Part I Basic Principles and Applications, 3rd ed.; MKS Umetrics AB: Umeå, Sweden, 2006. [Google Scholar]
- Henebry, G.; Anderson, J.; Losleben, M.; O’Keefe, J.; Shaw, D.; Vanderbilt, K.; Wetherill, K.; Zimmerman, J. A White Paper on Phenology across LTER. 2007. Available online: http://globalmonitoring.sdstate.edu/LTER-phenology/LTER_Phenology_White_Paper.pdf (accessed on 1 November 2014).
- Xiao, W.W.; Sun, Z.G.; Wang, Q.X.; Yang, Y.H. Evaluating MODIS phenology product for rotating croplands through ground observations. J. Appl. Remote Sens 2013, 7. [Google Scholar] [CrossRef]
- Zhang, Y.S.; Munkhtsetseg, E.; Kadota, T.; Ohata, T. An observational study of ecohydrology of a sparse grassland at the edge of the Eurasian cryosphere in Mongolia. J. Geophys. Res. Atmos. 2005, 110. [Google Scholar] [CrossRef]
- Shinoda, M.; Nandintsetseg, B. Soil moisture and vegetation memories in a cold, arid climate. Glob. Planet. Change 2011, 79, 110–117. [Google Scholar] [CrossRef]
- Zeng, H.Q.; Jia, G.S.; Epstein, H. Recent changes in phenology over the northern high latitudes detected from multi-satellite data. Environ. Res. Lett. 2011, 6. [Google Scholar] [CrossRef]
© 2014 by the authors; licensee MDPI, Basel, Switzerland. This article is an open access article distributed under the terms and conditions of the Creative Commons Attribution license (http://creativecommons.org/licenses/by/4.0/).
Share and Cite
Sun, Z.; Wang, Q.; Xiao, Q.; Batkhishig, O.; Watanabe, M. Diverse Responses of Remotely Sensed Grassland Phenology to Interannual Climate Variability over Frozen Ground Regions in Mongolia. Remote Sens. 2015, 7, 360-377. https://doi.org/10.3390/rs70100360
Sun Z, Wang Q, Xiao Q, Batkhishig O, Watanabe M. Diverse Responses of Remotely Sensed Grassland Phenology to Interannual Climate Variability over Frozen Ground Regions in Mongolia. Remote Sensing. 2015; 7(1):360-377. https://doi.org/10.3390/rs70100360
Chicago/Turabian StyleSun, Zhigang, Qinxue Wang, Qingan Xiao, Ochirbat Batkhishig, and Masataka Watanabe. 2015. "Diverse Responses of Remotely Sensed Grassland Phenology to Interannual Climate Variability over Frozen Ground Regions in Mongolia" Remote Sensing 7, no. 1: 360-377. https://doi.org/10.3390/rs70100360
APA StyleSun, Z., Wang, Q., Xiao, Q., Batkhishig, O., & Watanabe, M. (2015). Diverse Responses of Remotely Sensed Grassland Phenology to Interannual Climate Variability over Frozen Ground Regions in Mongolia. Remote Sensing, 7(1), 360-377. https://doi.org/10.3390/rs70100360