Article

Spatio-Temporal Change of Snow Cover and Its Response to Climate over the Tibetan Plateau Based on an Improved Daily Cloud-Free Snow Cover Product

1
State Key Laboratory of Grassland Agro-Ecosystems, College of Pastoral Agriculture Science and Technology, Lanzhou University, Lanzhou 730020, China
2
Key Laboratory of Arid Climatic Change and educing Disaster of Gansu Province, Institute of Arid Meteorology, China Meteorological Administration, Lanzhou 730020, China
3
Department of Geological Sciences, University of Texas at San Antonio, San Antonio, TX 78249, USA
*
Author to whom correspondence should be addressed.
Remote Sens. 2015, 7(1), 169-194; https://doi.org/10.3390/rs70100169
Submission received: 14 October 2014 / Accepted: 15 December 2014 / Published: 24 December 2014

Abstract

:
Using new, daily cloud-free snow-cover products, this study examines snow cover dynamics and their response to climate change. The results demonstrate that the daily cloud-free snow-cover products not only posses the advantages of the AMSR-E (unaffected by weather conditions) and MODIS (relatively higher resolution) products, but are also characterized by high snow and overall classification accuracies (~85% and ~98%, respectively), substantially greater than those of the existing daily snow-cover products for all sky conditions and very similar to, or even slightly greater than, those of the daily MODIS products for clear-sky conditions. Using the snow-cover products, we analyzed the snow cover dynamics over the Tibetan Plateau and determined that the maximum number of snow-covered days (SCD) in a year followed a decreasing tendency from 2003 to 2010, with a decrease in snow-covered area (SCA) equivalent to 55.3% of the total Tibetan Plateau area. There is also a slightly increasing tendency in the maximum snow cover area (SCA), and a slightly decreasing tendency in the persistent snow cover area (i.e., pixels of SCD > 350 days) was observed for the 8-year period, which was characterized by increases in temperature (0.09 °C/year) and in precipitation (0.26 mm/year). This suggests that, on the Tibetan Plateau, changes in temperature and precipitation exert a considerable influence on the regional SCD and SCA, as well as the distribution of persistent snow cover.

Graphical Abstract

1. Introduction

Snow cover, as an important component of land cover, is one of the most active natural materials on the Earth’s surface. In winter, the snow-covered area (SCA) of the northern hemisphere is greater than 50 million km2, which accounts 34% of the Earth’s surface [1]. The dynamics of the SCA exert a considerable influence on the surface albedo, climate change, hydrological circulation system and energy balance, with social, economic and ecological consequences [2].
The MODIS snow products that are derived from the visible and near-infrared portions of the electromagnetic spectrum are especially useful for mapping snow characteristics because of their potentially high spatial resolution, and the ability to differentiate snow from other features, such as clouds. Hence, these products play an important role in snow monitoring, snowmelt-runoff modeling and data assimilation [3,4,5,6,7,8,9]. Studies have shown that MODIS snow-cover products are characterized by high snow classification accuracies under clear skies [10,11,12,13]. Yet, on any given day, a substantial portion of the Earth's surface may be obscured by clouds, thus limiting the capability for the monitoring of snow cover using optical sensors such as MODIS [14,15]. In recent years, a series of algorithms have been developed for the elimination of cloud obscuration from MODIS and AMSR-E snow-cover products, such as the daily Terra-Aqua image combination [13,16], temporal deduction [14,17,18], the snow-line method (SNOWL) [19] and multi-sensor combinations [15,20,21]. These methods effectively reduce the high-cloud obscuration in the daily MODIS snow-cover products for the monitoring of SCA dynamics. However, the daily composite algorithms can only reduce cloud obscuration by approximately 10%–20% [12]. The snow classification accuracy of multi-day composite products could be improved by an increase in image-composition days to further reduce the level of cloud obscuration. However, this method sacrifices temporal resolution for the minimization of cloud coverage and maximization of snow coverage. The resultant products, therefore, are not appropriate for the real-time monitoring of SCA. The AMSR-E (passive microwave) snow-cover product is not influenced by weather conditions. However, it is primarily used for the study of the global snow depth, snow coverage and snow-water equivalent because of its coarse resolution (25 km). A composite of optical and passive-microwave snow-cover products can completely eliminate the contamination by clouds, though with a reduced accuracy compared to those of optical snow-cover products under conditions of clear skies because of the low spatial resolution of the AMSR-E snow data [15]. The SNOWL cloudless algorithm is a newly developed algorithm that removes clouds by performing a cloud-pixel reclassification based on the position relative to the regional snowline elevation [19]. Using this reclassification approach, the cloud pixels can be divided into snow, no-snow (land), and partial snow, with a certain degree of uncertainty associated with the partial-snow class. Paudel, et al. [22] reported that the effect of the regional terrain on the cloud-pixel reclassification when using the SNOWL method requires further examination. Because the fractional snow cover (FSC) data more accurately represent the gradual changes in snow cover in each pixel than the binary snow-cover data, the use of the FSC data is also more accurate for the removal of the cloud cover by multiple-endmember spectral mixture analysis [23]. Because of the requirement of multiple endmembers for the determination of the change in fractional snow cover (FSC), the radiative-transfer model for the estimation of the regional FSC cannot be applied to monitor the SCA dynamics of a large area because of the required amount of computational power. A new, MODIS daily cloud-free snow-cover product has been generated by integrating and improving the current cloud-reduction approaches [24]. The advantage of the new, snow-cover products is that all of the cloud pixels under all types of weather conditions are removed with a high snow-classification accuracy, thus providing considerable application value for snow-cover monitoring, hydrological modeling and other related research topics.
It is well known that SCA and snow depth are affected by both temperature and precipitation [25,26,27,28]. Changes in temperature influence global and regional atmospheric circulation patterns, which in return affect the distributions of precipitation and snowfall. As an area that is highly sensitive to climate change, the temperature of the Tibetan Plateau (TP) has increased at twice of the rate of global warming [29]. This has certainly impacted the regional patterns of snowfall and rainfall. The recent changes in snow cover on the TP, sometimes called “the third pole of the world” have received an increasing amount of attention [30]. The rate of snow melt has been accelerating in association with changes in aerosol concentrations and climate warming over the TP [30,31]. The snow cover during the wet and warm season has also decreased along the high mountain ranges of the TP [32,33]. There is a strong positive correlation between the amount of summer precipitation over East Asia and the winter snow cover over the TP [34]. There are primarily negative correlations between the monthly snow-cover products and the in-situ temperature, the net radiation and the wind speed at two high-altitude stations [35,36]. The glaciers, areas perennially covered in snow and ice, are contracting rapidly in the Brahmaputra Basin of the TP as a result of climate change [37]. These correlations suggest that the snow cover has a close relationship with regional climate change. However, previous studies have mainly focused on snow-cover mapping and snow-cover monitoring and have paid little attention to the relationship between the regional changes in snow cover and climate, particularly the changes in temperature and precipitation patterns.
The purposes of this study are (1) to validate the accuracy of the new, MODIS daily cloud-free snow-cover product for the TP; (2) to analyze the snow-cover dynamics, based on the new, snow-cover products for the TP; and (3) to examine the snow-cover response to climate change over the TP from 2003 to 2010.

2. Study Area

The TP (26°00′12″N–39°46′50″N and 73°18′52″E–104°46′59″E) is located in the middle of the Eurasian continent (Figure 1), which stretches from the Pamir to the Hengduan Mountains from west to east, with a length of 2945 km, while extending approximately 1532 km from the southern edge of the Himalayas in the south to the northern rim of the Kunlun Mountains and the Qilian Mountains in the north. The total area is approximately 2.57 × 10⁶ km2, with a mean altitude of over 4000 m. Grassland, forest, and desert are the primary land types on the TP. The TP is rich in snow and ice resources that are the main water source of numerous Asian rivers, including the Yellow, Yangtze and Lantsang rivers [38]. Global warming has accelerated the rate of glacier melt and has increased precipitation and caused a redistribution of precipitation [39]. This increased rate of melting and precipitation has caused more frequent flooding and snow disasters [31,40]. The results also demonstrate that the snow-cover dynamics on the TP influence the atmospheric circulation and the weather system in East Asia, which further influence the climate of China [34,41,42].
Figure 1. Shuttle Radar Topography Mission (SRTM)-Digital Elevation Model (DEM) based elevation and location of climate stations over the Tibetan Plateau region. S1–S7 denote the seven Landsat images used for validation of MODIS composite snow cover images.
Remotesensing 07 00169 g001

3. Data and Methods

3.1. Data

3.1.1. Meteorological Observation Data

The mean daily temperature (°C), precipitation (mm) and snow depth (cm) data from 1 January 2003 to 31 December 2010 were collected at 106 meteorological stations of the Chinese Meteorological Data Sharing Service System (CMDS) (http://cdc.cma.gov.cn/). These stations are mostly located at lower elevations, ranging from 1285 to 4850 m (Figure 1). The meteorological stations report snow depth in centimeters, with a minimum reported value of 1 cm. Snow depths less than 0.5 cm are reported as zero, and the values are rounded to the nearest centimeter if the snow depth is equal to or greater than 0.5 cm, according to the guidelines for observing snow cover established by the meteorological agencies of China. This snow depth data were used to validate the improved daily cloud-free snow-cover maps produced in this study.

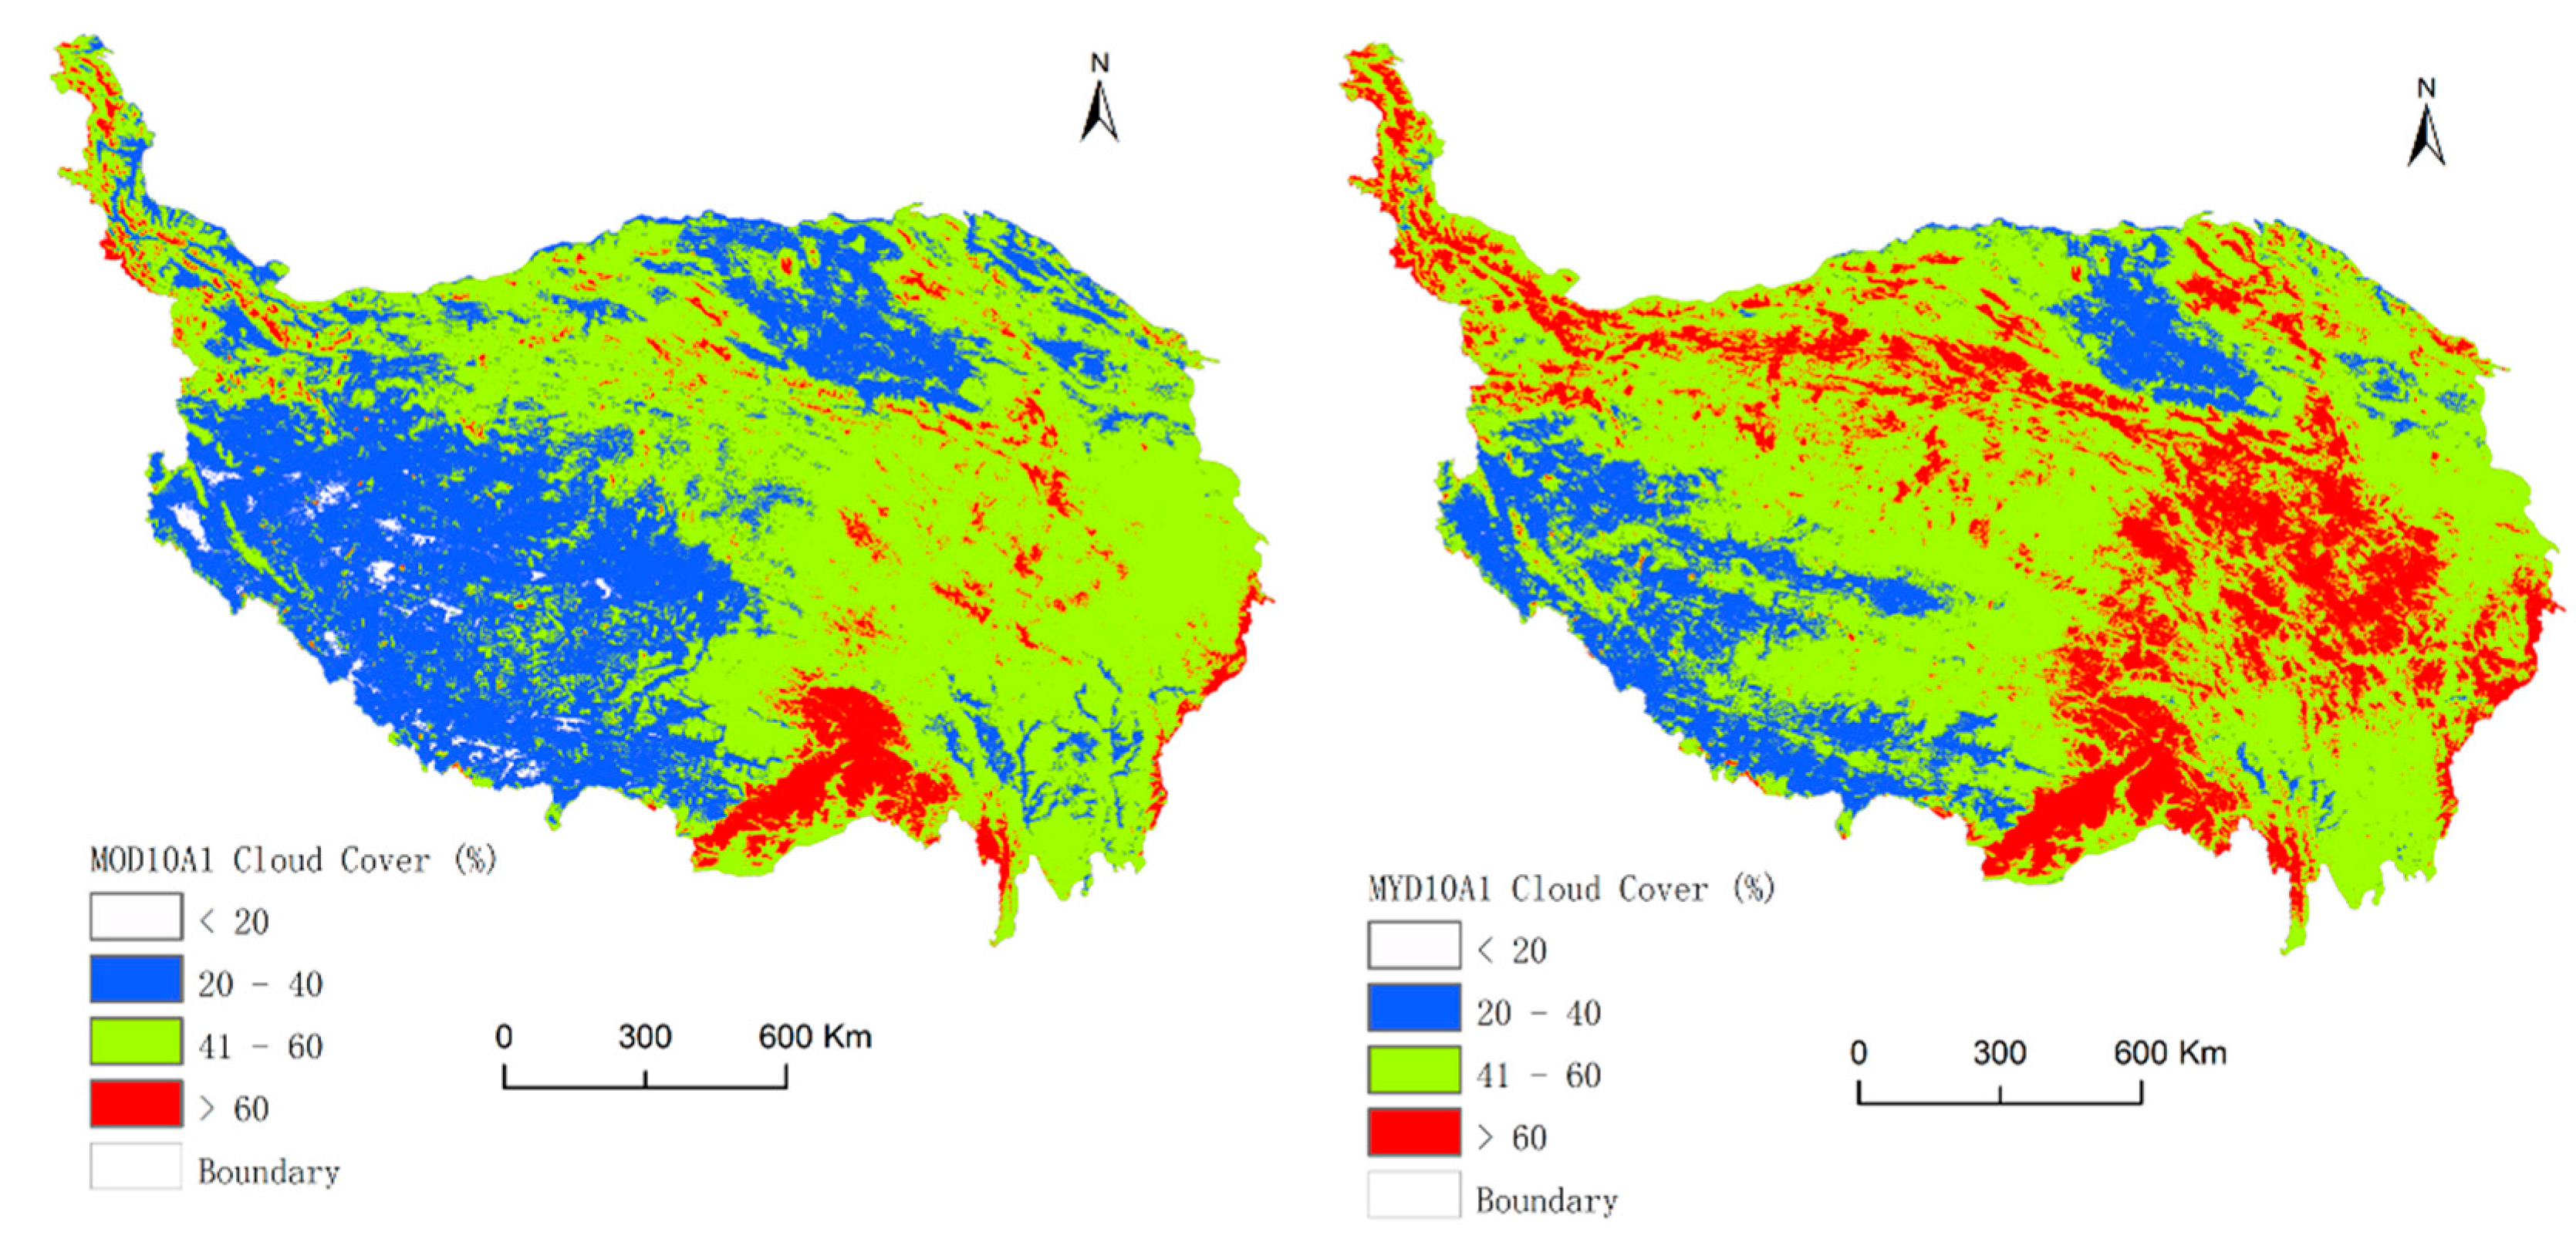
3.1.2. MODIS Snow-Cover Data

The MODIS Snow cover products are distributed by the National Snow and Ice Data Center (NSIDC) (http://nsidc.org). The snow cover images used in this study consist of MODIS daily snow cover products MOD10A1 and MYD10A1 (MODIS Terra/Aqua Snow Cover Daily L3 Global 500 m SIN GRID V005) from 1 January 2003 to 31 December 2010. The MODIS standard daily snow-cover products (MOD10A1 and MYD10A1) consist of 1200 × 1200 km land tiles of 500 m spatial resolution data. The Version 5 (VOO5) data are georeferenced on an equal-area sinusoidal projection in a daily temporal resolution. The MODIS snow-mapping algorithm uses the satellite reflectance from MODIS bands 4 (0.545–0.565 μm) and 6 (1.628–1.652 μm) to calculate the normalized-difference snow index (NDSI). Details regarding these MODIS snow products can be found in Hall and Riggs [10].
Thirteen MODIS tiles (i.e., h23v04, h23v05, h24v04, h24v05, h24v06, h25v04, h25v05, h25v06, h26v04, h26v05, h26v06, h27v05 and h27v06) are required to cover the entire study area. We mosaic 13 tiles using the nearest-neighbor resample approach and reproject them into an Albers equal-area conical projection using the MODIS Reprojection Tool (MRT). The mosaic procedure includes the following two steps: (1) Parameter configuration: The parameter file contains the file names and file types of the input and output data files, the spectral and spatial subsetting information, the output projection type, the output projection parameters, the output resampling type, and the output pixel size. These files are distinguished by a “.prm” extension and are formatted as ASCII text, which may be created and edited in any text editor; (2) Batch processing of MODIS data: A batch file is written to encapsulate the repetition of mosaic and resample execution on each file. The final mosaicked images are saved as a Geotiff file format and are then transformed into ESRI-grid data for further processing. Totals of 2909 MOD10A1 mosaic images and 2920 MYD10A1 mosaic images created from daily data, covering a period of 8 years from 2003 to 2010, were analyzed for this study (Table 1).
Table 1. MODIS snow cover images used in this study.
Snow SeasonMOD10A1MYD10A1AE_DySno
Total ImagesMissing DateMean Cloud (%)Total ImagesMissing DateMean Cloud (%)Total ImagesMissing Date
200335717–24 December39.83364 48.9435830 October–5 November
200436519 February37.75366-46.8536519 November
2005365-43.81365-53.7236417 November
200636424 August37.333645 July46.2036418 November
2007365-38.673642 December47.8836327– 28 November
200836621–23 December40.97366 49.15366
2009365 45.61365 51.20364July 11
2010365 44.37365 49.913633–4 February

3.1.3. Passive Microwave AMSR-E/Aqua Daily SWE Data

The AMSR-E instrument on NASA’s EOS Aqua satellite provides global passive-microwave measurements of terrestrial, oceanic, and atmospheric variables for the investigation of water and energy cycles. The daily level-3 AMSR-E snow water equivalent (SWE) data, AE_DySno (AMSR-E/Aqua Daily L3 Global Snow Water Equivalent EASE-Grids) for the Northern Hemisphere were obtained from the NSIDC. These data are stored in a Hierarchical Data Format-Earth Observing System (HDF-EOS) format, and the database contains SWE data and quality assurance flags mapped to 25 km Equal-Area Scalable Earth Grids (EASE-Grids). The actual SWE values range from 0 to 480 mm, but are scaled down by a factor of 2 for their storage in the HDF-EOS file. In addition to the snow water equivalent data, surface classes can also be studied using the data. A SWE value of zero indicates a snow-free surface (or land surface); values from 1 to 240 represent a snow-covered surface; and the values 248, 252, 253, 254 and 255 represent off-earth, land or snow impossible, ice sheet, water and data missing, respectively.
The 2907 AMSR-E daily SWE images from 1 January 2003 to 31 December 2010 (Table 1) were transformed into ESRI-grid format files by employing an Albers equal-area conical projection. The grid size of 25 km was re-sampled to 500 m using the nearest neighbor approach to match the MODIS data. There were a number of gaps in the AMSR-E daily SWE products in the mid-latitude areas that were filled by using the daily SWE images of previous day and the next day (i.e., adjacent temporal deduction method).

3.1.4. DEM

The Shuttle Radar Topography Mission (SRTM) Digital Elevation Model (DEM) data (SRTM3, NASA VERSION 2, 90 m) were downloaded from the CGIAR Consortium for Spatial Information (CGIAR-CSI) (http://srtm.csi.cgiar.org). The elevation datum is EGM96; the horizontal datum is WGS84; and there are 42 images to cover the entire study area. Rodriguez, et al. [43] reported that the accuracy of the SRTM varies among regions. The absolute vertical accuracies are approximately 6.2 m in Asia and Europe. Huang, et al. [44] analyzed the accuracy of the elevation data for the TP region using laser altimetry data (ICESat) and reported that the accuracy is approximately 0.63 ± 9.67 m for the TP.

3.1.5. Landsat TM/ETM

Seven series of cloud free Landsat TM/ETM+ images were downloaded from the United States Geological Survey (USGS). The specific dates and locations of the Landsat TM/ETM+ images (S1 to S7) are listed in Table 2 and shown in Figure 1. The Landsat TM/ETM+ bands (band 2 and band 5) were used to calculate the NDSI values, which can identify the snow-cover in 30 m pixels (i.e., the “SNOWMAP” algorithm) [45]. Using the SNOMAP algorithm, snow-cover maps derived from these images were also created to validate the daily cloud-free snow-cover products. The S1 and S3 images are ETM+ images with scan-to-scan gaps that are first filled using the U.S. Geological Survey (USGS) gap-fill method [46] before classifying them into either snow or no snow classes.
Table 2. Information about Landsat scenes used as ground truth in validating snow cover data in the Tibetan Plateau (TP).
RegionSensorDayLocal timePathRow
S1ETM+2007/11/2011:13:59147037
S2TM2010/08/2311:19:23148035
S3ETM+2007/04/1510:55:31134040
S4ETM+2003/02/2210:58:44135038
S5ETM+2003/03/2410:53:27141039
S6ETM+2003/05/0510:57:19132034
S7ETM+2003/11/2211:01:42131038

3.2. Methods

3.2.1. Composite Rules for Daily Cloud-Free Snow Cover Product

The MODIS daily snow-cover products (MOD10A1, MYD10A1), the AMSR-E daily SWE product, and the digital elevation model (DEM) were used to produce the MODIS daily cloud-free snow products. To eliminate the gaps in coverage caused by clouds, the composite algorithm procedure used for the daily cloud-free snow-cover product includes the following four main steps: (1) According to the characteristics of cloud movement, the MODIS daily snow-cover images (MOD10A1/Terra and MYD10A1/Aqua) are first composited using the same composite rules previously detailed in the literature [11,16]. This composite image is named as MOYD; (2) The next step is to further reduce cloud cover through adjacent temporal compositing. This composite image is named as MTS; (3) The snow distribution is similar for the same geographic condition within a region. The SNOWL method [19] is based on the aforementioned theory [19] to assign and reclassify the cloud pixel based on its elevation compared to the distribution of snow and land in a given elevation zone. The third step is to use the SNOWL method to assign the remaining cloud pixels into snow or land, assuming that a cloud pixel should be snow if the DEM elevation corresponding to the location of the pixel is above the mean elevation of snow, or land if the elevation of the pixel is below the mean elevation of land. This composite image is named as MSL. In this study, we divide the TP area into 7 elevation zones (as shown in Figure 1) to reduce uncertainties associated with using the SNOWL approach. The elevation zones are based on the land-cover classification, grassland type and SRTM-DEM of the TP; (4) For those cloud pixels with elevations between the two mean elevations (snow or land), an algorithm procedure used the AMSR-E SWE product as a reference to assign the pixels into either snow if SWE > 0 or land if SWE = 0. The ultimate composite image is referred to as MA. Details regarding the algorithm can be found in Huang, et al. [24].

3.2.2. Accuracy Assessment of the Snow-Cover Images

For this study, two methods were used to assess the snow classification accuracies of the daily snow-cover products.
(a) Using snow-depth data from 106 meteorological stations during the period from 2003 to 2010, the snow classification images were evaluated using a confusion matrix (Table 3). The overall accuracy, Oa (%), and snow classification accuracy, Sa (%), of the MODIS snow-cover products and snow-cover composite images (i.e., MOYD, MTS, MSL, and MA) were calculated using Equations (1) and (2).
O a = S b + L b S b + S s + L b + L s × 100
S a = S b S b + S s × 100
where, Sb (i.e., complete agreement for snow) represents the number of pixels in which snow is reported for climate stations and detected in snow-cover images; Ss (i.e., partial agreement for snow) represents the number of pixels in which snow is reported by climate stations but misclassified into land (Ss1) or cloud (Ss2) by the snow-cover images; Lb (i.e., complete agreement for land) represents the number of pixels in which land is reported by climate stations and detected in snow-cover images; Ls (i.e., partial agreement for land) represents the number of pixels in which land is reported by climate stations but misclassified into snow (Ls1) or cloud (Ls2) by snow-cover images.
(b) Landsat TM/ETM+ images were analyzed to assess the accuracy of the cloud-free snow-cover classification images (MA) produced from the combined use of MODIS and AMSR-E products. The specific calculation steps included (1) the derivation of snow cover maps from the selected Landsat images (cloud free) using the SNOWMAP approach [45,47] and the upscaling of the snow-cover maps to a 500-m pixel scale for comparison with the MA snow-cover maps and (2) the determination of the KAPPA coefficient (Khat) to assess the accuracy of the MA snow-cover maps treating the Landsat-derived snow-cover images as ground-truthed data [10,48].
The Khat is a popular descriptive statistic for summarizing the cross classification of two nominal variables with N ≥ 2 identical categories [49]. Originally proposed as a measure of agreement between two observers who each rate the same sample of objects (individuals, observations) on a nominal (unordered) scale with the same number of n categories [50], Khat has been applied to square cross-classifications encountered in map comparison [51] and other fields.
Table 3. Confusion matrix for remote sensing image vs. in situ observations.
Image: SnowImage: No SnowImage: Cloud
Ground: snowSbSs1Ss2
Ground: no snowLs1LbLs2

3.2.3. Maximum Snow-Covered Days (SCD)

The SCD represents the overall snow-cover conditions for a region for a year. Thus, the maps of the spatial distribution of SCD produced in this study have potential significance for local water resources, the live-stock industry, agriculture and emergency management. To study the long-term tendency of SCD, the daily cloud-free snow-cover images (i.e., MA) for the period from 2003 to 2010 were analyzed for each year of this study. According to Equation (3) [52], the slope of the least-squares line fitting the interannual variability of SCD over the 8-year time period for the TP was calculated for each pixel by the least-squares method.
S = n × i = 1 n i × S C D i , j k i = 1 n i i = 1 n S C D i , j k n × i = 1 n i 2 ( i = 1 n i ) 2
where, i is the serial number from 1 to 8 for the years from 2003 to 2010; SCDi,jk is the value of snow covered days in the pixel in the jth row and kth column of the MA image for the ith year; n is the number of years. When S = 0, there is no increasing or decreasing tendency; when S < 0, there is a decreasing tendency; when S > 0, there is an increasing tendency, and the significance levels (p) of the F-tests are presented.

4. Results and Discussion

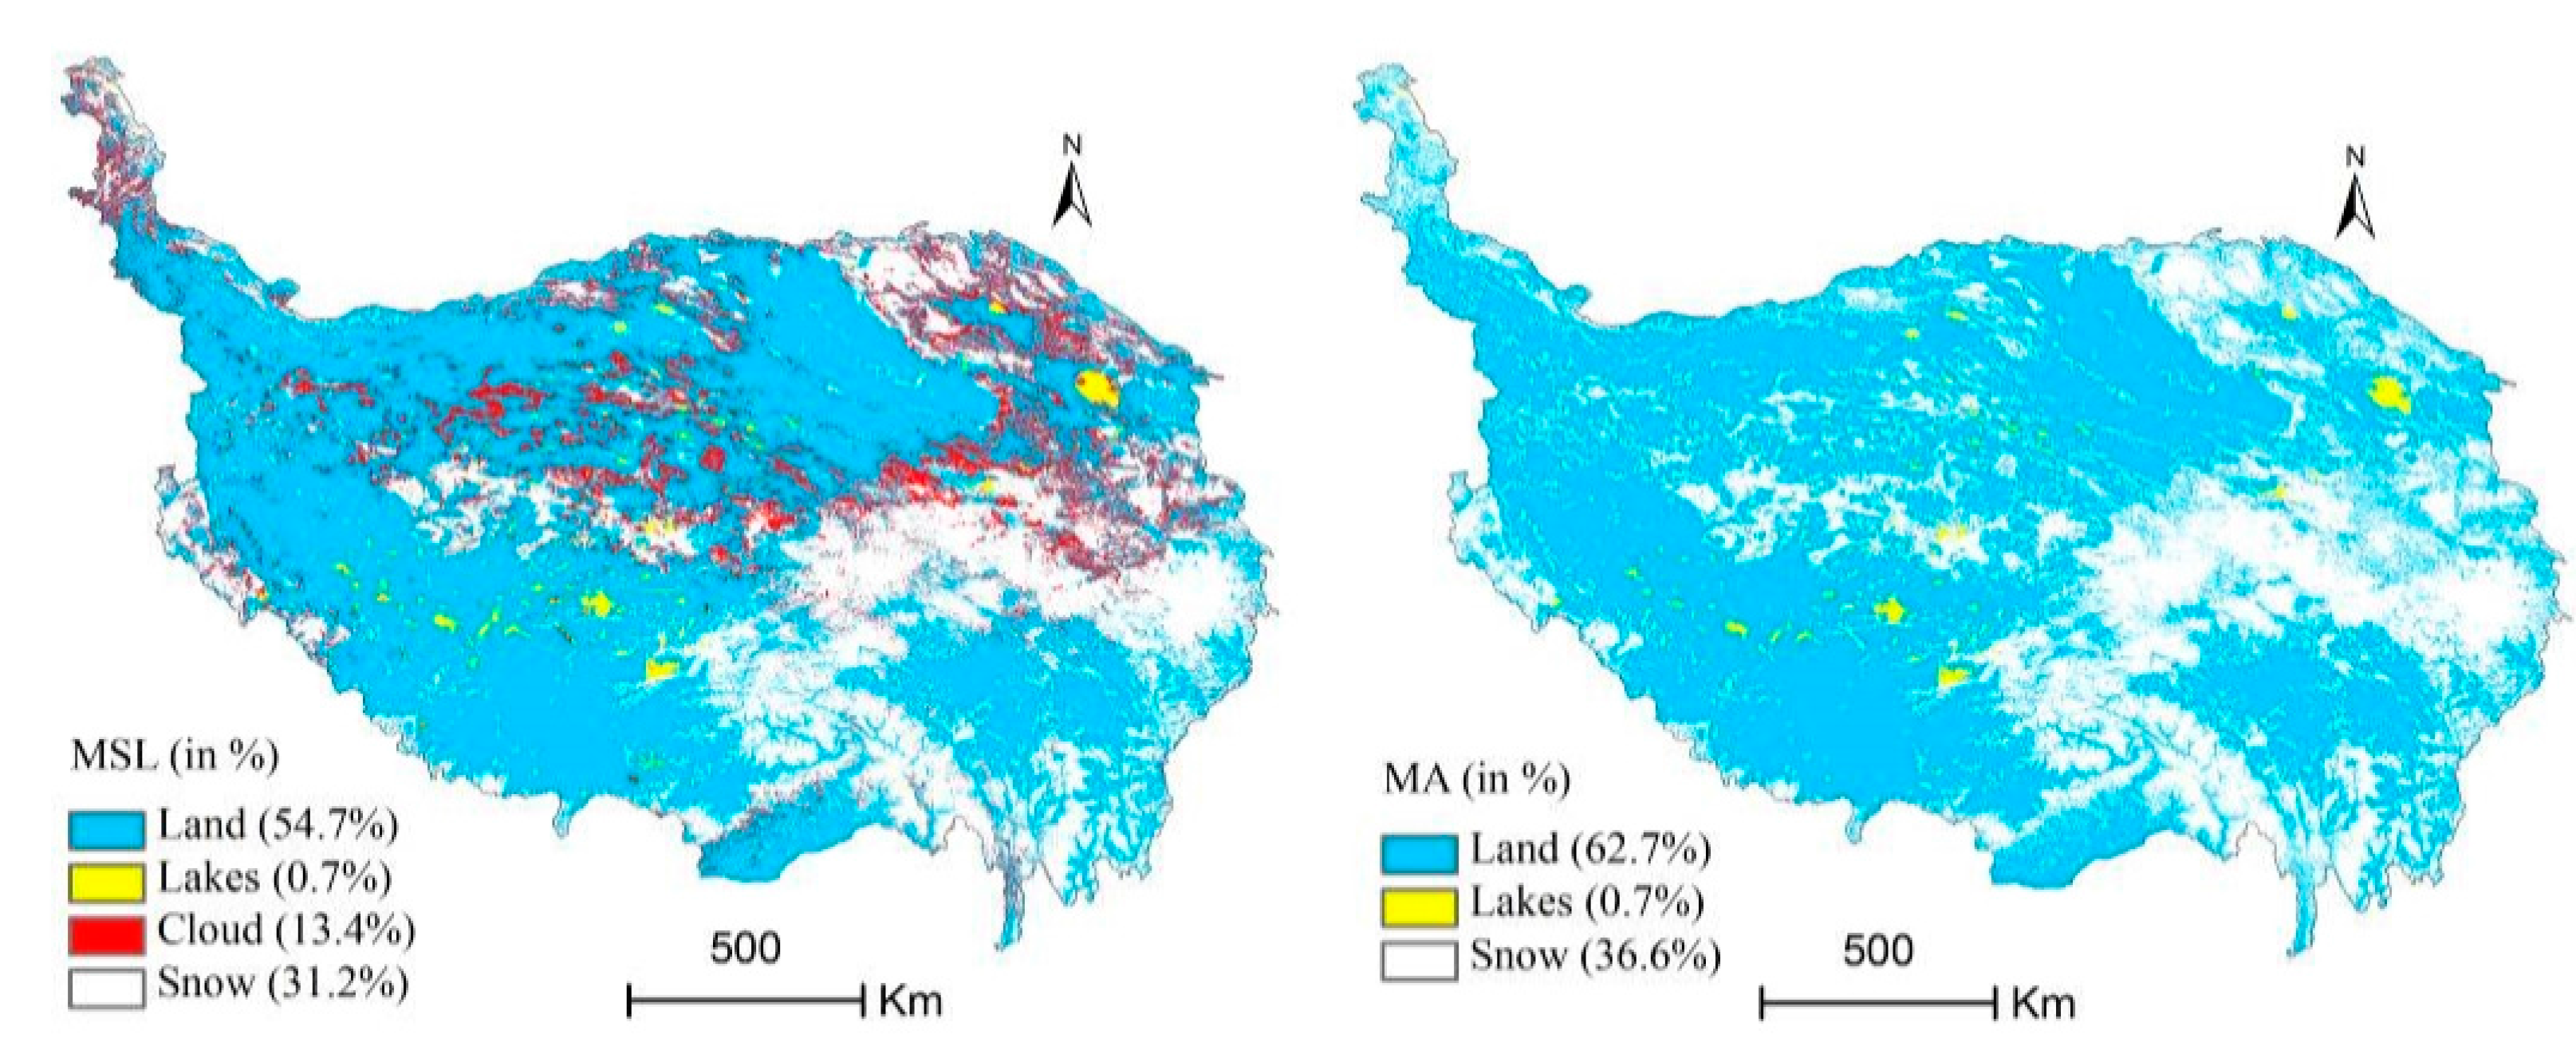
4.1. Effectiveness of Cloud Removal

Figure 2 shows the mean cloud coverage of the standard daily Terra/MODIS and Aqua/MODIS daily snow-cover maps for the 8 year period from 2003 to 2010. Clearly, the majority of the area was covered by over 40% cloudiness, with a higher cloud cover in the afternoon (1:30 pm) than in the morning (10:30 am) (52% verse 45%). The areas of highest cloud cover are located in southeast and east, while the areas of lowest cloud cover are located in the southwest and in the north near Qaidam basin.
Figure 2. Mean cloud coverage from standard daily MODIS snow cover products (left: Terra MODIS and right: Aqua MODIS) during the 8-year period from 2003 to 2010 in the TP region, with a mean cloud cover of 45% in the 10:30 am (left) versus 52% in the 1:30 pm (right).
Remotesensing 07 00169 g002
Therefore, the use of the daily MOD10A1 image or the daily MYD10A1 image to accurately monitor the snow-cover dynamics in the study area is almost impossible. Figure 3 shows that the combined Terra and Aqua daily snow-cover image (MOYD) can effectively reduce the cloud-covered area by 15%; the adjacent temporal reduction image (MTS) can further reduce the cloud coverage by 10%; the SNOWL method (MSL) can further reduce the cloud coverage by 9%, while the combined MODIS and AMSR-E images (MA) produce images with zero cloud cover. Figure 4 shows an example of the reduction in cloud coverage for 2 February 2008. The mean cloud cover was 48.6% for the MOD10A1 image and 55.9% for the MYD10A1 image, which was reduced to 31.7% for MOYD, 22.4% for MTS, 11.3% for MSL, and 0% for MA.
Figure 3. Mean cloud cover reduction over the period of 2003 to 2010 from MYD10A1/MOD10A1, to daily combined MOYD, to daily adjacent temporal reduction (MTS), to daily SNOWL result (MSL), and to daily MODIS and AMSR-E composite (MA) in the TP region.
Remotesensing 07 00169 g003
Figure 4. Examples of cloud reduction from MOD10A1 and MYD10A1 images on 2 February 2008 to different composite images MOYD, MTS, MSL, and MA of 2 February 2008, in Tibetan Plateau.
Remotesensing 07 00169 g004aRemotesensing 07 00169 g004b

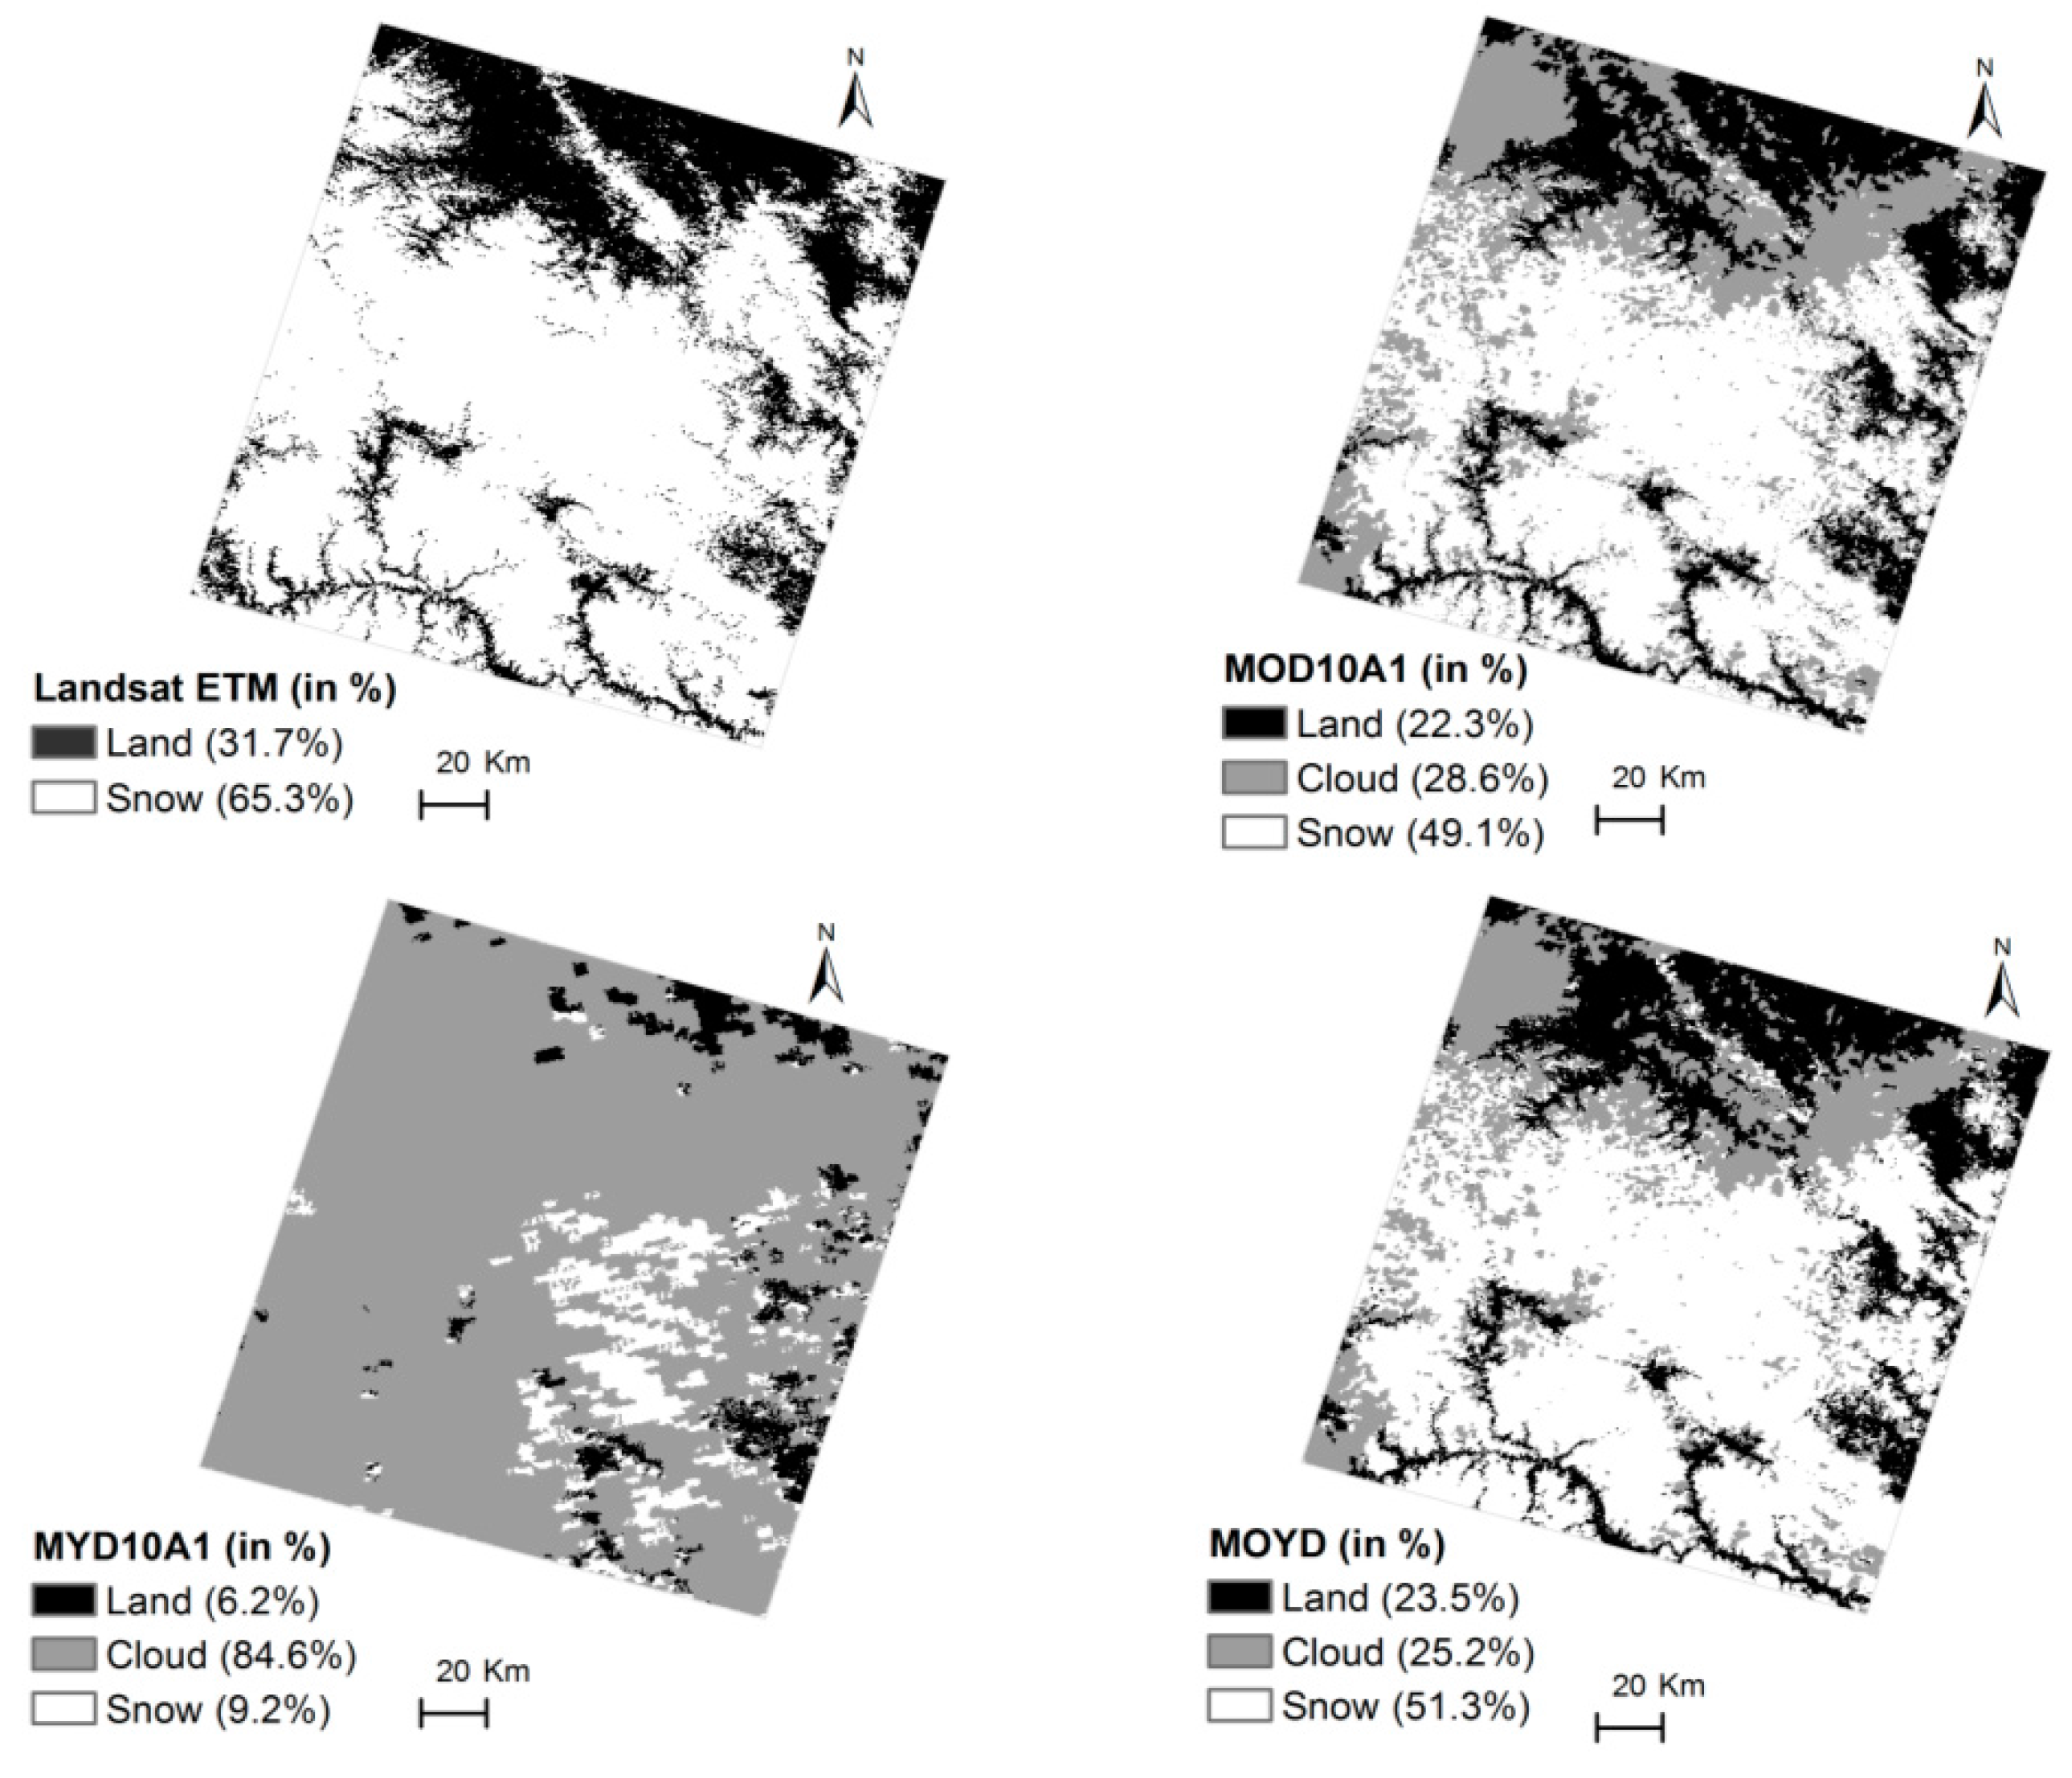
4.2. Snow Classification Accuracy

As shown in Table 4, the snow classification accuracies and overall classification accuracies under the clear sky condition are all very similar, except for the slightly lower snow classification accuracy for MYD10A1, and the accuracies all increase gradually from top to bottom as the cloud cover decreases under all sky conditions. The MOD10A1 and MYD10A1 have high snow classification accuracies under the clear sky condition, 81.21% and 70.31%, respectively. However, these two products are strongly influenced by clouds. Hence, it is difficult to accurately monitor the SCA of the TP under all sky conditions with these two products. By using the new composite algorithm, the snow classification accuracy can be improved greatly. For all sky conditions, the accuracy of snow identification from the MA images in the 8 years can reach 85.05% (Table 4). Although the accuracy of MA is slightly lower than that of the MSL (85.67%) for a clear sky, it is significantly greater than that of the MSL (64.98%) when considering all sky conditions.
Table 4. Snow classification accuracy for snow-covered area (SCA) images from 2003 to 2010.
SCA ImageS-SS-LS-CL-LL-SL-CClear SkyAll Sky
Snow Accuracy (%)Overall Accuracy (%)Snow Accuracy (%)Overall Accuracy (%)
MOD10A119364483855139,735797102,29081.2199.1331.0356.88
MYD10A114526134326122,9141486114,58070.3198.3422.7250.68
MOYD25525462733179,275237263,01182.3898.4243.7772.59
MTS37106632183200,816246141,20484.8498.5056.5981.47
MSL46707811736215,291255826,06885.6798.5064.9887.60
MA49798750245,3643199085.0598.4085.0598.40
Note: S, L, and C are respectively for snow, land, and cloud; the first letter is for climate station and the second letter for satellite. For example, S-S means that “snow” seen from climate stations is also seen as “snow” from satellite; L-S means that “land” seen from climate stations is seen as snow from satellite.
Table 5 shows the results when using the Landsat images as ground truth. There are clear increases in both the Khat values and snow-cover percentages progressing from MYD/MOD, to MOYD, MTS, MSL, and to MA for all seven selected areas (S1 to S7). Note that the MYD10A1 images often have the lowest Khat and snow-cover percentage values because of the general pattern of greater cloud coverage in the afternoon than in the morning and band 6 is non-functional on the Aqua satellite for the TP. Meanwhile, the snow-cover percentages of the MA images are always the best performing and the closest to the “ground truth” values of the Landsat images, though they are always slightly lower than the “ground truth” values. This difference is attributed to the relatively coarse resolution of the MODIS images compared to the Landsat images. This result indicates that the MODIS snow-cover images tend to slightly underestimate the “actual” snow cover, even under the clear sky condition.
Table 5. KAPPA coefficients of the different MODIS and composite snow cover images as compared with those from the seven Landsat images.
RegionSnow Cover ImageKhatSnow Cover (%) of MODIS ImageSnow Cover (%) of Landsat Image
S1MOD10A10.46710.6318.82
MYD10A10.38311.26
MOYD0.53613.10
MTS0.59013.51
MSL0.67113.92
MA0.70314.23
S2MOD10A10.59138.8348.44
MYD10A10.41321.37
MOYD0.66740.41
MTS0.73142.53
MSL0.79444.16
MA0.81245.95
S3MOD10A10.56128.7639.67
MYD10A10.49317.14
MOYD0.63030.78
MTS0.68631.52
MSL0.72832.67
MA0.76935.17
S4MOD10A10.68749.1065.32
MYD10A10.0899.20
MOYD0.74351.31
MTS0.76753.14
MSL0.81357.91
MA0.84161.30
S5MOD10A10.53110.6417.33
MYD10A10.4847.07
MOYD0.59011.31
MTS0.66311.62
MSL0.72112.91
MA0.74413.57
S6MOD10A10.51113.3120.21
MYD10A10.3729.38
MOYD0.56313.54
MTS0.60813.72
MSL0.68814.05
MA0.70614.62
S7MOD10A10.50740.2651.36
MYD10A10.48333.94
MOYD0.53941.13
MTS0.55143.47
MSL0.68446.18
MA0.72146.76
Figure 5 provides an example of snow-cover maps from various Landsat and MODIS composites on 22 February 2003 for region 4. The Khat values are included in Table 5. The lowest value for MYD10A1 (0.089) was associated with a high cloud coverage (84.6%) at 1:30 pm, while it was only 28.6% at 10:30 am. The combined use of MOD10A1 and MYD10A1 (MOYD), however, greatly reduces the cloud coverage to 25.2%, and simultaneously, increases the snow coverage to 51.3%. The final MA image has a snow coverage of 61.3%, which is slightly less than the 65.3% of the Landsat image, which was treated as the ‘‘ground truth’’.
Figure 5. Examples of snow cover maps from Landsat, MODIS and MODIS composites on 22 February 2003 (region S4 of Figure 1).
Remotesensing 07 00169 g005aRemotesensing 07 00169 g005b

4.3. The Timing of Snow Cover Onset and Melt, and Continuous Snow Cover

We first examined the time series of daily snow cover as quantified by the weight ratio (i.e., to quantify the fraction of snow coverage in the study area during the 8 year period) (Figure 6). Annually, the maximum and minimum percentages of snow cover, 41.25% ± 11.7% and 3.54% ± 2.6%, respectively, occurred on 15 February (i.e., the 46th day) and 10 August (i.e., the 220th day) of the year. Snow melt occurred after the 46th day and before the 220th day, and snow onset occurred after the 220th day and before the 46th day of the year. The mean spatial pattern of the onset, melt and continuous period of snow cover for the 8 year period varied among regions (Figure 7).
Figure 6. The weight ratio (Rwi) of snow cover over the course of year. The dots indicate the average Rwi, and the vertical bars are the standard deviation of Rwi during 2003–2010.
Remotesensing 07 00169 g006
Figure 7. Mean spatial patterns of the year of snow cover onset (a); melt (b); and snow cover continuous (c).
Remotesensing 07 00169 g007
The onset of snow cover occurred earlier in the central region of the TP (on the 220th day of the year). While in the north, northeast and southwest areas, the onset of snow cover occurred on the 274 day. Snow melt occurred earlier in the middle and eastern portions of the TP. In the majority of the TP (approximately 70.4%), the period of continuous snow cover is less than 46 days. However, in the northwest and southeast areas, it lasts longer than 200 days. On the TP, the onset/melt/continuous period of snow cover progressed eastward toward low-elevation areas, where no snow cover was observed. Although snow sometimes fell during the winter, the relatively high temperatures cause any snow that intense sublimation under the cold and dry conditions there.does fall to melt within a short time. Similarly, snow was seldom observed to accumulate in dry lands such as the Qaidam Basin (approximately 37–41°N, 91–99°E) because of the limited snowfall and

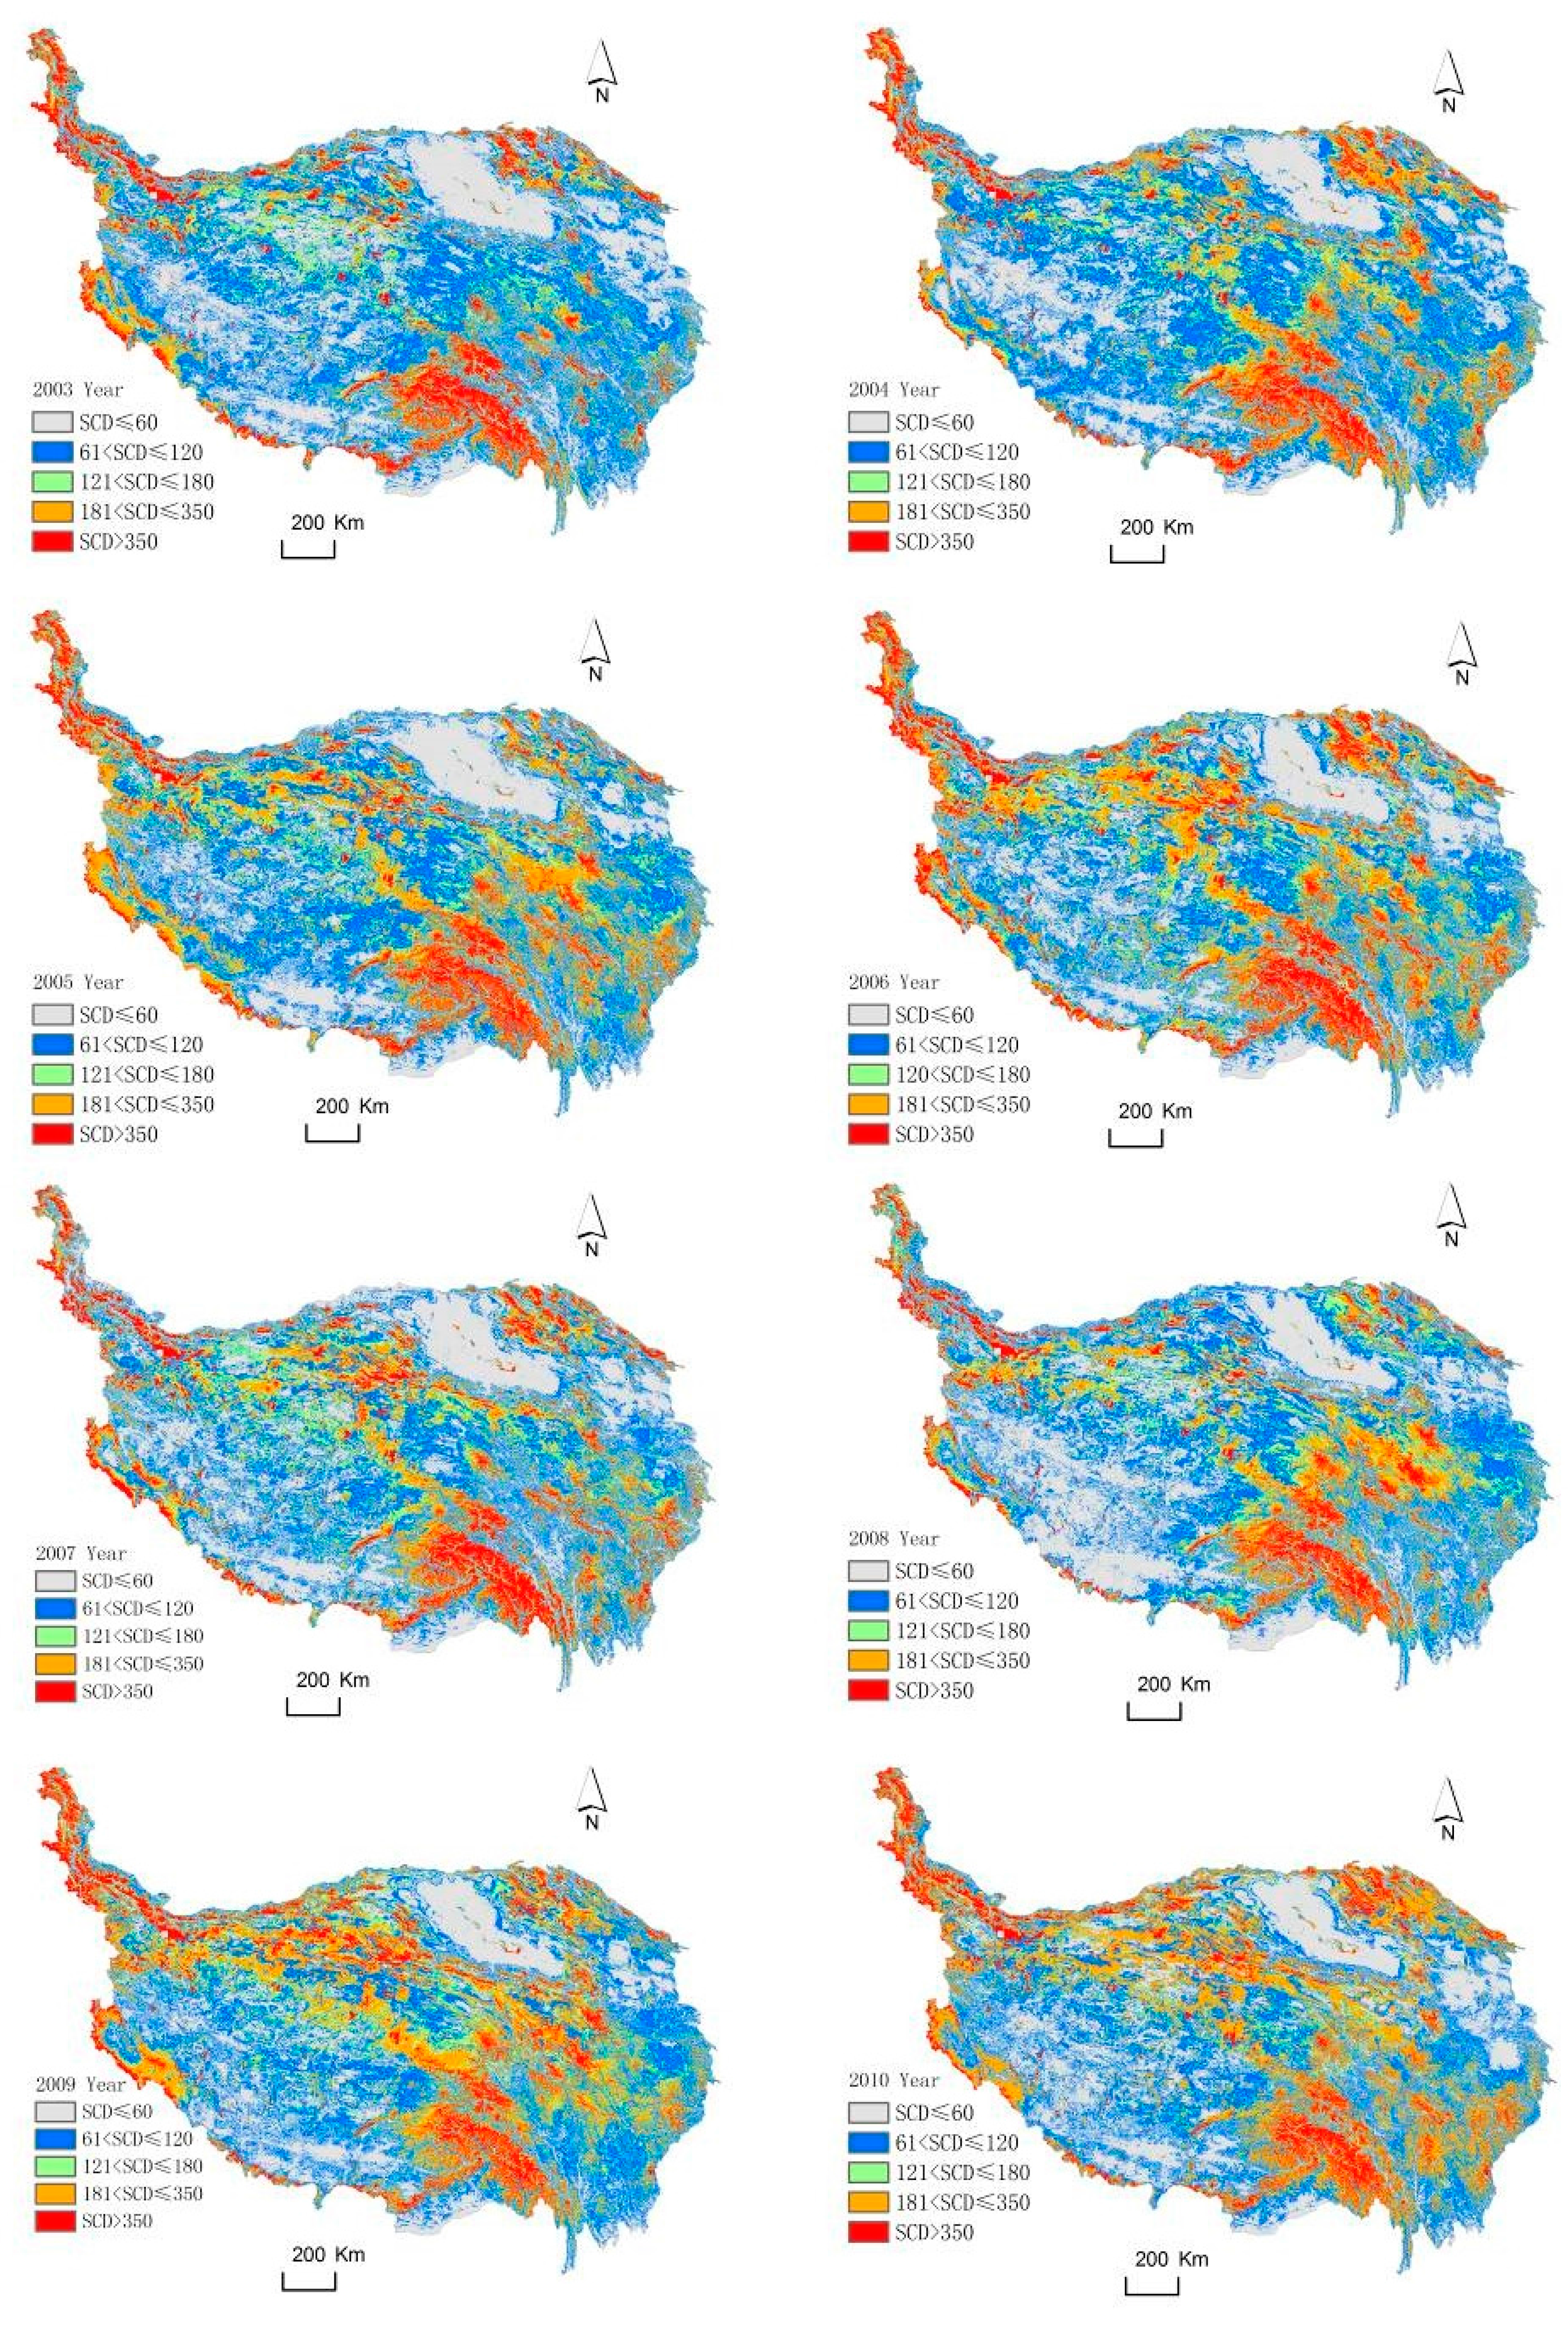
4.4. Tendency of SCD during 2003–2010

An area with a SCD greater than 60 is usually considered as an area that receives repeated snow cover year after year. Those areas are the major sources of snow-melt water resources for numerous large rivers [53]. As shown in Figure 8 and Table 6, the overall spatial distributions from SCD from 2003 to 2010 are actually very similar, with areas with an SCD between 60 and 120 days accounting the most area, followed by the areas with an SCD less than 60 days. Together, these two categories accounted for 71.16% of the total area of the TP in 2003 and 63.44% in 2010, exhibiting a clear decreasing tendency for each category and for the two considered together. The areas with an SCD between 121 and 180 or between 180 and 350 accounted for 12.82% of the total Plateau area in 2003 and 26.90% in 2010, a clear increasing tendency for each category and for the two considered together. The areas with an SCD > 350 can be treated as areas of persistent snow cover or glaciers, and there was a slightly decreasing tendency from 2003 to 2010 for these areas.
Table 6. Area ratio under different snow cover days.
YearArea of SCD (%)
SCD ≤ 6061 < SCD ≤ 120121 < SCD ≤ 180181 < SCD ≤ 350SCD > 350
200330.0341.136.456.3716.03
200430.9540.517.607.6013.34
200529.8840.887.847.1114.33
200629.8339.708.528.9412.01
200728.5339.4310.4510.7110.88
200827.4938.8211.6812.139.88
200926.3238.2811.7414.529.14
201025.7837.6611.4915.419.66
Figure 9 further illustrates the tendency of SCD and its significance level at the pixel scale for the 8 year period. Clearly, majority of the pixels (55.3%) are characterized by a decrease in SCD (S < 0). Although only 5.8% of these decreases were statistically significant (p < 0.05), the majority decreased by over 6 days and were located in the central and southern portions of the TP. In contrast, only 14.9% of pixels were characterized by increases in SCD (S > 0), with only 2.1% of these (in the northwestern TP) statistically significant (p < 0.05). Approximately 39.8% of the pixels were characterized by no change in SCD (S = 0) and are scattered over the entire plateau. Overall, the majority of pixels (55.3%) were characterized by a decreasing tendency for SCD.
Figure 8. Snow covered days (SCD) maps from the daily cloudless snow cover images (i.e., MA) during 2003 to 2010.
Remotesensing 07 00169 g008
Figure 9. Change tendency (days/year) of snow-covered days (SCD) (a) and its significance level (b) in pixel scale during the 8-year period in the TP.
Remotesensing 07 00169 g009

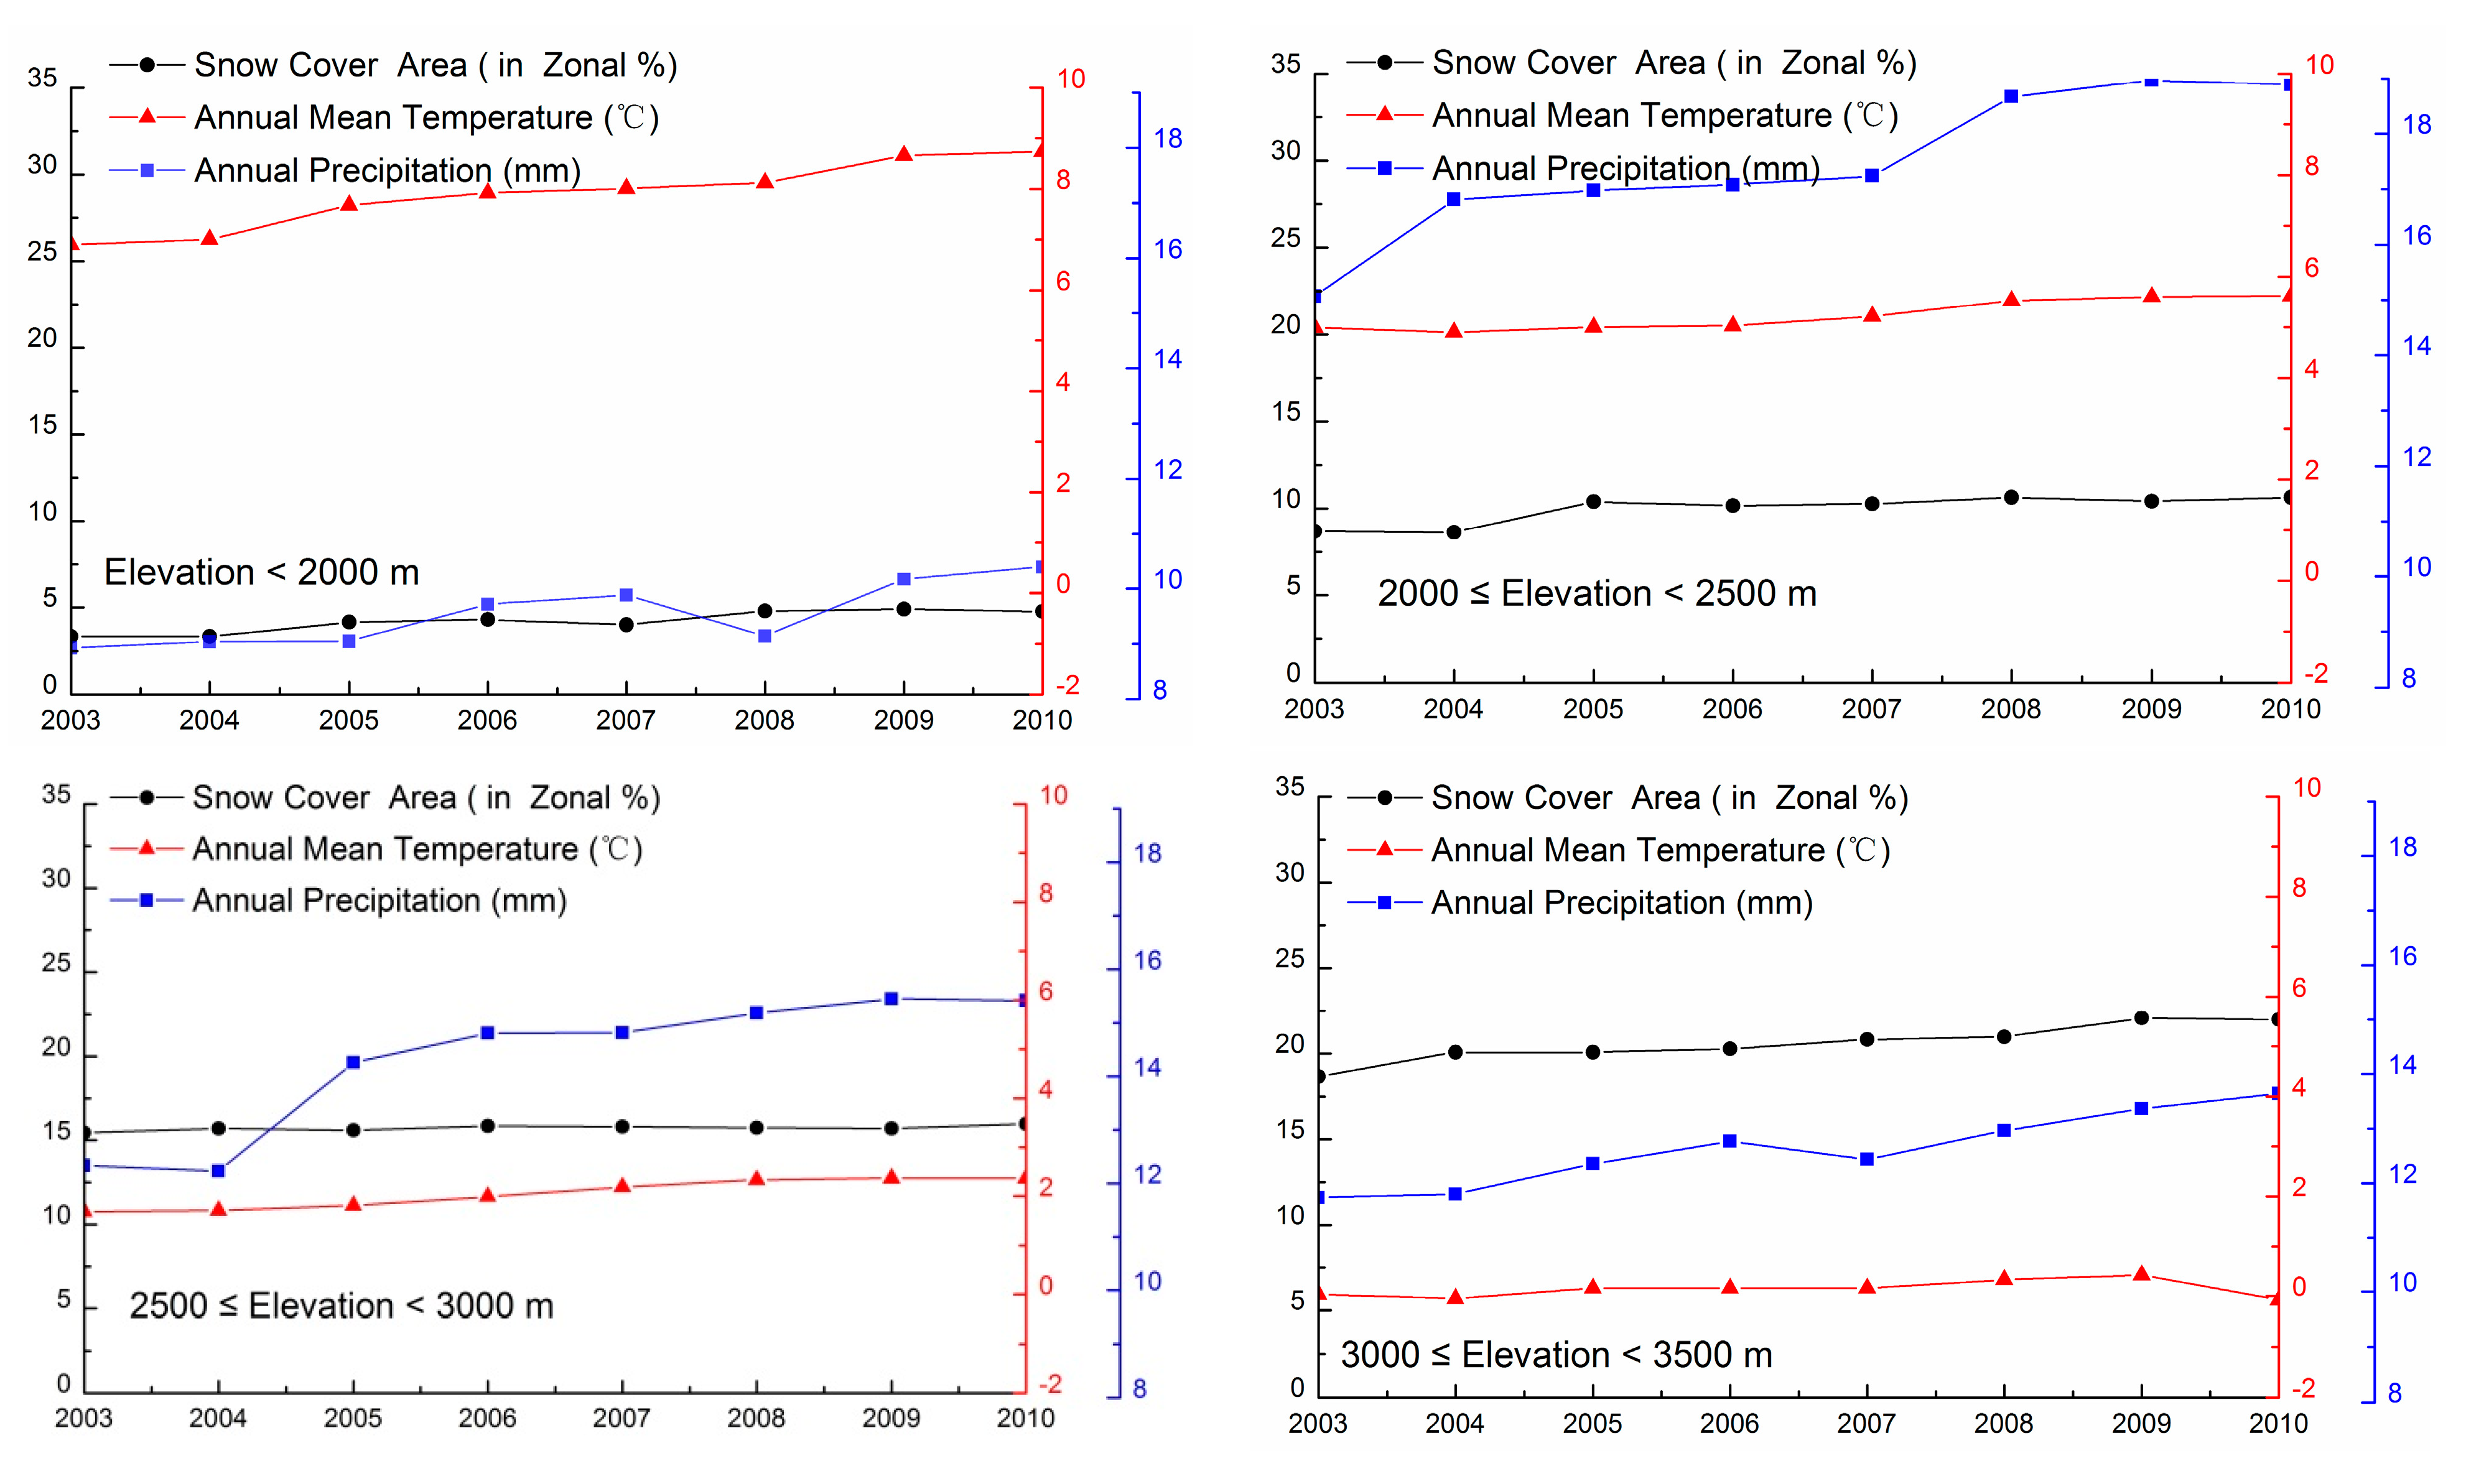
4.5. Spatial-Temporal Variability of Snow-Cover Area and Its Response to Climate Change

The cloud-free MA images were used to analyze the changes in daily snow-cover and its relationships to temperature and precipitation during the period from 2003 to 2010. As shown in Figure 10, snow accumulation mainly starts in September and snow melt starts in April. The maximum snow-cover area occurs between late January and the middle of February each year, with maximum snow coverage of 41.30% (2003), 46.12% (2004), 50.63% (2005), 54.47% (2006), 60.01% (2007), 70.45% (2008), 62.27% (2009), and 65.15% (2010). The lowest snow coverage occurs between middle to late August each year, with minimum coverage of 2.98% (2003), 2.73% (2004), 2.59% (2005), 2.44% (2006), 2.91% (2007), 3.17% (2008), 2.46% (2009), and 2.45% (2010). These results suggest a tendency for a slight increase in the maximum snow coverage and a slight decrease in the minimum snow coverage over the 8 year period. The increase in the maximum SCA might reflect the increases in both the mean precipitation rate (0.26 mm/year, Figure 11) and the maximum precipitation rate (Figure 10b), associated with the increases in mean temperature (at a rate of 0.09 °C/year, Figure 11) and maximum temperature (Figure 10a).
Figure 10. Dynamic changes of daily SCA, daily mean temperature, and daily precipitation from 2003 to 2010.
Remotesensing 07 00169 g010
The decrease in the minimum SCA and the area of persistent snow cover (SCD > 350 days) might indicate an increase in the melting of persistent snow cover and glaciers because of the increase in temperature. The area of persistent snow cover declined at the rate of 1.35% annually from 2003 to 2010, for a total of 9.43%. This finding is consistent with the increase in mean annual temperature of 0.09 °C per year (or 0.75 °C over 8 years). The increase in mean annual precipitation (0.26 mm/year, or 1.8 mm over 8 years), particularly in summer, could also contribute to the summer melting of persistent snow cover (Figure 11).
Further examination of the relationship between the SCA and climate change during the snow season (i.e., September to the next April) holds an important significance. Figure 12 presents the relationships between the SCA (when the SCD > 200) and temperature and precipitation for each of the seven elevation zones. The maximum SCA occurs in the elevation zone over 4500 m, while the minimum SCA occurs in the zone under 2000 m. The zone between 4000 m and 4500 m is the zone with the most rapid increase in SCA. A clear tendency for a decrease in temperature with an increase in elevation increase is evident between the low elevation zone (<2000 m) and the high elevation zone (>4500 m), with the highest rate of increase (0.27 °C per year) in the elevation zone <2000 m and the lowest rate of increase (0.06 °C per year) in the elevation zone between 3000 m and 3500 m. Precipitation increased in all of the elevation zones under 4500 m, while precipitation decreased in the zone over 4500 m. The most rapid rate of increase (0.5 mm/year) was observed in the elevation zone from 2000 to 2500 m.
Figure 11. Relationship among the persistent snow cover area, annual mean temperature, and annual precipitation from 2003 to 2010.
Remotesensing 07 00169 g011
Figure 12. Relationships between SCD and climate change in snow seasons in the 7 elevation zones from 2003 to 2010 in the TP.
Remotesensing 07 00169 g012aRemotesensing 07 00169 g012b

5. Conclusions

Although the snow classification accuracy of MOD10A1 and MYD10A1 are high (greater than 80%) under a clear sky condition, they are strongly affected by clouds. Therefore, it is difficult to accurately monitor the daily change of snow cover distribution using these images (Figure 2).
In this study, the algorithm for the daily cloud-free snow-cover product was examined, after each of the following four steps: Terra and Aqua daily combination (MOYD), adjacent temporal reduction (MTS), SNOWL reclassification (MSL), and MODIS and AMSR-E combination (MA). The accuracy of the products was assessed based on two sets of data, the observations from the 106 meteorological stations and the seven Landsat images. Based on the station data, the snow accuracies and overall accuracies for the clear sky condition of the standard daily MODIS products and the four composite images (MOYD, MTS, MSL, and MA) are all very similar, and the accuracies all gradually increase for all other sky conditions as the cloud cover reduces from MYD/MOD, to MOYD, MTS, MSL, and to MA as shown in Table 4. The snow classification accuracy and the overall classification accuracy of the final images (MA) reach 85.05% and 98.40%, respectively, considerably greater than any of the standard and middle-stage images under all sky conditions and are very similar to or even slightly greater than those of the daily MOD/MYD images for clear sky conditions.
Similar results were also observed using the Landsat images as “ground truth” data, with clear increases in both Khat values and snow cover percentages as the cloud coverage reduces from MYD/MOD, to MOYD, MTS, MSL, and to MA images. Notably, the MYD10A1 images often have both the lowest Khat and snow cover percentage because of the general pattern of higher cloud coverage in the afternoon than in the morning on the TP. This finding is consistent with previous studies conducted on the Colorado Plateau and in Northern Xinjing [16]. In contrast, the snow coverage of the final product (MA) was always the best and the closest to the “ground truth” values of the Landsat images, while the snow coverage were always slightly lower than the “ground truth” values because of the relatively coarse resolution of the MODIS images compared to the Landsat images. This finding indicates that the MODIS snow-cover images tend to underestimate the “true” snow cover, even under the clear sky condition.
The final time series of MA images are then used to produce the SCD and SCA maps. Approximately 55.3% (a significant decline of 5.8%) and 14.9% (a significant increase of 2.1%) of the study area were characterized by decreasing and increasing trends in SCD, respectively. Overall, the majority of the Plateau (55.3%) was characterized by a decreasing tendency for SCD. The overall spatial distribution of SCD was actually very similar from 2003 to 2010. This finding indicates that, although there are numerous spatial and temporal variations in snow cover onset and melt from year to year, the overall pattern of SCD are mostly controlled by the topographic and climate conditions within a given area. Snow cover onset, duration, and melt tended to vary systematically from high to low latitudes, with a tendency toward early/long/late values in elevated areas [35]. Our study findings were consistent with those of a previous satellite-based snow cover study that reported a reduction in SCD from 2000 to 2010 on the TP [53]. However, a longer time series of data should be examined to obtain further definitive conclusions concerning temporal trends. The reason for the differences among those observations remains unclear. This study also determined that the majority of the TP is characterized by SCDs between 60 and 120 days, followed by areas with SCDs less than 60 days. Together, these two categories accounted for 71.16% of the total Plateau area in 2003 and 63.44% in 2010, reflecting a clear decreasing tendency for each category and for the two considered together (as shown in Table 5). The areas with SCDs between 121 and 180 days or between 180 and 350 days accounted for 12.82% of the total Plateau area in 2003 and 26.90% in 2010, reflecting a clear increasing tendency for each category and for the two considered together. The areas with SCDs > 350 were treated as areas of persistent snow cover or glaciers, and there was a slightly decreasing tendency in this area from 2003 to 2010.
The maximum SCA occurs in late January to middle of February each year, with a slight increase over the 8-year period, while the lowest SCA occurs in middle to late August each year, with a slight decrease over the 8-year period. The increase in the maximum SCA might indicate the increase in both the mean annual precipitation (0.26 mm/year) and the maximum daily precipitation rate, associated with the increases in the mean annual temperature (0.09 °C/year) and daily maximum temperature.
The decreases in the minimum SCA and persistent snow-covered area (SCD > 350 days) might indicate the increased melt of persistent snow cover and glaciers because of the increase in temperature (0.09 °C/year). The increase in annual precipitation (0.26 mm/year or 1.8 mm in 8 years) particularly in summer (Figure 11) could also contribute to the summer melting of persistent snow cover.
The SCA dynamics were also analyzed, on the basis of 7 elevation zones, for their relationships with the corresponding precipitation and temperature for each zone. When the elevation < 4500 m, the SCA there were positive relationships between the SCA and both the mean annual temperature and the mean annual precipitation, with the most rapid temperature increase in the zone below 2000 m and the most rapid precipitation increase in the zone between 2000 and 2500 m. For the elevation zone higher than 4500 m, both the SCA and the precipitation decreased, −4.51% and −2.25 mm over the 8-year period, respectively, although the mean annual temperature in this elevation zone increased consistently at 0.07 °C/year. Persistent snow is only present in the areas of DEM ≥ 4500 m, indirectly indicating that the area of persistent snow has decreased. Therefore, our results demonstrate the regional influence of temperature and precipitation on the number of snow-covered days, snow-covered area and the distribution of persistent snow cover.
Our study findings are also consistent with previous studies in that there is no significant trend observed for the snow-covered area of western China since 1957, while the mid-northern hemisphere climate transition since the 1970s has caused a decrease in the number of snow-covered days, and the maximum snow depth of the TP has increased [54,55]. This suggests that the interior of the plateau is undergoing significant changes in snow cover as a product of the changes in the atmospheric circulation in response to the influence of climate. The TP is not only an important area of snow cover in China but also the main pastoral area. The variability in the SCD and the SCA may result in changes to ecosystem and water resources, which can further affect the sustainable development of the local animal husbandry industry.

Acknowledgments

This study was supported by the China State Key Basic Research Project (2013CBA01802), and Chinese National Natural Science Foundation of China (41101337, 31372367, and 31228021), and the Program for Changjiang Scholars and Innovative Research Team in University (IRT13019).

Author Contributions

All authors contributed equally in this work.

Conflicts of Interest

The authors declare no conflict of interest.

References

  1. Pulliainen, J. Mapping of snow water equivalent and snow depth in boreal and sub-arctic zones by assimilating space-borne microwave radiometer data and ground-based observations. Remote Sens. Environ. 2006, 101, 257–269. [Google Scholar] [CrossRef]
  2. Wulder, M.; Nelson, T.; Derksen, C.; Seemann, D. Snow cover variability across central Canada (1978–2002) derived from satellite passive microwave data. Clim. Chang. 2007, 82, 113–130. [Google Scholar] [CrossRef]
  3. Andreadis, K.M.; Lettenmaier, D.P. Assimilating remotely sensed snow observations into a macroscale hydrology model. Adv. Water Resour. 2006, 29, 872–886. [Google Scholar] [CrossRef]
  4. Clark, M.P.; Slater, A.G.; Barrett, A.P.; Hay, L.E.; McCabe, G.J.; Rajagopalan, B.; Leavesley, G.H. Assimilation of snow covered area information into hydrologic and land-surface models. Adv. Water Resour. 2006, 29, 1209–1221. [Google Scholar] [CrossRef]
  5. Grayson, R.B.; Blöschl, G.; Western, A.W.; McMahon, T.A. Advances in the use of observed spatial patterns of catchment hydrological response. Adv. Water Resour. 2002, 25, 1313–1334. [Google Scholar] [CrossRef]
  6. Hall, D.K.; Foster, J.L.; DiGirolamo, N.E.; Riggs, G.A. Snow cover, snowmelt timing and stream power in the Wind River Range, Wyoming. Geomorphology 2012, 137, 87–93. [Google Scholar] [CrossRef]
  7. Lopez, P.; Sirguey, P.; Arnaud, Y.; Pouyaud, B.; Chevallier, P. Snow cover monitoring in the Northern Patagonia Icefield using MODIS satellite images (2000–2006). Glob. Planet Chang. 2008, 61, 103–116. [Google Scholar] [CrossRef]
  8. Parajka, J.; Blöschl, G. The value of MODIS snow cover data in validating and calibrating conceptual hydrologic models. J. Hydrol. 2008, 358, 240–258. [Google Scholar] [CrossRef]
  9. Tekeli, A.E.; Akyürek, Z.; Arda Şorman, A.; Şensoy, A.; Ünal; Şorman, A. Using MODIS snow cover maps in modeling snowmelt runoff process in the eastern part of Turkey. Remote Sens. Environ. 2005, 97, 216–230. [Google Scholar] [CrossRef]
  10. Hall, D.K.; Riggs, G.A. Accuracy assessment of the MODIS snow products. Hydrol. Process. 2007, 21, 1534–1547. [Google Scholar] [CrossRef]
  11. Liang, T.G.; Huang, X.D.; Wu, C.X.; Liu, X.Y.; Li, W.L.; Guo, Z.G.; Ren, J.Z. An application of MODIS data to snow cover monitoring in a pastoral area: A case study in Northern Xinjiang, China. Remote Sens. Environ. 2008, 112, 1514–1526. [Google Scholar] [CrossRef]
  12. Wang, X.; Xie, H. New methods for studying the spatiotemporal variation of snow cover based on combination products of MODIS Terra and Aqua. J. Hydrol. 2009, 371, 192–200. [Google Scholar]
  13. Wang, X.; Xie, H.; Liang, T. Evaluation of MODIS snow cover and cloud mask and its application in Northern Xinjiang, China. Remote Sens. Environ. 2008, 112, 1497–1513. [Google Scholar] [CrossRef]
  14. Hall, D.K.; Riggs, G.A.; Foster, J.L.; Kumar, S.V. Development and evaluation of a cloud-gap-filled MODIS daily snow-cover product. Remote Sens. Environ. 2010, 114, 496–503. [Google Scholar] [CrossRef]
  15. Liang, T.; Zhang, X.; Xie, H.; Wu, C.; Feng, Q.; Huang, X.; Chen, Q. Toward improved daily snow cover mapping with advanced combination of MODIS and AMSR-E measurements. Remote Sens. Environ. 2008, 112, 3750–3761. [Google Scholar] [CrossRef]
  16. Xie, H.; Wang, X.; Liang, T. Development and assessment of combined Terra and Aqua snow cover products in Colorado Plateau, USA and northern Xinjiang, China. J. Appl. Remote Sens. 2009. [Google Scholar] [CrossRef]
  17. Gafurov, A.; Bárdossy, A. Cloud removal methodology from MODIS snow cover product. Hydrol. Earth Syst. Sci. 2009, 13, 1361–1373. [Google Scholar] [CrossRef]
  18. Gao, Y.; Lu, N.; Yao, T. Evaluation of a cloud-gap-filled MODIS daily snow cover product over the Pacific Northwest USA. J. Hydrol. 2011, 404, 157–165. [Google Scholar] [CrossRef]
  19. Parajka, J.; Pepe, M.; Rampini, A.; Rossi, S.; Blöschl, G. A regional snow-line method for estimating snow cover from MODIS during cloud cover. J. Hydrol. 2010, 381, 203–212. [Google Scholar] [CrossRef]
  20. Foster, J.; Hall, D.K.; Eylander, J.B.; Kim, E.; Riggs, G.A.; Tedesco, M.; Nghiem, S.; Kelly, R.; Choudhury, B.; Reichle, R.; et al. Blended visible, passive microwave and scatterometer global snow products. In Proceedings of the 64th Eastern Snow Conference, St.John’s, NL, Canada, 29 May–1 June 2007.
  21. Foster, J.L.; Hall, D.K.; Eylander, J.B.; Riggs, G.A.; Nghiem, S.V.; Tedesco, M.; Kim, E.; Montesano, P.M.; Kelly, R.E.J.; Casey, K.A.; et al. A blended global snow product using visible, passive microwave and scatterometer satellite data. Int. J. Remote Sens. 2011, 32, 1371–1395. [Google Scholar]
  22. Paudel, K.P.; Andersen, P. Monitoring snow cover variability in an agropastoral area in the Trans Himalayan region of Nepal using MODIS data with improved cloud removal methodology. Remote Sens. Environ. 2011, 115, 1234–1246. [Google Scholar] [CrossRef]
  23. Painter, T.H.; Rittger, K.; McKenzie, C.; Slaughter, P.; Davis, R.E.; Dozier, J. Retrieval of subpixel snow covered area, grain size, and albedo from MODIS. Remote Sens. Environ. 2009, 113, 868–879. [Google Scholar] [CrossRef]
  24. Huang, X.D.; Hao, X.H.; Feng, Q.S.; Wang, W.; Liang, T.G. A new MODIS daily cloud free snow cover mapping algorithm on the Tibetan Plateau. Sci. Cold Arid Reg. 2014, 6, 0116–0123. [Google Scholar]
  25. Bavay, M.; Grünewald, T.; Lehning, M. Response of snow cover and runoff to climate change in high Alpine catchments of Eastern Switzerland. Adv. Water Resour. 2013, 55, 4–16. [Google Scholar]
  26. Crawford, C.J.; Manson, S.M.; Bauer, M.E.; Hall, D.K. Multitemporal snow cover mapping in mountainous terrain for Landsat climate data record development. Remote Sens. Environ. 2013, 135, 224–233. [Google Scholar] [CrossRef]
  27. Liston, G.E. Interrelationships among snow distribution, snowmelt, and snow cover depletion: Implications for atmospheric, hydrologic, and ecologic modeling. J. Appl. Meteorol. 1999, 38, 1474–1487. [Google Scholar] [CrossRef]
  28. Liston, G.E.; Sturm, M. Winter precipitation patterns in arctic Alaska determined from a blowing-snow model and snow-depth observations. J. Hydrometeorol. 2002, 3, 646–659. [Google Scholar] [CrossRef]
  29. Xu, B.; Cao, J.; Hansen, J.; Yao, T.; Joswia, D.R.; Wang, N.; Wu, G.; Wang, M.; Zhao, H.; Yang, W.; et al. Black soot and the survival of Tibetan glaciers. Proc. Natl. Acad. Sci. USA 2009, 106, 22114–22118. [Google Scholar] [CrossRef]
  30. Singh, S.K.; Rathore, B.P.; Bahuguna, I.M. Ajai. Snow cover variability in the Himalayan-Tibetan region. Int. J. Climatol. 2014, 34, 446–452. [Google Scholar]
  31. Lee, W.S.; Bhawar, R.L.; Kim, M.K.; Sang, J. Study of aerosol effect on accelerated snow melting over the Tibetan Plateau during boreal spring. Atmos. Environ. 2013, 75, 113–122. [Google Scholar] [CrossRef]
  32. You, Q.; Kang, S.; Pepin, N.; Flügel, W.A.; Sanchez-Lorenzo, A.; Yan, Y.; Zhang, Y. Climate warming and associated changes in atmospheric circulation in the eastern and central Tibetan Plateau from a homogenized dataset. Glob. Planet Chang. 2010, 72, 11–24. [Google Scholar] [CrossRef]
  33. Cuo, L.; Zhang, Y.; Wang, Q.; Zang, L.; Zhou, B.; Hao, Z.; Su, F. Climate change on the northern Tibetan Plateau during 1957–2009: Spatial patterns and possible mechanisms. J. Clim. 2013, 26, 85–109. [Google Scholar] [CrossRef]
  34. Si, D.; Ding, Y. Decadal change in the correlation pattern between the Tibetan Plateau winter snow and the East Asian summer precipitation during 1979–2011. J. Clim. 2013, 26, 7622–7634. [Google Scholar] [CrossRef]
  35. Han, L.; Tsunekawa, A.; Tsubo, M.; He, C.; Shen, M. Spatial variations in snow cover and seasonally frozen ground over northern China and Mongolia, 1988–2010. Glob. Planet Chang. 2014, 116, 139–148. [Google Scholar] [CrossRef]
  36. Maskey, S.; Uhlenbrook, S.; Ojha, S. An analysis of snow cover changes in the Himalayan region using MODIS snow products and in-situ temperature data. Clim. Chang. 2011, 108, 391–400. [Google Scholar] [CrossRef]
  37. Mukhopadhyay, B. Signature and hydrologic consequences of climate change within the upper-middle Brahmaputra Basin. Hydrol. Process. 2013, 27, 2126–2143. [Google Scholar] [CrossRef]
  38. Zhang, Y.; Li, B.; Zhang, D. A discussion on the boundary and area of the Tibetan Plateau in China. Geogr. Res. 2002, 21, 1–8. [Google Scholar]
  39. Yao, T.; Thompson, L.; Yang, W.; Yu, W.; Gao, Y.; Guo, X.; Yang, X.; Duan, K.; Zhao, H.; Xu, B.; et al. Different glacier status with atmospheric circulations in Tibetan Plateau and surroundings. Nat. Clim. Chang. 2012, 2, 663–667. [Google Scholar]
  40. Wang, W.; Liang, T.; Huang, X.; Feng, Q.; Xie, H.; Liu, X.; Chen, M.; Wang, X. Early warning of snow-caused disasters in pastoral areas on the Tibetan Plateau. Nat. Hazard. Earth Syst. Sci. 2013, 13, 1411–1425. [Google Scholar] [CrossRef]
  41. Gao, J.; Williams, M.W.; Fu, X.; Wang, G.; Gong, T. Spatiotemporal distribution of snow in eastern Tibet and the response to climate change. Remote Sens. Environ. 2012, 121, 1–9. [Google Scholar] [CrossRef]
  42. Kang, S.; Xu, Y.; You, Q.; Flügel, W.A.; Pepin, N.; Yao, T. Review of climate and cryospheric change in the Tibetan Plateau. Environ. Res. Lett. 2010. [Google Scholar] [CrossRef]
  43. Rodriguez, E.; Morris, C.; Belz, E. A global assessment of the (SRTM) performance. Photogramm. Eng. Remote Sens. 2006, 72, 249–260. [Google Scholar] [CrossRef]
  44. Huang, X.; Xie, H.; Liang, T.; Yi, D. Estimating vertical error of SRTM and map-based DEMs using ICESat altimetry data in the eastern Tibetan Plateau. Int. J. Remote Sens. 2011, 32, 5177–5196. [Google Scholar] [CrossRef]
  45. Hall, D.K.; Riggs, G.A.; Salomonson, V.V. Development of methods for mapping global snow cover using moderate resolution imaging spectroradiometer data. Remote Sens. Environ. 1995, 54, 127–140. [Google Scholar] [CrossRef]
  46. Scaramuzza, P.; Micijevic, E.; Chander, G. SLC Gap-Filled Products: Phase One Methodology. Available online: http://landsat.usgs.gov/documents/SLC_Gap_Fill_Methodology.pdf (accessed on 19 December 2014).
  47. Hall, D.K.; Riggs, G.A.; Salomonson, V.V.; DiGirolamo, N.E.; Bayr, K.J. MODIS snow-cover products. Remote Sens. Environ. 2002, 83, 181–194. [Google Scholar] [CrossRef]
  48. Klein, A.G.; Barnett, A.C. Validation of daily MODIS snow cover maps of the Upper Rio Grande River Basin for the 2000–2001 snow year. Remote Sens. Environ. 2003, 86, 162–176. [Google Scholar] [CrossRef]
  49. Fleiss, J.L.; Cohen, J. The equivalence of weighted kappa and the intraclass correlation coefficient as measures of reliability. Educ. Psychol. Meas. 1973, 33, 613–619. [Google Scholar] [CrossRef]
  50. Cohen, J. A coefficient of agreement for nominal scales. Educ. Psychol. Meas. 1960, 20, 37–46. [Google Scholar] [CrossRef]
  51. Visser, H.; Nijs, T.D. The map comparison kit. Environ. Model. Softw. 2006, 21, 346–358. [Google Scholar] [CrossRef]
  52. Stow, D.A.; Hope, A.; McGuire, D.; Verbyla, D.; Gamon, J.; Huemmrich, F.; Houston, S.; Racine, C.; Sturm, M.; Tape, K.; et al. Remote sensing of vegetation and land-cover change in Arctic Tundra Ecosystems. Remote Sens. Environ. 2004, 89, 281–308. [Google Scholar]
  53. Tang, Z.; Wang, J.; Li, H.; Yan, L. Spatiotemporal changes of snow cover over the Tibetan plateau based on cloud-removed moderate resolution imaging spectroradiometer fractional snow cover product from 2001 to 2011. J. Appl. Remote Sens. 2013. [Google Scholar] [CrossRef]
  54. Qin, D.; Liu, S.; Li, P. Snow cover distribution, variability, and response to climate change in western China. J. Clim. 2006, 19, 1820–1833. [Google Scholar] [CrossRef]
  55. Zhang, Y.; Li, T.; Wang, B. Decadal change of the spring snow depth over the Tibetan Plateau: The associated circulation and influence on the East Asian Summer Monsoon. J. Clim. 2004, 17, 2780–2793. [Google Scholar] [CrossRef]

