
Soil Drought Anomalies in MODIS GPP of a Mediterranean Broadleaved Evergreen Forest


Abstract
:
1. Introduction
2. Material and Methods
2.1. Study Area
2.2. Flux and Ancillary Data
2.3. MODIS Land Products Subsets
2.4. Modeling Soil Water Balance and Daily Course of Relative Water Content
3. Results
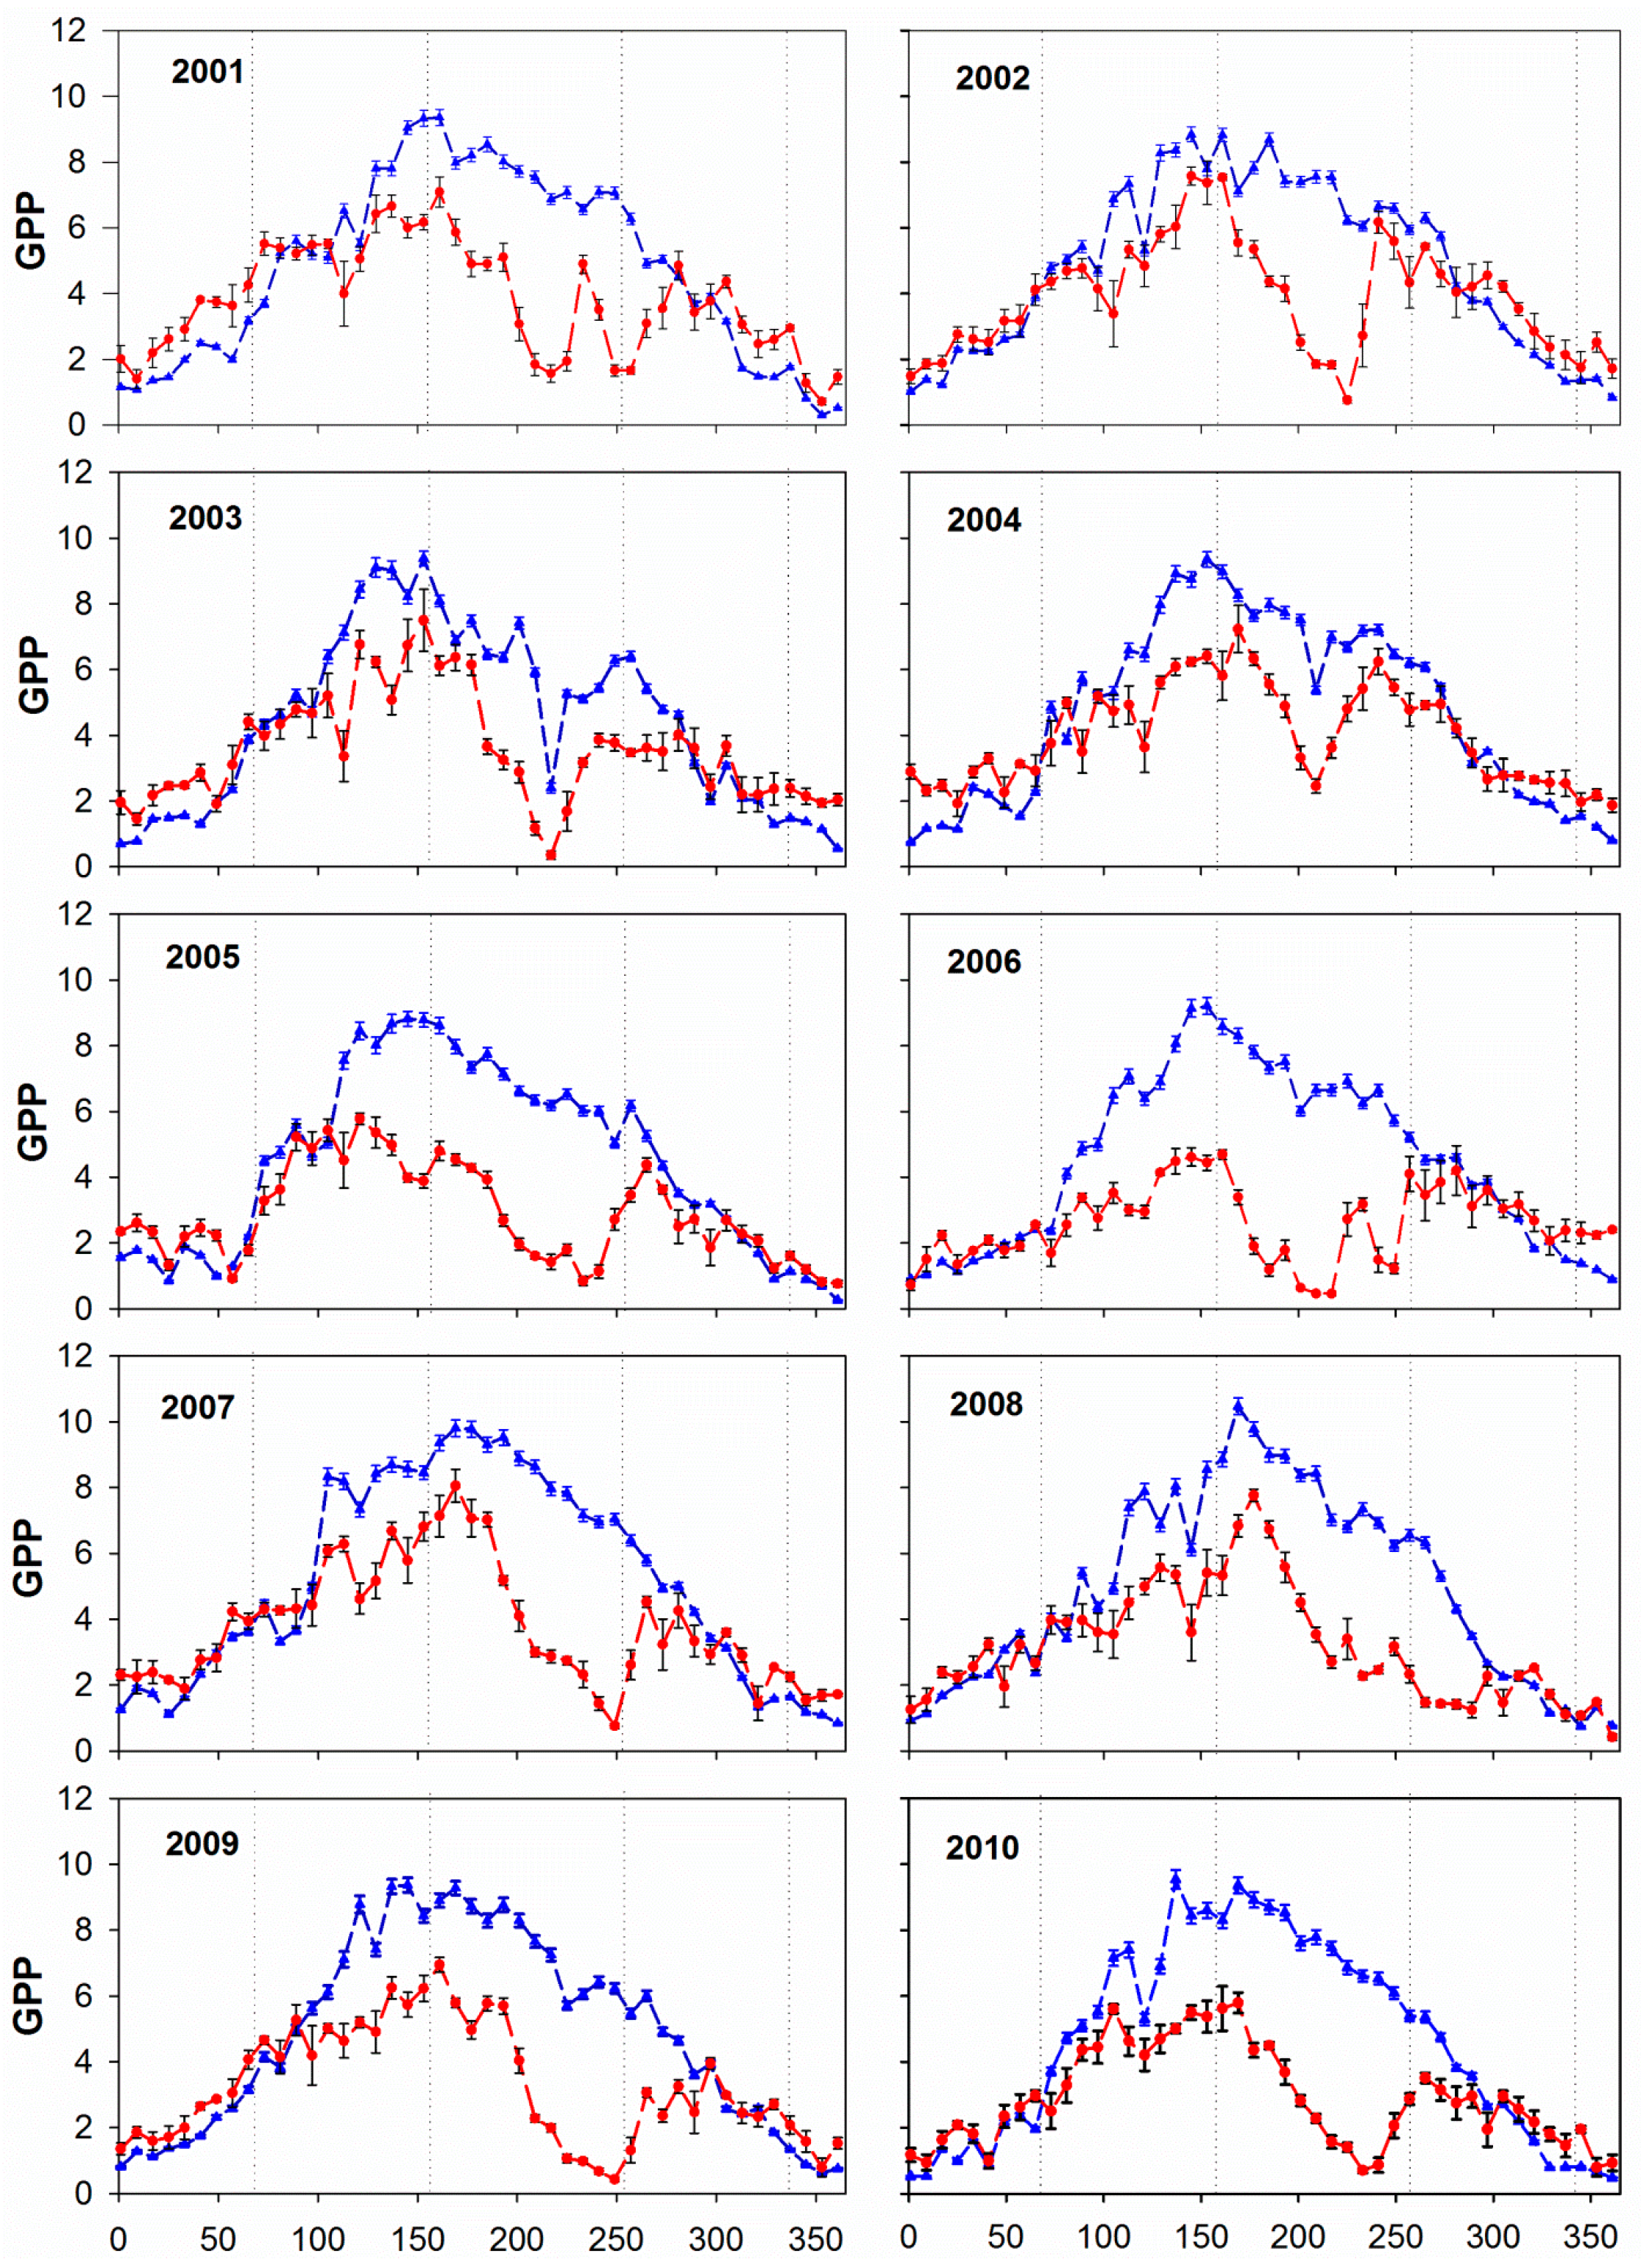
3.1. Annual and Seasonal Pattern of GPP: Comparing MOD17A2 with EC


| Year | 2001 | 2002 | 2003 | 2004 | 2005 | 2006 | 2007 | 2008 | 2009 | 2010 |
| R | 0.59 | 0.66 | 0.77 | 0.87 | 0.66 | 0.36 | 0.70 | 0.79 | 0.66 | 0.69 |
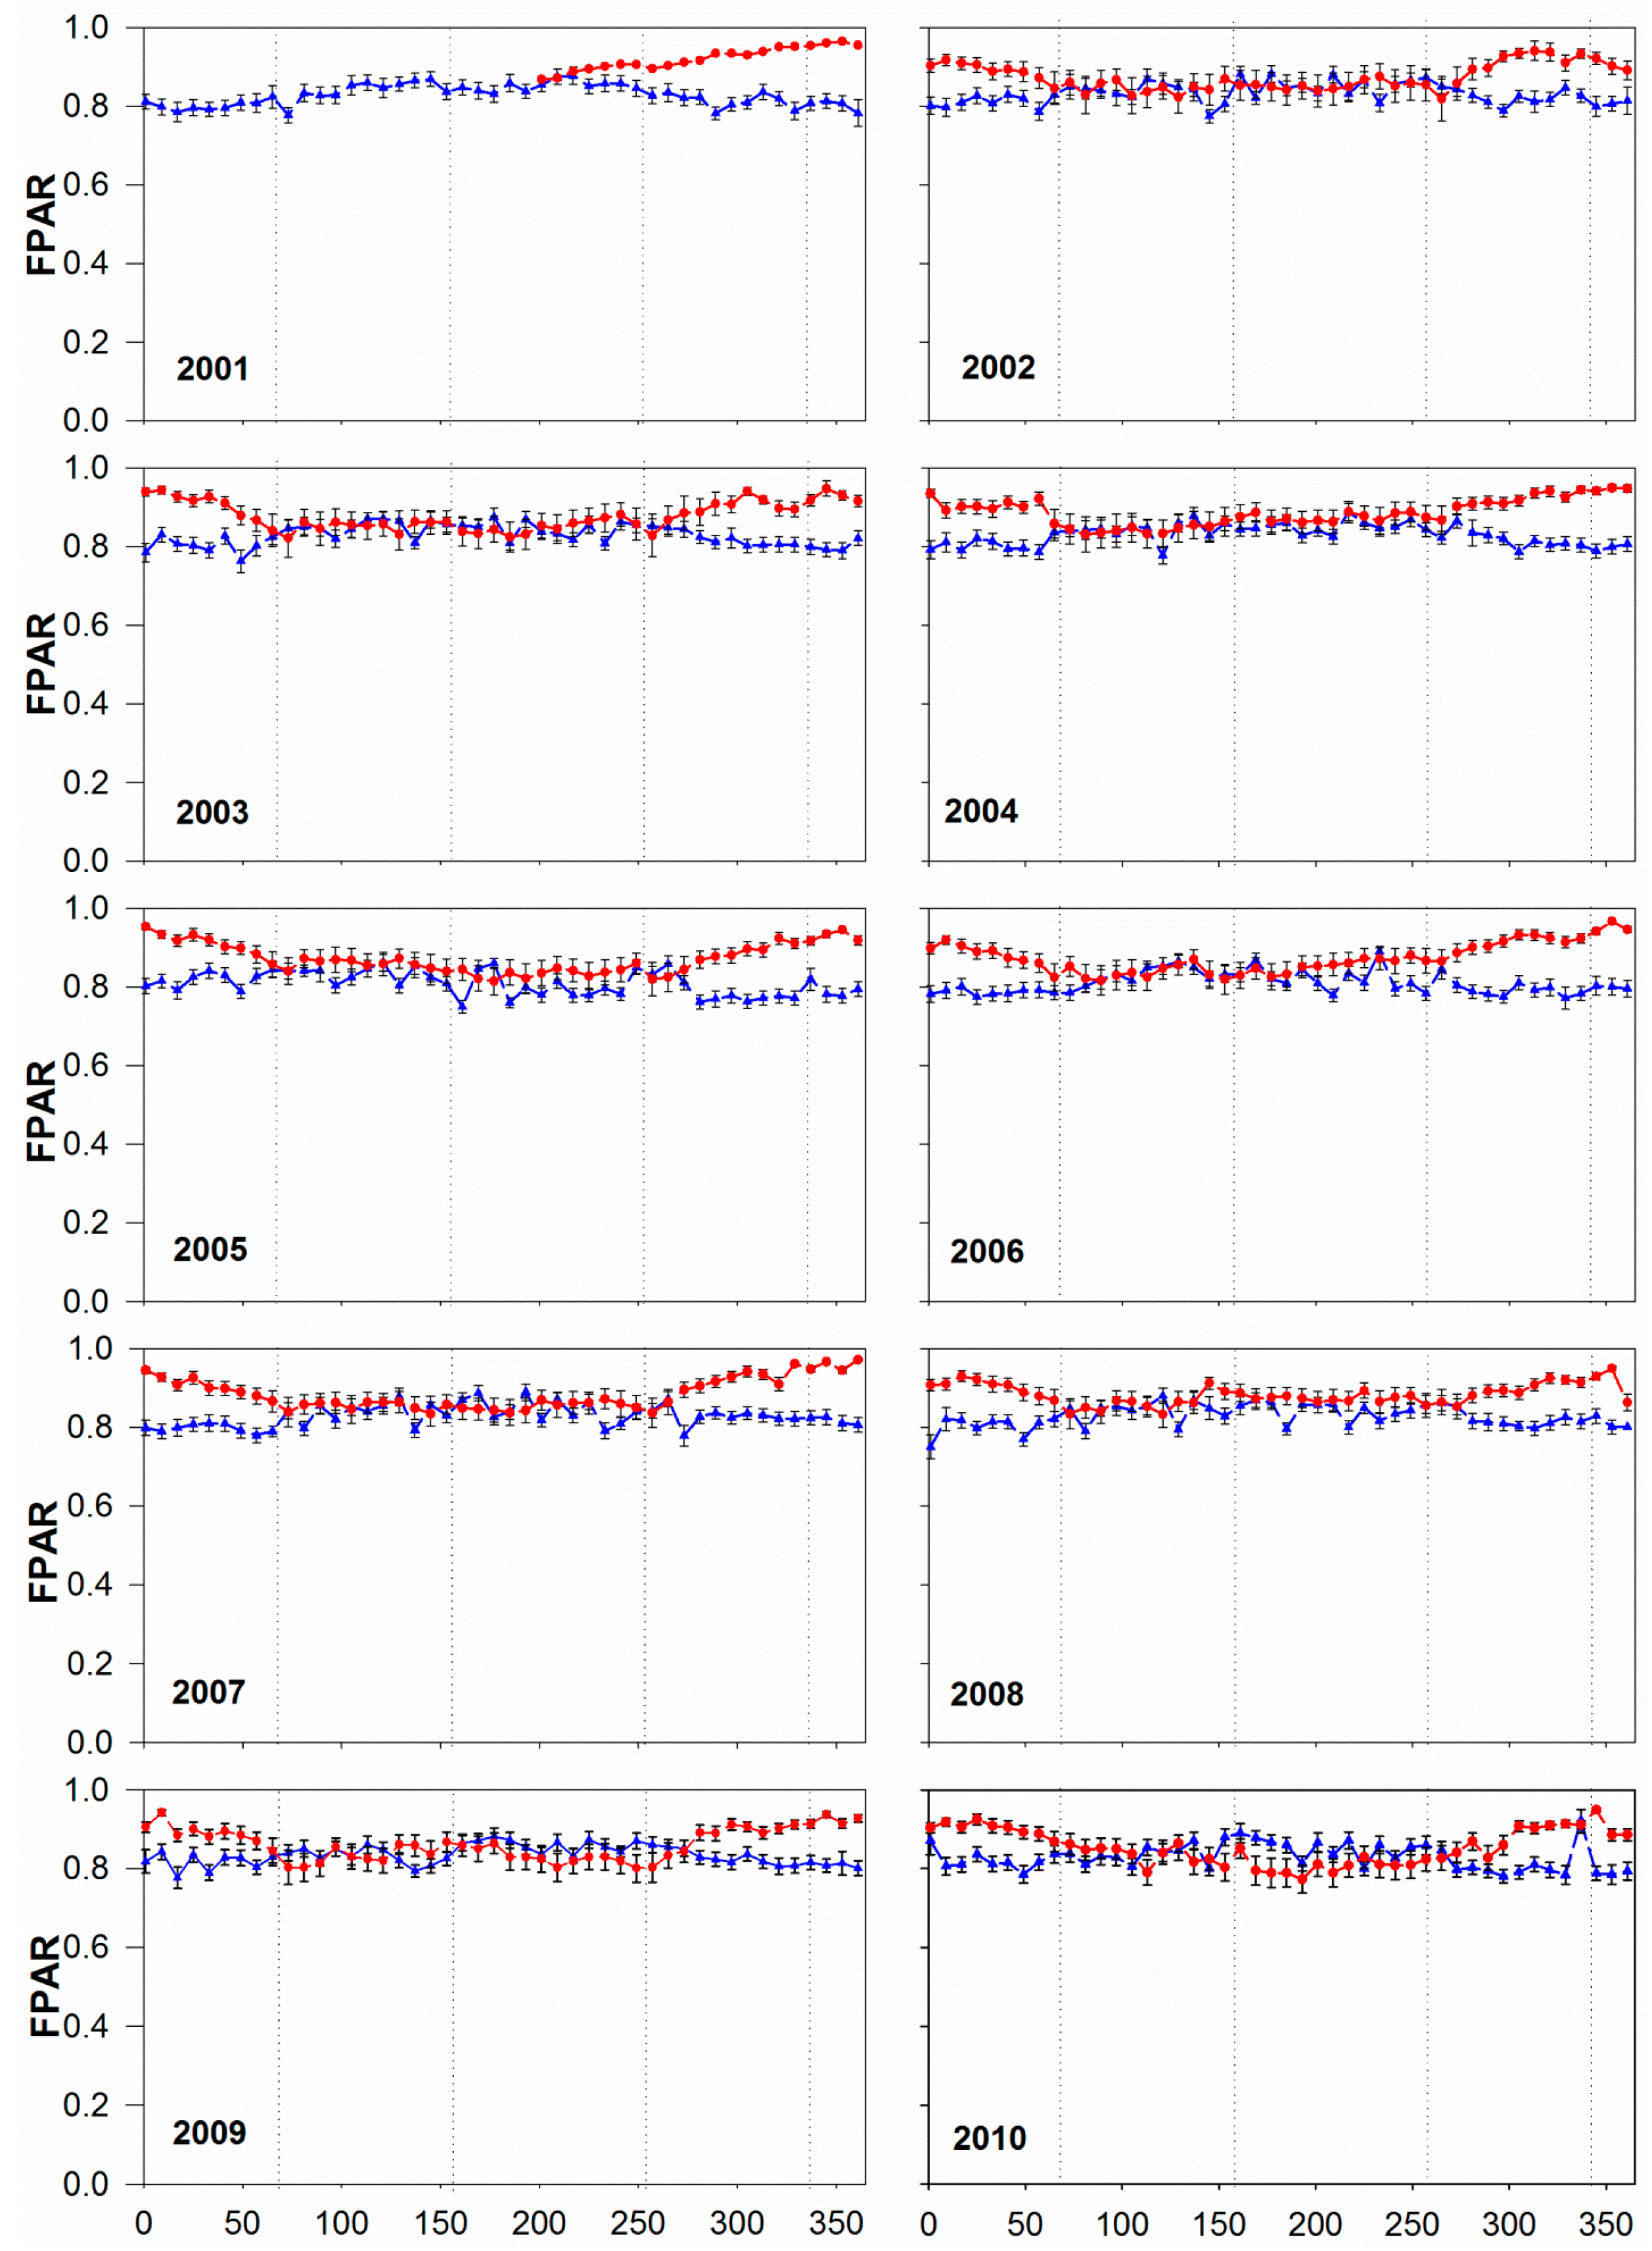
3.2. Annual and Seasonal Pattern of FPAR: Comparing MOD15A2 with Tower
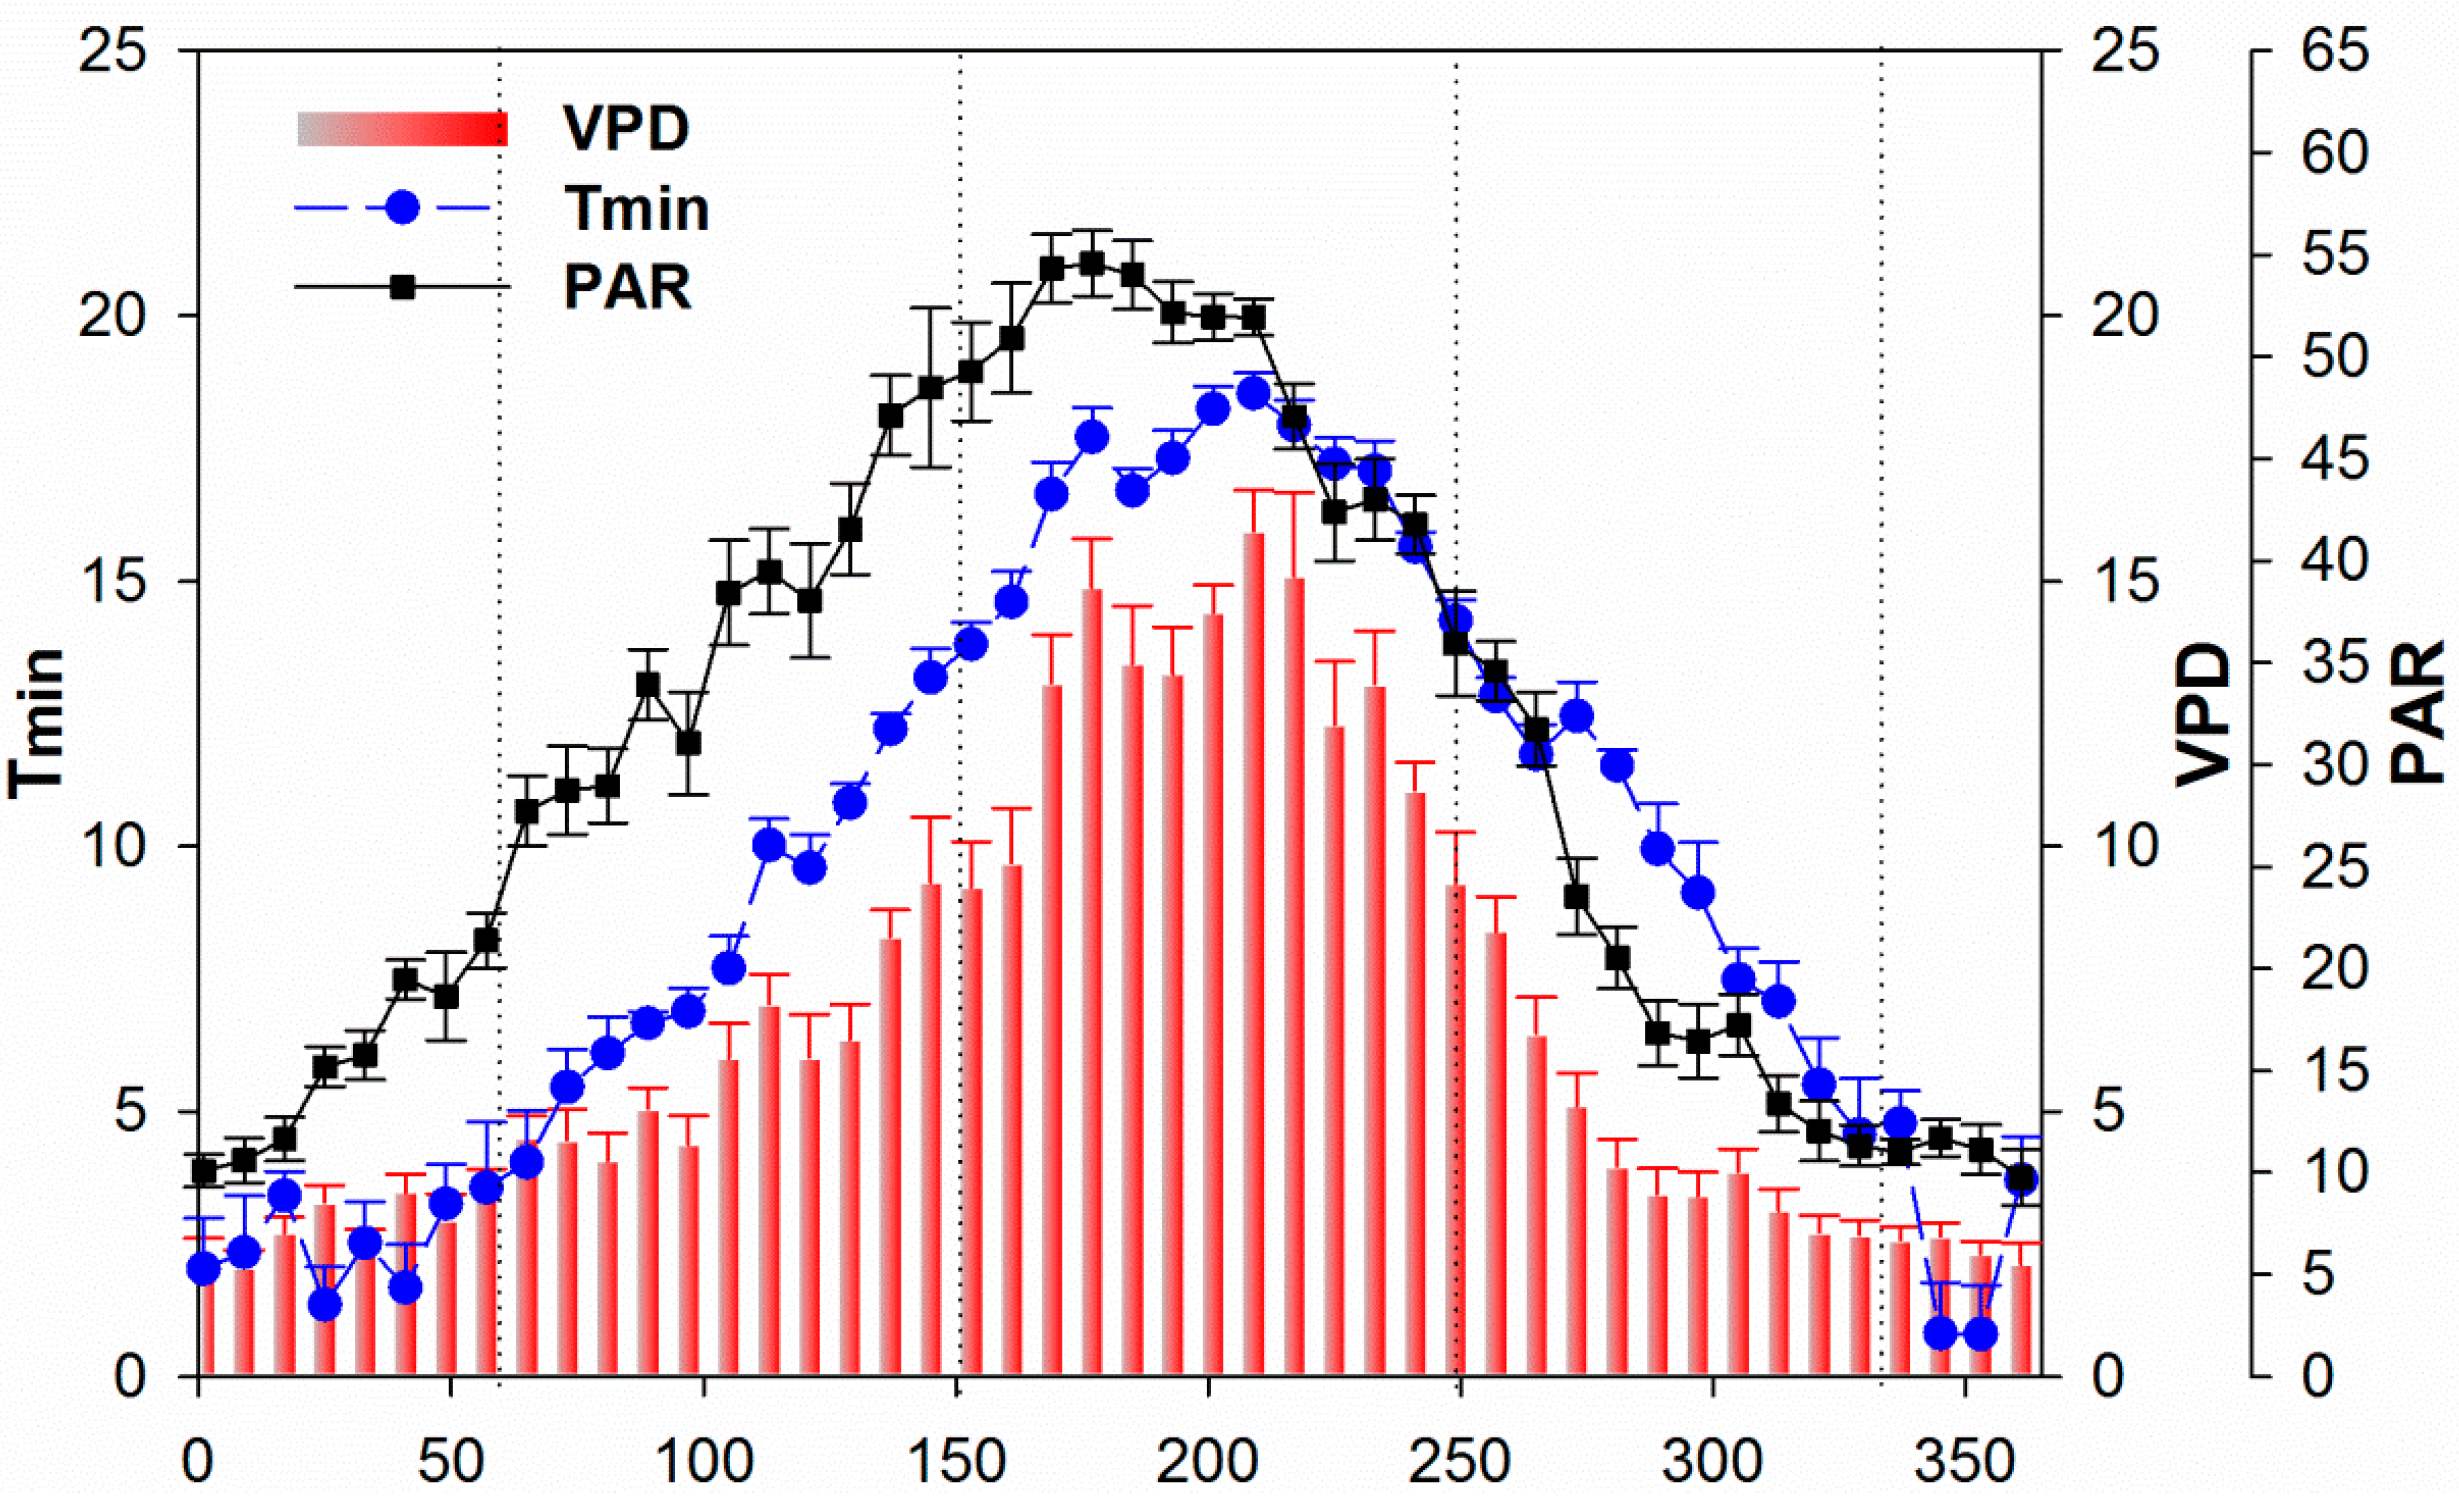
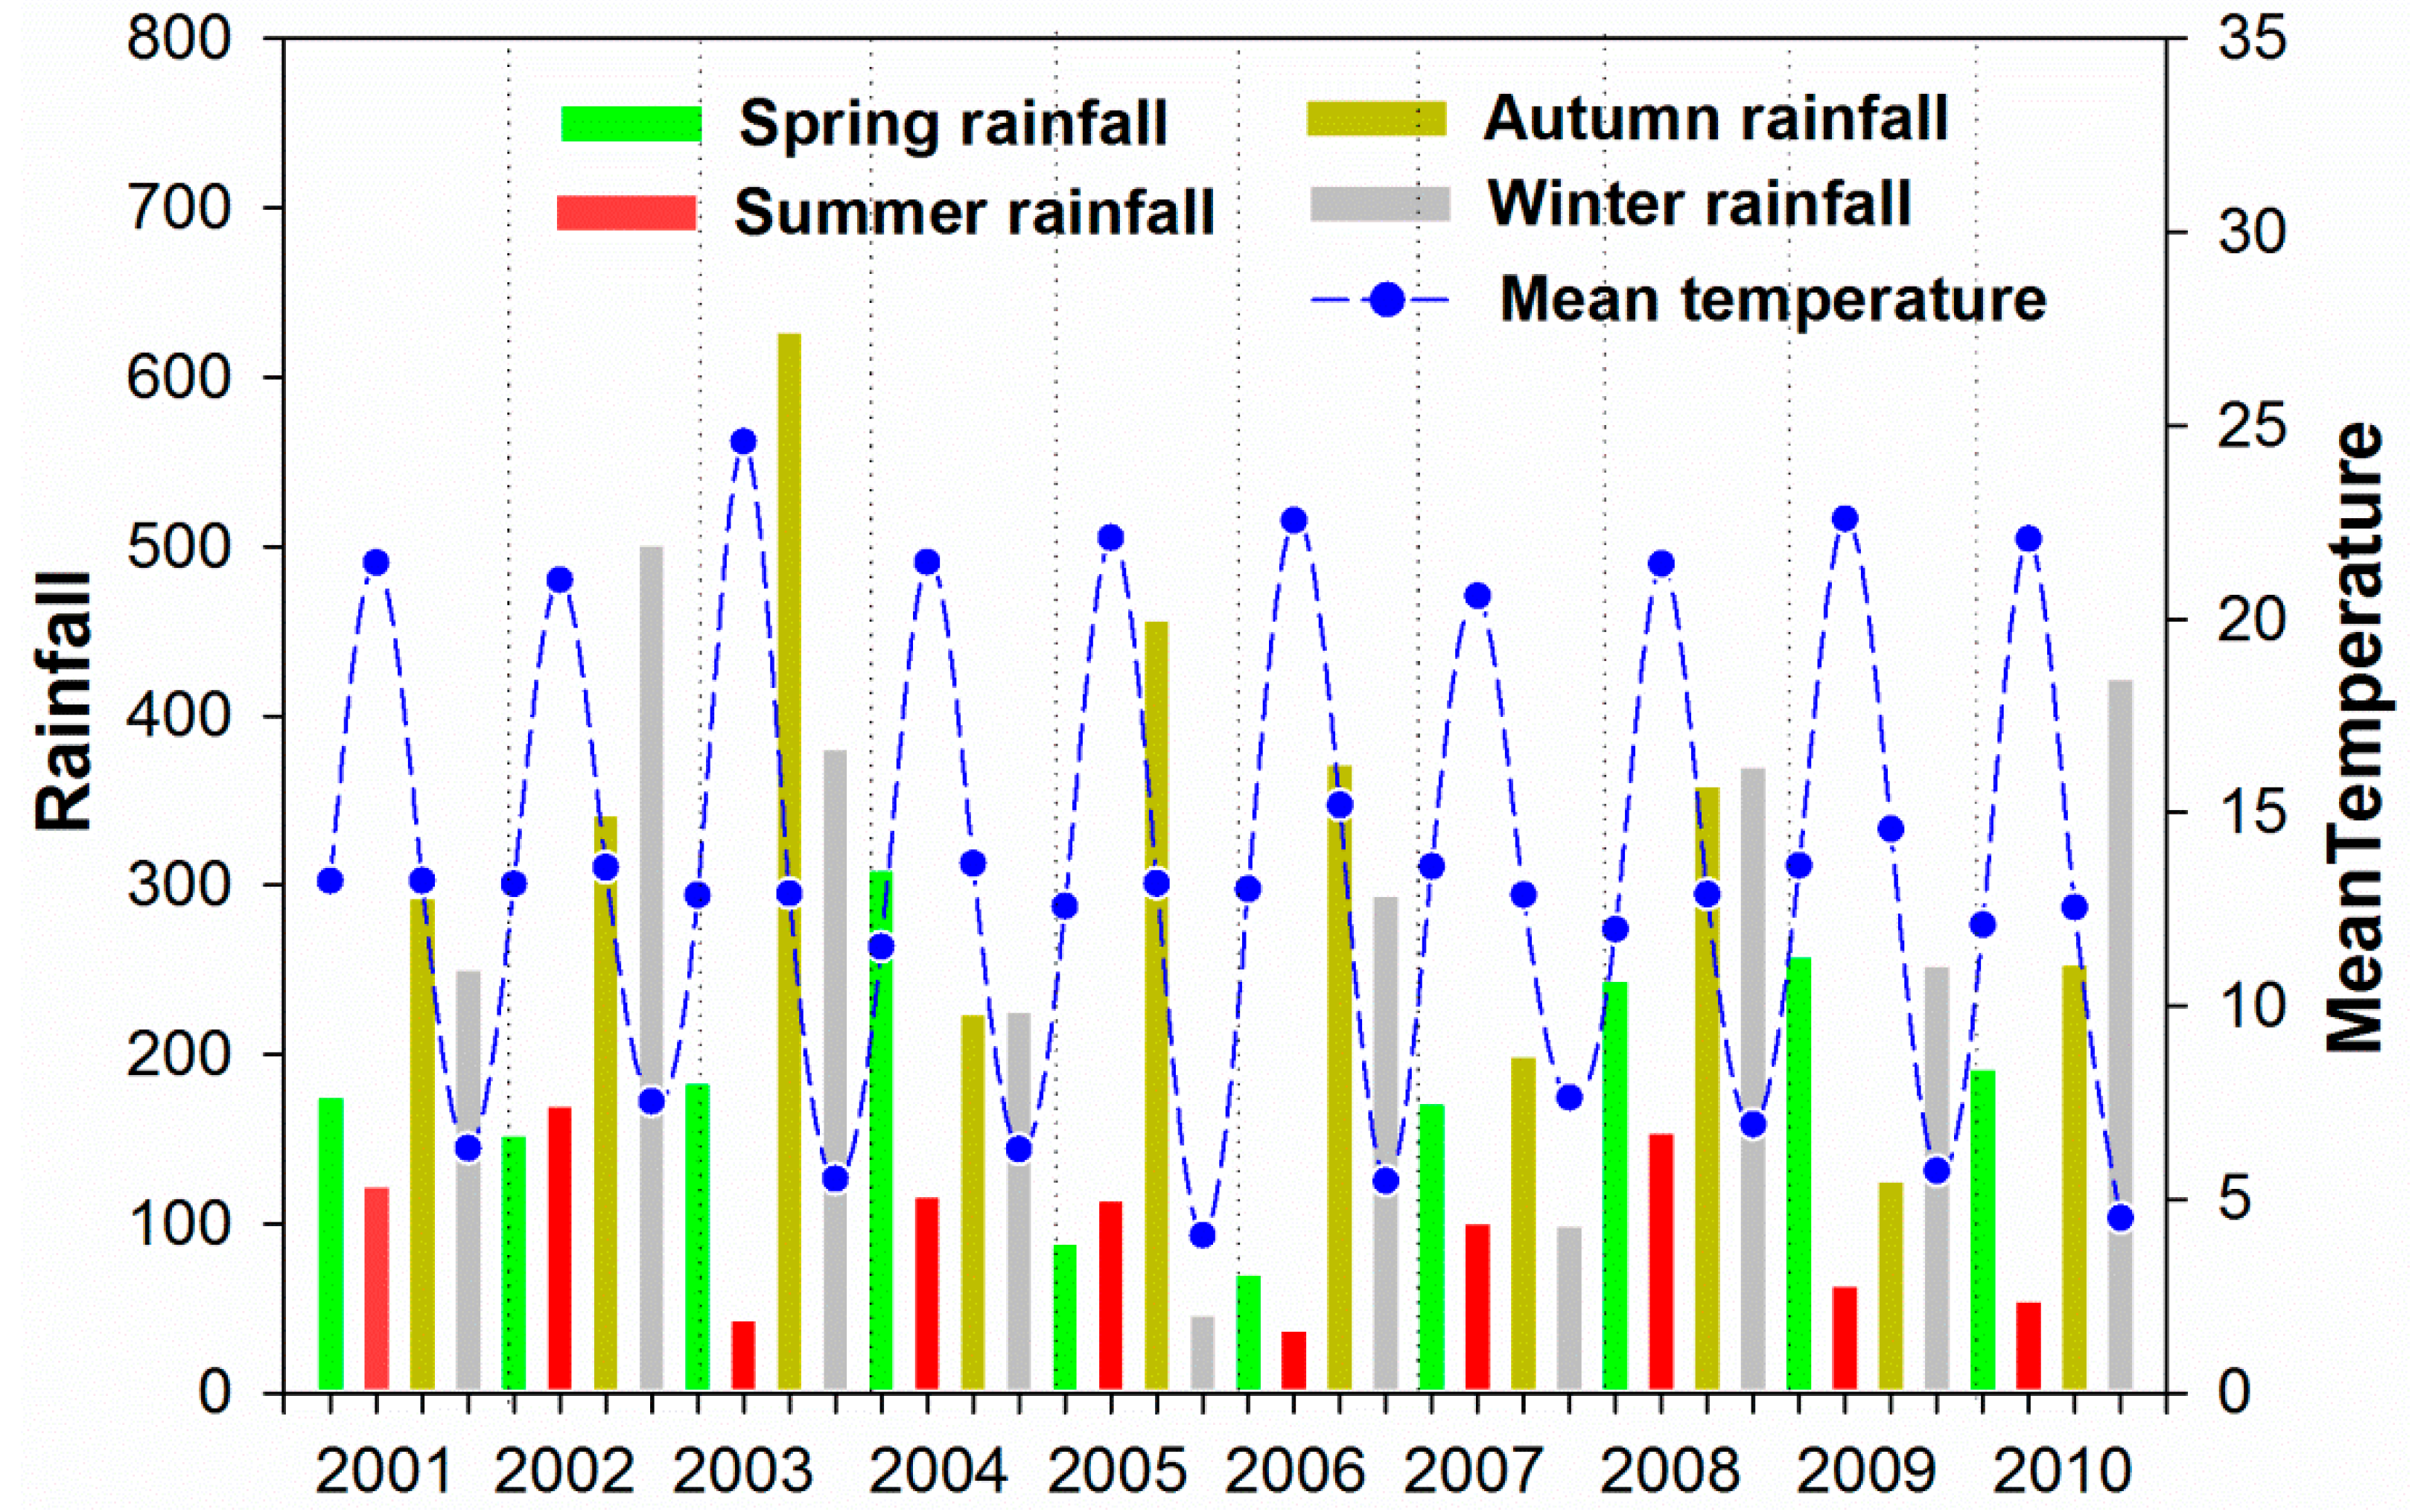
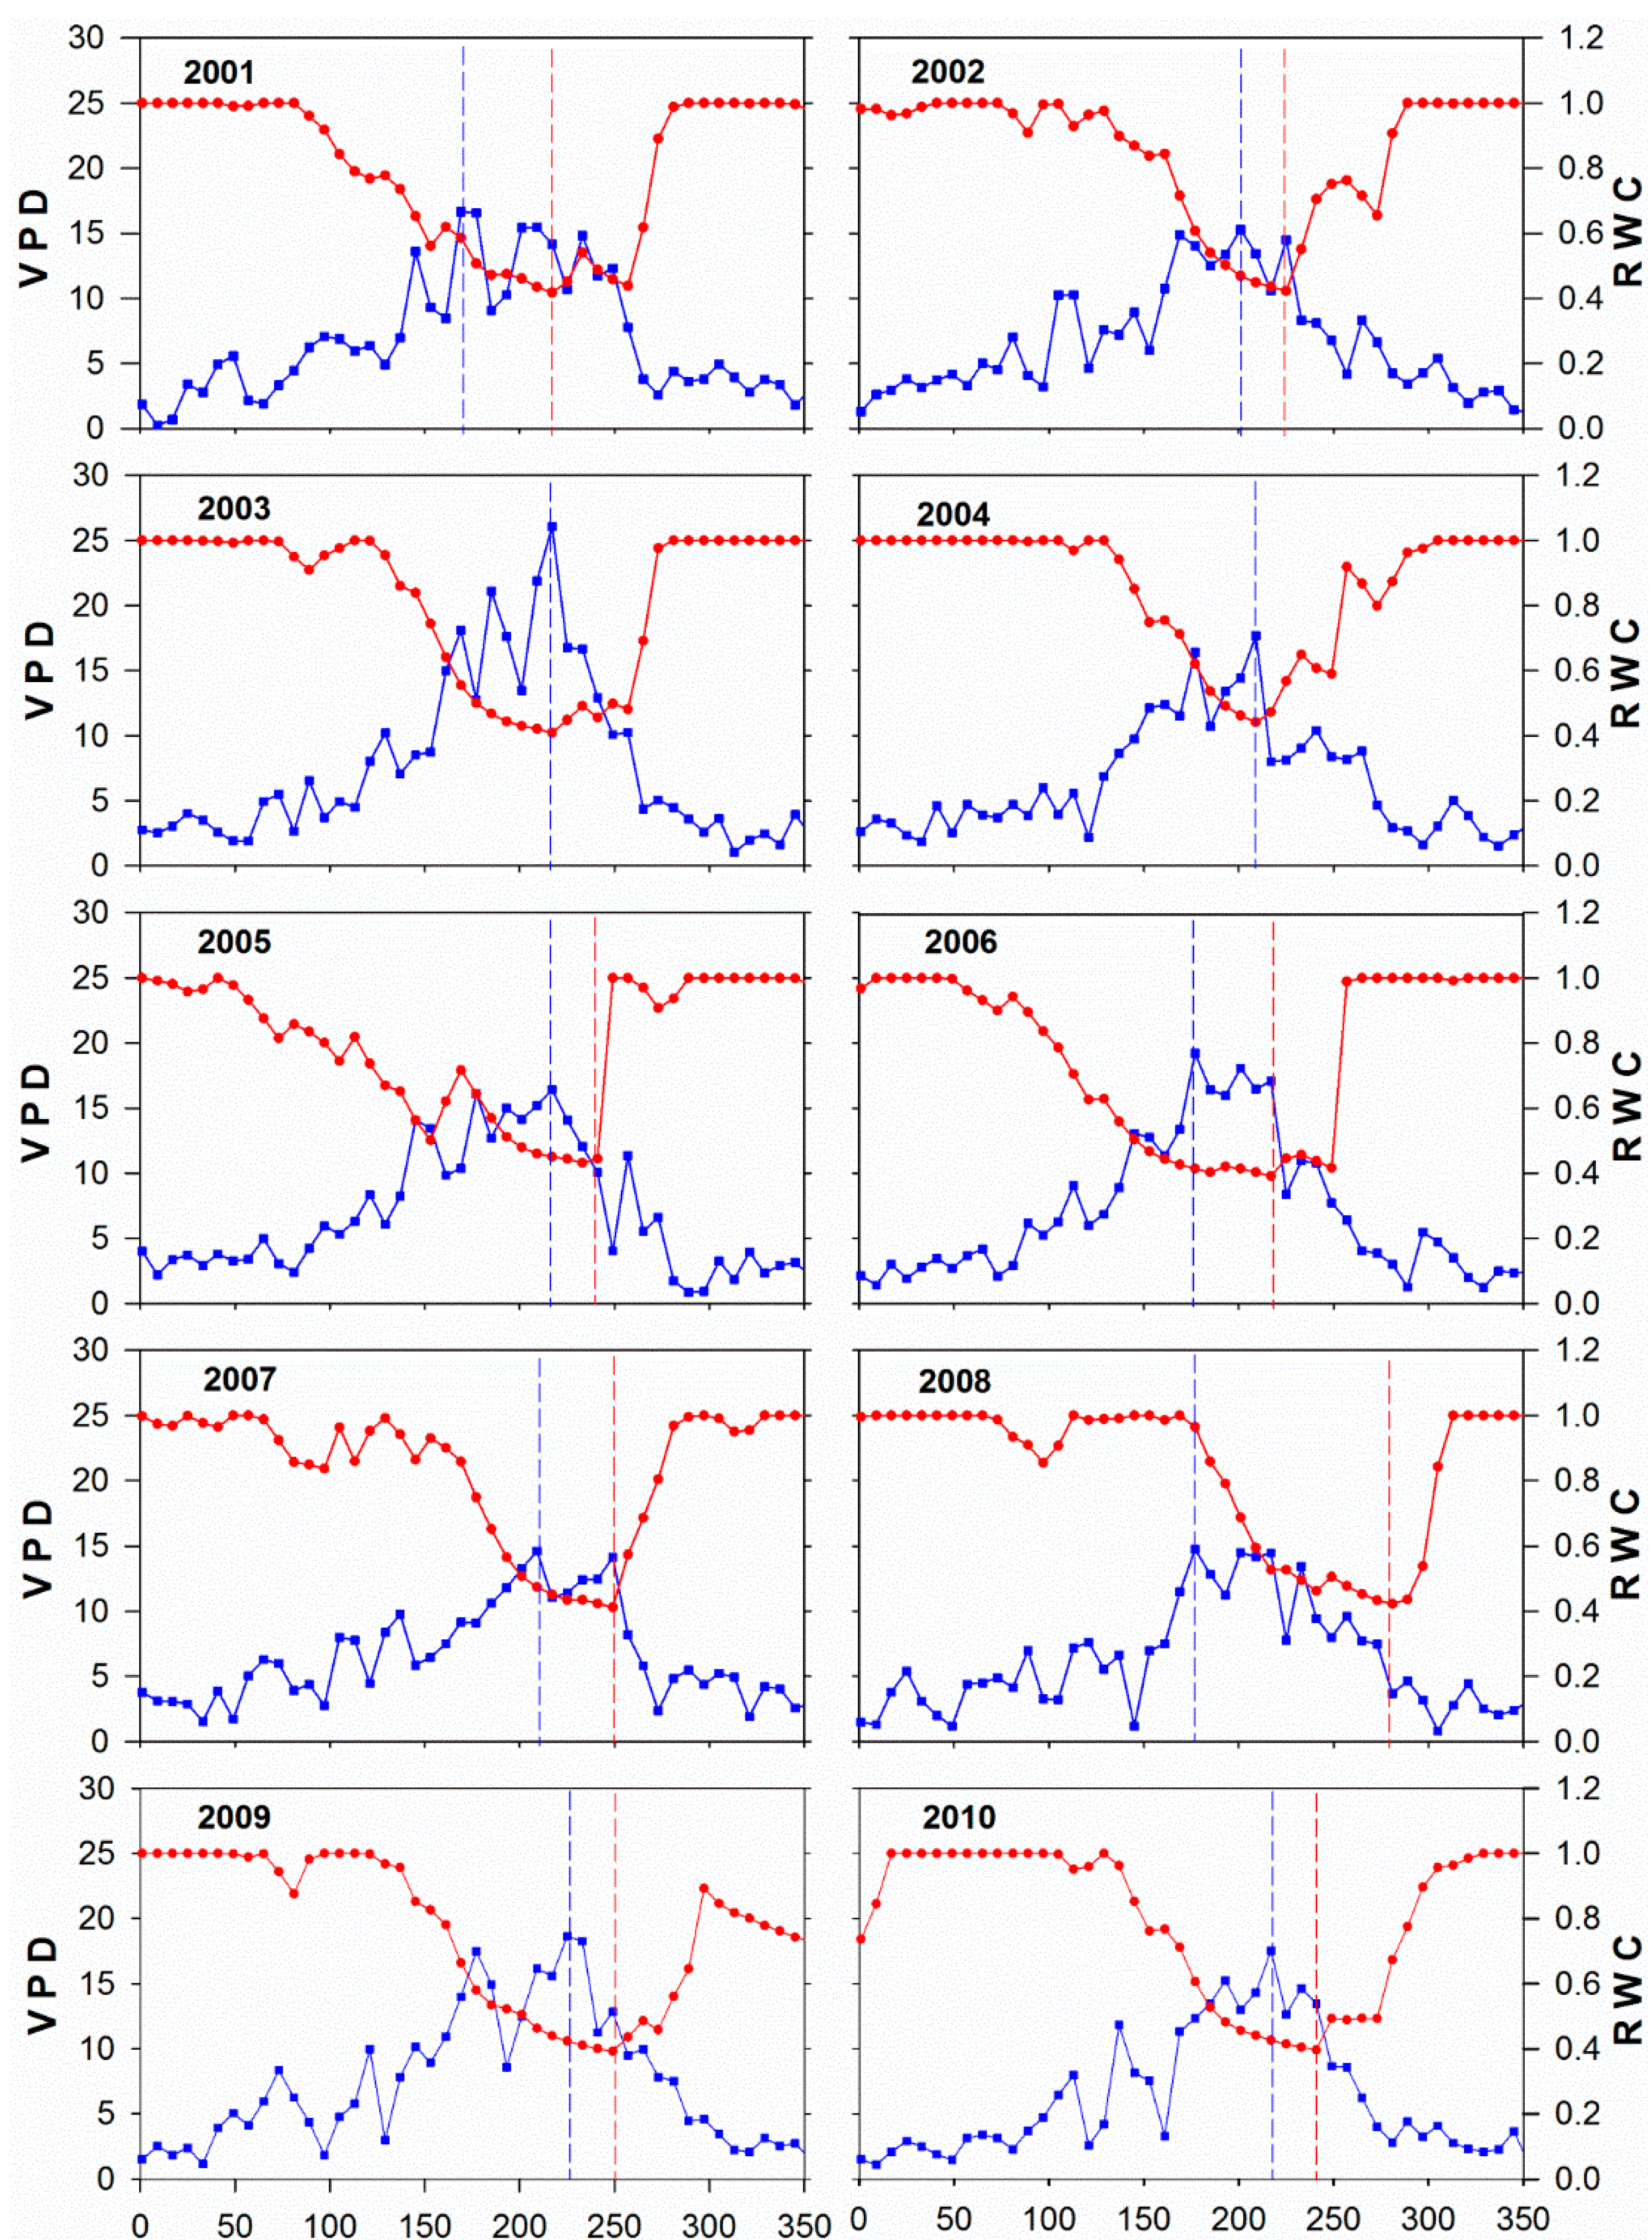
3.3. Climate and Drought Patterns

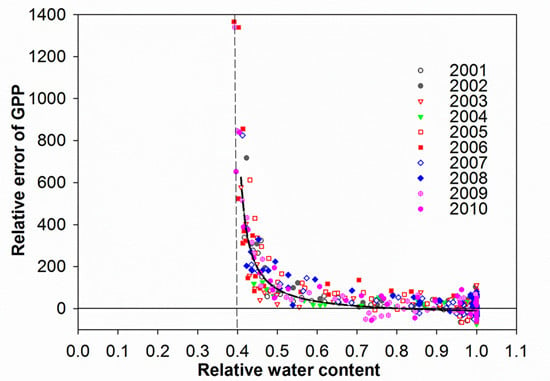
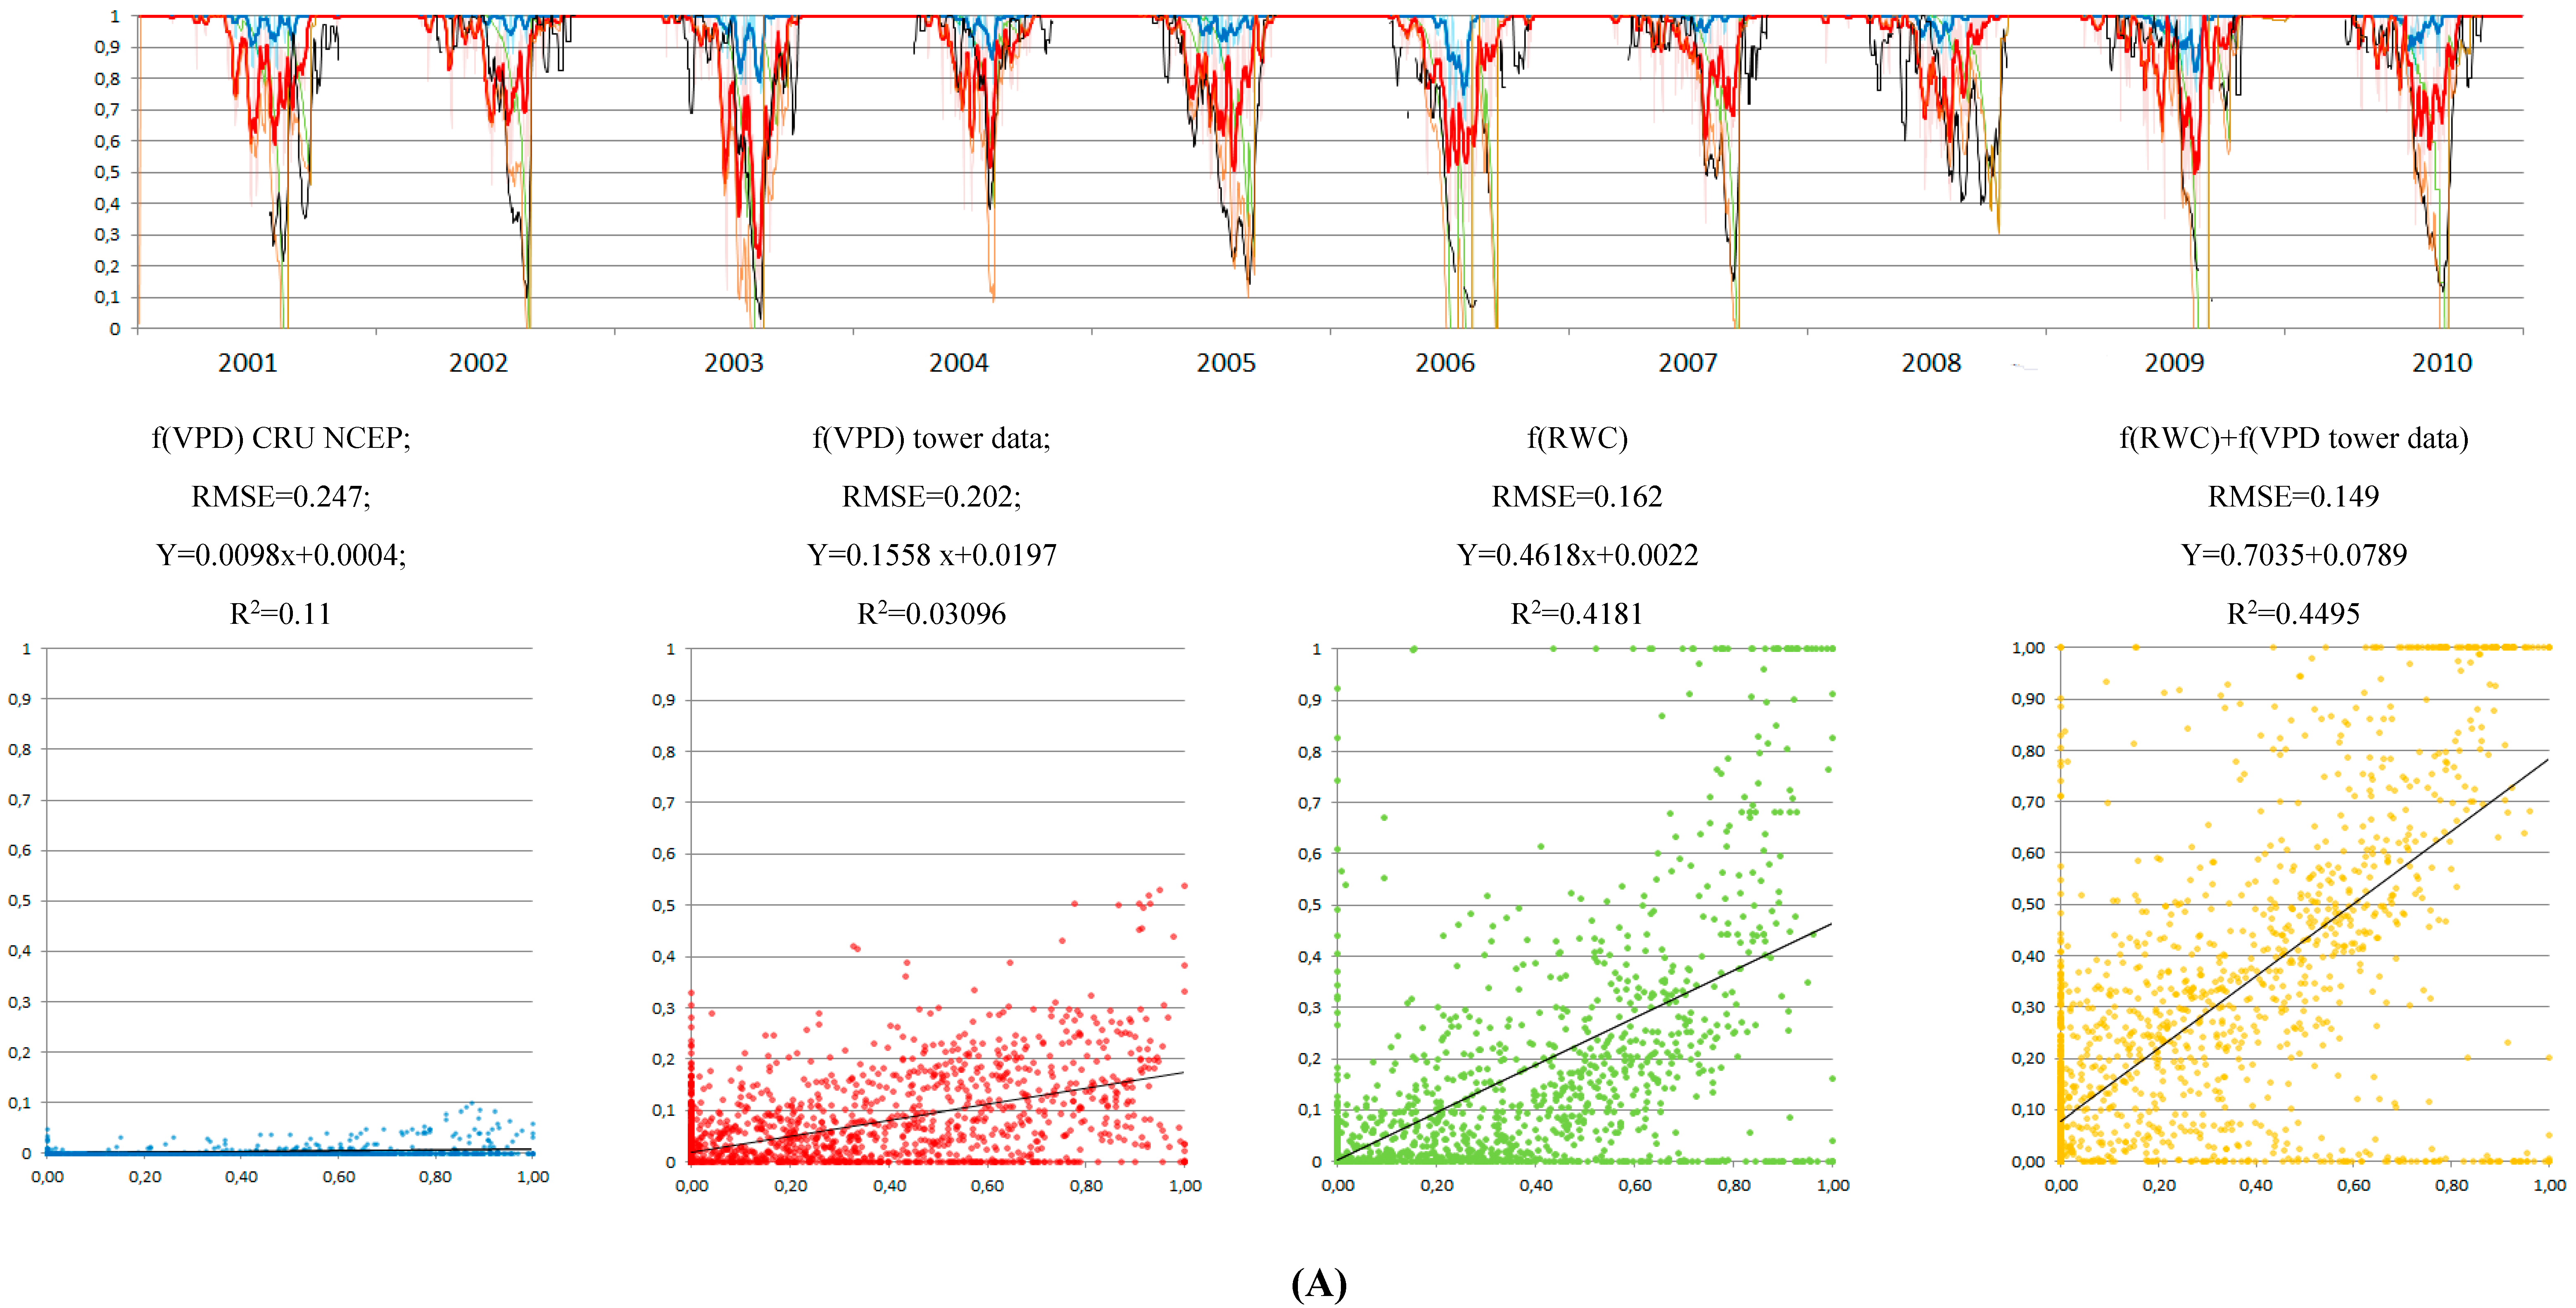
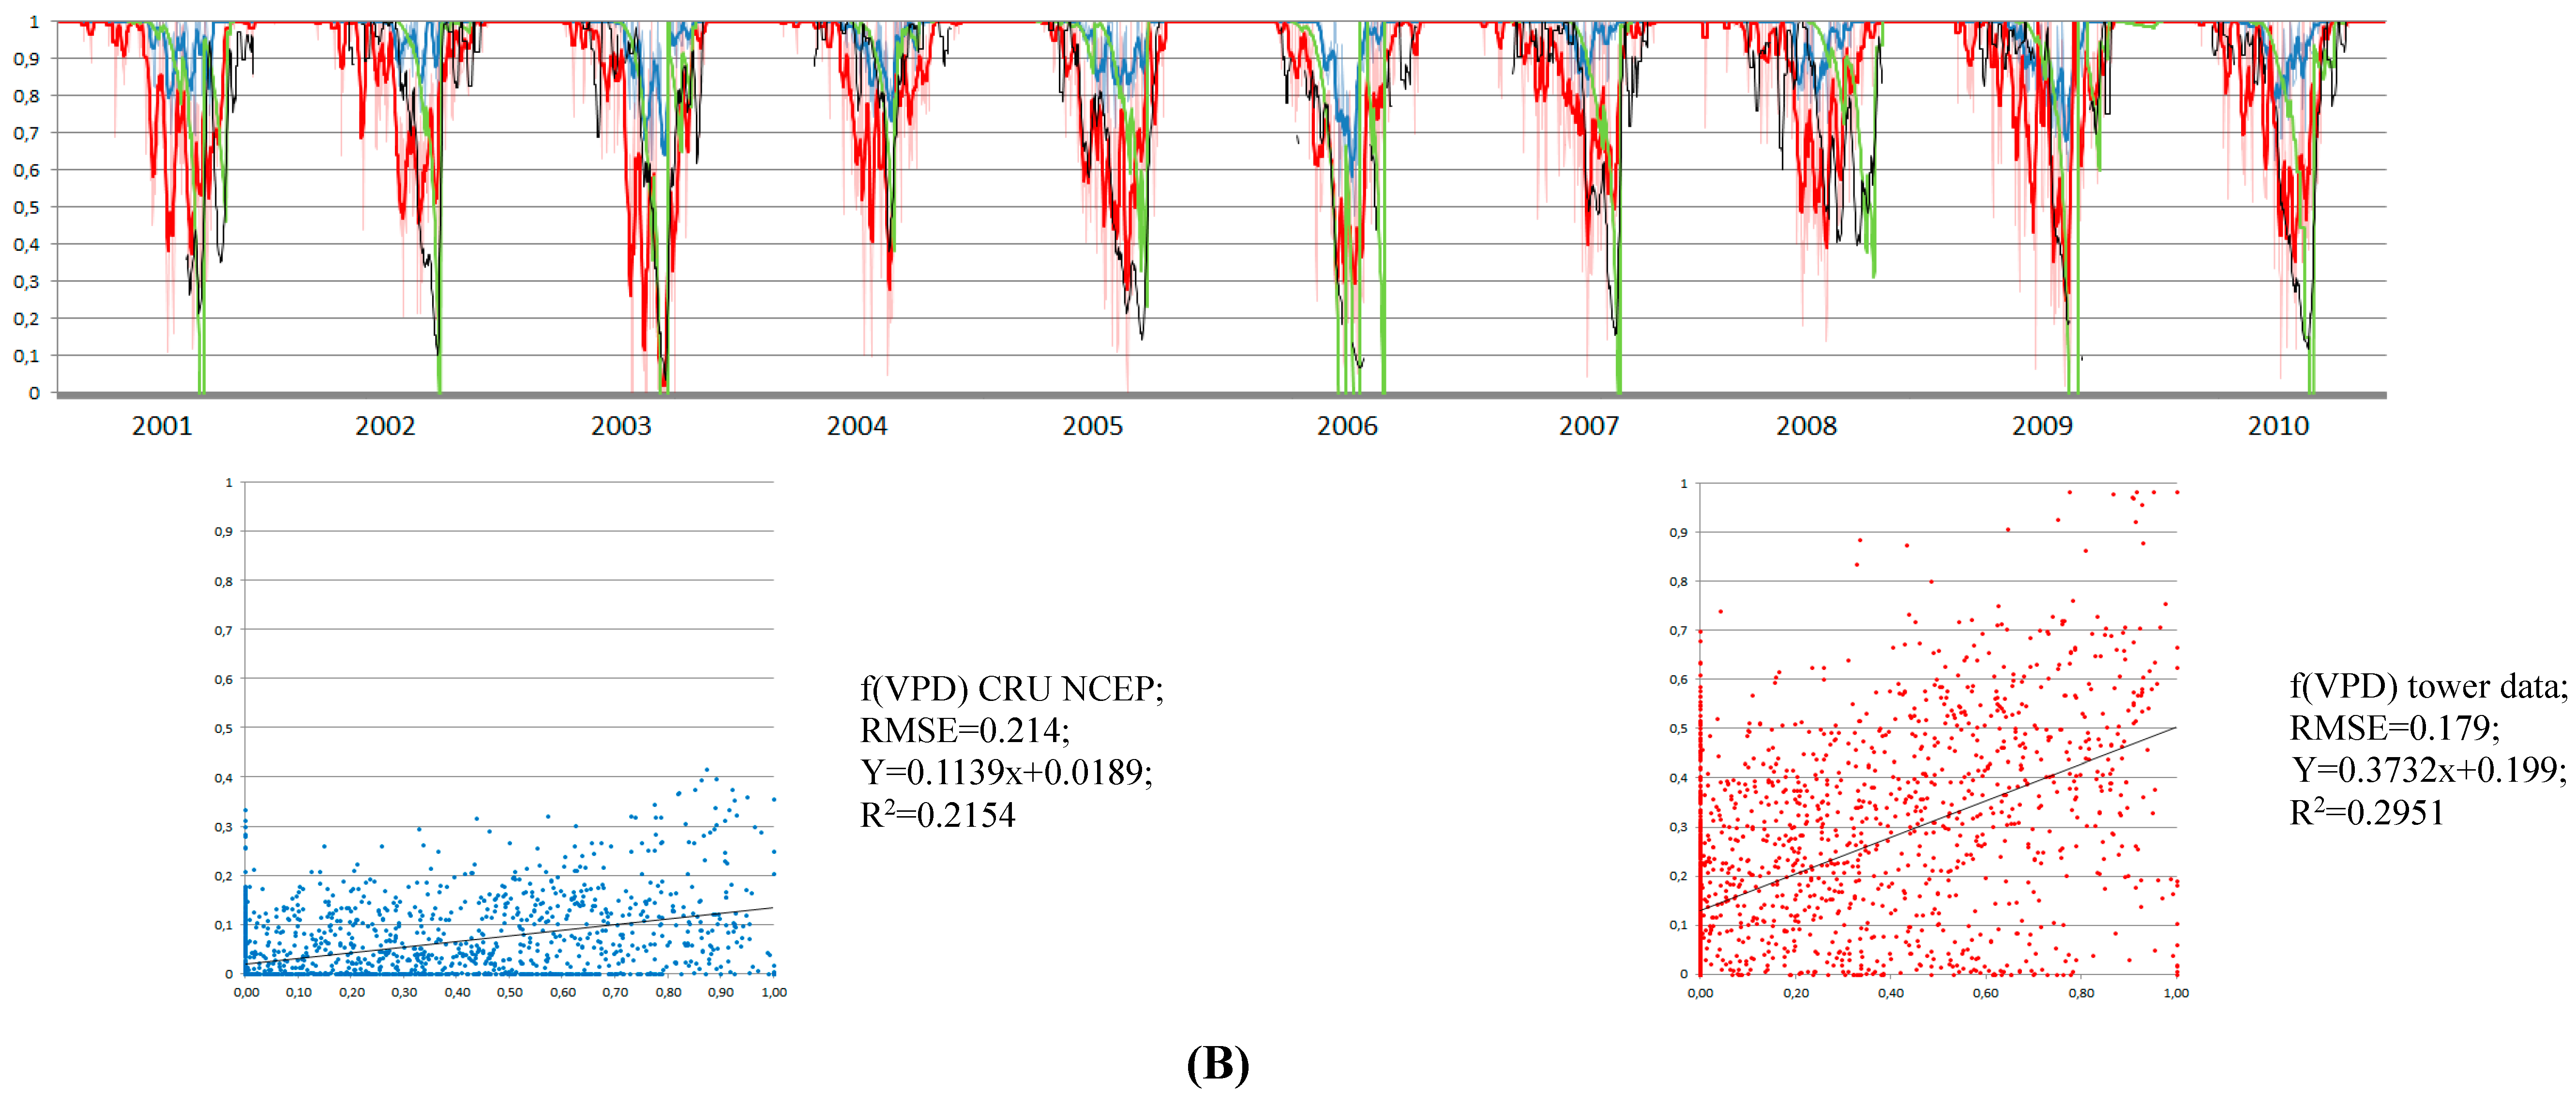
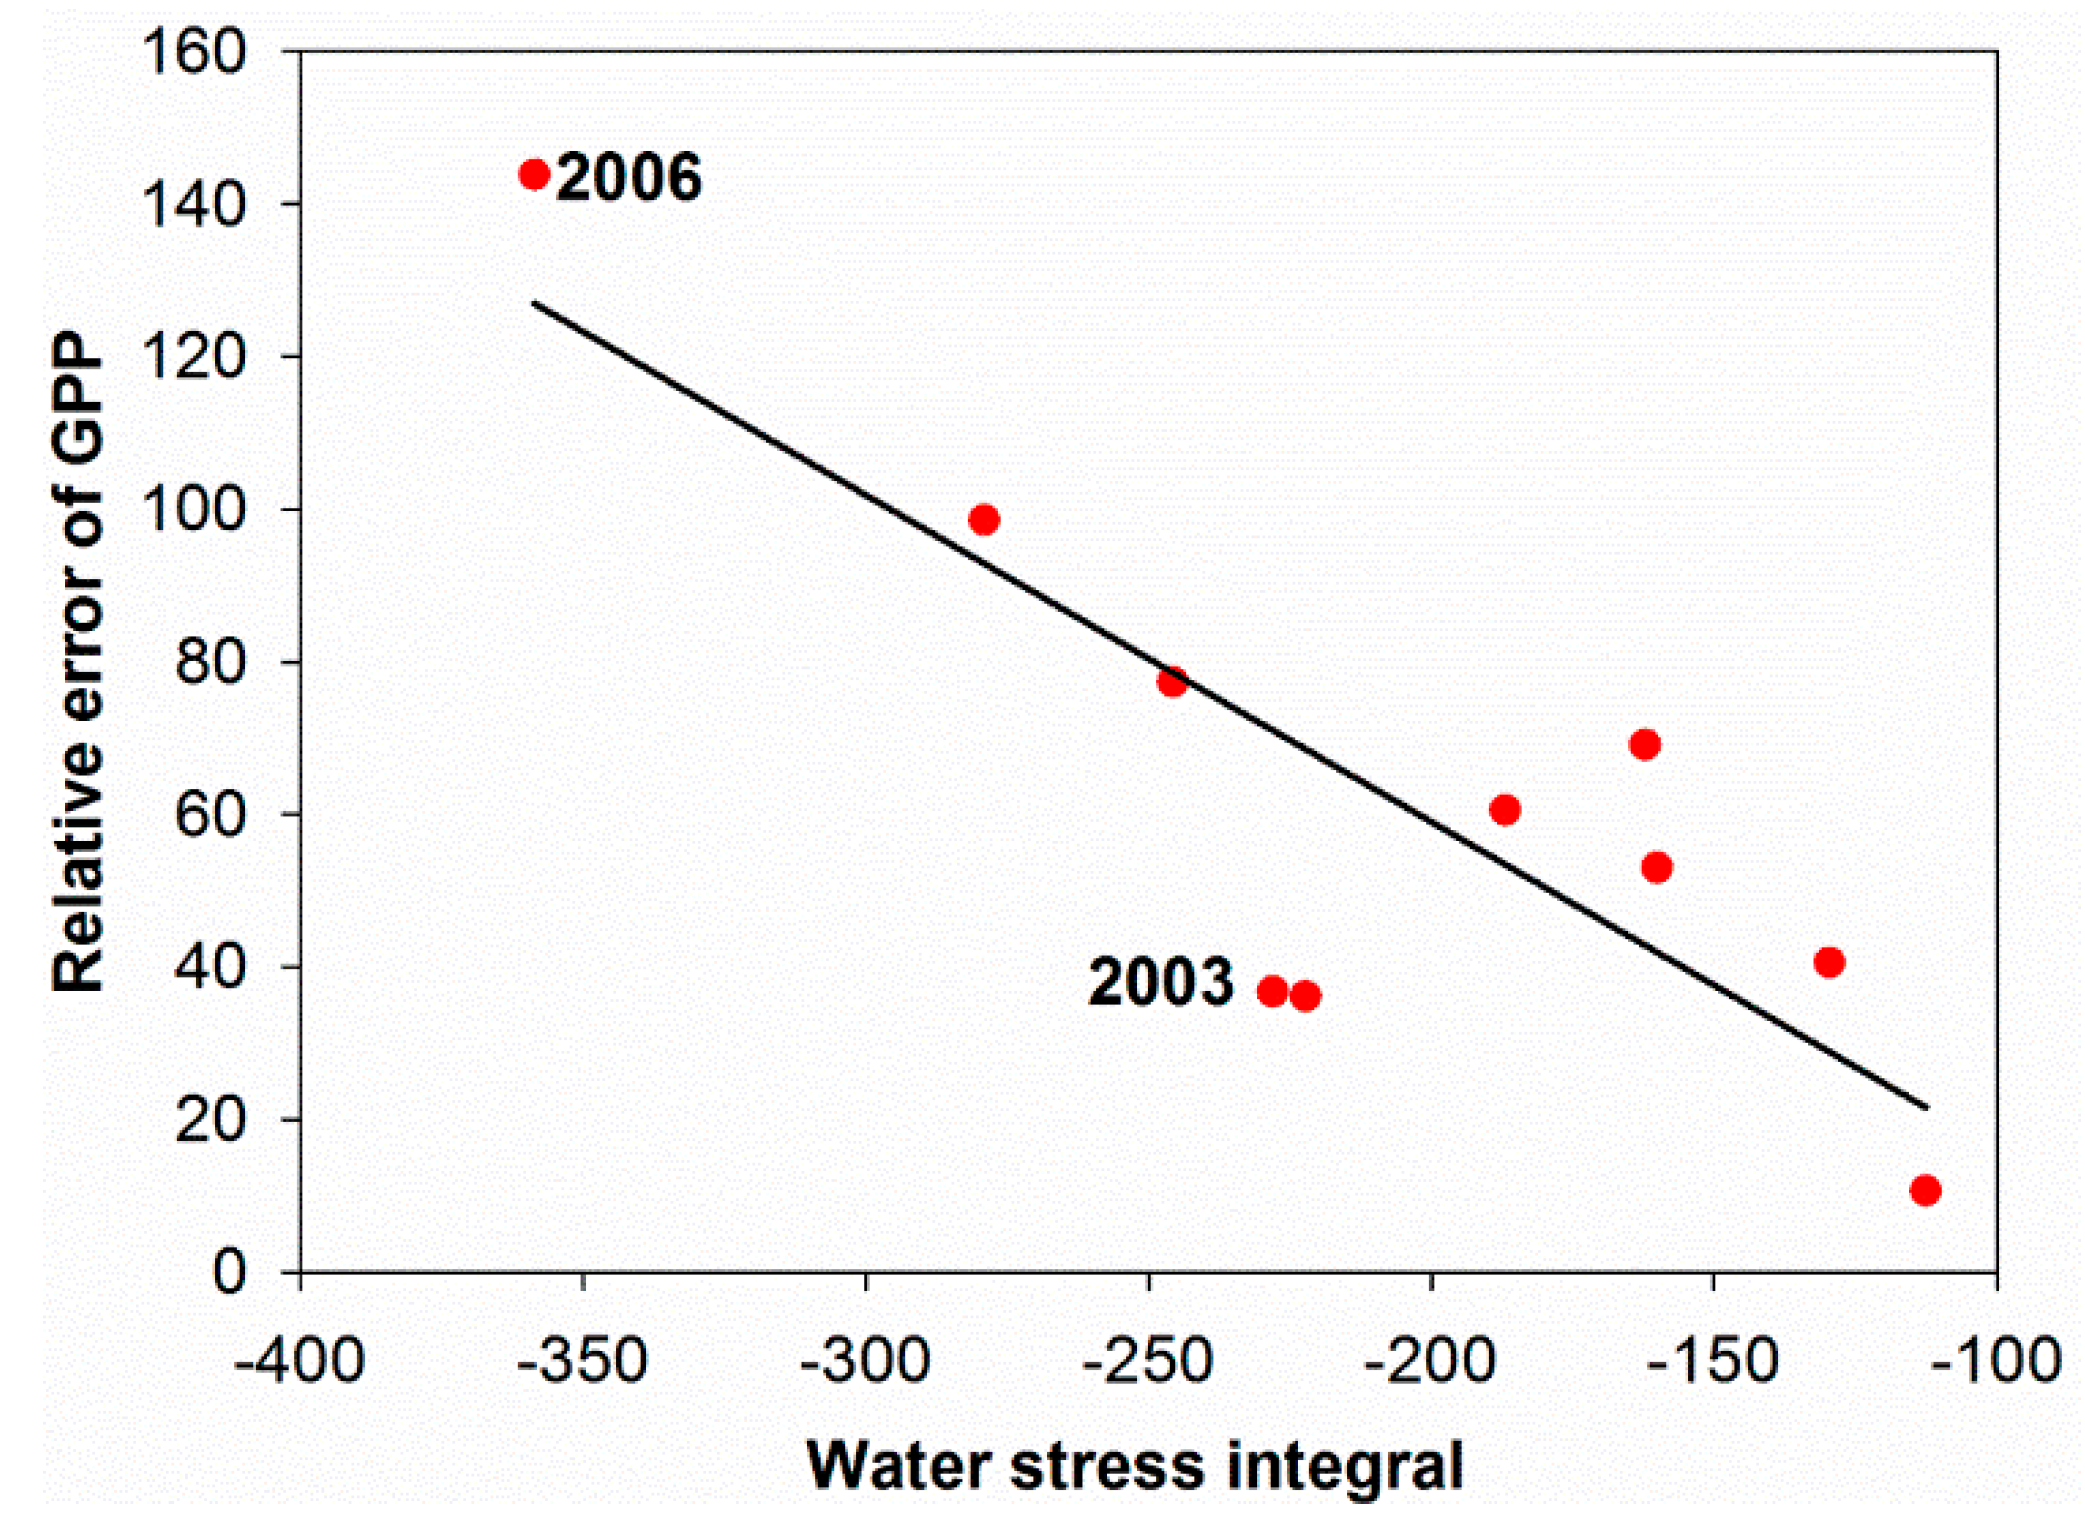
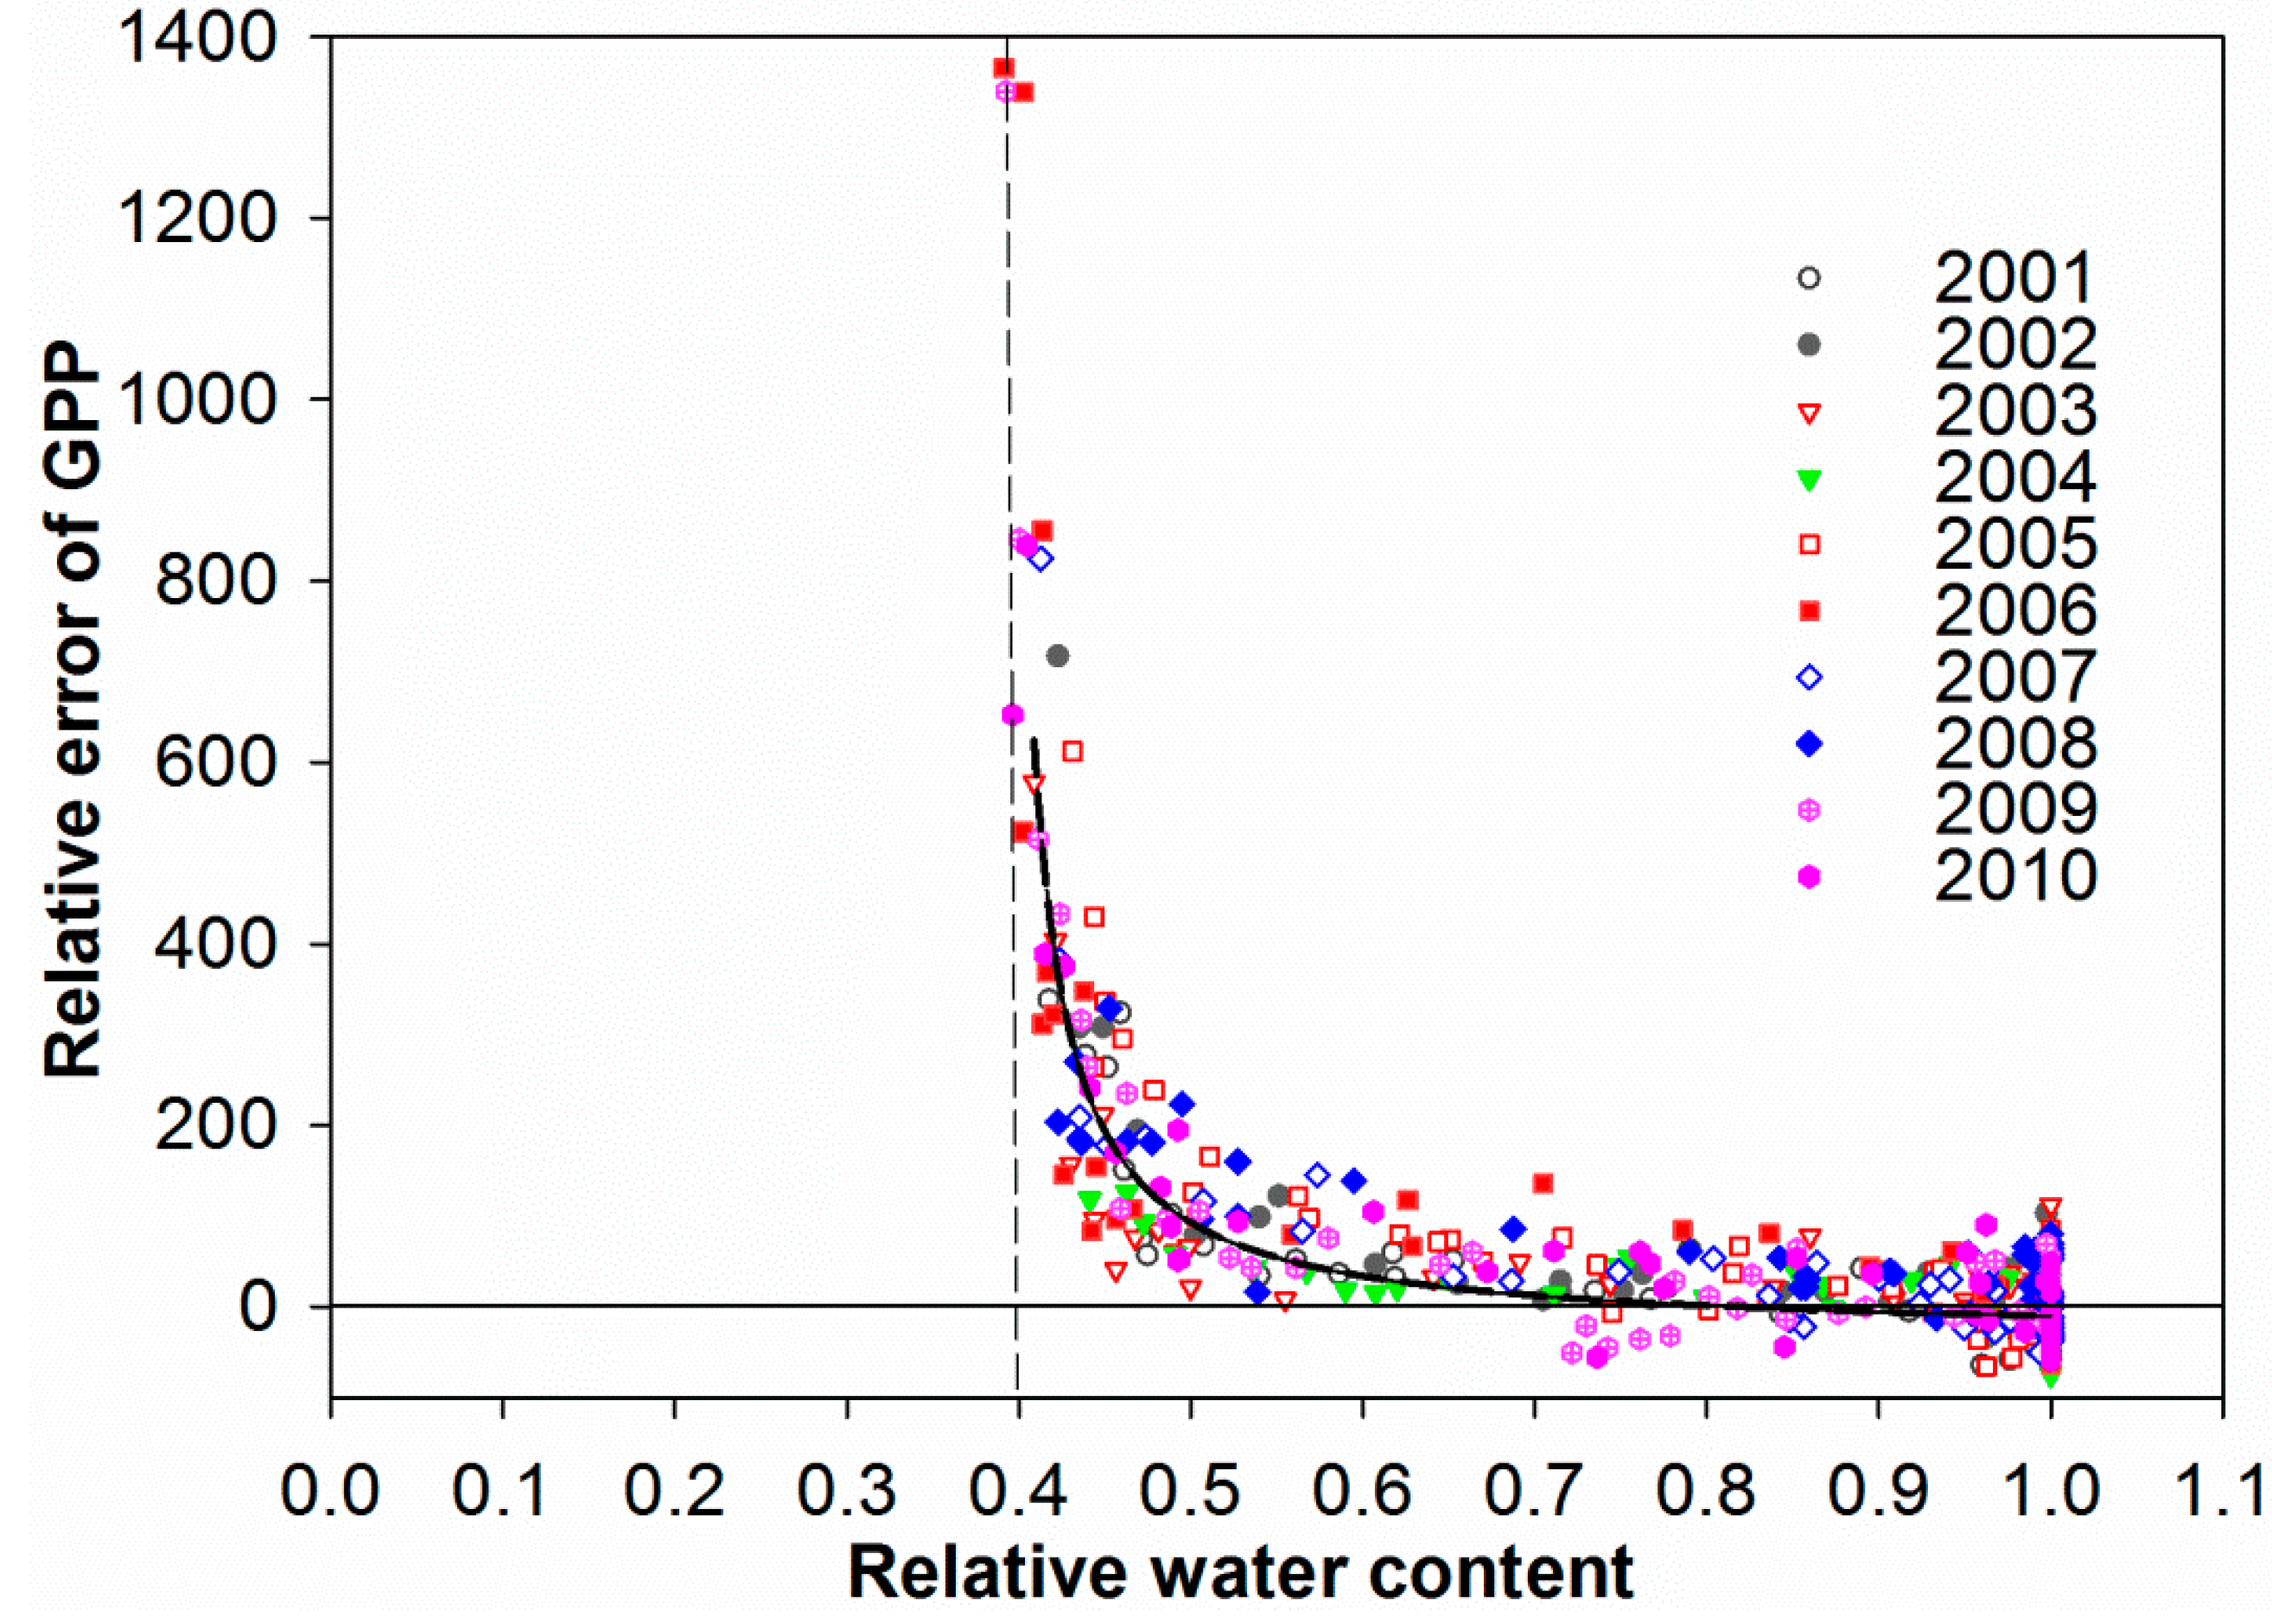
3.4. Control of RWC on GPP MODIS Anomalies
4. Discussion
4.1. Soil Drought as the Main Driver of GPP Anomalies
4.2. How Does Circumvent the Problem of Soil Drought Limitation?
5. Conclusions
Acknowledgments
Author Contributions
Conflicts of Interest
References
- Churkina, G.; Running, S.W. Contrasting climatic controls on the estimated productivity of global terrestrial biomes. Ecosystems 1998, 1, 206–215. [Google Scholar] [CrossRef]
- Zhao, M.; Running, S.W. Drought-induced reduction in global terrestrial net primary production from 2000 through 2009. Science 2010, 329, 940–943. [Google Scholar] [CrossRef] [PubMed]
- Hoerling, M.; Eischeid, J.; Perlwitz, J.; Quan, X.; Zhang, T.; Pegion, P. On the increased frequency of Mediterranean drought. J. Clim. 2012, 25, 2146–2161. [Google Scholar] [CrossRef]
- Somot, S.; Sevault, F.; Deque, M.; Crepon, M. 21st Century climate change scenario for the Mediterranean using a coupled atmosphere-ocean regional climate model. Glob. Planet. Change 2008, 63, 112–126. [Google Scholar] [CrossRef]
- Rambal, S. Hierarchy and productivity of Mediterranean-type ecosystems. In Terrestrial Global Productivity; Roy, J., Saugier, B., Mooney, H., Eds.; Academic Press: San Diego, CA, USA, 2001; pp. 315–344. [Google Scholar]
- Bonan, G.B. Forests and climate change: Forcings, feedbacks, and the climate benefits of forests. Science 2008, 320, 1444–1449. [Google Scholar] [CrossRef] [PubMed]
- Luo, Y.; Melillo, J.; Niu, S.; Beier, C.; Clark, J.S.; Classen, A.T.; Davidson, E.; Dukes, J.S.; Evans, R.D.; Field, C.B.; et al. Coordinated approaches to quantify long-term ecosystem dynamics in response to global change. Glob. Change Biol. 2011, 17, 843–854. [Google Scholar] [CrossRef]
- Heinsch, F.A.; Reeves, M.; Votava, P.; Kang, S.; Milesi, C.; Zhao, M.; Glassy, J.; Jolly, W.M.; Loehman, R.; Bowker, C.F. User’s Guide GPP and NPP (MOD17A2/A3) Products NASA MODIS Land Algorithm. Available online: http://datamirror.csdb.cn/modis/resource/doc/MOD17_UsersGuide.pdf (accessed on 7 July 2014).
- Ciais, P.; Reichstein, M.; Viovy, N.; Granier, A.; Ogee, J.; Allard, V.; Aubinet, M.; Buchmann, N.; Bernhofer, C.; Carrara, A.; et al. Europe-wide reduction in primary productivity caused by the heat and drought in 2003. Nature 2005, 437, 529–533. [Google Scholar] [CrossRef] [PubMed]
- Heinsch, F.A.; Zhao, M.S.; Running, S.W.; Kimball, J.S.; Nemani, R.R.; Davis, K.J.; Bolstad, P.V.; Cook, B.D.; Desai, A.R.; Ricciuto, D.M.; et al. Evaluation of remote sensing based terrestrial productivity from MODIS using regional tower eddy flux network observations. IEEE Trans. Geosci. Remote Sens. 2006, 44, 1908–1925. [Google Scholar] [CrossRef]
- Sims, D.A.; Rahman, A.F.; Cordova, V.D.; El-Masri, B.Z.; Baldocchi, D.D.; Bolstad, P.V.; Flanagan, L.B.; Goldstein, A.H.; Hollinger, D.Y.; Misson, L.; et al. A new model of gross primary productivity for North American ecosystems based solely on the enhanced vegetation index and land surface temperature from MODIS. Remote Sens. Environ. 2008, 112, 1633–1646. [Google Scholar] [CrossRef]
- Monteith, J.L. Solar radiation and productivity in Tropical ecosystems. J. Appl. Ecol. 1972, 9, 747–766. [Google Scholar] [CrossRef]
- Monteith, J.; Moss, C. Climate and the efficiency of crop production in Britain [and discussion]. Biol. Sci. 1977, 281, 277–294. [Google Scholar] [CrossRef]
- Running, S.W.; Nemani, R.R.; Heinsch, F.A.; Zhao, M.S.; Reeves, M.; Hashimoto, H. A continuous satellite-derived measure of global terrestrial primary production. Bioscience 2004, 54, 547–560. [Google Scholar] [CrossRef]
- Quézel, P.; Médail, F. Ecologie et Biogéographie des Forêts du Bassin Méditerranéen; Elsevier: Paris, France, 2003. [Google Scholar]
- Rambal, S.; Ourcival, J.M.; Joffre, R.; Mouillot, F.; Nouvellon, Y.; Reichstein, M.; Rocheteau, A. Drought controls over conductance and assimilation of a Mediterranean evergreen ecosystem: Scaling from leaf to canopy. Glob. Change Biol. 2003, 9, 1813–1824. [Google Scholar] [CrossRef]
- Aubinet, M.; Grelle, A.; Ibrom, A.; Rannik, U.; Moncrieff, J.; Foken, T.; Kowalski, A.S.; Martin, P.H.; Berbigier, P.; Bernhofer, C.; et al. Estimates of the annual net carbon and water exchange of forests: The EUROFLUX methodology. Adv. Ecol. Res. 2000, 30, 113–175. [Google Scholar]
- Papale, D.; Reichstein, M.; Aubinet, M.; Canfora, E.; Bernhofer, C.; Kutsch, W.; Longdoz, B.; Rambal, S.; Valentini, R.; Vesala, T.; et al. Towards a standardized processing of net ecosystem exchange measured with eddy covariance technique: Algorithms and uncertainty estimation. Biogeosciences 2006, 3, 571–583. [Google Scholar] [CrossRef]
- Reichstein, M.; Falge, E.; Baldocchi, D.; Papale, D.; Aubinet, M.; Berbigier, P.; Bernhofer, C.; Buchmann, N.; Gilmanov, T.; Granier, A.; et al. On the separation of net ecosystem exchange into assimilation and ecosystem respiration: Review and improved algorithm. Glob. Change Biol. 2005, 11, 1424–1439. [Google Scholar] [CrossRef]
- Oak Ridge National Laboratory. Available online: http://daac.ornl.gov/cgi-bin/MODIS/GR_col5_1/mod_viz.html (accessed on 7 July 2014).
- Zhao, M.S.; Heinsch, F.A.; Nemani, R.R.; Running, S.W. Improvements of the MODIS terrestrial gross and net primary production global data set. Remote Sens. Environ. 2005, 95, 164–176. [Google Scholar] [CrossRef]
- Rebmann, C.; Gockede, M.; Foken, T.; Aubinet, M.; Aurela, M.; Berbigier, P.; Bernhofer, C.; Buchmann, N.; Carrara, A.; Cescatti, A.; et al. Quality analysis applied on eddy covariance measurements at complex forest sites using footprint modelling. Theor. Appl. Climatol. 2005, 80, 121–141. [Google Scholar] [CrossRef]
- Gockede, M.; Foken, T.; Aubinet, M.; Aurela, M.; Banza, J.; Bernhofer, C.; Bonnefond, J.M.; Brunet, Y.; Carrara, A.; Clement, R.; et al. Quality control of CarboEurope flux data—Part 1: Coupling footprint analyses with flux data quality assessment to evaluate sites in forest ecosystems. Biogeosciences 2008, 5, 433–450. [Google Scholar] [CrossRef]
- Goerner, A.; Reichstein, M.; Rambal, S. Tracking seasonal drought effects on ecosystem light use efficiency with satellite-based PRI in a Mediterranean forest. Remote Sens. Environ. 2009, 113, 1101–1111. [Google Scholar] [CrossRef]
- Lacaze, B.; Rambal, S.; Winkel, T. Identifying spatial patterns of Mediterranean landscapes from geostatitical analysis of remotely-sensed data. Int. J. Remote Sens. 1994, 15, 2437–2450. [Google Scholar] [CrossRef]
- Zhao, M.S.; Running, S.W. Drought-induced reduction in global terrestrial net primary production from 2000 through 2009. Science 2010, 329, 940–943. [Google Scholar] [CrossRef] [PubMed]
- Chen, J.; Zhang, H.; Liu, Z.; Che, M.; Chen, B. Evaluating parameters adjustment in the MODIS gross primary production algorithm based on eddy covariance tower measurements. Remote Sens. 2014, 6, 3321–3348. [Google Scholar] [CrossRef]
- Zhao, M.; Running, S.W.; Nemani, R.R. Sensitivity of moderate resolution imaging spectroradiometer (MODIS) terrestrial primary production to the accuracy of meteorological reanalyses. J. Geophys. Res. 2006, 111. [Google Scholar] [CrossRef]
- Rambal, S. Annales de la Société d'Horticulture et d'Histoire Naturelle de l'Hérault. Available online: http://www.shhnh.com/ (accessed on 7 July 2014).
- Hoff, C.; Rambal, S.; Joffre, R. Simulating carbon and water flows and growth in a Mediterranean evergreen Quercus ilex coppice using the FOREST-BGC model. Forest Ecol. Manag. 2002, 164, 121–136. [Google Scholar] [CrossRef]
- Rambal, S. The diffrential role of mechanisms for drought resistance in a Mediterranean evergreen shrub—A simulation approach. Plant Cell Environ. 1993, 16, 35–44. [Google Scholar] [CrossRef]
- Grote, R.; Lavoir, A.V.; Rambal, S.; Staudt, M.; Zimmer, I.; Schnitzler, J.P. Modelling the drought impact on monoterpene fluxes from an evergreen Mediterranean forest canopy. Oecologia 2009, 160, 213–223. [Google Scholar] [CrossRef] [PubMed]
- Campbell, G.S. Simple method for determining unsaturated conductivity from moisture retention data. Soil Sci. 1974, 117, 311–314. [Google Scholar] [CrossRef]
- Rambal, S. Les Transferts D’eau Dans Le Système Sol-Plante En Région Méditerranéenne Karstique: Une Approche Hiérarchique. PhD thesis, Paris-Sud Orsay, Paris, France, 1990. [Google Scholar]
- Limousin, J.M.; Rambal, S.; Ourcival, J.M.; Rocheteau, A.; Joffre, R.; Rodriguez-Cortina, R. Long-term transpiration change with rainfall decline in a Mediterranean Quercus ilex forest. Glob. Change Biol. 2009, 15, 2163–2175. [Google Scholar] [CrossRef]
- Leuning, R.; Cleugh, H.A.; Zegelin, S.J.; Hughes, D. Carbon and water fluxes over a temperate Eucalyptus forest and a tropical wet/dry savanna in Australia: Measurements and comparison with MODIS remote sensing estimates. Agr. Forest Meteorol. 2005, 129, 151–173. [Google Scholar] [CrossRef]
- Soudani, K.; Hmimina, G.; Delpierre, N.; Pontailler, J.Y.; Aubinet, M.; Bonal, D.; Caquet, B.; de Grandcourt, A.; Burban, B.; Flechard, C.; et al. Ground-based Network of NDVI measurements for tracking temporal dynamics of canopy structure and vegetation phenology in different biomes. Remote Sens. Environ. 2012, 123, 234–245. [Google Scholar] [CrossRef]
- Coops, N.C.; Black, T.A.; Jassal, R.P.S.; Trofymow, J.A.T.; Morgenstern, K. Comparison of MODIS, eddy covariance determined and physiologically modelled gross primary production (GPP) in a Douglas-fir forest stand. Remote Sens. Environ. 2007, 107, 385–401. [Google Scholar] [CrossRef]
- Gao, X.J.; Pal, J.S.; Giorgi, F. Projected changes in mean and extreme precipitation over the Mediterranean region from a high resolution double nested RCM simulation. Geophys. Res. Lett. 2006, 33. [Google Scholar] [CrossRef]
- Giorgi, F.; Lionello, P. Climate change projections for the Mediterranean region. Glob. Planet. Change 2008, 63, 90–104. [Google Scholar] [CrossRef]
- Giorgi, F. Climate change hot-spots. Geophys. Res. Lett. 2006, 33. [Google Scholar] [CrossRef]
- Mueller, B.; Seneviratne, S.I. Hot days induced by precipitation deficits at the global scale. In Proceedings of the National Academy of Sciences of the United States of America, Vienna, Austria, 7–12 April 2013.
- Giannakopoulos, C.; Le Sager, P.; Bindi, M.; Moriondo, M.; Kostopoulou, E.; Goodess, C.M. Climatic changes and associated impacts in the Mediterranean resulting from a 2 °C global warming. Glob. Planet. Change 2009, 68, 209–224. [Google Scholar] [CrossRef]
- Moriondo, M.; Good, P.; Durao, R.; Bindi, M.; Giannakopoulos, C.; Corte-Real, J. Potential impact of climate change on fire risk in the Mediterranean area. Climate Res. 2006, 31, 85–95. [Google Scholar] [CrossRef]
- Mouillot, F.; Rambal, S.; Joffre, R. Simulating climate change impacts on fire frequency and vegetation dynamics in a Mediterranean-type ecosystem. Glob. Change Biol. 2002, 8, 423–437. [Google Scholar] [CrossRef]
- Fischer, E.M.; Schaer, C. Consistent geographical patterns of changes in high-impact European heatwaves. Nat. Geosci. 2010, 3, 398–403. [Google Scholar] [CrossRef]
- Gao, X.; Giorgi, F. Increased aridity in the Mediterranean region under greenhouse gas forcing estimated from high resolution simulations with a regional climate model. Glob. Planet. Change 2008, 62, 195–209. [Google Scholar] [CrossRef]
- Sheffield, J.; Wood, E.F. Projected changes in drought occurrence under future global warming from multi-model, multi-scenario, IPCC AR4 simulations. Clim. Dynam. 2008, 31, 79–105. [Google Scholar] [CrossRef]
- Laurance, W.F.; Dell, B.; Turton, S.M.; Lawes, M.J.; Hutley, L.B.; McCallum, H.; Dale, P.; Bird, M.; Hardy, G.; Prideaux, G.; et al. The 10 Australian ecosystems most vulnerable to tipping points. Biol. Conserv. 2011, 144, 1472–1480. [Google Scholar] [CrossRef]
- Lenton, T.M. Early warning of climate tipping points. Nat. Clim. Change 2011, 1, 201–209. [Google Scholar] [CrossRef]
- Lenton, T.M.; Ciscar, J.-C. Integrating tipping points into climate impact assessments. Climatic Change 2013, 117, 585–597. [Google Scholar] [CrossRef]
- Allard, V.; Ourcival, J.M.; Rambal, S.; Joffre, R.; Rocheteau, A. Seasonal and annual variation of carbon exchange in an evergreen Mediterranean forest in Southern France. Glob. Change Biol. 2008, 14, 714–725. [Google Scholar] [CrossRef]
- Misson, L.; Rocheteau, A.; Rambal, S.; Ourcival, J.-M.; Limousin, J.-M.; Rodriguez, R. Functional changes in the control of carbon fluxes after 3 years of increased drought in a Mediterranean evergreen forest? Glob. Change Biol. 2010, 16, 2461–2475. [Google Scholar]
- Mu, Q.Z.; Zhao, M.S.; Heinsch, F.A.; Liu, M.L.; Tian, H.Q.; Running, S.W. Evaluating water stress controls on primary production in biogeochemical and remote sensing based models. Biogeoscience 2007, 112. [Google Scholar] [CrossRef]
- Turner, D.P.; Ritts, W.D.; Cohen, W.B.; Maeirsperger, T.K.; Gower, S.T.; Kirschbaum, A.A.; Running, S.W.; Zhao, M.S.; Wofsy, S.C.; Dunn, A.L.; et al. Site-level evaluation of satellite-based global terrestrial gross primary production and net primary production monitoring. Glob. Change Biol. 2005, 11, 666–684. [Google Scholar] [CrossRef]
- Kanniah, K.D.; Beringer, J.; Hutley, L.B.; Tapper, N.J.; Zhu, X. Evaluation of Collections 4 and 5 of the MODIS Gross Primary Productivity product and algorithm improvement at a tropical savanna site in Northern Australia. Remote Sens. Environ. 2009, 113, 1808–1822. [Google Scholar] [CrossRef]
- Kanniah, K.D.; Beringer, J.; Hutley, L.B. Response of savanna gross primary productivity to interannual variability in rainfall: Results of a remote sensing based light use efficiency model. Prog. Phys. Geogr. 2013, 37, 642–663. [Google Scholar] [CrossRef]
- Zhang, Q.Y.; Cheng, Y.B.; Lyapustin, A.I.; Wang, Y.J.; Xiao, X.M.; Suyker, A.; Verma, S.; Tan, B.; Middleton, E.M. Estimation of crop gross primary production (GPP): I. Impact of MODIS observation footprint and impact of vegetation BRDF characteristics. Agric. Forest Meteorol. 2014, 191, 51–63. [Google Scholar] [CrossRef]
- Zhang, Q.Y.; Middleton, E.M.; Cheng, Y.B.; Landis, D.R. Variations of foliage chlorophyll fAPAR and foliage non-chlorophyll fAPAR (fAPARchl, fAPARnon-chl) at the harvard forest. IEEE J. Sel. Top. Appl. Earth Obs. Remote Sens. 2013, 6, 2254–2264. [Google Scholar] [CrossRef]
- Zhang, Q.Y.; Middleton, E.M.; Gao, B.C.; Cheng, Y.B. Using EO-1 hyperion to simulate HyspIRI Products for a coniferous forest: The fraction of PAR absorbed by chlorophyll (fAPARchl) and Leaf Water Content (LWC). IEEE Trans. Geosci. Remote Sens. 2012, 50, 1844–1852. [Google Scholar] [CrossRef]
- Zhang, Q.Y.; Middleton, E.M.; Margolis, H.A.; Drolet, G.G.; Barr, A.A.; Black, T.A. Can a satellite-derived estimate of the fraction of PAR absorbed by chlorophyll (fAPARchl) improve predictions of light-use efficiency and ecosystem photosynthesis for a boreal aspen forest? Remote Sens. Environ. 2009, 113, 880–888. [Google Scholar] [CrossRef]
- Zhang, Q.Y.; Xiao, X.M.; Braswell, B.; Linder, E.; Baret, F.; Moore, B. Estimating light absorption by chlorophyll, leaf and canopy in a deciduous broadleaf forest using MODIS data and a radiative transfer model. Remote Sens. Environ. 2005, 99, 357–371. [Google Scholar] [CrossRef]
- Ogutu, B.O.; Dash, J. An algorithm to derive the fraction of photosynthetically active radiation absorbed by photosynthetic elements of the canopy (fAPAR(ps)) from eddy covariance flux tower data. New Phytol. 2013, 197, 511–523. [Google Scholar] [CrossRef] [PubMed]
- Ogutu, B.O.; Dash, J.; Dawson, T.P. Developing a diagnostic model for estimating terrestrial vegetation gross primary productivity using the photosynthetic quantum yield and Earth Observation data. Glob. Change Biol. 2013, 19, 2878–2892. [Google Scholar] [CrossRef]
- Ogutu, B.O.; Dash, J.; Dawson, T.P. Evaluation of the influence of two operational fraction of absorbed photosynthetically active radiation (fAPAR) products on terrestrial ecosystem productivity modelling. Int. J. Remote Sens. 2014, 35, 321–340. [Google Scholar] [CrossRef]
- Breda, N.J.J. Ground-based measurements of leaf area index: A review of methods, instruments and current controversies. J. Exp. Bot. 2003, 54, 2403–2417. [Google Scholar] [CrossRef] [PubMed]
- Soudani, K.; Francois, C. Remote sensing: A green illusion. Nature 2014, 506, 165–166. [Google Scholar] [CrossRef] [PubMed]
- Guanter, L.; Zhang, Y.G.; Jung, M.; Joiner, J.; Voigt, M.; Berry, J.A.; Frankenberg, C.; Huete, A.R.; Zarco-Tejada, P.; Lee, J.E.; et al. Reply to Magnani et al.: Linking large-scale chlorophyll fluorescence observations with cropland gross primary production. Proc. Natl. Acad. Sci. USA 2014, 111, E2511–E2511. [Google Scholar] [CrossRef] [PubMed]
- Guanter, L.; Zhang, Y.G.; Jung, M.; Joiner, J.; Voigt, M.; Berry, J.A.; Frankenberg, C.; Huete, A.R.; Zarco-Tejada, P.; Lee, J.E.; et al. Global and time-resolved monitoring of crop photosynthesis with chlorophyll fluorescence. Proc. Natl. Acad. Sci. USA 2014, 111, E1327–E1333. [Google Scholar] [CrossRef] [PubMed]
- Magnani, F.; Raddi, S.; Mohammed, G.; Middleton, E.M. Let’s exploit available knowledge on vegetation fluorescence. Proc. Natl. Acad. Sci. USA 2014, 111, E2510–E2510. [Google Scholar] [CrossRef] [PubMed]
- Porcar-Castell, A.; Tyystjarvi, E.; Atherton, J.; van der Tol, C.; Flexas, J.; Pfundel, E.E.; Moreno, J.; Frankenberg, C.; Berry, J.A. Linking chlorophyll a fluorescence to photosynthesis for remote sensing applications: Mechanisms and challenges. J. Exp. Bot. 2014, 65, 4065–4095. [Google Scholar] [CrossRef] [PubMed]
- Hwang, T.; Kangw, S.; Kim, J.; Kim, Y.; Lee, D.; Band, L. Evaluating drought effect on MODIS Gross Primary Production (GPP) with an eco-hydrological model in the mountainous forest, East Asia. Glob. Change Biol. 2008, 14, 1037–1056. [Google Scholar] [CrossRef]
- Pan, Y.; Birdsey, R.; Hom, J.; McCullough, K.; Clark, K. Improved estimates of net primary productivity from MODIS satellite data at regional and local scales. Ecol. Appl. 2006, 16, 125–132. [Google Scholar] [CrossRef] [PubMed]
- Coops, N.C.; Jassal, R.S.; Leuning, R.; Black, A.T.; Morgenstern, K. Incorporation of a soil water modifier into MODIS predictions of temperate Douglas-fir gross primary productivity: Initial model development. Agr. Forest Meteorol. 2007, 147, 99–109. [Google Scholar] [CrossRef]
- Yi, C.; Rustic, G.; Xu, X.; Wang, J.; Dookie, A.; Wei, S.; Hendrey, G.; Ricciuto, D.; Meyers, T.; Nagy, Z.; Pinter, K. Climate extremes and grassland potential productivity. Environ. Res. Lett. 2012, 7. [Google Scholar] [CrossRef]
- Arneth, A.; Kelliher, F.M.; McSeveny, T.M.; Byers, J.N. Fluxes of carbon and water in a Pinus radiata forest subject to soil water deficit. Aust. J. Plant Physiol. 1998, 25, 557–570. [Google Scholar] [CrossRef]
- Granier, A.; Loustau, D.; Breda, N. A generic model of forest canopy conductance dependent on climate, soil water availability and leaf area index. Ann. Forest Sci. 2000, 57, 755–765. [Google Scholar] [CrossRef]
- Granier, A.; Reichstein, M.; Breda, N.; Janssens, I.A.; Falge, E.; Ciais, P.; Gruenwald, T.; Aubinet, M.; Berbigier, P.; Bernhofer, C.; et al. Evidence for soil water control on carbon and water dynamics in European forests during the extremely dry year: 2003. Agr. Forest Meteorol. 2007, 143, 123–145. [Google Scholar] [CrossRef]
- Xiao, X.M.; Zhang, Q.Y.; Braswell, B.; Urbanski, S.; Boles, S.; Wofsy, S.; Berrien, M.; Ojima, D. Modeling gross primary production of temperate deciduous broadleaf forest using satellite images and climate data. Remote Sens. Environ. 2004, 91, 256–270. [Google Scholar] [CrossRef]
- Xiao, X.M.; Zhang, Q.Y.; Hollinger, D.; Aber, J.; Moore, B. Modeling gross primary production of an evergreen needleleaf forest using MODIS and climate data. Ecol. Appl. 2005, 15, 954–969. [Google Scholar] [CrossRef]
- Xiao, J.F.; Zhuang, Q.L.; Law, B.E.; Chen, J.Q.; Baldocchi, D.D.; Cook, D.R.; Oren, R.; Richardson, A.D.; Wharton, S.; Ma, S.Y.; et al. A continuous measure of gross primary production for the conterminous United States derived from MODIS and AmeriFlux data. Remote Sens. Environ. 2010, 114, 576–591. [Google Scholar] [CrossRef]
- Xiao, X.M.; Zhang, Q.Y.; Saleska, S.; Hutyra, L.; De Camargo, P.; Wofsy, S.; Frolking, S.; Boles, S.; Keller, M.; Moore, B. Satellite-based modeling of gross primary production in a seasonally moist tropical evergreen forest. Remote Sens. Environ. 2005, 94, 105–122. [Google Scholar] [CrossRef]
- Caccamo, G.; Chisholm, L.A.; Bradstock, R.A.; Puotinen, M.L.; Pippen, B.G. Monitoring live fuel moisture content of heathland, shrubland and sclerophyll forest in South-Eastern Australia using MODIS data. Int. J. Wildland Fire 2012, 21, 257–269. [Google Scholar] [CrossRef]
- Ceccato, P.; Flasse, S.; Tarantola, S.; Jacquemoud, S.; Gregoire, J.M. Detecting vegetation leaf water content using reflectance in the optical domain. Remote Sens. Environ. 2001, 77, 22–33. [Google Scholar] [CrossRef]
- Zarco-Tejada, P.J.; Pushnik, J.C.; Dobrowski, S.; Ustin, S.L. Steady-state chlorophyll a fluorescence detection from canopy derivative reflectance and double-peak red-edge effects. Remote Sens. Environ. 2003, 84, 283–294. [Google Scholar] [CrossRef]
- Yebra, M.; Chuvieco, E.; Riano, D. Estimation of live fuel moisture content from MODIS images for fire risk assessment. Agr. Forest Meteorol. 2008, 148, 523–536. [Google Scholar] [CrossRef]
- Sow, M.; Mbow, C.; Hely, C.; Fensholt, R.; Sambou, B. Estimation of herbaceous fuel moisture content using vegetation indices and land surface temperature from MODIS data. Remote Sens. 2013, 5, 2617–2638. [Google Scholar] [CrossRef]
- Garbulsky, M.F.; Penuelas, J.; Papale, D.; Filella, I. Remote estimation of carbon dioxide uptake by a Mediterranean forest. Glob. Change Biol. 2008, 14, 2860–2867. [Google Scholar] [CrossRef]
- Goerner, A.; Reichstein, M.; Tomelleri, E.; Hanan, N.; Rambal, S.; Papale, D.; Dragoni, D.; Schmullius, C. Remote sensing of ecosystem light use efficiency with MODIS-based PRI. Biogeosciences 2011, 8, 189–202. [Google Scholar] [CrossRef]
- Cleugh, H.A.; Leuning, R.; Mu, Q.; Running, S.W. Regional evaporation estimates from flux tower and MODIS satellite data. Remote Sens. Environ. 2007, 106, 285–304. [Google Scholar] [CrossRef]
- Mu, Q.; Zhao, M.; Running, S.W. Improvements to a MODIS global terrestrial evapotranspiration algorithm. Remote Sens. Environ. 2011, 115, 1781–1800. [Google Scholar] [CrossRef]
- Yuan, W.; Liu, S.; Yu, G.; Bonnefond, J.-M.; Chen, J.; Davis, K.; Desai, A.R.; Goldstein, A.H.; Gianelle, D.; Rossi, F.; et al. Global estimates of evapotranspiration and gross primary production based on MODIS and global meteorology data. Remote Sens. Environ. 2010, 114, 1416–1431. [Google Scholar] [CrossRef]
- Albergel, C.; de Rosnay, P.; Gruhier, C.; Munoz-Sabater, J.; Hasenauer, S.; Isaksen, L.; Kerr, Y.; Wagner, W. Evaluation of remotely sensed and modelled soil moisture products using global ground-based in situ observations. Remote Sens. Environ. 2012, 118, 215–226. [Google Scholar] [CrossRef]
- Doubkova, M.; van Dijk, A.I.J.M.; Sabel, D.; Wagner, W.; Bloeschl, G. Evaluation of the predicted error of the soil moisture retrieval from C-band SAR by comparison against modelled soil moisture estimates over Australia. Remote Sens. Environ. 2012, 120, 188–196. [Google Scholar] [CrossRef] [PubMed]
- Van der Velde, R.; Su, Z.; van Oevelen, P.; Wen, J.; Ma, Y.; Salama, M.S. Soil moisture mapping over the central part of the Tibetan Plateau using a series of ASAR WS images. Remote Sens. Environ. 2012, 120, 175–187. [Google Scholar] [CrossRef]
- Su, C.-H.; Ryu, D.; Young, R.I.; Western, A.W.; Wagner, W. Inter-comparison of microwave satellite soil moisture retrievals over the Murrumbidgee Basin, Southeast Australia. Remote Sens. Environ. 2013, 134, 1–11. [Google Scholar] [CrossRef]
- Paloscia, S.; Pettinato, S.; Santi, E.; Notarnicola, C.; Pasolli, L.; Reppucci, A. Soil moisture mapping using Sentinel-1 images: Algorithm and preliminary validation. Remote Sens. Environ. 2013, 134, 234–248. [Google Scholar] [CrossRef]
- Barrett, D.J.; Renzullo, L.J. On the efficacy of combining thermal and microwave satellite data as observational constraints for root-zone soil moisture estimation. J. Hydrometeorol. 2009, 10, 1109–1127. [Google Scholar] [CrossRef]
- Tran, A.P.; Vanclooster, M.; Lambot, S. Improving soil moisture profile reconstruction from ground-penetrating radar data: A maximum likelihood ensemble filter approach. Hydrol. Earth Syst. Sci. 2013, 17, 2543–2556. [Google Scholar] [CrossRef]
- Renzullo, L.J.; Barrett, D.J.; Marks, A.S.; Hill, M.J.; Guerschman, J.P.; Mu, Q.; Running, S.W. Multi-sensor model-data fusion for estimation of hydrologic and energy flux parameters. Remote Sens. Environ. 2008, 112, 1306–1319. [Google Scholar] [CrossRef]
Appendix
| Year | Spring | Summer | Autumn | Winter |
|---|---|---|---|---|
| 2001 | - | −3 | −12 | −16 |
| 2002 | −1 | −1 | −7 | −10 |
| 2003 | 0 | −1 | −7 | −13 |
| 2004 | 0 | −2 | −9 | −13 |
| 2005 | −3 | −5 | −9 | −12 |
| 2006 | −1 | −3 | −12 | −13 |
| 2007 | −2 | −1 | −8 | −13 |
| 2008 | −2 | −4 | −7 | −12 |
| 2009 | 0 | 3 | −4 | −10 |
| 2010 | −1 | 6 | −6 | −10 |
| Year | 2001 | 2002 | 2003 | 2004 | 2005 | 2006 | 2007 | 2008 | 2009 | 2010 |
|---|---|---|---|---|---|---|---|---|---|---|
| PARmax | 60.4 | 60.9 | 57.6 | 61.4 | 58.6 | 62.4 | 58.6 | 58.3 | 62.5 | 59.1 |
| PARmean | 31.0 | 30.3 | 28.8 | 28.3 | 30.7 | 30.9 | 31.2 | 29.7 | 31.8 | 30.9 |
| Year | Tmin (°C) | VPD (hPa) | RWC | EC GPP (g∙C∙m−2) | ||||
|---|---|---|---|---|---|---|---|---|
| Max. | DOY | Max. | DOY | Min. | DOY | Min. within Drought | DOY | |
| 2001 | 22.7 | 214 | 22.1 | 6/22 | 0.40 | 230 | 1.57 | 220–224 |
| 2002 | 22.2 | 228 | 20.5 | 228 | 0.41 | 234–236 | 0.76 | 225–232 |
| 2003 | 23.8 | 166 | 33.2 | 224 | 0.40 | 224–229 | 0.35 | 217–244 |
| 2004 | 22.2 | 182 | 23.2 | 206 | 0.43 | 215–216 | 2.46 | 209–216 |
| 2005 | 22.3 | 159 | 25.6 | 220 | 0.42 | 247–248 | 0.85 | 233–240 |
| 2006 | 24.3 | 193 | 27.2 | 181 | 0.39 | 220–227 | 0.45 | 217–224 |
| 2007 | 23.4 | 208 | 23.3 | 208 | 0.40 | 260 | 0.76 | 249–256 |
| 2008 | 23.1 | 181 | 21.6 | 217 | 0.41 | 292–293 | 1.24 | 283–296 |
| 2009 | 22.1 | 189 | 23.7 | 225 | 0.39 | 252–261 | 0.43 | 252–256 |
| 2010 | 22.3 | 127 | 23.4 | 199 | 0.39 | 246–249 | 0.70 | 233–240 |


© 2015 by the authors; licensee MDPI, Basel, Switzerland. This article is an open access article distributed under the terms and conditions of the Creative Commons Attribution license (http://creativecommons.org/licenses/by/4.0/).
Share and Cite
Liu, J.; Rambal, S.; Mouillot, F. Soil Drought Anomalies in MODIS GPP of a Mediterranean Broadleaved Evergreen Forest. Remote Sens. 2015, 7, 1154-1180. https://doi.org/10.3390/rs70101154
Liu J, Rambal S, Mouillot F. Soil Drought Anomalies in MODIS GPP of a Mediterranean Broadleaved Evergreen Forest. Remote Sensing. 2015; 7(1):1154-1180. https://doi.org/10.3390/rs70101154
Chicago/Turabian StyleLiu, Jia, Serge Rambal, and Florent Mouillot. 2015. "Soil Drought Anomalies in MODIS GPP of a Mediterranean Broadleaved Evergreen Forest" Remote Sensing 7, no. 1: 1154-1180. https://doi.org/10.3390/rs70101154
APA StyleLiu, J., Rambal, S., & Mouillot, F. (2015). Soil Drought Anomalies in MODIS GPP of a Mediterranean Broadleaved Evergreen Forest. Remote Sensing, 7(1), 1154-1180. https://doi.org/10.3390/rs70101154