Land Cover Characterization and Classification of Arctic Tundra Environments by Means of Polarized Synthetic Aperture X- and C-Band Radar (PolSAR) and Landsat 8 Multispectral Imagery — Richards Island, Canada

 ,
, 
Abstract
: In this work the potential of polarimetric Synthetic Aperture Radar (PolSAR) data of dual-polarized TerraSAR-X (HH/VV) and quad-polarized Radarsat-2 was examined in combination with multispectral Landsat 8 data for unsupervised and supervised classification of tundra land cover types of Richards Island, Canada. The classification accuracies as well as the backscatter and reflectance characteristics were analyzed using reference data collected during three field work campaigns and include in situ data and high resolution airborne photography. The optical data offered an acceptable initial accuracy for the land cover classification. The overall accuracy was increased by the combination of PolSAR and optical data and was up to 71% for unsupervised (Landsat 8 and TerraSAR-X) and up to 87% for supervised classification (Landsat 8 and Radarsat-2) for five tundra land cover types. The decomposition features of the dual and quad-polarized data showed a high sensitivity for the non-vegetated substrate (dominant surface scattering) and wetland vegetation (dominant double bounce and volume scattering). These classes had high potential to be automatically detected with unsupervised classification techniques.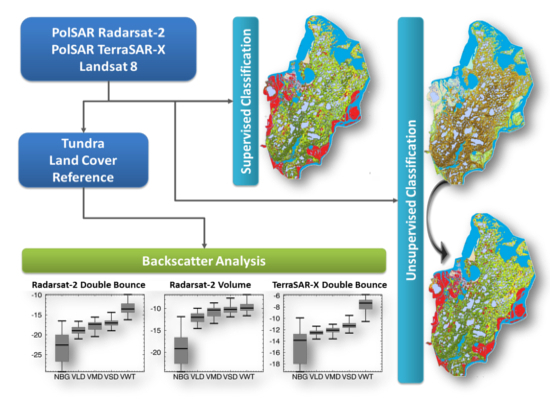
1. Introduction and Objectives
The ecosystem of the high northern latitudes is affected by the recently changing environmental conditions [1]. With regard to the regional and global implications there is a need for high resolution spatiotemporal information of the Arctic’s surface and the occurring changes. It has been demonstrated that this information can be collected by the use of remotely sensed data from various sources [2]. Remote sensing of the Arctic’s land coverage was primarily carried out by the use of optical sensors [3–6]. The use of optical remote sensing data on the one hand encounters problems in the arctic environment, such as persistent cloud cover and the solar geometry [3] fragmented land cover boundaries, fast changing spectral characteristics and low spectral contrast of land cover types in general [7]. Imaging of Synthetic Aperture Radar (SAR), on the other hand, is not affected by cloud cover and the acquisition is independent of solar illumination due to the active sending of defined electromagnetic pulses. SAR sensors are capable of acquiring data over the whole year at any time with constant quality and independent of external situation. Compared to optical sensors the interpretation of SAR imagery is more challenging and not intuitive. It is based on the physical structure and dielectric properties of the target and not on the spectral properties. The content of information varies with the acquisition parameters [8].
SAR data have been shown to be of value for various applications related to periglacial processes and the Arctic environment in general. The application of SAR interferometry (InSAR) offers ways to measure the ground movement/subsidence related to the freezing and thawing of the active layer [9,10], to solifluction processes [11], or to mass movements, e.g., coastal erosion slumps [12]. InSAR techniques are suited to derive digital elevation models (DEM) of the earth surface. Recently, German TerraSAR-X [13] and TanDEM-X [14] satellites performed global InSAR measurements in a helix configuration of the two satellite orbits. Single polarimetric SAR data has been used for the characterization of arctic landscapes, e.g., Regmi et al. [15] used TerraSAR-X imagery for the characterization of post-drainage succession in thermokarst lake basins. The backscatter characteristics of ASAR data were used in time series analysis for mapping of freeze and thaw cycles as shown by Park et al. [16]. Similarly, SAR data have been used widely for the characterization of snow and ice [17,18] and glacial processes [19].
The analysis of polarimetric SAR data (PolSAR) has shown previously to be suitable for land cover characterization (e.g., in terms of biomass [20]) or land cover classification for various ecosystems (e.g., tropics) and anthropogenic disturbed landscapes, such as urban areas [21] or agricultural regions [22]. Few research projects have addressed the use of PolSAR data for land cover characterization and classification of tundra environments. Collingwood et al. [23] showed the usage of quad-polarized Radarsat-2 data for the modeling of above-ground phytomass for high arctic environment. The findings indicate that the data are sensitive for specific cover types of the area of investigation. PolSAR data from TerraSAR-X and Radarsat-2 have been applied to detect snowmelt events in the Lena Delta (Russia) and were identified as meaningful for the delineation of geomorphological units [24]. Quad-polarized Radarsat-2, as well as dual-polarized TerraSAR-X imagery, was shown to be suitable in previous work for land cover classification of artic coastal regions of the southern Beaufort Sea [25–27]. The information on the arctic land cover is of interest for detection and quantification of sudden changes (e.g., large scale erosion) [28] and for the quantification and monitoring of vegetation succession. This succession is likely to take place due to recently changing environmental parameters (e.g., climate change). A quantification and monitoring of Arctic vegetation is of interest with respect to the estimation of the carbon stock and the carbon flux [4,5,29]. Beside this information on coverage is of interest for assessment in case of oil disasters [30,31].
The objective of this research is to evaluate the potential of PolSAR data of X-Band and C-Band of TerraSAR-X and Radarsat-2 for land cover characterization and classification of the arctic environment of Richards Island, Canada. In addition the combined use of optical Landsat 8 and PolSAR data is investigated for land cover classification. The major objectives of this study are formulated as follows:
Evaluation of the amplitudes as well as decomposition features of dual-polarized and quad-polarized X- and C-Band data for the characterization of the tundra land cover. The short wavelengths of X (∼2–3 cm)—and C (∼5–6 cm)—Bands are assumed to be suitable to characterize the comparatively small vegetation, wetlands and open substrates of Richards Island. For the evaluation of the PolSAR data the following hypotheses are stated:
- ○
Wetland vegetation shows a high double bounce backscattering due to the interaction of the electromagnetic wave with the water and the stem of the vegetation forming a strong reflector.
- ○
It is expected that the open substrate without vegetation cover causes a high surface scattering, respectively dominant single bounce directly from the surface (depending on the roughness).
- ○
Closed tundra vegetation is expected to show distinct volume or mixed scattering depending on the type of vegetation. It is assumed that an increasing shrub density causes a higher volume backscattering since the volume of the vegetation body is bigger compared to the grass and herb dominated vegetation formations. In analogy to this it is expected that small vegetation such as low grasses and herbs cause a low volume scattering but a relatively high surface scattering.
According to these hypotheses the PolSAR data facilitate the characterization of the tundra landscapes based on the physical structure of the coverage and they give complementary information to optical data. This is of value in accurate land cover classification and to consistently monitor arctic land surface properties.
It is further a goal to investigate the potential of PolSAR data and of multi-sensor PolSAR and optical data in unsupervised and supervised land cover classification. A focus lies on the application of the unsupervised classification, since reference information on the Artic land cover is usually sparse due to limited accessibility. The circumference of the Arctic further makes an automated system desirable.
The analysis concentrates on a small number of general tundra land cover types that are anticipated to be detectable by the PolSAR systems. The chosen classes are meaningful as indicators of the change of the northern high latitude ecosystem and of ecological sensitive regions, such as shrub or wetland dominated regions.
Section two of this contribution gives information on the environment of the test site Richards Island, Canada. Section three provides information on the reference data, the PolSAR and optical data. The methodology of the unsupervised and supervised classifiers is shown in this section as well. Results of the boxplot, scatterplot and separability analysis are shown in section four along with the results from unsupervised and supervised land cover classification. Finally section five provides conclusions and a summary of this study.
2. Test Site Description
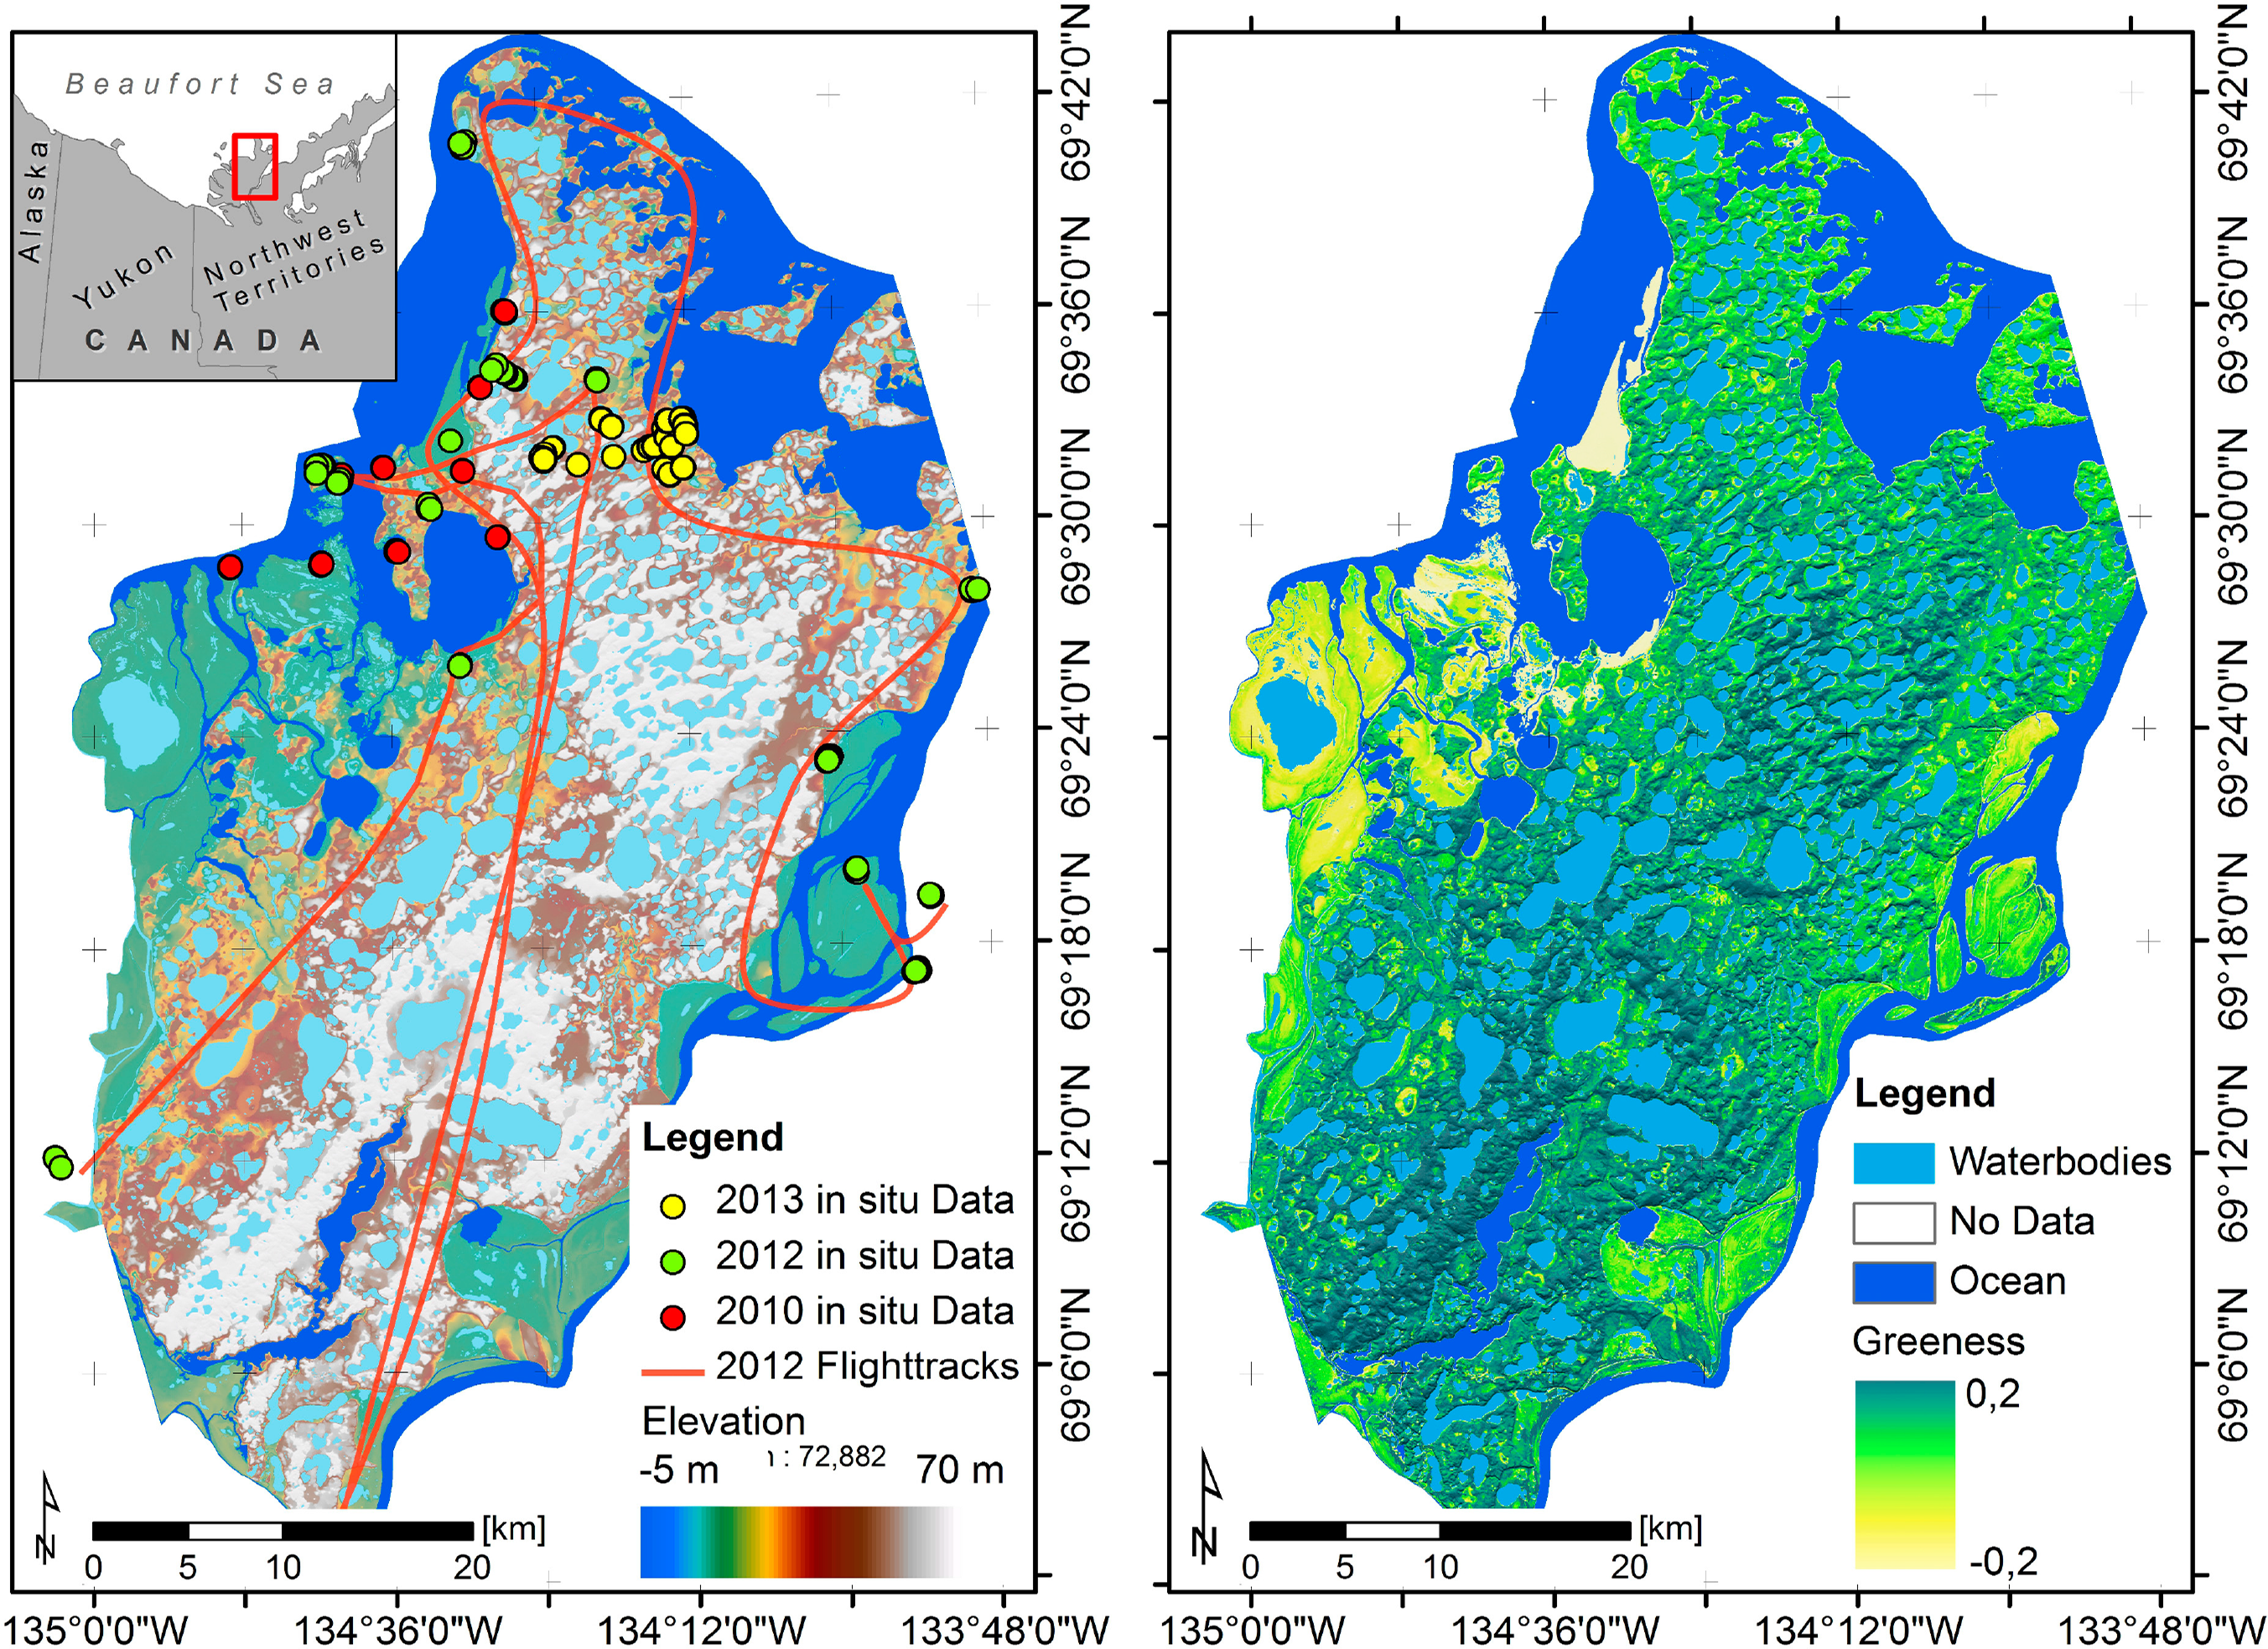
The test site of this study is Richards Island, Northwest Territories, Canada—located at about 69° Northern Latitude and 133° Western Longitude (Figure 1). The island is separated from the mainland by the East Channel of the Mackenzie River in the south, by the channels of the Mackenzie delta complex in the west and by the ocean of the southern Beaufort Sea in the north and east. It is part of the greater Mackenzie Delta Region and directly neighboring the Mackenzie Delta complex.
The Mackenzie Delta coastal region is part of the Beaufort-Mackenzie Delta Basin (Northern Beaufort Continental Shelf) and bounded to the north by the Arctic Ocean [32]. As part of the subarctic ecosystem the climatic situation of the area is forced mainly by orbital parameters and shows a strong seasonality with distinct summer and winter conditions and a relatively short transition time in spring and autumn. The summers are short and cool, winters long and cold. Precipitation is low throughout the year and shows a peak in the summer and fall months [33]. The region is part of the continuous permafrost zone. The average ground temperatures are low and range from −10 °C to 0 °C. The surface is underlaid by ice-bearing permafrost (IBPF). The IBPF can have a thickness of several hundreds of meters up to a maximum of about 700 m under the central part of Richards Island [34]. While the surrounding sediments show a distinct thickness of IBPF, the Mackenzie valley and modern delta complex itself have in general a lower thickness of IBPF due to the warming effects of water bodies [34].
The vegetation of the Greater Mackenzie Delta region is characterized by four general zones: (1) the open spruce boreal woodlands in the south of the Mackenzie valley and on the flanking uplands (Caribou Hills and Richards Mountains); (2) a zone with a transition from forest to tundra separated by the tree line; (3) the tundra formations north of the tree line in the delta and on the uplands; (4) wetlands with sedge formations at the flat outer delta plains [35]. Richards Island is part of the third zone. The vegetation is characterized as low arctic tundra (see Figure 2); grass, sedges and dwarf shrubs dominate the land cover, while the surficial cover is dominated by small herbs and mosses. The growing season is short and peaks in summer. Many regions show a hummocky structure of the ground. Wetlands appear inland at creeks and drained lakes and in association with shallow inshore waters. The vegetation of these wetlands is dominated by tussocks, sedges and small reeds [33,35]. The active geomorphology is visible in the form of erosion slumps. These are usually in association with polygonal ice complexes and at the water/land boundary of ocean, river and lake shores [36]. The eco- and geosystem of greater Mackenzie Delta Region is a habitat for many mammals and bird species and it is of high ecological value.
3. Data and Methods
For this research polarized SAR data of TerraSAR-X (TSX) and Radarsat-2 (R-2) of Richards Island have been acquired in 2012 and 2010 (Table 1). Landsat 8 data were acquired in 2013 as well. These data sources were used to characterize and classify the land cover with respect to ground truth reference data. The classification was done in unsupervised and supervised way using data of each single sensor and a combination of SAR and optical data.
3.1. PolSAR Data
The information content of SAR data is a function of the acquisition parameters (e.g., incidence angle, polarization, wavelength or acquisition mode) and the target parameters (e.g., dielectric properties, physical structure or orientation). The acquisition parameters are chosen in accordance with the capacities of the imaging SAR system and are defined variables. The target properties are variable and are the variables of interest. Microwave radiation can transit targets depending on the properties of this target; the penetration depth increases with the wavelength. Depending on the wavelength of the SAR system information on the structure below the canopy of vegetation or even information on near surface conditions can be collected. The data can be used to model the type of backscatter via polarimetric analysis.
Most SAR systems are able to send and receive not only one single polarization channel but multiple channels in different polarizations simultaneously in vertical (V) or horizontal (H) polarization—such as HH, VV, HV or VH, where the first letter describes the transmitted polarization and the second letter, the received polarization for products of R-2 and TSX. Information of more than one polarization channel can be used to characterize the type of backscattering via polarimetric analysis [37]. Two types of polarimetric systems are commonly distinguished: (1) the full or quad-polarized systems and (2) the dual-polarized systems. The former are able to acquire four polarization channels simultaneously and coherently. The quad-polarized data have been widely used for backscatter modelling [38,39]. The systems Radarsat-2 and ALOS [40] (and in future ALOS-2 [41]) are able to acquire data in this mode. The dual-polarized systems have in general a higher resolution compared to the quad-polarized systems when working with the same wavelength. They acquire two out of the four polarization channels; either the cross-polarized information (HH/HV or VV/VH) or the co-polarized information (HH/VV) coherently. The recently launched Sentinel-1, Radarsat-2 and TerraSAR-X satellites are able to acquire the cross-polarized information. Few systems such as TerraSAR-X, PAZ and COSMO-Skymed are designed to acquire the co-polarized information coherently. The co-polarized information can be used to model backscattering types such as double bounce or surface scattering. The cross-polarized information is known to be sensitive to volume scattering processes and can be related to the type and structure of vegetation [37]. The backscattering processes can be simplified to three general types: double bounce scattering, surface or odd bounce scattering and volume or randomly oriented dipoles [7].
3.1.1. Representations of PolSAR Data
The information of polarimetric SAR data is commonly stored in the form of the Sinclair matrix (S-Matrix), where a pixel has a complex value (real and imaginary part) for each polarimetric channel. When PolSAR data are multi-looked the data is usually converted to one of the following matrices: the Coherency Matrix (T-Matrix) and the Covariance Matrix (C-Matrix) [37]. T-, and C- Matrices can be converted into each other by linear transformations [37]. In polarimetric analysis commonly a complex Wishart Distribution (multivariate χ2 distribution) for multi-looked data is anticipated for C- and T-Matrix [42].
3.1.2. Decomposition of PolSAR Data
Several concepts exist to generate polarimetric features that facilitate the interpretation of the PolSAR signal in terms of the backscattering processes. These concepts are decomposing the total received energy (the sum of all acquired polarimetric channels and called span) into individual components. The frequently used decomposition models are Power Decompositions (e.g., Freeman-Durden Decomposition [43] and the Yamaguchi Decomposition [44]) and Eigendecompositions (e.g., Cloude Pottiers’ Entropy/Alpha decomposition [45]). Most of these models were designed for the usage of quad-polarized data but some of them can be adapted to dual-polarized data as specified in the following. The decomposition models are designed to characterize the SAR backscattering process and to facilitate the interpretation and classification of the PolSAR signal; these features help to evaluate the relation between the SAR signal and physical parameters of the earth surface, e.g., the biomass, moisture conditions or land cover properties. The characteristics of the PolSAR data of R-2 and TSX will be analyzed based on Cloude Pottiers’ Entropy/Alpha decomposition for dual-polarized and quad-polarized data and on two and three component Power decomposition. These models provide an effective characterization of the land cover. The computation and interpretation is described in the following.
The four component Yamaguchi Decomposition [44] is decomposing the span into the scattering power components of surface scattering, double bounce, volume scattering and helix scattering. It is based on the spatial average Coherency Matrix (T-Matrix) of quad-polarized data. This decomposition scheme is frequently applied as three component model decomposing the span in the power components of surface scattering Ps (ODD), double bounce Pd (DBL) and volume scattering Pv (VOL) Equation (1) [37].
The models of surface and double bounce are based on the co-polarized information and a straight forward approach is to decompose the span of a co-polarized system into the scattering power components of surface Ps (ODD) and double bounce Pd (DBL) Equation (2). The scattering power components volume and helix scattering are not obtainable due to the missing cross-polarized information [27,37]. The obtained features double bounce and odd bounce are different from a quad polarized system since they are not adjusted to the cross-polarized information, e.g. there is no adjustment using the volume scattering. The equation can be solved in analogy to the four/three component decomposition model [37,44].
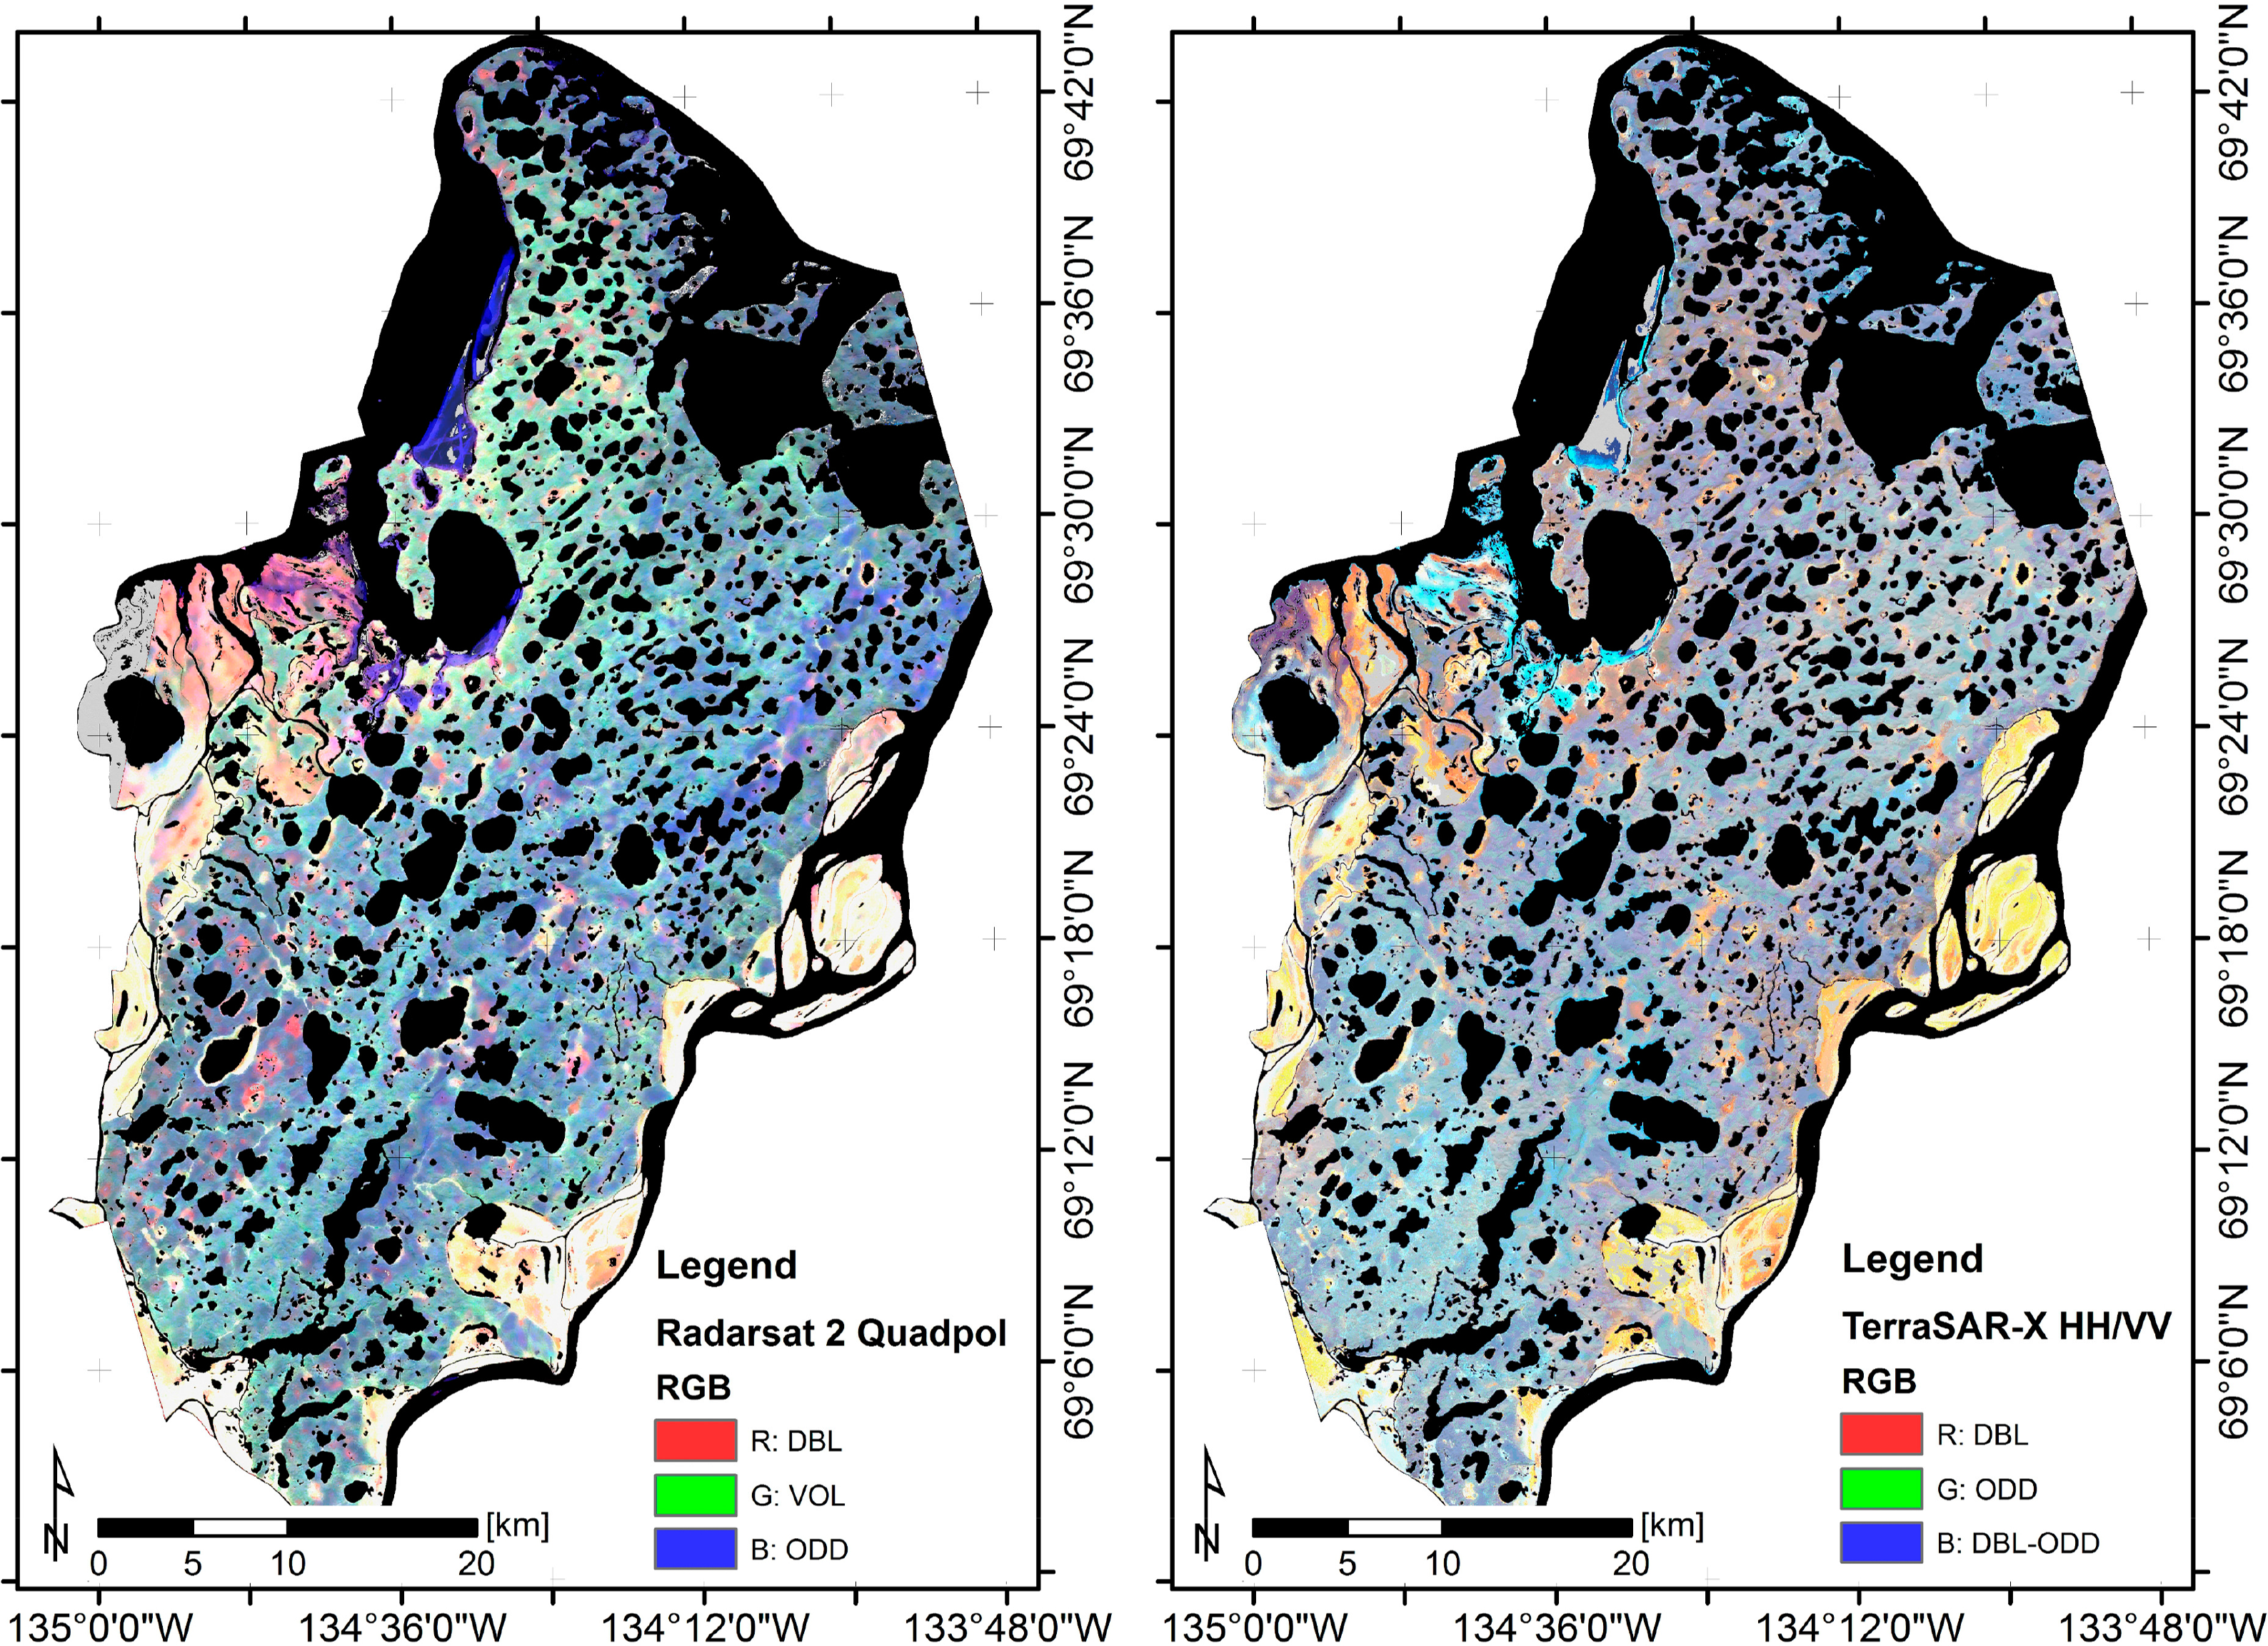
A RGB false color images of quad-polarized Yamaguchi Decomposition of R-2 and dual-polarized Two Component Decomposition of TSX are shown for Richards Island in Figure 3. Yellowish and reddish colors correspond mainly to the wetlands of the delta complex and the East Channel. The bluish and turquois colors indicate bare substrate and sparse vegetation areas.
Coherency and Covariance Matrix of dual or quad-polarized systems can further be decomposed using the Eigendecomposition approach [38,39]. For dual-polarized system two eigenvalues λ and two eigenvectors μ are obtained. For quad-polarized data—under assumption of reciprocity—three eigenvalues and three eigenvectors are obtained [45]. The Eigenvalues of T- and C-Matrix are real and the same, whereas the eigenvectors differ from each other. Eigenvalue and eigenvector based Entropy/Alpha Decomposition was shown by Cloude and Pottier [45]. The features Entropy H and Alpha α describe the backscattering properties of pixel in an incoherent way. The Entropy (Equation (3), Parameter n is the number of eigenvalues) can be interpreted as the degree of randomness of the backscattering signal [45]. The Entropy is calculated via the pseudo probabilities p of the eigenvalues Equation (4). It is described by the logarithmic sum of the pseudo probabilities and ranges from zero to one. Alpha is the sum of inverse cosine of the absolute value of the eigenvectors weighted by the pseudo probabilities Equation (5). The Alpha of T-Matrix indicates the type of backscattering. Low Alpha values describe single bounce, medium Alpha values describe volume scattering and high Alpha values indicate dominant double bounce scattering. Alpha is usually shown as scattering angle between zero and ninety degrees. In the following Alpha is shown in the interval zero to one. Total backscattered energy is the sum of the eigenvalues (span) [45]. This decomposition can be applied to dual-polarized data as well [46,47].
3.1.3. Processing Chain
The data of TSX were imaged as dual-polarized data (HH/VV), where the channels are phase coherent. The data of R-2 were acquired in quad-polarized mode with coherency of all channels (HH, HV, VH and VV). For quad-polarized data reciprocity (HV = VH) was assumed for all the following operations. From the quad-polarized R-2 data a polarimetric subset (HH/HV) was done. The geometric location error after terrain correction between R-2 and TSX data was less than 10 m. TSX and R-2 imagery were processed according to the following steps. Steps (1) to (6) were processed Next ESA SAR Toolbox (NEST Version 5.1). Steps (7) to (9) were processed in Exelis IDL8.2/ENVI 5.0.
- (1)
Level 1 data import (SSC, SLC) and calibration from digital numbers to beta nought reflectance values;
- (2)
Adjustment of pixel-size (square pixel on ground), derivation of scattering Matrix and subsequent boxcar speckle filtering [48,49];
- (3)
Geometric Terrain Correction to Universal Transverse Mercator (UTM) Zone 8 North (WGS84 ellipsoid) with twelve meter resolution (bilinear interpolation) using Range Doppler approach and TanDEM-X digital elevation model data [50,51];
- (4)
Radiometric calibration to sigma nought using the projected local incidence angle from TanDEM-X digital elevation model [52];
- (5)
Non-Local-Means post filtering of Scattering Matrix intensities with a patch window size of 3 × 3 pixels, a search window size of 31 × 31 pixels. The Non-Local-Means filter used is similar to the Buades’ Non-Local Filter [53] and applied here for image generalization. The parameterization was done semi-automatically. The application and the effectiveness of Non-Local-Means filtering of PolSAR data was shown for example in [54,55];
- (6)
Cloude Pottiers’ Entropy/Alpha Decomposition, Three Component Yamaguchi Decomposition and Two Component Decomposition;
- (7)
Mosaicing of TSX and R-2 data (Table 1) and color balancing using ENVI’s mosaic function.
3.2. Landsat 8 Multispectral Data
Landsat 8 multispectral imagery of Richards Island was acquired in August 2013 [56], contemporaneously to field work. The cloud free data were processed to geocoded Level 1T and corrected to the top of atmosphere reflectance (TOA) using the scene specific metadata. The data were manually referenced to the SAR data (image-to-image) with an estimated location error of less than 20 m. The data were projected to Universal Trans Mercator (UTM) Zone 8 North using WGS84 ellipsoid with a spatial resolution of 30 m. From the TOA reflectances Normalized Difference Vegetation Index (NDVI) was calculated as well as Brightness, Greenness (see Figure 1) and Wetness using the tasseled cap transformation [57].
3.3. Reference Data
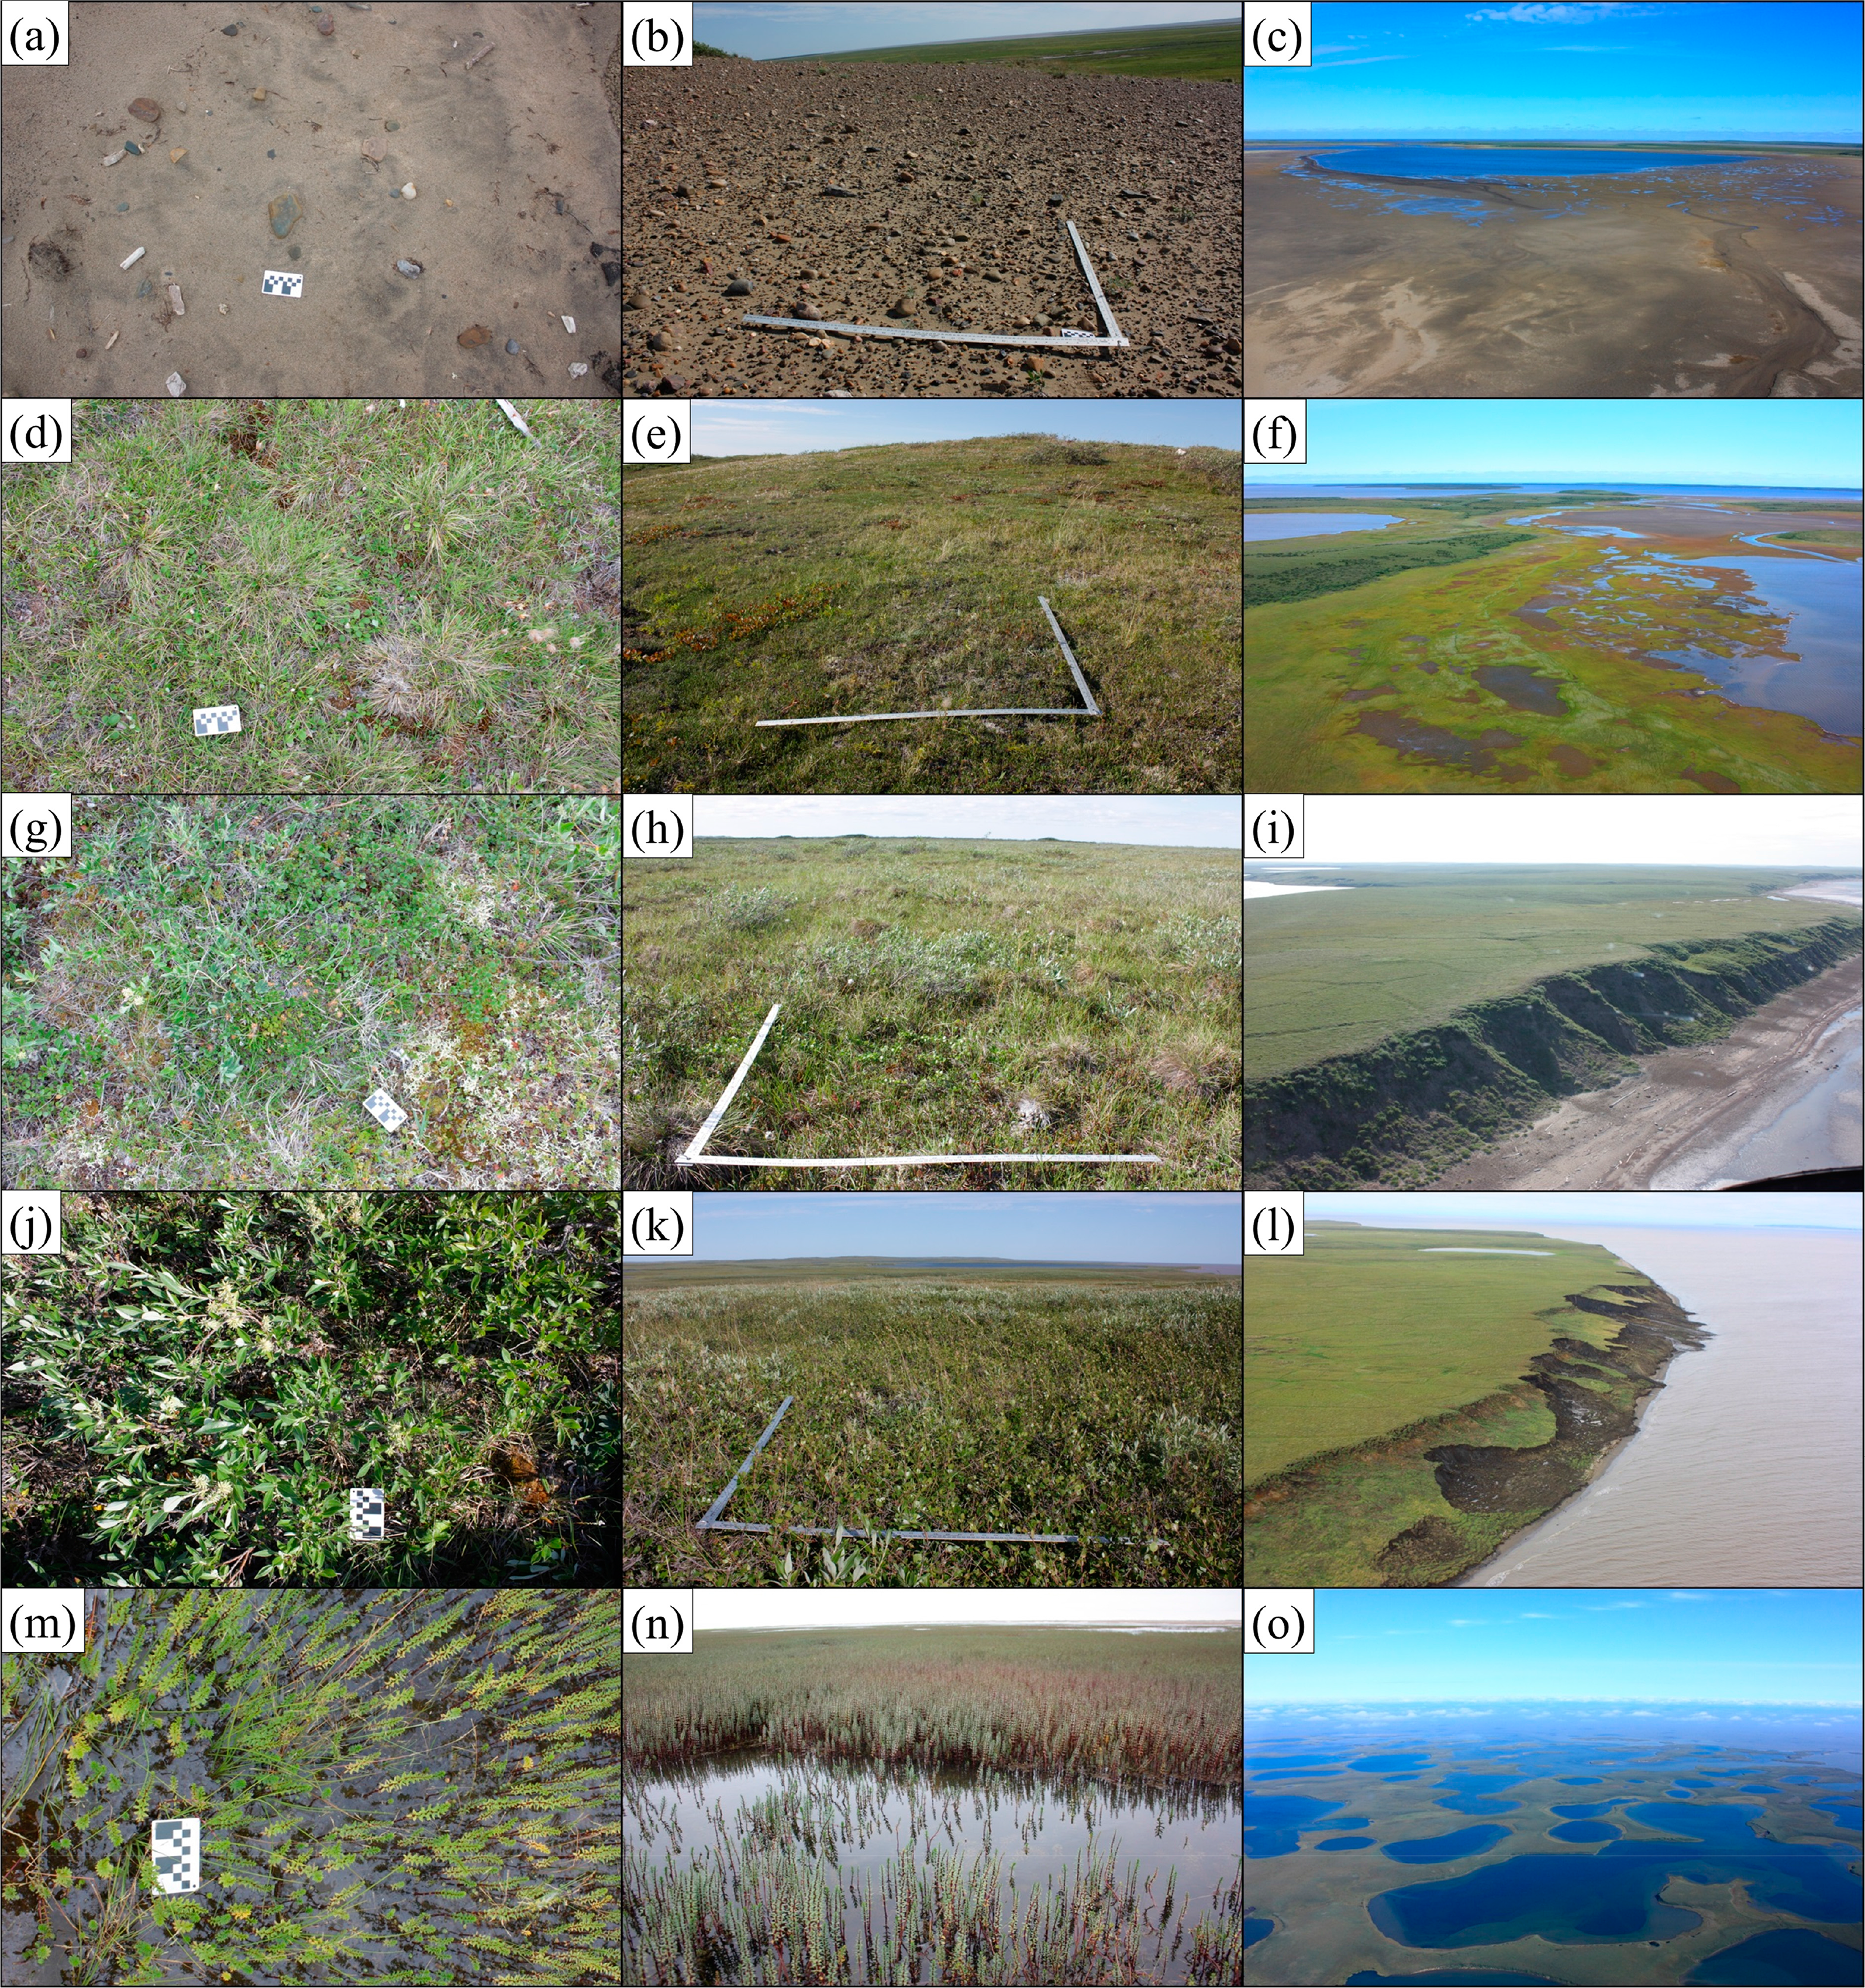
Land cover reference data for Richards Island were collected during three field work campaigns in 2010, 2012 and 2013. Test sites were visited and ground control points of representative locations were surveyed using GPS field instruments. In addition, airborne photos taken during the Polar 5 Campaign (Dr. Hartmann and Dr. Sachs) in summer 2012 and 2013 by the Alfred Wegener Institute (AWI) and airborne photos taken from helicopter observation in 2012 were used as reference. The data mapped during the campaigns were aggregated in six general land cover classes with respect to [35]. The in-situ criteria for the cut-off between classes were the heights of the formations and the percent coverage of shrubs. Field photographs of the land cover from top and angular view and airborne photography of Richards Island are shown in Figure 2. The land cover classes of interest for this study are:
Water (NWA): Open water areas such as river, lakes and ocean. Thermokarst processes have led to a high number of small and big inland lakes.
Bare Substrate (NBG): Non-vegetated open substrate of varying grain sizes and bedrock. Mudflats are present at the west coast of Richards Island near the bay of West Point and the Burnt Creek. Elongated spits are present east of the North Head of Richards Island.
Low/Grass and Herb Dominated Tundra (VLD): Closed tundra vegetation cover less than 20 cm height dominated by formations of grasses, mosses and small herbs, no shrubs. Low tundra formations are common at the north head of Richards Island, at the surroundings of Madison Bay towards Summer Island and at the hill tops south close to the Mackenzie East Channel. In general the occurrence is observed with increasing elevation and at exposed areas, such as hill tops. Locations are comparably dry.
Medium/Herb Dominated Tundra (VMD): Closed tundra vegetation cover less than 50 cm height dominated by formations of herbs and dwarf shrubs. The percent coverage of shrubs is less than 50%. This type of mixed tundra is frequent at the transition between exposed uplands and low lying plains and creeks.
High/Shrub Dominated Tundra (VSD): Closed tundra vegetation cover usually less than 100 cm height dominated by formations of dwarf shrubs. The percent coverage of shrubs is higher than 50%. Areas of extensive shrub dominance are present on Richards Island at the leeward side of the hills and brims. In general the frequency of shrub coverage decreases from south to north, from east to west and from high to low elevation.
Wetlands (VWT): Vegetated areas in standing water usually dominated by sedge formations. Coastal Wetlands are present at the western boundary of Richards Island located at the delta complex of the Bird Sanctuary. Wetlands frequently occur inland at creeks and drained lakes and in association with shallow inshore waters (e.g., the Mackenzie East Channel).
In total, 50 plots were surveyed in situ during the field work with a plot size of 90 × 90 m. (see Figure 1). The number of samples was increased using the airborne reference data. These new samples were taken from homogeneous regions located close to the in-situ sites. The same number of samples was collected for each class. The reference data were cross validated with the TanDEM-X digital elevation model to avoid systematic topographic effects (e.g., slope or aspect dependencies) and misinterpretation. None of the classes showed a noticeable anomaly. To minimize the variance in the feature space water bodies (class NWA) were masked out in advance using vector reference data from [58] (see Figure 1). The remaining reference samples of the classes NBG, VLD, VMD, VSD, and VWT were used to estimate the accuracies of the land cover classifications (see Section 3.4.3. Accuracy Assessment). These samples were used as well for the scatterplot, correlation, and separability analysis.
3.4. Classification
The classification of the SAR and Landsat 8 data was done in unsupervised and supervised mode. The unsupervised classification was done using methods similar to unsupervised PolSAR Wishart Maximum Likelihood classifiers [42,45,59]. For supervised classification ENVI’s Maximum Likelihood Classifier was used. The PolSAR data used for the classification processed as described above. The reflectance values (TOA) of Landsat 8 and the Greenness were used in the classification. A standardization and normalization with respect to mean µ and standard deviation σ was done when combining data from different sources, e.g., combining TSX and Landsat 8 data. For Landsat 8 and for the combination of Landsat 8 and SAR data a Multivariate Gaussian Normal distribution was used in the classification processes; for TSX and R-2 data Wishart Distribution was used for the unsupervised classification process.
3.4.1. Unsupervised Classification Approach
In the unsupervised classification “[…] the attempt is made to find an underlying class structure automatically by organizing the data into groups sharing similar characteristics” [59]. The unsupervised classifiers do not require any training samples. This is favorable when little reference information is available. The unsupervised classifier used in this work is similar to the Maximum Likelihood classifiers used for PolSAR data [42]. It was adapted to operate with optical data and a combination of optical and PolSAR data as well. The classifier is a combination of Jenks-Natural Breaks [60], Fuzzy-K-Means (FKM) from [59] and Maximum Likelihood classifiers (MLC) [42,59].
The effectiveness of MLC in unsupervised classification of quad-polarized PolSAR data has been demonstrated by Lee et al. [42] and the intention of our approach is to provide a MLC scheme that is capable to handle quad- and dual-polarized PolSAR and optical data. It is known that MLC alone is sensitive to the initialization conditions and can become unstable when it is randomly initialized [59]. A more stable and robust performance of the MLC can be realized by estimating the initialization conditions (class statistics) with other classifiers in advance [59]. Canty [59] used FKM classification and Lee et al. [42] a pre-classification based on the three Freeman-Durden Decomposition features. The interpretation of the unsupervised classes is facilitated in the approach of Lee et al. since general PolSAR scattering categories are preserved [42].
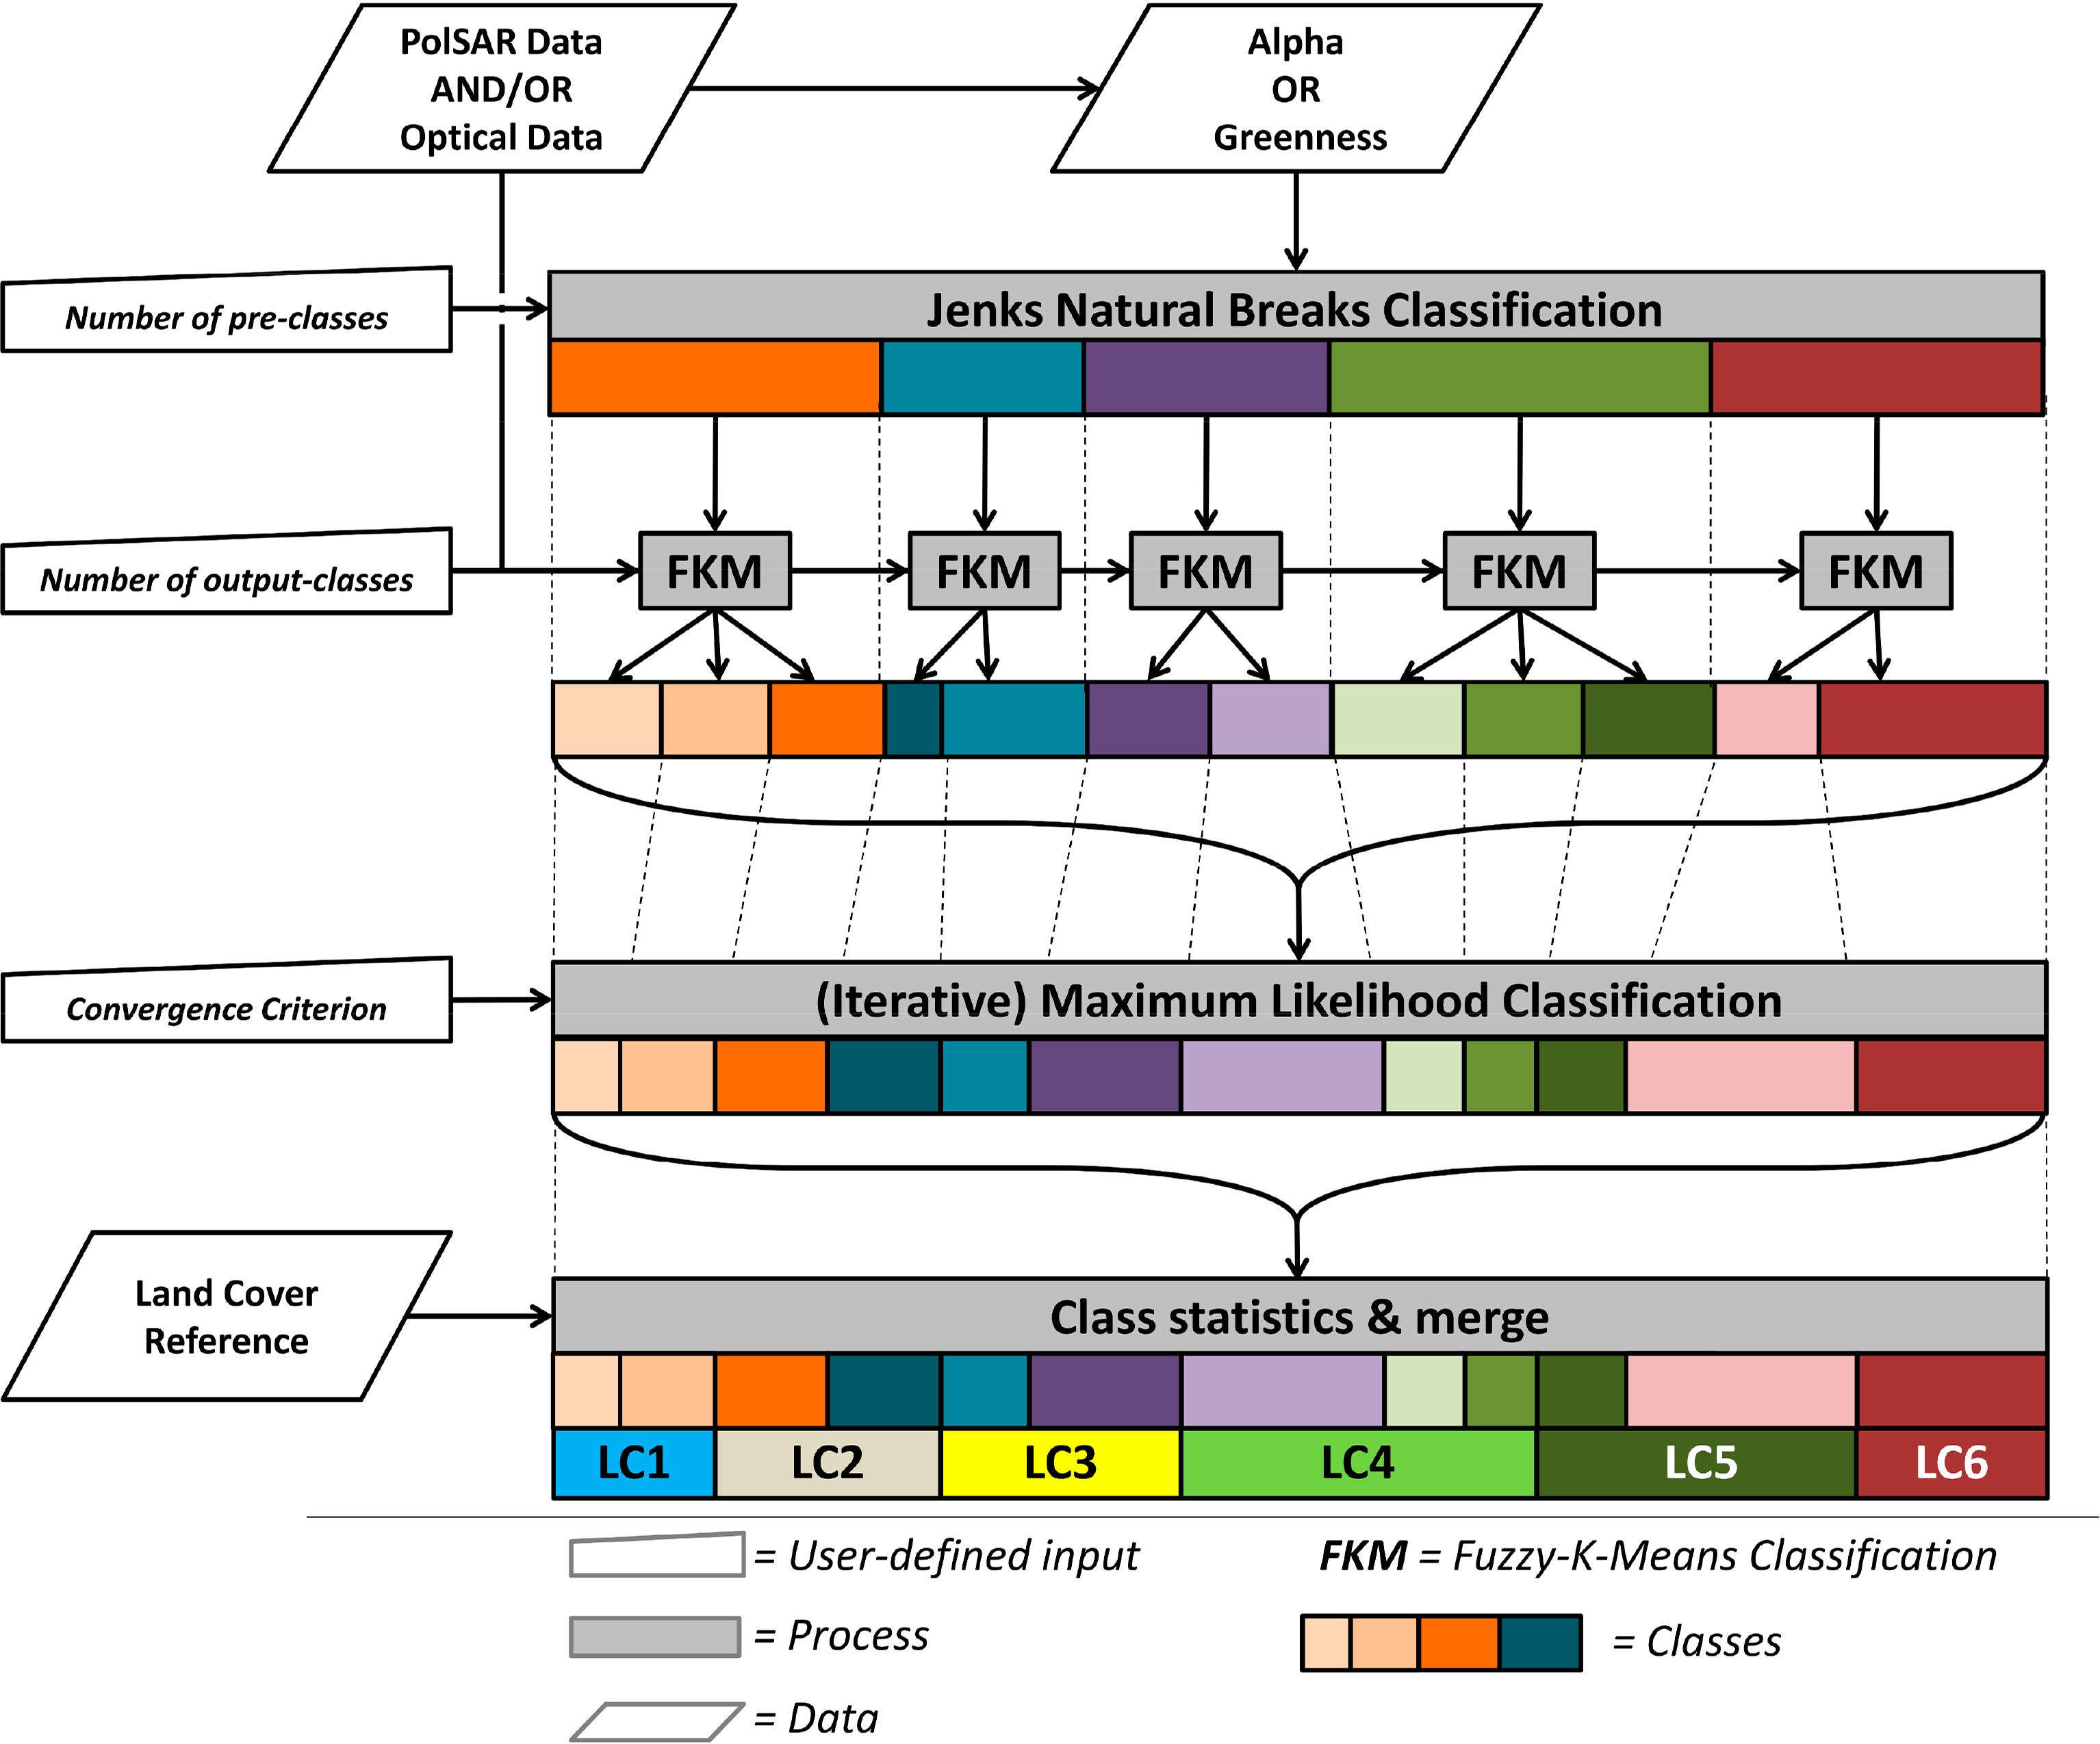
In our approach the MLC is initialized by classifying such categories (optical or PolSAR) using the Jenks-Natural-Breaks classifier. This classification is based on a single feature. This feature should be identified as sensitive and meaningful for characterization of the land cover in advance (e.g., the Alpha angle or the NDVI). Since this first estimate of general categories is derived from a single feature, a FKM classification is initialized afterwards with respect to all data. The FKM is applied to each category separately. This makes the FKM fast and robust and increases the number of classes to the number of user-defined output-classes. It preserves the general categories from the Jenks-Natural-Breaks classification. This pre-classification is used to initialize the iterative MLC. The unsupervised classification was performed as listed in the following. A simplified process chart is illustrated in Figure 4.
- (1)
Jenks Natural Breaks Classification: The classification was initialized on a single feature using Jenks Natural Breaks Classification. This pre-classification defines general categories of backscattering (PolSAR data) or reflectance (Landsat 8).
- (2)
Variance Analysis: The standard deviation of each pre-class was calculated with respect to all data. The number of sub-classes for a single pre-class was then set by comparing the standard deviations of all pre-classes and with respect to the total number of desired output-classes.
- (3)
FKM: Each pre-class was classified in its number of sub-classes separately. During the operation a local minimum was iteratively searched in the feature space [59]. This process was stopped when the difference of the fuzzy class membership’s matrices between two iterations reaches a small value. Since the FKM is applied to a subset of the feature space the calculation is fast and robust. This classification preserves the categories of the pre-classification (see dashed lines in Figure 4).
- (4)
Iterative MLC: The class statistic of the FKM classification was used as input for an iterative MLC. Covariance matrices and mean vectors were calculated if Multivariate Gaussian Normal Distribution was assumed. The sample Coherency Matrices and the cluster means were calculated when Wishart Distribution was assumed. In both cases the rule images were calculated and showed the class memberships for each pixel (the probability that a pixel belongs to a certain class). The classification was done according to the maximum observed probability. The MLC was iteratively repeated until the user-defined convergence criterion was met—when less than a user defined amount of valid pixels changed their class membership between two iterations [42]. The usage of a priori information in Maximum Likelihood Classification is optional [59]. During the MLC the categories of the pre-classification were dissolved.
In unsupervised classification the number of output-classes is usually set to be higher than the number of target land cover classes. Because of this the number unsupervised classes has to be reduced either by expert knowledge or reference data. In the latter case the unsupervised classes can be reduced (merged) with respect to percentaged occurrences of the reference land cover classes. Each unsupervised class can be assigned to the land cover class with the highest occurrence, respectively with respect to the dominating coverage.
3.4.2. Supervised Classification Approach
The supervised classification was done using Maximum-Likelihood Classifier implemented in ENVI. This method has been shown in previous work to be efficient for the classification of general land cover types based on optical data and SAR imagery [26]. It was also chosen with respect to the traceability of the classification process and due to its comparability to the unsupervised classifier. The supervised Maximum-Likelihood classification was performed on the Landsat 8 reflectances and on the scattering matrices of the PolSAR images. It was processed in the following steps.
- (1)
Training data statistics: Calculation of Covariance matrices and mean vectors for each supervised training sample (region of interest) derived from ground truth reference data.
- (2)
Creation of the rule images: Formation of the rule images and calculation of the probability values.
- (3)
Maximum-Likelihood Classification: Classification based to the maximum observed probability of the rule images; respectively the minimum Mahalanobis distance.
The final classification has five classes: NBG, VLD, VMD, VSD and VWT, and the masked water bodies. The supervised classification of tundra land cover has been demonstrated with other techniques such as the Neural Network Classification [23], Minimum Distance Classification [4] or Decision-Tree Classification [7].
3.4.3. Accuracy Assessment
The accuracies of the unsupervised and supervised classification results were estimated using a k-fold cross validation with five experiments (k = 5). During each experiment the total number of samples was split in a training set holding 80% of all reference data and a reference set holding 20% of all reference data. Each reference set was used once to estimate the classification accuracy. Each training set was used once to assign each unsupervised class to a land cover class and to train the supervised classifier. The k-fold cross validation was done to take into account the variation of the data during training and referencing. The confusion matrices were calculated for each experiment [61]. The final assessment was done by averaging the accuracies of all five experiments. The average overall classification accuracies and the average Kappa coefficients [61] were calculated in addition.
4. Results and Discussion
The backscatter characteristics of the PolSAR data and the reflectance characteristics of the Landsat 8 data were analyzed via boxplot, scatterplot, correlation and separability analysis, based on all available land cover reference data (see 3.3 Reference Data). The PolSAR features analyzed in this way were the Amplitudes (HH, HV, and VV), the Power Decomposition Features of TSX and R-2 (DBL, ODD, VOL), Entropy, and Alpha. For Landsat 8 NDVI, Greenness and Brightness were analyzed. The unsupervised and supervised classification was done for each data of a sensor alone and in combination. The results are shown and discussed in the following sub-sections.
4.1. Boxplot Analysis
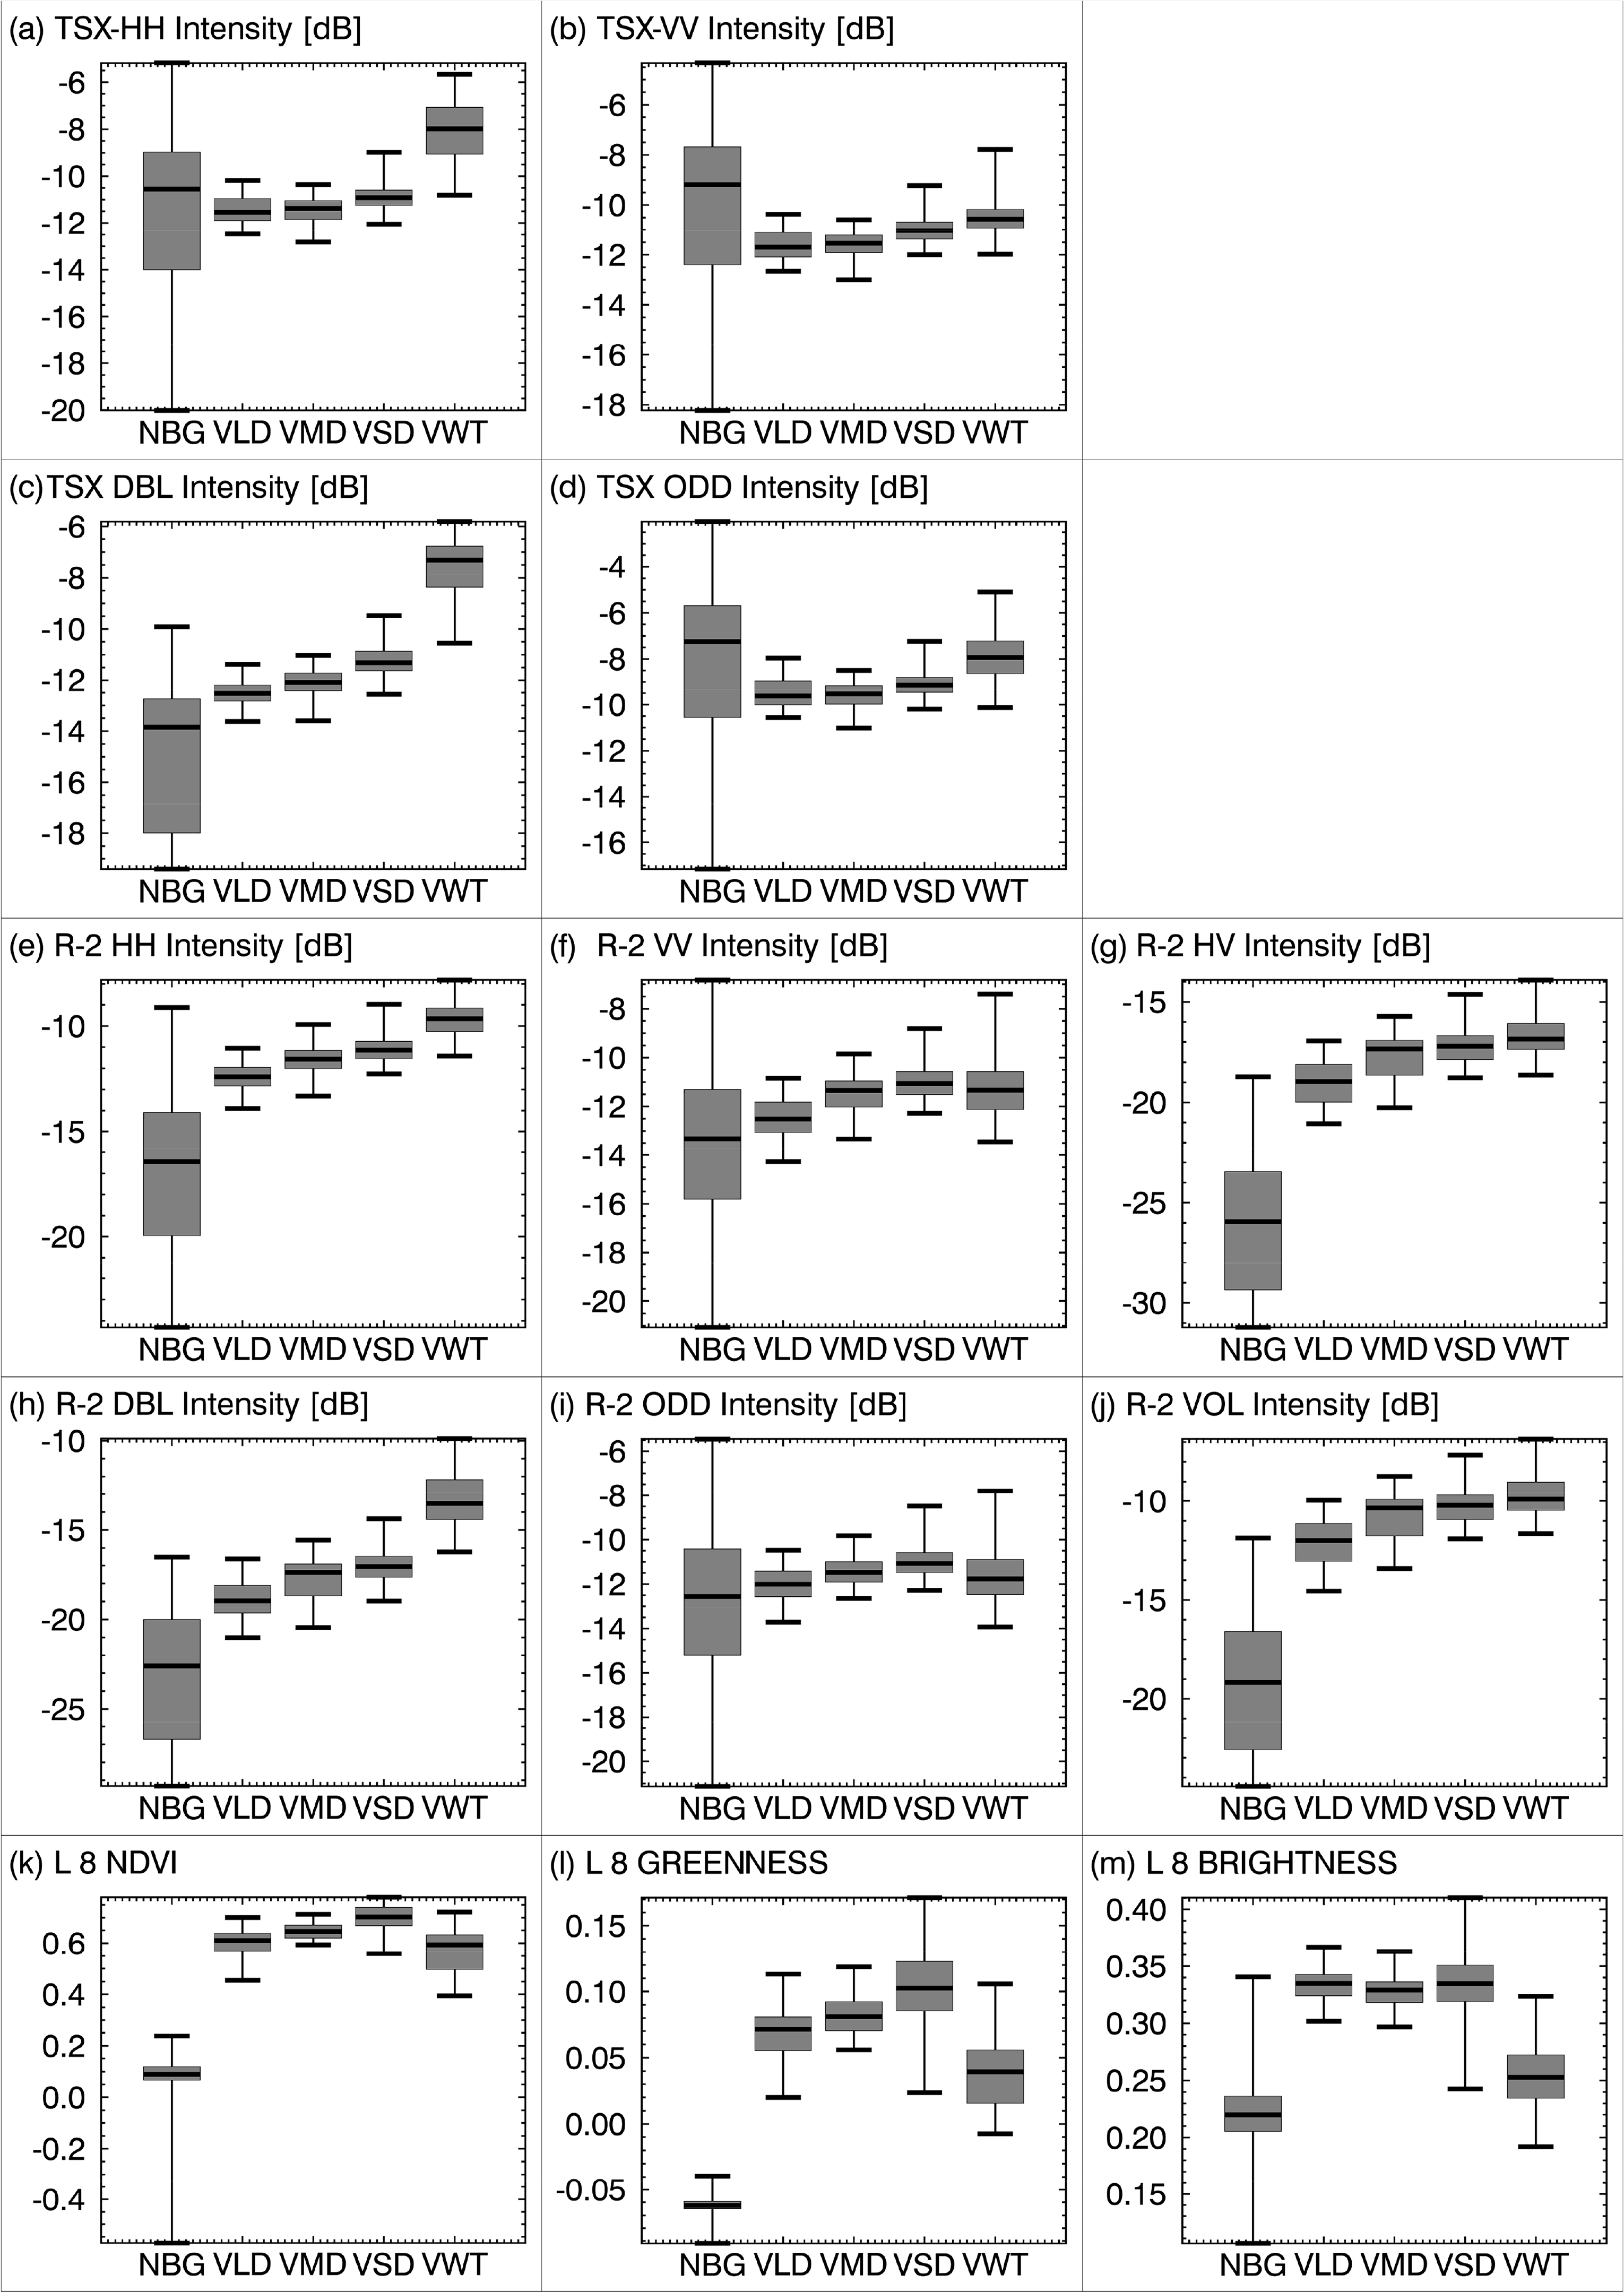
Features of PolSAR data and Landsat 8 imagery were analyzed with respect to the land cover reference data via boxplot analysis. The boxplots show the 0.5% percentile, the 25% percentile, the 50% percentile (median), the 75% percentile and the 99.5%. Figure 4 shows the intensities (HH, VV, HV) (Figure 5a–e), the power decomposition features double bounce (DBL), surface scattering (ODD) and volume scattering (VOL) (Figure 5f–j) of TSX and R-2, as well as the NDVI, Greenness and Brightness of Landsat 8 (Figure 5k–m). The intensities HH and VV of TSX and R-2 showed little variation in the backscatter values of the vegetation classes VLD, VMD and VSD. HH channels of both systems showed high values for class VWT. The highest variance was observed for both sensors in class NBG. This may be caused by different moisture or roughness conditions of the substrate. R-2 HV intensity showed an increasing backscatter over the vegetation classes VLD, VMD, VSD and VWT and indicates increasing volume (mixed) scattering. The same is true for the R-2 VOL and TSX DBL. For classes VLD, VMD, and VSD these observations are most likely linked to the increasing shrub density. This agrees to the third hypothesis. Both TSX and R-2 DBL features showed high backscatter values in class VWT. This is in accordance with the first hypothesis that vegetation in standing water causes a double bounce signal. Both had the lowest backscatter values in class NBG while ODD showed little variation over all classes. This indicates absence of double bounce scattering and dominant surface scattering and supports the second hypothesis. DBL (TSX and R-2) and VOL/HV (R-2) were identified to be most sensitive to the land cover classes.
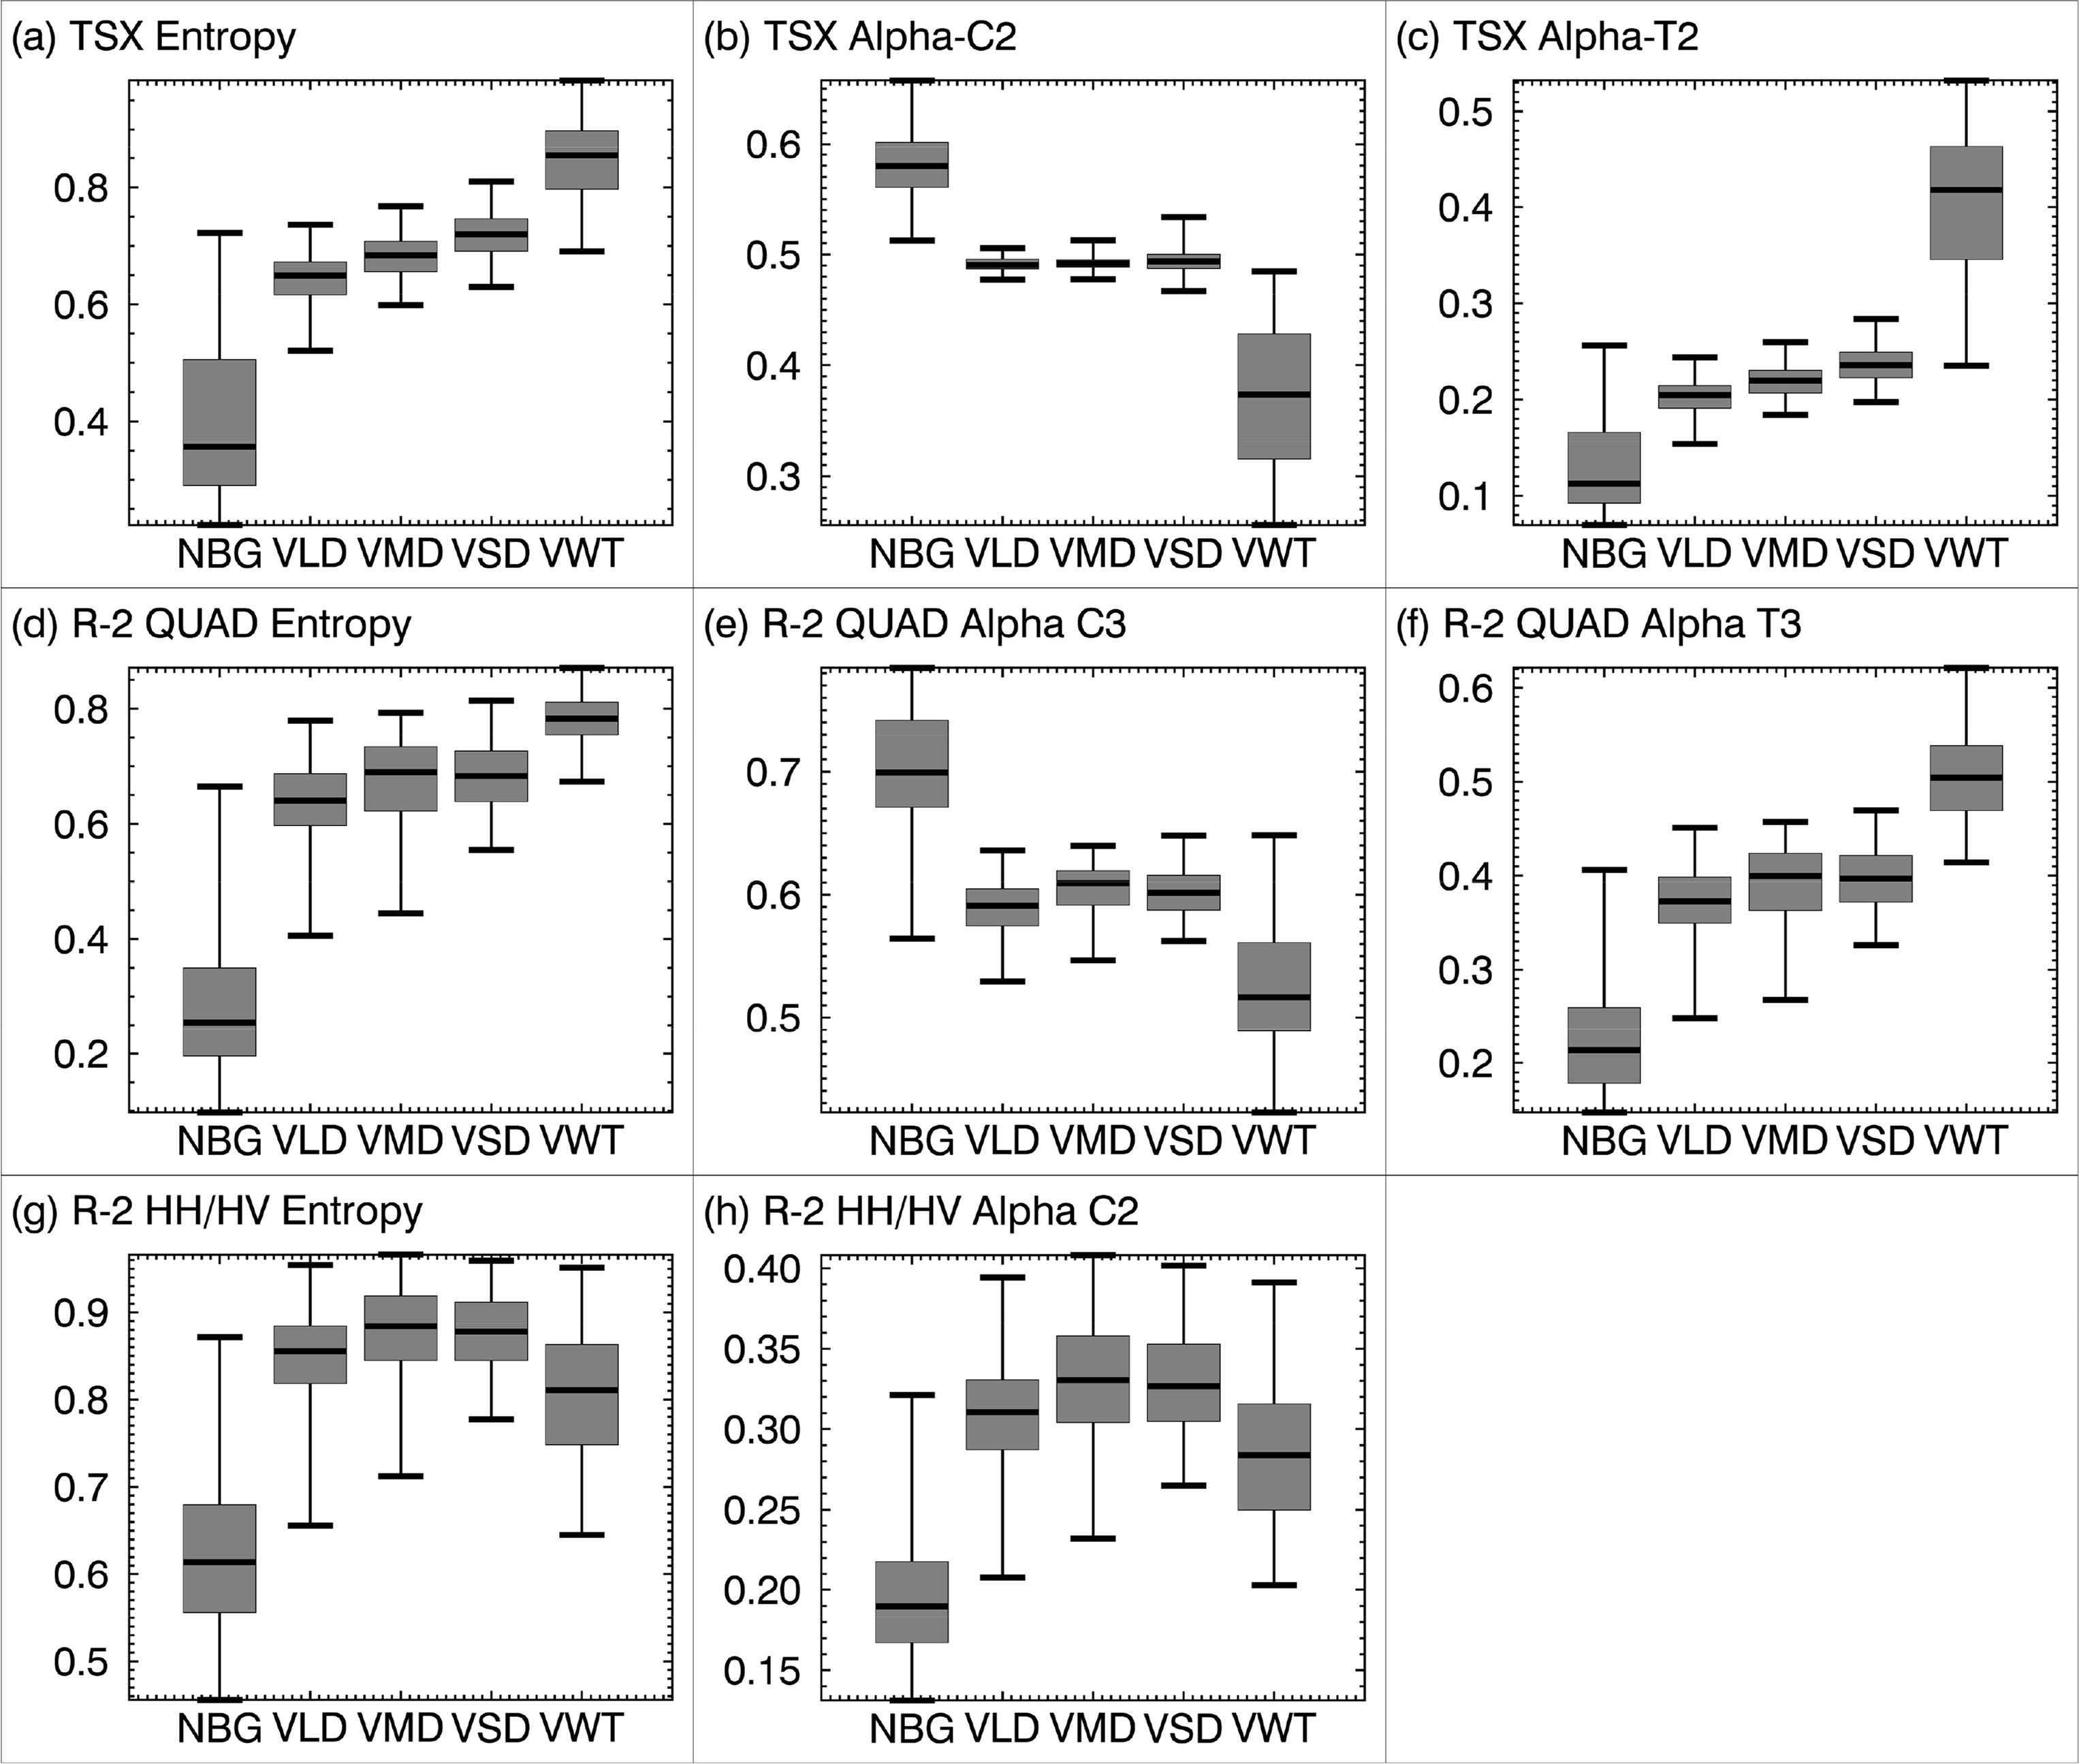
The vegetation indices NDVI and Greenness of L 8 data (Figure 5k,l) increased with the vegetation classes VLD, VMD and VSD. This is in accordance with the results of [5]. NBG reflectances were low with respect to the Greenness and the Brightness (Figure 5m). Class VWT was characterized by comparably low values of all Landsat 8 features. Like the PolSAR features, DBL and VOL/HV, the classes NBG and VWT had distinct positions for NDVI and Greenness. There was less overlap between these classes compared to the PolSAR features as well. Figure 6 shows the boxplots of Entropy/Alpha decomposition for TSX dual-polarized data (HH/VV) (Figure 6a–c), R-2 quad-polarized data (Figure 6d–f) and R-2 dual-polarized data (HH/HV) (Figure 6g–h).
The backscattering characteristics of Entropy, Alpha C and Alpha T were similar for R-2 quad-polarized data and the TSX dual-polarized HH/VV data. This supports the findings from [62] that Entropy and Alpha angle of quad-polarized and co-polarized data are similar (although we compared different wavelengths here). The TSX features showed less overlap of the boxes (25%–75% quartile) compared to the R-2 data. This indicates higher sensitivity of the X-Band data for the classes VLD, VMD and VSD and is most likely caused by the increasing shrub density. The Entropy values of R-2 quad-polarized and TSX increased with land cover classes from NBG, VLD, VMD, VSD, to VWT and showed an increasing degree randomness.
Alpha values of the T-Matrix were increasing as well over these classes. This indicates dominant surface scattering for NBG, dominant volume or mixed scattering for the vegetation classes (VLD, VMD and VSD) and dominant double bounce scattering for the class VWT. This observation is in accordance with the hypotheses. Alpha C values (R-2 quad-polarized and TSX) showed no dominant backscattering type with values of Alpha around 0.5 for the classes VLD, VMD and VSD. The analysis of Entropy/Alpha of R-2 dual-polarized data (HH/HV) showed high variance for all classes with high overlap of the boxes. The vegetation classes (VLD, VMD and VSD) had equally high values for Entropy and Alpha. Entropy (TSX and R-2 quad-polarized) and Alpha T (TSX and R-2 quad-polarized) were identified to be most sensitive to the land cover classes.
4.2. Scatterplot, Correlation and Separability Analysis
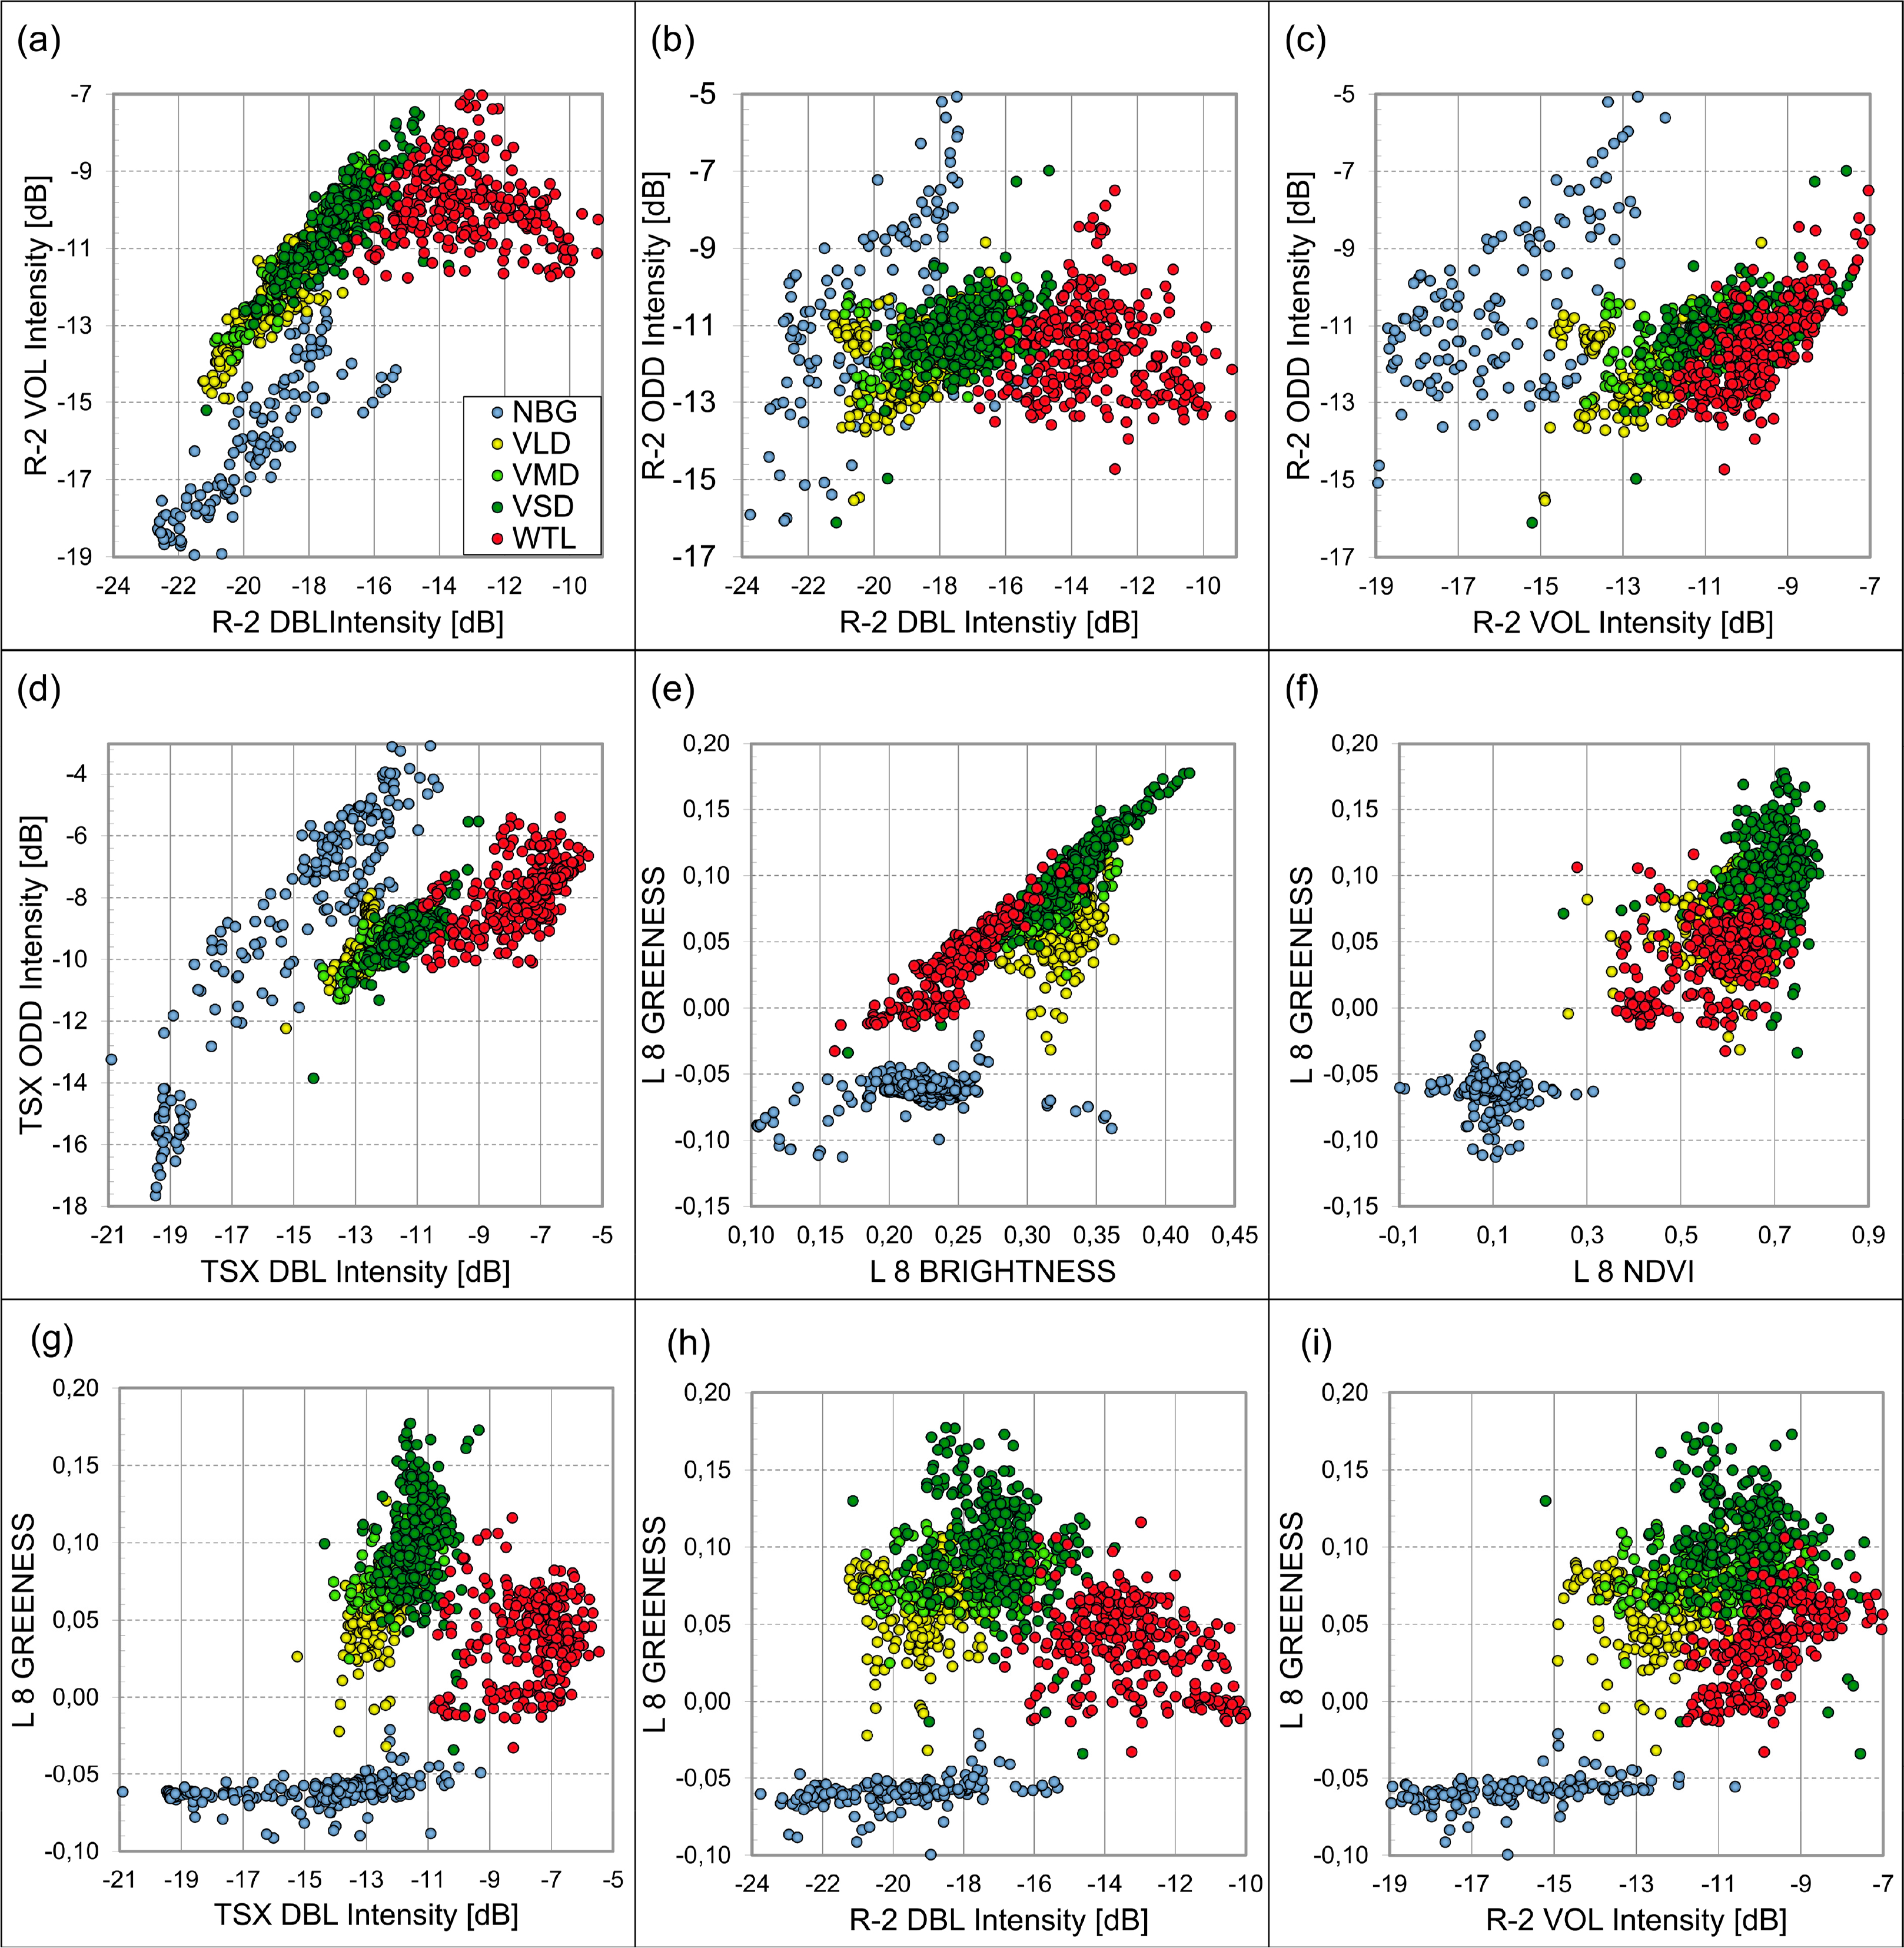
The feature space positions of the land cover classes for selected features (Figure 7) showed a clear separability between the clusters of NBG and VWT for the power decomposition features of R-2 quad-polarized data (Figure 7a–c) and the TSX dual-polarized data (Figure 7d). The clusters of VLD, VMD and VSD had a high overlap with a tendency to increase from low to high tundra vegetation. The Landsat 8 features (Figure 7e–f) showed a good separation of the NBG; however the class centers of VLD, VMD, VSD and VWT have an overlap.
Combining PolSAR and optical features (Figure 7g–i) the centers of NBG and VWT separated well. Classes VLD, VMD and VSD still showed high overlap, but class VLD was better distinguishable compared to the other scatterplots. The combination of TSX DBL or R-2 DBL feature and Landsat 8 Greenness (Figure 7g–h) shows the best separability of all analyzed scatterplots. The separability of VWT from VSD as well as the separability between VSD and VMD was higher compared to any of the other plots. The PolSAR data gave here supplementary information on the land cover in special for the tundra vegetation classes. It is likely to separate this classes best with a combination of optical and PolSAR data.
The linear correlation between all features was investigated analyzing the squared linear Pearson coefficient R2 values calculated in IDL8.3 with the CORRELATE function. This analysis was performed for all classes and for the non-wetland vegetation classes. High correlation values (R2 > 0.5) were observed between the R-2 features DBL and VOL and between Landsat 8 Greenness and Brightness with respect to the classes VLD, VMD and VSD. Correlation was high between TSX DBL and R-2 VOL for all land cover classes (R2 = 0.8). There was no direct linear correlation between any of the PolSAR features and the NDVI nor the Greenness. This is in line with the findings of [23].
Prior to the classification separability of different feature combinations was examined using Jeffries Matusita Distance (JD) and Bhattacharyya Distance (BD) [57]. JD ranges from zero to the square root of two and the range of BD starts at zero and has no upper limit. Separability distances are used to estimate the separability of classes in terms of their statistical distances in the feature space under the assumption of Gaussian Normal Distribution properties. These separability features are also used to select reasonable subsets of bands, when operating with big data stacks or data from different sources. The JD and BD were here examined for the data of the single sensors and in combination with different sensors. The results showed that a combination of optical and PolSAR data as well as PolSAR data from different wavelengths in general enhance the separability of classes in the feature space. The highest separability of BD was observed for the combination of Landsat 8 and R-2 quad-polarized data followed by the combination of TSX and R-2 Quad. High JD and BD values were observed for the classes NBG and VWT and indicated a good separability. Vegetation classes VLD, VMD and VSD showed relatively low JD and BD values for the single sensors.
Again the separability increased for these classes when combining PolSAR and optical data. A relation between the estimated JD and BD and the obtained supervised classification accuracies was examined and showed a positive correlation with R2 values of around 0.7 for JD and 0.5 for BD. The results of the separability analysis indicated that an accurate classification of the classes NBG and VWT can be expected using the data from all single sensors alone. It was also shown that a clear class distinction between the vegetation classes VLD, VMD and VSD can be expected when using data from optical and PolSAR data in combination.
4.3. Classification Results
The land cover classification of the PolSAR and optical data of Richards Island were performed as described in Section 3.4 Classification. The unsupervised Jenks Natural Breaks was initialized with six pre-classes. For the PolSAR data these were derived from the Alpha values of T-Matrix. These pre-classes can be interpreted as general backscattering categories. Whenever Landsat 8 data were integrated in the classification, the Greenness index of the tasseled cap transformation was used. These pre-classes can be interpreted as general Greenness categories. Both features have been shown to be meaningful for the characterization of the land cover classes of interest in the boxplot analysis. The total number of output-classes was fixed to twenty classes and FKM classification was performed. The statistics of these twenty classes were calculated and iterative MLC was initialized. PolSAR and optical data were standardized when they were used in combination.
The convergence criterion was fixed to five percent and convergence of the classifier was observed for all performed classifications after a maximum of twelve iterations. The unsupervised classes were finally merged with respect to each training set derived from the experiments of the k-fold cross validation (see Section 3.4.3 Accuracy Assessment). Each final classification has five land cover classes and the masked water bodies.
The accuracies from unsupervised classification (Table 2a–d) showed that the best classification of the land cover classes using a single source was achieved with Landsat 8 data. The overall classification accuracy was about 71%. The accuracy of an unsupervised classification based on R-2 quad-polarized or TSX data alone was in both cases about 62%. Lowest overall classification accuracy was observed for R-2 HH/HV data with about 56%. All classification results showed accuracies of over 80% for the classes NBG and VWT. On the other hand classification accuracies of classes VLD, VMD and VSD were low and none of the classifications showed a high accuracy. The combination of PolSAR and optical data, as well as the combination of PolSAR data from R-2 and TSX (Table 2e–h) showed an increase in the overall classification accuracies in the range from 2% to 7%. The best classification result was obtained using Landsat 8 and TSX data with an overall accuracy of about 71%. The confusion matrix pointed to a good accuracy for NBG and VWT and showed a minimum accuracy of about 57% for the classes VLD, VMD and VSD. A combination of R-2 quad-polarized and TSX data showed high classification accuracies for NBG and VWT but comparable low accuracies for the vegetation classes VLD, VMD and VSD. The results indicate that the used unsupervised classifier is capable of finding reasonable structures in the feature space of PolSAR and optical data automatically that are in accordance with land cover classes. The best classification results from one single source were obtained with the optical data. The combination of optical and PolSAR data further enhanced the classification accuracy.
The same was true for the results of the supervised classification. Again results from the single sensors alone showed that highest accuracy was obtained using Landsat 8 data, followed by R-2 quad-polarized, TSX HH/VV and R-2 HH/HV (Table 3a–d). Lowest accuracies for all data were observed for the vegetation classes VLD, VMD and VSD. The classes NBG and VWT were classified with a high accuracy. The confusion matrices indicated that the PolSAR data facilitate the differentiation between VLD and VMD, as well as between VSD and VWT classes (Table 3a compared to Table 3f). The accuracies of these classes’ increased compared to the classifications obtained from single sources.
The best results was obtained by combining Landsat 8 and R-2 quad-polarized data with an overall classification accuracy of about 87%. The increase of the classification accuracy for combination of Landsat 8 and PolSAR data was observed for the separation of VLD and VMD and for the separation of VSD and VWT. The combination of R-2 and TSX data had positive effect on the classification of the classes VMD and VSD (Table 3b,c compared to Table 3h).
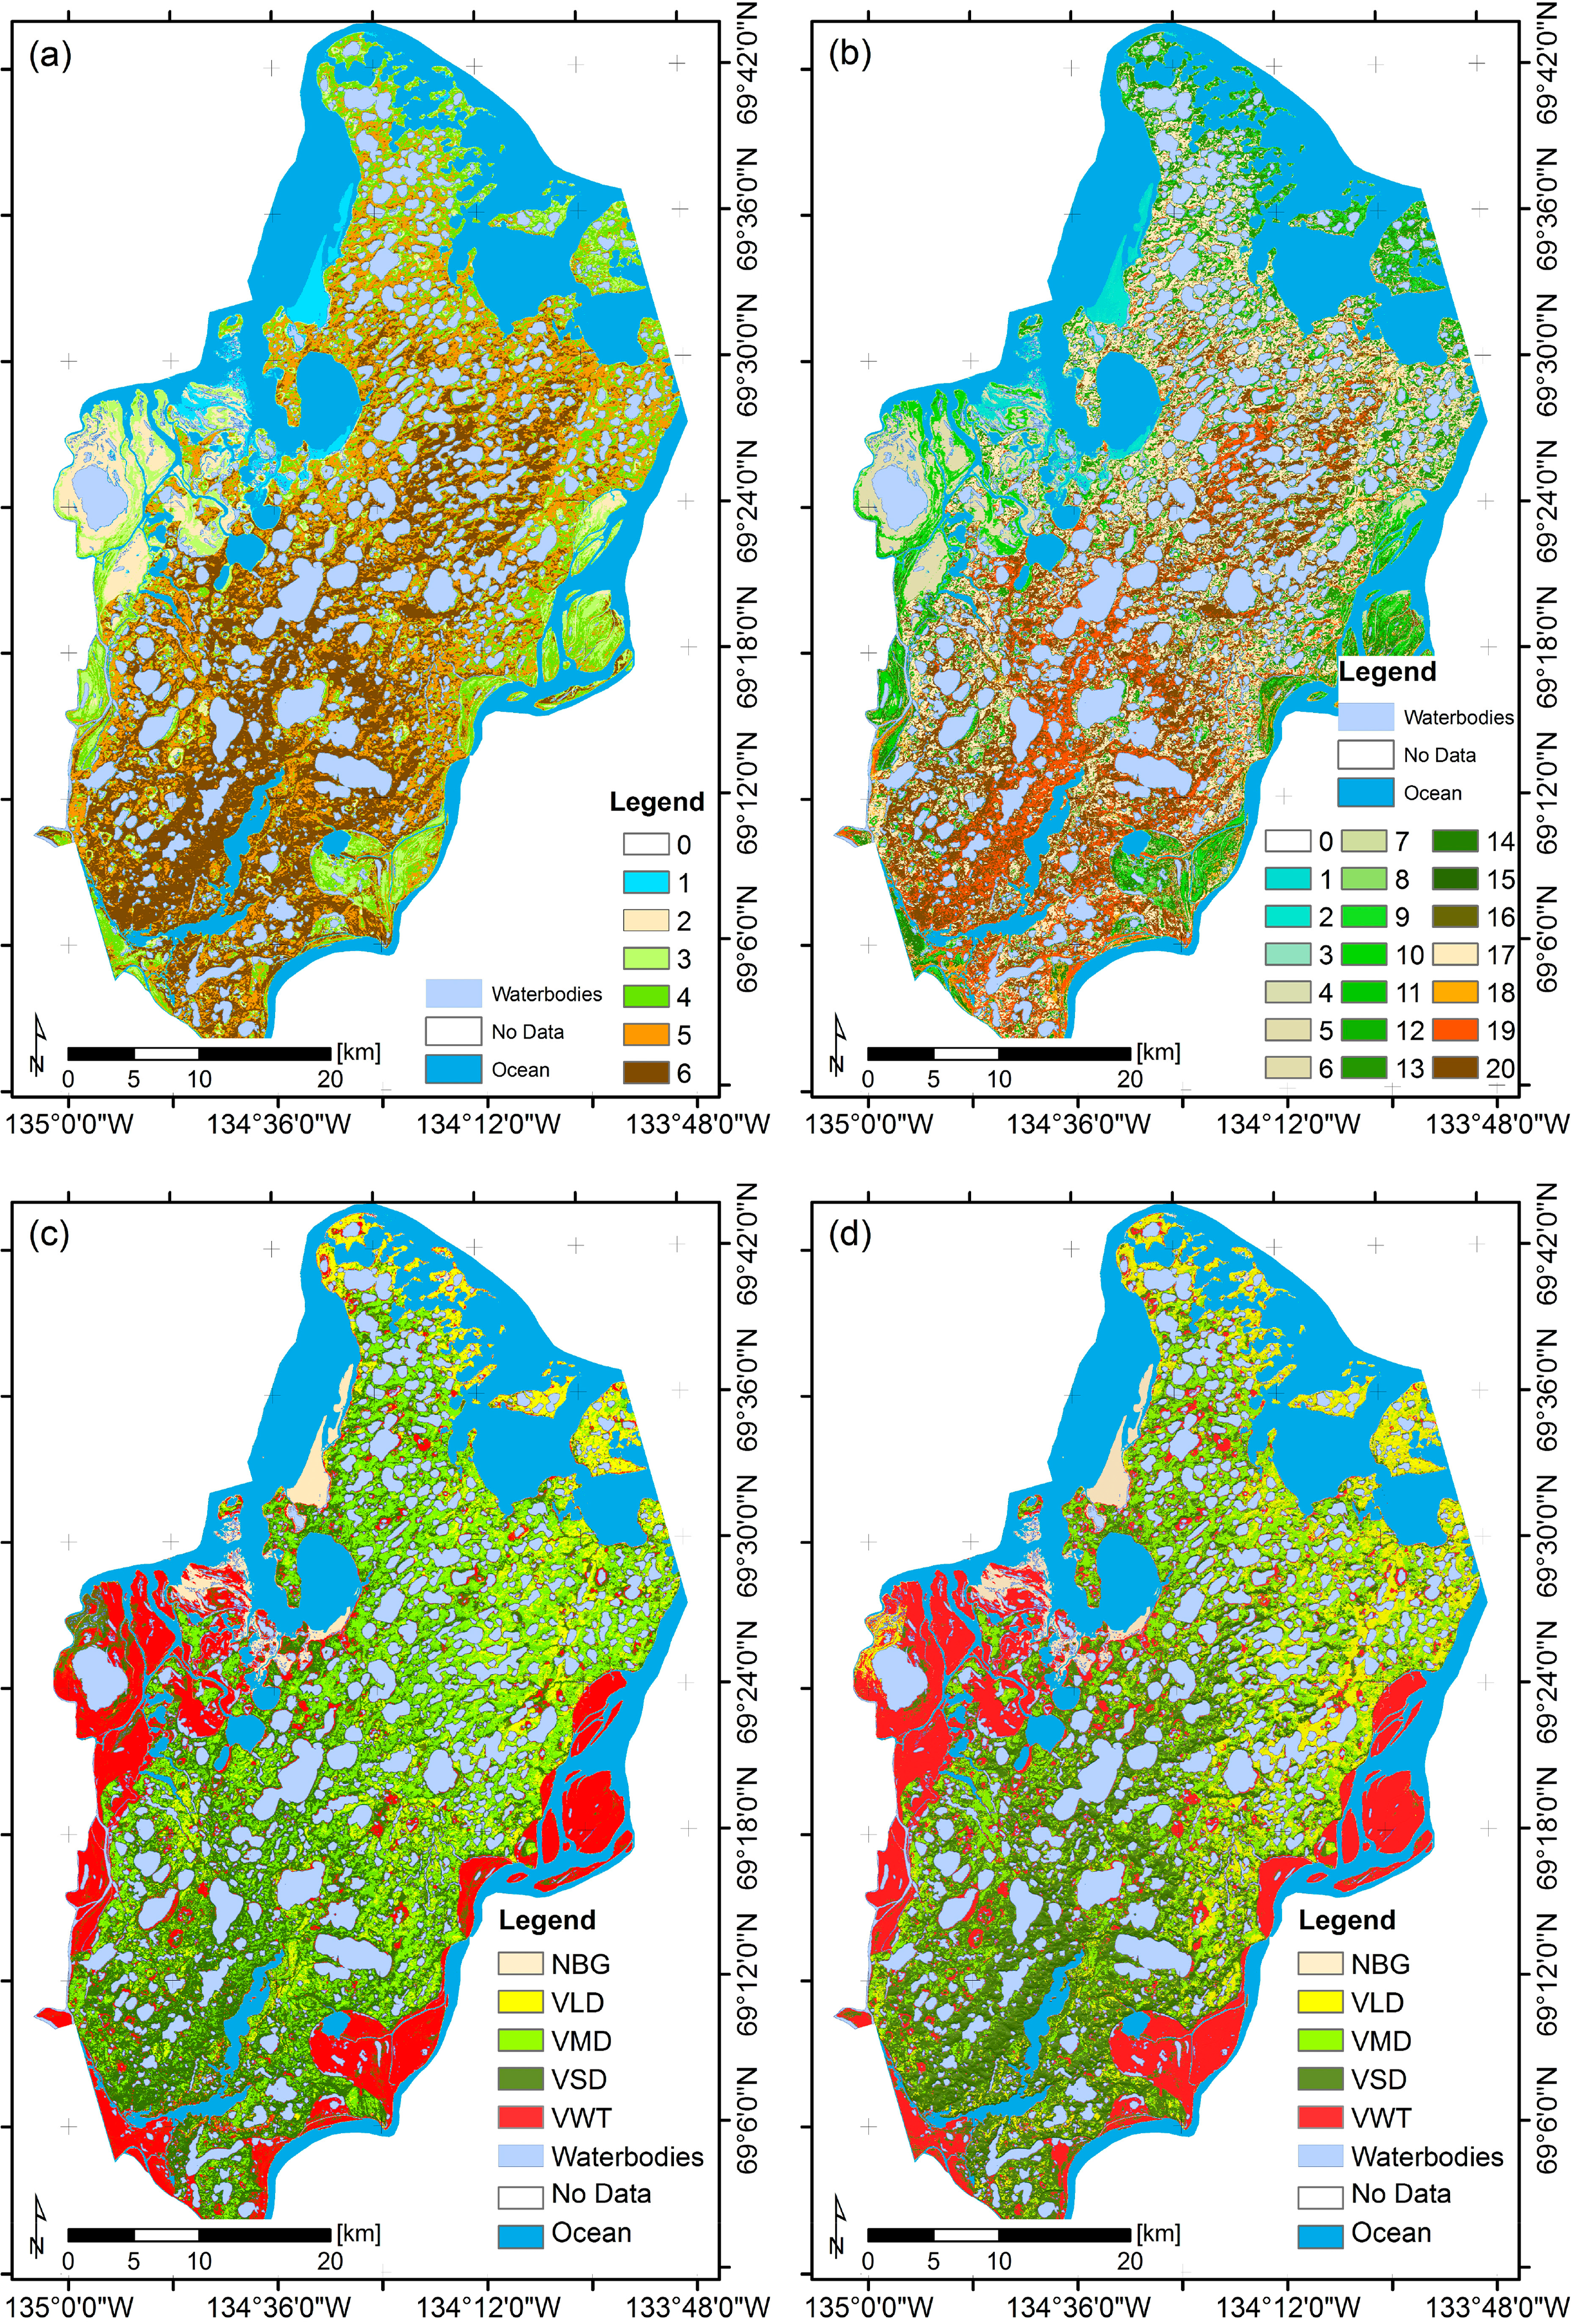
Results of unsupervised and supervised classification for Richards Island are shown in Figure 8. The distribution of the shrub dominated Tundra (VSD) differed between the unsupervised classification (Figure 8a–c) and the supervised classification (Figure 8d)—especially in the central part of the island with many misclassified pixels in the unsupervised classification. As indicated in the previous results wetlands (VWT) and bare ground (NBG) were classified well. The effectiveness of PolSAR data for the classification of wetlands was shown in previous works [49] also for arctic environments [26]. These findings are supported with this study. As shown this is also true for unsupervised classification techniques and these classes have high potential to be automatically detected with unsupervised classification techniques.
5. Conclusions
The ecosystem of the high northern latitudes is affected by the recently changing environmental conditions and there is a need for spatiotemporal information of the Arctic’s land cover. It was shown that this information can be collected by the use of remotely sensed data from various sources. Remote sensing of the Arctic’s land coverage was primarily carried out by the use of optical sensors and few research projects have addressed the use of polarimetric Synthetic Aperture Radar (PolSAR) data for characterization of tundra environments. Therefore, the potential of X- and C-Band PolSAR data for characterization and classification of tundra land cover was examined in this work.
For this research quad-polarized data from Radarsat-2, dual-polarized HH/VV data from TerraSAR-X and Landsat 8 multispectral data were analyzed for the test site Richards Island (Northwest Territories, Canada). The referencing was based on in situ data collected contemporaneously to the satellite acquisitions and on high resolution airborne photography. The land cover classes of interest were bare ground, tundra vegetation classes (sparse vegetated tundra, mixed tundra, shrub dominated tundra) and wetland areas. The PolSAR Features examined were the components of the Entropy/Alpha decomposition (dual and quad-polarized), of the Yamaguchi Decomposition (quad-polarized data), and of the Two Component Decomposition (co-polarized HH/VV data). From top of atmosphere corrected Landsat 8 data, Normalized Difference Vegetation Index (NDVI) and tasseled caps indices Greenness and Brightness were derived and analyzed.
Outcomes of this study showed that the type of land cover was in relation to the dominant type of backscattering. The PolSAR features were suited for the characterization of the tundra land cover and helped to distinguish types beside their spectral properties. Wetlands showed for example a distinct double bounce backscattering with high values of features of the Power Decomposition (e.g., double bounce) and the Eigendecomposition (e.g., Cloude Pottier’s Alpha). The backscattering from bare substrate was identified as surface scattering with a high range of intensity values. The intensity of double bounce, as well as volume scattering increased with higher vegetation formations and showed relatively low values for sparse vegetated areas and high values for shrub dominated land cover. It was furthermore observed that Alpha values of TerraSAR-X increased with higher density of shrubs. This indicated sensitivity of the X-Band for this type of coverage. However, ambiguities were observed for the mixed tundra land cover type for all analyzed data.
Among the tested PolSAR features of TerraSAR-X the double bounce and the Alpha angle were identified to give best characterization. For the Radarsat-2 quad-polarized data double bounce, volume scattering and the Alpha angle were identified to be of value for the differentiation and characterization of the land cover types. The difference between the PolSAR features of the C-Band quad-polarized and the X-Band co-polarized data were small. However, the cross-polarized information gave additional information and showed distinct backscattering for the shrub formations. This had positive effect on the separability of the classes and the quad-polarized data are favorable for a characterization.
The sensitivity of PolSAR data to the land coverage revealed as well in the unsupervised and supervised classification. There were clear positions in the features space of the PolSAR data for areas dominated by wetlands or bare substrates and the unsupervised as well as the supervised classifiers showed good performance. However, no sufficient classification of the non-wetland vegetation was possible with the PolSAR data—neither from X-Band, C-Band, nor combined X- and C-Band data. The overall accuracies were less than 63% for unsupervised classification and less than 75% for supervised classification.
Acceptable classification results of tundra vegetation required the usage of spectral information. The best classification results were obtained using PolSAR and optical data. The overall accuracies for supervised classification of Landsat 8 and any of the PolSAR data were between 84% and 86%. The best unsupervised classification result was obtained for the combination of Landsat 8 and TerraSAR-X with about 71%.
Future work will concentrate on the spatial and temporal transferability of the approach and also on the possibilities and limitations of an automated unsupervised classification system. For this, an integration of digital elevation model data (e.g., from TanDEM-X mission) in the classification process is planned. Future analysis will also focus on the role of the incidence angle in backscattering process since it has high effect on the backscattering properties of vegetation and on the analysis of longer wavelengths such as L-Band.
Acknowledgments
Authors like to thank Blair E. Kennedy, Sarah N. Banks (NWRC) and Joerg Hartmann, Torsten Sachs and Jennifer Sobiech (AWI) for their help during the field work. Authors like to thank also the reviewers for their helpful comments. This work was funded in parts by the National Wildlife Research Center, the Elite Network of Bavaria and the Bavarian Research Alliance (BayFOR). TerraSAR-X and TanDEM-X imagery is shown under permission of German Remote Sensing Datacenter (DFD), German Aerospace Center (DLR): Related Proposals COA1736 and COA1144. RADARSAT-2 imagery is shown under permission of MacDonald Dettwiler and Associates (MDA). Related Multi-User Request Form MDA GSI Ref Number: CG0061(2)-12-2011 “eSAPCE”. This publication was funded by the German Research Foundation (DFG) and the University of Wuerzburg in the funding program Open Access Publishing.
Author Contributions
Tobias Ullmann is the principal author of this paper. Tobias Ullmann, Andreas Schmitt and Achim Roth worked on the methodology and the processing of the PolSAR data and on the classification of the PolSAR and optical data. Together with Jason Duffe, Stefan Dech, Hans-Wolfgang Hubberten and Roland Baumhauer they worked on the interpretation of the results and the final version of this contribution.
Conflicts of Interest
The authors declare no conflict of interest.
References
- Lemke, P.; Jacobi, H. Arctic Climate Change: The ACSYS Decade and Beyond; Springer: New York, NY, USA, 2011; pp. 1–464. [Google Scholar]
- Kääb, A. Remote sensing of permafrost-related problems and hazards. Permafr. Periglac. Process 2008, 19, 107–136. [Google Scholar]
- Stow, D.A.; Hope, A.; McGuire, D.; Verbyla, D.; Gamon, J.; Huemmrich, F.; Houston, S.; Racine, C.; Sturm, M.; Tape, K.; et al. Remote sensing of vegetation and land-cover change in Arctic Tundra Ecosystems. Remote Sens. Environ 2004, 89, 281–308. [Google Scholar]
- Schneider, J.; Grosse, G.; Wagner, D. Land cover classification of tundra environments in the Arctic Lena Delta based on Landsat 7 ETM+ data and its application for upscaling of methane emissions. Remote Sens. Environ 2009, 113, 380–391. [Google Scholar]
- Fraser, R.H.; Olthof, I.; Carrière, M.; Deschamps, A.; Pouliot, D. Detecting long-term changes to vegetation in northern Canada using the Landsat satellite image archive. Environ. Res. Lett 2011, 6, 1–9. [Google Scholar]
- Ulrich, M.; Grosse, G.; Chabrillat, S.; Schirrmeister, L. Spectral characterization of periglacial surfaces and geomorphological units in the Arctic Lena Delta using field spectrometry and remote sensing. Remote Sens. Environ 2009, 113, 1220–1235. [Google Scholar]
- Chasmer, L.; Hopkinson, C.; Veness, T.; Quinton, W.; Baltzer, J. A decision-tree classification for low-lying complex land cover types within the zone of discontinuous permafrost. Remote Sens. Environ 2014, 143, 73–84. [Google Scholar]
- Richards, J.A. Remote Sensing with Imaging Radar; Springer Verlag: Berlin/Heidelberg, Germany, 2009; pp. 1–361. [Google Scholar]
- May, I.; Ludwig, R.; Bernier, M. Using TerraSAR-X imagery for the monitoring of permafrost dynamics in northern Quebec. Proceedings of the 4th TerraSAR-X Science Team Meeting, Oberpfaffenhofen, Germany, 14–16 February 2011.
- Liu, L.; Zhang, T.; Wahr, J. InSAR measurements of surface deformation over permafrost on the North Slope of Alaska. J. Geophys. Res 2010, 115, 1–14. [Google Scholar]
- Lauknes, T.R.; Larsen, Y.; Eckerstorfer, M.; Christiansen, H.H. Permafrost landform dynamics at Kapp Linné central Svalbard, observed using high- resolution TerraSAR-X data, 2009–2012. Proceedings of the 5th TerraSAR-X Science Team Meeting, Oberpfaffenhofen, Germany, 10–11 June 2013.
- Short, N.; Brisco, B.; Couture, N.; Pollard, W.; Murnaghan, K.; Budkewitsch, P. A comparison of TerraSAR-X, RADARSAT-2 and ALOS-PALSAR Interferometry for monitoring permafrost environments, case study from Herschel Island, Canada. Remote Sens. Environ 2011, 115, 3491–3506. [Google Scholar]
- DLR, German Aerospace Center. TerraSAR-X Ground Segment Basic Product Specification Document; Cluster Applied Remote Sensing: Oberpfaffenhofen, Germany, 2010; pp. 1–109. [Google Scholar]
- Wessel, B.; Marschalk, U.; Gruber, A.; Huber, M.; Hahmann, T.; Roth, A.; Habermeyer, M. Design of the DEM mosaicking and calibration processor for TanDEM-X. Proceedings of the EUSAR 7th European Conference on Synthetic Aperture Radar, Friedrichshafen, Germany, 2–5 June 2008; pp. 1–4.
- Regmi, P.; Grosse, G.; Jones, M.C.; Jones, B.M.; Anthony, K.W. Characterizing post-drainage succession in Thermokarst Lake Basins on the Seward Peninsula, Alaska with TerraSAR-X backscatter and Landsat-based NDVI data. Remote Sens 2012, 4, 3741–3765. [Google Scholar]
- Park, S-E.; Yamaguchi, Y.; Singh, G.; Bartsch, A. Spatio-temporal monitoring of permafrost regions using SAR remote sensing. Proceedings of the International Archives of the Photogrammetry, Remote Sensing and Spatial Information Science, Kyoto, Japan, 9–12 August 2010.
- Van der Sanden, J.J.; Drouin, H.; Hicks, F.E.; Beltaos, S. Potential of RADARSAT-2 for the monitoring of river freeze-up processes. Proceedings of the 15th Workshop on River Ice, St. John’s, NL, Canada, 14–17 June 2009; pp. 364–377.
- Scheuchl, B.; Hajnsek, I.; Cumming, I.G. Sea ice classification using multi-frequency Polarimetric SAR data. Proceeding of the Geoscience and Remote Sensing Symposium (IGARSS), Toronto, ON, Canada, 24–28 June 2002.
- Rignot, E.; Mouginot, J.; Scheuchl, B. Ice flow of the Antarctic ice sheet. Science 2011, 333, 1427–1430. [Google Scholar]
- Rignot, E.J.; Way, J.; Williams, C.; Viereck, L. Radar estimates of aboveground biomass in boreal forests of interior Alaska. IEEE Trans. Geosci. Remote Sens 1994, 32, 1117–1124. [Google Scholar]
- Salehi, M.; Sahebi, M.R.; Maghsoudi, Y. Improving the accuracy of urban land cover classification using Radarsat-2 PolSAR data. IEEE J. Sel. Top. Appl. Earth Obs. Remote Sens 2014, 7, 1394–1401. [Google Scholar]
- Zhao, L.; Yang, J.; Li, P.; Zhang, L. Characteristics analysis and classification of crop harvest patterns by exploiting high-frequency multi-polarization SAR data. IEEE J. Sel. Top. Appl. Earth Obs. Remote Sens 2014. PP. [Google Scholar] [CrossRef]
- Collingwood, A.; Treitz, P.; Charbonneau, F.; Atkinsons, D. Artificial neural network modeling of high arctic phytomass using synthetic aperture radar and multispectral data. Remote Sens 2014, 6, 2134–2153. [Google Scholar]
- Sobiech, J.; Boike, J.; Dierking, W. Observation of melt onset in an arctic tundra landscape using high resolution TerraSAR-X and RADARSAT-2 data. Proceedings of the 2012 IEEE International Geoscience and Remote Sensing Symposium (IGARSS), Munich, Germany, 22–27 July 2012; pp. 3552–3555.
- Banks, S.N.; King, D.J.; Merzouki, A.; Duffe, J.; Solomon, S. Assessing Radarsat-2 polarimetric SAR for mapping Shoreline Cleanup and Assessment Technique (SCAT) classes in the Canadian Arctic. Proceedings of the 32nd Canadian Symposium on Remote Sensing, Sherbrooke, QC, Canada, 13–16 June 2011; pp. 1–8.
- Banks, S.N.; Ullmann, T.; Schmitt, A.; Roth, A.; Dech, S. Classification of Arctic coastal land cover with Polarimetric SAR data. Proceedings of the IEEE Radarcon, Ottawa, ON, Canada, 29 April–3 May 2013; pp. 1–6.
- Ullmann, T.; Banks, S.N.; Duffe, J.; Roth, A.; Schmitt, A.; Baumhauer, R.; Dech, S.S. Classification of coastal arctic land cover by means of TerraSAR-X dual co- polarized data (HH/VV). Proceedings of the 5th TerraSAR-X Science Team Meeting, Oberpfaffenhofen, Germany, 10–11 June 2013.
- Lantuit, H.; Pollard, W. Fifty years of coastal erosion and retrogressive thaw slump activity on Herschel Island, southern Beauforst Sea, Yukon Territory. Can. Sci. Direct 2008, 95, 84–102. [Google Scholar]
- Myers-Smith, I.H.; Forbes, B.C.; Wilmking, M.; Hallinger, M.; Lantz, T.; Blok, D.; Tape, K.D.; Macias-Fauria, M.; Sass-Klaassen, U.; Lévesque, E. Shrub expansion in tundra ecosystems: Dynamics, impacts and research priorities. Environ. Res. Lett 2011, 6, 1–15. [Google Scholar]
- Demers, A.-M.; Banks, S.; Duffe, J.; Carriere, M.; Torontow, V.; Chaudhary, B.; Laforest, S. eSPACE: Emergency spatial pre-SCAT for arctic coastal ecosystem project. Proceedings of IEEE Radar Conference (RADAR), Ottawa, ON, Canada, 29 April 2013–3 May 2013; pp. 1–6.
- Forbes, D.L. State of the Arctic Coast 2010—Scientific Review and Outlook; Helmholtz-Zentrum: Geesthacht, Germany, 2010; p. 178. [Google Scholar]
- Hill, P.; Hequette, A.; Ruz, M.; Jenner, K. Geological Investigations of the Canadian Beaufort Sea Coast; Open File 2387; Geological Survey of Canada: Dartmouth, NS, Canada, 1991; p. 375. [Google Scholar]
- Burn, C.R.; Kokelj, S.V. The environment and permafrost of the Mackenzie Delta Area. Permafr. Periglac. Process 2009, 20, 83–105. [Google Scholar]
- Allen, D.M.; Michel, F.A.; Judge, A.S. The permafrost regime in the Mackenzie Delta, Beaufort Sea region, N.W.T. and its significance to the reconstruction of the palaeoclimatic history. J. Quat. Sci 1988, 3, 3–13. [Google Scholar]
- Corns, I.G.W. Arctic plant communities east of the Mackenzie Delta. Can. J. Bot 1974, 52, 1731–1745. [Google Scholar]
- Dallimore, S.R.; Wolfe, S.A.; Solomon, S.M. Influence of ground ice and permafrost on coastal evolution, Richards Island, Beaufort Sea coast, N.W.T. Can. J. Earth Sci 1996, 33, 664–675. [Google Scholar]
- Cloude, S.R. Polarisation—Applications in Remote Sensing; Oxford University Press: Oxford, UK, 2009; pp. 1–453. [Google Scholar]
- Touzi, R.; Boerner, W.M.; Lee, J.S.; Lueneburg, E. A review of polarimetry in the context of synthetic aperture radar: concepts and information extraction. Can. J. Remote Sens 2004, 30, 380–407. [Google Scholar]
- Cloude, S.R.; Pottier, E. A review of target decomposition theorems in radar Polarimetry. IEEE Trans. Geosci. Remote Sens 1996, 34, 498–518. [Google Scholar]
- Hamazaki, T. Overview of the Advanced Land Observing Satellite (ALOS): Its mission requirements, sensors, and a satellite system., Proceedings of the ISPRS Joint Workshop—Sensors and Mapping from Space, Hannover, Germany, 27–30 September 1999.
- Kankaku, Y.; Osawa, Y.; Hatooka, Y.; Suzuki, S. Overview of advanced land observing satellite-2 (ALOS-2) mission. Proceedings of the International Archives of the Photogrammetry, Remote Sensing and Spatial Information Science, Kyoto, Japan, 9–12 August 2010.
- Lee, J.S.; Grunes, M.R.; Pottier, E.; Ferro-Famil, L. Unsupervised terrain classification preserving polarimetric scattering characteristics. IEEE Trans. Geosci. Remote Sens 2004, 42, 722–731. [Google Scholar]
- Freeman, A.; Durden, S.L. A three-component scattering model for Polarimetric SAR data. IEEE Trans. Geosci. Remote Sens 1998, 36, 963–973. [Google Scholar]
- Yamaguchi, Y.; Yajima, Y; Yamada, H. A four-component decomposition of POLSAR images based on the Coherency Matrix. IEEE Trans. Geosci. Remote Sens 2006, 3, 292–296. [Google Scholar]
- Cloude, S.R.; Pottier, E. An entropy based classification scheme for land applications of polarimetric SAR. IEEE Trans. Geosci. Remote Sens 1997, 35, 68–78. [Google Scholar]
- Cloude, S.R. The Dualpol Entropy/Alpha decomposition: A PALSAR case study. Proceedings of 3th International Workshop on Science and Applications of SAR Polarimetry and Polarimetric Interferometry, PolInSAR, Frascati, Italy, 22–26 January 2007.
- Shan, Z.; Wang, C.; Zhang, H.; Chen, J. H-alpha decomposition and alternative parameters for dual Polarization SAR data. Proceedings of the PIERS, Suzhou, China, 12–16 September 2011.
- Schmitt, A. Änderungserkennung in Multitemporalen und Multipolarisierten Radaraufnahmen. Ph.D. Dissertation. Karlsruher Institut für Technologie (KIT), Oberpfaffenhofen, Germany, 2009. [Google Scholar]
- Schmitt, A.; Leichtle, T.; Huber, M.; Roth, A. On the use of dual-co-polarized TerraSAR-X data for wetland monitoring. Proceedings of the XXII Congress of the International Society for Photogrammetry and Remote Sensing, Melbourne, Australia, 25 August–1 September 2012.
- Hein, A. Processing of SAR Data: Fundamentals, Signal, Processing, Interferometry; Springer Verlag: Berlin/Heidelberg, Germany, 2010; pp. 1–308. [Google Scholar]
- Roth, A.; Huber, M.; Kosmann, D. Geocoding of TerraSAR-X data. Proceedings of the 20th Congress of 20’th International Congress of the ISPRS, Istanbul, Turkey, 12–23 July 2004.
- infoterra. Radiometric calibration of TerraSAR-X data. In Beat Nought and Sigma Nought Coefficient Calculation; infoterra GmbH: Friedrichshafen, Germany, 2008; pp. 1–16. [Google Scholar]
- Buades, A.; Coll, B.; Morel, J.-M. A non-local algorithm for image denoising. Proceedings of the 2005 IEEE Computer Society Conference on Computer Vision and Pattern Recognition, San Diego, CA, USA, 20–25 June 2005; pp. 60–65.
- Deledalle, C.-A.; Tupin, F.; Denis, L. Polarimetric SAR estimation based on non-local means. Proceedings of IEEE International Geoscience and Remote Sensing Symposium (IGARSS), Honolulu, HI, USA, 25–30 July 2010; pp. 2515–2518.
- Deledalle, C.-A.; Denis, L.; Tupin, F.; Reigber, A.; Jäger, M. NL-SAR: A Unified Non-Local Framework for Resolution- Preserving (Pol)(In)SAR Denoising, Available online: http://hal.archieves-ouvertes.fr/hal-00844118 (accessed on 02 May 2014).
- NASA Landsat Program. Landsat 8 Scene LC80640112013214LGN00, US Geological Survey (USGS). 2013. Available online: http://landsat.usgs.gov/landsat8.php (accessed on 13 May 2014). [Google Scholar]
- Jensen, J.R. Introductory Digital Image Processing, 2nd ed; Keith, C.C., Ed.; Prentice Hall: Upper Saddle River, NJ, USA, 1996; p. 318. [Google Scholar]
- Natural Resources Canada, CanVec—Hydrography Data for Canada, 2007. Available online: http://geogratis.gc.ca (accessed on 5 May 2014).
- Canty, M.J. Image Analysis, Classification, and Change Detection in Remote Sensing: With Algorithms for ENVI/IDL; CRC Press: Boca Raton, FL, USA, 2009; p. 441. [Google Scholar]
- Jenks, G.F. The data model concept in statistical mapping. In International Yearbook of Cartography; George Philip: London, UK, 1967; pp. 186–190. [Google Scholar]
- Congalton, R.G.; Green, K. Assessing the Accuracy of Remotely Sensed Data: Principles and Practices, 2nd ed.; CRC Press: Raton, FL, USA, 2008; p. 200. [Google Scholar]
- Mitsunobu, S.; Kazuo, O.; Chan-Su, Y. On the eigenvalue analysis using HH-VV dual-polarization SAR data and its applications to monitoring of coastal oceans. Proc. SPIE 2013, 8734. [Google Scholar] [CrossRef]


| Sensor | AcquisitionDate | Incidence Angle | Polarization | AcquisitionMode | Resampled Resolution |
|---|---|---|---|---|---|
| L 8 | 2 August 2013 | n/a | n/a | n/a | 30.0 m |
| TSX | 13 August 2012 | 30.6° | HH/VV | Stripmap | 12.0 m |
| TSX | 4 September 2012 | 31.6° | HH/VV | Stripmap | 12.0 m |
| TSX | 15 September 2012 | 32.1° | HH/VV | Stripmap | 12.0 m |
| TSX | 26 September 2012 | 32.7° | HH/VV | Stripmap | 12.0 m |
| R-2 | 5 August 2010 | 46.1° | HH/HV/VH/VV | Fine | 12.0 m |
| R-2 | 25 August 2010 | 40.7° | HH/HV/VH/VV | Fine | 12.0 m |
| (a) Landsat 8 | (b) TSX HH/VV | |||||||||
| NBG | VLD | VMD | VSD | VWT | NBG | VLD | VMD | VSD | VWT | |
| NBG | 98 | 1 | 0 | 1 | 0 | 90 | 1 | 0 | 2 | 0 |
| VLD | 2 | 71 | 32 | 8 | 0 | 8 | 58 | 26 | 5 | 0 |
| VMD | 0 | 20 | 49 | 10 | 0 | 1 | 5 | 14 | 9 | 0 |
| VSD | 0 | 7 | 18 | 74 | 8 | 1 | 35 | 58 | 75 | 2 |
| VWT | 0 | 1 | 1 | 7 | 92 | 0 | 1 | 2 | 9 | 98 |
| Overall | 70.6 | Overall | 62.1 | |||||||
| Kappa | 0.64 | Kappa | 0.53 | |||||||
| (c) R-2 QUAD | (d) R-2 HH/HV | |||||||||
| NBG | VLD | VMD | VSD | VWT | NBG | VLD | VMD | VSD | VWT | |
| NBG | 98 | 1 | 2 | 2 | 8 | 91 | 8 | 3 | 0 | 0 |
| VLD | 0 | 61 | 26 | 20 | 0 | 0 | 55 | 23 | 12 | 0 |
| VMD | 0 | 11 | 47 | 28 | 2 | 0 | 15 | 42 | 31 | 4 |
| VSD | 2 | 26 | 25 | 47 | 7 | 0 | 22 | 29 | 45 | 16 |
| VWT | 0 | 1,0 | 0 | 3 | 83 | 9 | 0 | 3 | 12 | 80 |
| Overall | 62.9 | Overall | 56.1 | |||||||
| Kappa | 0.54 | Kappa | 0. 46 | |||||||
| (e) Landsat 8 + TSX | (f) Landsat 8 + R-2 QUAD | |||||||||
| NBG | VLD | VMD | VSD | VWT | NBG | VLD | VMD | VSD | VWT | |
| NBG | 96 | 0 | 0 | 0 | 0 | 96 | 0 | 0 | 1 | 3 |
| VLD | 0 | 57 | 14 | 1 | 0 | 1 | 69 | 13 | 8 | 0 |
| VMD | 0 | 24 | 65 | 23 | 0 | 0 | 19 | 59 | 15 | 0 |
| VSD | 2 | 17 | 20 | 72 | 2 | 0 | 10 | 25 | 67 | 2 |
| VWT | 2 | 2 | 1 | 4 | 98 | 3 | 2 | 3 | 9 | 95 |
| Overall | 71.3 | Overall | 69.2 | |||||||
| Kappa | 0.64 | Kappa | 0.26 | |||||||
| (g) Landsat 8 + R-2 HH/HV | (h) TSX + R-2 QUAD | |||||||||
| NBG | VLD | VMD | VSD | VWT | NBG | VLD | VMD | VSD | VWT | |
| NBG | 97 | 0 | 0 | 0 | 8 | 96 | 2 | 1 | 3 | 3 |
| VLD | 1 | 57 | 8 | 5 | 2 | 3 | 51 | 17 | 17 | 1 |
| VMD | 0 | 19 | 52 | 11 | 2 | 0 | 35 | 61 | 28 | 0 |
| VSD | 2 | 24 | 37 | 81 | 2 | 0 | 11 | 21 | 50 | 7 |
| VWT | 0 | 0 | 3 | 3 | 86 | 1 | 1 | 0 | 2 | 89 |
| Overall | 68.1 | Overall | 62.7 | |||||||
| Kappa | 0.61 | Kappa | 0.54 | |||||||
| (a) Landsat 8 | (b) TSX HH/VV | |||||||||
| NBG | VLD | VMD | VSD | VWT | NBG | VLD | VMD | VSD | VWT | |
| NBG | 98 | 1 | 0 | 1 | 0 | 97 | 1 | 0 | 5 | 0 |
| VLD | 2 | 60 | 7 | 4 | 2 | 1 | 43 | 16 | 9 | 0 |
| VMD | 0 | 36 | 88 | 14 | 3 | 0 | 50 | 74 | 50 | 0 |
| VSD | 0 | 3 | 4 | 79 | 4 | 0 | 6 | 10 | 34 | 2 |
| VWT | 0 | 0 | 1 | 2 | 91 | 2 | 0 | 0 | 2 | 98 |
| Overall | 82.5 | Overall | 67.2 | |||||||
| Kappa | 0.78 | Kappa | 0.59 | |||||||
| (c) R-2 QUAD | (d) R-2 HH/HV | |||||||||
| NBG | VLD | VMD | VSD | VWT | NBG | VLD | VMD | VSD | VWT | |
| NBG | 98 | 0 | 0 | 0 | 0 | 91 | 1 | 0 | 6 | 0 |
| VLD | 0 | 69 | 18 | 23 | 0 | 4 | 73 | 30 | 28 | 1 |
| VMD | 0 | 21 | 66 | 32 | 1 | 1 | 19 | 58 | 34 | 6 |
| VSD | 1 | 9 | 13 | 41 | 4 | 0 | 5 | 9 | 27 | 3 |
| VWT | 1 | 1 | 3 | 4 | 95 | 4 | 2 | 3 | 5 | 90 |
| Overall | 68.5 | Overall | 66.3 | |||||||
| Kappa | 0.68 | Kappa | 0.57 | |||||||
| (e) Landsat 8 + TSX HH/VV | (f) Landsat 8 + R-2 QUAD | |||||||||
| NBG | VLD | VMD | VSD | VWT | NBG | VLD | VMD | VSD | VWT | |
| NBG | 99 | 0 | 0 | 4 | 0 | 98 | 0 | 0 | 0 | 0 |
| VLD | 1 | 71 | 7 | 6 | 0 | 1 | 75 | 7 | 7 | 0 |
| VMD | 0 | 27 | 90 | 22 | 0 | 0 | 20 | 88 | 11 | 0 |
| VSD | 0 | 1 | 3 | 66 | 2 | 0 | 4 | 4 | 79 | 3 |
| VWT | 0 | 1 | 0 | 2 | 98 | 1 | 1 | 1 | 3 | 97 |
| Overall | 83.8 | Overall | 86.5 | |||||||
| Kappa | 0.79 | Kappa | 0.83 | |||||||
| (g) Landsat 8 + R-2 HH/HV | (h) TSX HH/VV + R-2 QUAD | |||||||||
| NBG | VLD | VMD | VSD | VWT | NBG | VLD | VMD | VSD | VWT | |
| NBG | 98 | 0 | 0 | 0 | 0 | 98 | 0 | 0 | 5 | 0 |
| VLD | 2 | 73 | 8 | 8 | 1 | 0 | 64 | 14 | 10 | 0 |
| VMD | 0 | 21 | 86 | 12 | 0 | 0 | 27 | 78 | 36 | 0 |
| VSD | 0 | 5 | 5 | 78 | 3 | 0 | 8 | 6 | 46 | 2 |
| VWT | 0 | 0 | 1 | 2 | 96 | 2 | 1 | 2 | 3 | 98 |
| Overall | 85.4 | Overall | 75.5 | |||||||
| Kappa | 0.81 | Kappa | 0.69 | |||||||
© 2014 by the authors; licensee MDPI, Basel, Switzerland This article is an open access article distributed under the terms and conditions of the Creative Commons Attribution license (http://creativecommons.org/licenses/by/3.0/).
Share and Cite
Ullmann, T.; Schmitt, A.; Roth, A.; Duffe, J.; Dech, S.; Hubberten, H.-W.; Baumhauer, R. Land Cover Characterization and Classification of Arctic Tundra Environments by Means of Polarized Synthetic Aperture X- and C-Band Radar (PolSAR) and Landsat 8 Multispectral Imagery — Richards Island, Canada. Remote Sens. 2014, 6, 8565-8593. https://doi.org/10.3390/rs6098565
Ullmann T, Schmitt A, Roth A, Duffe J, Dech S, Hubberten H-W, Baumhauer R. Land Cover Characterization and Classification of Arctic Tundra Environments by Means of Polarized Synthetic Aperture X- and C-Band Radar (PolSAR) and Landsat 8 Multispectral Imagery — Richards Island, Canada. Remote Sensing. 2014; 6(9):8565-8593. https://doi.org/10.3390/rs6098565
Chicago/Turabian StyleUllmann, Tobias, Andreas Schmitt, Achim Roth, Jason Duffe, Stefan Dech, Hans-Wolfgang Hubberten, and Roland Baumhauer. 2014. "Land Cover Characterization and Classification of Arctic Tundra Environments by Means of Polarized Synthetic Aperture X- and C-Band Radar (PolSAR) and Landsat 8 Multispectral Imagery — Richards Island, Canada" Remote Sensing 6, no. 9: 8565-8593. https://doi.org/10.3390/rs6098565
APA StyleUllmann, T., Schmitt, A., Roth, A., Duffe, J., Dech, S., Hubberten, H.-W., & Baumhauer, R. (2014). Land Cover Characterization and Classification of Arctic Tundra Environments by Means of Polarized Synthetic Aperture X- and C-Band Radar (PolSAR) and Landsat 8 Multispectral Imagery — Richards Island, Canada. Remote Sensing, 6(9), 8565-8593. https://doi.org/10.3390/rs6098565