Aerosol Indices Derived from MODIS Data for Indicating Aerosol-Induced Air Pollution


Abstract
:1. Introduction
2. Data and Method
2.1. Data Acquisition and Processing
2.2. Simulation Experiments
3. Results
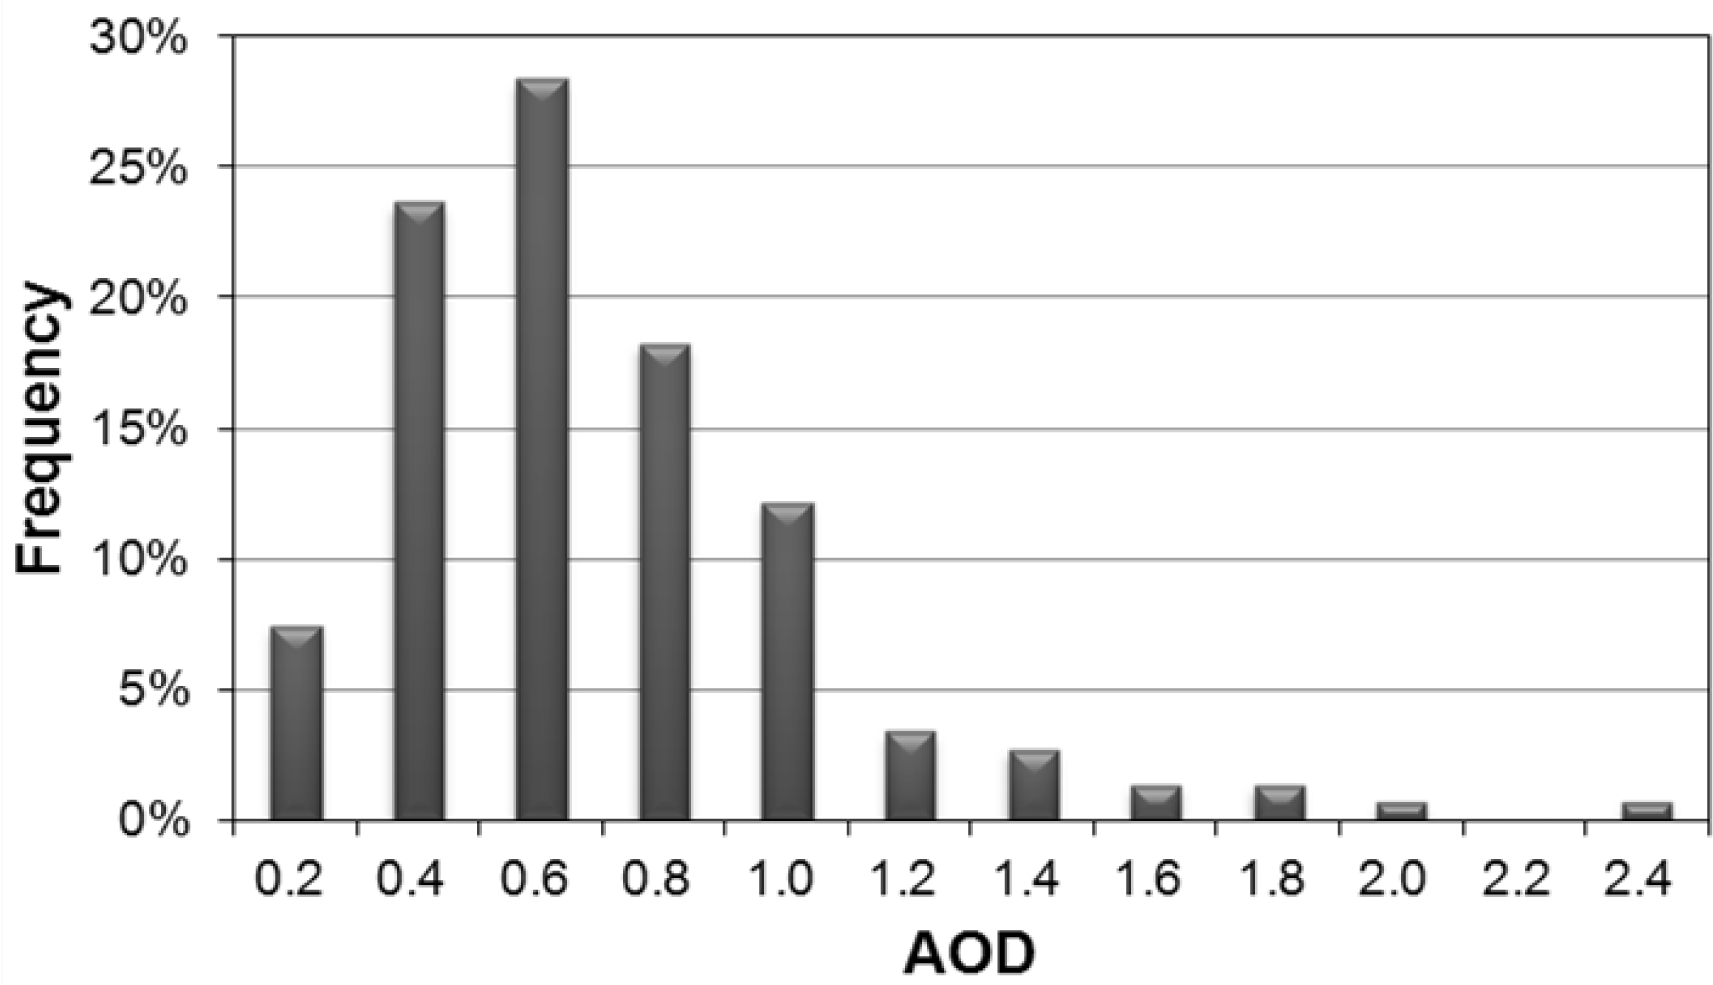
3.1. AOD Variation
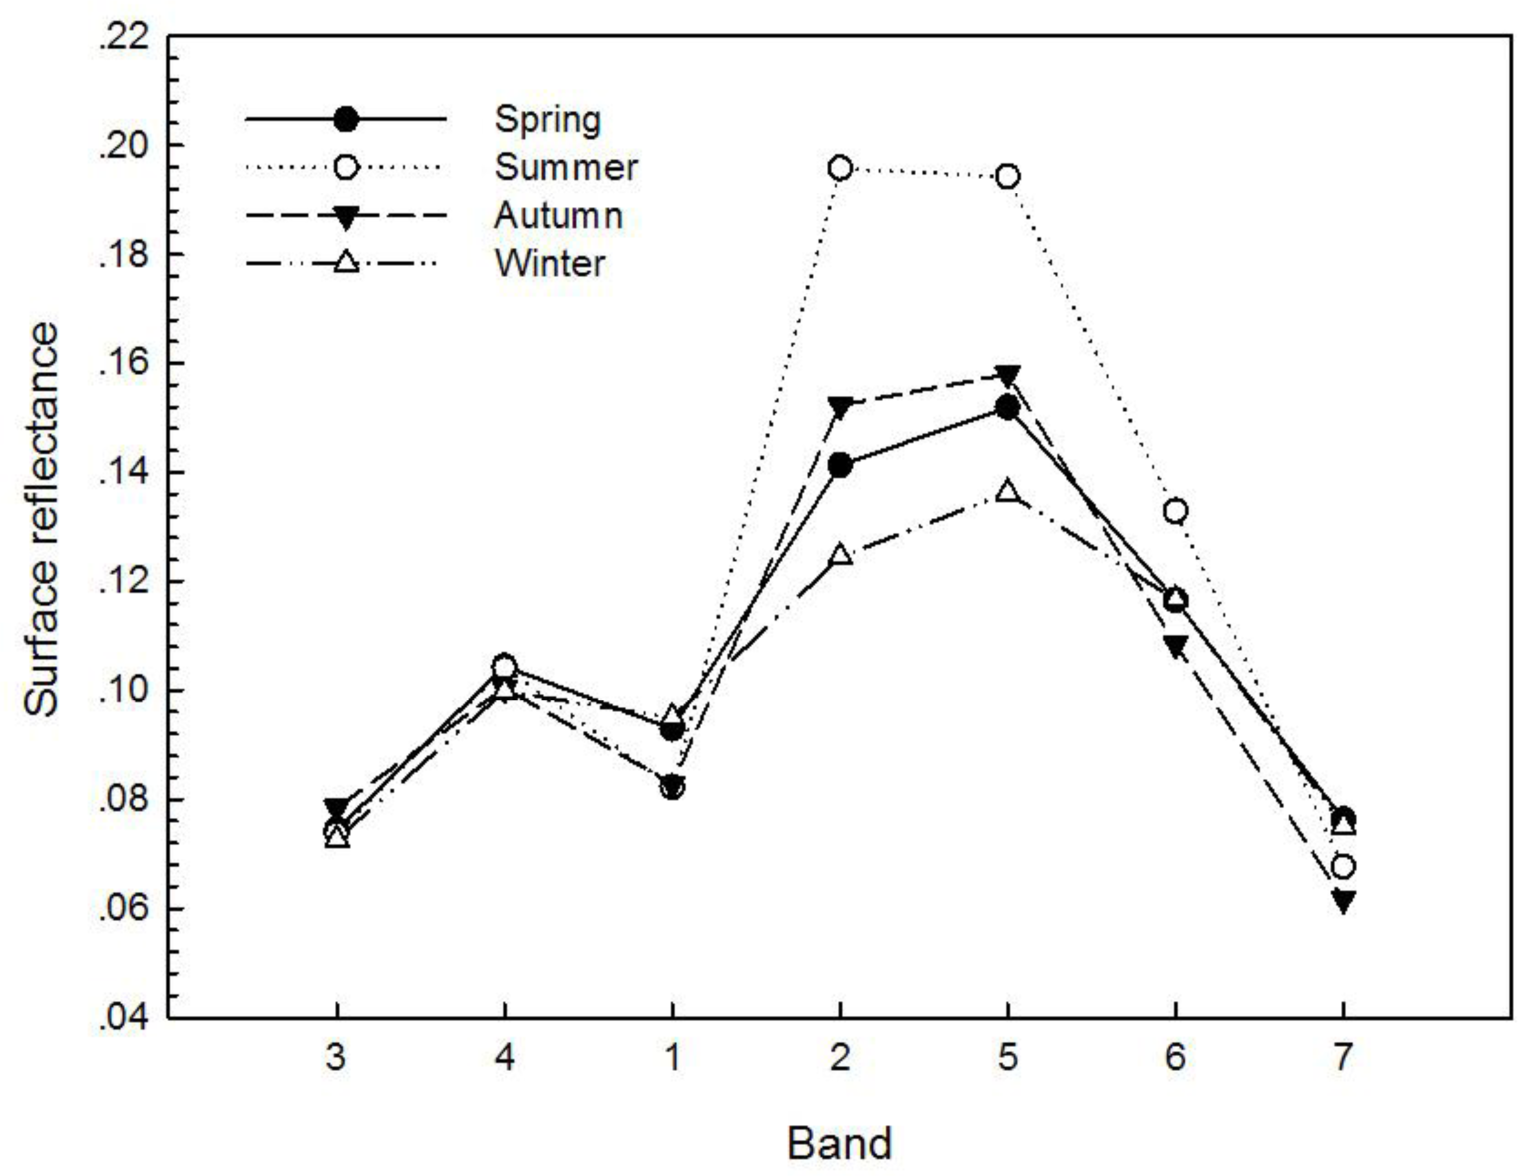
3.2. Spectral Properties of the Study Site
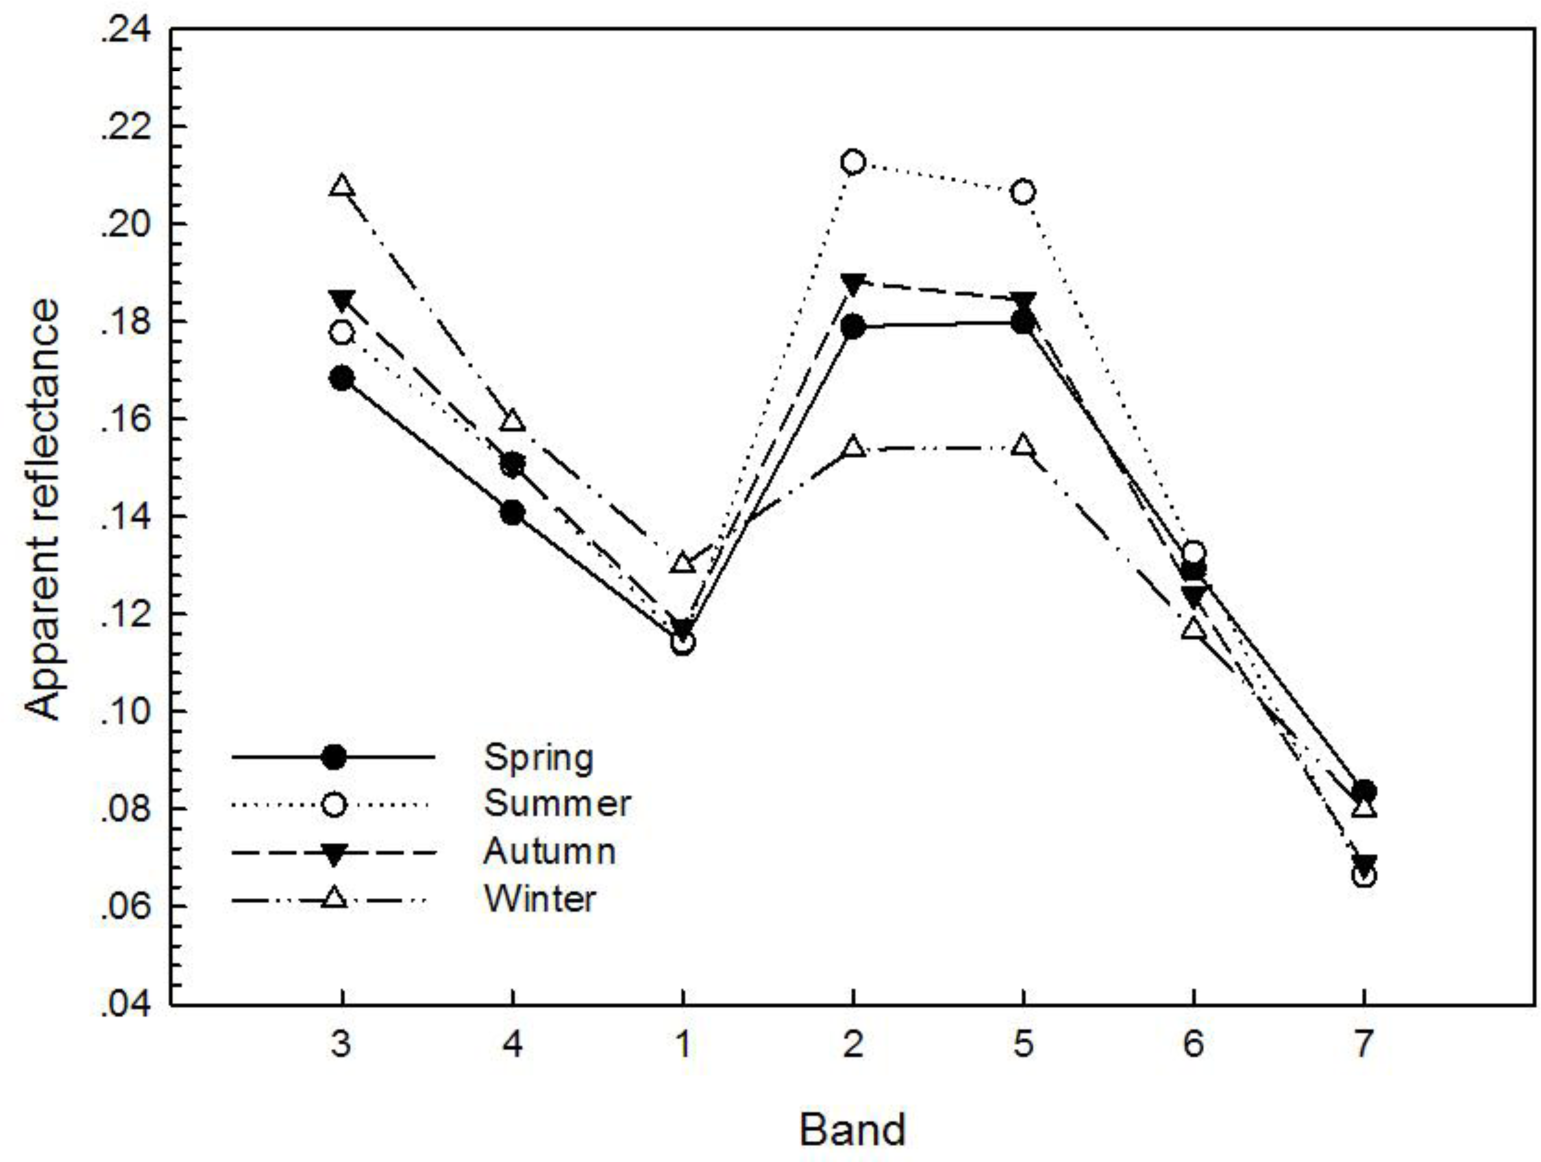
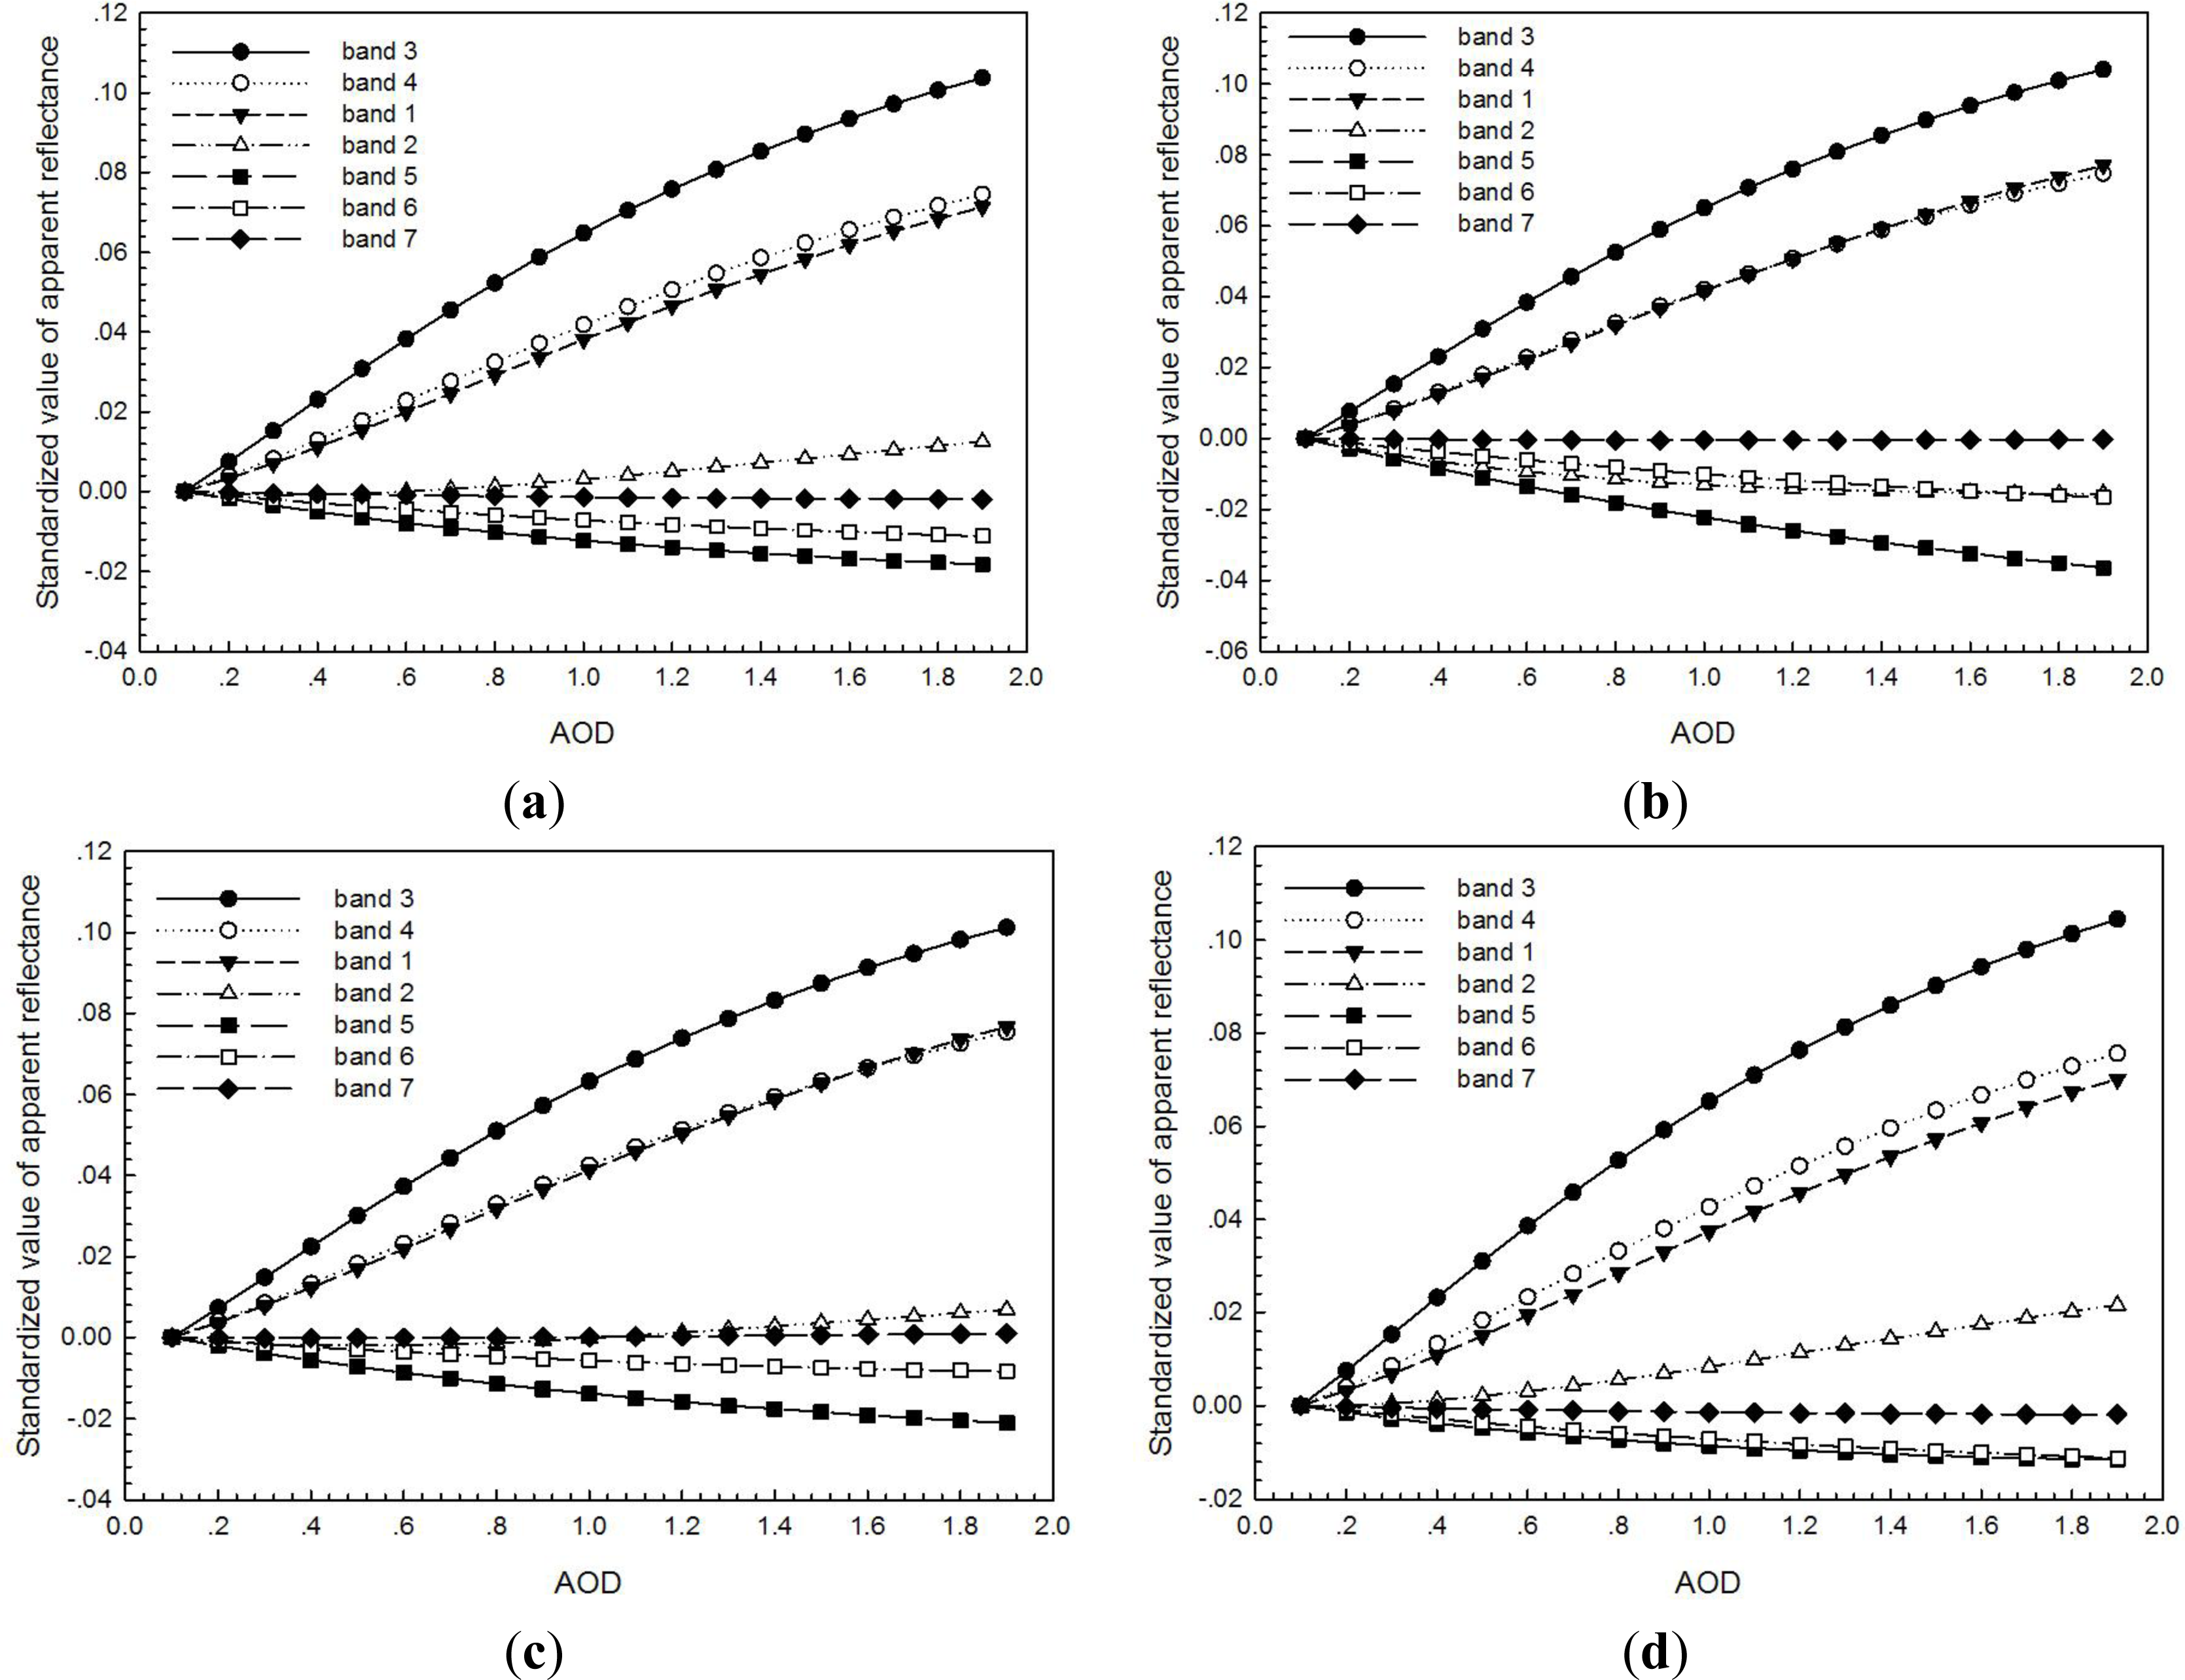
3.3. Variation of Simulated Apparent Reflectance
3.4. Correlation between in situ Measured AOD and Aerosol Indices
4. Conclusions
Acknowledgments
Author Contributions
Conflict of Interest
References
- Rosenfeld, D.; Dai, J.; Yu, X.; Yao, Z.Y.; Xu, X.H.; Yang, X.; Du, C.L. Inverse relations between amounts of air pollution and orographic precipitation. Science 2007, 315, 1396–1398. [Google Scholar]
- Wang, K.C.; Dickinson, R.E.; Liang, S.L. Clear sky visibility has decreased over land globally from 1973 to 2007. Science 2009, 323, 1468–1470. [Google Scholar]
- Chan, Y.C.; Simpson, R.W.; Mctainsh, G.H.; Vowles, P.D.; Cohen, D.D.; Bailey, G.M. Source apportionment of visibility degradation problems in Brisbane (Australia) using the multiple linear regression techniques. Atmos. Environ 1999, 33, 3237–3250. [Google Scholar]
- Carmichael, G.R.; Adhikary, B.; Kulkarni, S.; D’Allura, A.; Tang, Y.H.; Streets, D.; Zhang, Q.; Bond, T.C.; Ramanathan, V.; Jamroensan, A.; et al. Asian aerosols: current and year 2030 distributions and implications to human health and regional climate change. Environ. Sci. Technol 2009, 43, 5811–5817. [Google Scholar]
- Gao, J.; Zha, Y. Meteorological influence on predicting air pollution from MODIS-derived aerosol optical thickness: A case study in Nanjing, China. Remote Sens 2010, 2, 2136–2147. [Google Scholar]
- Kaufman, Y.J.; Sendra, C. Algorithm for automatic atmospheric corrections to visible and near-IR satellite imagery. Int. J. Remote Sens 1988, 9, 1357–1381. [Google Scholar]
- Tanré, D.; Deschamps, P.Y.; Devaux, C.; Herman, M. Estimation of Saharan aerosol optical thickness from blurring effects in thematic mapper data. J. Geophys. Res 1988, 93, 15955–15964. [Google Scholar]
- Holben, B.; Vermote, E.; Kaufman, Y.J.; Tanré, D.; Kalb, V. Aerosols retrieval over land from AVHRR data—Application for atmospheric correction. IEEE Trans. Geosci. Remote Sens 1992, 30, 212–222. [Google Scholar]
- Herman, M.; Deuzé, J.L.; Devaux, C.; Goloub, P.; Bréon, F.M.; Tanré, D. Remote sensing of aerosols over land surfaces including polarization measurements and application to POLDER measurements. J. Geophys. Res 1997, 102, 17039–17049. [Google Scholar]
- Deuzé, J.L.; Bréon, F.M.; Devaux, C.; Goloub, P.; Herman, M.; Lafrance, B.; Maignan, F.; Marchand, A.; Nadal, F.; Perry, G.; et al. Remote sensing of aerosols over land surfaces from POLDER-ADEOS-1 polarized measurements. J. Geophys. Res 2001, 106, 4913–4926. [Google Scholar]
- Martonchik, J.V. Determination of aerosol optical depth and land surface directional reflectances using multiangle imagery. J. Geophys. Res 1997, 102, 17015–17022. [Google Scholar]
- Diner, D.J.; Martonchik, J.V.; Kahn, R.A.; Pinty, B.; Gobron, N.; Nelson, D.L.; Holben, B.N. Using angular and spectral shape similarity constraints to improve MISR aerosol and surface retrievals over land. Remote Sens. Environ 2005, 94, 155–171. [Google Scholar]
- Hsu, N.C.; Tsay, S.C.; King, M.D.; Herman, J.R. Aerosol properties over bright-reflecting source regions. IEEE Trans. Geosci. Remote Sens 2004, 42, 557–569. [Google Scholar]
- Rouse, J.W.; Haas, R.H.; Schell, J.A.; Deering, D.W. Monitoring vegetation systems in the Great Plains with ERTS. NASA Spec. Publ 1973, 1, 309–317. [Google Scholar]
- Mcfeeters, S.K. The use of the normalized difference water index (NDWI) in the delineation of open water features. Int. J. Remote Sens 1996, 17, 1425–1432. [Google Scholar]
- Zha, Y.; Gao, J.; Ni, S. Use of normalized difference built-up index in automatically mapping urban areas from TM imagery. Int. J. Remote Sens 2003, 24, 583–594. [Google Scholar]
- Xu, H.Q. Fast information extraction of urban built-up land based on the analysis of spectral signature and normalized difference index. Geograph. Res 2005, 24, 311–320. (In Chinese) [Google Scholar]
- Griggs, M. Measurement of atmospheric aerosol optical thickness over water using ERTS-1 data. J. Air Pollut. Control Assoc 1975, 25, 622–626. [Google Scholar]
- Durkee, P.A.; Jensen, D.R.; Hindman, E.E.; VonderHaar, T.H. The relationship between marine aerosol particles and satellite-detected radiance. J. Geophys. Res 1986, 91, 4063–4072. [Google Scholar]
- Hsu, N.C.; Herman, J.R.; Bhartia, P.K.; Seftor, C.J.; Torres, O.; Thompson, A.M.; Gleason, J.F.; Eck, T.F.; Holben, B.N. Detection of biomass burning smoke from TOMS measurements. Geophys. Res. Lett 1996, 23, 745–748. [Google Scholar]
- Yu, Z.M.; Zhou, H.M.; Zheng, Y.F. Study on distribution of urban particle pollution by remote sensing and GIS. J. Nat. Disaster 2004, 13, 58–64. (In Chinese) [Google Scholar]
- Zha, Y.; Gao, J.; Jiang, J.J.; Lu, H.; Huang, J.Z. Normalized difference haze index: A new spectral index for monitoring urban air pollution. Int. J. Remote Sens 2012, 33, 309–321. [Google Scholar]
- Eck, T.F.; Holben, B.N.; Reid, J.S.; Dubovik, O.; Smirnov, A.; O’Neill, N.T.; Slutsker, I.; Kinne, S. Wavelength dependence of the optical depth of biomass burning, urban and desert dust aerosols. J. Geophys. Res 1999, 104, 31333–31349. [Google Scholar]
- Holben, B.N.; Eck, T.F.; Slutsker, I.; Tanré, D.; Buis, J.P.; Setzer, A.; Vermote, E.; Reagan, J.A.; Kaufman, Y.J.; Nakajima, T.; et al. AERONET—A federated instrument network and data archive for aerosol characterization. Remote Sens. Environ 1998, 66, 1–16. [Google Scholar]
- Aerosol Robotic Network (AERONET). Available online: http://aeronet.gsfc.nasa.gov/ (accessed on 10 January 2013).
- Dubovik, O.; King, M.D. A flexible inversion algorithm for retrieval of aerosol optical properties from Sun and sky radiance measurements. J. Geophys. Res 2000, 105, 20673–20696. [Google Scholar]
- National Aeronautics and Space Administration (NASA). Available online: http://ladsweb.nascom.nasa.gov/ (accessed on 10 January 2013).
- Cao, C.; Xiong, X.; Wu, A.; Wu, X. Assessing the consistency of AVHRR and MODIS L1B reflectance for generating fundamental climate data records. J. Geophys. Res 2008, 113. [Google Scholar] [CrossRef]
- Ångström, A. The parameters of atmospheric turbidity. Tellus 1964, 16, 64–75. [Google Scholar]
- Vermote, E.F.; Tanré, D.; Deuzé, J.L.; Herman, M.; Morcrette, J.J. Second simulation of the satellite signal in the solar spectrum, 6S: An overview. IEEE Trans. Geosci. Remote Sens 1997, 35, 675–686. [Google Scholar]
- Hu, F.C.; Wang, Z.H.; Zhang, B.; Li, J.S. Study on method for determining atmospheric aerosol type using remote sensing experimental Data. Chin. J. Lasers 2009, 36, 312–317. (In Chinese) [Google Scholar]
- Vermote, E.F.; Tanré, D.; Deuzé, J.L.; Herman, M.; Morcrette, J.J.; Kotchenova, S.Y. Second Simulation of the Satellite Signal in the Solar Spectrum (6S), 6S User Guide Version 3,; November 2006. Available online: http://6s.ltdri.org (accessed on 18 October 2013).
- Zhang, J.H.; Si, Z.J.; Mao, J.T.; Wang, M.H. Remote sensing aerosol optical depth over China with GMS-5 satellite. Chin. J. Atmos. Sci 2003, 27, 23–35. (In Chinese) [Google Scholar]
- Rao, J.W.; Ma, R.H.; Duan, H.T.; Jiang, G.J.; Shang, L.L.; Zhou, L. Aerosol optical thickness of the atmospheric aerosol over Taihu Lake and its features: Results of in situ measurements. Environ. Sci 2012, 33, 2158–2164. (In Chinese) [Google Scholar]
- Zhang, L.; Liao, H.; Li, J.P. Impacts of Asian summer monsoon on seasonal and interannual variations of aerosols over eastern China. J. Geophys. Res 2010, 115. [Google Scholar] [CrossRef]
Appendix

| Season | Seasonal Mean |
|---|---|
| Spring | 0.61 ± 0.27 |
| Summer | 0.72 ± 0.52 |
| Autumn | 0.55 ± 0.33 |
| Winter | 0.51 ± 0.22 |


| Month | 440 nm | 675 nm | 870 nm | 1,020 nm | ||||
|---|---|---|---|---|---|---|---|---|
| SSA | ASY | SSA | ASY | SSA | ASY | SSA | ASY | |
| 2011-SEP | 0.918 | 0.734 | 0.919 | 0.666 | 0.910 | 0.628 | 0.906 | 0.619 |
| 2011-OCT | 0.892 | 0.723 | 0.911 | 0.651 | 0.911 | 0.620 | 0.910 | 0.615 |
| 2011-NOV | 0.908 | 0.736 | 0.928 | 0.666 | 0.927 | 0.629 | 0.925 | 0.613 |
| 2011-DEC | 0.869 | 0.720 | 0.897 | 0.642 | 0.897 | 0.612 | 0.892 | 0.599 |
| 2012-JAN | 0.924 | 0.722 | 0.939 | 0.649 | 0.936 | 0.618 | 0.928 | 0.604 |
| 2012-FEB | 0.911 | 0.716 | 0.928 | 0.650 | 0.925 | 0.629 | 0.918 | 0.621 |
| 2012-MAR | 0.907 | 0.702 | 0.933 | 0.642 | 0.938 | 0.632 | 0.938 | 0.637 |
| 2012-APR | 0.896 | 0.706 | 0.929 | 0.661 | 0.938 | 0.655 | 0.940 | 0.661 |
| 2012-MAY | 0.935 | 0.715 | 0.947 | 0.650 | 0.946 | 0.623 | 0.945 | 0.619 |
| 2012-JUN | 0.944 | 0.721 | 0.960 | 0.659 | 0.961 | 0.627 | 0.960 | 0.613 |
| 2012-JUL | 0.980 | 0.707 | 0.984 | 0.646 | 0.983 | 0.623 | 0.982 | 0.629 |
| 2012-AUG | 0.976 | 0.759 | 0.978 | 0.684 | 0.975 | 0.639 | 0.972 | 0.618 |
| Mean | 0.922 | 0.722 | 0.938 | 0.656 | 0.937 | 0.628 | 0.935 | 0.621 |
| Season | No. of Observations | Seasonal Mean |
|---|---|---|
| Spring | 40 | 0.59 ± 0.21 |
| Summer | 36 | 0.68 ± 0.61 |
| Autumn | 33 | 0.63 ± 0.35 |
| Winter | 39 | 0.50 ± 0.17 |
| Season | Spring | Summer | Autumn | Winter |
|---|---|---|---|---|
| AI | ||||
| DAI | 0.9905 | 0.9903 | 0.9902 | 0.9904 |
| RAI | 0.9911 | 0.9893 | 0.9875 | 0.9909 |
| NDAI | 0.9707 | 0.9679 | 0.9669 | 0.9704 |
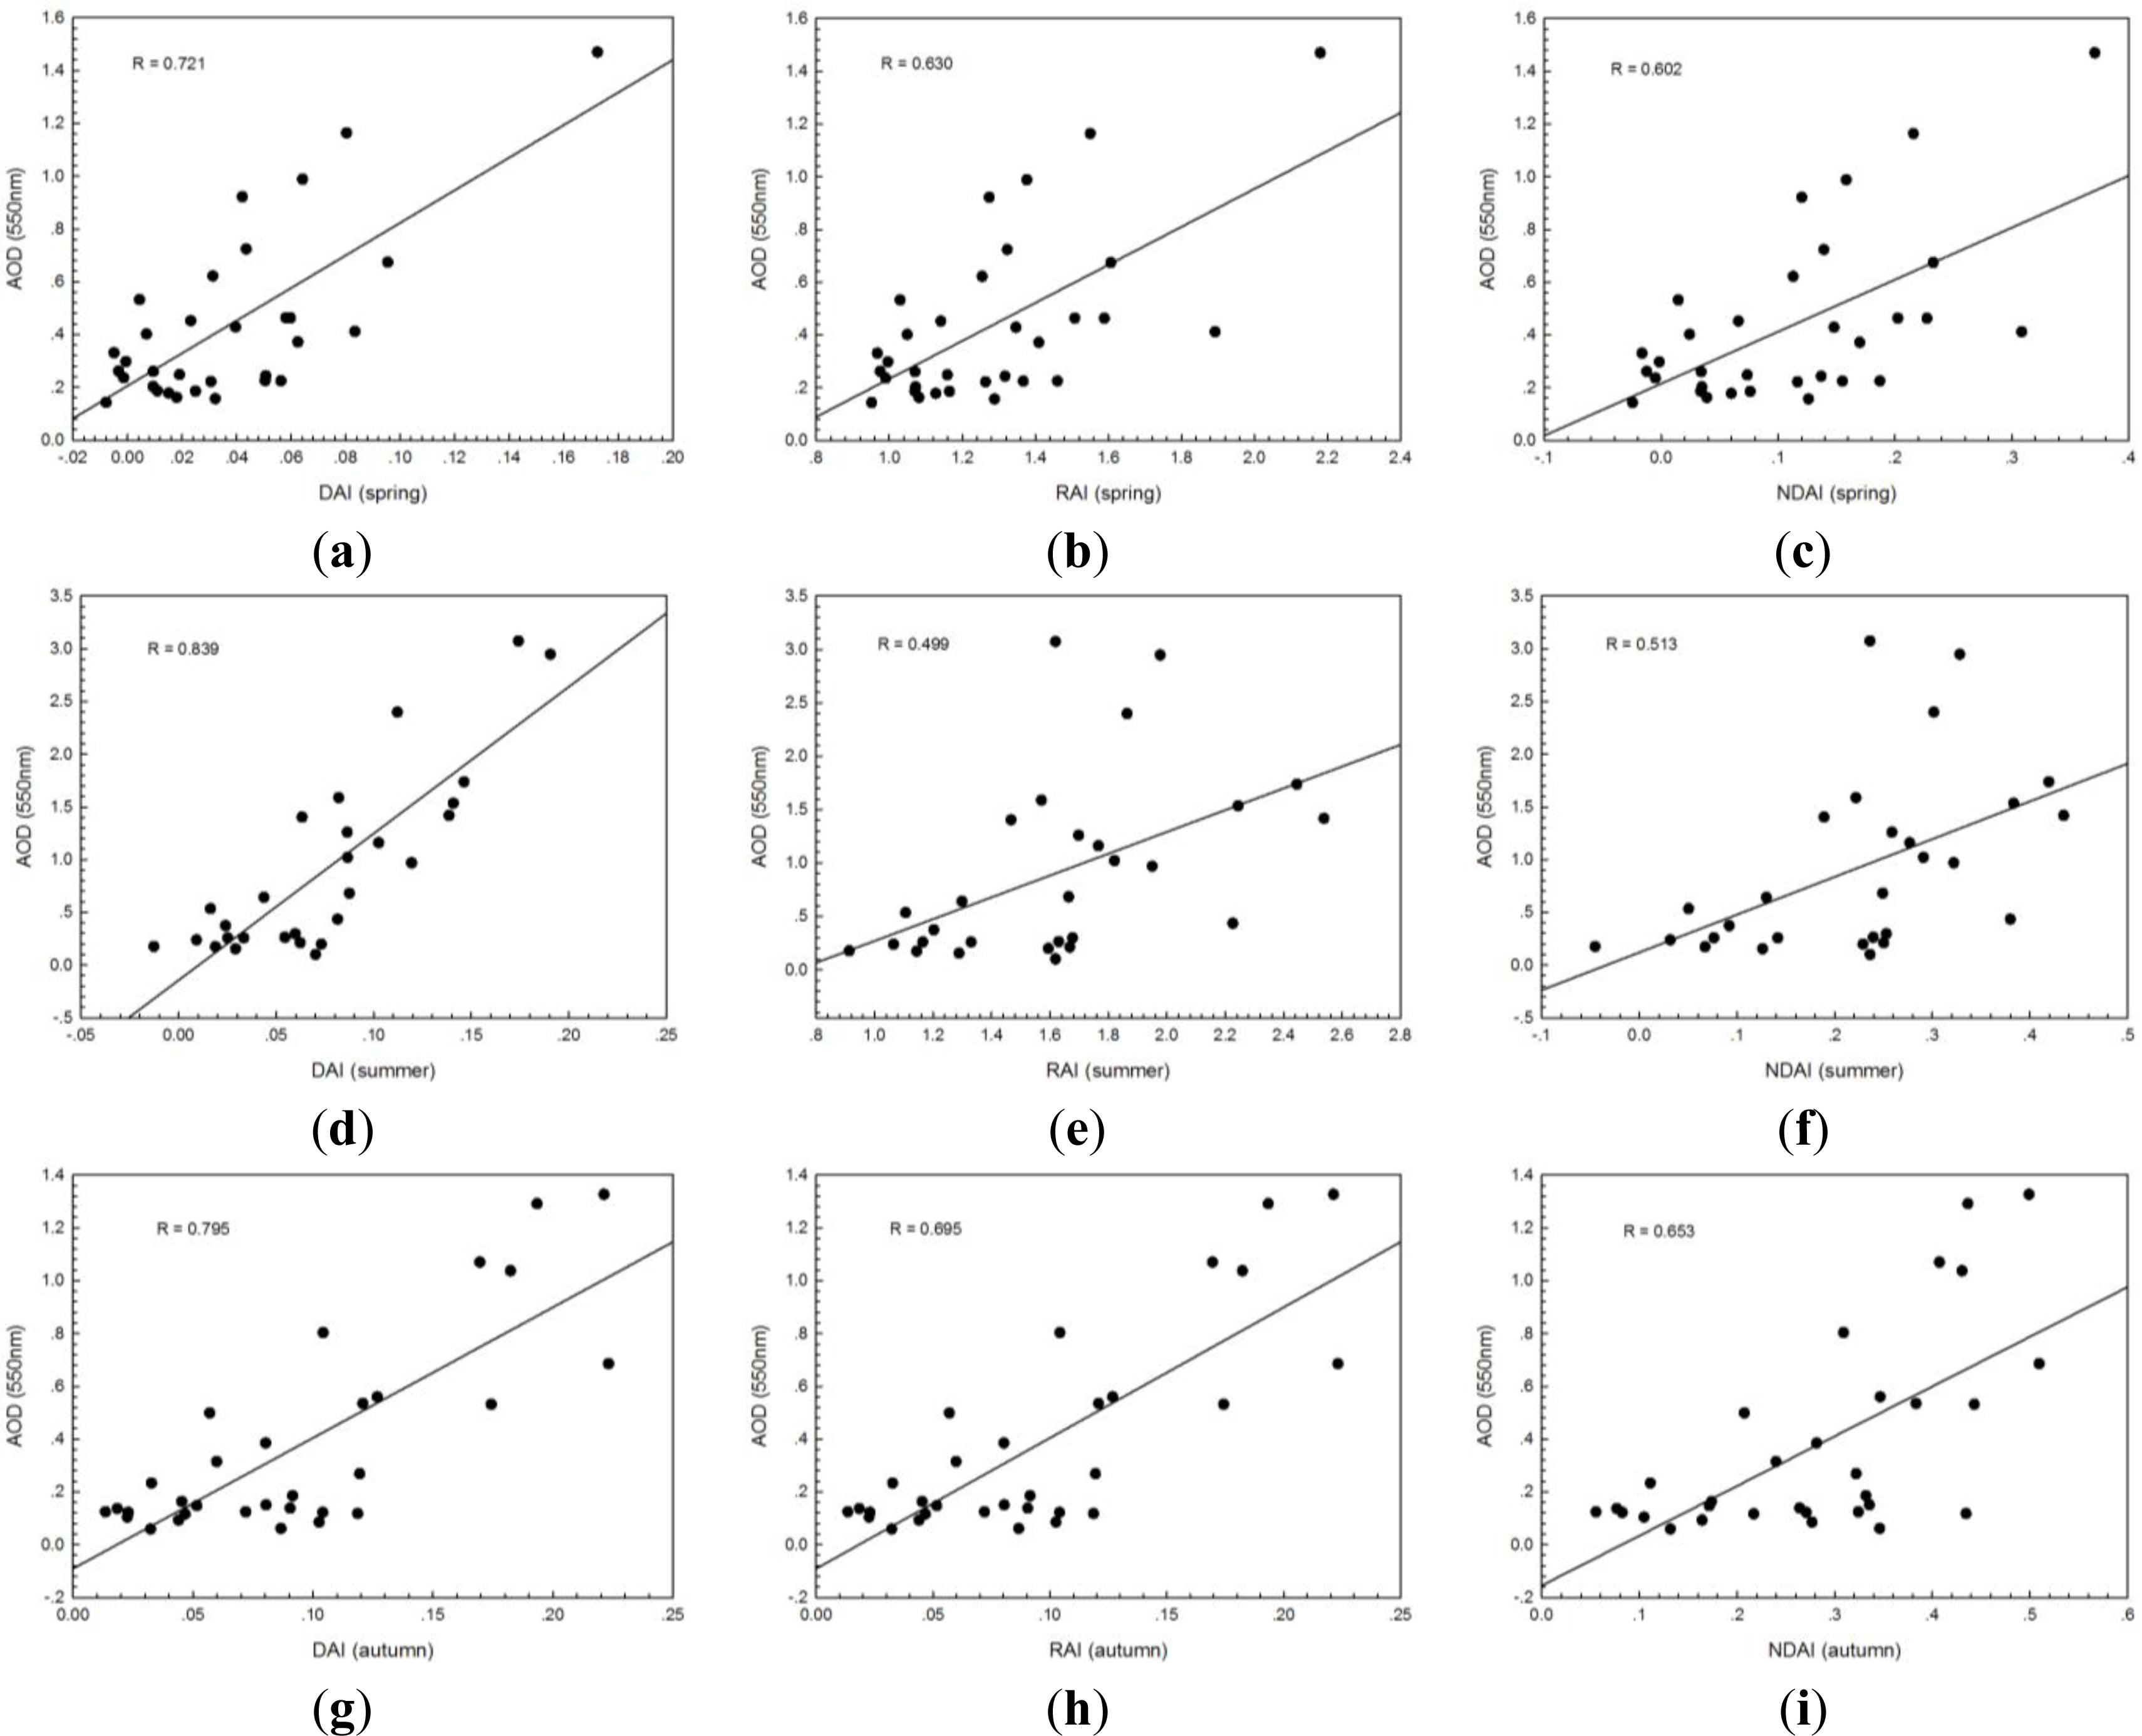
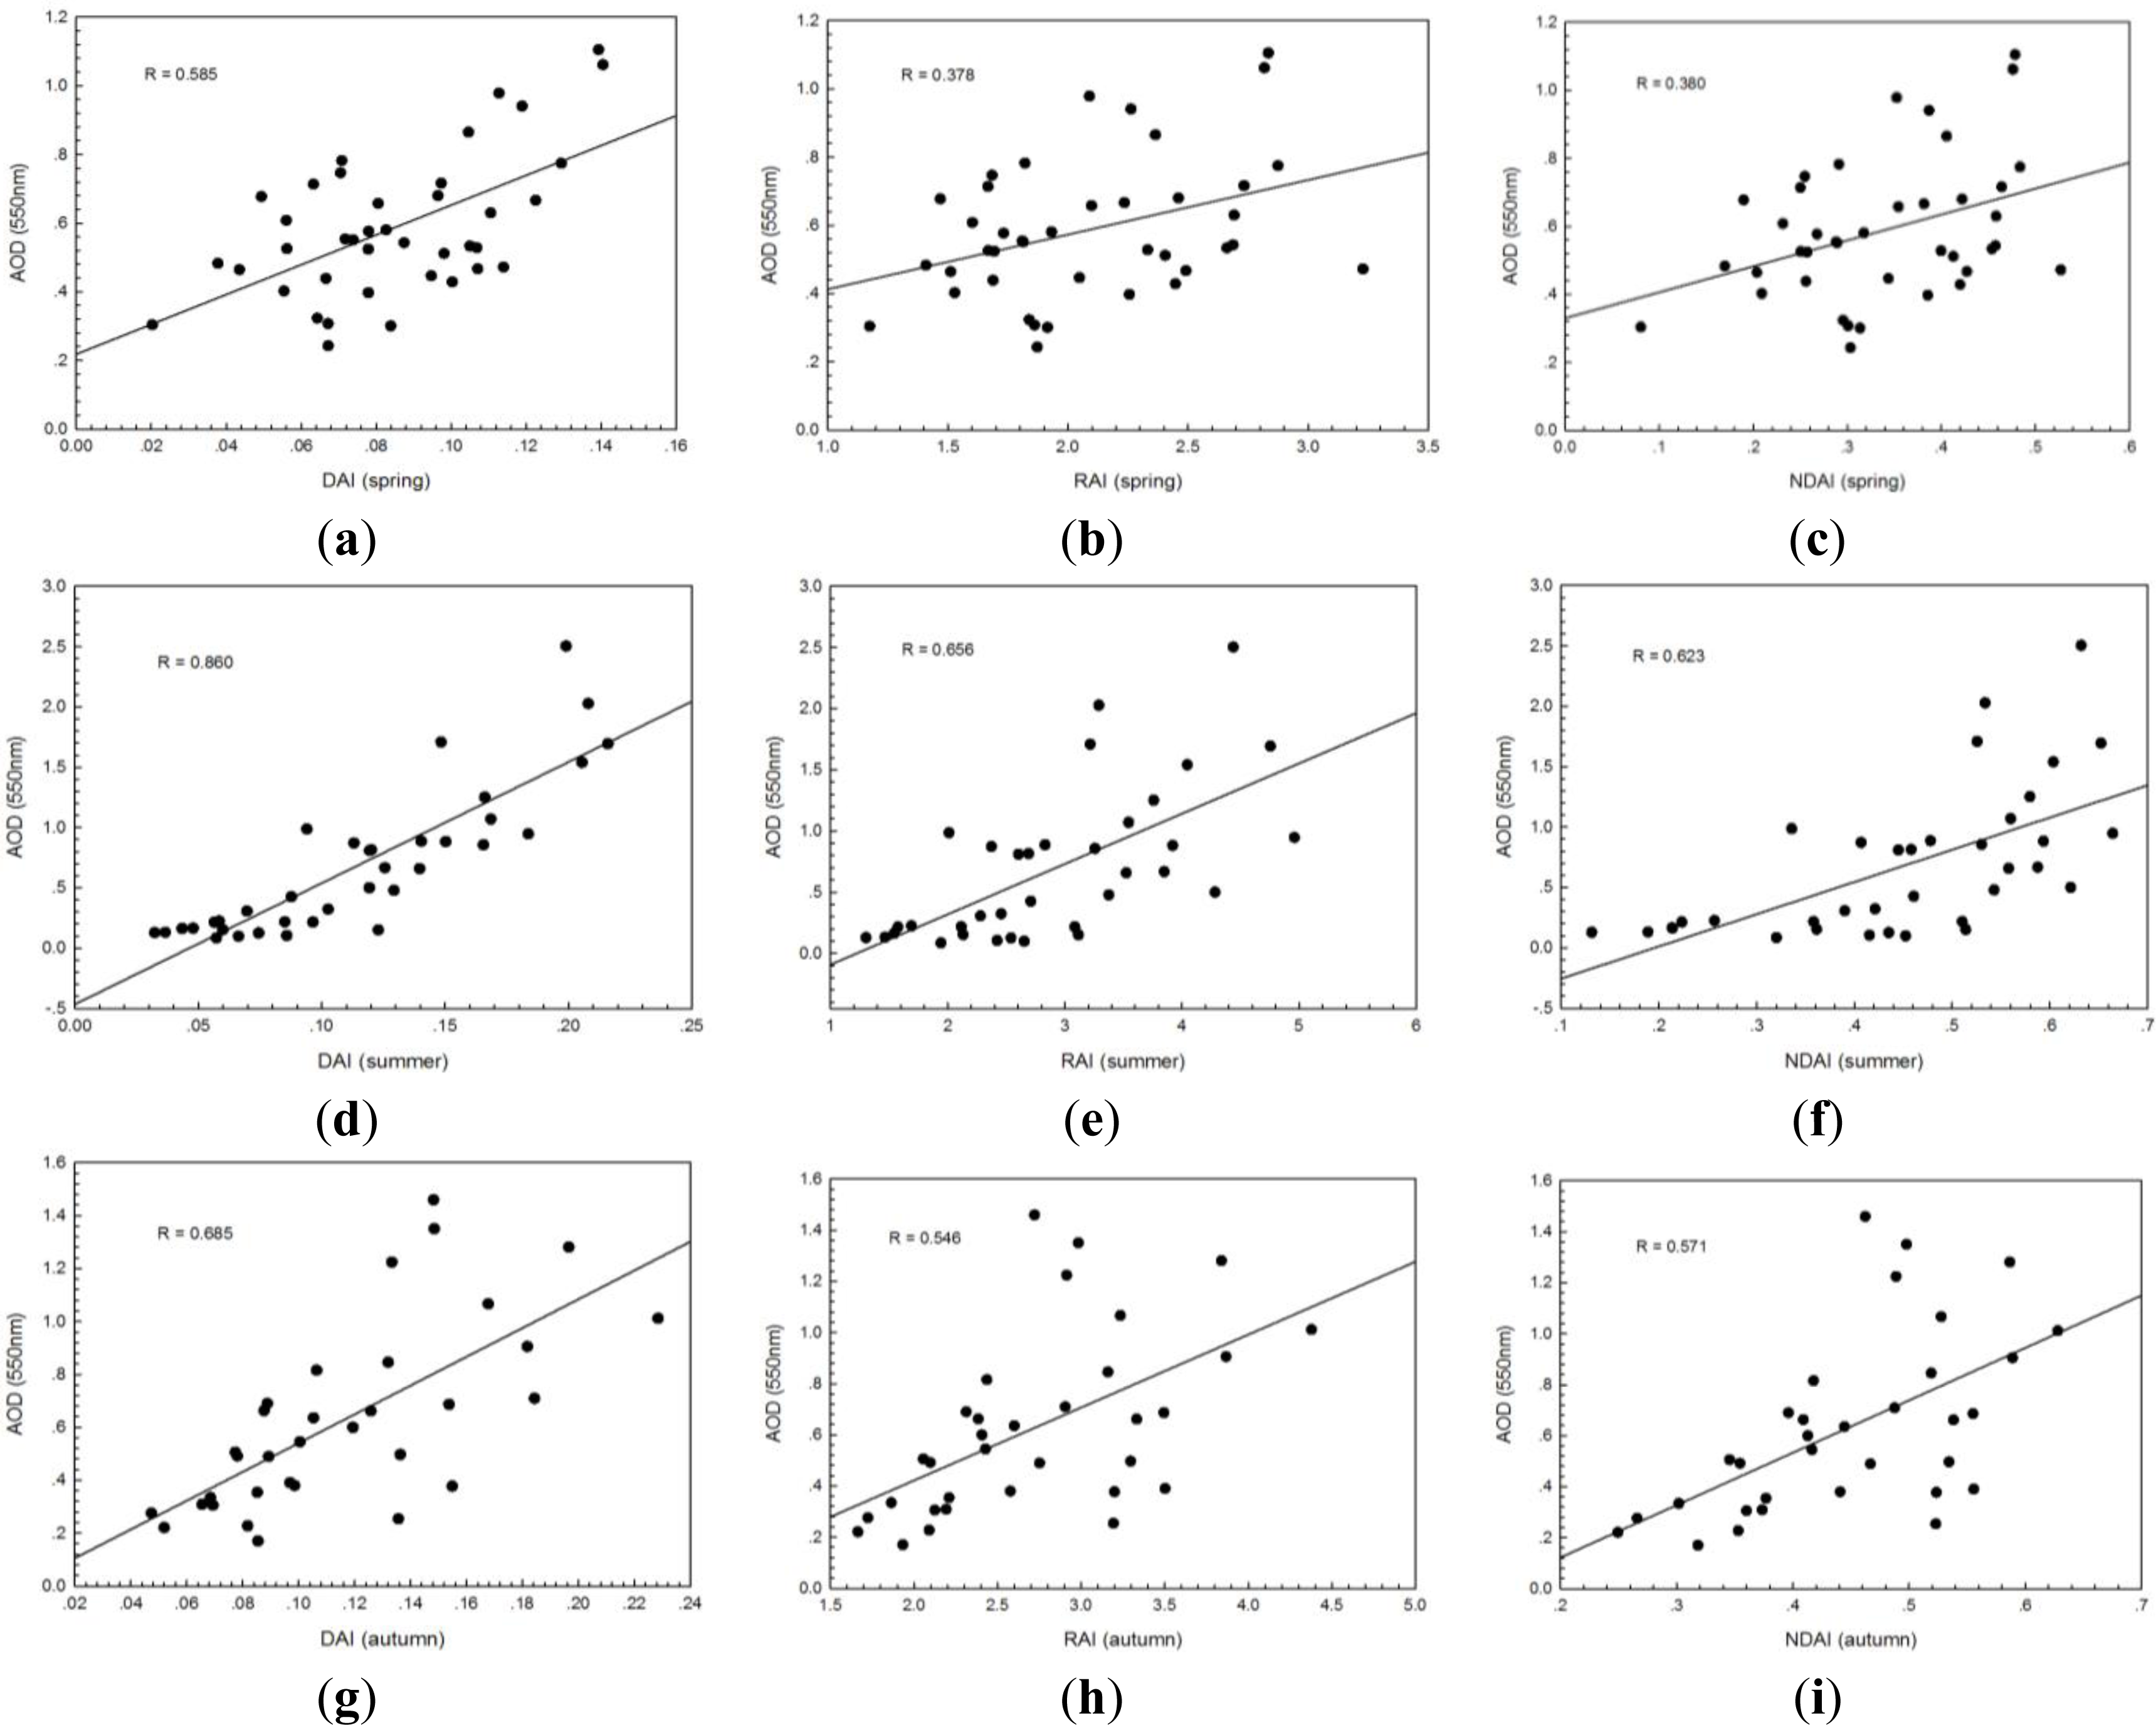
| Site | Season | Index | Model | R | R-Squared | P | N |
|---|---|---|---|---|---|---|---|
| Taihu | Spring | DAI | Y = 4.343 × x + 0.218 | 0.585 | 0.343 | 0.000 | 40 |
| RAI | Y = 0.160 × x + 0.252 | 0.378 | 0.143 | 0.016 | |||
| NDAI | Y = 0.763 × x + 0.330 | 0.380 | 0.145 | 0.015 | |||
| Summer | DAI | Y = 10.044 × x − 0.466 | 0.860 | 0.740 | 0.000 | 36 | |
| RAI | Y = 0.411 × x − 0.504 | 0.656 | 0.430 | 0.000 | |||
| NDAI | Y = 2.669 × x − 0.523 | 0.623 | 0.389 | 0.000 | |||
| Autumn | DAI | Y = 5.440 × x − 0.004 | 0.685 | 0.469 | 0.000 | 33 | |
| RAI | Y = 0.285 × x − 0.149 | 0.546 | 0.298 | 0.001 | |||
| NDAI | Y = 2.056 × x − 0.289 | 0.571 | 0.326 | 0.001 | |||
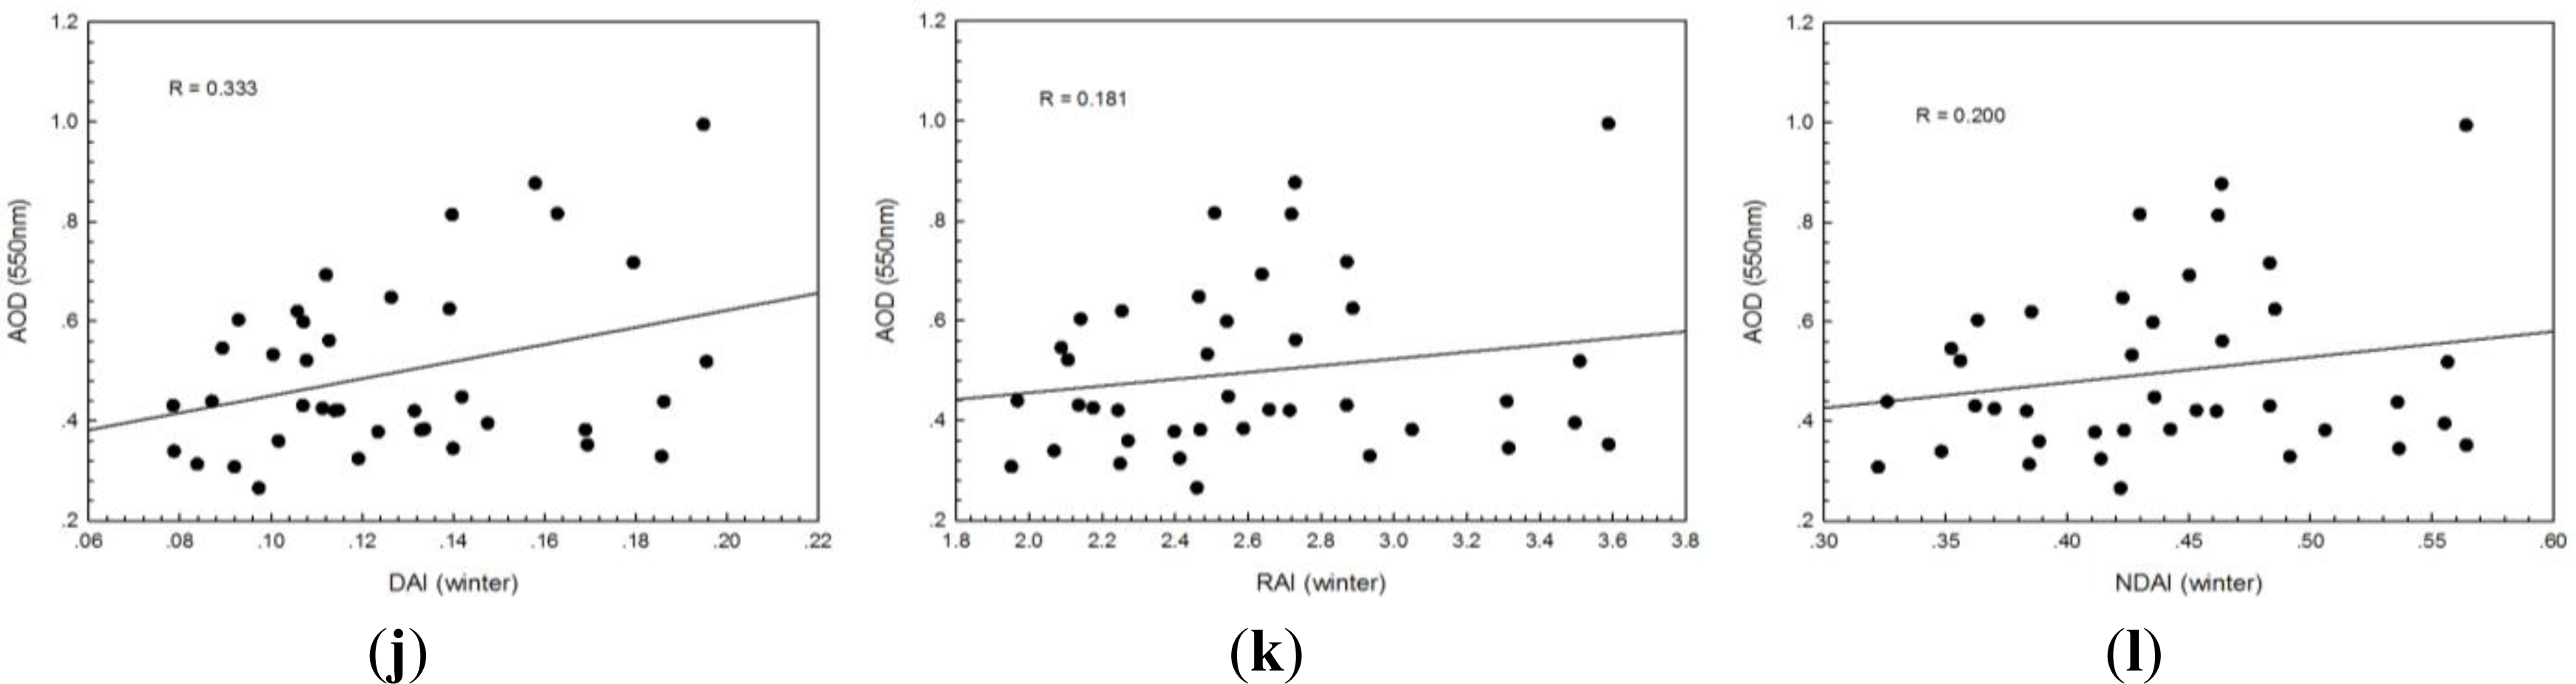
| Winter | DAI | Y = 1.716 × x + 0.279 | 0.333 | 0.111 | 0.038 | 39 | |
| RAI | Y = 0.068 × x + 0.319 | 0.181 | 0.033 | 0.270 | |||
| NDAI | Y = 0.513 × x + 0.273 | 0.200 | 0.040 | 0.223 | |||
| Site | Season | Index | Model | R | R-Squared | P | N |
|---|---|---|---|---|---|---|---|
| Beijing | Spring | DAI | Y = 6.176 × x + 0.205 | 0.721 | 0.520 | 0.000 | 32 |
| RAI | Y = 0.721 × x − 0.488 | 0.630 | 0.397 | 0.000 | |||
| NDAI | Y = 1.973 × x + 0.215 | 0.602 | 0.363 | 0.000 | |||
| Summer | DAI | Y = 13.915 × x − 0.143 | 0.839 | 0.704 | 0.000 | 28 | |
| RAI | Y = 1.022 × x − 0.752 | 0.499 | 0.249 | 0.007 | |||
| NDAI | Y = 3.581 × x + 0.121 | 0.513 | 0.263 | 0.005 | |||
| Autumn | DAI | Y = 4.951 × x − 0.091 | 0.795 | 0.632 | 0.000 | 31 | |
| RAI | Y = 0.483 × x − 0.530 | 0.695 | 0.483 | 0.000 | |||
| NDAI | Y = 1.884 × x − 0.155 | 0.653 | 0.426 | 0.000 | |||
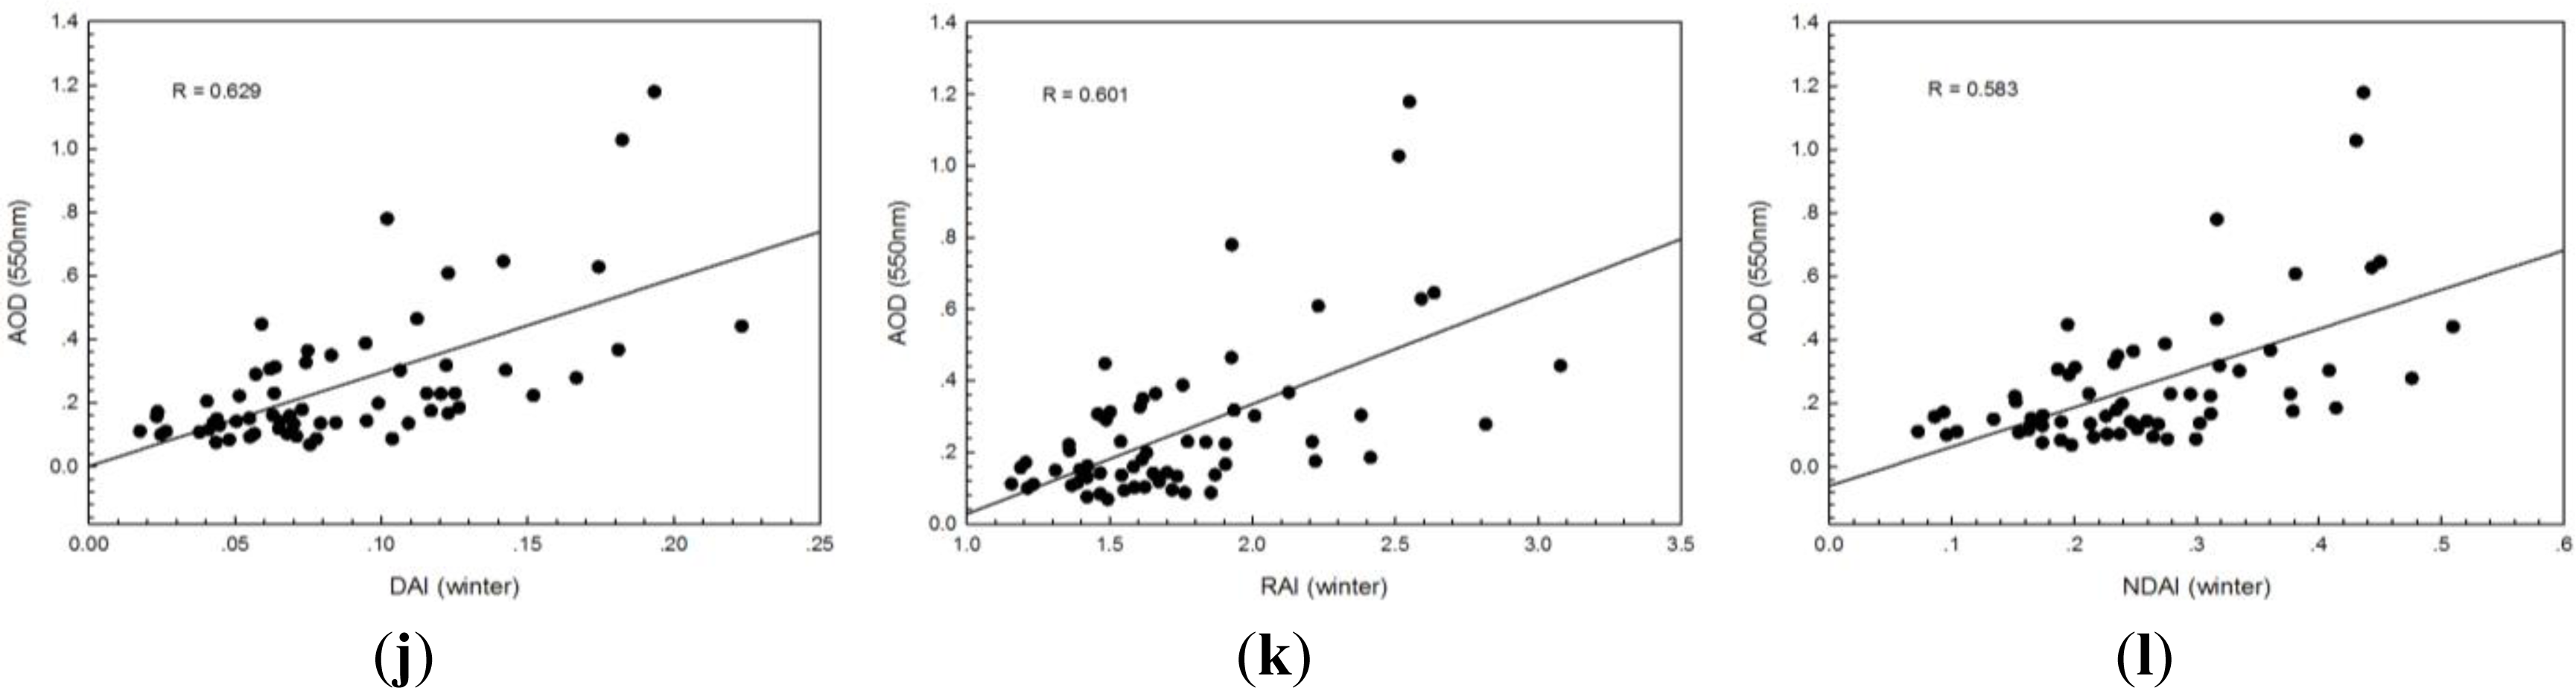
| Winter | DAI | Y = 2.952 × x + 0.001 | 0.629 | 0.396 | 0.000 | 63 | |
| RAI | Y = 0.307 × x − 0.279 | 0.601 | 0.361 | 0.000 | |||
| NDAI | Y = 1.237 × x − 0.060 | 0.583 | 0.340 | 0.000 | |||
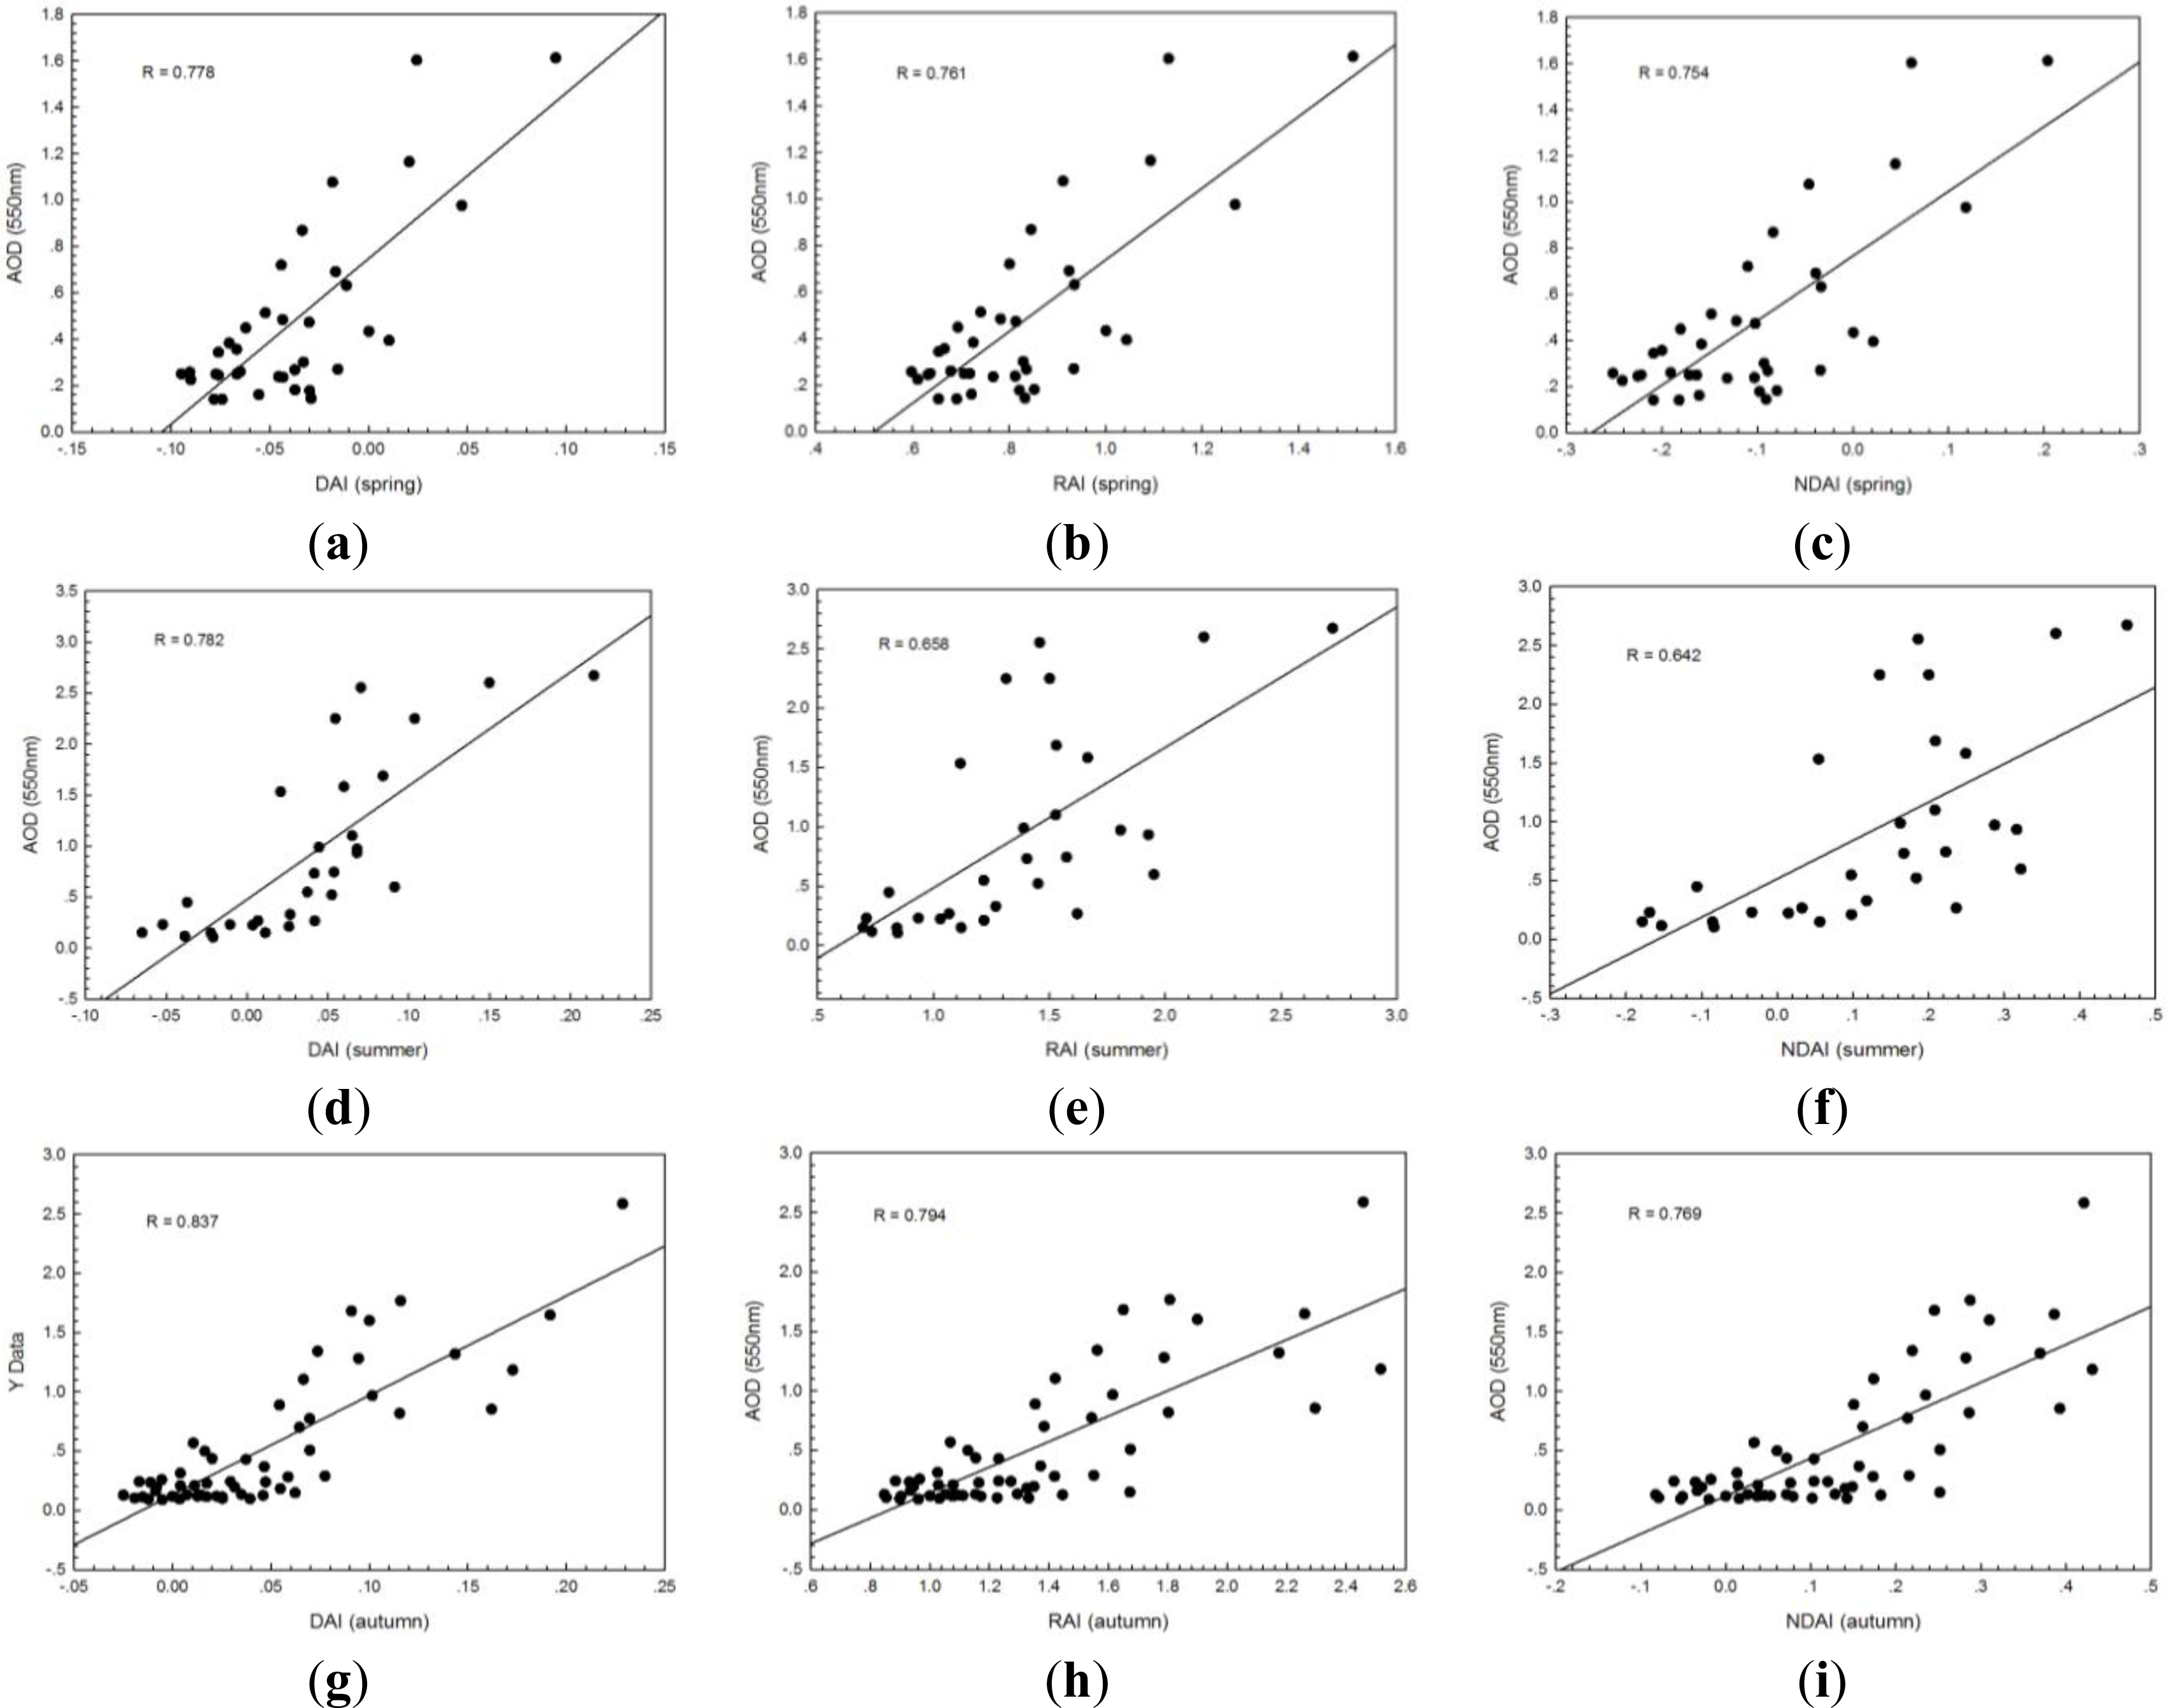
| Xianghe | Spring | DAI | Y = 7.141 × x + 0.748 | 0.778 | 0.606 | 0.000 | 36 |
| RAI | Y = 1.543 × x − 0.804 | 0.761 | 0.580 | 0.000 | |||
| NDAI | Y = 2.801 × x + 0.766 | 0.754 | 0.569 | 0.000 | |||
| Summer | DAI | Y = 11.138 × x + 0.477 | 0.782 | 0.612 | 0.000 | 30 | |
| RAI | Y = 1.184 × x − 0.700 | 0.658 | 0.433 | 0.000 | |||
| NDAI | Y = 3.257 × x + 0.514 | 0.642 | 0.413 | 0.000 | |||
| Autumn | DAI | Y = 8.392 × x + 0.131 | 0.837 | 0.701 | 0.000 | 56 | |
| RAI | Y = 1.072 × x − 0.928 | 0.794 | 0.631 | 0.000 | |||
| NDAI | Y = 3.188 × x + 0.119 | 0.769 | 0.591 | 0.000 | |||
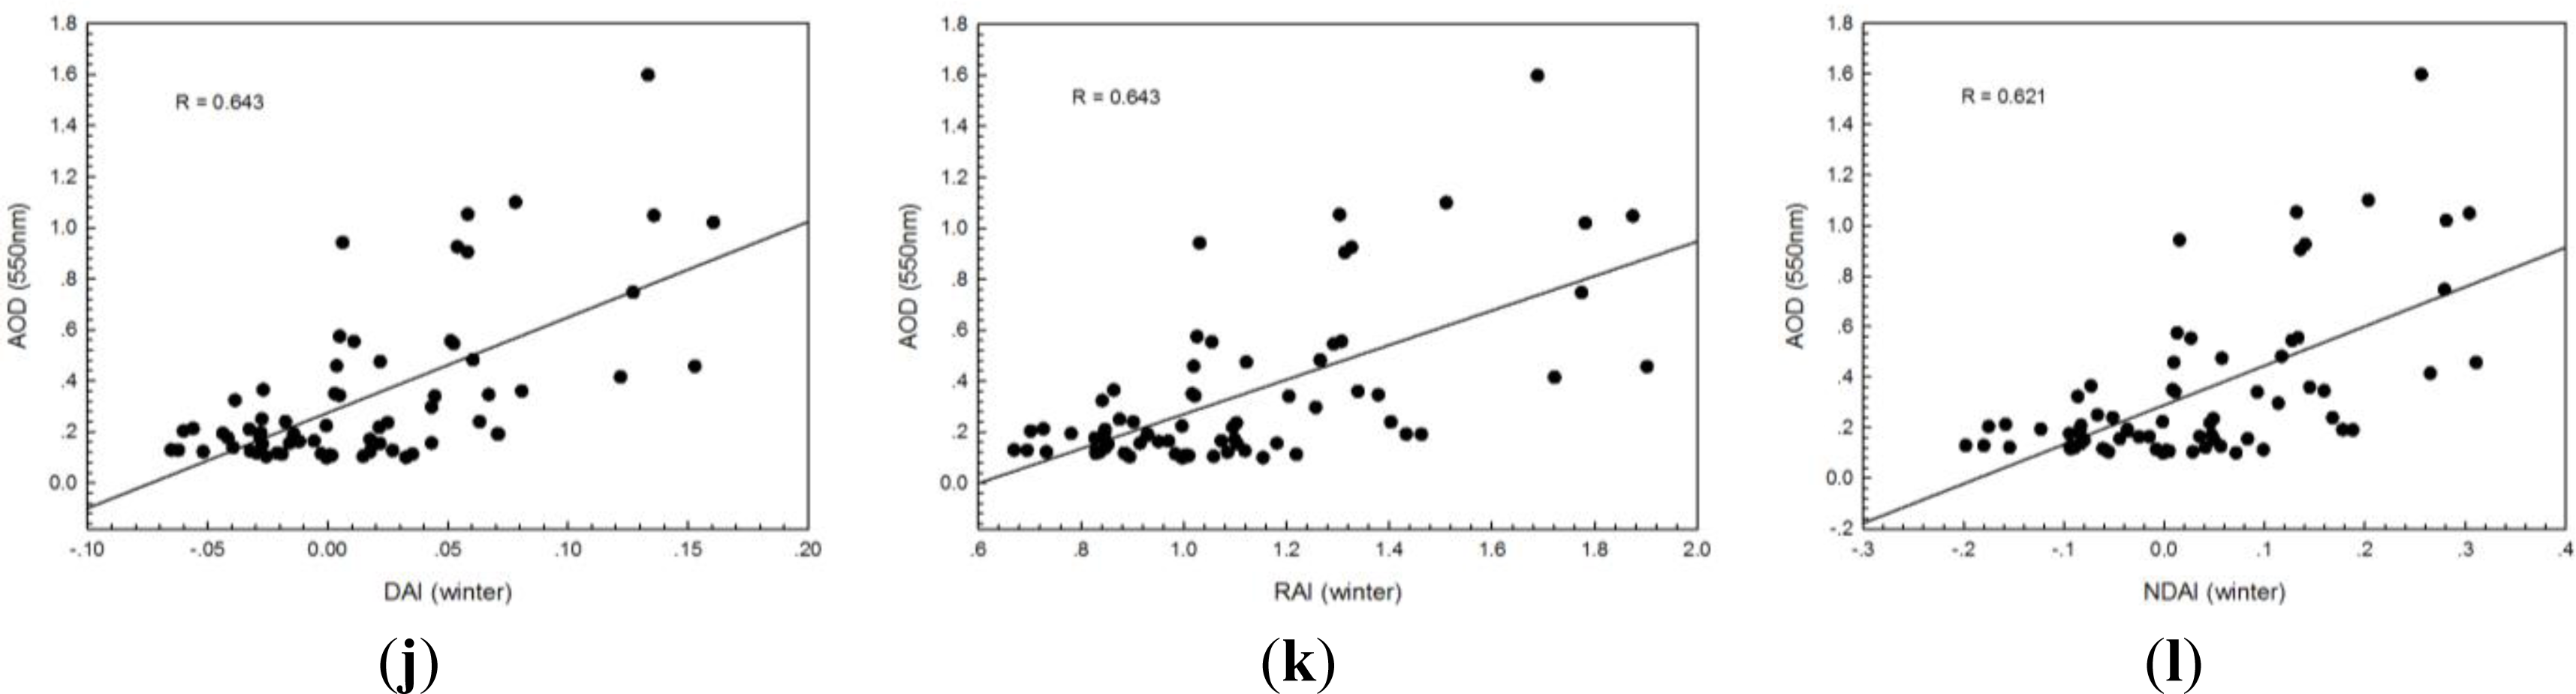
| Winter | DAI | Y = 3.742 × x + 0.275 | 0.643 | 0.413 | 0.000 | 71 | |
| RAI | Y = 0.678 × x − 0.408 | 0.643 | 0.413 | 0.000 | |||
| NDAI | Y = 1.559 × x + 0.290 | 0.621 | 0.385 | 0.000 | |||
© 2014 by the authors; licensee MDPI, Basel, Switzerland This article is an open access article distributed under the terms and conditions of the Creative Commons Attribution license (http://creativecommons.org/licenses/by/3.0/).
Share and Cite
He, J.; Zha, Y.; Zhang, J.; Gao, J. Aerosol Indices Derived from MODIS Data for Indicating Aerosol-Induced Air Pollution. Remote Sens. 2014, 6, 1587-1604. https://doi.org/10.3390/rs6021587
He J, Zha Y, Zhang J, Gao J. Aerosol Indices Derived from MODIS Data for Indicating Aerosol-Induced Air Pollution. Remote Sensing. 2014; 6(2):1587-1604. https://doi.org/10.3390/rs6021587
Chicago/Turabian StyleHe, Junliang, Yong Zha, Jiahua Zhang, and Jay Gao. 2014. "Aerosol Indices Derived from MODIS Data for Indicating Aerosol-Induced Air Pollution" Remote Sensing 6, no. 2: 1587-1604. https://doi.org/10.3390/rs6021587
APA StyleHe, J., Zha, Y., Zhang, J., & Gao, J. (2014). Aerosol Indices Derived from MODIS Data for Indicating Aerosol-Induced Air Pollution. Remote Sensing, 6(2), 1587-1604. https://doi.org/10.3390/rs6021587