Slope Superficial Displacement Monitoring by Small Baseline SAR Interferometry Using Data from L-band ALOS PALSAR and X-band TerraSAR: A Case Study of Hong Kong, China


Abstract
:
1. Introduction
2. Study Site and Geological Setting
3. Available SAR and DEM Data
4. Small Baseline InSAR (SB-InSAR) with 3-D Phase Unwrapping
- (1)
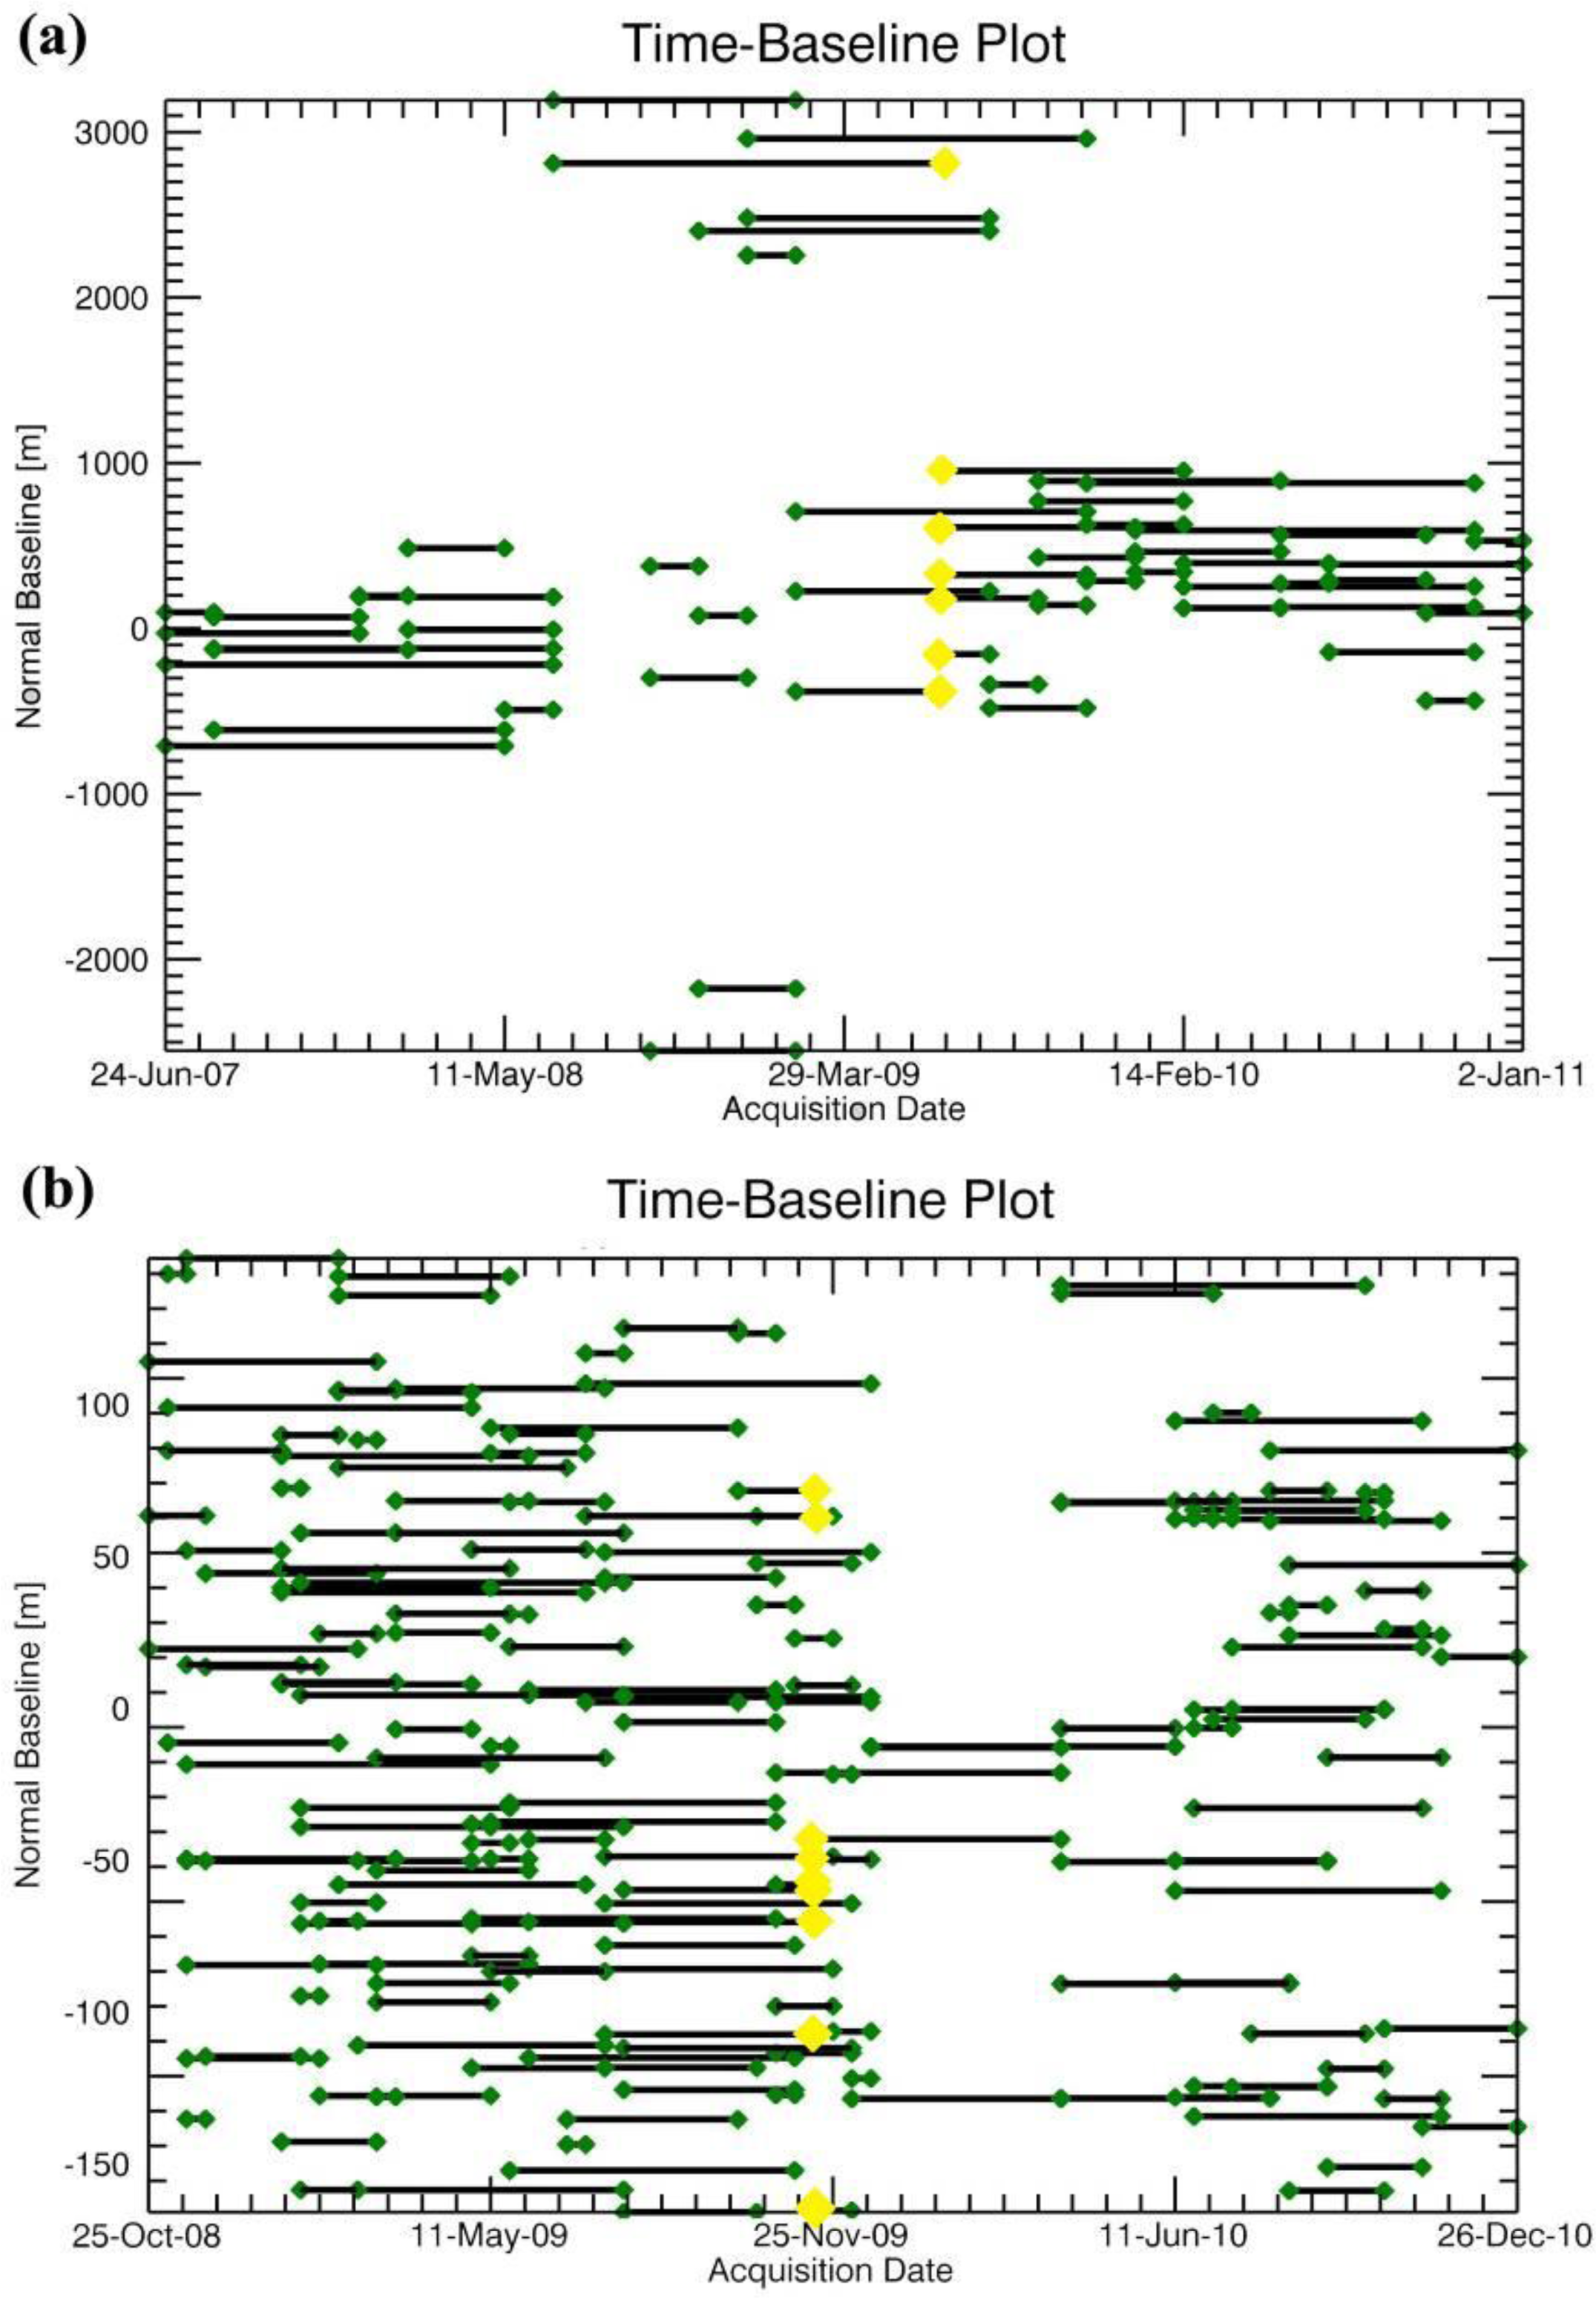
- The generation of M multi-looked, filtered small baseline differential interferograms (after the flat and topographic phase removal). For the ALOS PALSAR data, two thresholds for baselines (smaller than 3,000 m spatially and 368 days temporally) were first applied to generate initial interferograms; then interferograms with perpendicular baselines larger than 1,500 m were kept only if they were needed to guarantee connectivity of the subsets in time. A total of 57 final interferograms (Figure 2a) were generated. For the TerraSAR-X data, a small baseline constraint (less than 150 m spatially and 180 days temporally) was applied to generate 226 initial interferograms; of these 45 low-quality inteferograms were discarded and the remaining 181 were retained (Figure 2b). Therefore, problems of temporal and geometric decorrelation and residual phase due to uncompensated topography were mitigated. Such a baseline constraint leads to several independent interferogram subsets, and thus SB-InSAR is also termed within the scientific community as small baseline subsets (SBAS).
- (2)
- Absolute phase estimation by means of interferogram unwrapping. Phase unwrapping is a crucial step for the successful implementation of SB-InSAR. In general, the 2-D spatial phase unwrapping is a traditional way, whether for an entire interferogram or for sparse point-targets on an interferogram [40]. Recent advances have focused on algorithms that incorporate both the temporal and spatial dimensions, so-called 3-D phase unwrapping [41–43]. Considering the redundant network of interferograms in time, the Delauney-based 3-D phase unwrapping method [44] was applied; phase unwrapping in the spatial domain was constrained through the consistency of the network in time (see Figure 3). Note that two original TerraSAR images acquired in 13 May 2008 and 18 September 2010 were discarded during interferogram formation because of the applied spatial baseline constraint of 150 m.
- (3)
- A set of coherent pixels (CPs, dominated by DSs) in M interferograms was selected as characterized by a high coherence in the majority of total interferograms. The surface deformation time series of the selected CPs can be retrieved by singular value decomposition (SVD) as long as those subsets overlapped in time. The first step of SB-InSAR was the estimation of low-pass displacement and residual height using a preferred cubic displacement model. Then the second step was concentrated on the displacement time series retrieval and atmospheric artifact isolation. For more details, interested readers can refer to Berardino et al. [16].
5. Results and Interpretation
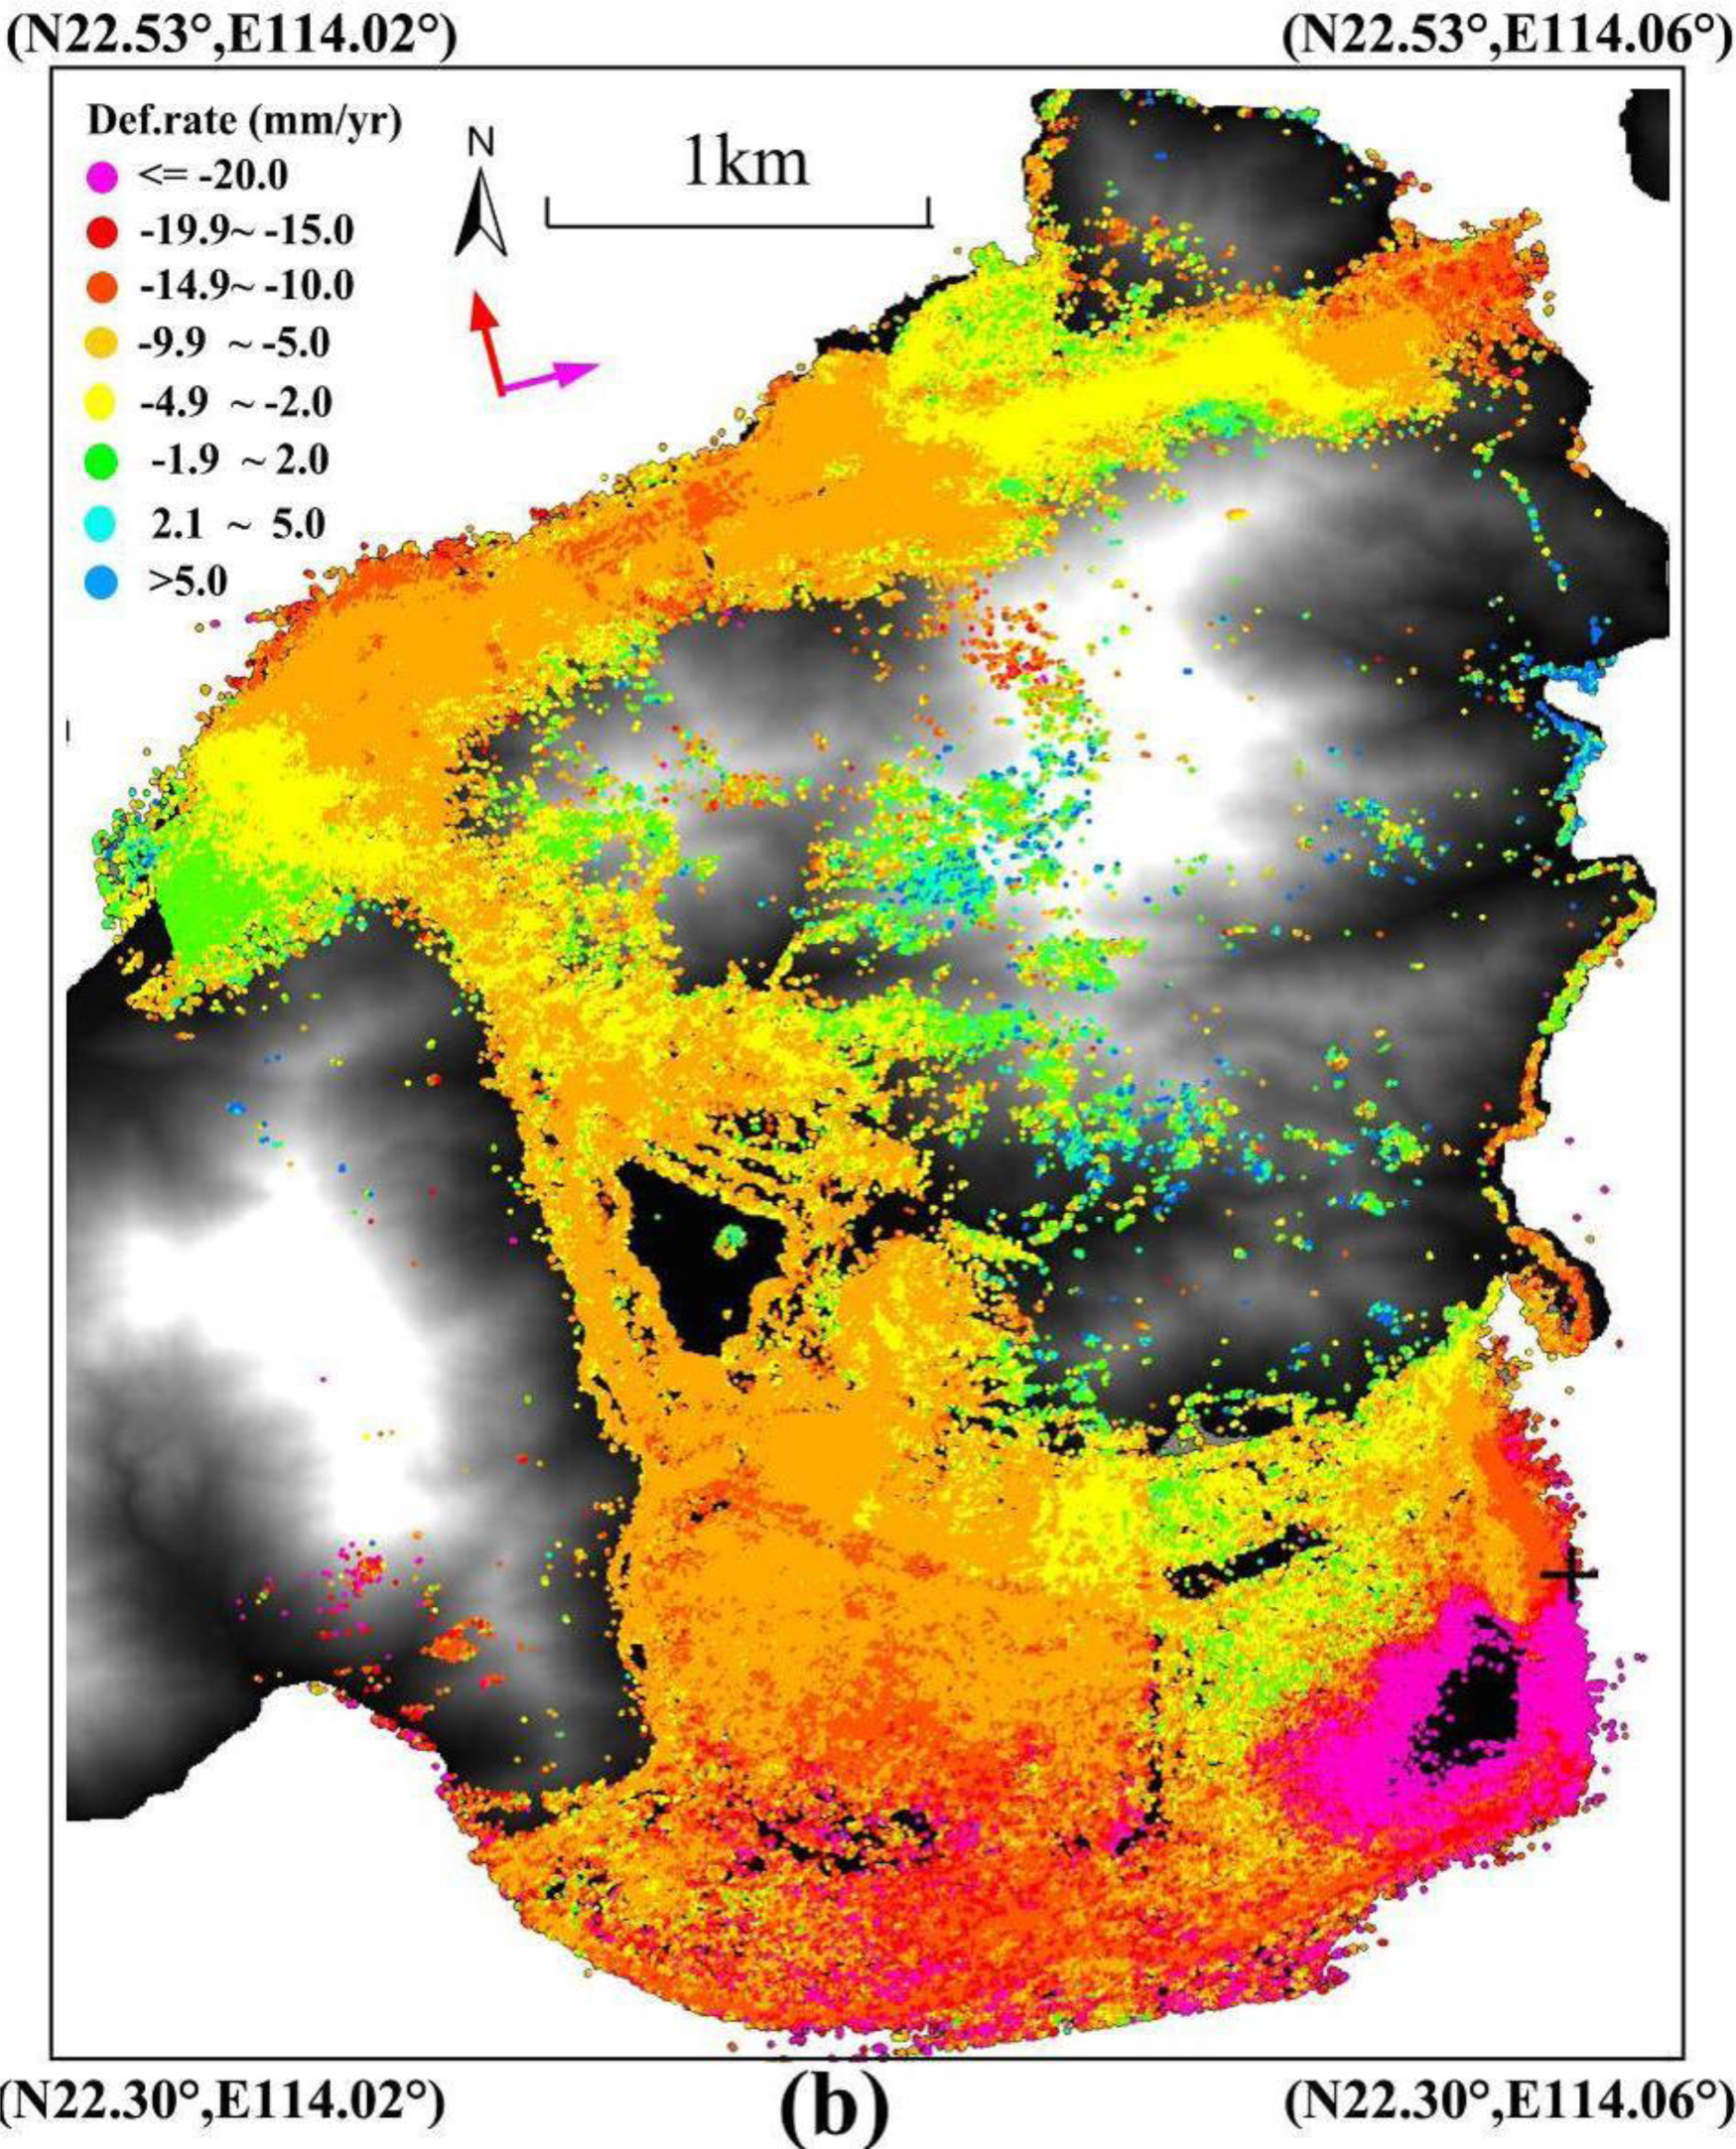
5.1. ALOS PALSAR
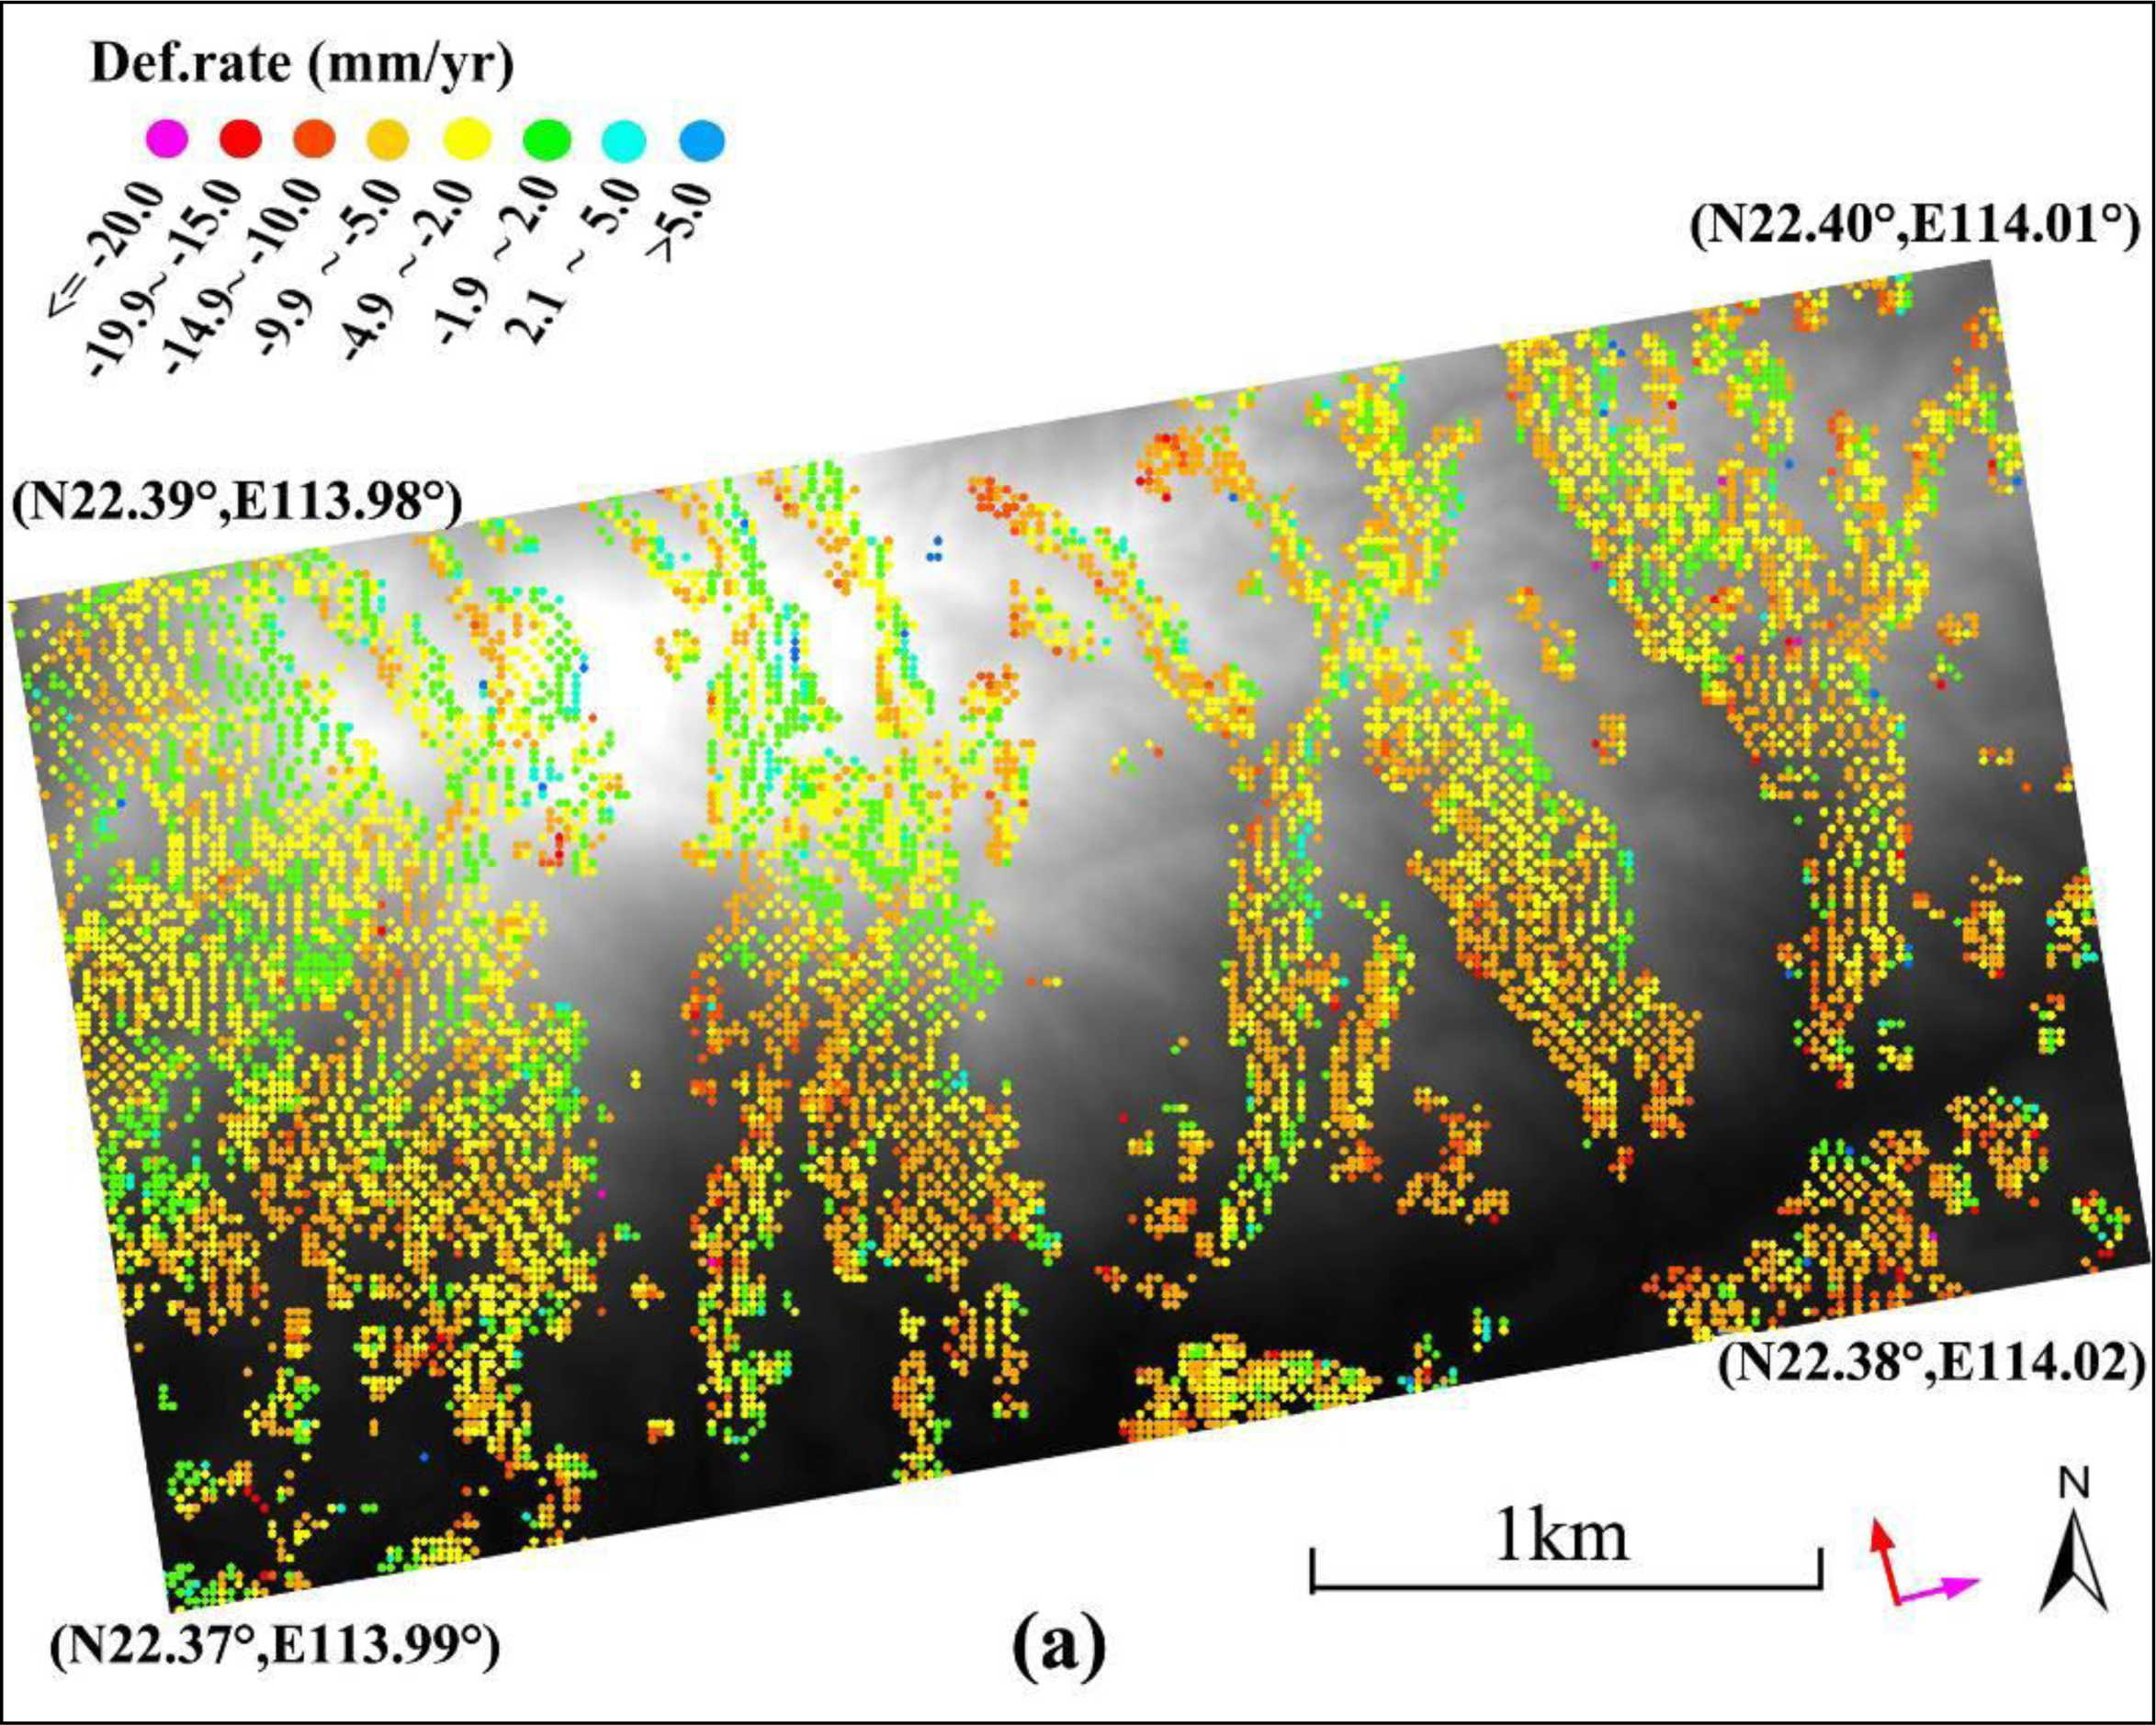
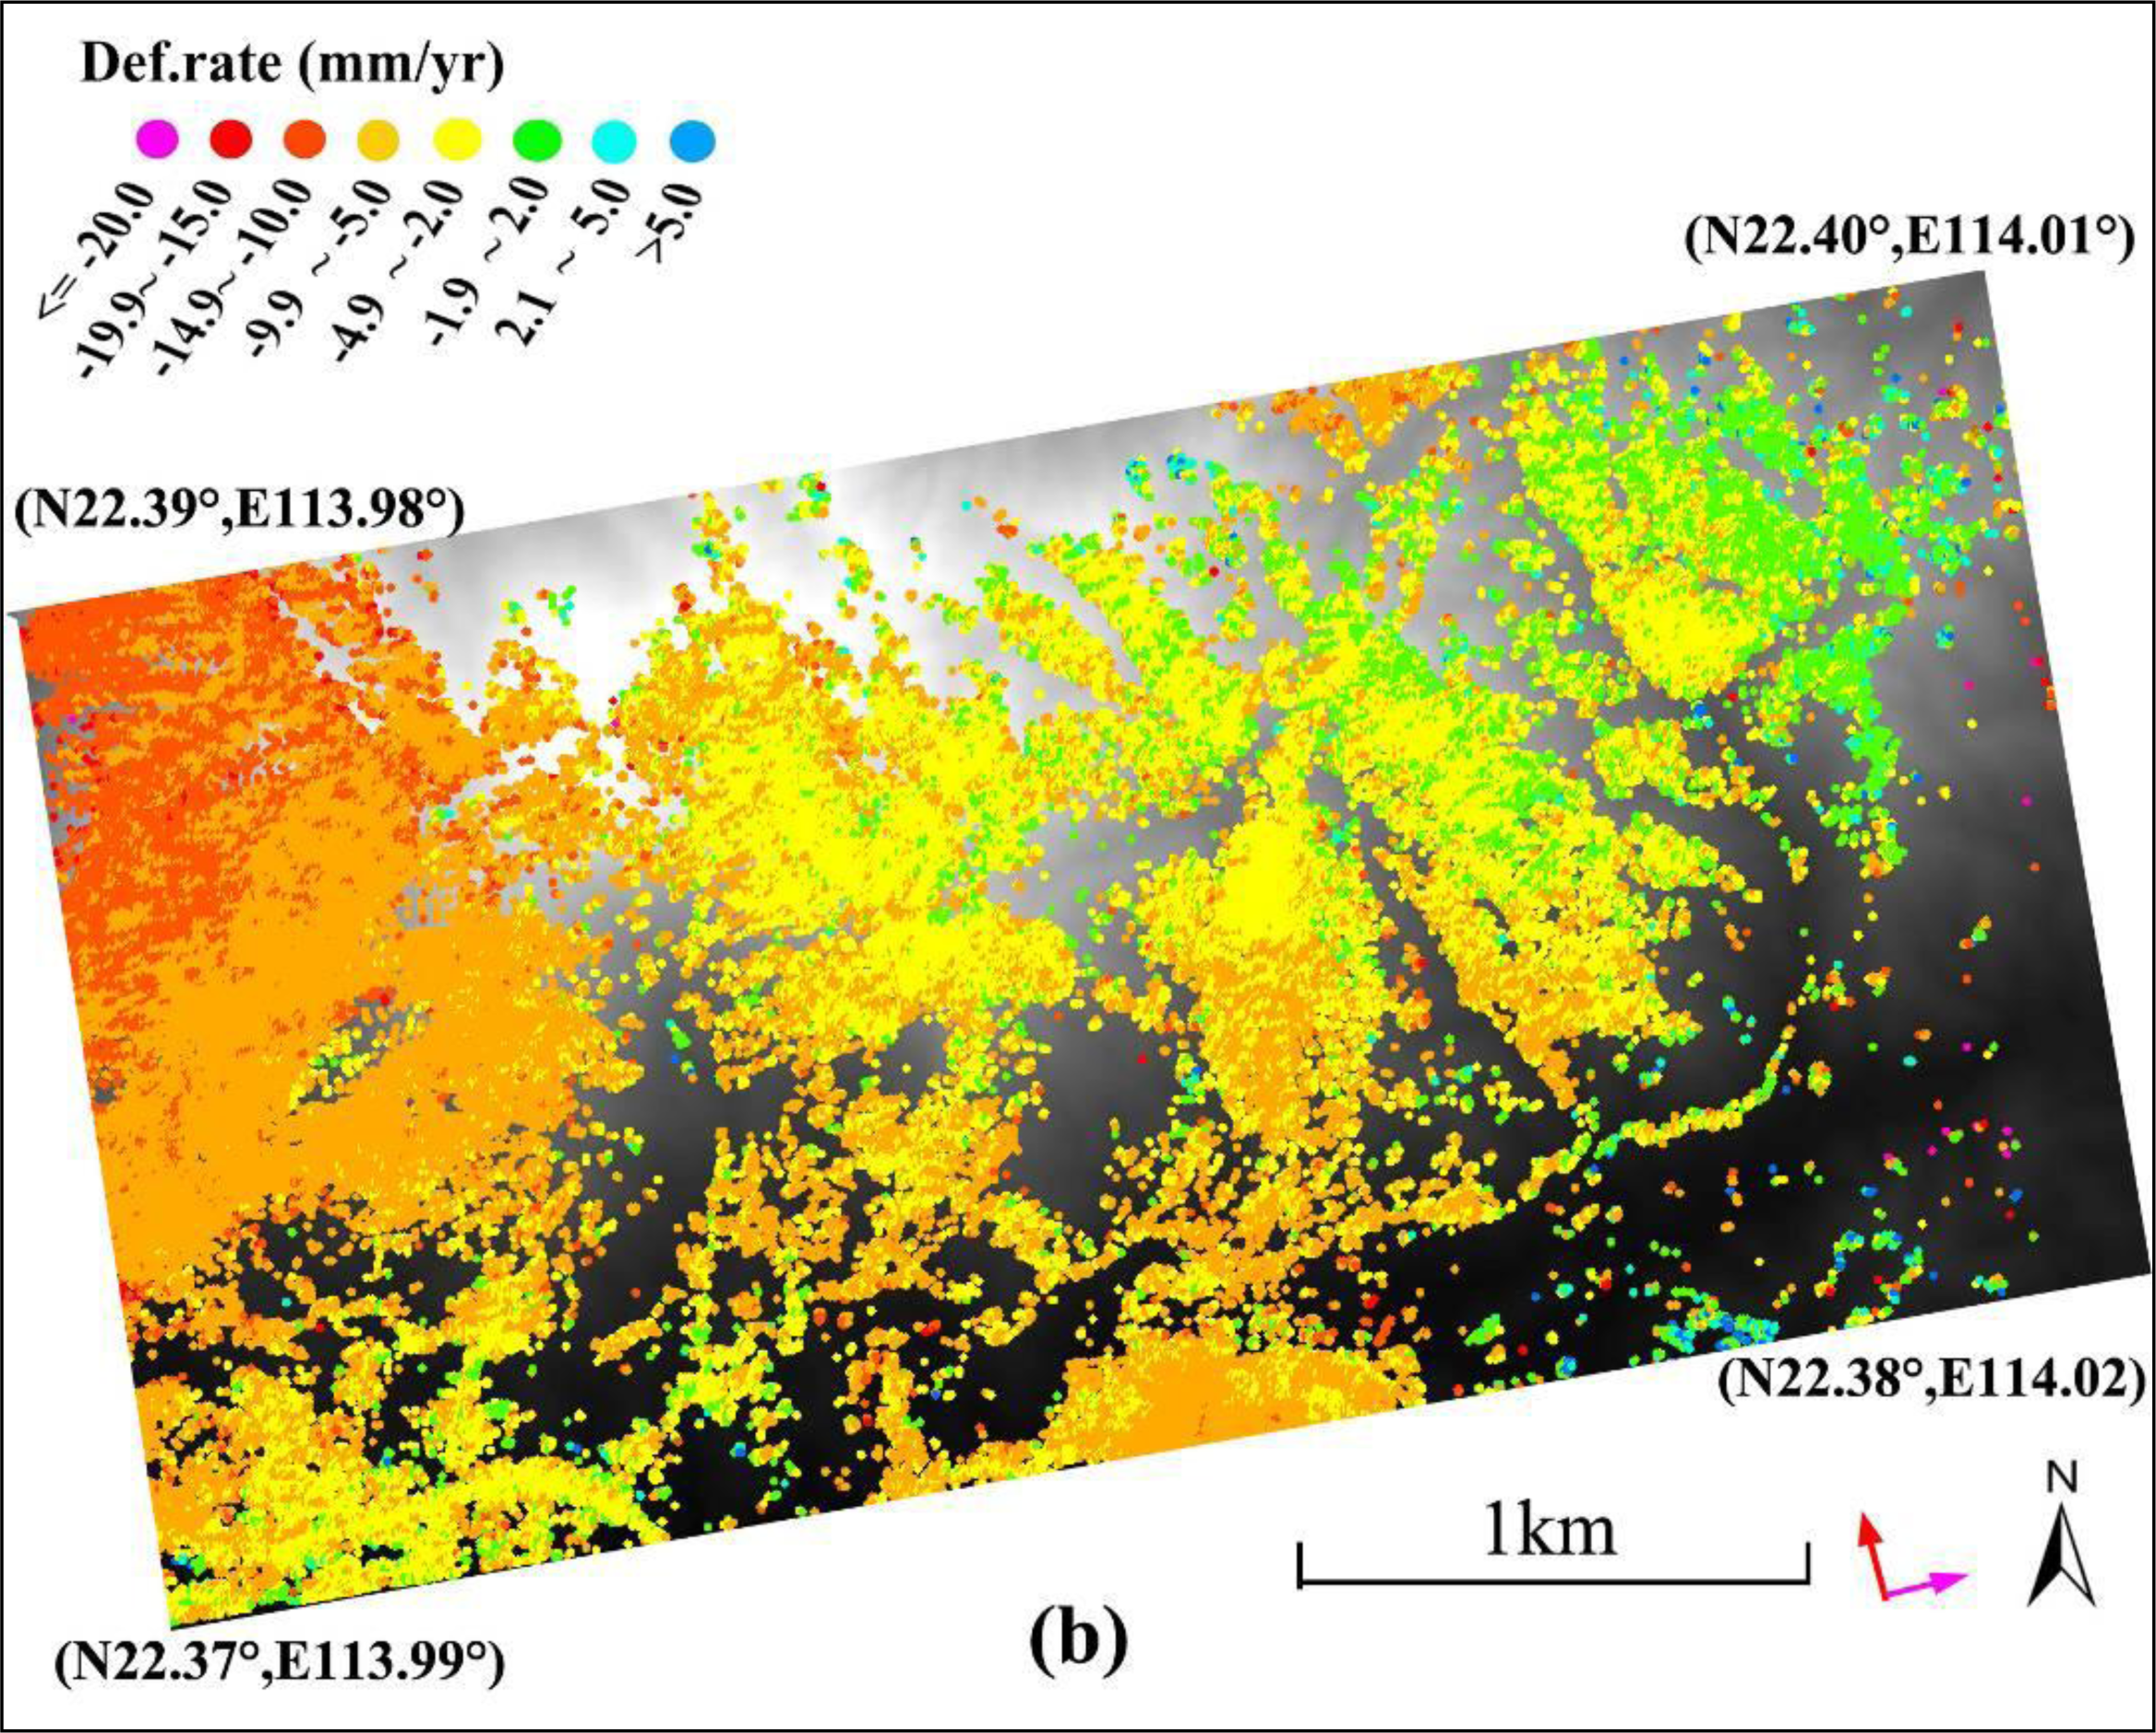
5.2. TerraSAR
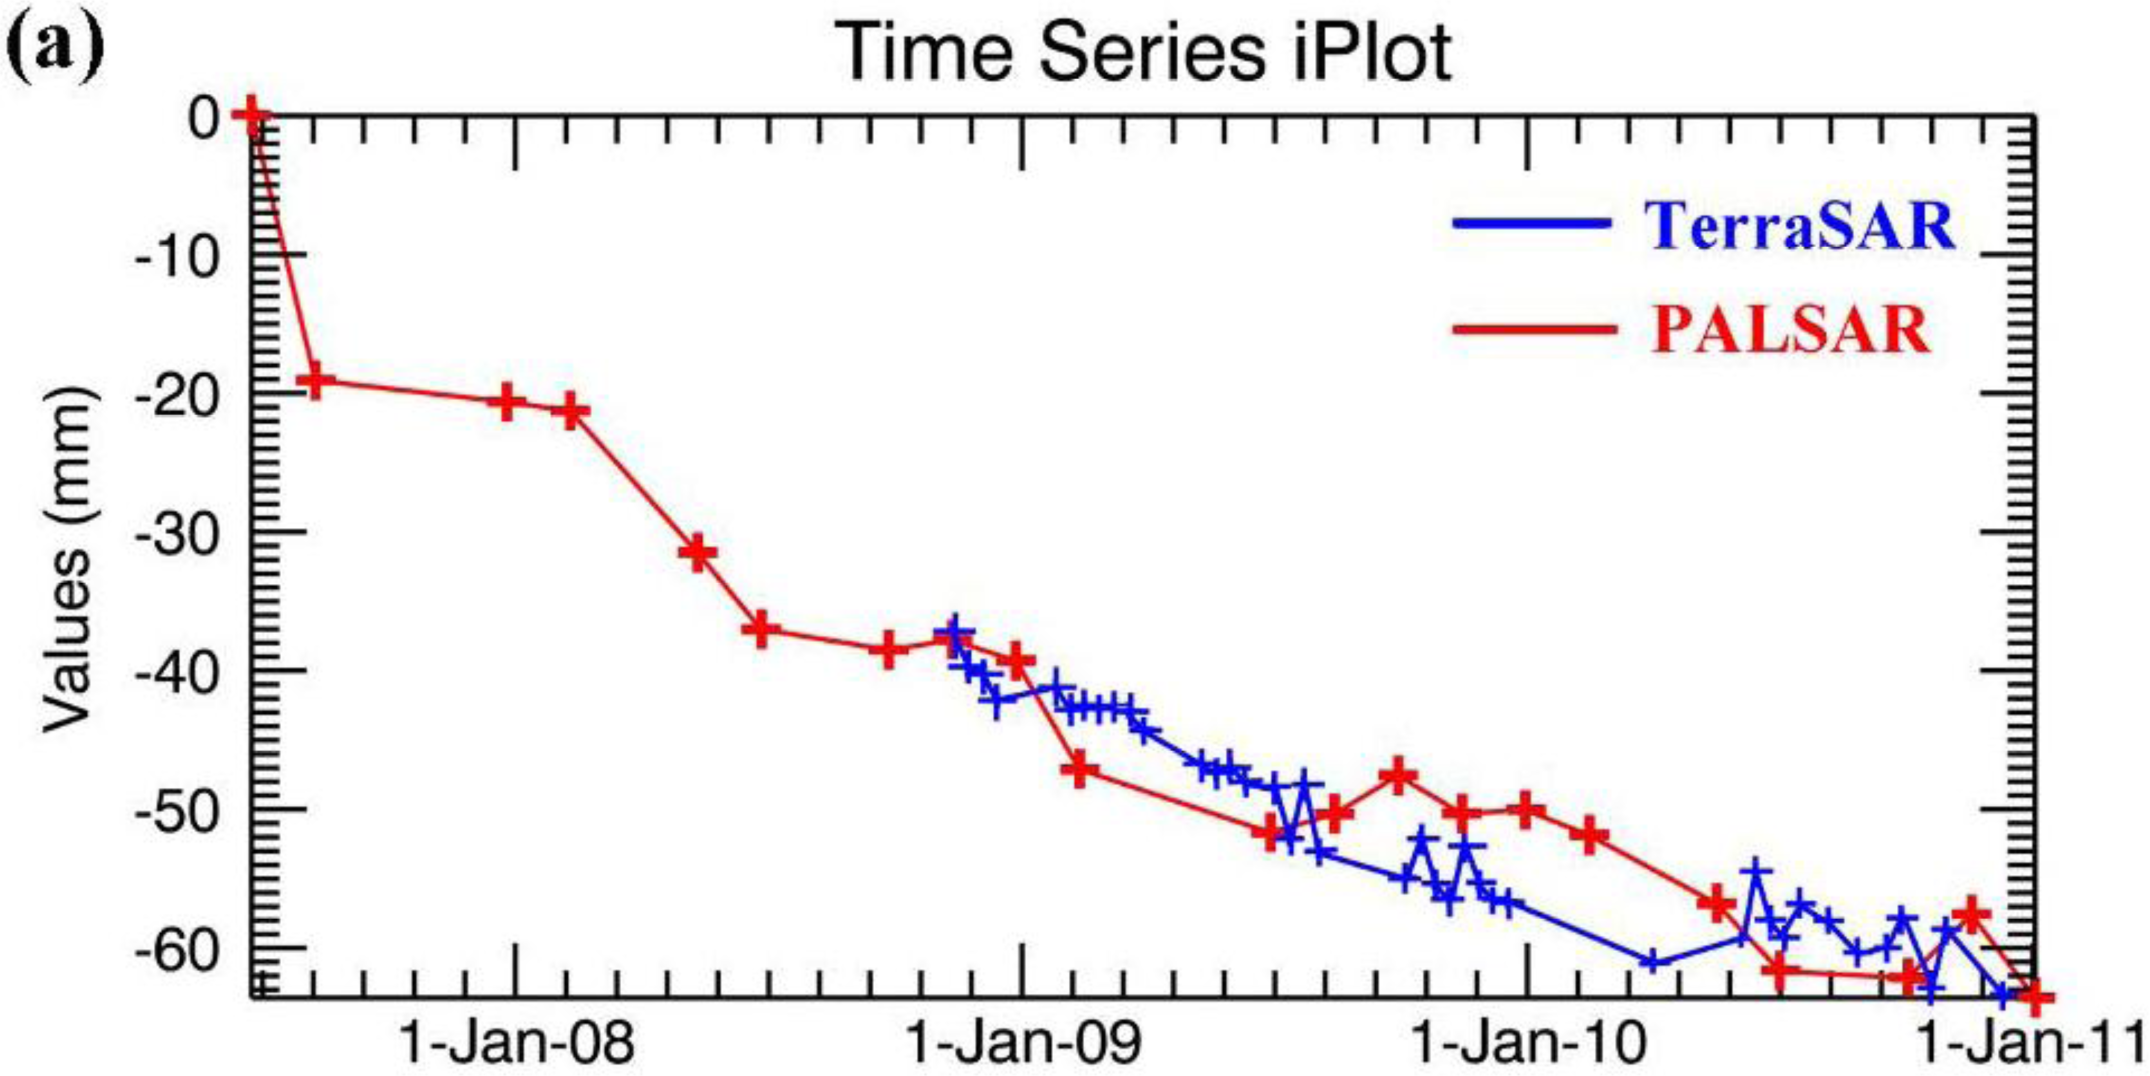
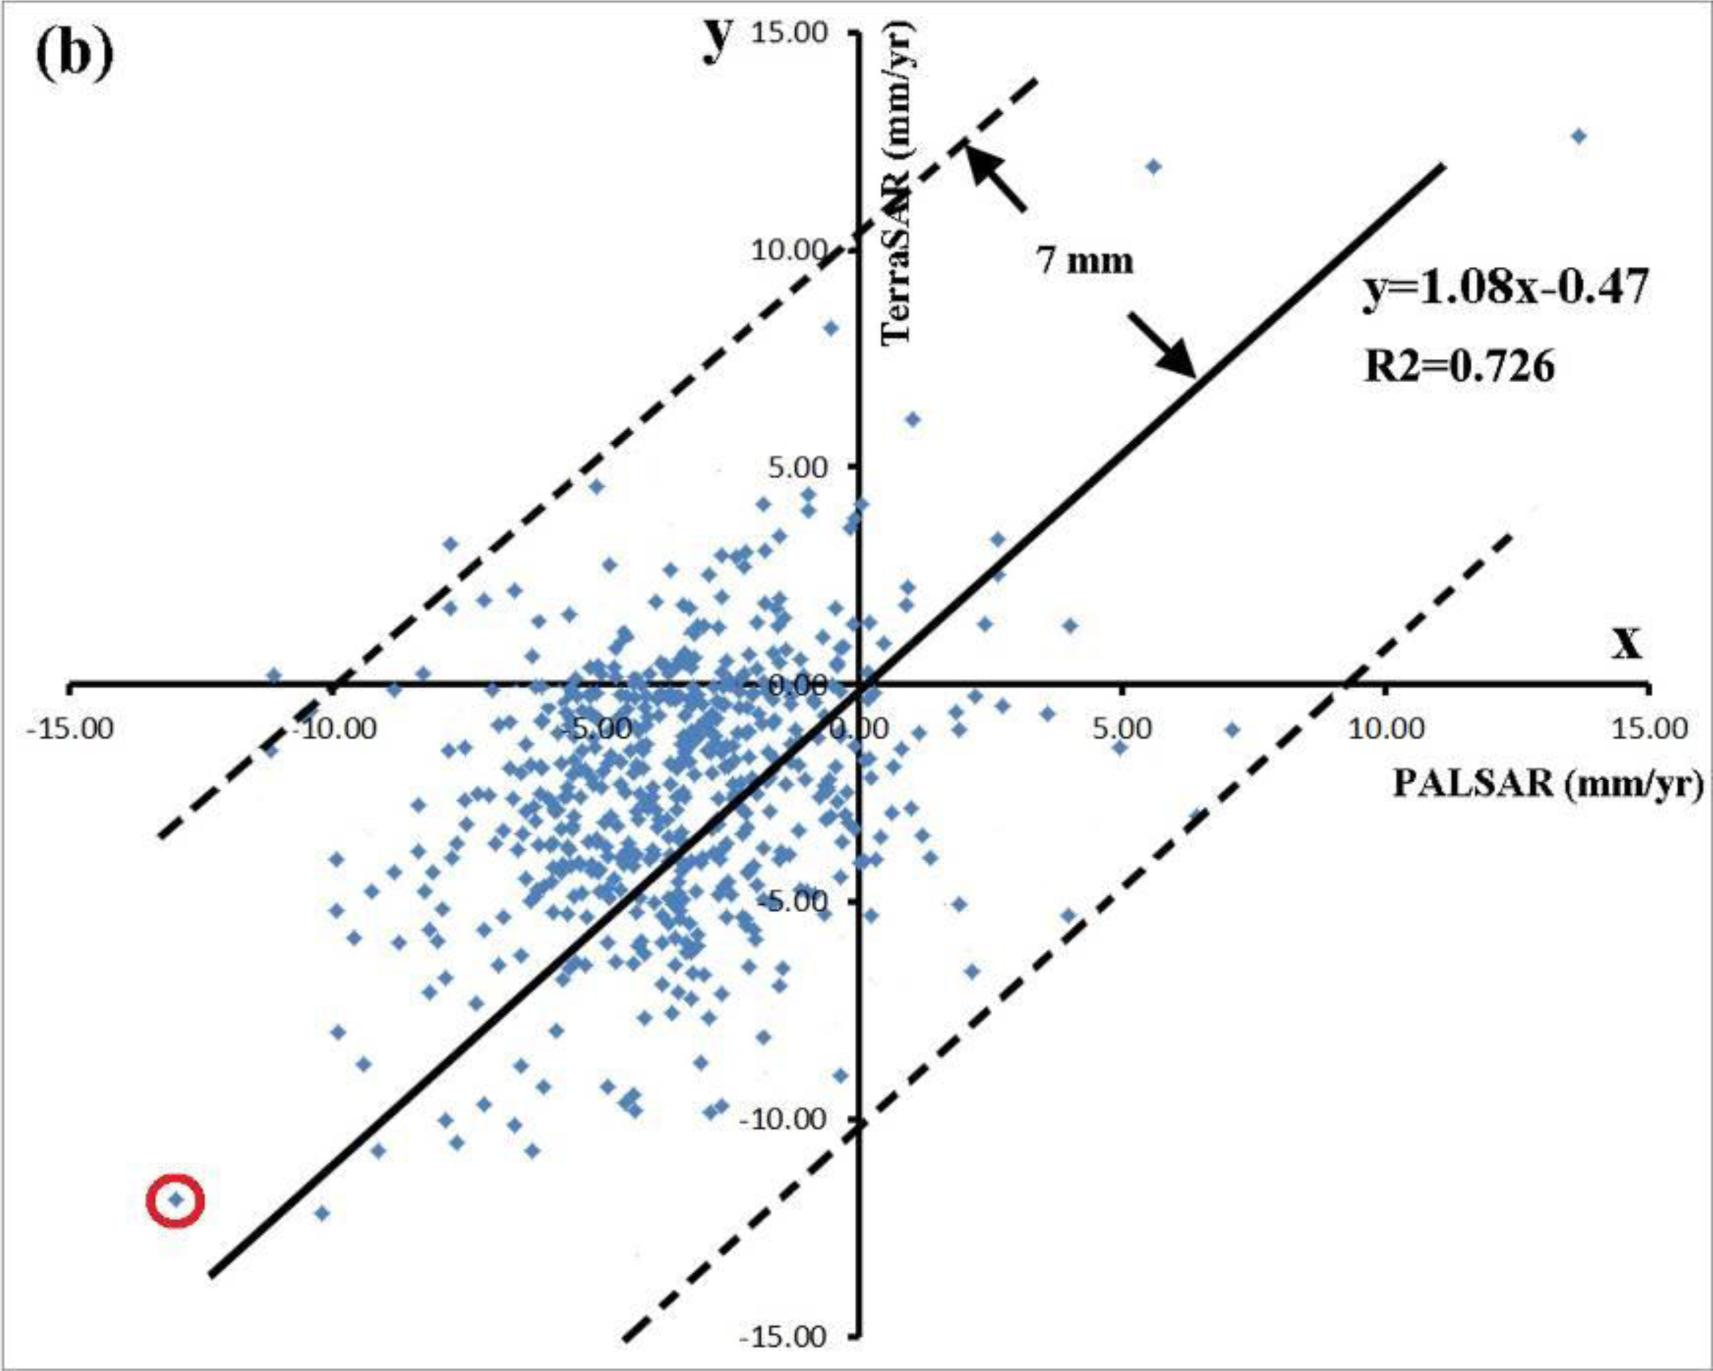
5.3. Cross Comparison and Interpretation
6. Effects of Slope Consolidation in the Lantau Island
7. Conclusions
- (1)
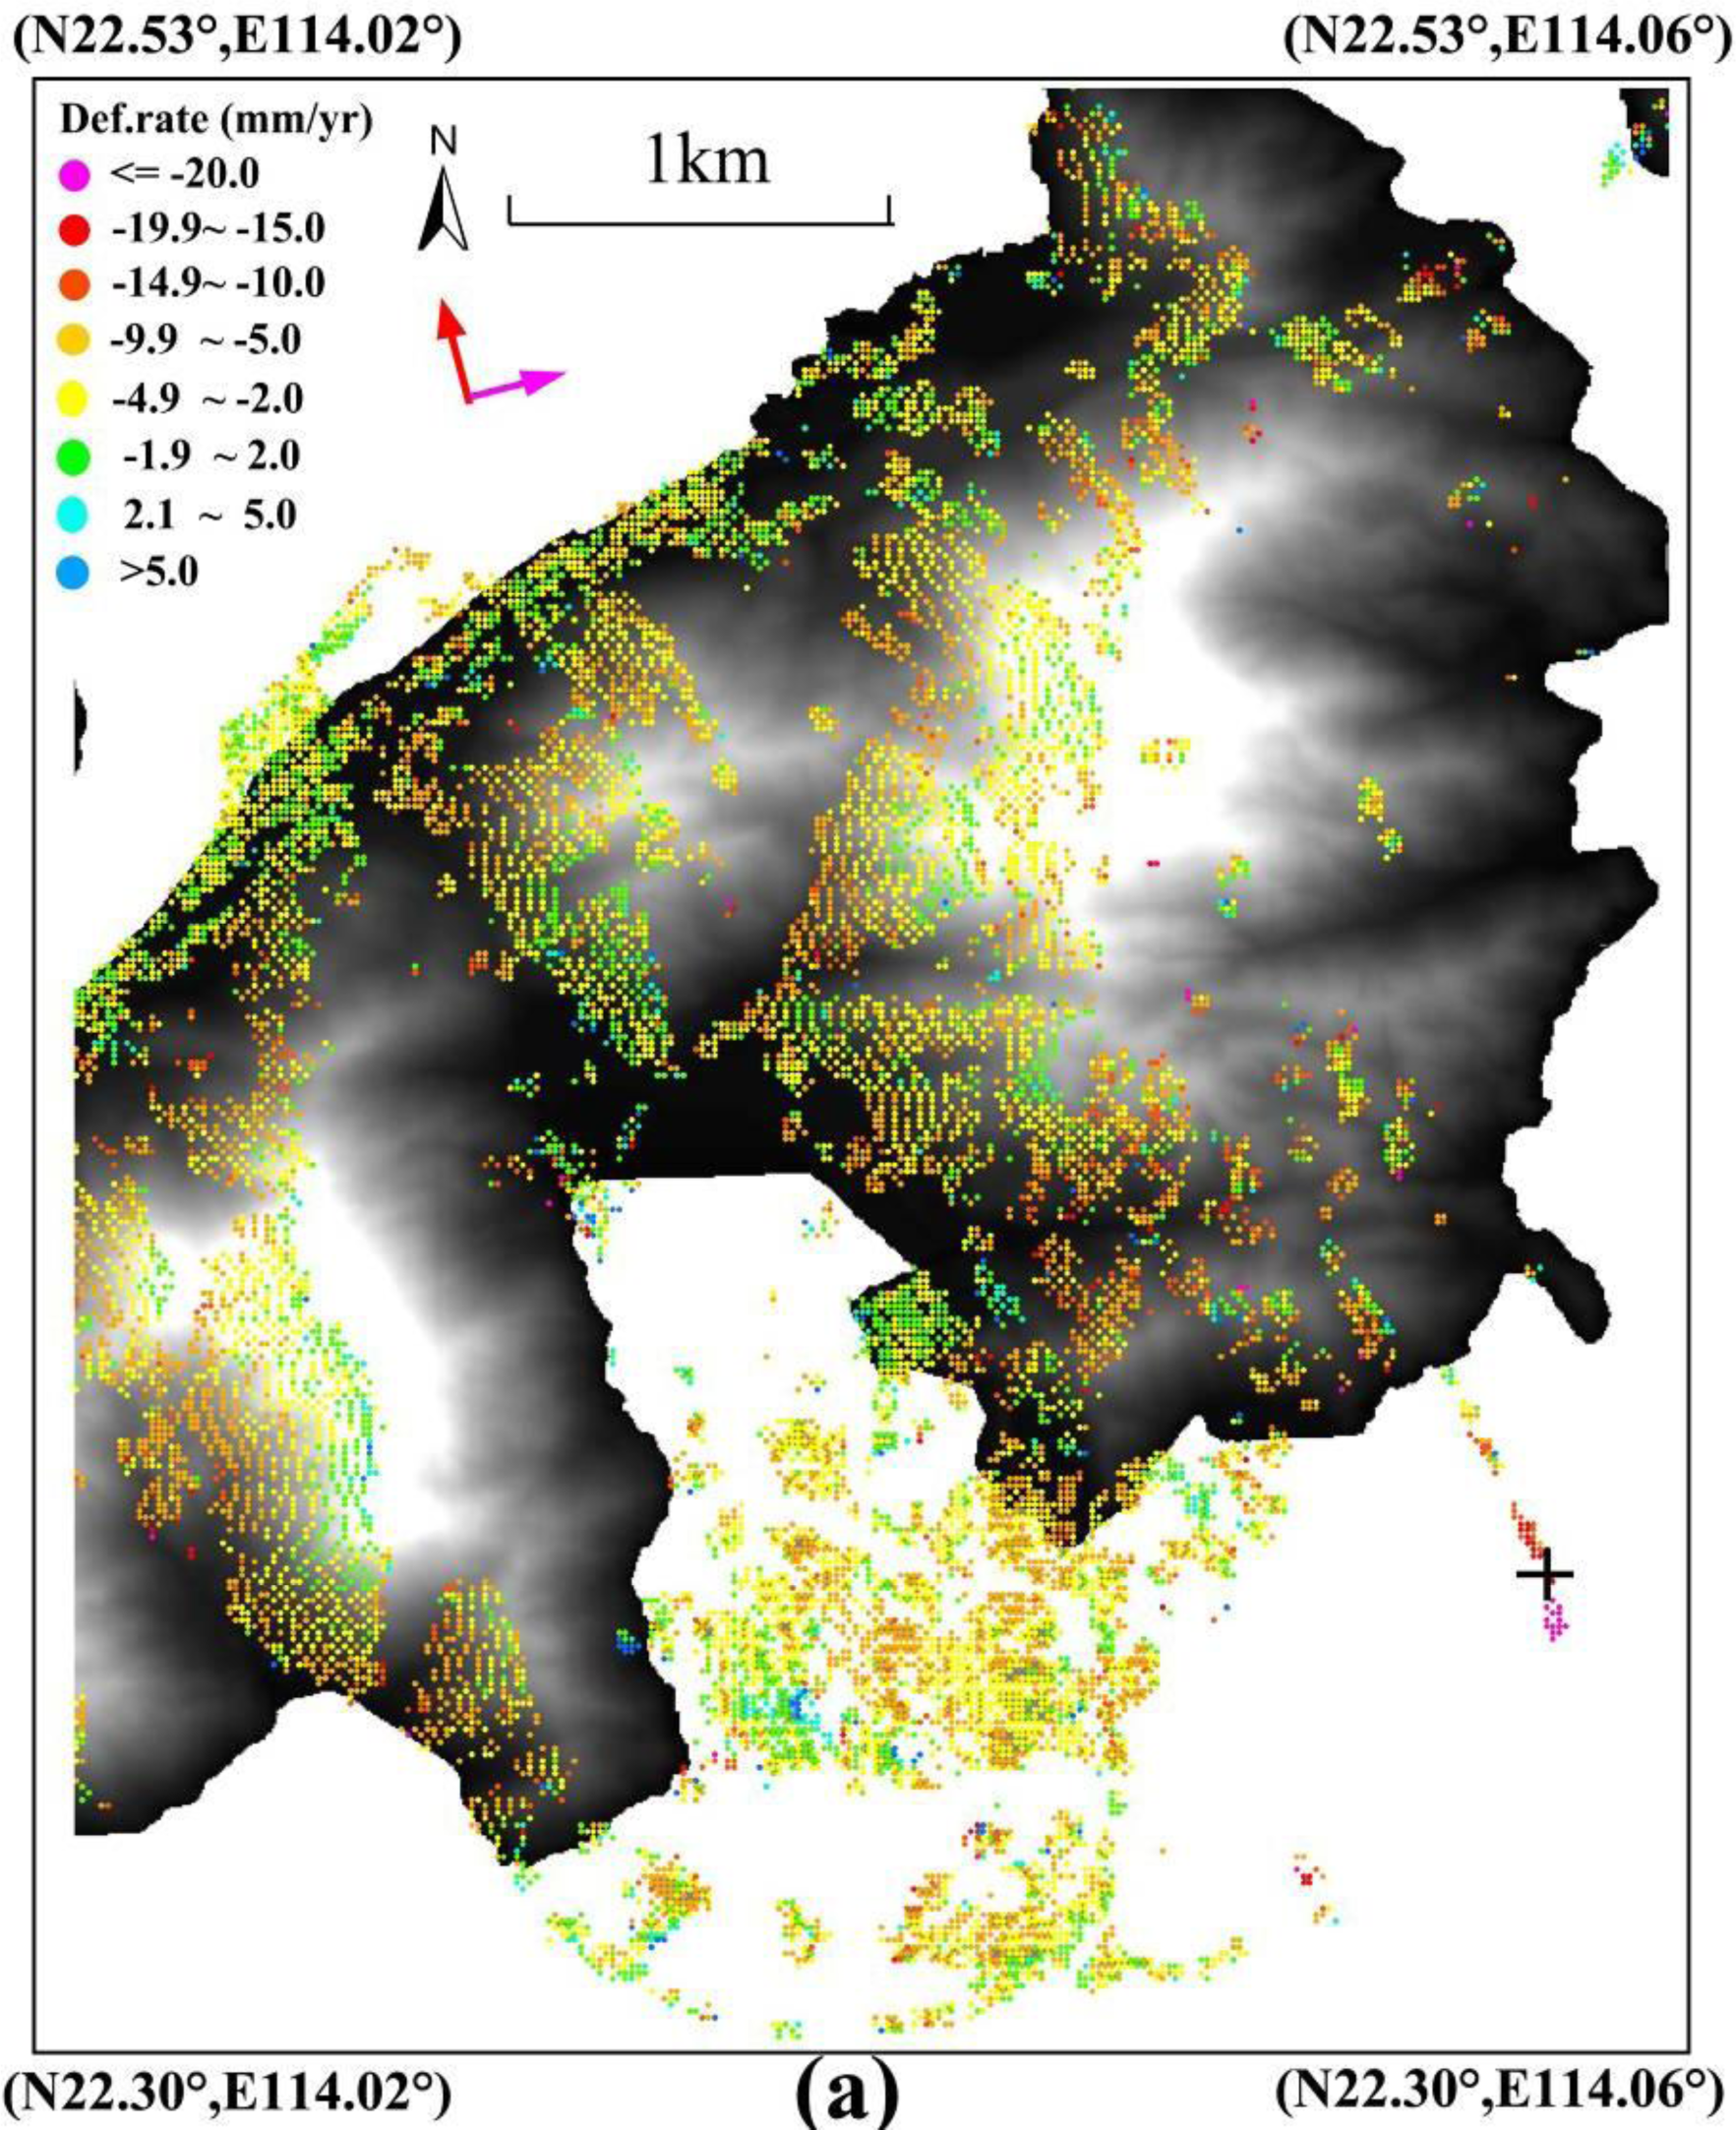
- Rapid urban development in hilly terrain, coupled with tropical rainy storms and weathered covering rocks, has led to the frequent occurrence of disastrous landslides in Hong Kong. Most of those failures are minor and shallow in depth with a volume of usually less than 50 m3 [37] and occurred in vegetated region. Although challenging, the synergistic analysis of L-band PALSAR and X-band TerraSAR provides a feasible solution for taking advantage of high resolution, frequent revisit times as well as long wavelength for the monitoring of superficial displacement of ES and VS slopes. The experimental results imply that SB-InSAR is potential for unstable slope surveillance due to the introduction of 3-D phase unwrapping coupled with the occurrence of DSs in the natural scenario of Hong Kong, e.g., 376 CPs/km2 of L-band PALSAR covering the whole Hong Kong area, 12,656 and 8,487 CPs/km2 of X-band TerraSAR in the Disneyland and Tai Lam sub-regions, respectively.
- (2)
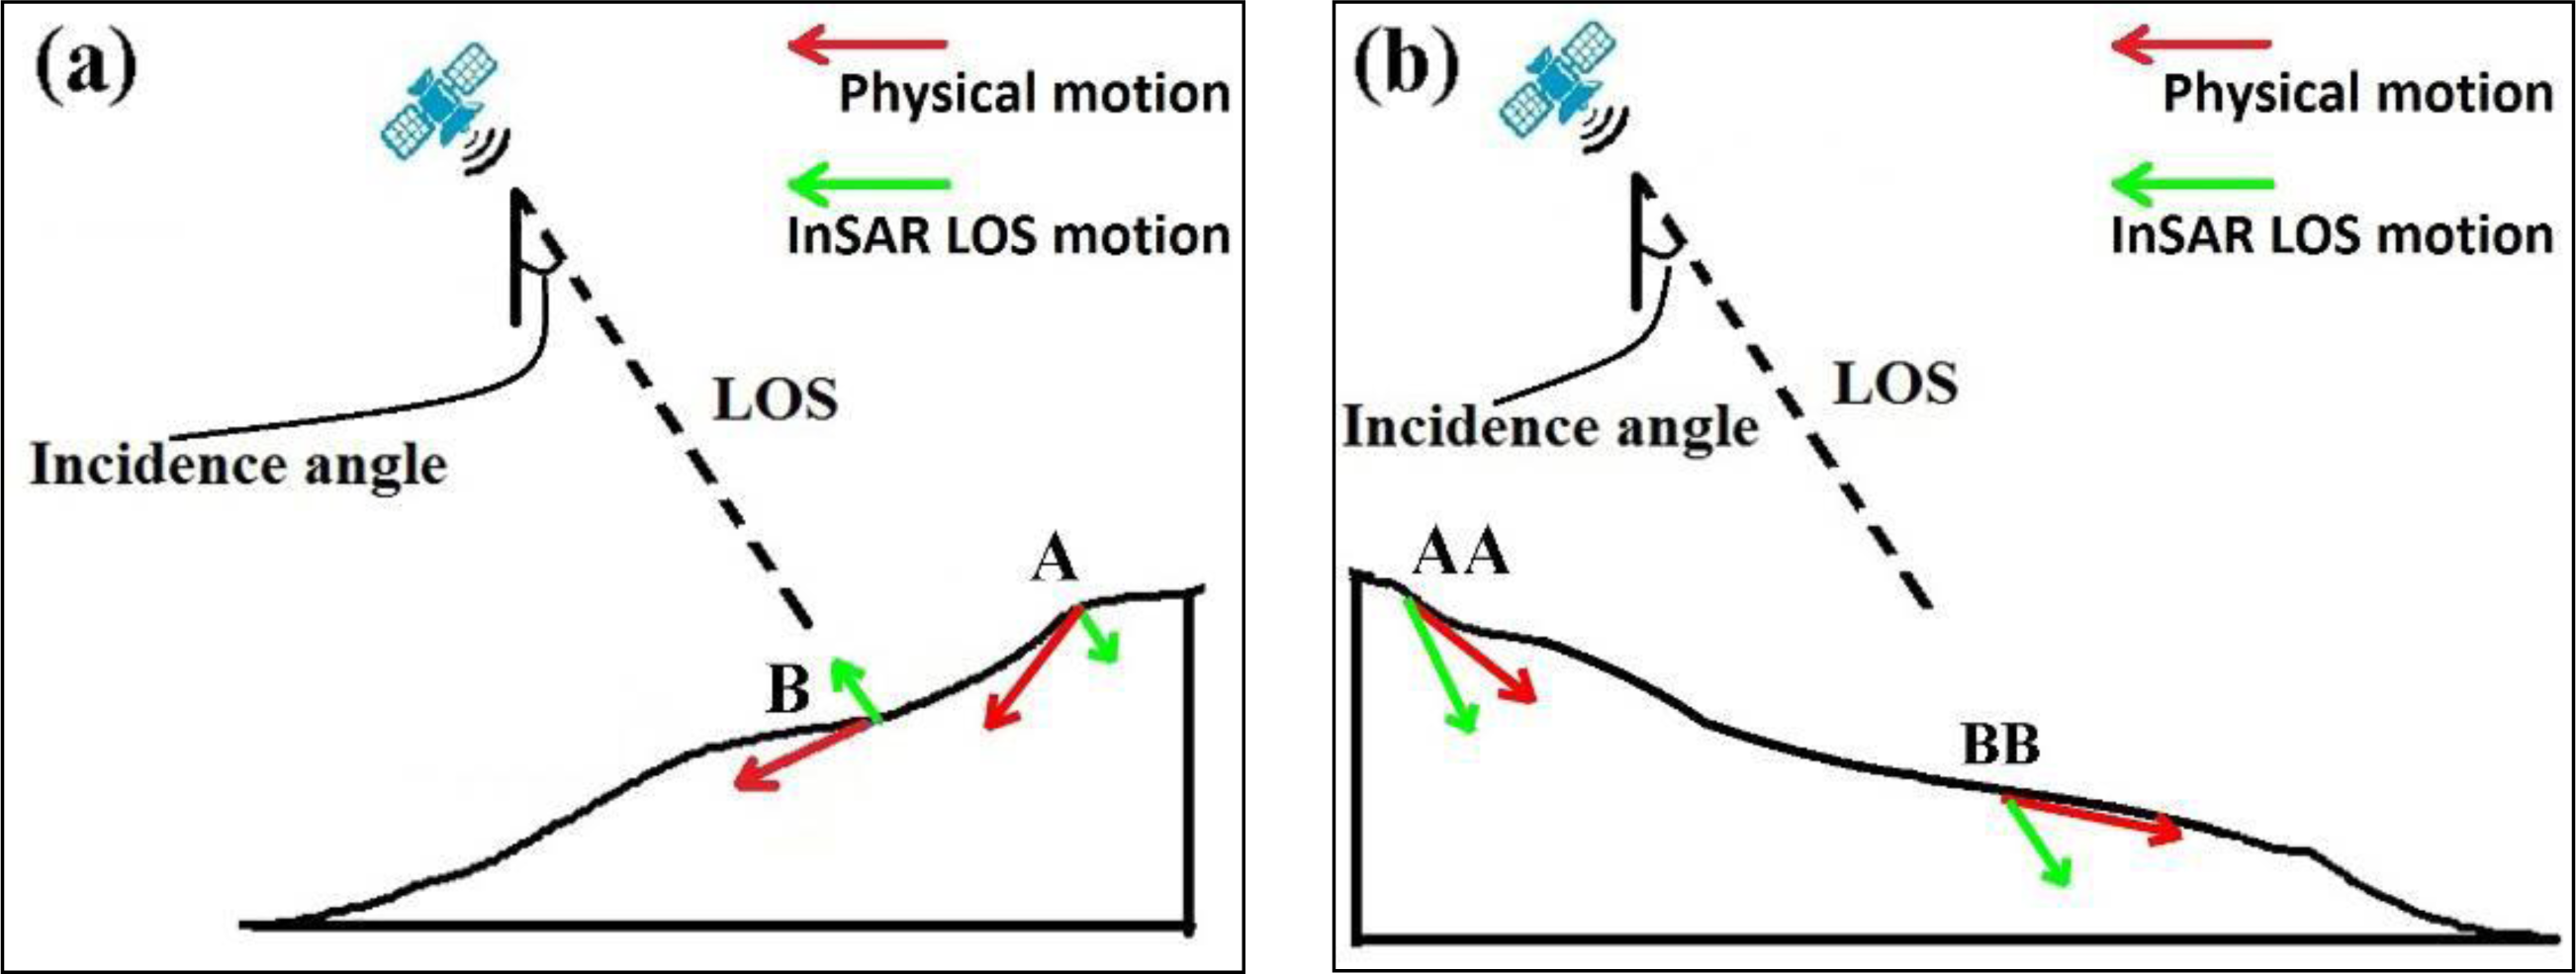
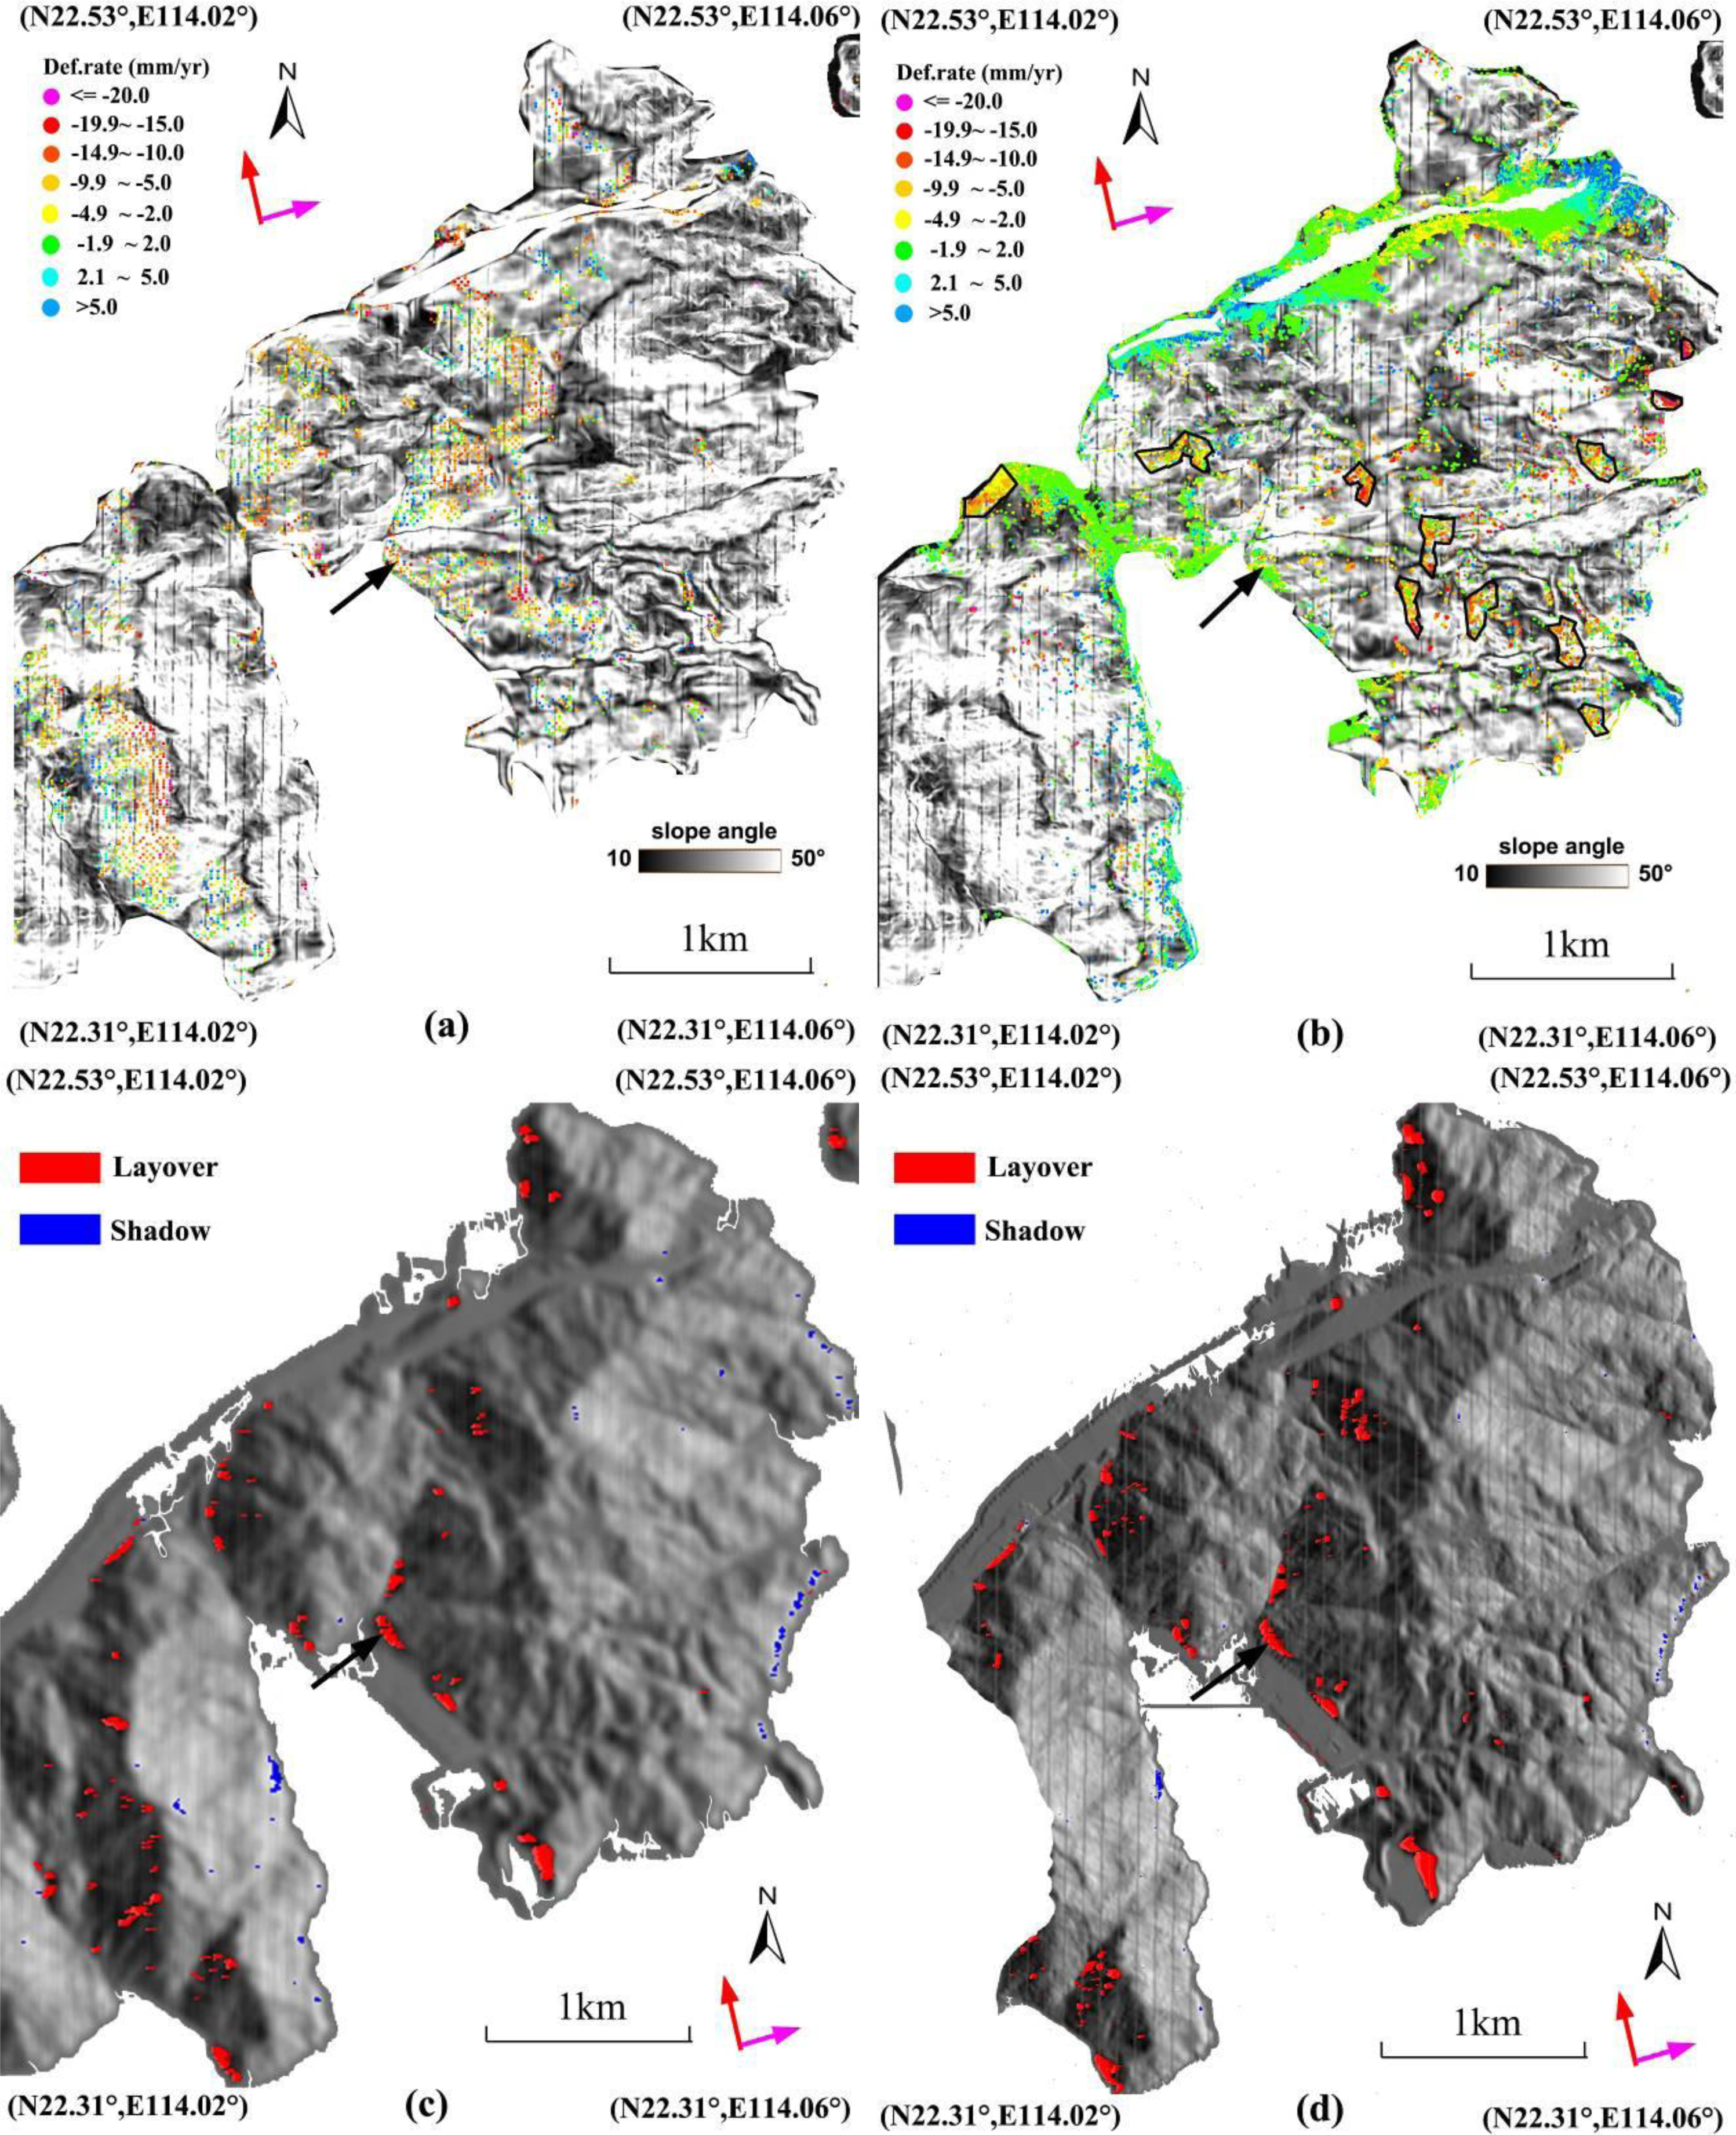
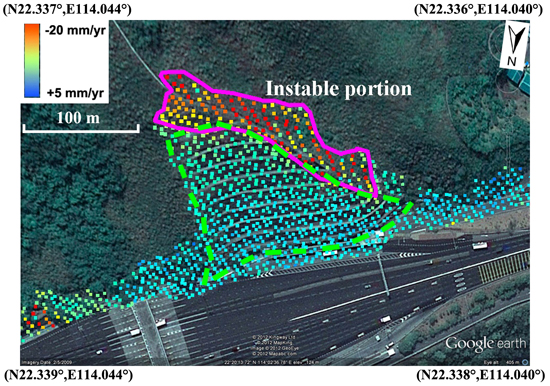
- In case of monitoring superficial displacement of slopes, application of currently available spaceborne SAR systems are feasible (approximately 90% landslides occurred in areas with gradients less than 60°) in Hong Kong owing to the wide incidence coverage (20°–60°), minimizing the occurrence of layovers and shadows. The phenomena of slope superficial movements are exploited by the SB-InSAR technique applied in this study. A quantitative comparison between L- and X-band dataset was undertaken. The results demonstrated that: X-band TerraSAR is more seriously affected by the vegetation (only 10% of CPs extracted in sparse vegetated regions) in comparison to an almost even spatial distribution of CPs of L-band PALSAR over the same observed scenario. Second, X-band TerraSAR is more capable of identifying unstable slopes (see Figures 9 and 10) owing to the higher sensitivity to movements as well as spatial resolution. Consequently, we suggest that the two different spaceborne SAR data need to be integrated for the improvement in the performance of monitoring unstable slope movements.
Acknowledgments
Author Contributions
Conflicts of Interest
References
- Cruden, D.M.; Varnes, D.J. Special Report 247. Landslide Types and Processes. In Landslides: Investigation and Mitigation; Turner, A.K., Schuster, R.L., Eds.; National Academy Press: Washington, DC, USA, 1996; pp. 36–75. [Google Scholar]
- Guzzetti, F.; Mondini, A.C.; Cardinali, M.; Fiorucci, F.; Santangelo, M.; Chang, K.-T. Landslide inventory maps: New tools for an old problem. Earth Sci. Rev 2012, 112, 42–66. [Google Scholar]
- Westen, C.J.; Castellanos, E.; Kuriakose, S. Spatial data for landslide susceptibility, hazard, and vulnerability assessment: An overview. Eng. Geol 2008, 102, 112–131. [Google Scholar]
- Strozzi, T.; Ambrosi, C.; Raetzo, H. Interpretation of aerial photographs and satellite SAR interferometry for the inventory of landslides. Remote Sens 2013, 5, 2554–2570. [Google Scholar]
- Qiao, G.; Lu, P.; Scainoni, M.; Xu, S.; Tong, X.; Feng, T.; Wu, H.; Chen, W.; Tian, Y.; Wang, W.; et al. Landslide investigation with remote sensing and sensor network: From susceptibility mapping and scaled-down simulation towards in situ sensor network design. Remote Sens 2013, 5, 4319–4346. [Google Scholar]
- Singhroy, V.; Molch, K. Characterizing and monitoring rockslides from SAR techniques. Adv. Space Res 2004, 33, 290–295. [Google Scholar]
- Li, Z.; Fielding, E.J.; Cross, P. Integration of InSAR time series analysis and water vapour correction for mapping postseismic deformation after the 2003 Bam, Iran Earthquake. IEEE Trans. Geosci. Remote Sens 2009, 47, 3220–3230. [Google Scholar]
- Zebker, H.A.; Rosen, P.A.; Goldstein, R.M.; Gabriel, A.; Werner, C.L. On the derivation of coseismic displacement fields using differential radar interferometry: The Landers earthquake. J. Geophys. Res 1994, 99, 19617–19634. [Google Scholar]
- Lu, Z.; Dzurisin, D.; Biggs, J.; Wicks, C., Jr.; McNutt, S. Ground surface deformation patterns, magma supply, and magma storage at Okmok volcano, Alaska, inferred from InSAR analysis: I. Inter-eruptive deformation, 1997–2008. J. Geophys. Res 2010, 115. [Google Scholar] [CrossRef]
- Luckman, A.; Quincey, D.; Bevan, S. The potential of satellite radar interferometry and feature tracking for monitoring flow rates of Himalayan glaciers. Remote Sens. Environ 2007, 111, 172–181. [Google Scholar]
- Chen, F.; Lin, H. Multi-baseline differential SAR interferometry analysis of Lantau Highway, Hong Kong, using ENVIsat ASAR data. Remote Sens. Lett 2011, 2, 167–173. [Google Scholar]
- Lin, H.; Chen, F.; Zhao, Q. Land deformation monitoring using coherent target-neighborhood networking method combined with polarimetric information—A case study of Shanghai, China. Int. J. Remote Sens 2011, 32, 2395–2407. [Google Scholar]
- Ferretti, A.; Prati, C.; Rocca, F. Nonlinear subsidence rate estimation using persistent scatterers indifferential SAR interferometry. IEEE Trans. Geosci. Remote Sens 2000, 38, 2202–2212. [Google Scholar]
- Hooper, A.; Zebker, H.; Segall, P.; Kampes, B. A new method for measuring deformation on volcanoes and other natural terrains using InSAR persitent scatterers. Geophys. Res. Lett 2004, 31. [Google Scholar] [CrossRef]
- Werner, C.; Wegmuller, U.; Strozzi, T.; Wiesmann, A. Interferometric Point Target Analysis for Deformation Mapping. Proceedings of the IEEE Geoscience and Remote Sensing Symposium (IGARSS’03), Toulouse, France, 21–25 July 2003.
- Berardino, P.; Fornaro, G.; Lanari, R.; Sansosti, E. A new algorithm for surface deforamtion monitoring based on small baseline differential SAR interferograms. IEEE Trans. Geosci. Remote Sens 2002, 40, 2375–2383. [Google Scholar]
- Chen, F.; Lin, H.; Zhang, Y.; Lu, Z. Ground subsidence geo-hazards induced by rapid urbanization: Implications from InSAR observation and geological analysis. Nat. Harzards Earth Syst. Sci 2012, 12, 935–942. [Google Scholar]
- Lanari, R.; Mora, O.; Manunta, M. A small-baseline approach for investigating deformations on full-resolution differential SAR interferograms. IEEE Trans. Geosci. Remote Sens 2004, 42, 1377–1386. [Google Scholar]
- Li, Z.; Liu, Y.; Zhou, X.; Cross, P.; Feng, W. Using small baseline interferometric SAR to map nonlinear ground motion: A case study in northern Tibet. J. Appl. Geod 2009, 3, 163–170. [Google Scholar]
- Ferretti, A.; Fumagalli, A.; Novali, F.; Prati, C.; Rocca, F.; Rucci, A. A new algorithm for processing interferometric data-stacks: SqueeSAR. IEEE Trans. Geosci. Remote Sens 2011, 49, 3460–3470. [Google Scholar]
- Hooper, A. A multi-temporal InSAR method incorporating both persistent scatterer and small baseline approaches. Geophys. Res. Lett 2008, 35, 1–5. [Google Scholar]
- Cascini, L.; Fornaro, G.; Peduto, D. Analysis at medium scale of low-resolution DInSAR data in slow-moving landslide-affected areas. ISPRS J. Photogramm. Remote Sens 2009, 64, 598–611. [Google Scholar]
- Cascini, L.; Fornaro, G.; Peduto, D. Advanced low- and full-resolution DInSAR map generation for slow-moving landslide analysis at different scales. Eng. Geol 2010, 112, 29–42. [Google Scholar]
- Cigna, F.; Ventisette, C.D.; Liguori, V.; Casagli, N. Advanced radar-interpretation of InSAR time series for mapping and characterization of geological processes. Nat. Hazard. Earth Syst. Sci 2011, 11, 865–881. [Google Scholar]
- Cigna, F.; Bianchini, S.; Casagli, N. How to assess landslide activity and intensity with Persistent Scatterer Interferometry (PSI): The PSI-based matrix approach. Landslides 2012, 10, 267–283. [Google Scholar]
- Colesanti, C.; Wasowski, J. Investigating landslides with space-borne synthetic aperture radar (SAR) interferometry. Eng. Geol 2006, 88, 173–199. [Google Scholar]
- Farina, P.; Colombo, D.; Fumagalli, A.; Marks, F.; Moretti, S. Permanent scatterers for landslide investigations: Outcomes from the ESA-SLAM project. Eng. Geol 2006, 88, 200–217. [Google Scholar]
- Guzzetti, F.; Manunta, M.; Ardizzone, F.; Pepe, A.; Cardinali, M.; Zeni, G.; Reichenbach, P.; Lanari, R. Analysis of ground deformation detected using the SBAS-DInSAR technique in Umbria, Central Italy. Pure Appl. Geophys 2009, 166, 1425–1459. [Google Scholar]
- Lauknes, T.R.; Shanker, A.P.; Dehls, J.F.; Zebker, H.A.; Henderson, I.H.C.; Larsen, Y. Detailed rockslide mapping in northern Norway with small baseline and persistent scatterer interferometric SAR time series methods. Remote Sens. Environ 2010, 114, 2097–2109. [Google Scholar]
- Strozzi, T.; Farina, P.; Corsini, A.; Ambrosi, C.; Thüring, M.; Zilger, J.; Wiesmann, A.; Wegmüller, U.; Werner, C. Survey and monitoring of landslide displacements by means of L-band satellite SAR interferometry. Landslides 2005, 2, 193–201. [Google Scholar]
- Bianchini, S.; Cigna, F.; del Ventisette, C.; Moretti, S.; Casagli, N. Detecting and Monitoring Landslide Phenomena with TerraSAR-X Persistent Scatterers Data: The Gimigliano Case Study in Calabria Region (Italy). In Proceedings of the 2012 IEEE International Geoscience and Remote Sensing Symposium (IGARSS’12), Munich, Germany, 22–27 July 2012; 6351237, pp. 982–985.
- Bovenga, F.; Wasowski, J.; Nitti, D.O.; Nutricato, R.; Chiaradia, M.T. Using COSMO/SkyMed X-band and ENVISAT C-band SAR interferometry for landslides analysis. Remote Sens. Environ 2012, 119, 272–285. [Google Scholar]
- Chen, F.; Lin, H.; Yeung, K.; Cheng, S. Detection of slope instability in Hong Kong based on multi-baseline differential SAR interferometry using ALOS PALSAR data. GISci. Remote Sens 2010, 47, 208–220. [Google Scholar]
- Zhou, C.H.; Lee, C.F.; Li, J.; Xu, Z.W. On the spatial relationship between landslides and causative factors on Lantau Island, Hong Kong. Geomorphology 2002, 43, 197–207. [Google Scholar]
- Parry, S. The application of geomorphological mapping in the assessment of landslide hazard in Hong Kong. Dev. Earth Surf. Process 2011, 15, 413–441. [Google Scholar]
- Evans, N.C.; King, J.P. Natural Terrain Landslide Study Debris Avalanches Susceptibility, Hong Kong; Technical Note TN 1/98; Geotechnical Engineering Office: Hong Kong, China, 1998; p. 96. [Google Scholar]
- Chen, H.; Lee, C.F. Geohazards of slope mass movement and its prevention in Hong Kong. Eng. Geol 2004, 76, 3–25. [Google Scholar]
- Hanssen, R.F. Radar Interferometry: Data Interpretation & Error Analysis; Kluwer Academic Publishers: Dordrecht, The Netherlands, 2001; p. 138. [Google Scholar]
- Nitti, D.O.; Hanssen, R.F.; Refice, A.; Bovenga, F.; Nutricato, R. Impact of DEM-assisted coregistration on high-resolution SAR interferometry. IEEE Trans. Geosci. Remote Sens 2011, 49, 1127–1143. [Google Scholar]
- Costantini, M.; Rosen, P. A Generalized Phase Unwrapping Approach for Sparse Data. Proceedings of the International Geoscience and Remote Sensing Symposium 1999 (IGARSS’99), 28 June–2 July 1999; Hamburg, Germany.
- Costantini, M.; Malvarosa, F.; Minati, F. A general formulation for redundant integration of finite differences and phase unwrapping on a sparse multidimensional domain. IEEE Trans. Geosci. Remote Sens 2012, 50, 758–768. [Google Scholar]
- Hooper, A.; Zebker, H. Phase unwrapping in three dimensions with application to InSAR time series. J. Opt. Soc. Am. A 2007, 24, 2737–2747. [Google Scholar]
- Shanker, P.; Zebker, H. Edgelist phase unwrapping algorithm for time series InSAR analysis. J. Opt. Soc. Am 2010, 27, 605–612. [Google Scholar]
- Pepe, A.; Lanari, R. On the extension of the miminum cost flow algorithm for phase unwrapping of multitemporal differential SAR interferograms. IEEE Trans. Geosci. Remote Sens 2006, 44, 2374–2383. [Google Scholar]
- Samsonov, S. Topographic correction for ALOS PALSAR interferometry. IEEE Trans. Geosci. Remote Sens 2010, 48, 3020–3027. [Google Scholar]
- Goldstein, R.M.; Werner, C.L. Radar interferogram filtering for geophysical applications. Geophys. Res. Lett 1998, 25, 4035–4038. [Google Scholar]
- Sansosti, E.; Casu, F.; Manzo, M.; Lanari, R. Space-borne radar interferometry techniques for the generation of deformation time series: An advanced tool for Earth’s surface displacement analysis. Geophys. Res. Lett 2010, 37. [Google Scholar] [CrossRef]
- Rocca, F. 3D Motion Recovery with Multi-Angle and/or Left Right Interferometry. Proceedings of the Third International Workshop on ERS SAR Interferometry (FRINGE 2003), Frascati, Italy, 2–5 December 2003.
- Wright, T.J.; Parsons, B.E.; Lu, Z. Toward mapping surface deformation in three dimensions using InSAR. Geophys. Res. Lett 2004, 31. [Google Scholar] [CrossRef]
- Tofani, V.; Raspini, F.; Catani, F.; Casagli, N. Persistent Scatterer Interferometry (PSI) technique for landslide characterization and monitoring. Remote Sens 2013, 5, 1045–1065. [Google Scholar]


| Acquisition Time | Polarization | Perpendicular Baseline (m) | Temporal Baseline (days) |
|---|---|---|---|
| 20070624 | HH/HV | 2,592.75 | −736 |
| 20070809 | HH/HV | 2,689.86 | −690 |
| 20071225 | HH | 2,621.81 | −552 |
| 20080209 | HH | 2,818.71 | −506 |
| 20080511 | HH/HV | 3,303.44 | −414 |
| 20080626 | HH | 2,811.50 | −368 |
| 20080926 | HH/HV | −2,934.69 | −276 |
| 20081111 | HH/HV | −2,558.41 | −230 |
| 20081227 | HH | −2,635.86 | −184 |
| 20090211 | HH | −381.09 | −138 |
| 20090629 | HH/HV | 0 | 0 |
| 20090814 | HH/HV | −155.75 | 46 |
| 20090929 | HH/HV | 182.99 | 92 |
| 20091114 | HH | 324.77 | 138 |
| 20091230 | HH | 611.42 | 184 |
| 20100214 | HH | 952.09 | 230 |
| 20100517 | HH/HV | 1,074.14 | 322 |
| 20100702 | HH/HV | 1,347.14 | 368 |
| 20101002 | HH/HV | 1,639.99 | 460 |
| 20101117 | HH/HV | 1,203.67 | 506 |
| 20110102 | HH | 1,733 | 552 |
| Acquisition Time | Perpendicular Baseline (m) | TemporalBaseline (days) | Acquisition Time | PerpendicularBaseline (m) | TemporalBaseline (days) |
|---|---|---|---|---|---|
| 20080513 | −204.08 | −550 | 20091023 | −45.16 | −22 |
| 20081025 | −201.70 | −385 | 20091103 | −150.58 | −11 |
| 20081105 | 101.23 | −374 | 20091114 | 0 | 0 |
| 20081116 | −28.73 | −363 | 20091125 | −125.12 | 11 |
| 20081127 | −141.03 | −352 | 20091206 | −138.60 | 22 |
| 20090110 | 21.92 | −308 | 20091217 | −37.91 | 33 |
| 20090121 | −46.65 | −297 | 20100406 | −32.09 | 143 |
| 20090201 | −123.71 | −286 | 20100611 | −32.41 | 209 |
| 20090212 | 105.68 | −275 | 20100622 | 32.23 | 220 |
| 20090223 | −179.27 | −264 | 20100703 | 92.21 | 231 |
| 20090306 | −96.90 | −253 | 20100714 | 32.47 | 242 |
| 20090317 | 9.05 | −242 | 20100725 | 182.34 | 253 |
| 20090430 | 9.64 | −198 | 20100805 | −138.46 | 264 |
| 20090511 | −18.08 | −187 | 20100816 | −105.65 | 275 |
| 20090522 | −23.53 | −176 | 20100907 | −70.67 | 297 |
| 20090602 | −55.84 | −165 | 20100918 | −239.08 | 308 |
| 20090624 | 180.15 | −143 | 20100929 | 94.53 | 319 |
| 20090705 | 60.57 | −132 | 20101010 | 27.25 | 330 |
| 20090716 | −88.08 | −121 | 20101101 | 55.42 | 352 |
| 20090727 | −46.62 | −110 | 20101112 | −79.32 | 363 |
| 20091001 | 67.76 | −44 | 20101226 | −59.14 | 407 |
| 20091012 | −185.64 | −33 |
© 2014 by the authors; licensee MDPI, Basel, Switzerland This article is an open access article distributed under the terms and conditions of the Creative Commons Attribution license (http://creativecommons.org/licenses/by/3.0/).
Share and Cite
Chen, F.; Lin, H.; Hu, X. Slope Superficial Displacement Monitoring by Small Baseline SAR Interferometry Using Data from L-band ALOS PALSAR and X-band TerraSAR: A Case Study of Hong Kong, China. Remote Sens. 2014, 6, 1564-1586. https://doi.org/10.3390/rs6021564
Chen F, Lin H, Hu X. Slope Superficial Displacement Monitoring by Small Baseline SAR Interferometry Using Data from L-band ALOS PALSAR and X-band TerraSAR: A Case Study of Hong Kong, China. Remote Sensing. 2014; 6(2):1564-1586. https://doi.org/10.3390/rs6021564
Chicago/Turabian StyleChen, Fulong, Hui Lin, and Xianzhi Hu. 2014. "Slope Superficial Displacement Monitoring by Small Baseline SAR Interferometry Using Data from L-band ALOS PALSAR and X-band TerraSAR: A Case Study of Hong Kong, China" Remote Sensing 6, no. 2: 1564-1586. https://doi.org/10.3390/rs6021564
APA StyleChen, F., Lin, H., & Hu, X. (2014). Slope Superficial Displacement Monitoring by Small Baseline SAR Interferometry Using Data from L-band ALOS PALSAR and X-band TerraSAR: A Case Study of Hong Kong, China. Remote Sensing, 6(2), 1564-1586. https://doi.org/10.3390/rs6021564