Detection of Coal Fire Dynamics and Propagation Direction from Multi-Temporal Nighttime Landsat SWIR and TIR Data: A Case Study on the Rujigou Coalfield, Northwest (NW) China

 ,
,
Abstract
:1. Introduction
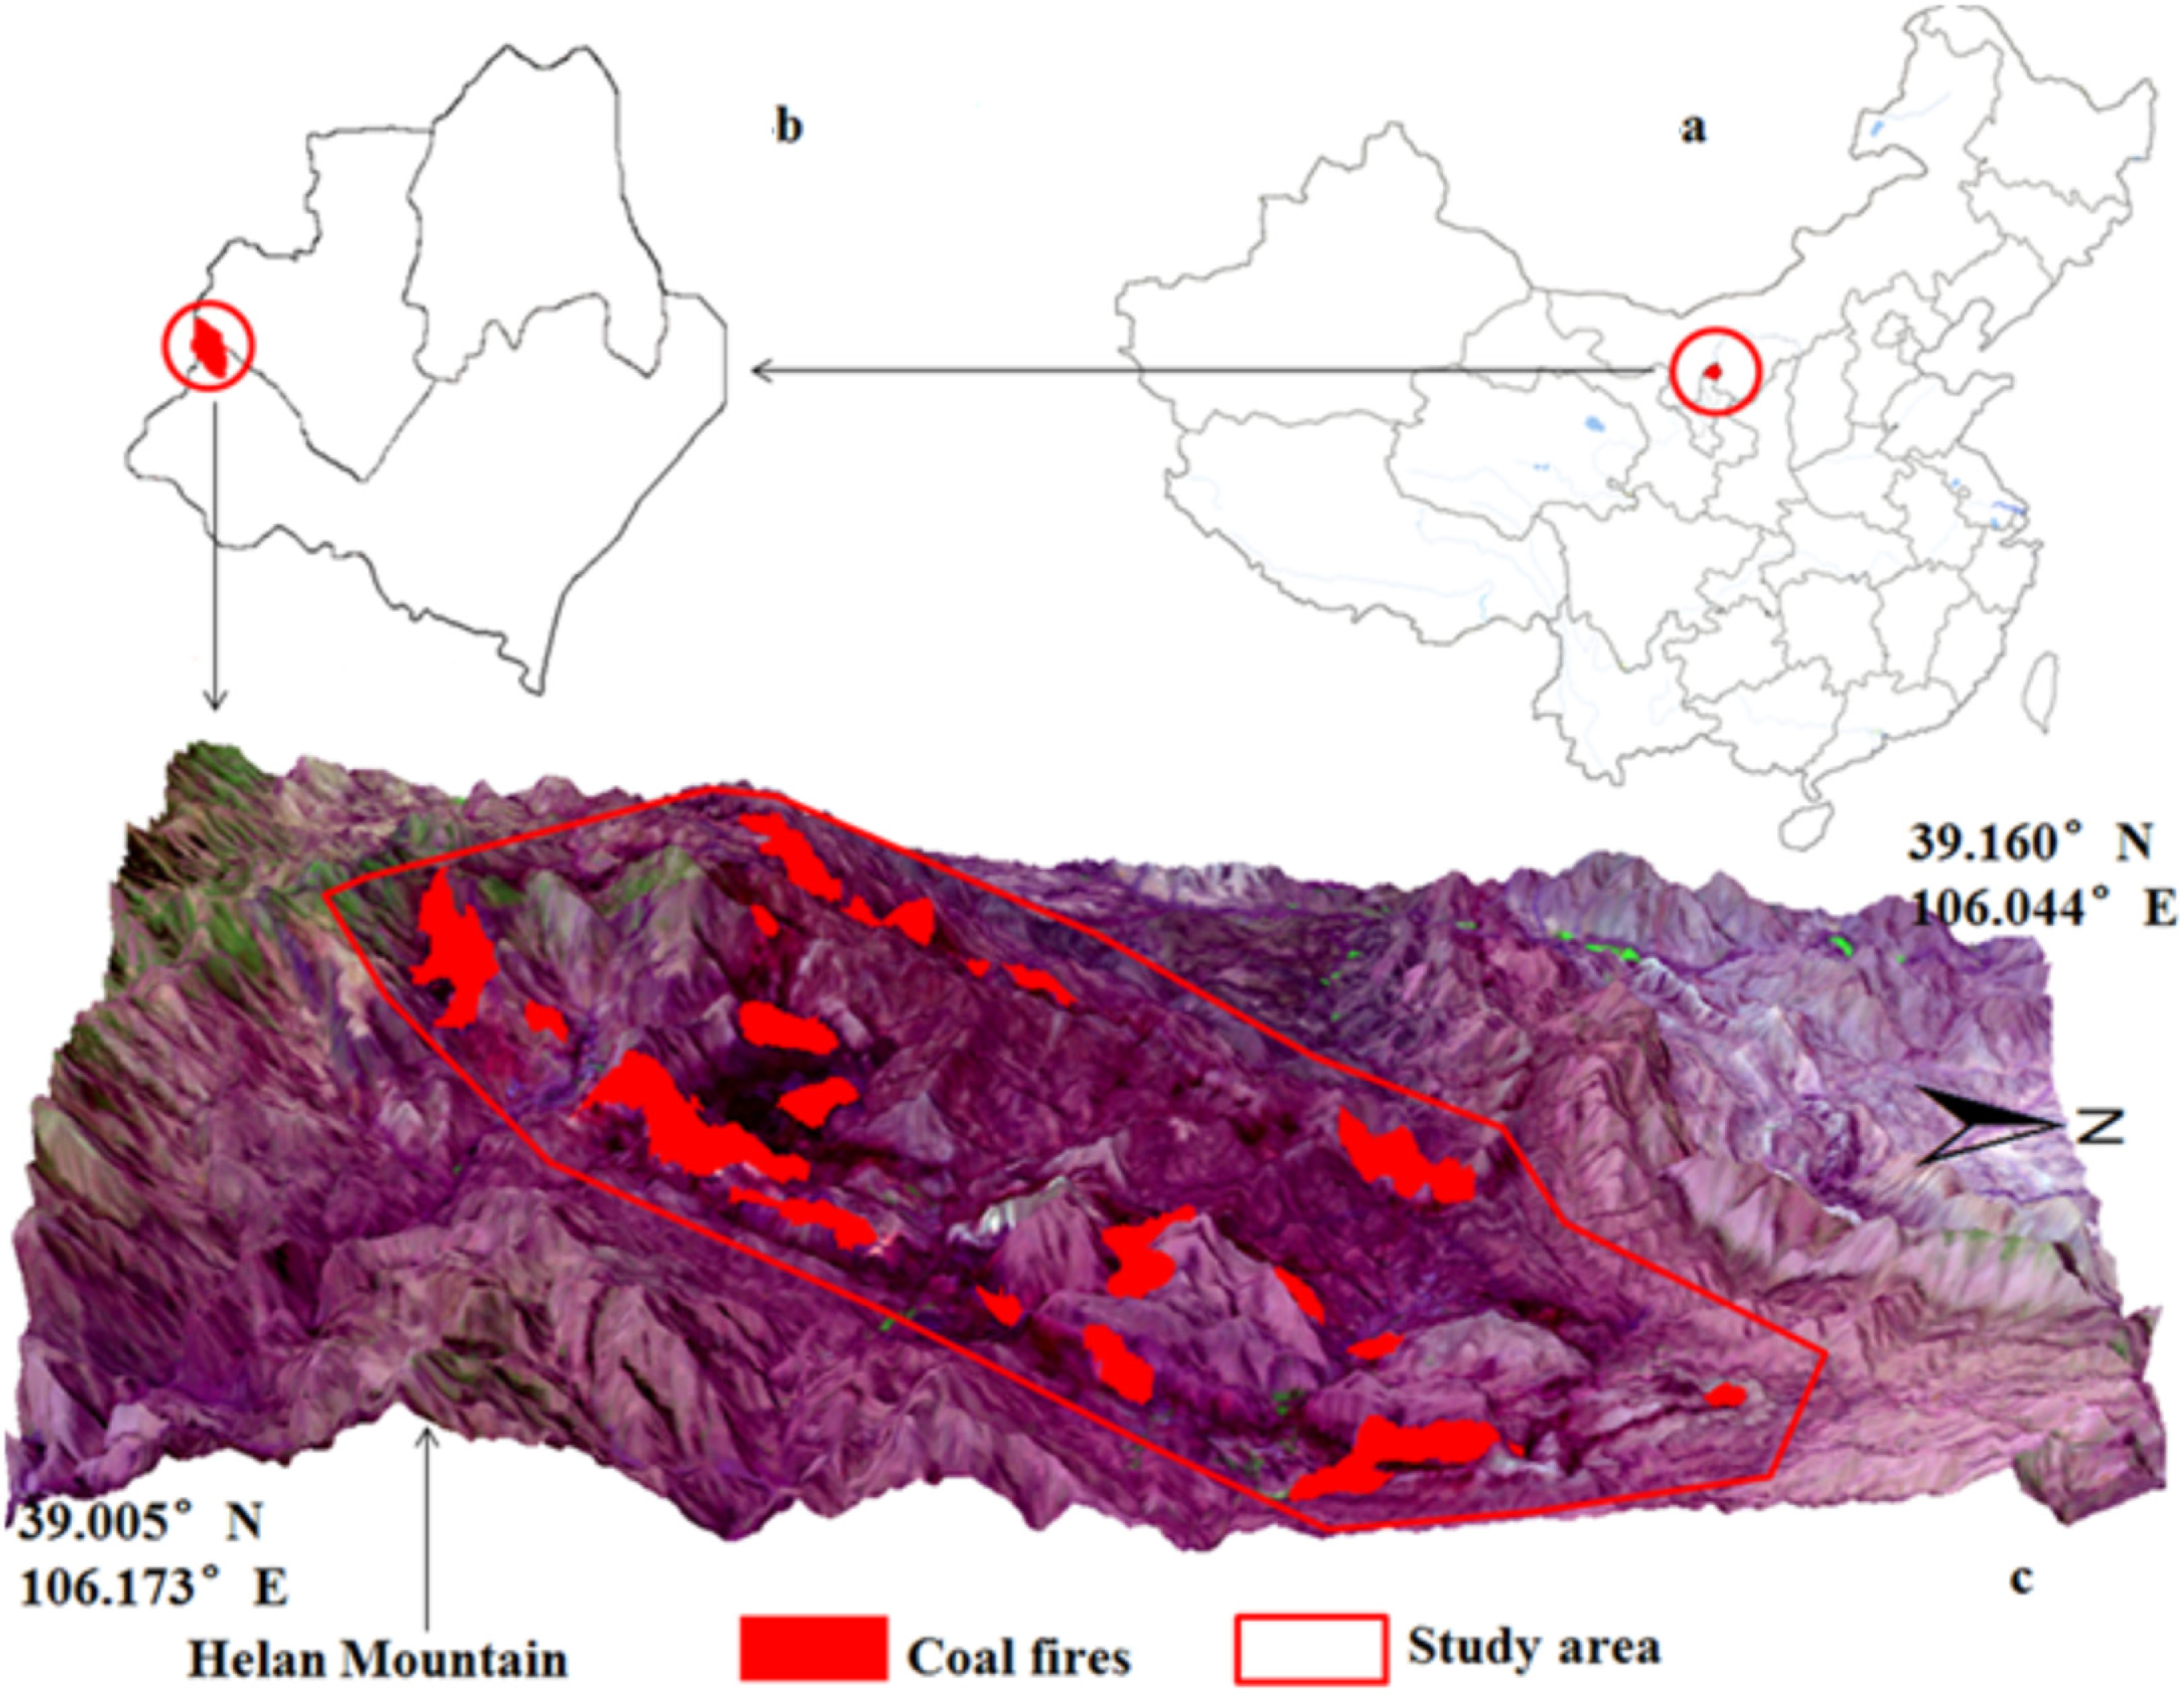
2. Study Area
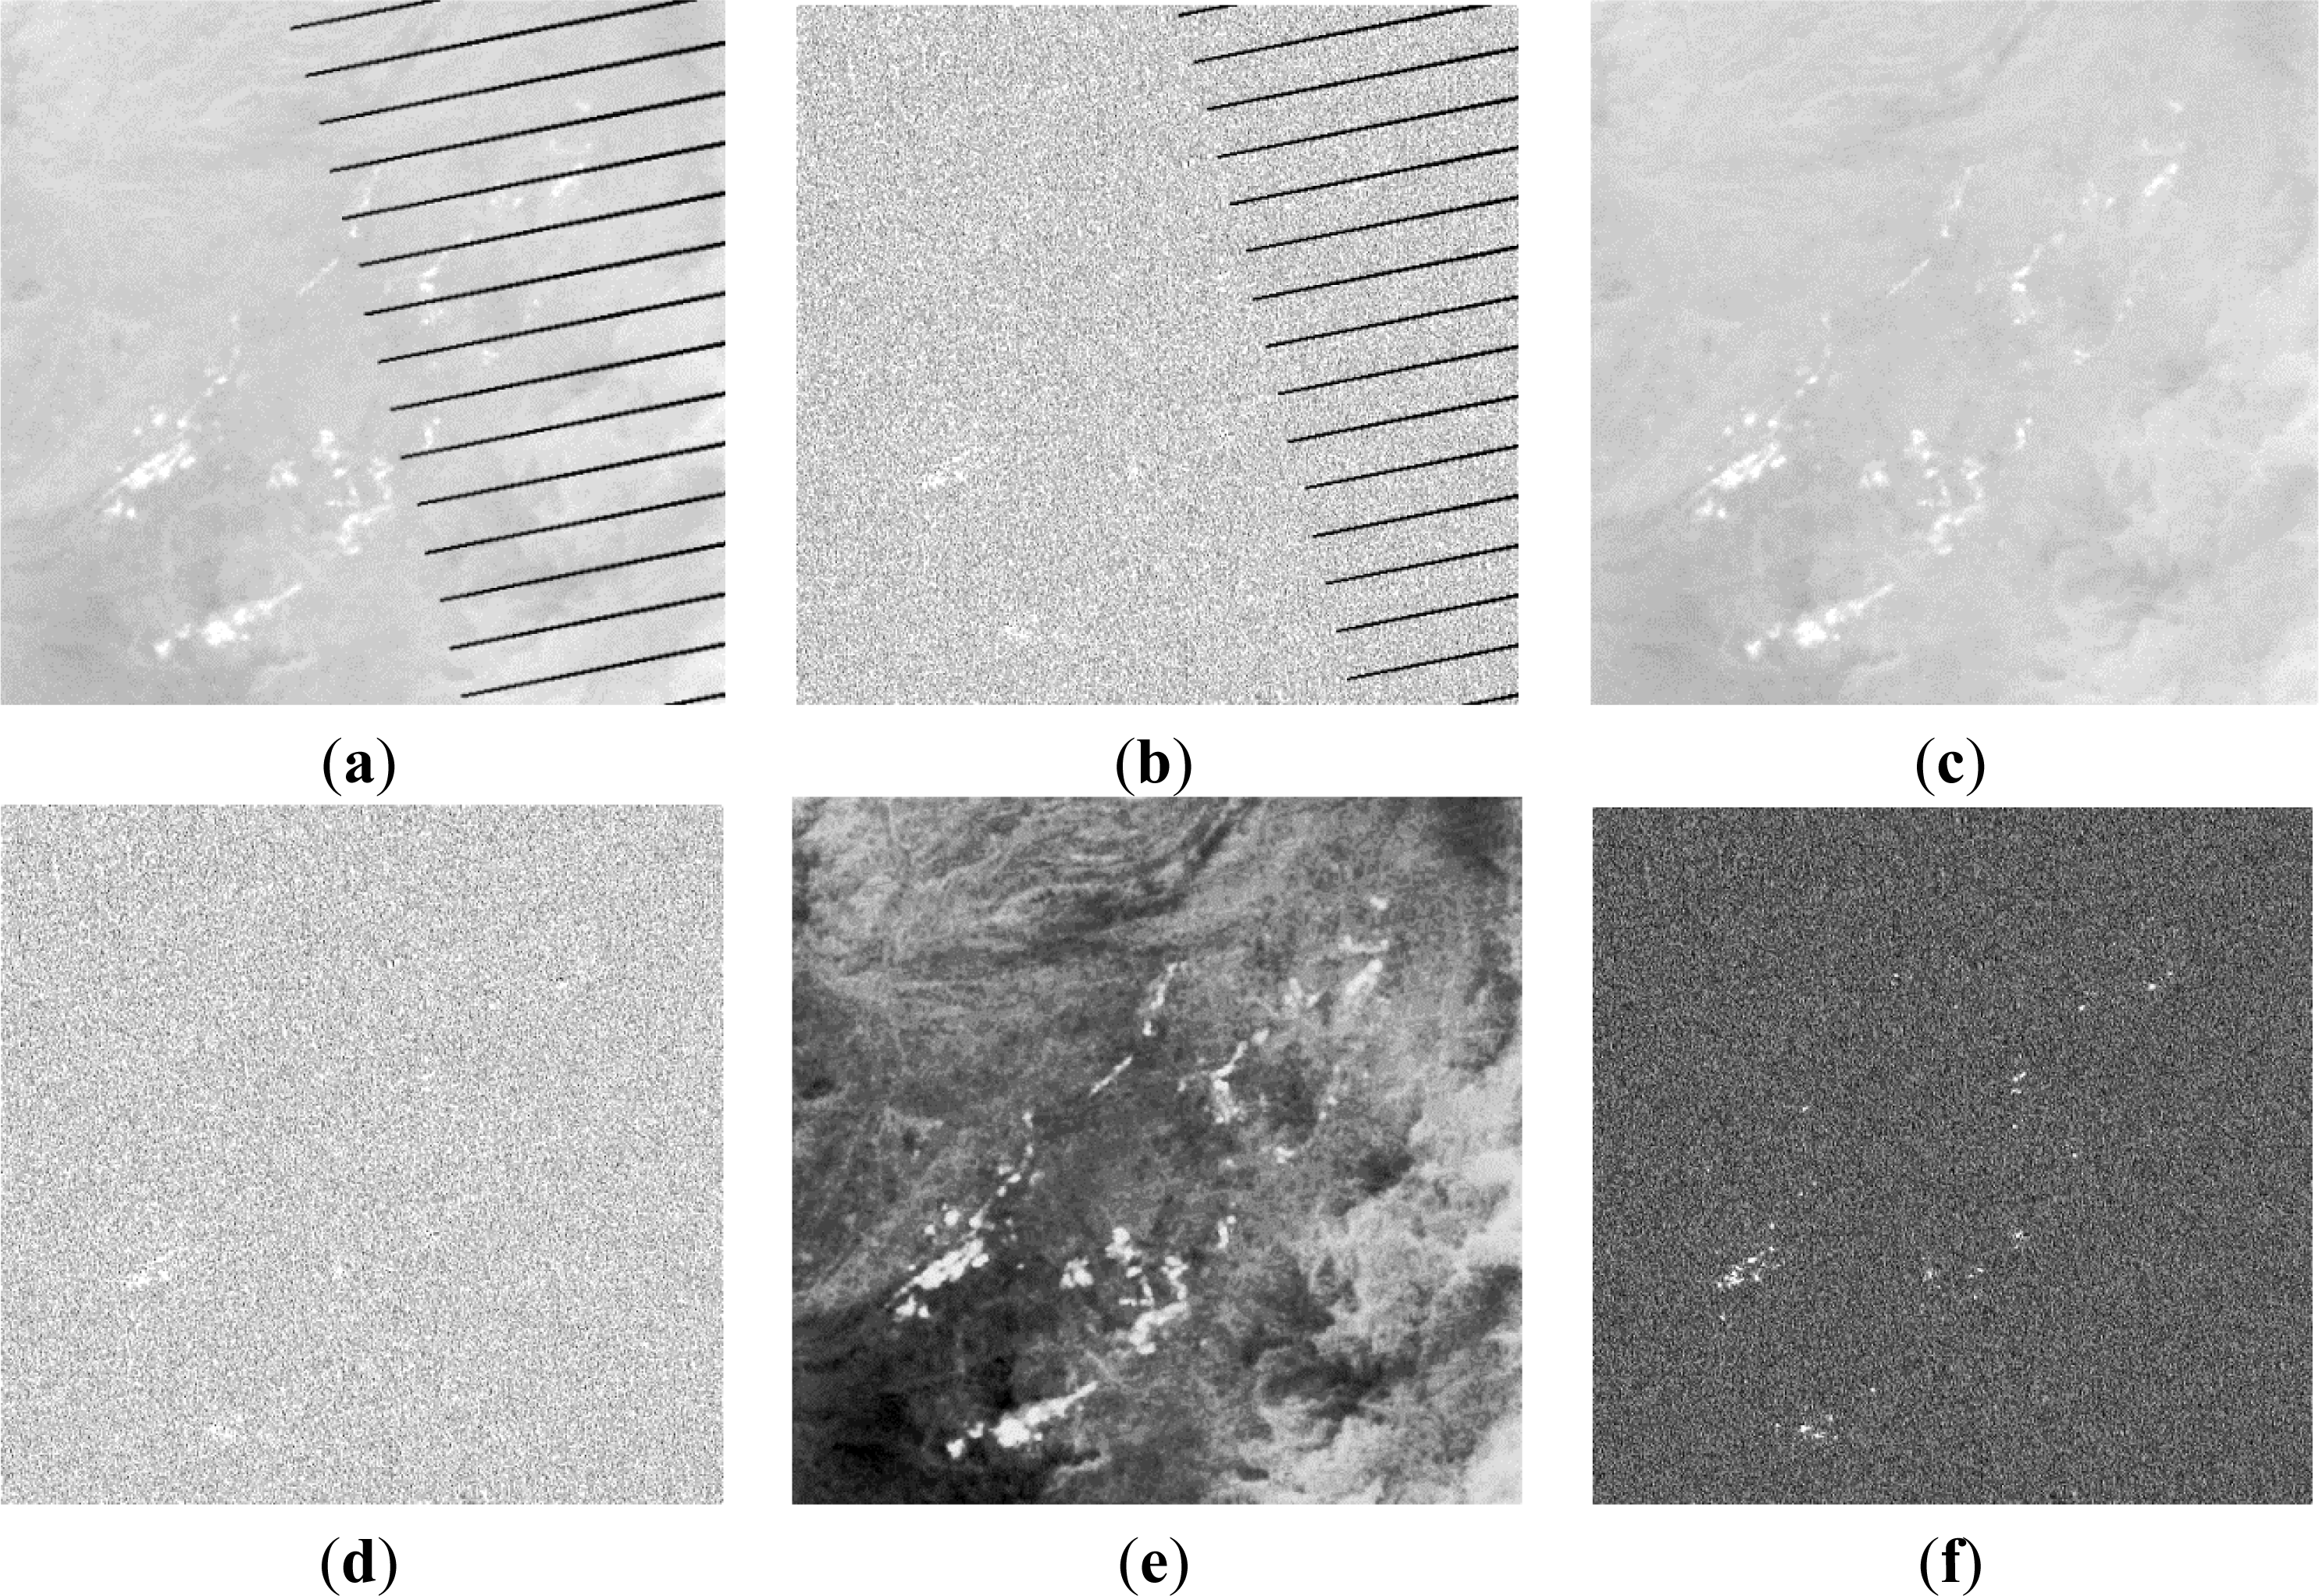
3. Data Used and Preprocessing
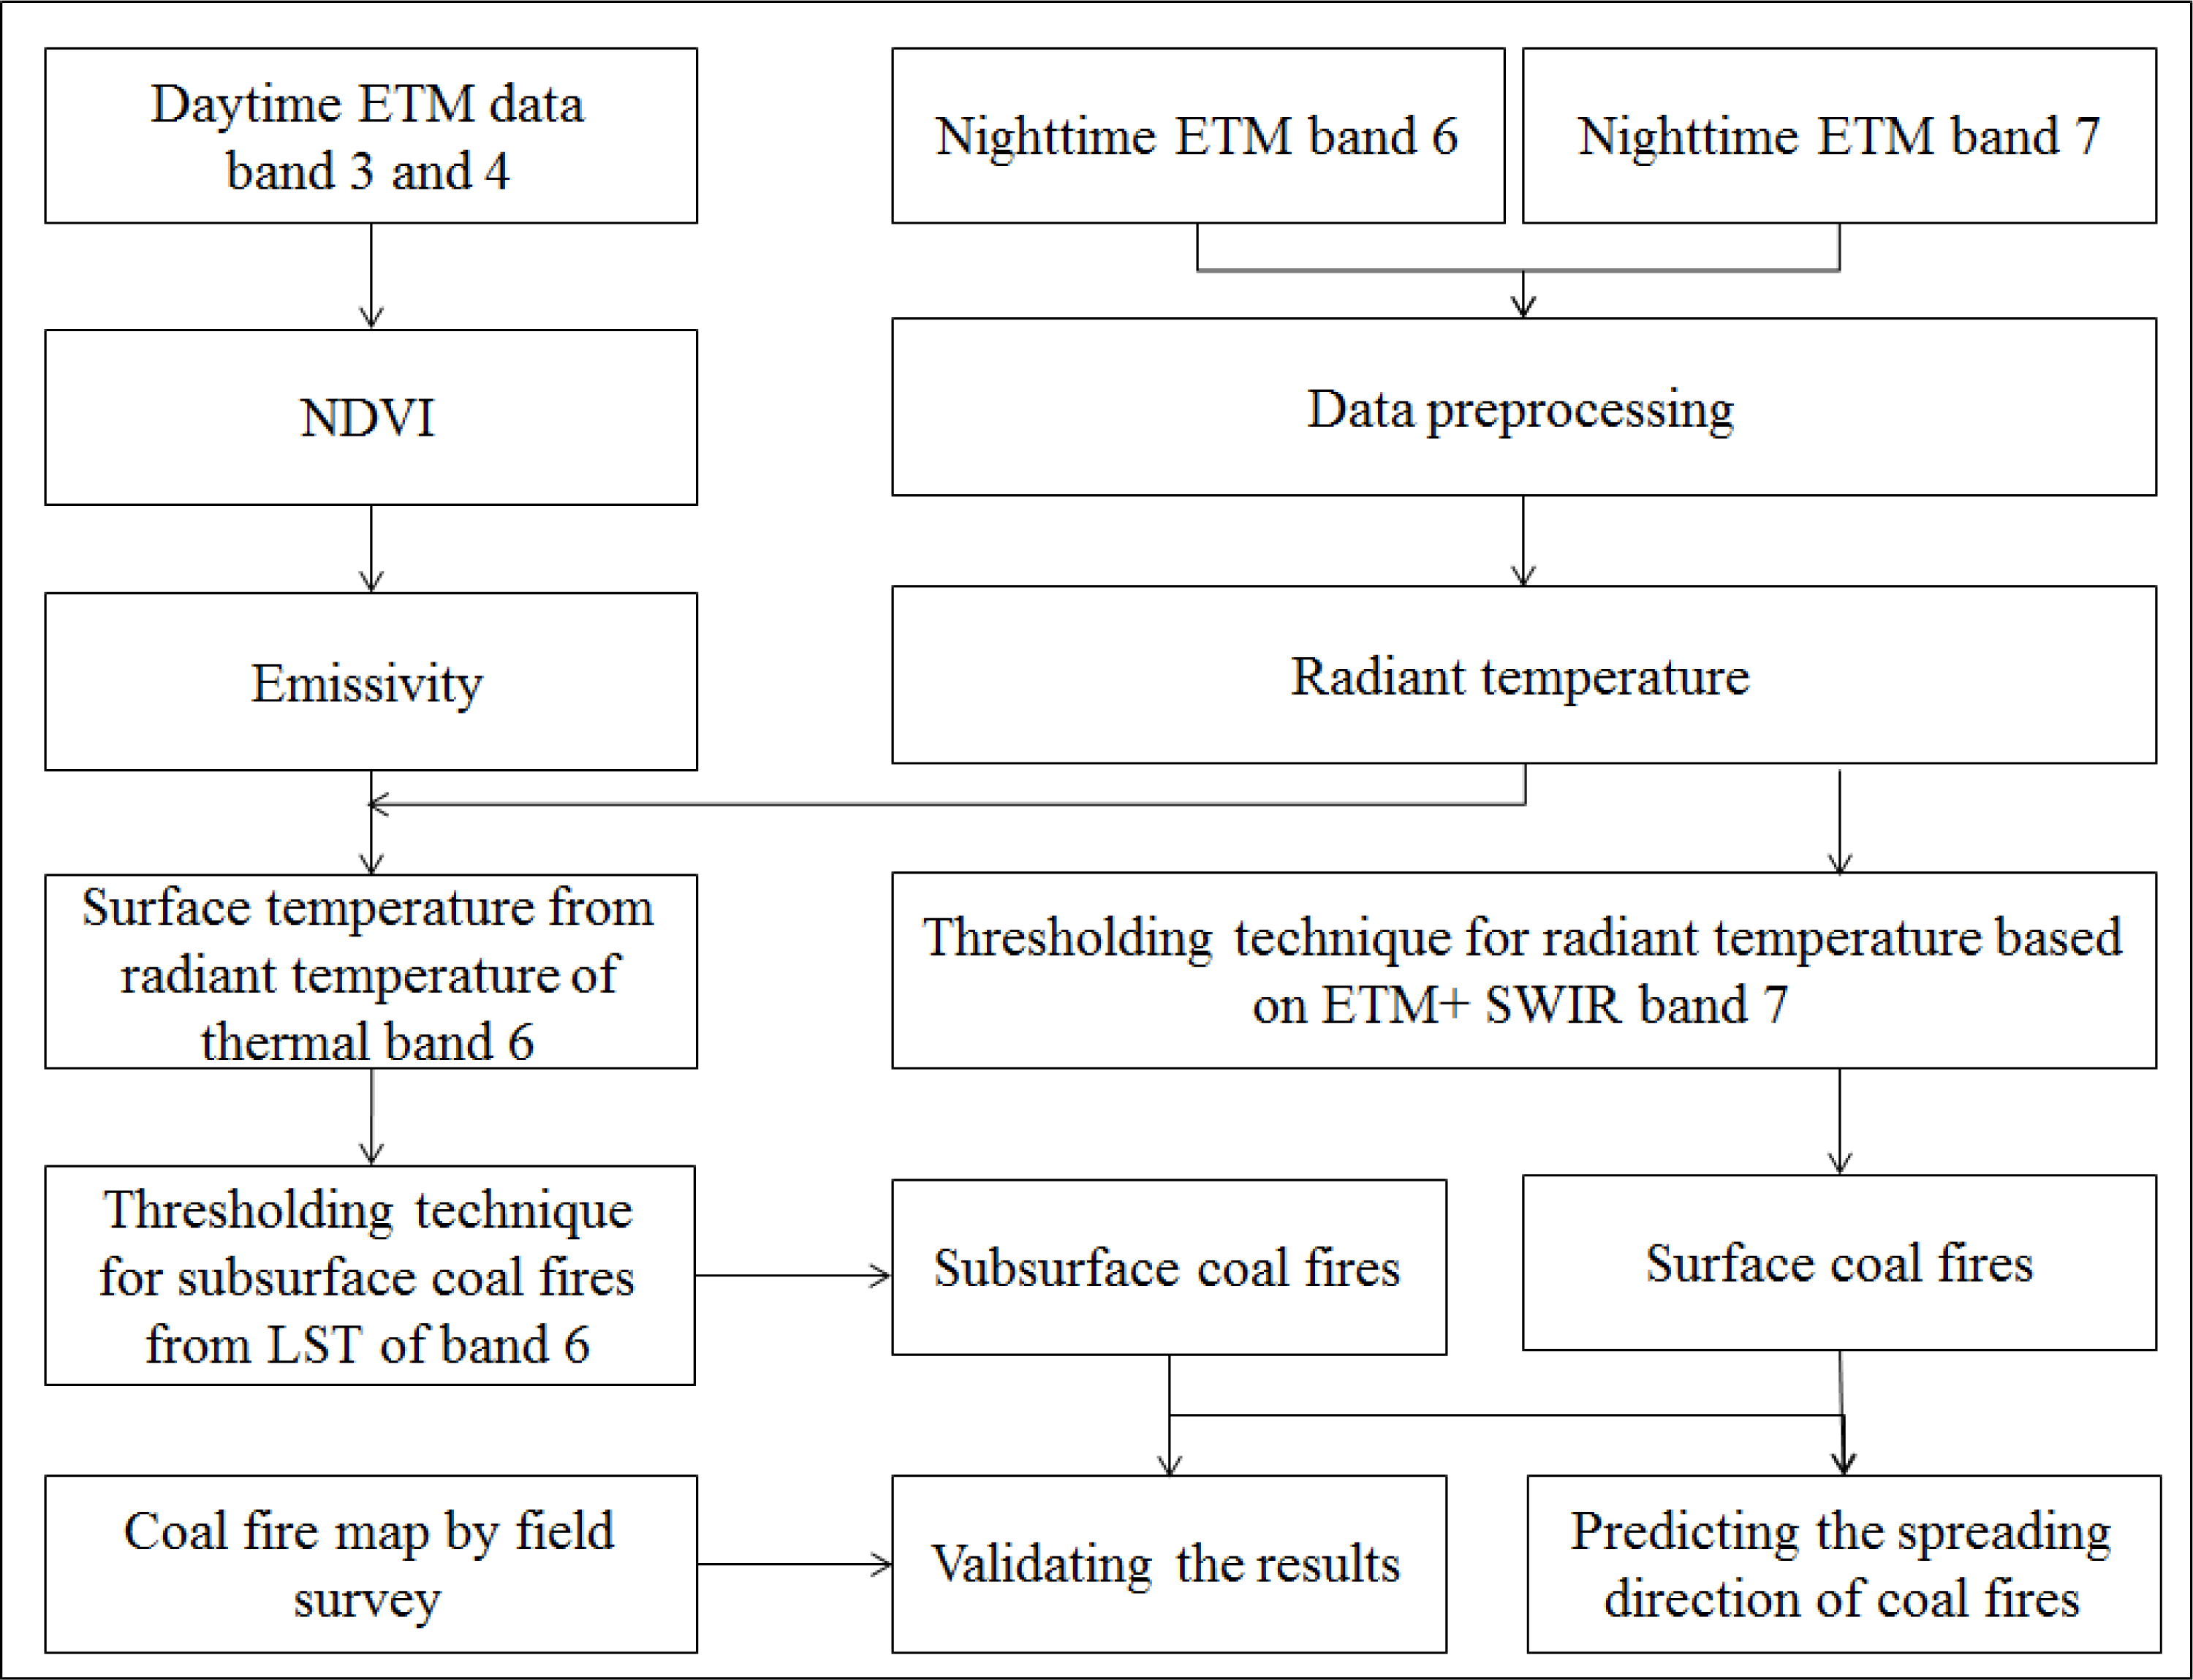
4. Methodology
4.1. Surface Temperature Estimated from Thermal Band 6 Images and Radiant Temperature Calculated from SWIR Band 7 Images
4.2. Method for Detecting Coal Fires and Monitoring Their Spreading Directions
4.2.1. Dynamic Thresholding Technique for Detection of Subsurface Coal Fires Using Nighttime ETM+ Thermal Band 6L Data
4.2.2. Fixed Thresholding Technique for Surface Coal Fires Detection Using Nighttime ETM+ SWIR Band 7 Data
4.2.3. Identification of the Spreading Direction of Coal Fires
5. Results and Discussions
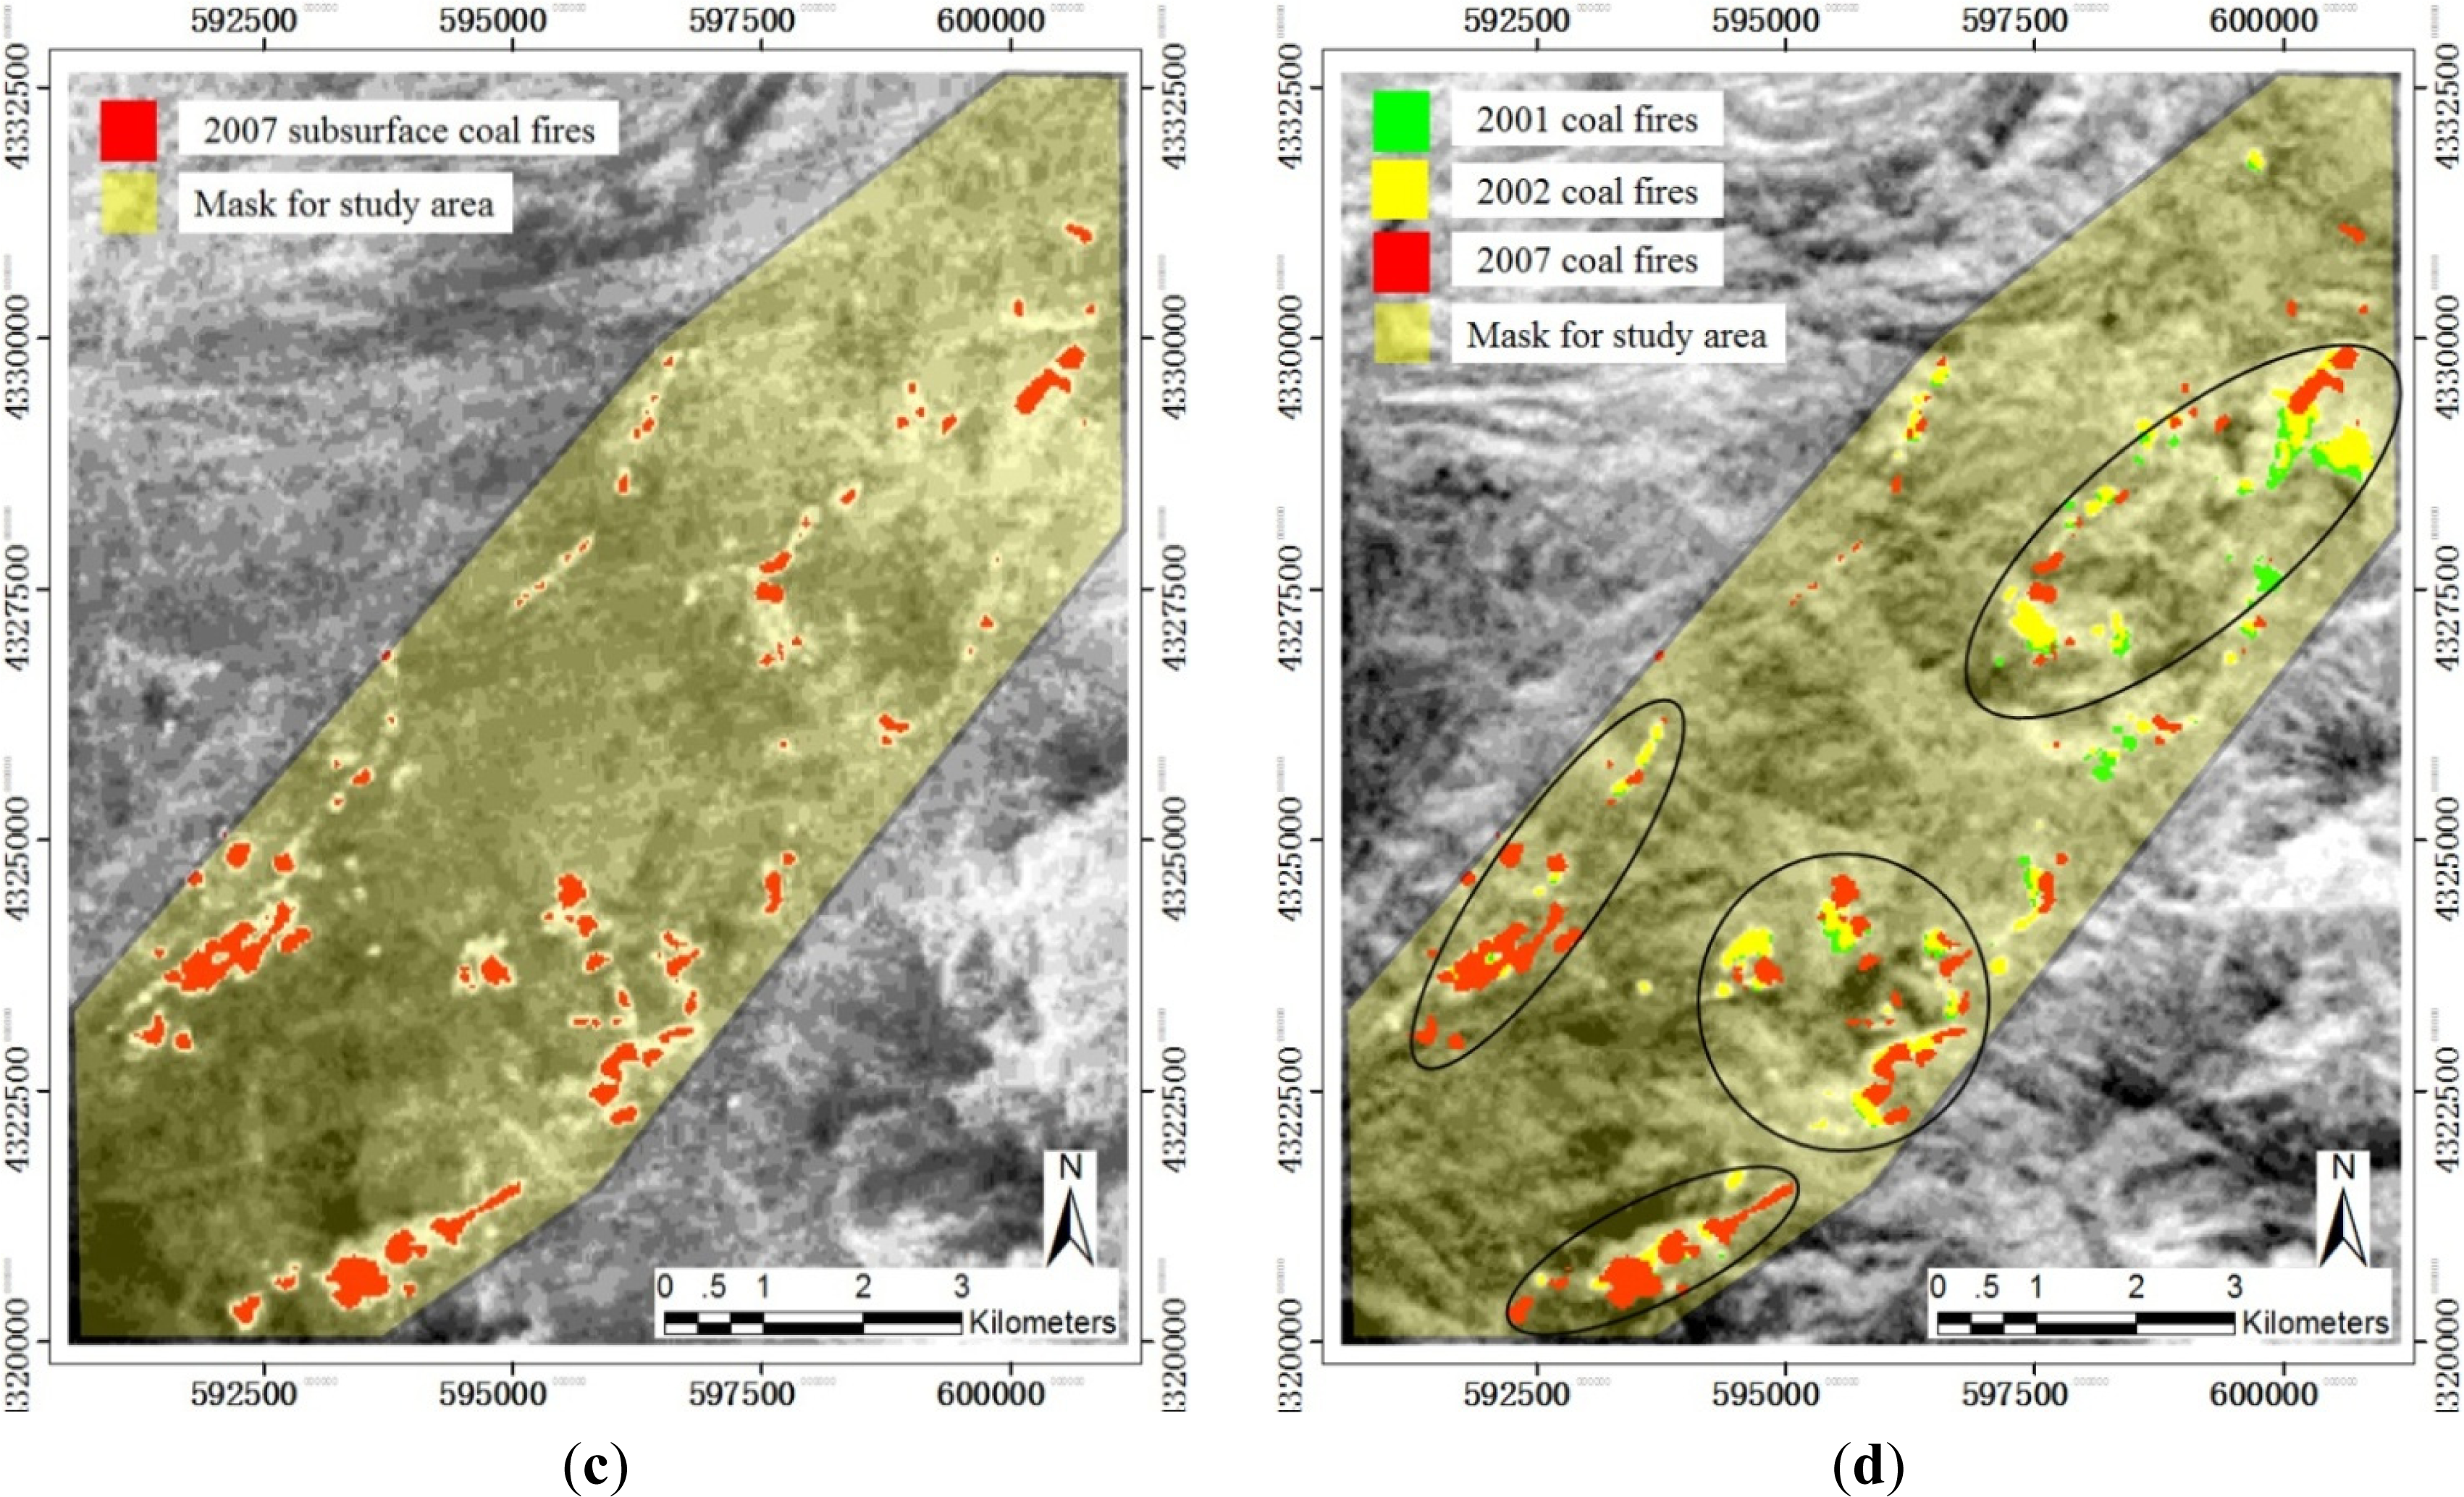
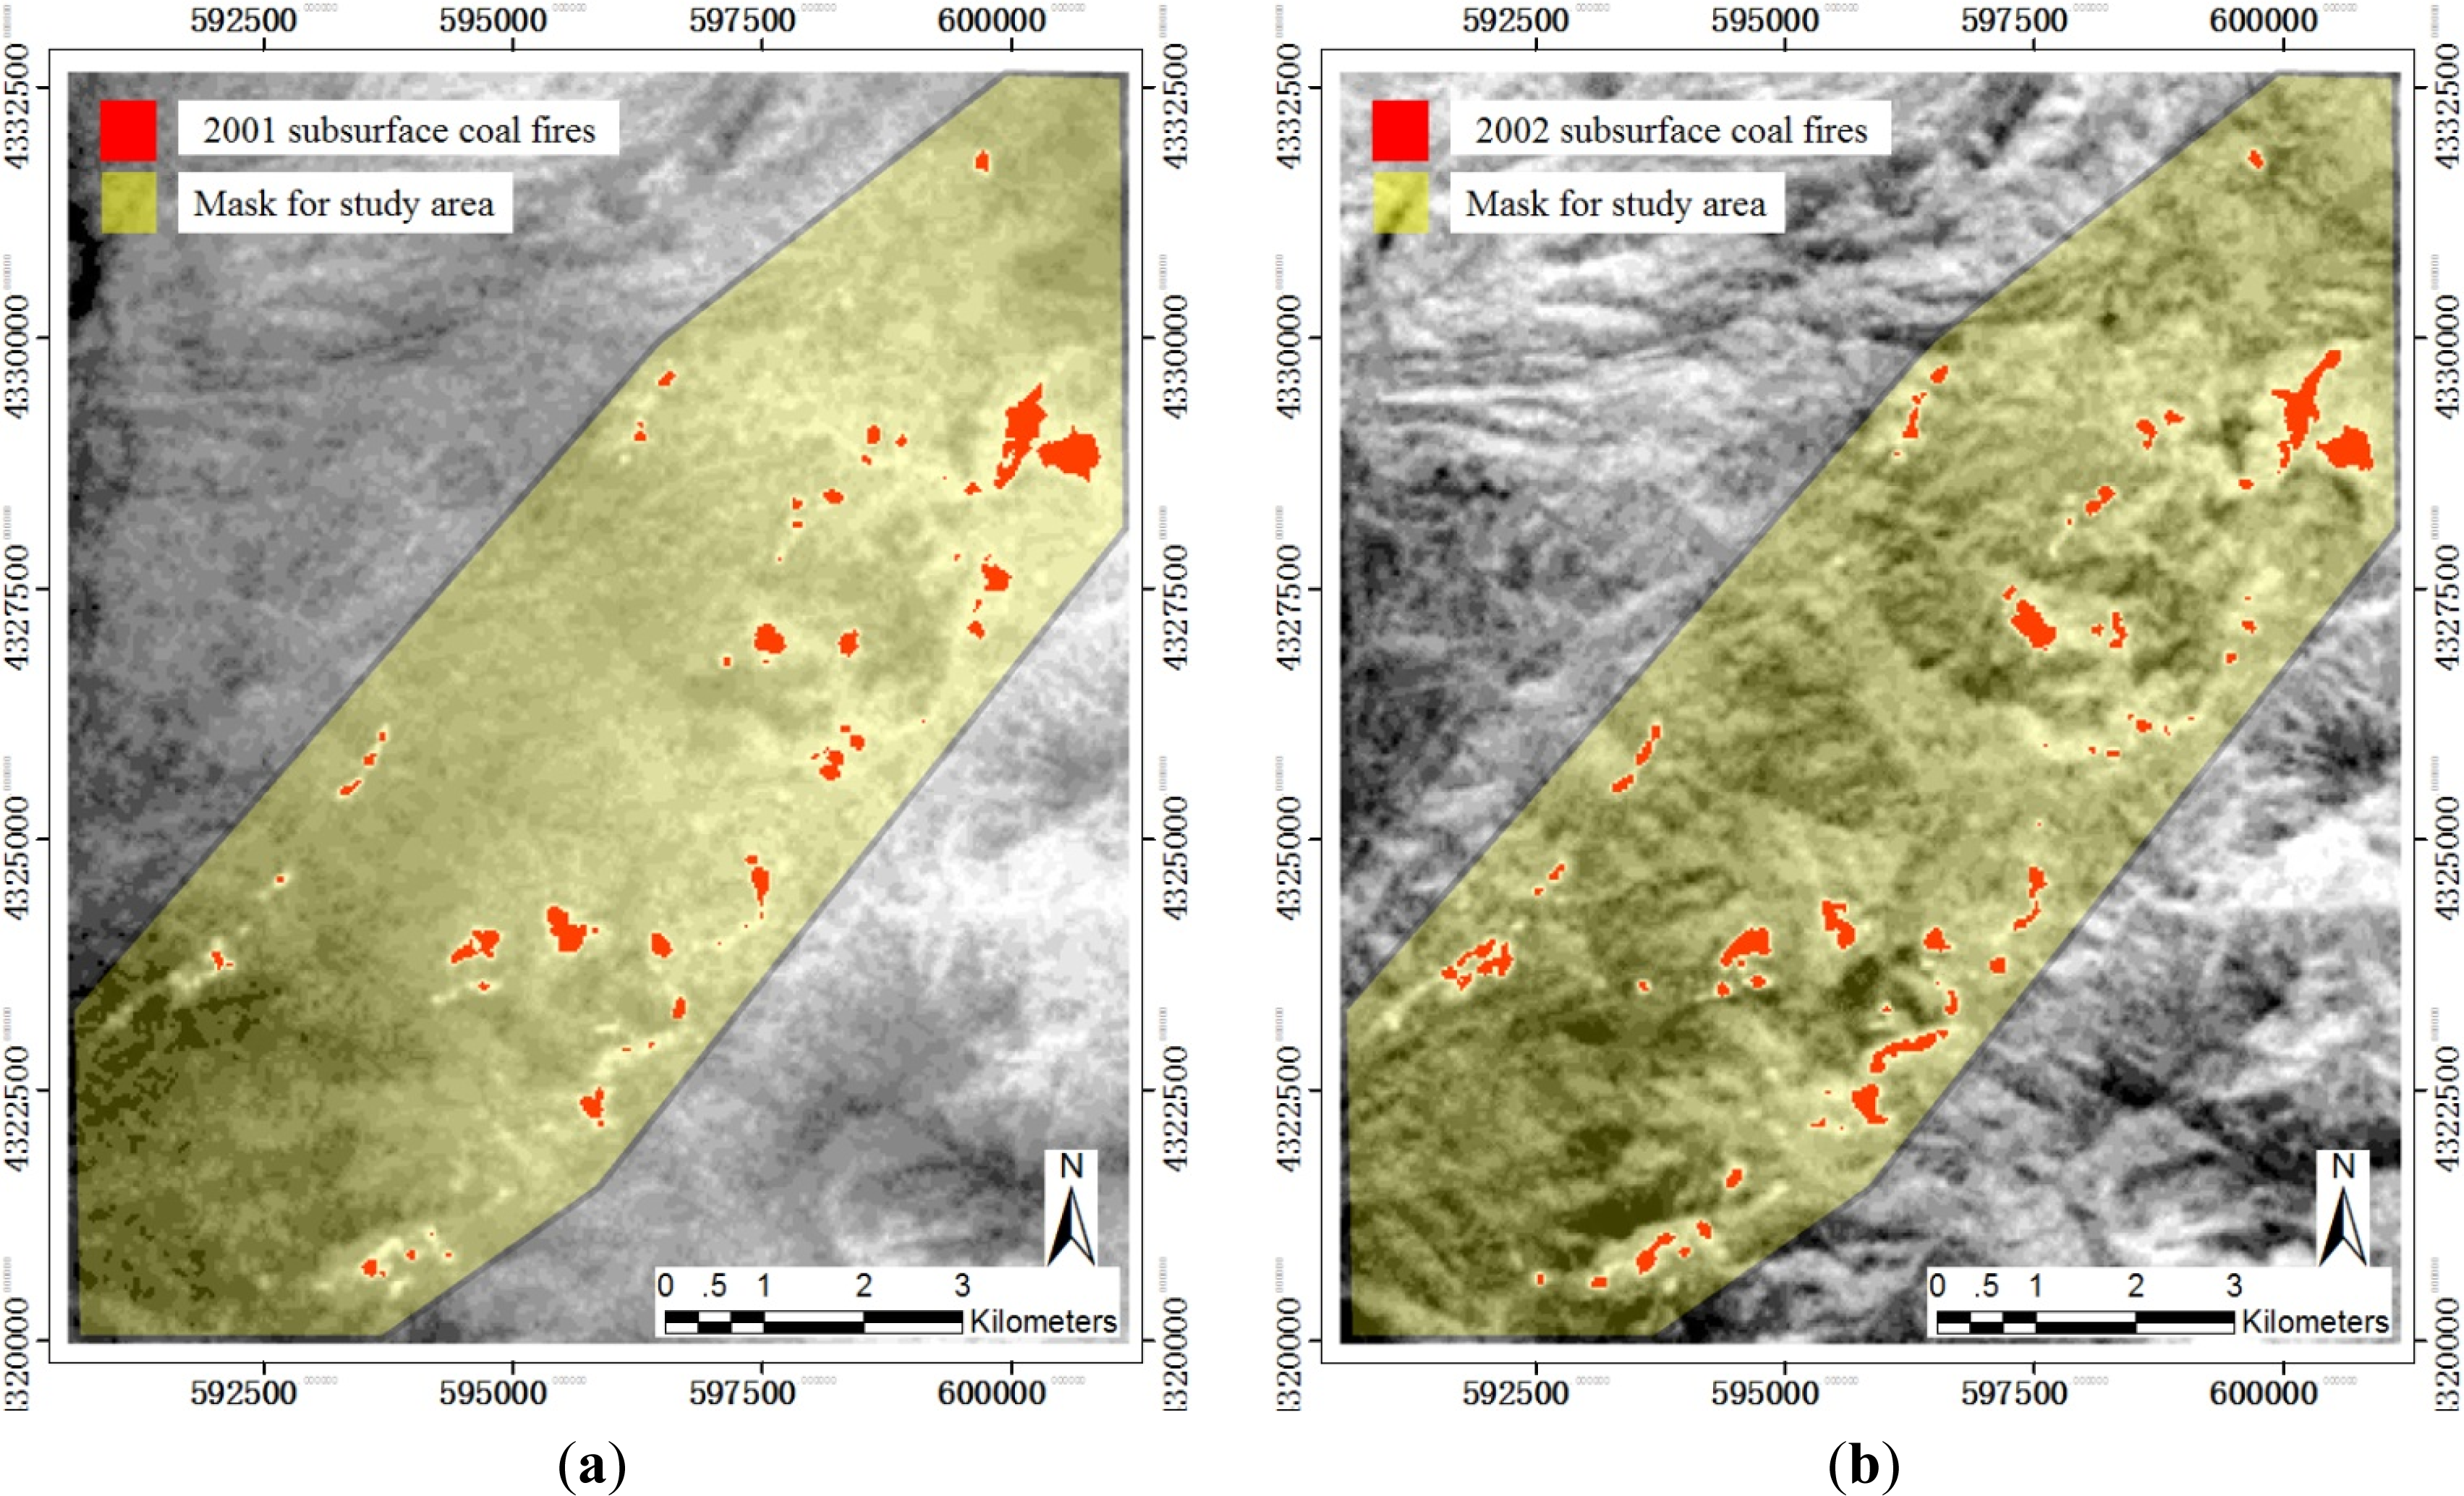
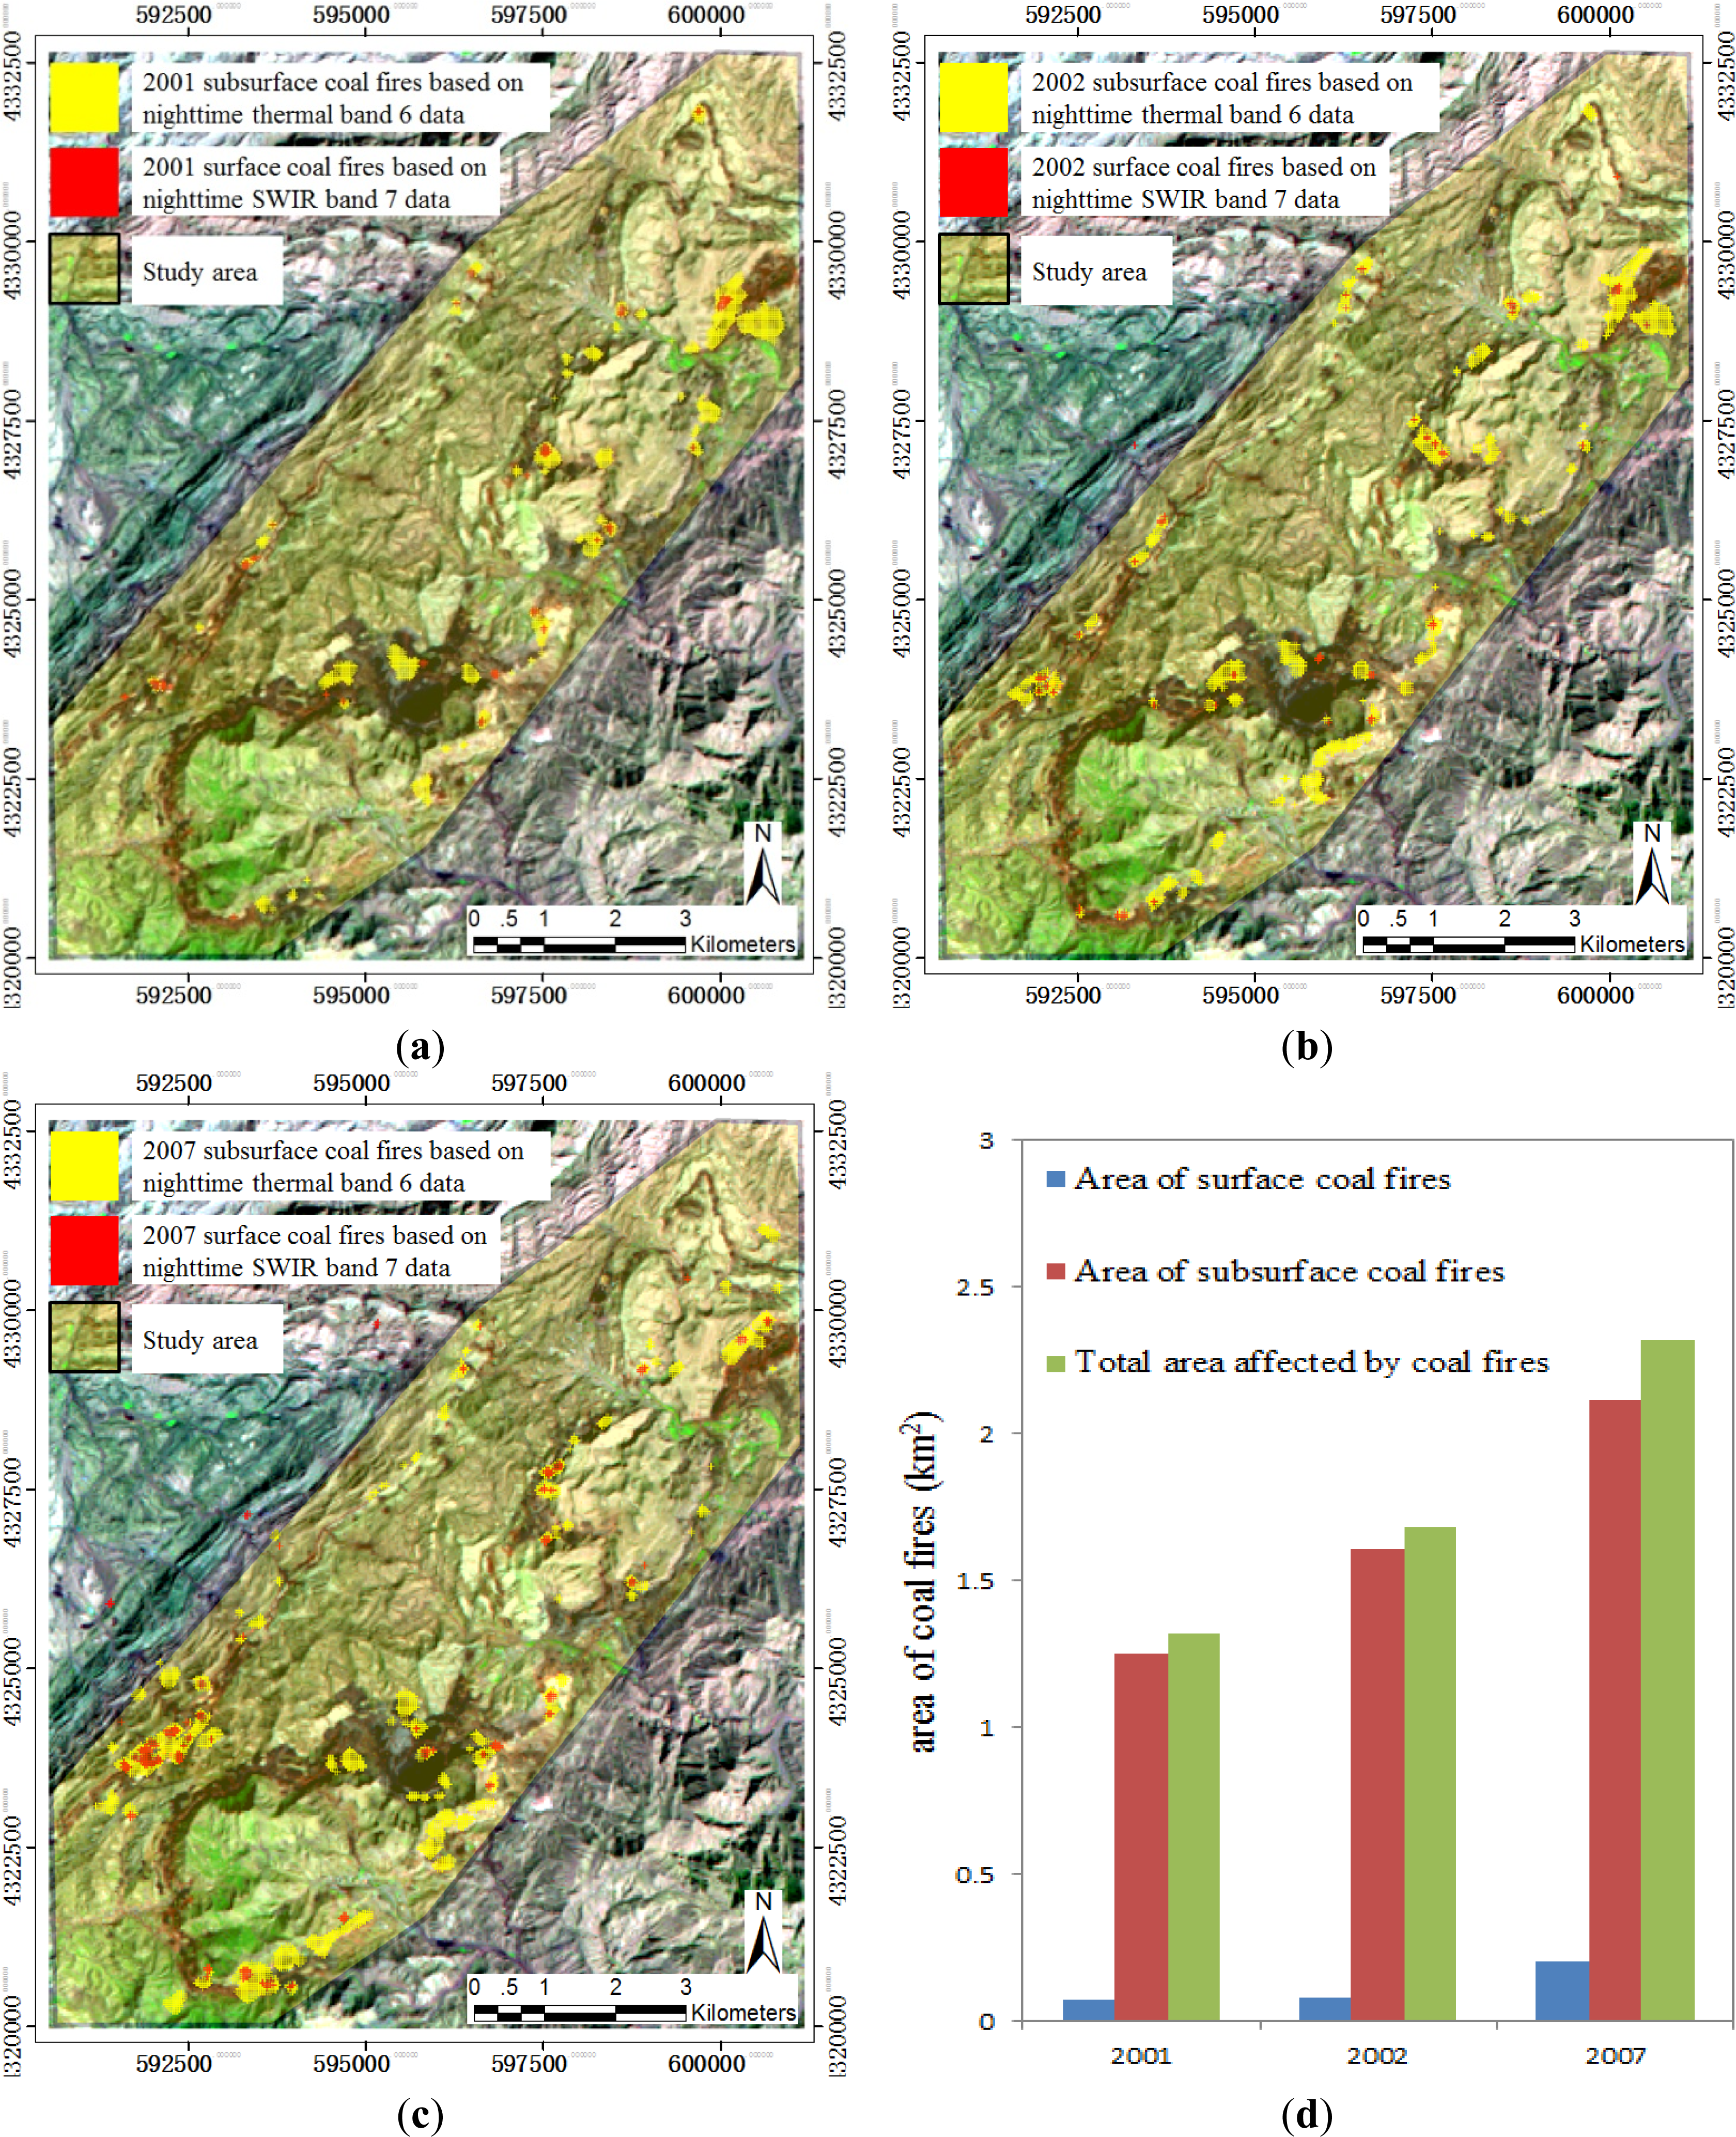
5.1. Results 1: Subsurface Coal Fire Dynamics Based on ETM+ Thermal Band 6 Data
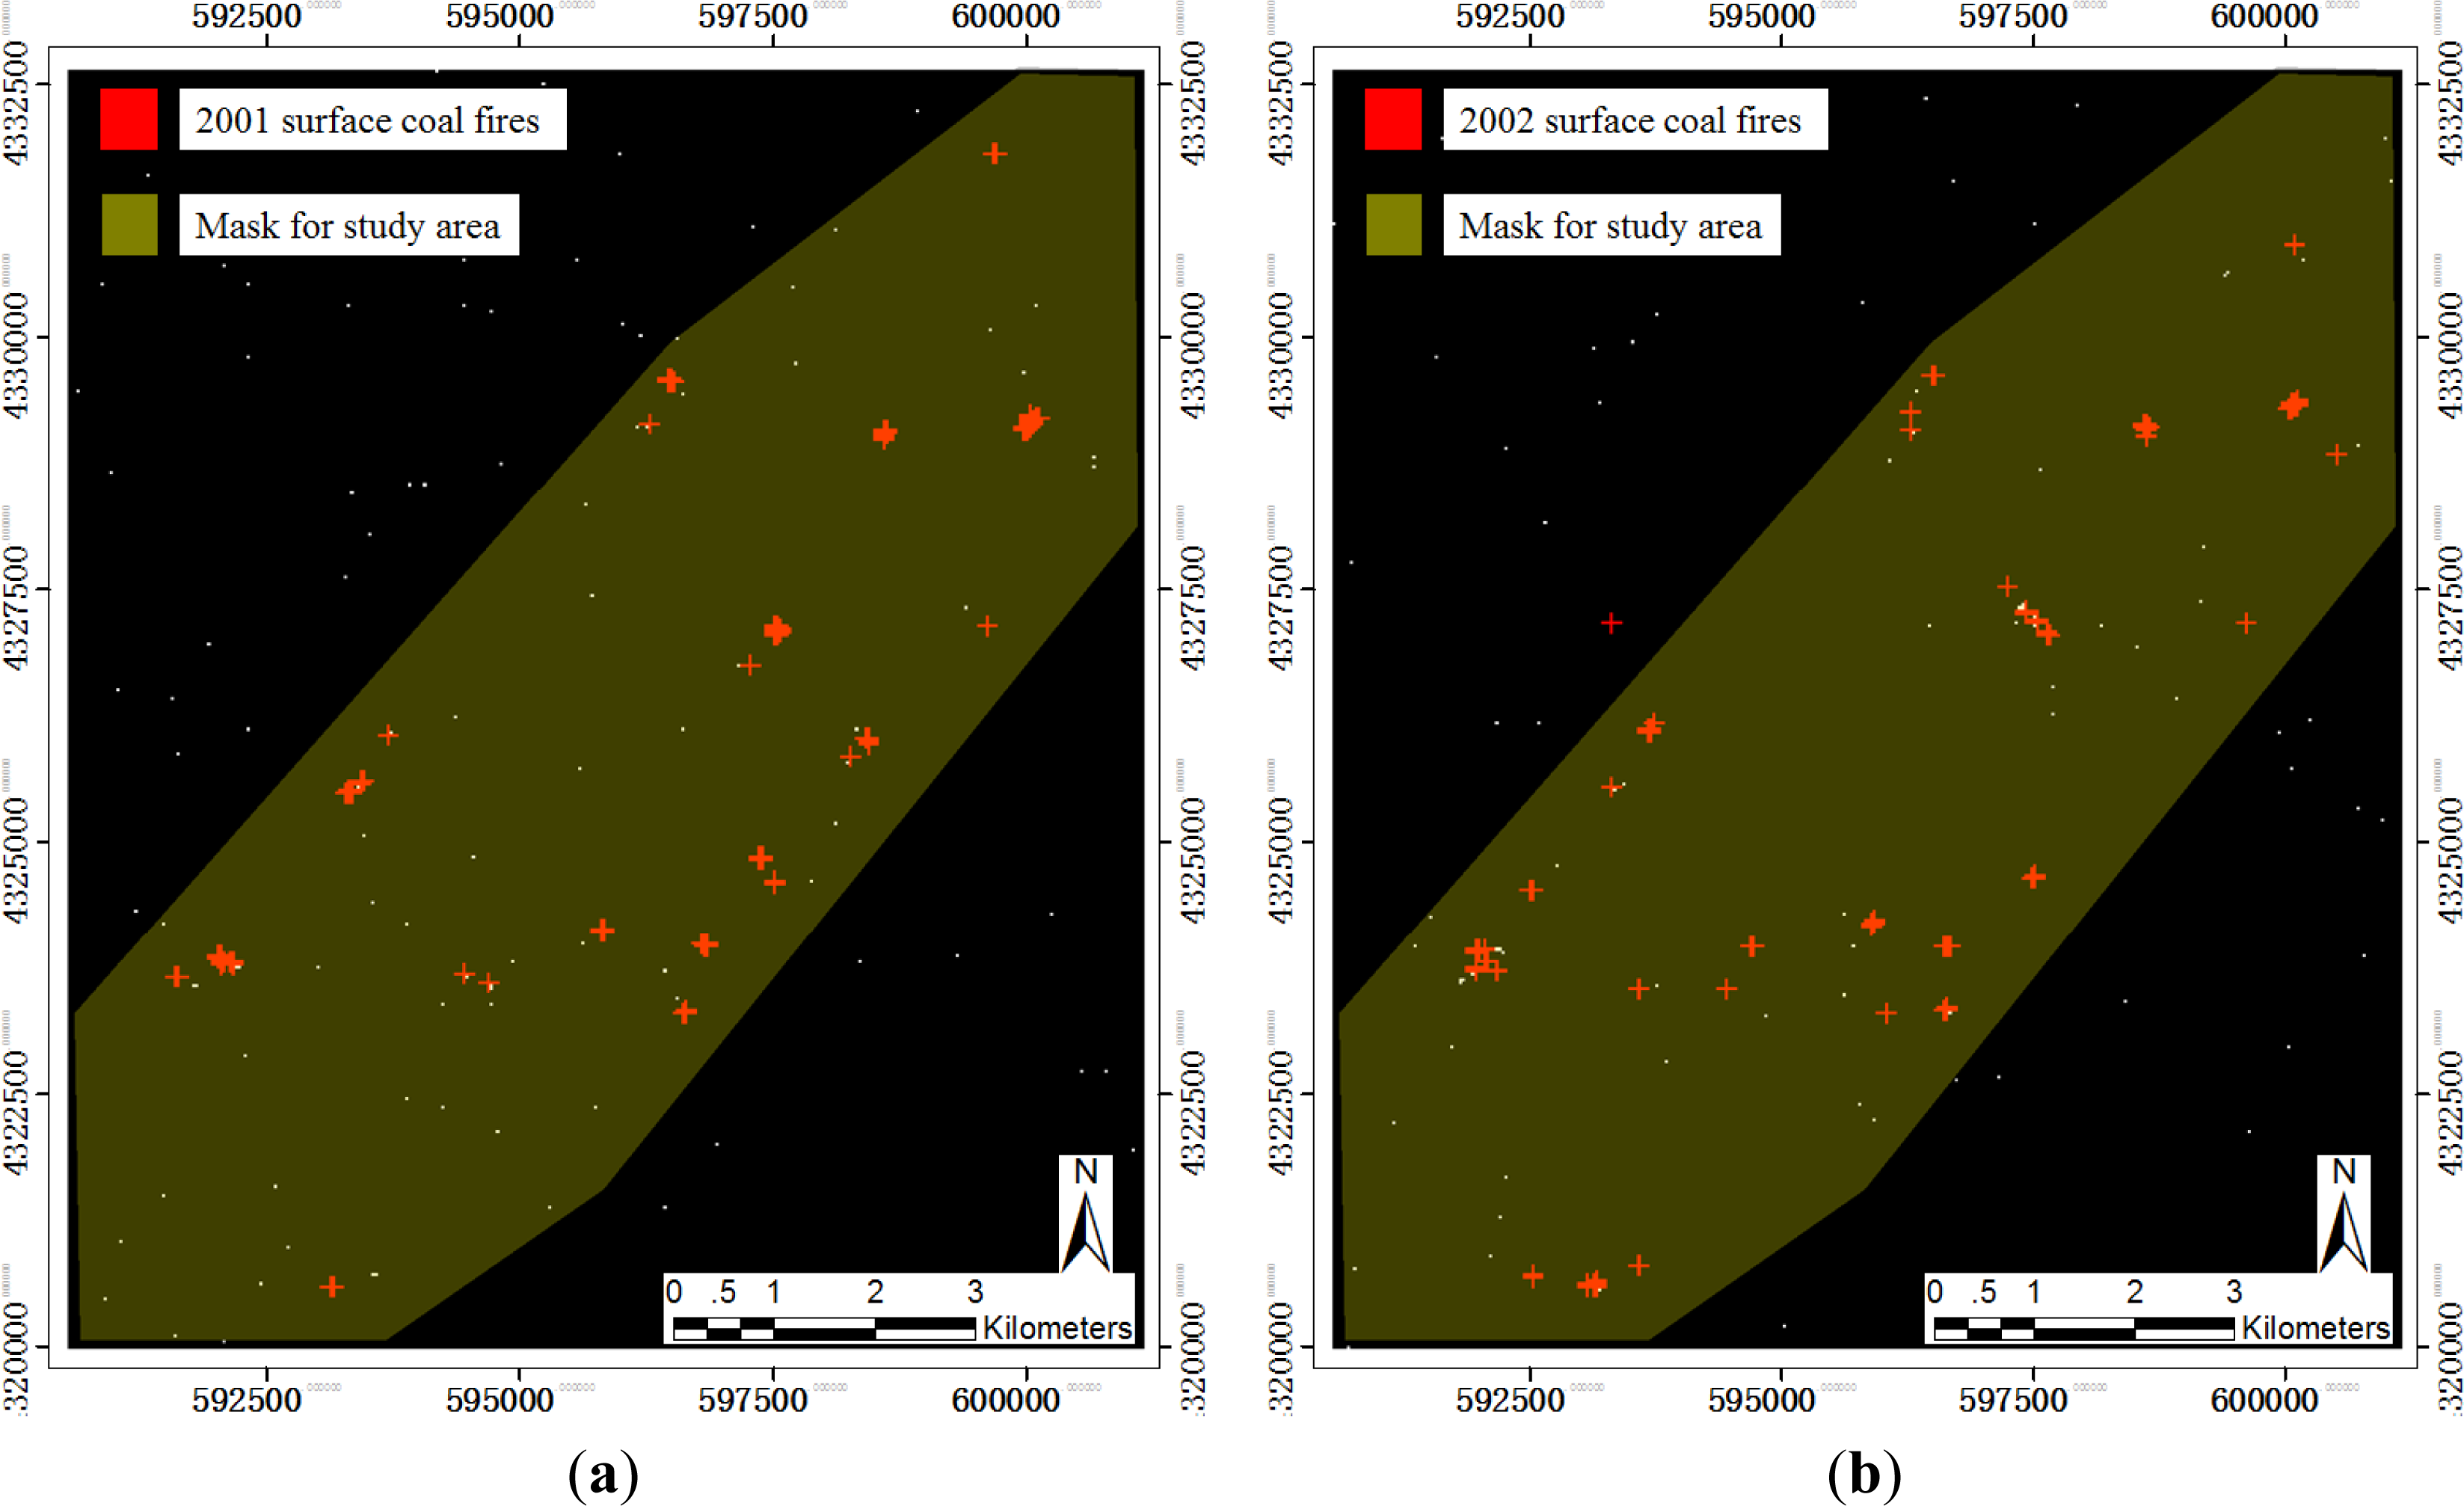
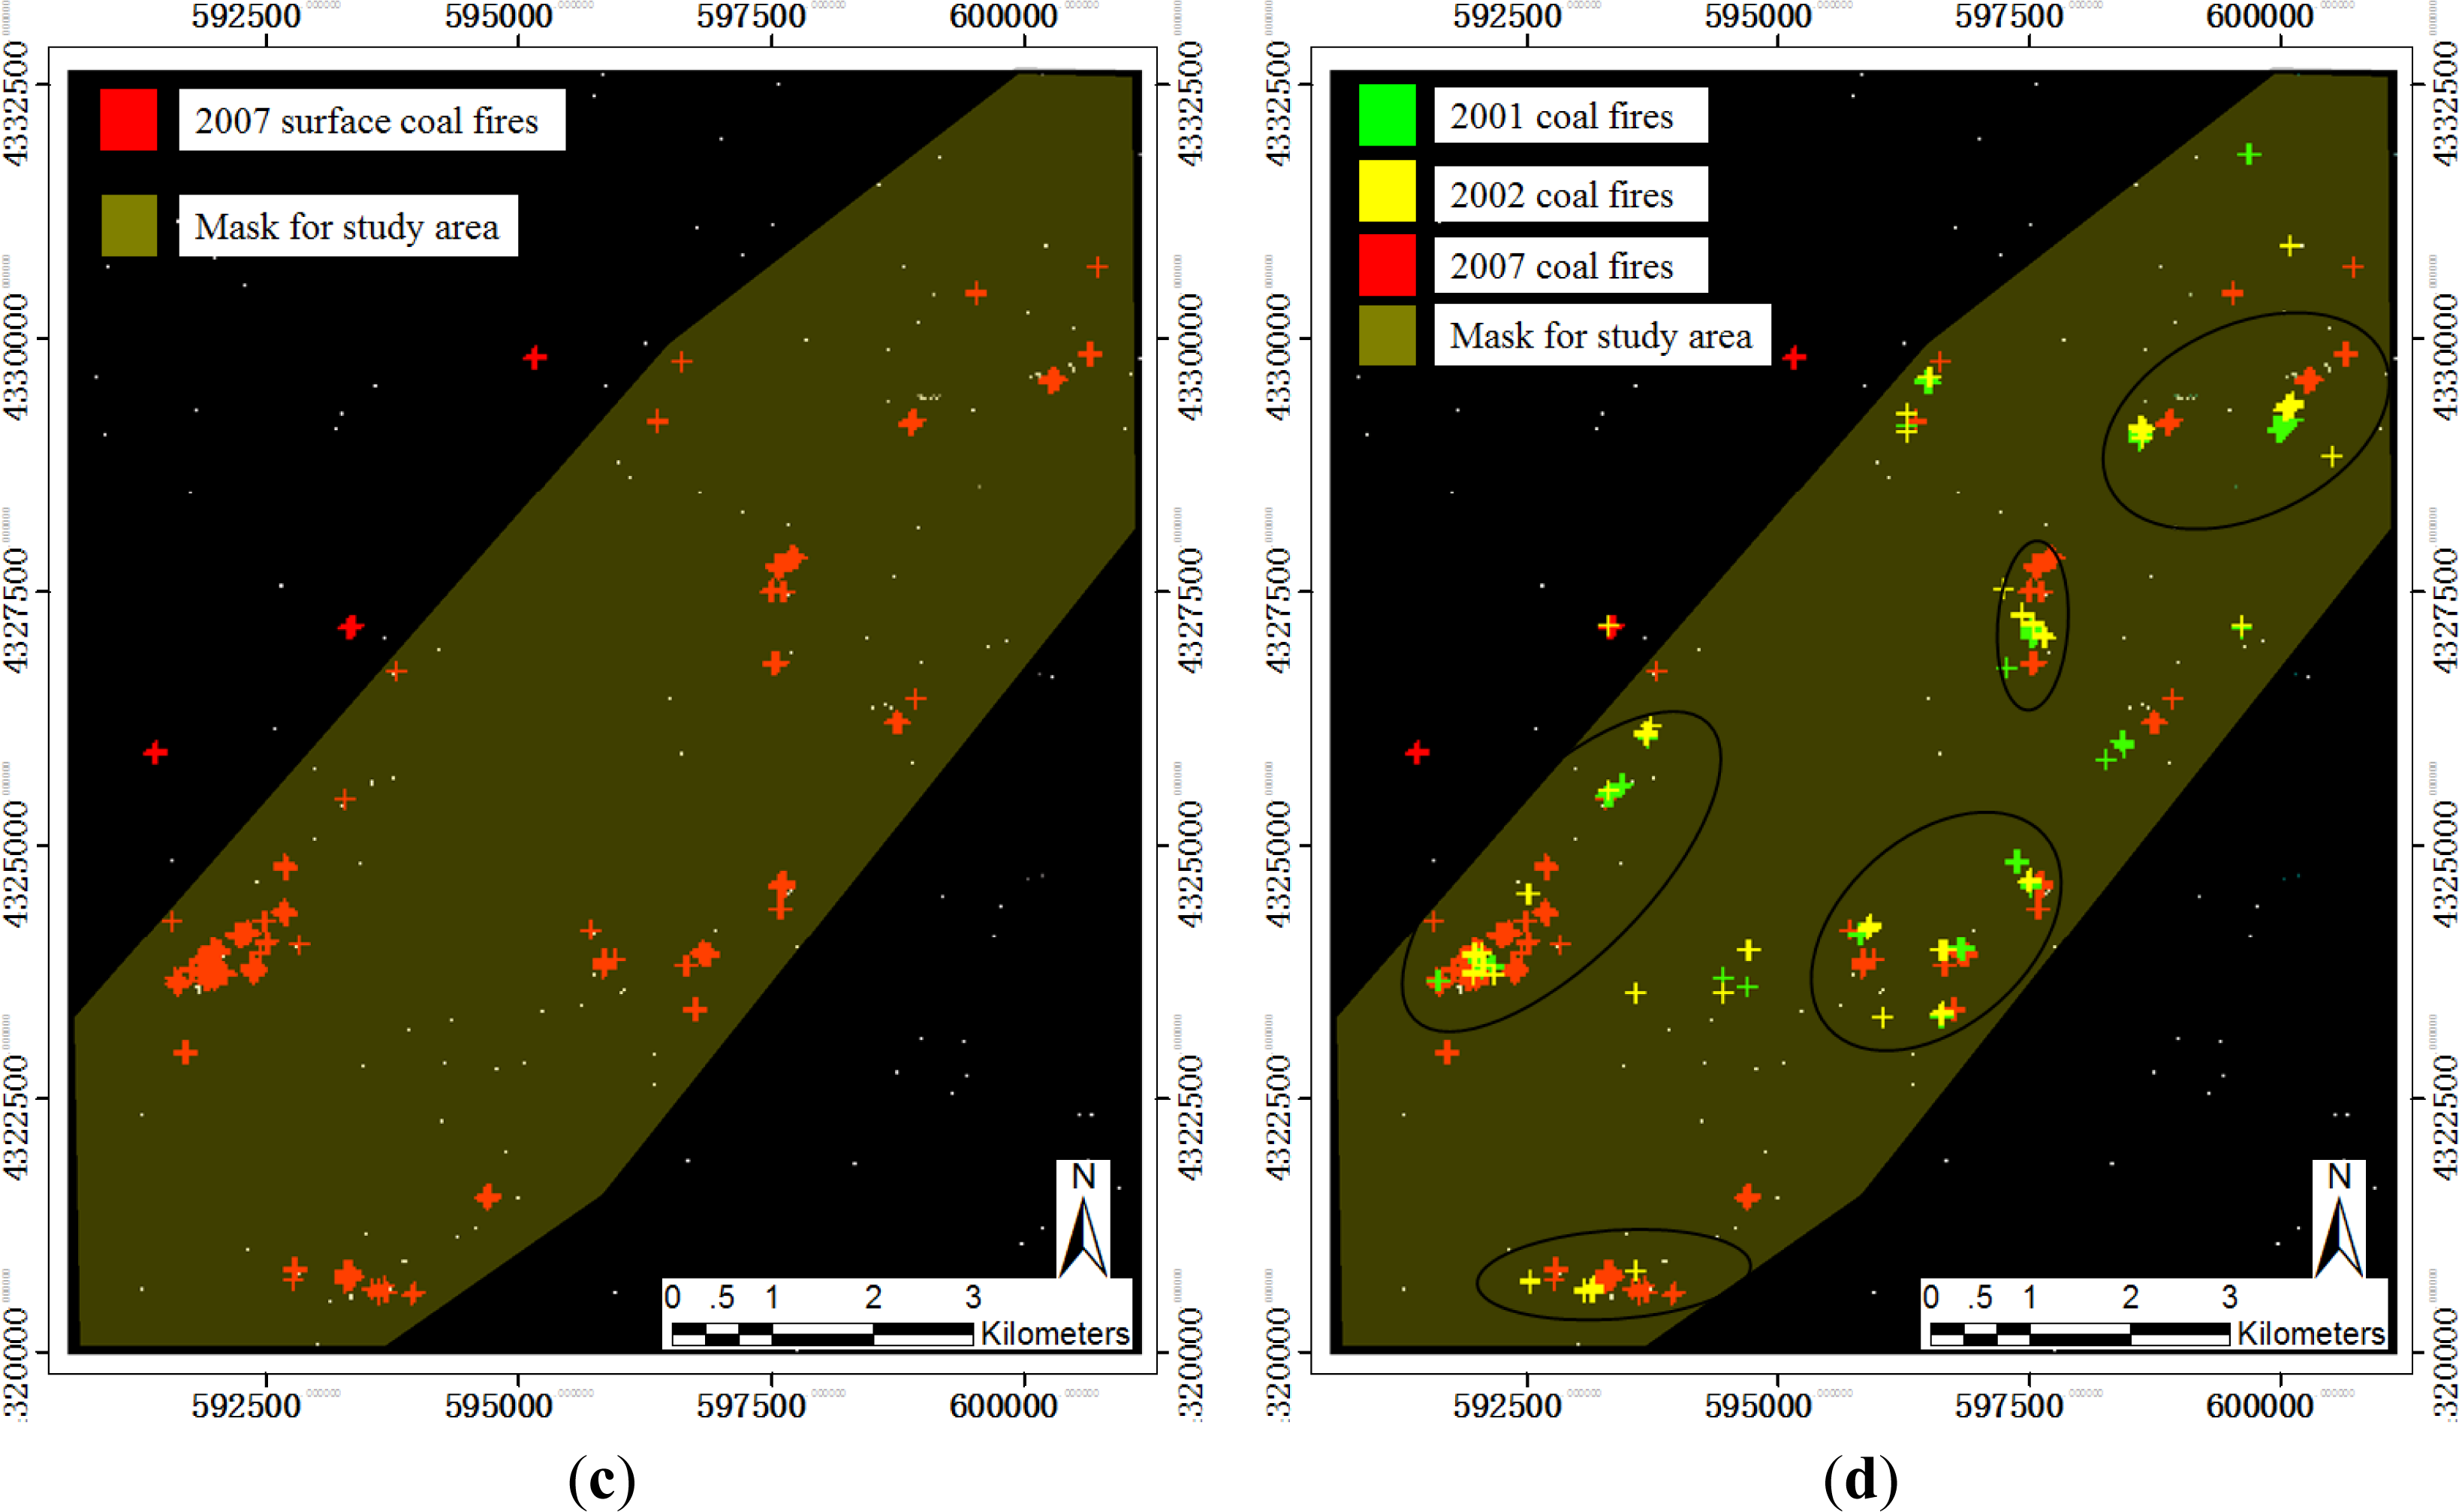
5.2. Results 2: Surface Coal Fire Dynamics Based on ETM+ SWIR Band 7 Data
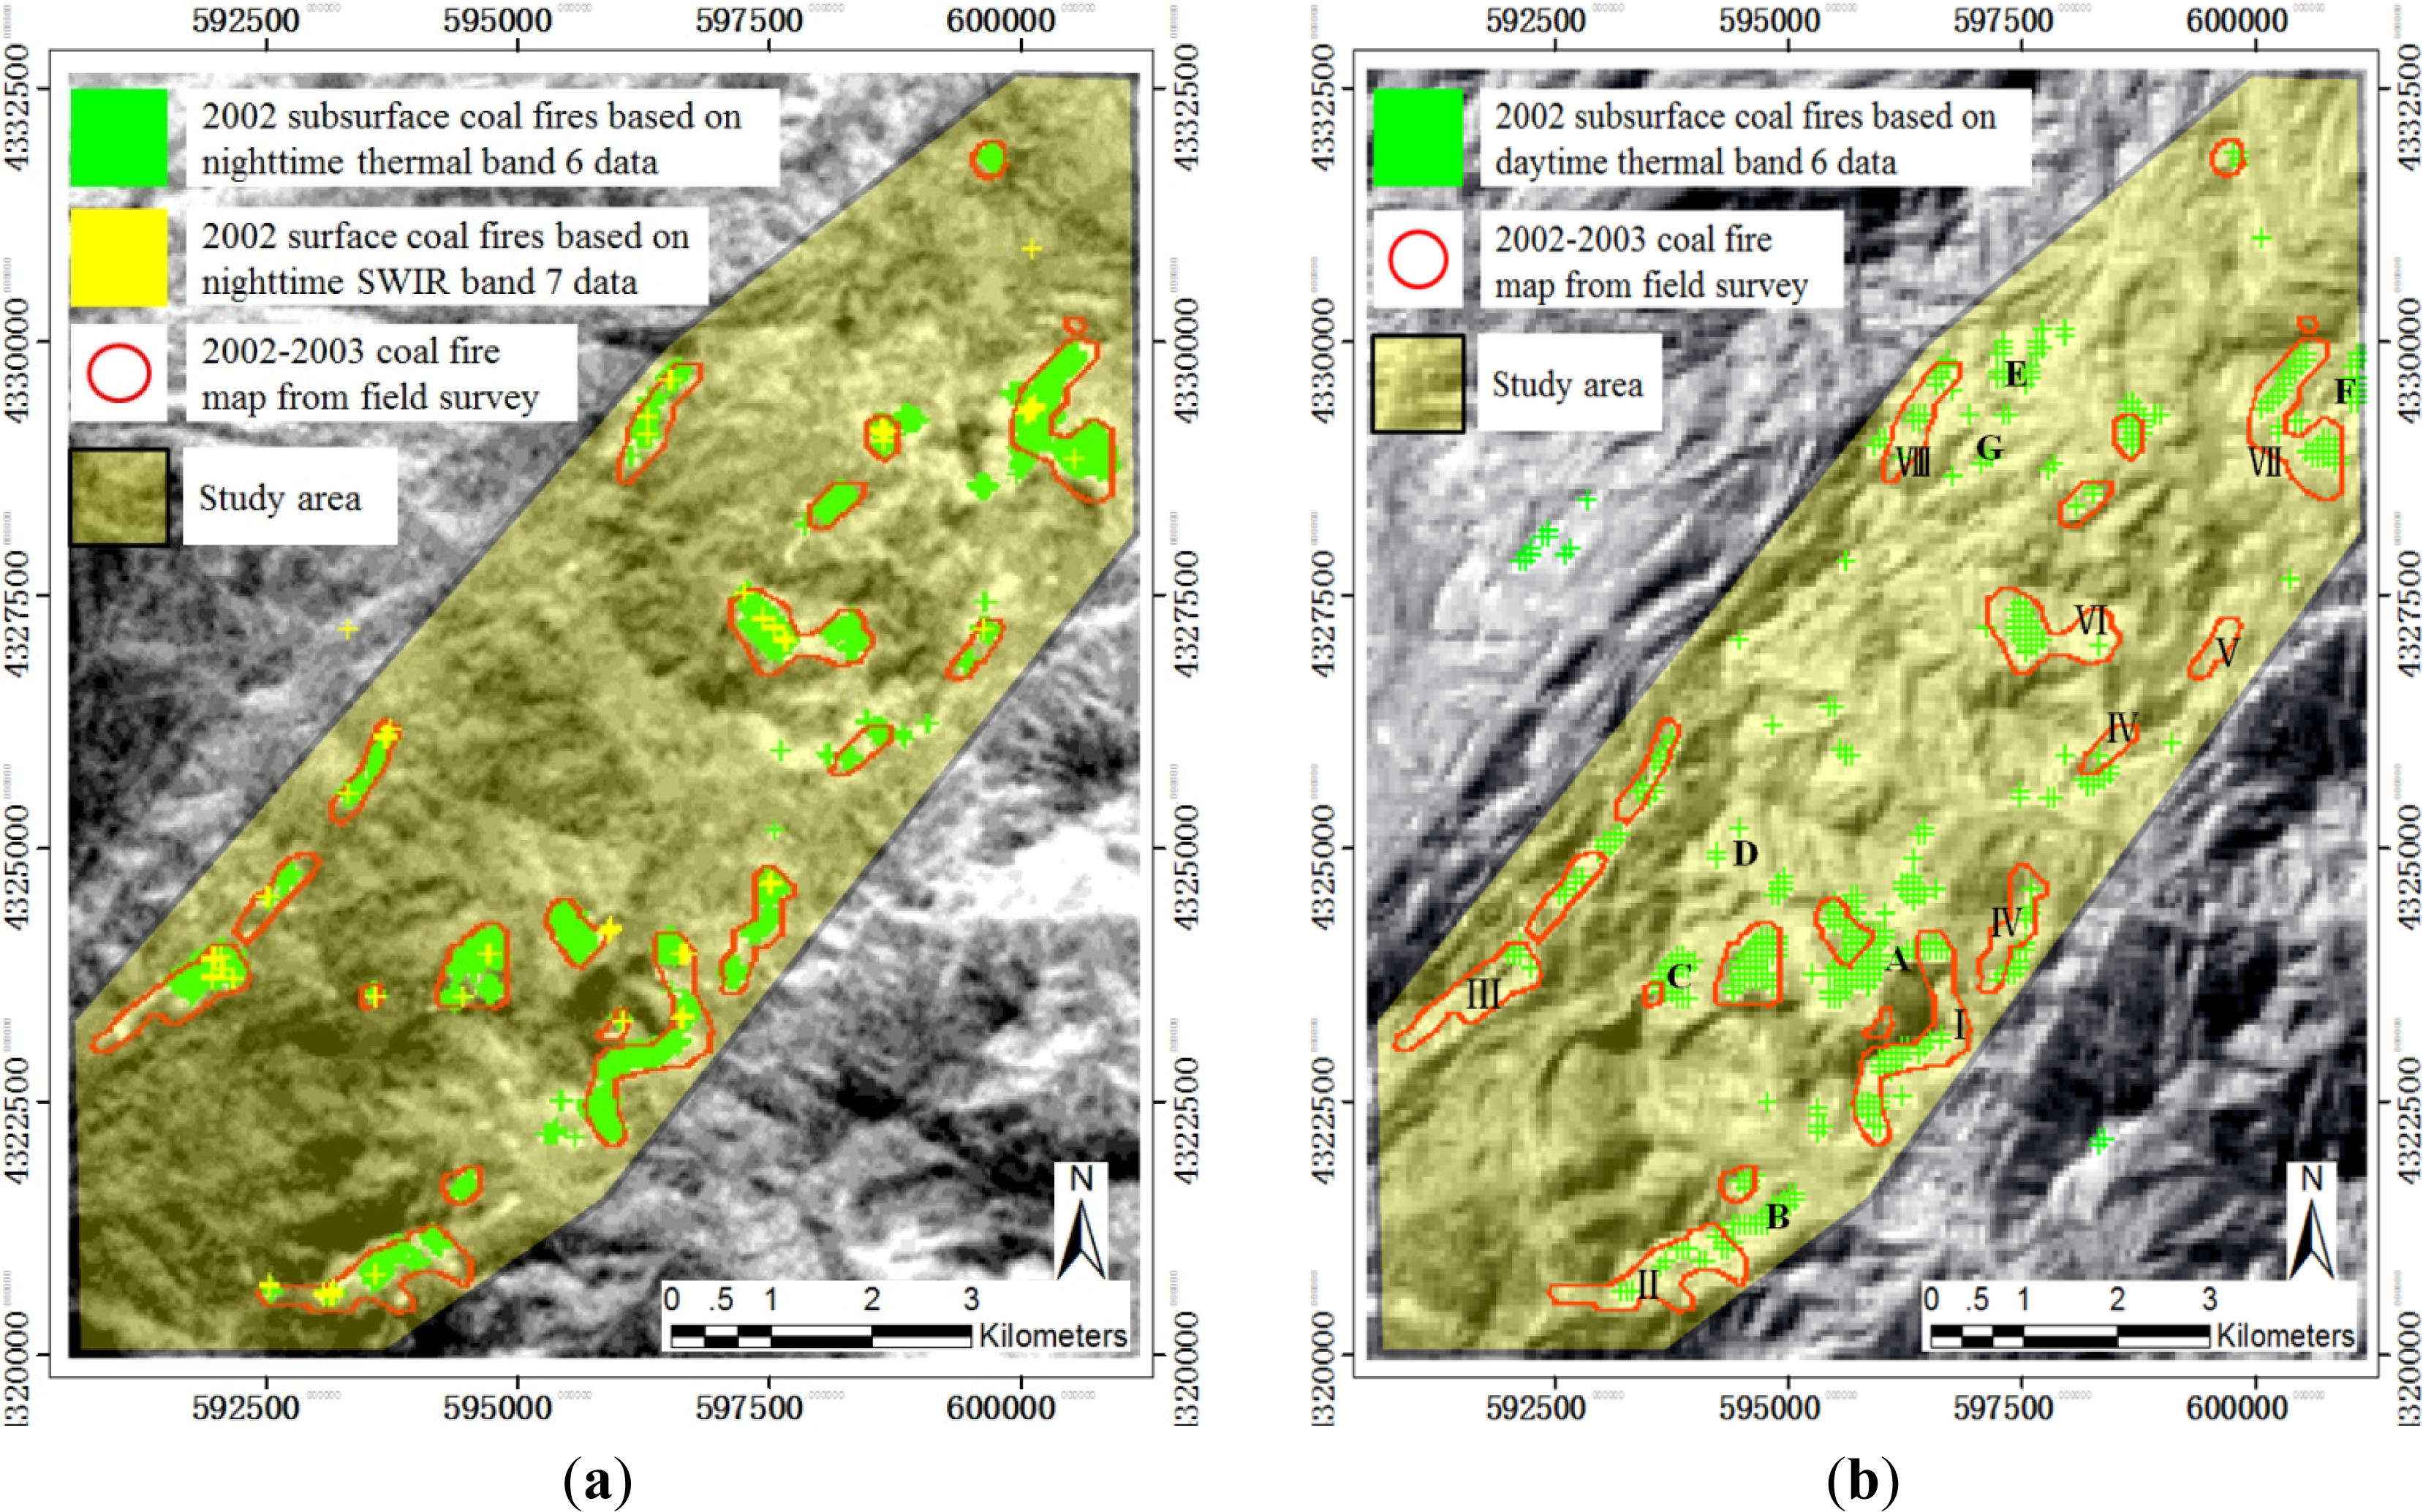
5.3. Validation of the Coal Fires Based on the Nighttime Series of Multi-Temporal ETM+ Data
5.4. Comparative Analysis of the Results 1 and the Results 2
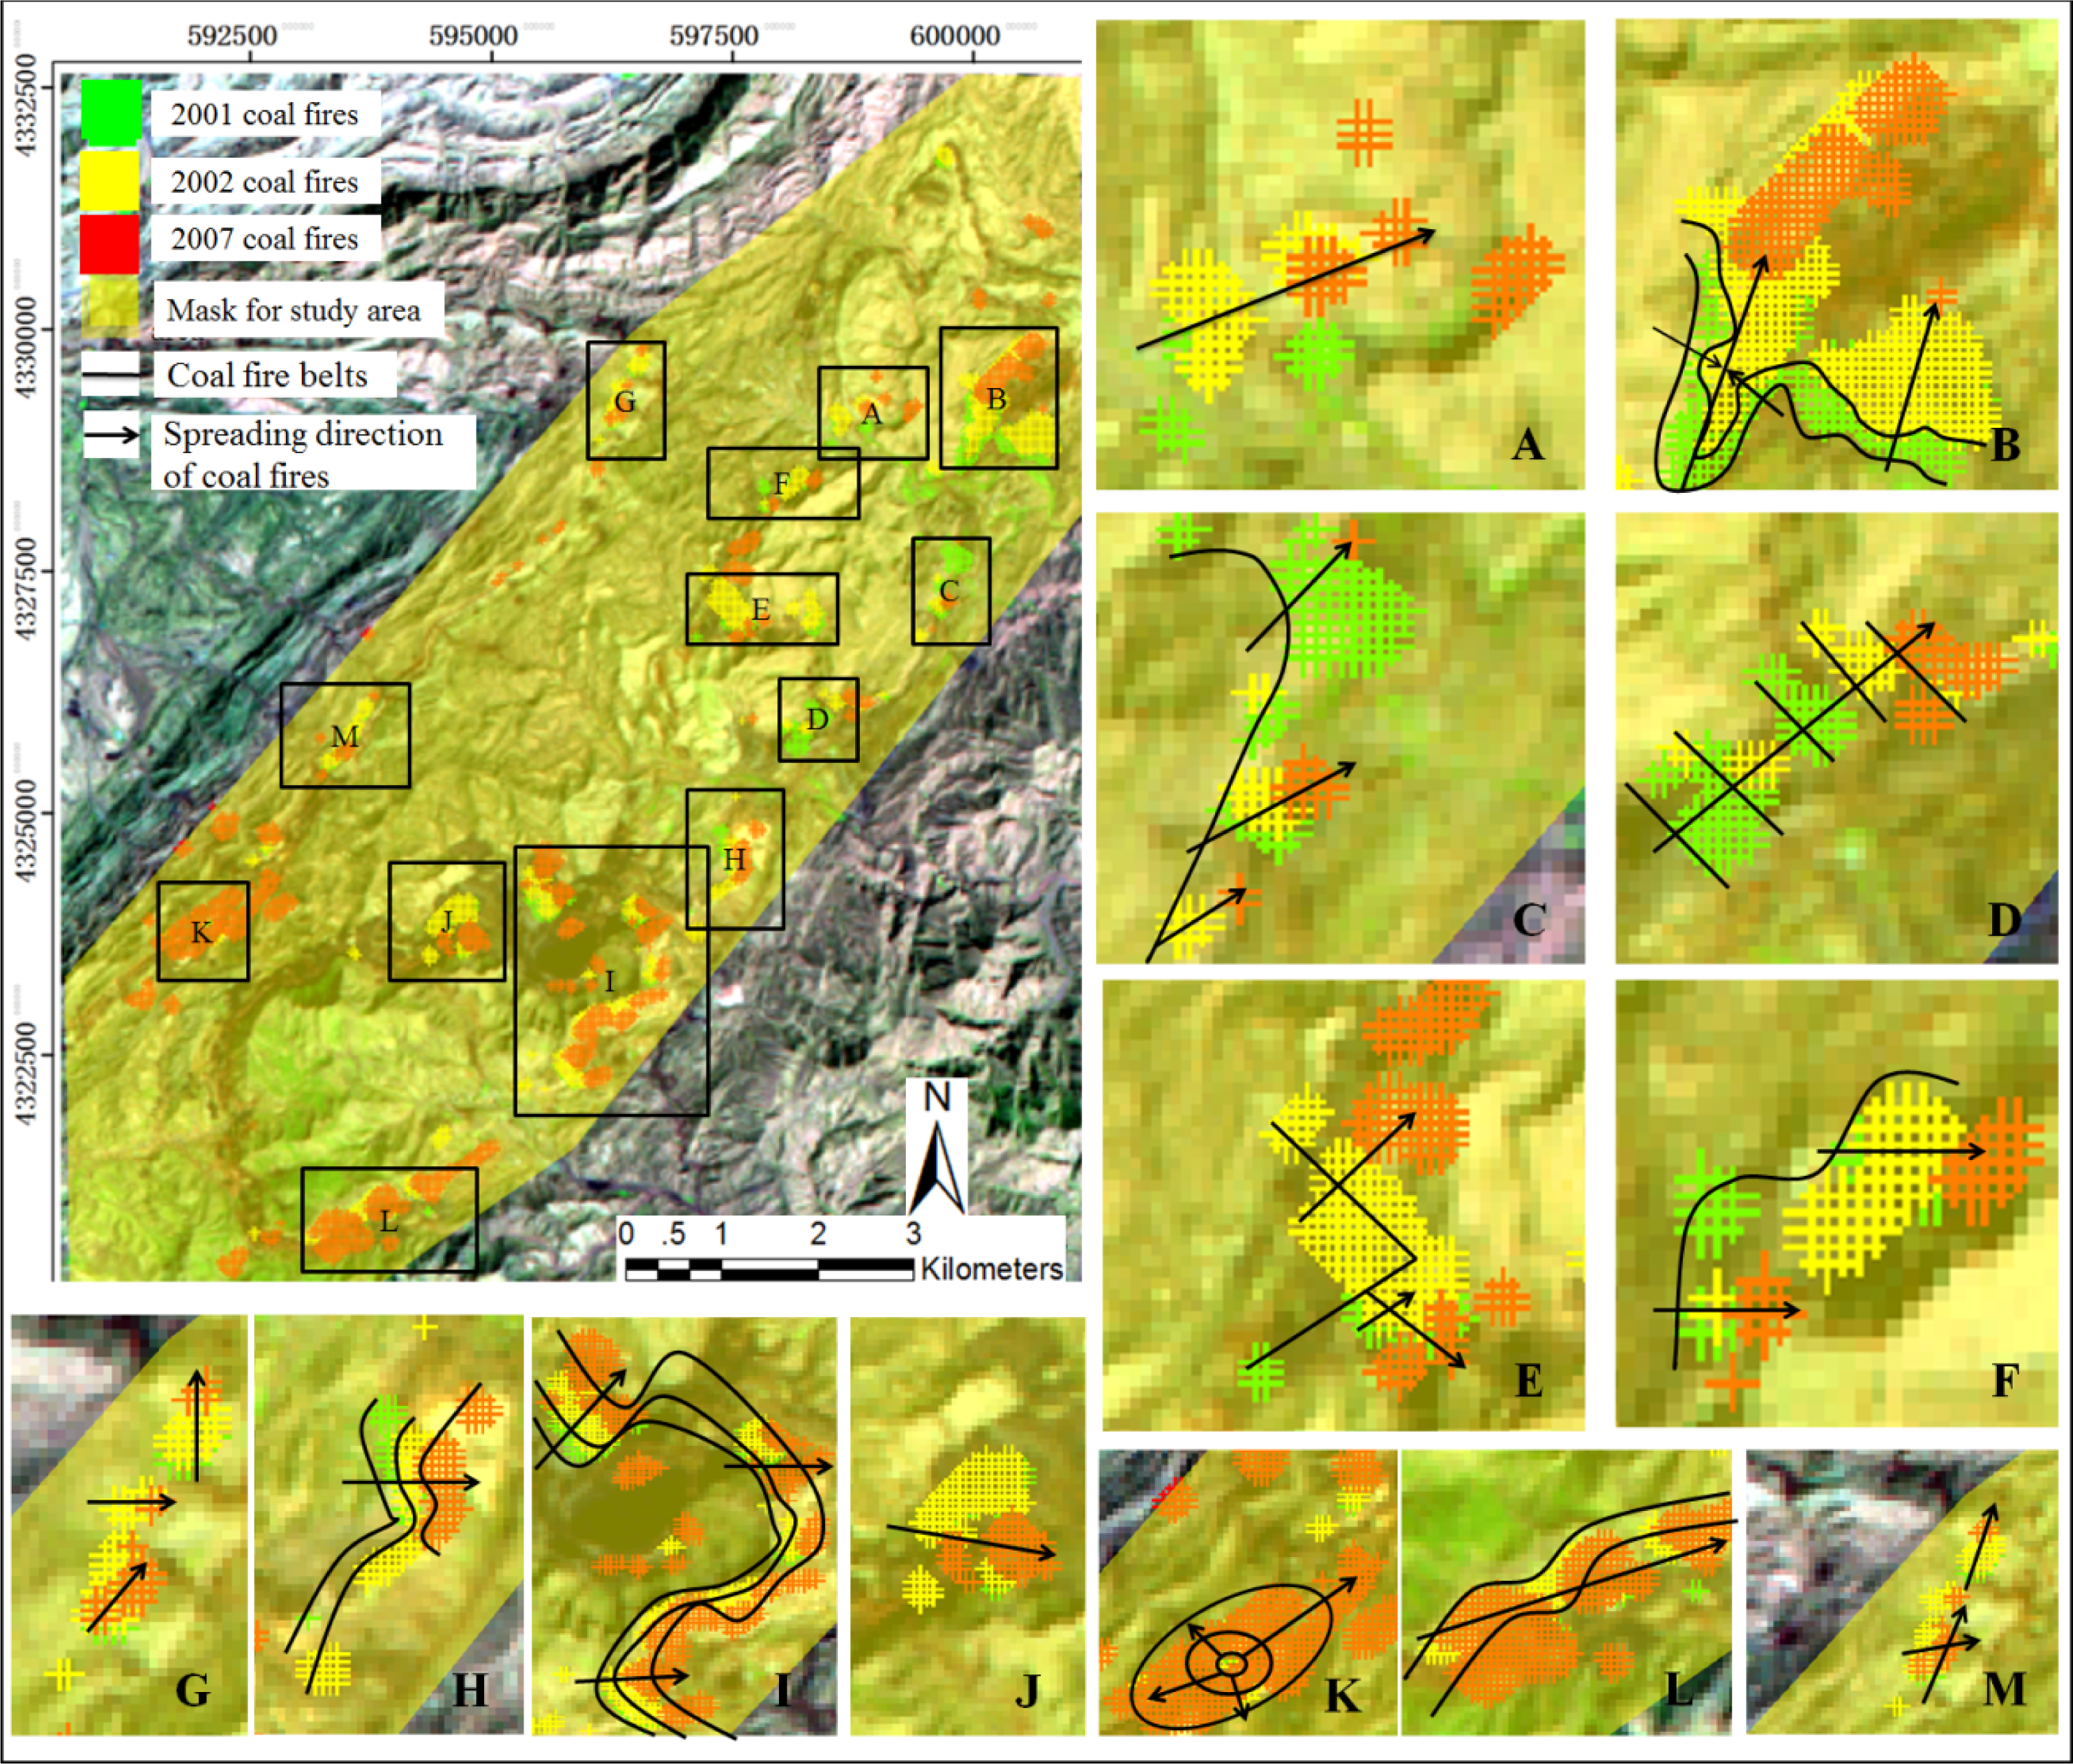
5.5. Delineating the Spreading Direction of Coal Fires Based on the Results 1 and Results 2
6. Conclusions
Acknowledgments
Author Contributions
Conflicts of Interest
References
- Banerjee, S.C. Spontaneous Combustion of Coal and Mine Fires; Balkema: Rotterdam, The Netherlands, 1985. [Google Scholar]
- Schmal, D.; Duyzer, J.H.; van Heuven, J.W. A model for the spontaneous heating of coal. Fuel 1985, 64, 963–972. [Google Scholar]
- Guan, H.Y.; van Genderen, J.L.; Schalke, H.J.W.G. Study and Survey on the Geological Hazards of Coal Fire in Northern China. Proceedings of the 30th International Geological Congress Abstract, Beijing, China, 4–14 August 1996; p. 458.
- Peng, W.X.; van Genderen, J.L.; Kang, G.F.; Guan, H.Y.; Tan, Y.J. Estimating the depth of underground coal fires using data integration techniques. Terra Nova 1997, 9, 180–183. [Google Scholar]
- Finkelman, R.B. Potential health impacts of burning coal beds and waste banks. Int. J. Coal Geol 2004, 59, 19–24. [Google Scholar]
- Zhang, J.; Wagner, W.; Prakash, A.; Mehl, H.; Voigt, S. Detecting coal fires using remote sensing techniques. Int. J. Remote Sens 2004, 25, 3193–3220. [Google Scholar]
- Gangopadhyay, P. Coalfire Detection and Monitoring in Wuda, North China: A Multi-Spectral and Multi-sensor TIR Approach. International Institute for Geo-Information Science and Earth Observation (ITC), Enschede, The Netherlands, 2003. [Google Scholar]
- Zhou, L.; Zhang, D.; Wang, J.; Huang, Z.; Pan, D. Mapping Land subsidence related to underground coal fires in the Wuda coalfield (Northern China) using a small stack of ALOS PALSAR differential interferograms. Remote Sens 2013, 5, 1152–1176. [Google Scholar]
- Van Genderen, J.L.; Cassells, C. The Synergistic use of remote Sensing data for the detection of Underground Coal fires. Int. Arch. Phogramm. Remote Sens. Spat. Inf. Sci 1996, 31, 9–19. [Google Scholar]
- Chen, Y.; Li, J.; Yang, B.; Shi, P.; Zhang, S. Detection of coal fire location and change based on multi-temporal thermal remotely sensed data and field measurements. Int. J. Remote Sens 2007, 28, 3173–3179. [Google Scholar]
- Rosema, A.; Guan, H.Y.; Veld, H.; Vekerdy, Z.; Ten Katen, A.; Prakash, A. Manual of Coal Fire Detection and Monitoring; Report of the Project: Development and Implementation of a Coal Fire Monitoring and Fighting System in China; Netherlands Institute of Applied Geoscience: Utrecht, The Netherlands, 1999; p. 245. [Google Scholar]
- Künzer, C.; Zhang, J.; Voigt, S.; Center, G.R.S.D. Set up of a Spectral Database for Unmixing Approaches in Mining Environments in North-Central China: Demarcating Coal Fire Risk Areas. In EARSeL Workshop on Imaging Spectroscopy, 3rd ed; EARSeL Secretariat: Hannover, Germany, 2003; pp. 344–348. [Google Scholar]
- Zhang, X.; Kroonenberg, S.B.; de Boer, C.B. Dating of coal fires in Xinjiang, north-west China. Terra Nova 2004, 16, 68–74. [Google Scholar]
- Dai, S.; Ren, D.; Tang, Y.; Shao, L.; Li, S. Distribution, isotopic variation and origin of sulfur in coals in the Wuda coalfield, Inner Mongolia, China. Int. J. Coal Geol 2002, 51, 237–250. [Google Scholar]
- Slavecki, R.J. Detection and Location of Subsurface Coal Fires. Proceedings of the Third Symposium on Remote Sensing of Environment, Ann Arbor, MI, USA, 14–16 October 1964; pp. 537–547.
- Sinha, P.R. Mine fires in Indian coalfields. Energy 1986, 11, 1147–1154. [Google Scholar]
- Cracknell, A.P.; Mansor, S.B. Detection of sub-surface coal fires using Landsat TM data. Int. Arch. Phogramm. Remote Sens. Spat. Inf. Sci 1993, 29, 4. [Google Scholar]
- Prakash, A.; Gupta, R.P. Surface fires in Jharia coalfield, India-their distribution and estimation of area and temperature from TM data. Int. J. Remote Sens 1999, 20, 1935–1946. [Google Scholar]
- Kuenzer, C.; Zhang, J.; Li, J.; Voigt, S.; Mehl, H.; Wagner, W. Detecting unknown coal fires: Synergy of automated coal fire risk area delineation and improved thermal anomaly extraction. Int. J. Remote Sens 2007, 28, 4561–4585. [Google Scholar]
- Greene, G.W.; Moxham, R.M. Aerial Infrared Surveys and Borehole Temperature Measurements of Coal Mine Fires in Pennsylvania. Proceedings of the 6th Symposium on Remote Sensing of Envrionment (ERIM), University of Michigan, MI, USA, 13–16 October 1969; pp. 517–525.
- Guan, H.Y. Application of remote sensing techniques in coal geology. Acta Geol. Sinica 1989, 2, 253–269. [Google Scholar]
- Rabchevsky, G.A. Determination from Available Satellite and Aircraft Imagery of the Applicatility of Remote Sensing Techniques to the Detection of Fires Burning in Abandoned Coal Mines and Unmined Coal Deposits Located in North Central Wyoming and Southern Montana; US Department of Interior, Bureau of Mines, Prepared by Allied Research Associates Inc.: Boston, MA, USA, 1972; p. 21. [Google Scholar]
- Ellyett, C.D.; Fleming, A.W. Thermal infrared imagery of the burning mountain coal fire. Remote Sens. Environ 1974, 3, 79–86. [Google Scholar]
- Tan, K.; Zhou, R.; Wan, Y.; Li, X. Remote sensing monitoring method of hyperspectral and high-resolution for underground coal bed combustion. J. Infrared Millim. Waves 2007, 26, 349–352. [Google Scholar]
- Zhang, X. Coal Fires in Northwest China, Detection, Monitoring, and Prediction Using Remote Sensing Data. International Institute for Geo-Information Science and Earth Observation (ITC), Enschede, The Netherlands, 1998. [Google Scholar]
- Künzer, C. Demarcating Coal Fire Risk Areas Based on Spectral Test Sequences and Partial Unmixing Using Multi Sensor Remote Sensing Data. Technical University Vienna, Vienna, Austria, 2005. [Google Scholar]
- Zhang, J. Spatial and Statistical Analysis of Thermal Satellite Imagery for Extraction of Coal Fire Related Anomalies. Technical University Vienna, Vienna, Austria, 2004. [Google Scholar]
- Tetzlaff, A. Coal Fire Quantification Using ASTER, ETM and BIRD Satellite Instrument Data. Ludwig Maximilian University of Munich, München, Germany, 22 December 2004. [Google Scholar]
- Yang, B.; Chen, Y.; Li, J.; Gong, A.; Kuenzer, C.; Zhang, J. Simple Normalization of Multi-Temporal Thermal IR Data and Applied Research, on the Monitoring of Typical Coal Fires in Northern China. Proceedings of the 2005 IEEE International Geoscience and Remote Sensing Symposium, Seoul, Korea, 25–29 July 2005.
- Gangopadhyay, P.K.; Maathuis, B.; van Dijk, P. ASTER-derived emissivity and coal-fire related surface temperature anomaly: A case study in Wuda, north China. Int. J. Remote Sens 2005, 26, 5555–5571. [Google Scholar]
- Prakash, A.; Gupta, R.P.; Saraf, A.K. A Landsat TM based comparative study of surface and subsurface fires in the Jharia coalfield, India. Int. J. Remote Sens 1997, 18, 2463–2469. [Google Scholar]
- Prakash, A.; Vekerdy, Z. Design and implementation of a dedicated prototype GIS for coal fire investigations in North China. Int. J. Coal Geol 2004, 59, 107–119. [Google Scholar]
- Agarwal, R.; Singh, D.; Chauhan, D.; Singh, K. Detection of coal mine fires in the Jharia coal field using NOAA/AVHRR data. J. Geophys. Eng 2006, 3, 212–218. [Google Scholar]
- Bhattacharya, A.; Reddy, S. Underground and surface coal mine fire detection in India’s Jharia coal field using airborne thermal infrared data. Asian-Pac. Remote Sens. J 1994, 7, 59–73. [Google Scholar]
- Reddy, C.S.S.; Srivastav, S.K.; Bhattacharya, A. Application of thematic mapper short wavelength infrared data for the detection and monitoring of high temperature related geoenvironmental features. Int. J. Remote Sens 1993, 14, 3125–3132. [Google Scholar]
- Saraf, A.K.; Prakash, A.; Sengupta, S.; Gupta, R.P. Landsat-TM data for estimating ground temperature and depth of subsurface coal fire in the Jharia coalfield, India. Int. J. Remote Sens 1995, 16, 2111–2124. [Google Scholar]
- Gangopadhyay, P.K. Coalfires Related CO2 Emissions and Remote Sensing; International Institute for Geo-Information Science and Earth Observation (ITC): Enschede, The Netherlands, 2008. [Google Scholar]
- Zhang, X.; van Genderen, J.L.; Kroonenberg, S.B. A method to evaluate the capability of Landsat-5 TM band 6 data for sub-pixel coal fire detection. Int. J. Remote Sens 1997, 18, 3279–3288. [Google Scholar]
- Rothery, D.; Francis, P.; Wood, C. Volcano monitoring using short wavelength infrared data from satellites. J. Geophys. Res 1988, 93, 7993–8008. [Google Scholar]
- Storey, J.; Scaramuzza, P.; Schmidt, G.; Barsi, J. Landsat 7 Scan Line Corrector-Off Gap-Filled Product Development. Proceedings of Pecora 16 Global Priorities in Land Remote Sensing, Sioux Fall, SD, USA, 23–27 October 2005.
- Prakash, A.; Gens, R.; Vekerdy, Z. Monitoring coal fires using multi-temporal night-time thermal images in a coalfield in north-west China. Int. J. Remote Sens 1999, 20, 2883–2888. [Google Scholar]
- Markham, B.; Baker, J. EOSAT Landsat Technical Notes No. 1; EOSAT: Lanham, MD, USA, 1986. [Google Scholar]
- Gyanesh, Chander; Markham, Brian L.; Helder, Dennis L. Summary of current radiometric calibration coefficients for Landsat MSS, TM, ETM+, and EO-1 ALI sensors. Remote Sens. Environ. 2009, 113, 893–903. [Google Scholar]
- Jiménez-Muñoz, J.C.; Sobrino, J.A. A generalized single-channel method for retrieving land surface temperature from remote sensing data. J. Geophys. Res.: Atmos 2003, 108. [Google Scholar] [CrossRef]
- Van de Griend, A.; Owe, M. On the relationship between thermal emissivity and the normalized difference vegetation index for natural surfaces. Int. J. Remote Sens 1993, 14, 1119–1131. [Google Scholar]
- Valor, E.; Caselles, V. Mapping land surface emissivity from NDVI: Application to European, African, and South American areas. Remote Sens. Environ 1996, 57, 167–184. [Google Scholar]
- Sobrino, J.A.; Raissouni, N. Toward remote sensing methods for land cover dynamic monitoring: Application to Morocco. Int. J. Remote Sens 2000, 21, 353–366. [Google Scholar]
- Li, Z.-L.; Wu, H.; Wang, N.; Qiu, S.; Sobrino, J.A.; Wan, Z.; Tang, B.-H.; Yan, G. Land surface emissivity retrieval from satellite data. Int. J. Remote Sens 2012, 34, 3084–3127. [Google Scholar]
- Nerry, F.; Labed, J.; Stoll, M.P. Spectral properties of land surface in the thermal infrared 1. Laboratory measurement of absolute spectral emissivity signature. J. Geophys. Res 1990, 95, 7027–7044. [Google Scholar]
- Raju, A.; Gupta, R.P.; Prakash, A. Delineation of coalfield surface fires by thresholding Landsat TM-7 day-time image data. Geocarto Int 2012, 4, 343–363. [Google Scholar]
- Chatterjee, R.S. Coal fire mapping from satellite thermal IR data—A case example in Jharia Coalfield, Jharkhand, India. ISPRS J. Photogramm. Remote Sens. 2006, 60, 113–128. [Google Scholar]
- Kuenzer, C.; Zhang, J.; Tetzlaff, A.; van Dijk, P.; Voigt, S.; Mehl, H.; Wagner, W. Uncontrolled coal fires and their environmental impacts: Investigating two arid mining regions in north-central China. Appl. Geogr 2007, 27, 42–62. [Google Scholar]


| Data Type | Band Used for Temperature | Respective Spatial Resolution (m) | Time of Data Acquisition |
|---|---|---|---|
| Nighttime Landsat 7 | 6, 7 | 60/30 | 9 September 2001 |
| Nighttime Landsat 7 | 6, 7 | 60/30 | 28 September 2002 |
| Nighttime Landsat 7 | 6, 7 | 60/30 | 8 July 2007 |
| Data Type | Bands Used for NDVI | Respective Spatial Resolution (m) | Time of Data Acquisition |
|---|---|---|---|
| Daytime Landsat 5 | 3, 4 | 30 | 10 September 2001 |
| Daytime Landsat 7 | 3, 4 | 30 | 21 September 2002 |
| Daytime Landsat 5 | 3, 4 | 30 | 23 June 2007 |
| Data Type | Image Date | Min (k) | Max (k) | Mean (k) | Stdev (k) | Threshold (k) | Area (km2) |
|---|---|---|---|---|---|---|---|
| Nighttime Landsat 7 | 9 September 2001 | 275.63 | 302.39 | 283.55 | 2.03 | 287.6 | 1.248 |
| Nighttime Landsat 7 | 28 September 2002 | 274.32 | 296.05 | 282.03 | 1.86 | 285.8 | 1.607 |
| Nighttime Landsat 7 | 8 July 2007 | 283.77 | 323.19 | 289.27 | 1.39 | 292.1 | 2.113 |
| Data Type | Image Date | Threshold (k) | Area (km2) |
|---|---|---|---|
| Nighttime Landsat 7 | 9 September 2001 | 423.15 | 0.0702 |
| Nighttime Landsat 7 | 28 September 2002 | 423.15 | 0.0783 |
| Nighttime Landsat 7 | 8 July 2007 | 423.15 | 0.2043 |
| Data Type | Acquisition Time | Spatial Resolution (m) | Omission Error (%) | Comission Error (%) |
|---|---|---|---|---|
| Nighttime ETM+FSM | 28 September 2002 2002–2003 | 60 60 | 15.2 | 4.5 |
| Daytime ETM+FSM | 21 September 2002 2002–2003 | 60 60 | 47.5 | 48.3 |
© 2014 by the authors; licensee MDPI, Basel, Switzerland This article is an open access article distributed under the terms and conditions of the Creative Commons Attribution license (http://creativecommons.org/licenses/by/3.0/).
Share and Cite
Huo, H.; Jiang, X.; Song, X.; Li, Z.-L.; Ni, Z.; Gao, C. Detection of Coal Fire Dynamics and Propagation Direction from Multi-Temporal Nighttime Landsat SWIR and TIR Data: A Case Study on the Rujigou Coalfield, Northwest (NW) China. Remote Sens. 2014, 6, 1234-1259. https://doi.org/10.3390/rs6021234
Huo H, Jiang X, Song X, Li Z-L, Ni Z, Gao C. Detection of Coal Fire Dynamics and Propagation Direction from Multi-Temporal Nighttime Landsat SWIR and TIR Data: A Case Study on the Rujigou Coalfield, Northwest (NW) China. Remote Sensing. 2014; 6(2):1234-1259. https://doi.org/10.3390/rs6021234
Chicago/Turabian StyleHuo, Hongyuan, Xiaoguang Jiang, Xianfeng Song, Zhao-Liang Li, Zhuoya Ni, and Caixia Gao. 2014. "Detection of Coal Fire Dynamics and Propagation Direction from Multi-Temporal Nighttime Landsat SWIR and TIR Data: A Case Study on the Rujigou Coalfield, Northwest (NW) China" Remote Sensing 6, no. 2: 1234-1259. https://doi.org/10.3390/rs6021234
APA StyleHuo, H., Jiang, X., Song, X., Li, Z.-L., Ni, Z., & Gao, C. (2014). Detection of Coal Fire Dynamics and Propagation Direction from Multi-Temporal Nighttime Landsat SWIR and TIR Data: A Case Study on the Rujigou Coalfield, Northwest (NW) China. Remote Sensing, 6(2), 1234-1259. https://doi.org/10.3390/rs6021234