Article

Radiometric Cross Calibration of Landsat 8 Operational Land Imager (OLI) and Landsat 7 Enhanced Thematic Mapper Plus (ETM+)

1
Engineering-Office of Research, South Dakota State University (SDSU), Brookings, SD 57007, USA
2
SGT, Inc., Contractor to U. S. Geological Survey (USGS) Earth Resources Observation and Science Center (EROS), Sioux Falls, SD 57198, USA
3
Biospheric Sciences Branch, Code 618, National Aeronautics and Space Administration Goddard Space Flight Centre (NASA/GSFC), Greenbelt, MD 20771, USA
*
Author to whom correspondence should be addressed.
Remote Sens. 2014, 6(12), 12619-12638; https://doi.org/10.3390/rs61212619
Submission received: 1 August 2014 / Revised: 4 December 2014 / Accepted: 5 December 2014 / Published: 16 December 2014
(This article belongs to the Special Issue Landsat-8 Sensor Characterization and Calibration)

Abstract

:
This study evaluates the radiometric consistency between Landsat-8 Operational Land Imager (OLI) and Landsat 7 Enhanced Thematic Mapper Plus (ETM+) using cross calibration techniques. Two approaches are used, one based on cross calibration between the two sensors using simultaneous image pairs, acquired during an underfly event on 29–30 March 2013. The other approach is based on using time series of image statistics acquired by these two sensors over the Libya 4 pseudo invariant calibration site (PICS) (+28.55°N, +23.39°E). Analyses from these approaches show that the reflectance calibration of OLI is generally within ±3% of the ETM+ radiance calibration for all the reflective bands from visible to short wave infrared regions when the ChKur solar spectrum is used to convert the ETM+ radiance to reflectance. Similar results are obtained comparing the OLI radiance calibration directly with the ETM+ radiance calibration and the results in these two different physical units (radiance and reflectance) agree to within ±2% for all the analogous bands. These results will also be useful to tie all the Landsat heritage sensors from Landsat 1 MultiSpectral Scanner (MSS) through Landsat-8 OLI to a consistent radiometric scale.

1. Introduction

The primary objective of the Landsat-8 (L8) mission operation is to collect, archive, process and distribute science data in a manner consistent with the existing Landsat data record [1,2]. L8 has a temporal repeat cycle of 16 days with an orbit phased 8 days from Landsat-7 (L7), which means that Landsat data (7 or 8) are now available every 8 days for many land areas of the Earth. L8 is referenced to the WRS-2 system and operates in a 705 km near-circular polar, sun synchronous orbit with an equatorial crossing at approximately 10:13 a.m. mean local time during the descending node of each orbit. L8 has two sensors on board, Operational Land Imager (OLI) and the Thermal Infrared Sensor (TIRS) and these two sensors collect data nearly coincidentally. Requirements are for data calibrated within an uncertainty of better than 5% (1 sigma) in terms of at-sensor-radiance (comparable to L7 Enhanced Thematic Mapper Plus (L7 ETM+)) and better than 3% in top of atmosphere (TOA) reflectance space for each spectral band [2].
The Landsat archive contains the longest continuous record of the Earth’s surface, as viewed from space, with the Landsat 8 mission extending this record to more than 42 years (and counting). Because of its temporal coverage, spatial resolution at an appropriate scale for monitoring human activity, as well as the benefit of free access to the public, the Landsat data record is important for land cover change research and global climate change studies. A key precursor for these studies is the consistent radiometric calibration of the satellite sensors and radiometric stability of the Landsat sensors. This element has been a key contributing factor to the overall success of the Landsat mission. In this context, on-going characterization of OLI data is critical to maintain the continuity of high data quality.
Landsat calibration has always relied on the expertise and the best efforts of several agencies and universities. The Calibration and Validation Team (CVT) for L8 consists of a team from NASA Goddard Space Flight Center (GSFC), U. S. Geological Survey (USGS) Earth Resources Observation and Science Center (EROS), South Dakota State University (SDSU), University of Arizona (U of A), Rochester Institute of Science and Technology (RIT) in Rochester, New York and the Jet Propulsion Laboratory (JPL) in California. These teams are responsible for monitoring the overall health of the Landsat instruments with various post launch calibration techniques that include monitoring stability of the instrument with on-board calibrators, vicarious ground-based calibration and PICS-based calibration to name a few.
In this paper, cross-calibration results of OLI and ETM+ instruments performed at SDSU and USGS EROS are presented. The objective of this continuing study is twofold: to monitor the radiometric calibration consistency of the OLI sensor and to provide a first order cross calibration between the two existing Landsat instruments which will tie all the Landsat instruments to a consistent radiometric scale. It should be noted that the CVT has also created a database for temporally monitoring the radiometric stability of OLI using the sensor’s response to lamp pairs, solar diffusers and lunar acquisitions [3]. This has provided independent validation of the temporal stability of the OLI instrument for top of atmosphere in-band response.

2. Overview

The sensors used for the current calibration studies include L8 OLI, L7 ETM+ and EO-1 Hyperion. L7 ETM+ is well known in the remote sensing user community and L8 OLI continues to be very stable since launch [3]. EO-1 Hyperion is used to understand the spectral signature of the target and to derive the Spectral Band Adjustment Factor (SBAF). The calibration uncertainties of ETM+ are specified to be within ±5% in at sensor radiance space [4] and the Hyperion uncertainties are specified to be within 5% [5]. The instrument description and the radiometric performance ETM+ and EO-1 Hyperion can be found in the literature [4,5,6,7].

2.1. OLI Design Summary

The OLI design is presented in [8] and a brief overview is given here. Figure 1 shows a schematic of the OLI instrument. It consists of 9 spectral channels ranging from visible to shortwave infrared wavelengths. When compared to ETM+, OLI has two additional channels: the deep blue band at 443 nm for coastal and aerosol measurements and the cirrus band at 1375 nm for cirrus cloud detection [1]. The OLI is a pushbroom sensor instead of the whiskbroom sensors used on earlier Landsat satellites (1–7). The spatial resolution and swath width of the OLI are comparable to the ETM+. The Focal Plane Array (FPA) consists of 14 Focal Plane Modules (FPMs) made up of detectors and spectral filters for each band. Silicon detectors are used for visible to near infrared (NIR) bands with Mercury Cadmium Telluride detectors for the SWIR bands [1,2,3]. There are about 7000 across-track detectors per spectral channel except for the panchromatic band, which has nearly 14,000 detectors. OLI has multiple onboard radiometric sources, namely two spectralon solar diffusers and three pairs of lamps. OLI data are quantized to 12 bits; this is higher than ETM+ and Thematic Mapper (TM) where the quantization is 8 bits.
Figure 1. Schematic of Landsat 8 OLI instrument.
Remotesensing 06 12619 g001
*Note: The schematic diagram was provided by Ball Aerospace & Technologies Corp.

2.2. Relative Spectral Response (RSR)

Figure 2 shows the band average Relative Spectral Response (RSR) of L8 OLI together with L7 ETM+ for matching spectral bands [9,10]. For clarity purposes, the bands considered in this paper are named Blue, Green, Red, NIR, Short Wave InfraRed (SWIR)-1 and SWIR-2. As alluded to earlier, the coastal aerosol band and the cirrus cloud band are new to OLI and have no analogous ETM+ bands and will not be considered here. In general, the OLI bands are narrower than the ETM+ bands as the OLI band edges have been refined to avoid atmospheric absorption features. The OLI NIR band is substantially narrower to avoid the water vapor absorption feature at approximately 825 nm. These differences mean that even while both sensors are looking at the same general region of the electromagnetic spectrum at the same time, they may report different values of at-sensor radiance depending on the spectral signature of the target.
Figure 2. Relative Spectral Response (RSR) of L8 OLI and L7 ETM+.
Remotesensing 06 12619 g002

2.3. Conversion to TOA Radiance and Reflectance for OLI

L7 has been operational for more than a decade and the conversion to TOA radiance and reflectance has been addressed in various articles [11,12]. Readers are encouraged to visit Landsat websites maintained by USGS for further details. This section is dedicated to conversion to TOA radiance and reflectance for Landsat 8 OLI as the conversion equations are slightly different than earlier Landsats. Standard Landsat 8 L1T products are distributed by USGS EROS in 16 bits unsigned integer format and can be rescaled to TOA spectral reflectance and TOA spectral radiance using the radiometric rescaling coefficients provided in the product metadata (MTL) file [13]. Results from both radiance and reflectance-based cross calibration will be presented in this paper.

2.3.1. Conversion to TOA Radiance

OLI image data can be converted to TOA radiance using a conversion equation given as
Lλ = ML × Qcal + AL
where,
  • Lλ: TOA radiance ( Watts/m2 × srad × μm)
  • ML: Band-specific multiplicative rescaling
  • AL: Band-specific additive rescaling factor
  • Qcal: Quantized and calibrated standard product pixel values (DN)
A point of note here is that, a similar conversion equation for radiance conversion is also applicable for L7 ETM+ as USGS has recently updated the product metadata (MTL) files and added the radiance scaling parameters to be consistent with L8.

2.3.2. Conversion to TOA Reflectance

OLI image data can be converted to TOA reflectance using a conversion equation given as
ρ λ ` = M ρ × Q cal + A ρ
where,
  • ρ λ ` : TOA planetary reflectance, without correction for solar angle
  • Mρ: Band-specific multiplicative rescaling factor
  • Aρ: Band-specific additive rescaling factor
  • Qcal: Quantized and calibrated standard product pixel values (DN)
The TOA reflectance with a correction for solar zenith angle is given as
ρ λ = ρ λ ` c o s ( θ S Z A   )
where,
  • ρλ: TOA reflectance
  • θSZA: Solar Zenith angle

3. Method Overview

As stated earlier, cross calibration between ETM+ and OLI was performed using images acquired by these two sensors during the commissioning phase “underfly” and using image statistics over Libya 4 PICS. On 29–30 March 2013, L8 was in a lower altitude orbit that provided a similar ground track to L7 to give a period of near-coincident data collects to directly cross compare ETM+ & OLI. During the underfly period, none of the well characterized PICS [14] sites traditionally used for Landsat and other sensor calibration were within view of Landsat-8, so these simultaneous image data were supplemented by PICS analyses.
PICS-based calibration methods have been used by numerous researchers over an extended period of time [12,14,15,16,17,18] A host of PICS sites have been endorsed by Committee on Earth Observation Satellites (CEOS) and these stable Earth-based sites have been used extensively to monitor the post-launch temporal stability of optical satellite sensors and for cross-calibration/inter-comparison purposes [12,19,20,21,22,23]. In the cross-calibration method, the response of the sensor under investigation is compared against a reference sensor that is believed to be well calibrated over time [19,20,24,25,26]. In order to achieve best results, a large homogeneous area is imaged simultaneously or nearly simultaneously by the two sensors using similar viewing angles, ideally nadir. Once spectral equivalency has been performed using the SBAF technique, for a stable atmosphere, the in-band radiances can be directly compared to determine any sensor calibration differences. This cross-calibration is a vital step not only to establish the relative calibration of the satellite sensors but also to ensure that data from multiple sensors can be used to provide a consistent set of measurements. The current work focuses on the cross-comparison of L8 OLI to L7 ETM+. The ETM+ sensor has been extremely stable since launch and successfully operating for over a decade and has been used by researchers for a number of cross-calibration studies [19,25,27]. The use of the ETM+ sensor, in this study, will provide a first order estimate of OLI calibration as compared to the stable ETM+ sensor. It should be noted that a similar cross calibration approach has been used to tie all the Landsat Multispectral Scanner (MSS) suites of sensors (MSS1–MSS5) to L5 TM and L5 TM to L7 ETM+ [24,25].

3.1. Test Sites

During the underfly, several African sites were imaged near-coincidentally by ETM+ and OLI. Among these underfly scenes were paths 182 rows 42 and 43 and path 198 rows 38 and 39 where simultaneous or near simultaneous Hyperion data were also collected. The Hyperion data provide an opportunity to account for the spectral band differences as described earlier and provides an alternative to simultaneous ground measurement which is often impossible for remote inaccessible areas. The rationale behind using near simultaneous image pairs for cross calibration is to reduce the uncertainties that may arise due to uncharacterized atmospheric conditions between overpass times. Landsat-7 ETM+ and Landsat-8 OLI images of these sites were collected within 4 minutes of each other. The Hyperion scene of WRS2 path/rows 182/42–43 were acquired three days prior to the L7/L8 scenes. This desert site is located within several hundred kilometers of the North African desert site, Libya 4, which is well known for temporal stability. The other site, WRS2 path/row 198/39 is less uniform with substantial variation of ground structure; however, the Hyperion data was acquired within 20 min of L7/L8 imaging. Table 1 shows the metadata for the scenes used. As an example, Figure 3 shows the Hyperion, ETM+ and OLI data over path 198 row 39. Since the swath of Hyperion data is much smaller than L7/L8, small common Regions Of Interest (ROI) were chosen carefully to cover all three geo-registered images. As L8 was in a lower orbit, the pixel size of OLI underfly images was less than 30 m (approximately 29.3 m). However, the scenes were resampled to 30 m pixels and processed through the USGS processing system to generate standard L1T products. Also, during these collections, L8 was flying approximately 40 km to the east of the WRS2 path. To account for the sun angle difference between pixels within an image, a “per pixel sun angle” was used during reflectance calculations over the ROIs of both L7 and L8 images. No BRDF correction was applied under the expectation that differences due BRDF effect should be very minimal as the scenes were acquired within 4 minutes. The statistics over each ROI were generated both in radiance and reflectance space using the L7 and L8 Image Assessment Systems (IAS).
Table 1. Metadata of scenes used for L7/L8 cross-calibration.
Sat/SensorAcquisition DateAcquisition TimeWRS2 Path/RowScene center Lat/LonSun Elevation (deg)Sun Azimuth (deg)Look Angle (deg)
L7 ETM+30 March 20138:58:11182/4225.996°N/21.557°E57.41128.49NADIR
L8 OLI30 March 20139:02:01182/4226.002°N/21.936°E58.43130.10NADIR
EO-1 HYP*27 March 20138:30:16182/4225.363°N/21.349°E51.91121.21−0.76
L7 ETM+30 March 20138:58:35182/4324.557°N/21.206°E58.10126.35NADIR
L8 OLI30 March 20139:02:24182/4324.551°N/21.581°E59.15127.91NADIR
L7 ETM+30 March 201310:35:52198/3930.312°N/2.058°W55.10134.39NADIR
L8 OLI30 March 201310:39:24198/3930.301°N/1.608°W56.03136.08NADIR
EO-1 HYP*30 March 201310:20:56198/3830.379°N/2.067°W53.04130.2123.94
* Note the scene center Lat/Long as Hyperion was little off from true WRS2 path/row.
Figure 3. Hyperion, ETM+ and OLI images over path 198, row 39 acquired during the L8 underfly on 30 March 2013. 10 ROIs each of approximately 6 km by 6 km area were chosen from geo-registered L1T products. The co-ordinates of the ROIs are provided in Table 1.
Remotesensing 06 12619 g003
The PICS approach relies on the long-term stability of the site, and does not require simultaneity. The Libya 4 PICS was chosen for this calibration study as investigations have indicated that the site has been stable to within 2% for the last decade [22,28]. ETM+ has made over 200 nadir cloud-free acquisitions over Libya 4 since its launch in 1999. Similarly OLI has acquired more than 20 cloud-free images since its launch. 
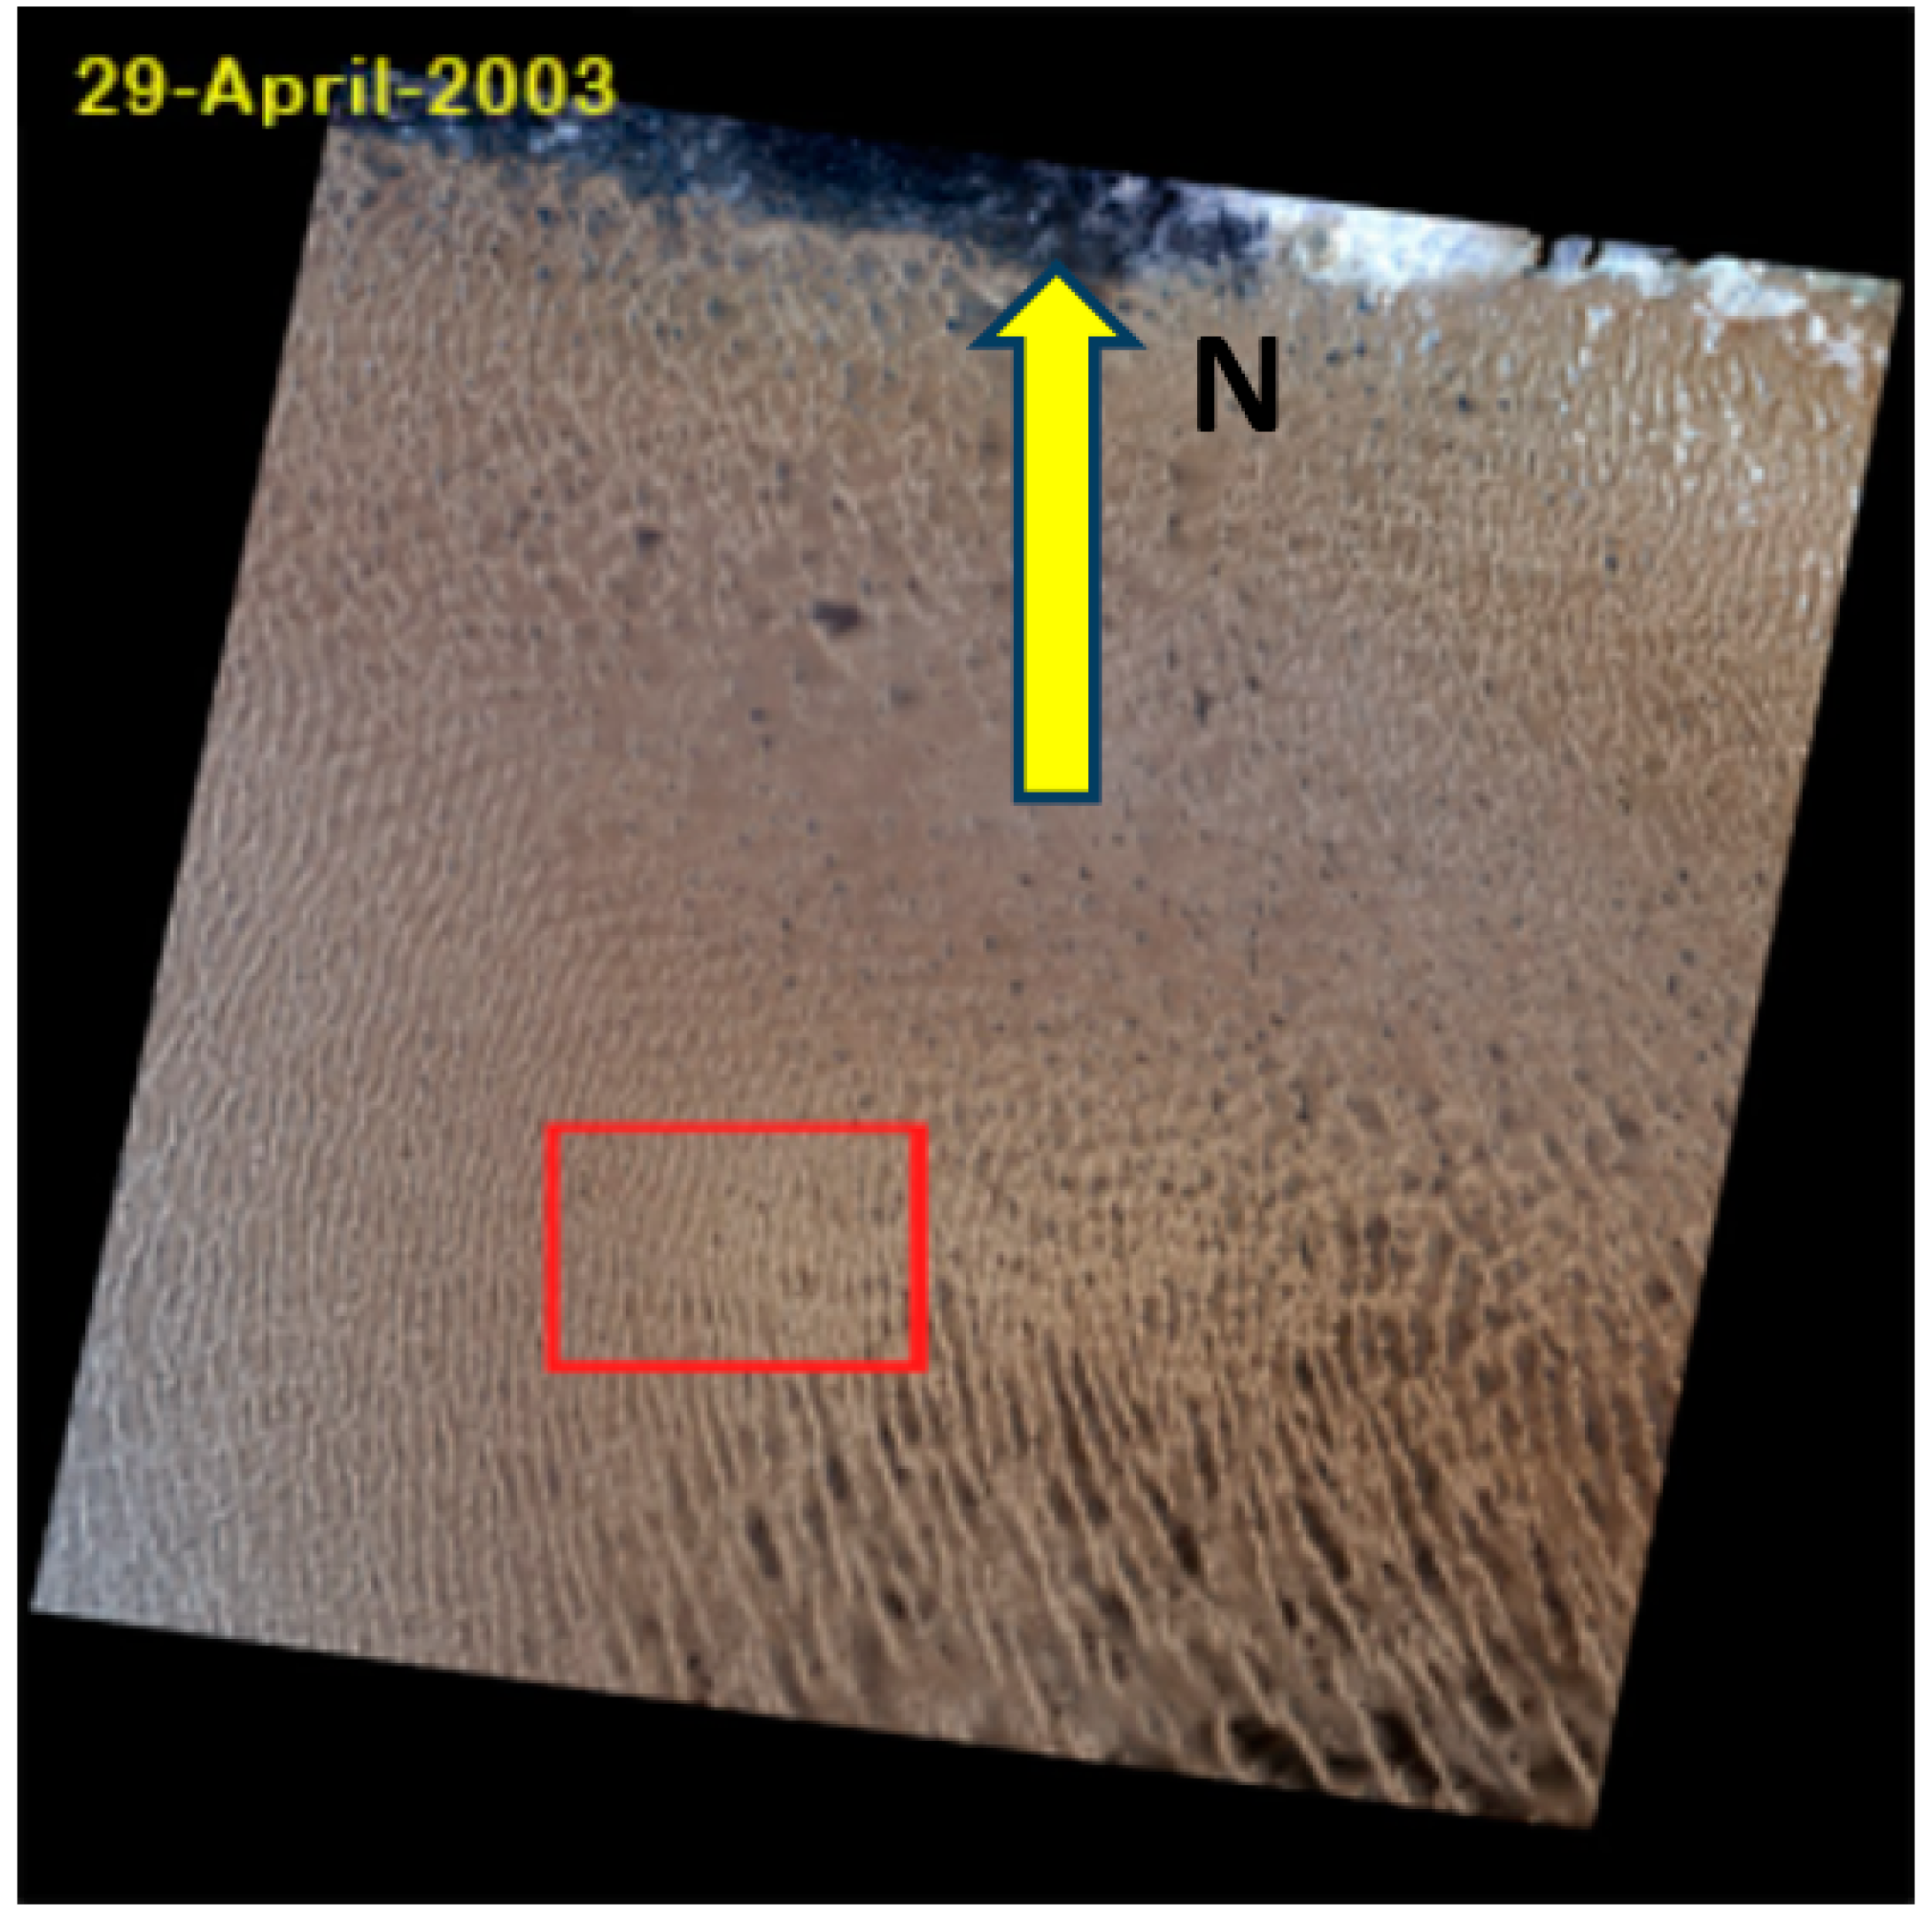
Figure 4 shows a RGB color composite Landsat image over Libya 4 PICS. The red rectangle shows the region of interest (ROI) which is about 45 × 28 km2 [14]. ETM+ and OLI image TOA reflectance over the ROI were calculated using the Landsat Image Assessment (IAS) PICS database. EO-1 Hyperion images were available in the USGS EarthExplorer database. It should be noted that historically Landsat calibration has been always based on the MODerate resolution atmospheric TRANsmission (MODTRAN) based ChKur solar model [25]. Hence for consistency, the same ChKur model is used for converting at-sensor radiance to TOA reflectance for both the ETM+ and the Hyperion sensors.
Figure 4. Landsat 7 ETM+ image over Libya 4. The red rectangle in the bottom images marks the chosen region of interest (ROI) with latitude (min and max): 28.45, 28.64, longitude (min and max): 23.29, 23.4.
Remotesensing 06 12619 g004

3.2. Spectral Band Adjustment Factor (SBAF)

EO-1 Hyperion images, available in the USGS EarthExplorer database, were used to derive the spectral band adjustment factor (SBAF) to compensate for the RSR differences between the sensors. Although SBAF is discussed briefly in this section, the readers are directed elsewhere for the related mathematical expressions for SBAF [17,19,29]. The suitability of Hyperion for the assessment of spectral band differences has been addressed in the literature [19,30]. 
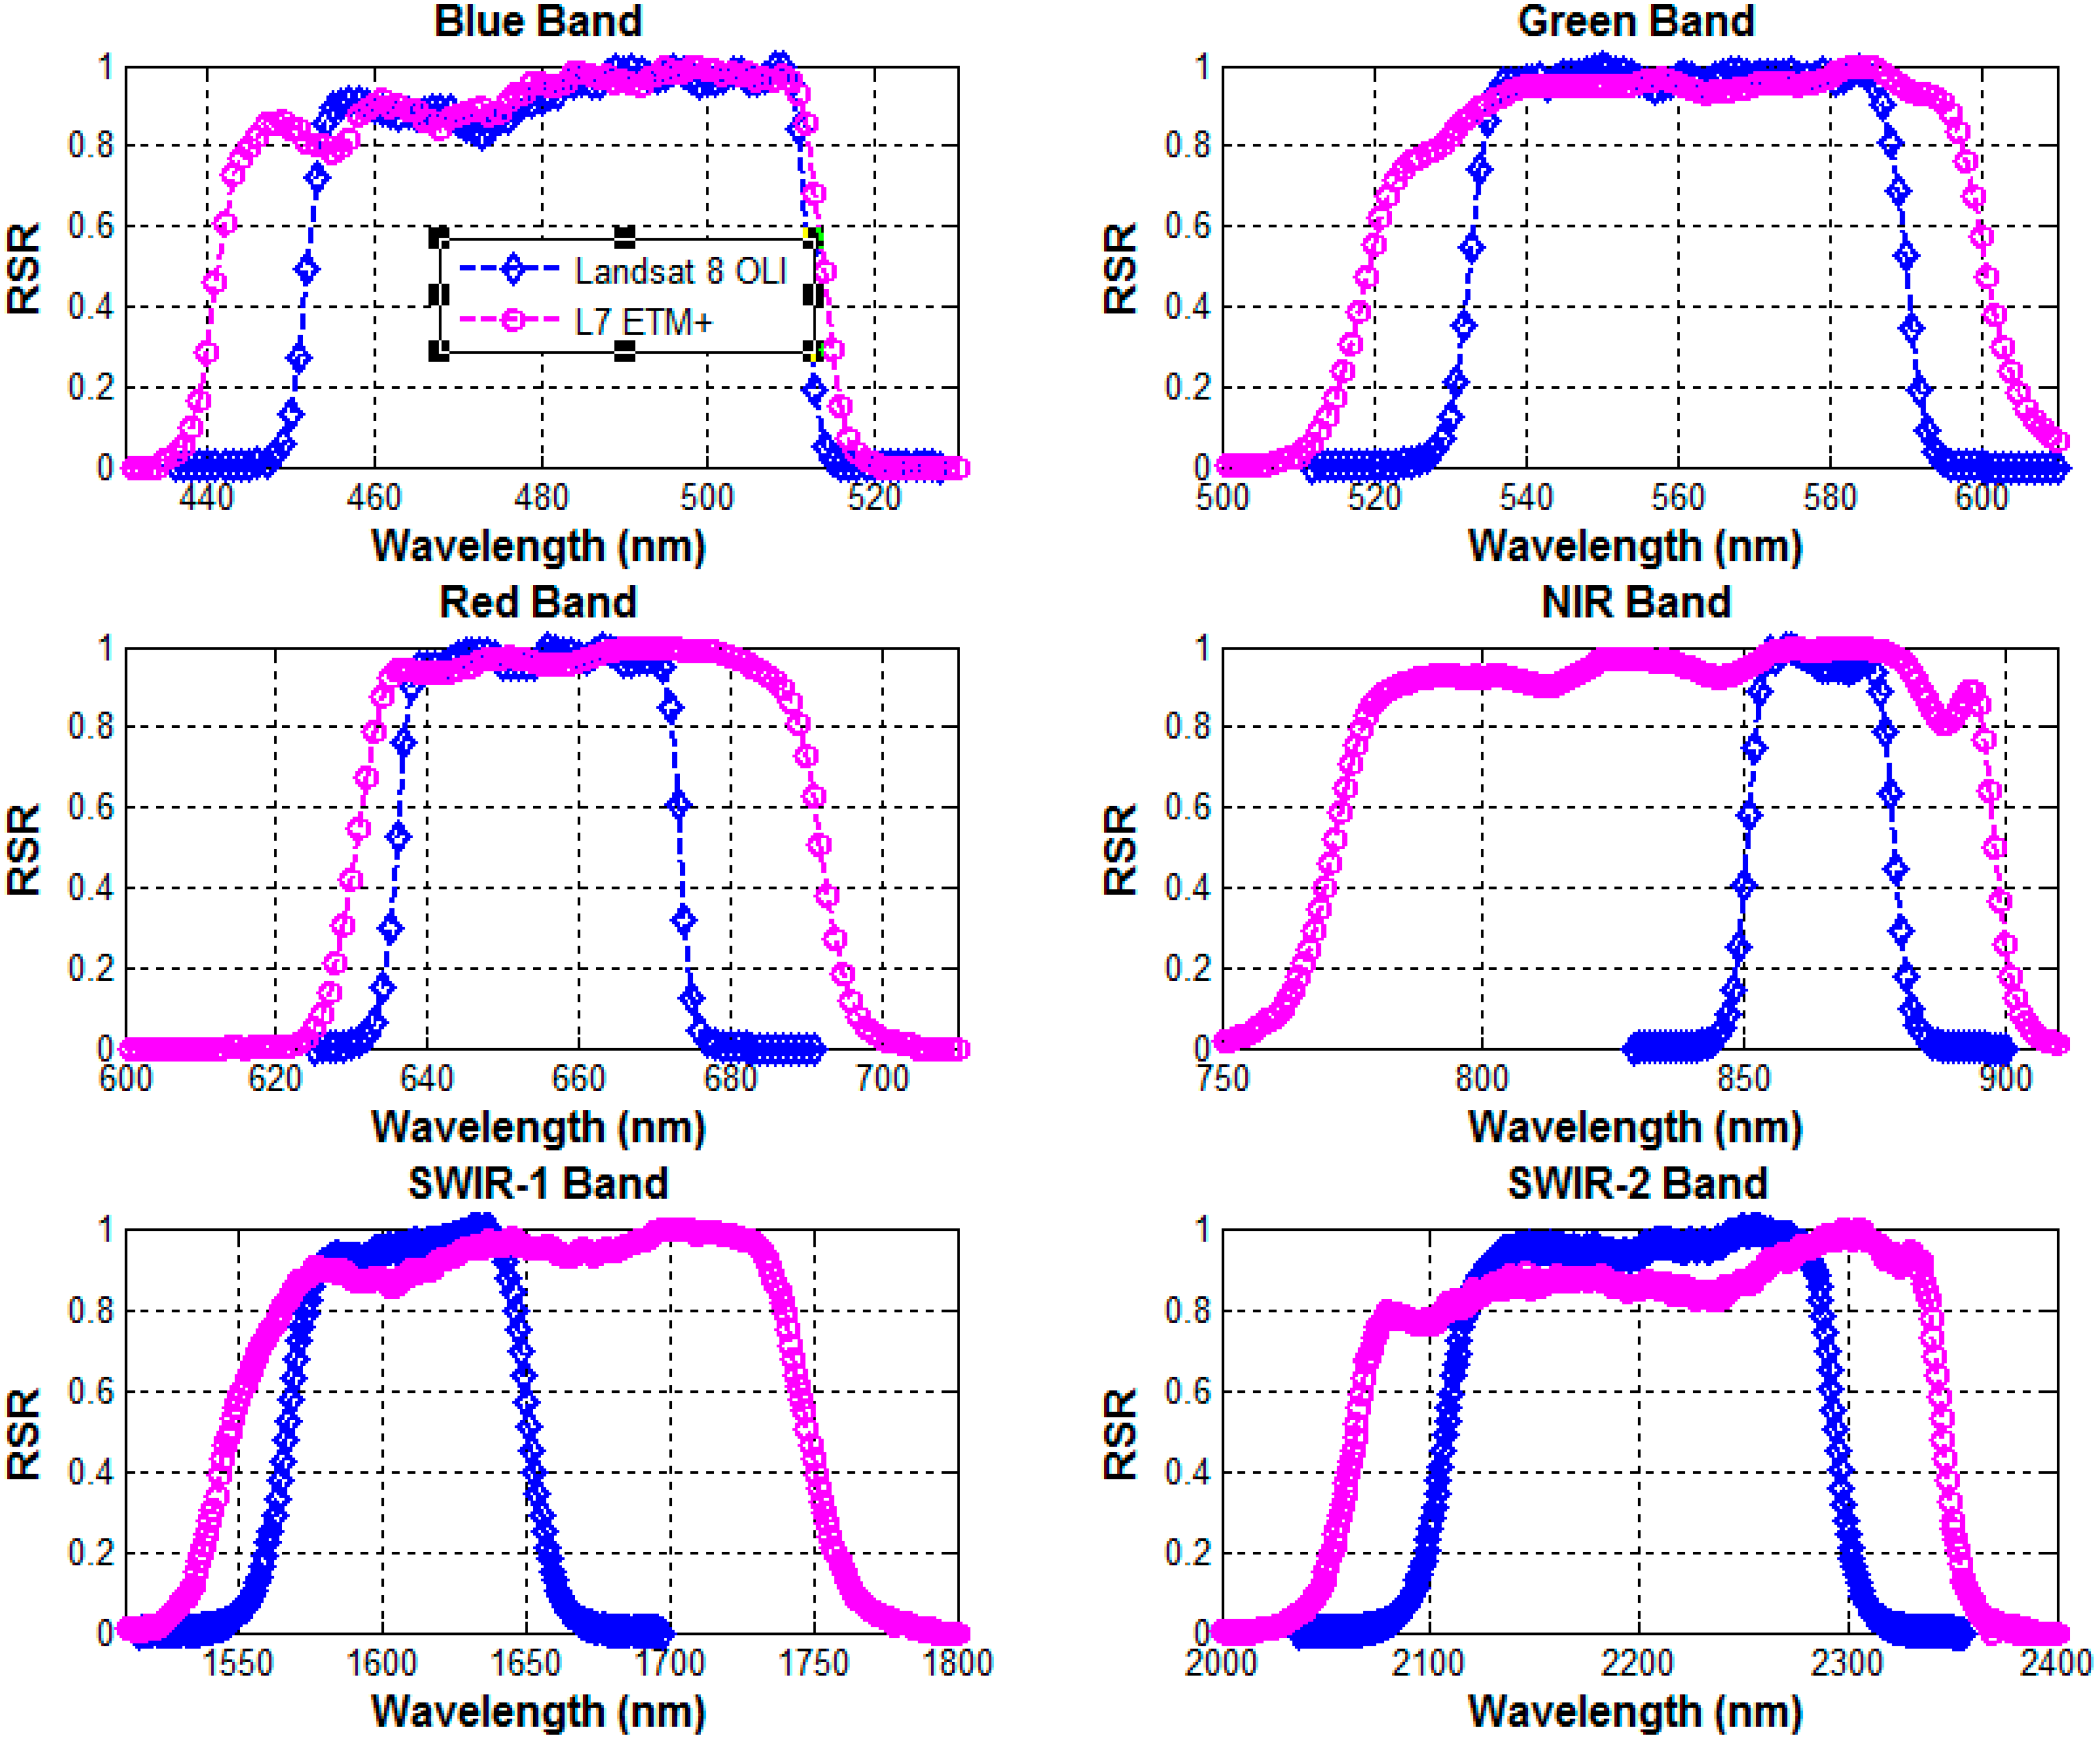
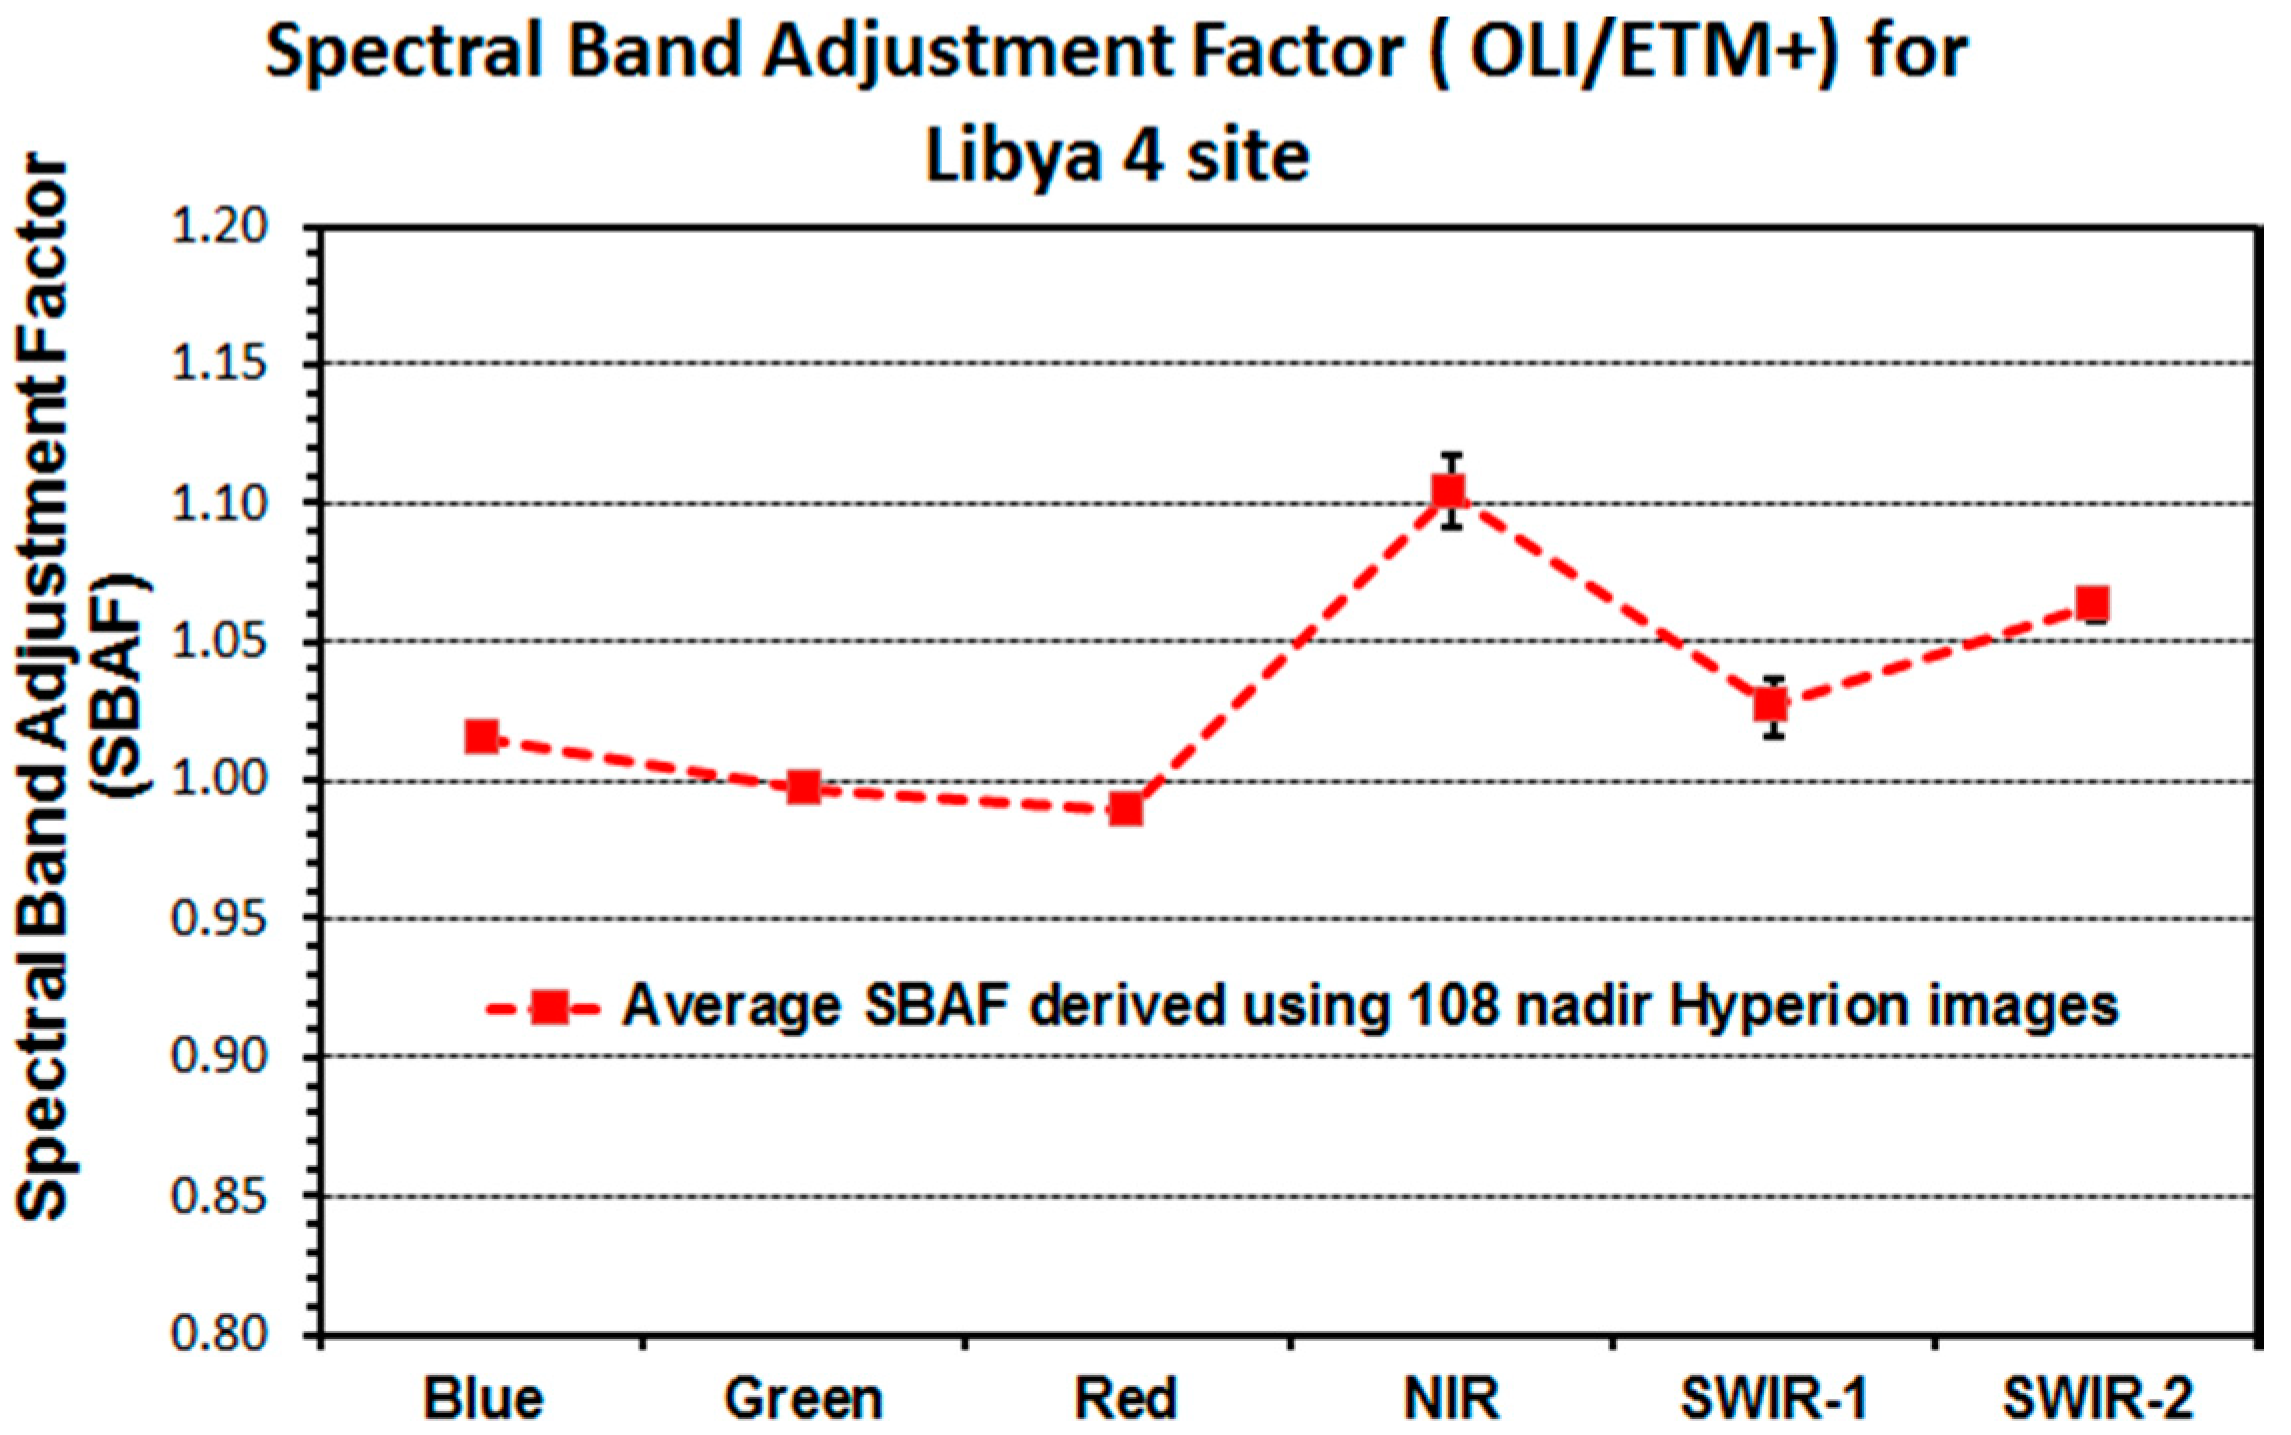
Figure 5 shows the SBAF derived for the OLI-ETM+ analogous band pairs using 108 nadir Hyperion TOA reflectance images over the Libya 4 site. Error bars (uncertainties) indicate 1 sigma standard deviation from the mean. The uncertainties are higher in the NIR and SWIR-1 bands as the spectral bandpasses of the two sensors differ the most for these bands. Nevertheless, uncertainties are ~1% for the NIR and SWIR-1 bands, while for the remaining bands the uncertainties are <0.5%. Departure from unity is an indication of in-band differences between the two sensors in that they respond differently for the same electromagnetic source. If this is not accounted for, there will be a systematic error in the cross calibration [29,30,31]. SBAF plots shown in Figure 5 indicate that for ETM+ and OLI band combination, the largest difference is 6%–10% in the NIR and SWIR-2 bands whereas difference of 1%–4% can be expected in the other bands when imaging a bright desert.
Figure 5. Spectral band adjustment Factor (SBAF) for Libya 4 test site.
Remotesensing 06 12619 g005

4. Results and Discussion

As noted earlier, cross calibration between ETM+ and OLI can be achieved in both TOA reflectance and at-sensor radiance units. Since the methods involved in either space are the same, this section describes reflectance-based cross-comparison results in detail. However, a comparison is made between reflectance and radiance-based results near the end of the section.

4.1. Results Based on Underfly Image Pairs

Figure 6 shows the path 198 row 39 percentage differences in TOA reflectance between L8 OLI and L7 ETM+ similar bands before and after the spectral band adjustment. The 10 ROIs along row 39 are plotted sequentially for each band. It can be seen that prior to SBAF application, differences vary between ROIs, which is primarily because these sites are not spatially uniform. After application of the SBAF, the within-band between ROI differences is reduced to ±0.5%. The application of SBAFs also reduces the differences between the analogous bands except for the NIR band. The percentage differences in TOA reflectance between ETM+ and OLI in all but the NIR band are about 2%. The direction of difference is consistent between different bands such that the TOA reflectance reported by OLI is generally higher. One anomaly in this trend is the NIR band where the two sensors disagree by 4%.
The NIR band is the anomaly, which may be related to the major water vapor absorption features at about 826 nm, as shown in Figure 2, which is present in the ETM+ NIR band but not in OLI NIR band. The reason that the Hyperion data, though taken near simultaneously, do not appear to compensate for this difference is unknown but previous studies done with higher resolution (~0.1 nm) SCanning Imaging Absorption spectroMeter for Atmospheric CHartographY (SCIAMACHY) have pointed out that this can be partially attributed to the inability of Hyperion spectra (10 nm) to delineate finer spectral features in the electromagnetic spectra which may cause some bias in Hyperion-derived SBAF [20]. However it should be noted that it is possible that some, if not all, of these differences between OLI and ETM+ bands, especially the NIR bands, could also be a real difference between the OLI and ETM+ NIR radiometric calibration. Further investigation is on-going to assess the need for calibration update to account for these differences. Similar results were observed over path 182 rows 42–43. A comparison among the results from different test sites along with the PICS-based results is given in the following section.
Figure 6. Cross calibration scenes based on path 198, row 39.
Remotesensing 06 12619 g006

4.2. Results Based on Libya 4

Figure 7 shows temporal trending of Landsat 8 OLI measured TOA reflectance over Libya 4 PICS for the 6 bands since its launch. No data were acquired of this site between days 220 and 270 since launch due to issues related to the U.S. Government partial shutdown. An empirical linear model was used to account for BRDF due to solar zenith angle in the trend [22,23] which would mean that the time series shown in the Figure 7 is BRDF corrected. Linear regressions, indicated by the black lines were performed, though none were statistically significant at 95% confidence interval, which indicates a good stability of the sensor. The intercept value was then used as a mean TOA reflectance value for comparison against ETM+. Further investigations on the stability of OLI measured via PICS and other techniques can be found in a companion paper [3]. The temporal uncertainty (standard deviation divided by the mean) of OLI is better than 1% for all bands expect for the SWIR-2 band where uncertainties approach 2%. Atmospherically cleaner spectral channels such as red, NIR and SWIR-1 bands indicate stability of better than 0.5% per year.
Similarly, Figure 8 shows the temporal plot of ETM+ TOA reflectance over Libya 4 PICS. Higher temporal uncertainties are observed in ETM+ trends than OLI primarily because ETM+ bands are spectrally wider than OLI bands and thus are more affected by intervening absorptions and perturbations in the atmosphere. As with OLI, an empirical BRDF model has been applied to the trend. The slopes of the linear lines fitted to these trends indicate no statistical evidence of drift at 95% confidence interval and the intercept value was used as a mean TOA reflectance for comparison purposes. The differences between ETM+ and TOA reflectance values are summarized in Table 2. A negative sign in the difference column indicates that the value measured by the OLI band is higher than the corresponding ETM+ band. It is apparent, by examining column 5, that before performing spectral adjustment, the TOA reflectance measured by OLI bands are higher than ETM+ in NIR, SWIR-1 and SWIR-2 where the differences approach 5%–8%. The differences are smaller in blue, green and red bands where the agreement is generally within 1.5%. It can also be observed that after applying SBAF as shown in column 6, the offset between the two sensors reduces and in general the bands agree to within ±2.5%. The direction of differences is generally consistent with the previous results presented using underfly scenes. A comparison between the two approaches is made in the following sections. Thus, these cross-calibration results indicate a good radiometric agreement between ETM+ and OLI, and generally within 3% across the spectral bands.
Figure 7. Temporal Trend of L8 OLI over Libya 4 PICS.
Remotesensing 06 12619 g007
Figure 8. Temporal trend of L8 OLI over Libya 4 PICS.
Remotesensing 06 12619 g008
Table 2. Comparison between L7 ETM+ and L8 OLI TOA reflectance.
BandsL8 OLIL7 ETM+SBAF (Hyperion Derived)% Diff Before SBAF% Diff after SBAF
Blue0.2490.2501.0150.70%2.22%
Green0.3400.3400.997−0.24%−0.54%
Red0.4660.4590.989−1.57%−2.64%
NIR0.5890.5461.104−7.43%2.20%
SWIR-10.6830.6501.026−4.92%−2.49%
SWIR-20.6120.5621.063−8.23%−2.45%

4.3. Combining the Comparison Results

Figure 9 compares the cross-calibration results obtained from the two approaches discussed earlier. The differences are obtained using the mean value of TOA radiance or reflectance of ETM+ time series and OLI time series. The results are shown for path 198 (green color) and path 182 (red color) and Libya 4 (blue color). The plot on the left shows the comparison of the radiance-based cross calibration and the one on the right shows reflectance-based comparisons. On observing the reflectance-based comparisons, the results from the two underfly images are slightly different in the blue and NIR whereas results in other bands are similar. Part of the reason for this difference is the Hyperion collect for path 182 row 42 was separated from the ETM+ and OLI underfly collections by 3 days which may have induced some bias in the SBAF. Overall the results are encouraging in that the direction of the differences is fairly consistent between two independent sets of results, i.e., using Libya 4 and simultaneous image pair statistics. However, it must be noted that less consistency is seen in the results in the NIR. Comparisons over Libya 4 using the time series approach show 2% agreement whereas comparisons done using underfly image pairs show about 4.5% differences in reflectance. A point of note, as seen in the Figure 9, is that results from these two independent sites agree to within ±2.0%. However these differences are within the natural variability of the Libya 4 site which is about 1%–2% as calculated from ETM+ measurements in Figure 8. Similar numbers were also reported by other stable instrument such as Aqua MODIS, over the Libya 4 site [28]. The plot on the right hand side of Figure 9 shows the cross-calibration results in radiance units, which is consistent with the reflectance-based results as described earlier. As in the reflectance based results, larger differences can be seen in NIR bands, especially when cross calibration is performed using simultaneous image pairs. It can be seen that differences between OLI and ETM+ are smaller when using Libya 4 sites compared to other sites. For Libya 4, all the TOA reflectance data from ETM+ and OLI time series are averaged together to make comparisons. Also an average SBAF of 108 scenes is considered rather than a single SBAF used for underfly image pairs and this may partially explain the larger bias in NIR band when using underfly statistics. Closer inspection of the plot also indicates that from band to band radiance-based cross calibration appears to be more consistent as compared to reflectance based results. However this does not indicate that the OLI radiance calibration is necessarily more accurate than the reflectance-based calibration. Figure 10 summarizes the difference between radiance and reflectance-based cross calibrations and these show how the difference between the OLI radiance and reflectance calibrations deviates from the ChKur spectrum. The differences between radiance and reflectance based cross calibrations are within ±0.5% for the green and red bands whereas the differences approach ±2% for blue, NIR and SWIR bands. It should be noted that earlier articles have reported the ESUN difference between various solar models can be greater than 3% depending on the spectral bands [11]. Therefore, TOA reflectance values derived for ETM+ may be different depending upon the solar models chosen. Readers are therefore cautioned that these differences between radiance and reflectance based cross calibration may vary depending on the solar models used.
Figure 9. Summarized plot of ETM+ and OLI cross-calibration results.
Remotesensing 06 12619 g009
Figure 10. Comparison between reflectance and radiance-based cross-calibration.
Remotesensing 06 12619 g010

5. Discussion on Atmospheric Uncertainties

When doing cross-calibration work between two sensors, there is always uncertainty in the correction for the differing RSR-induced effects of the atmosphere. In this section, an attempt is made to quantify the uncertainties due to the atmospheric conditions at the time of overpass between ETM+ and OLI. Two different cases are presented in this section. For both cases the “SBAF compensation” is a fixed value based on a mean computed across a multitude of atmospheric conditions. Case 1 represents an ideal case, where the satellites fly over on the same day with the same atmospheric conditions. In Case 2 the satellites come over on different days with potentially different atmospheric loadings. The atmospheric parameters were determined by looking at SDSU’s Modtran Atmospheric Correction Anytime Anywhere (SMACAA) database for Libya 4 over the course of a year—specifically 2013. This database is a compilation of numerous data sources including spaceborne and ground measurements, used to generate a 40+ year history of atmospheric loadings for the purpose of understanding how the atmospheric optical properties impacts imaging platforms, and how to correct for this impact. From the database, the mean value and ± one standard deviation for each atmospheric value was determined. 
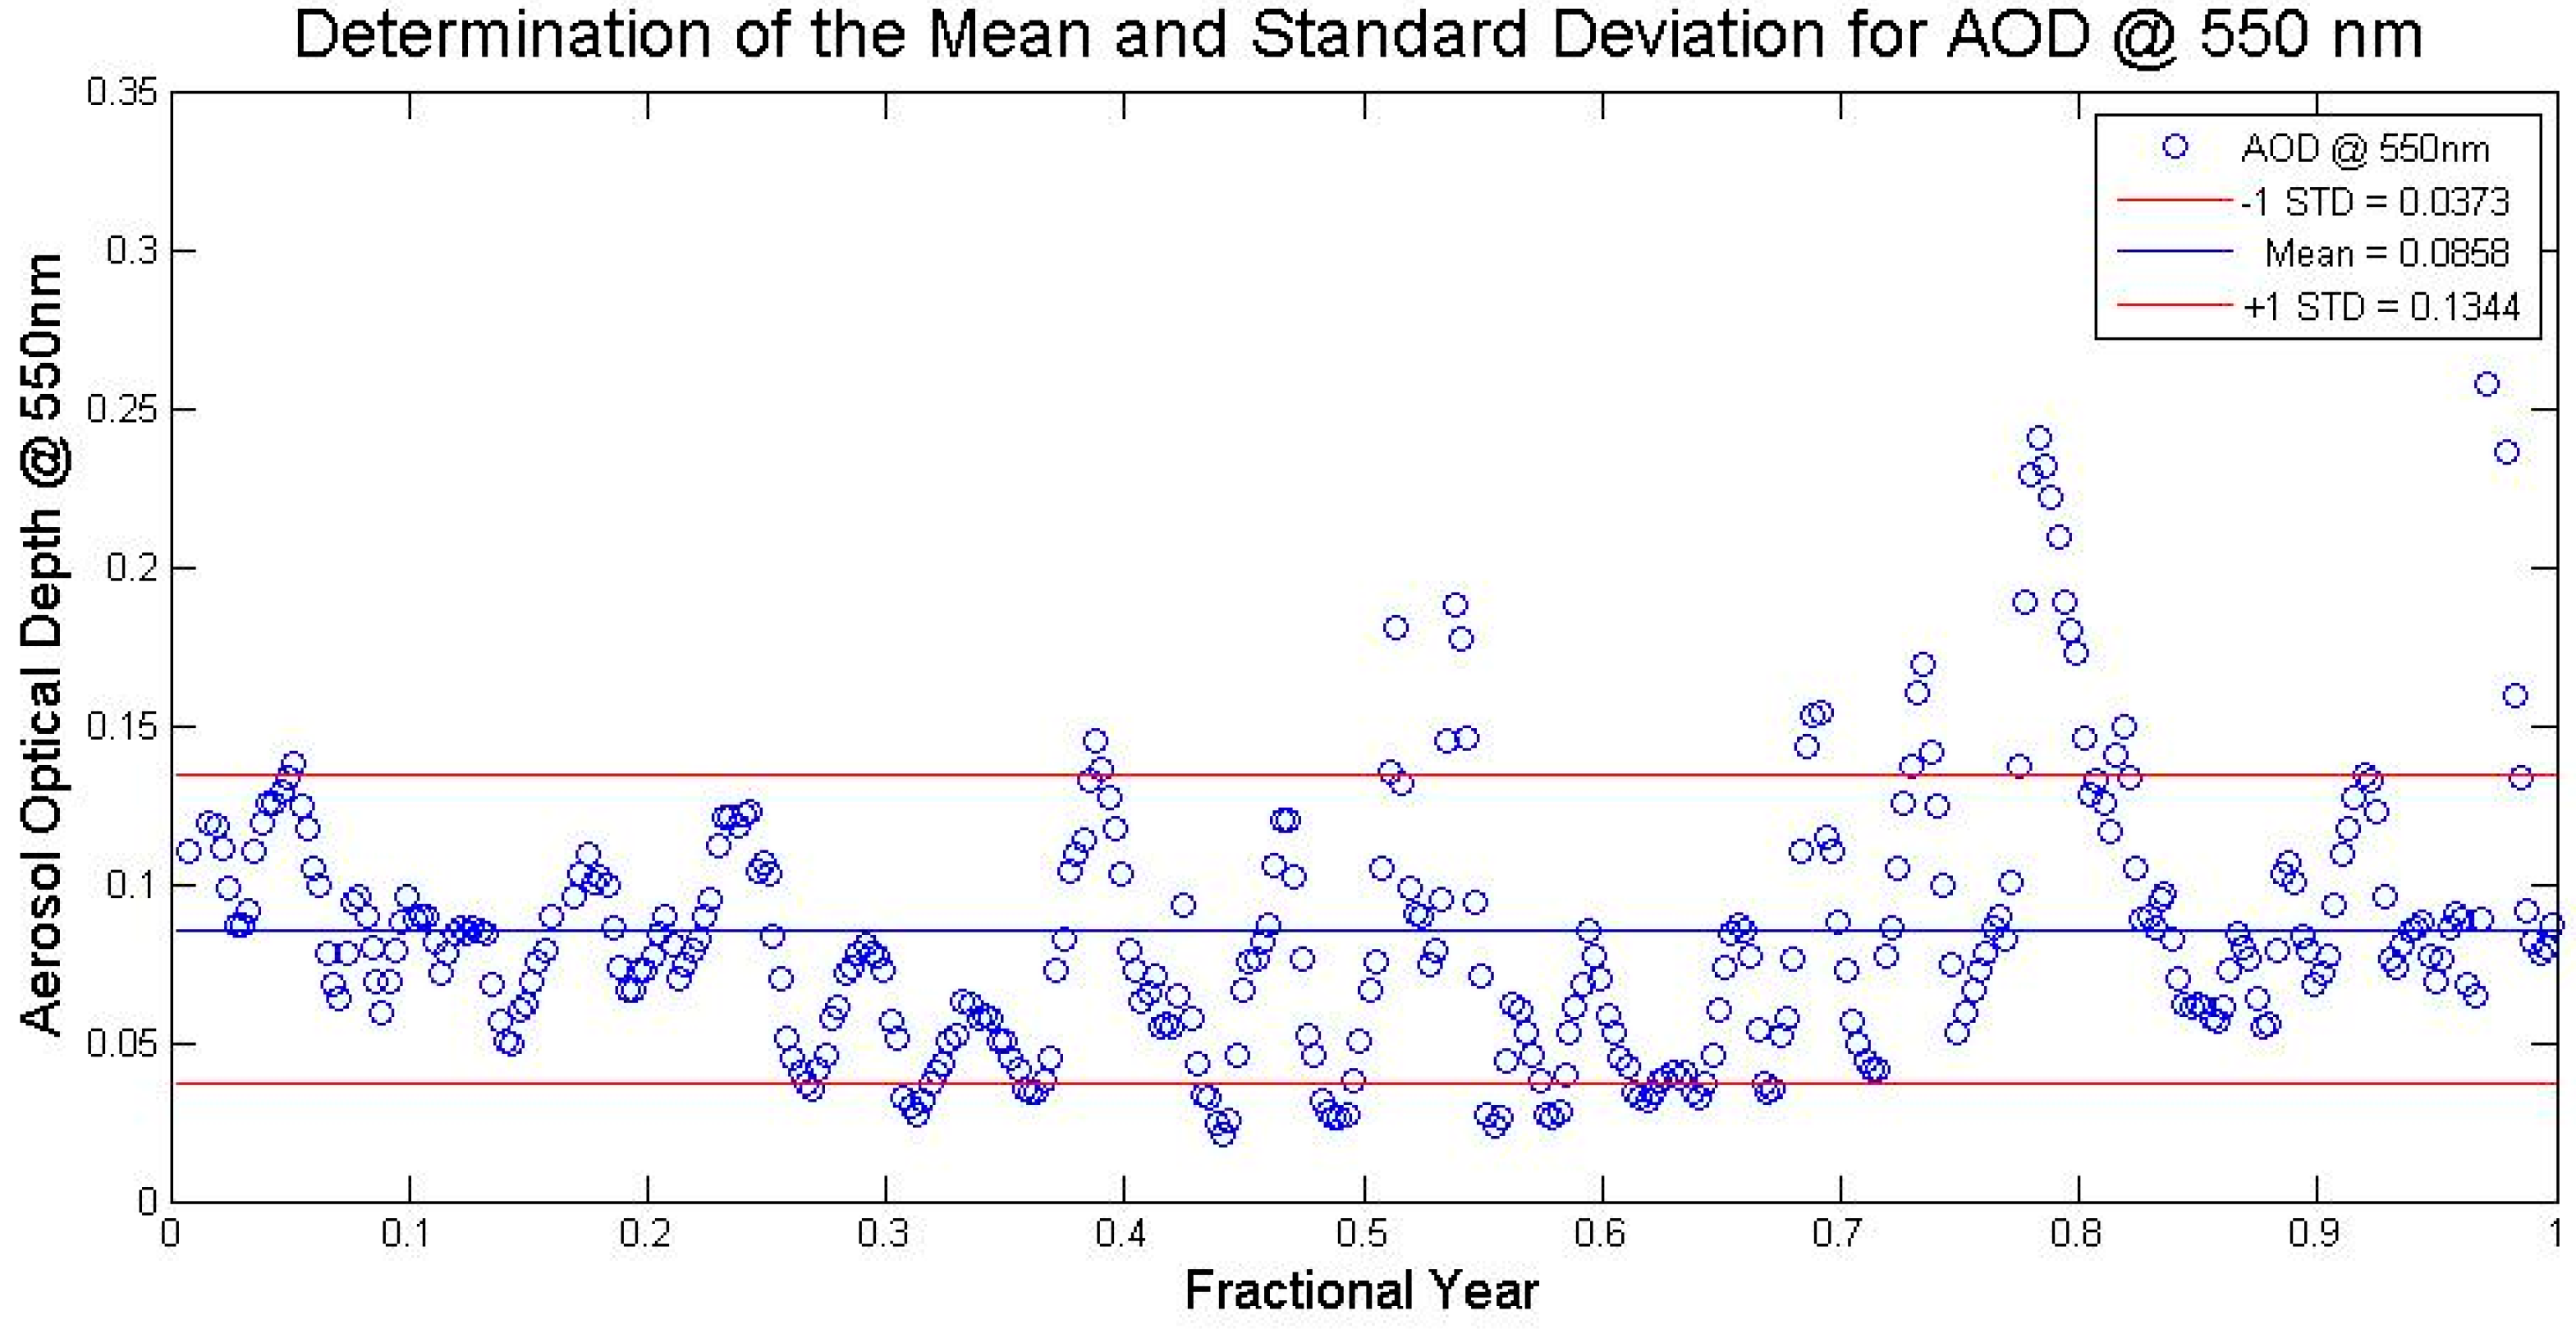
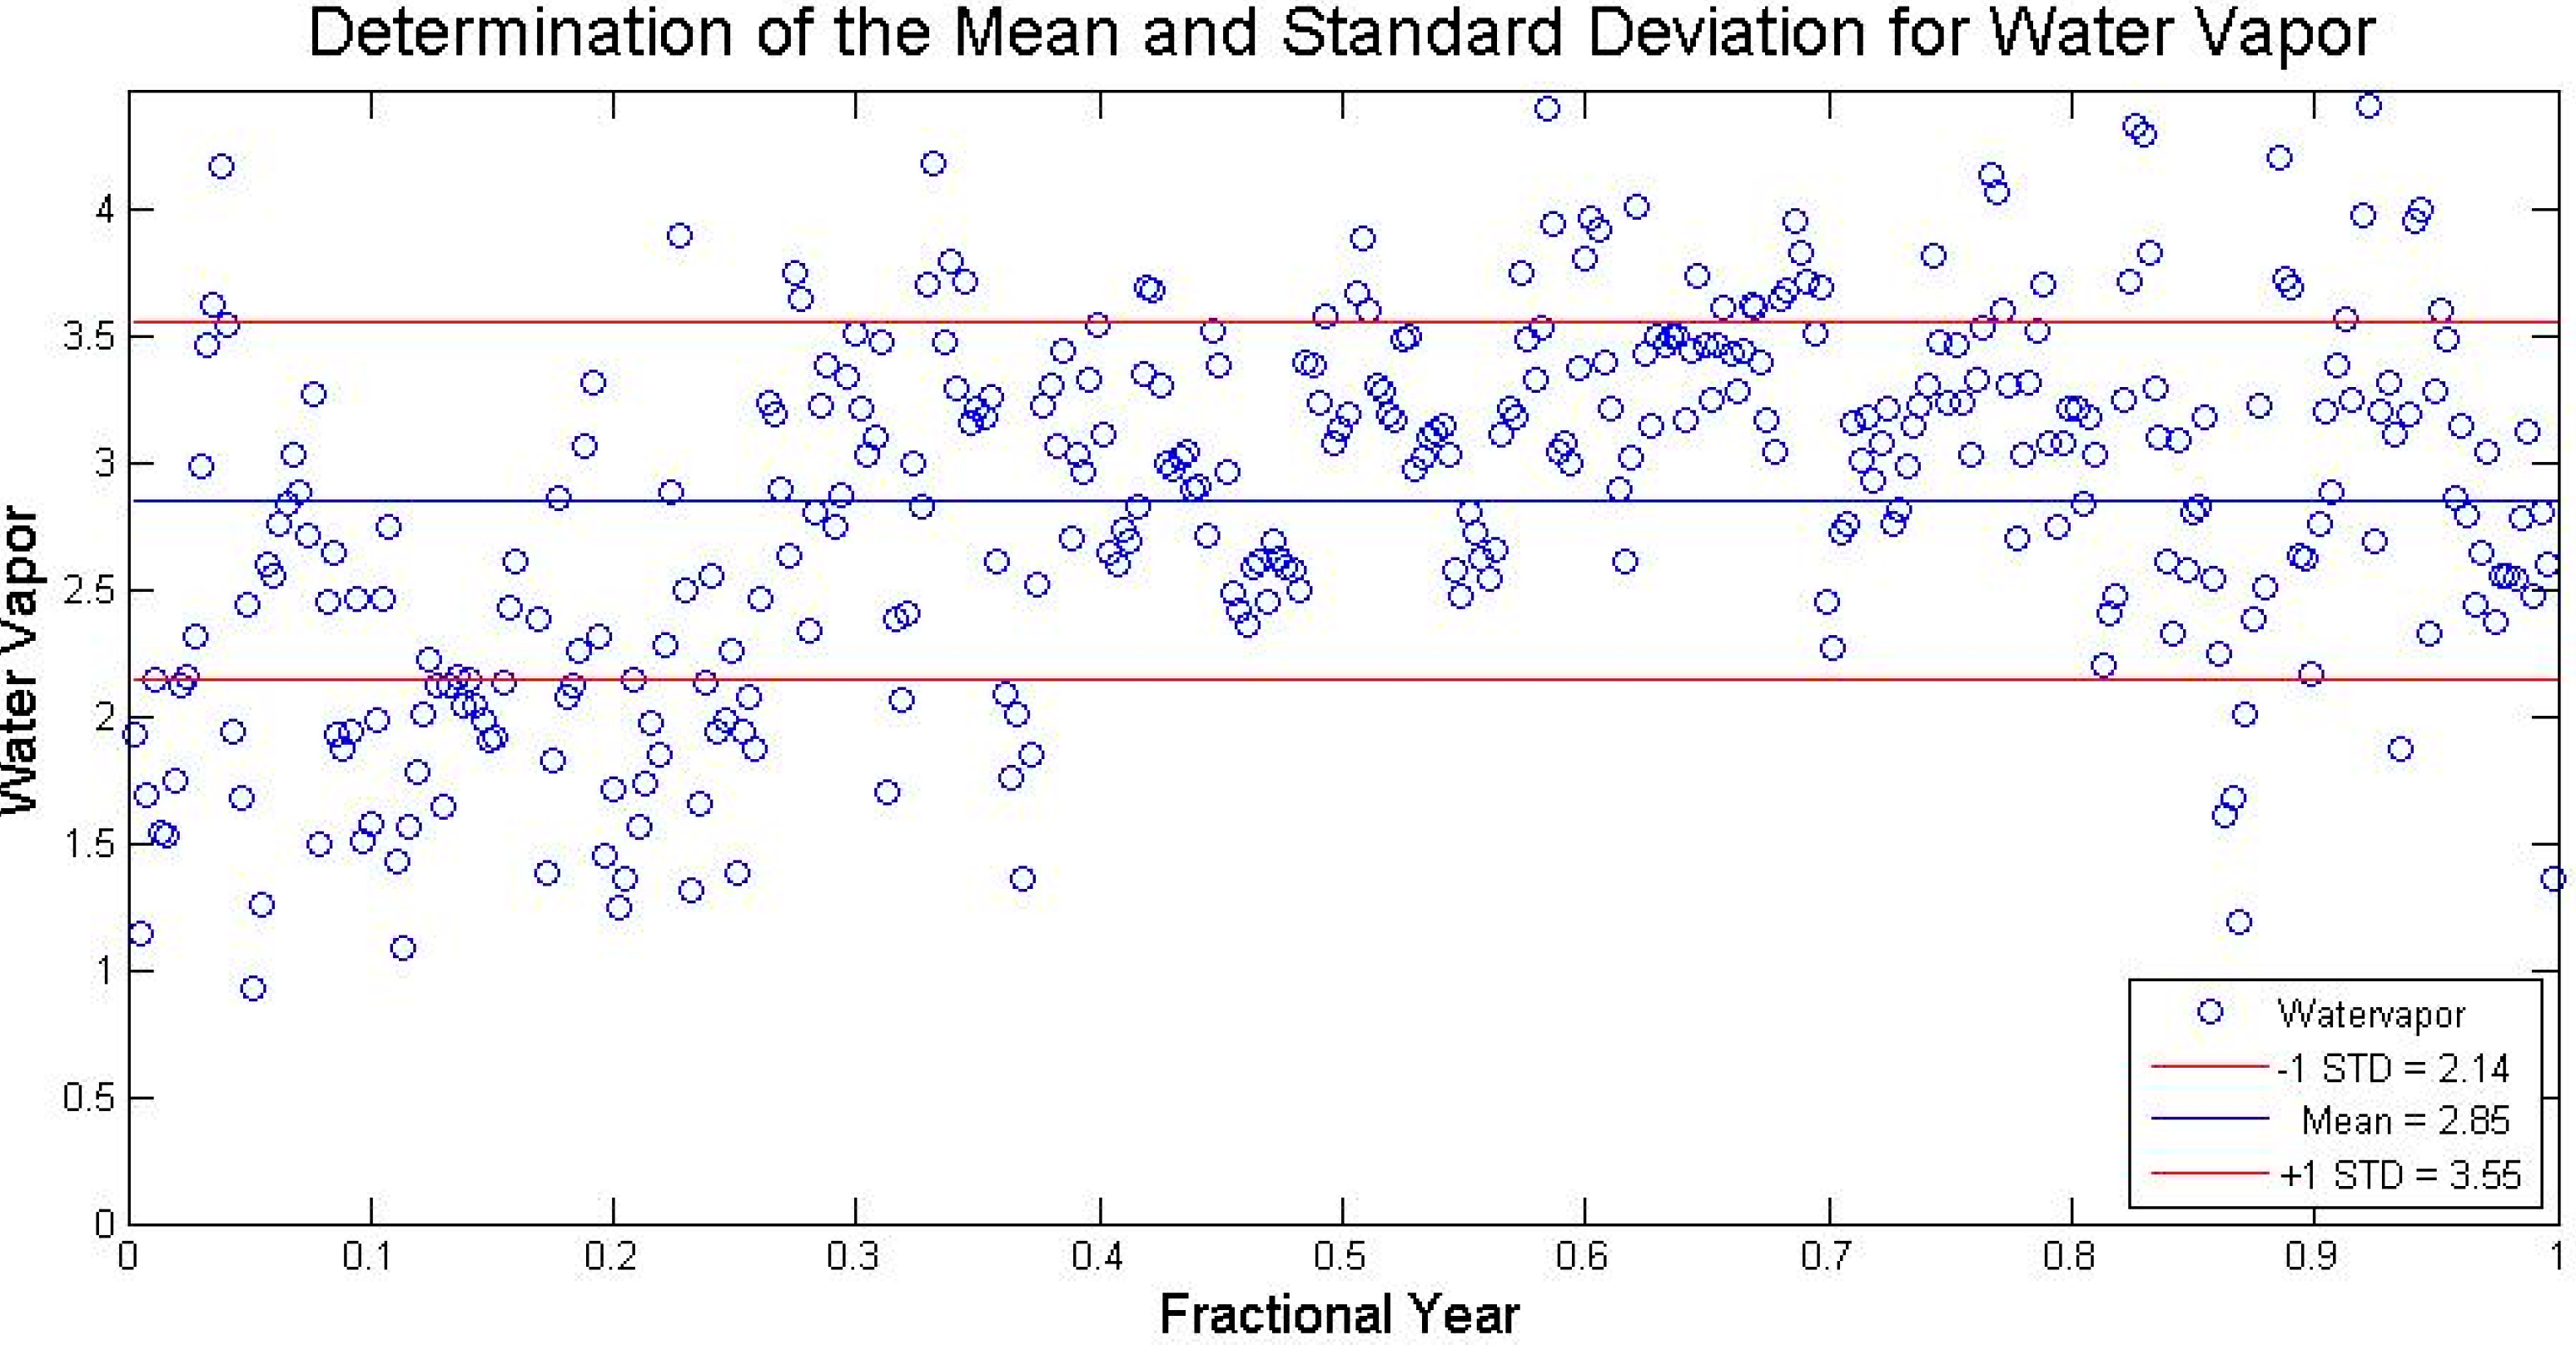
Figure 11 shows the aerosol loading over Libya 4 for 2013, along with the calculated mean and +/− one standard deviation levels. These three values are used in the simulations to determine the impact of aerosol on the cross calibration of the two sensors. The mean Aerosol Optical Depth (AOD) for Libya 4 for 2013 is 0.11 with a standard deviation of ±0.06. Similarly, an evaluation of water vapor was performed, and is shown in Figure 12. The results show that the mean columnar water vapor over the Libya 4 test site is 2.8 g/cm2, with a standard deviation of ±0.7 g/cm2.
Figure 11. Aerosol levels over the Libya 4 test site.
Remotesensing 06 12619 g011
Figure 12. Water vapor levels over the Libya 4 site.
Remotesensing 06 12619 g012
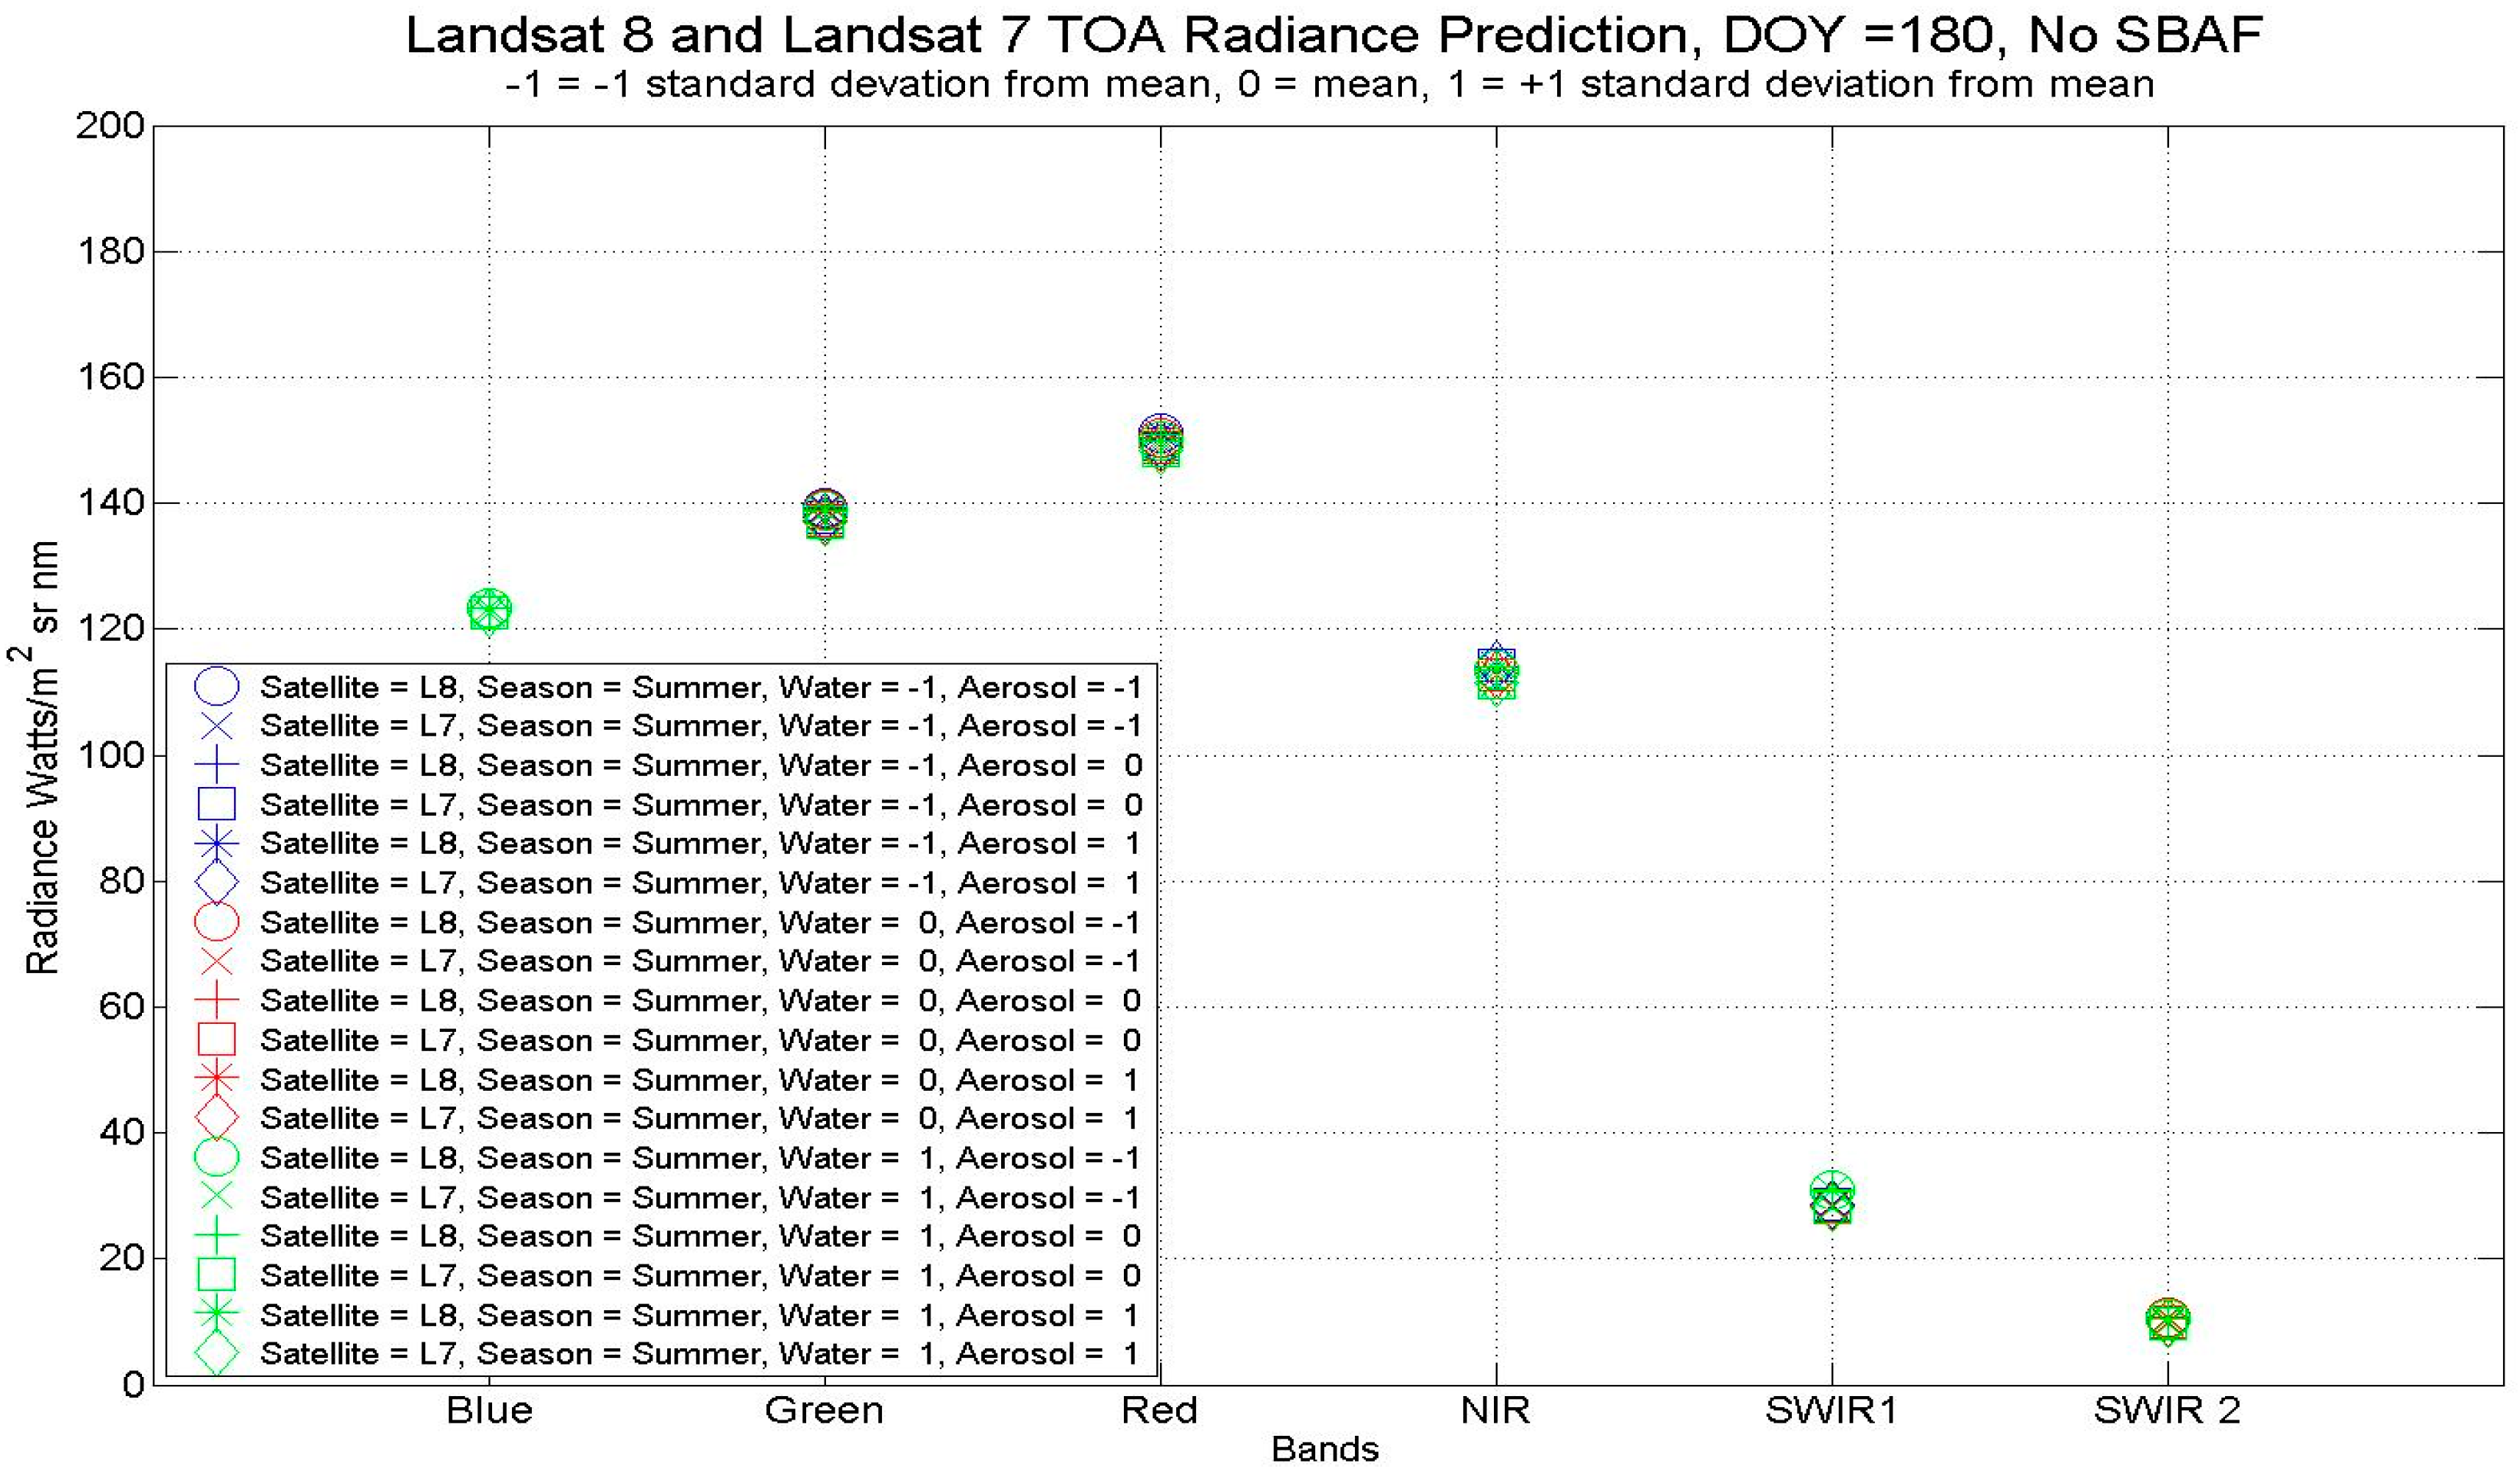
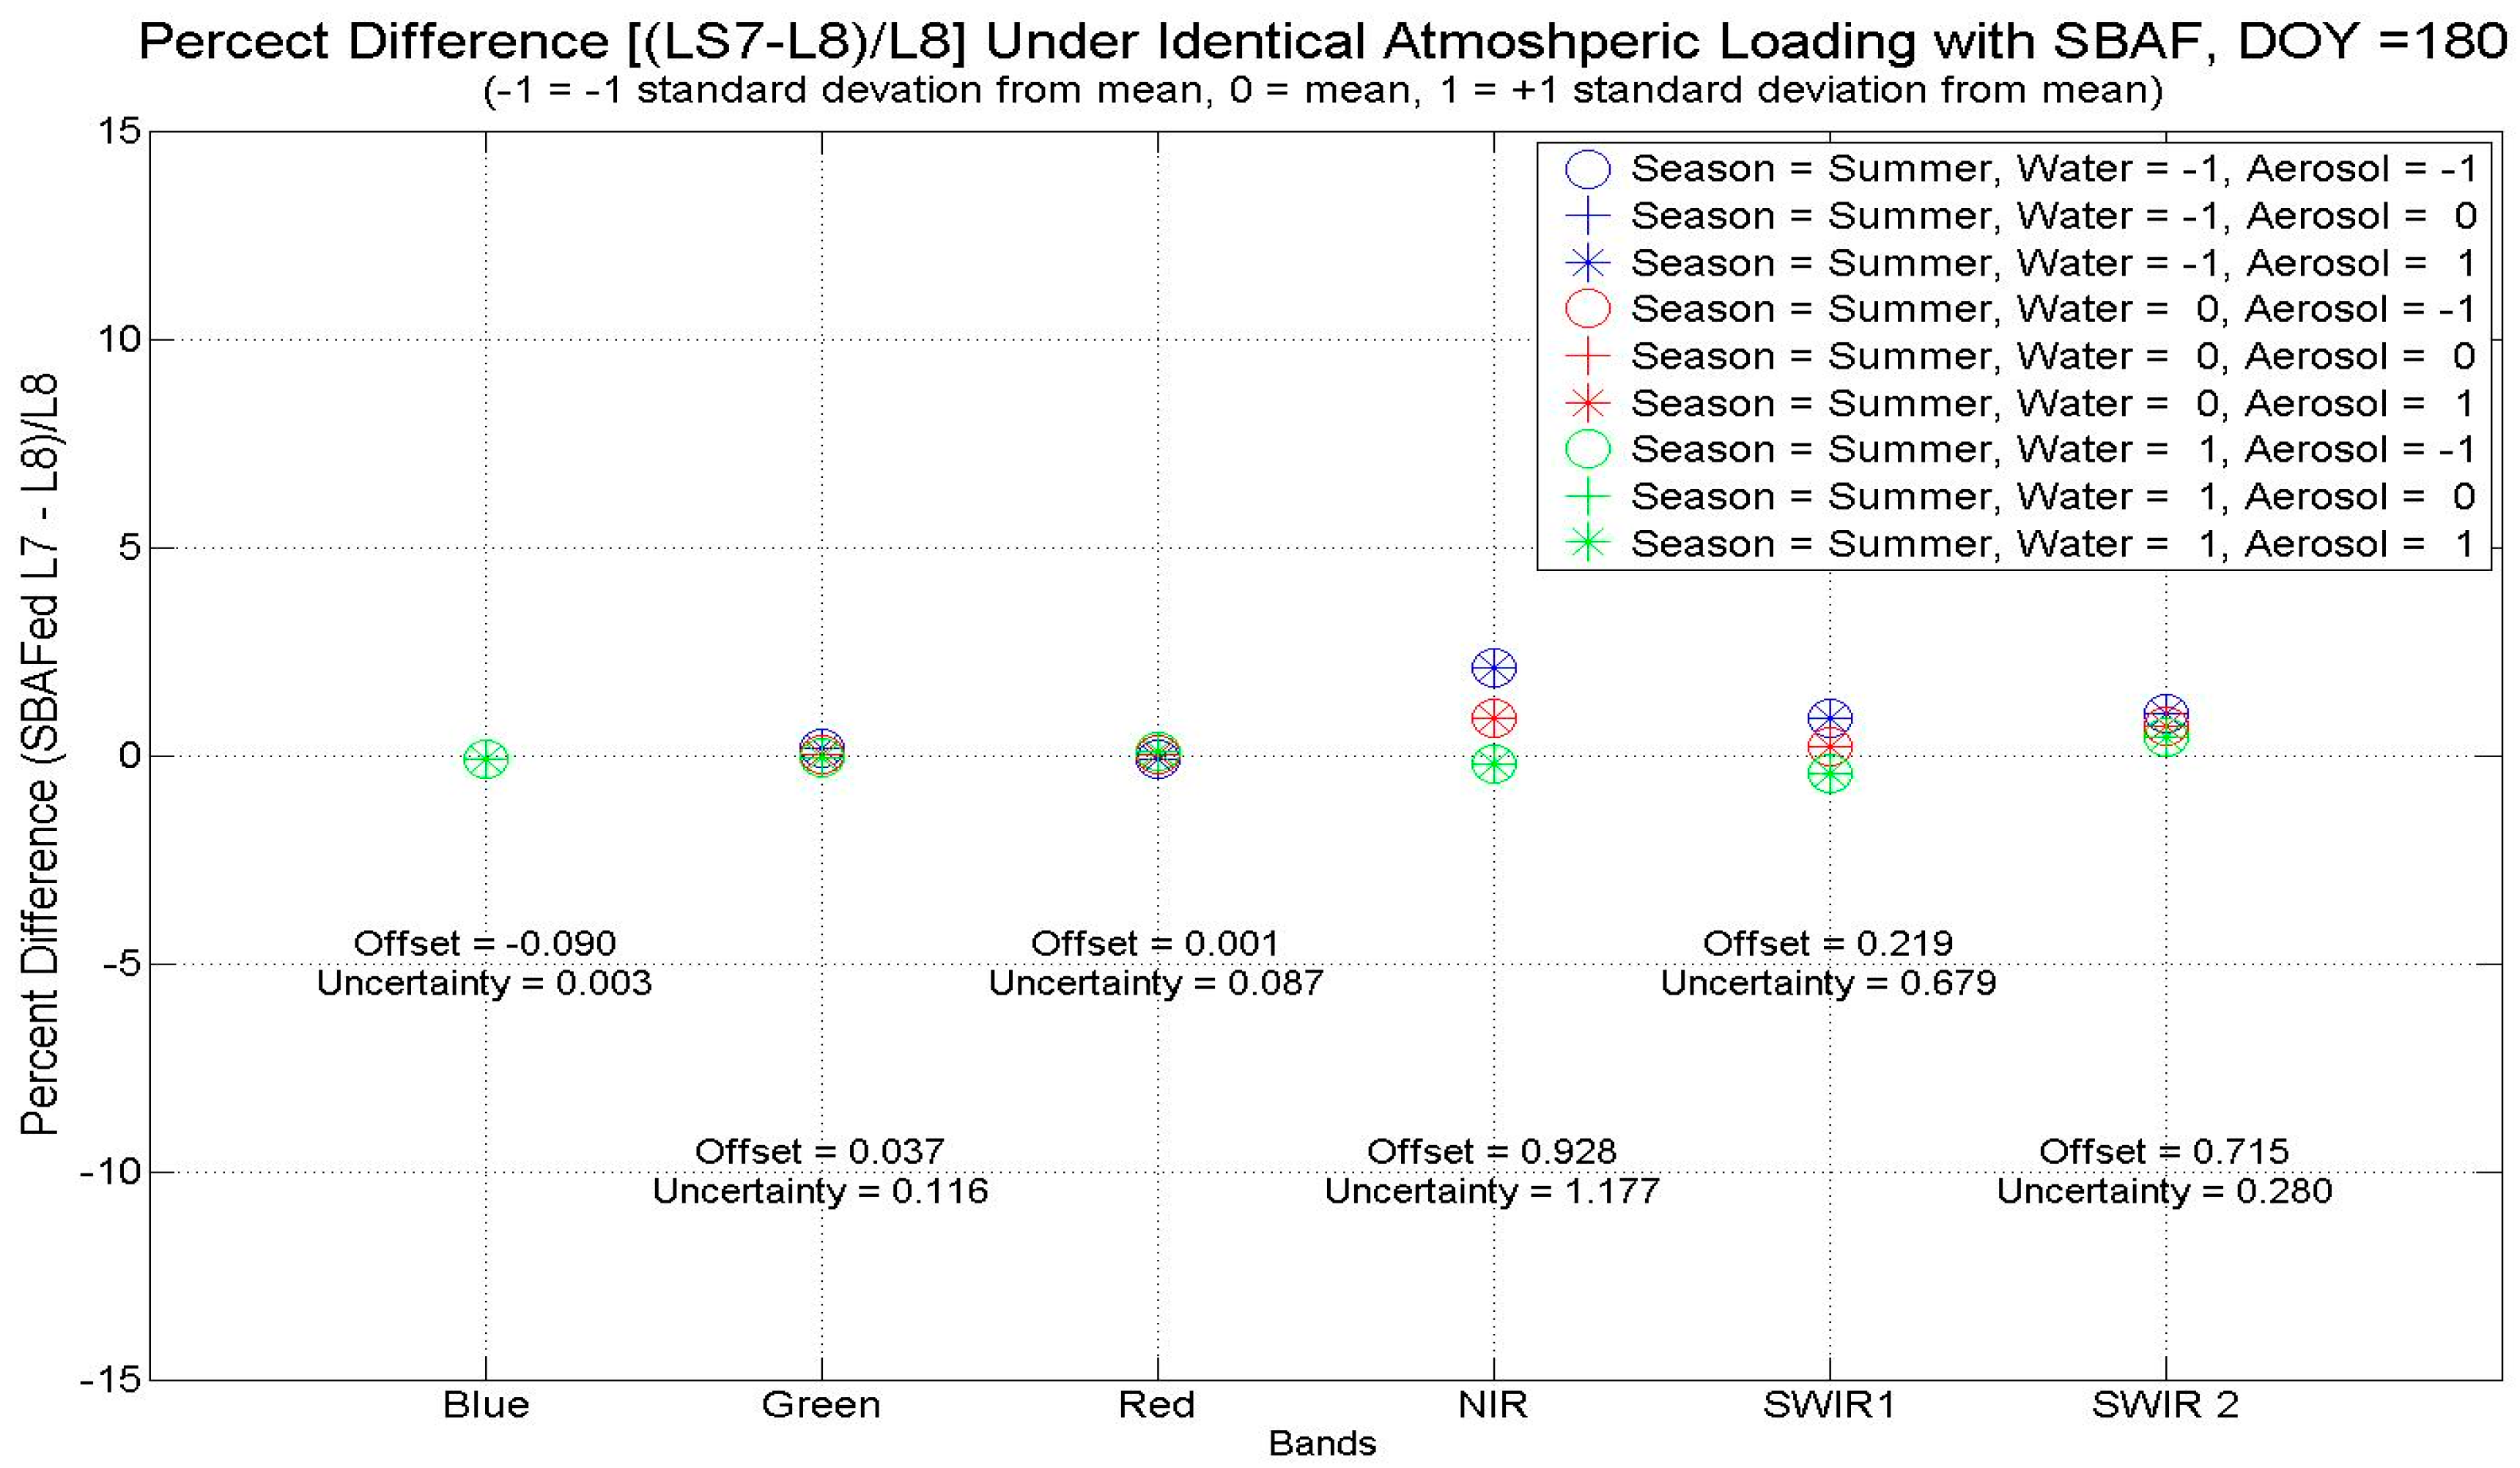
For Case 1, all combinations of mean, plus one standard deviation, and minus one standard deviation for water vapor and aerosol are simulated. This simulation produces nine different atmospheric loading conditions for the top of atmosphere predictions for the two sensors, in this case Landsat 7 and 8. Case 1 simulates the acquisition of both sensors simultaneously over the test site. The case was simulated for a summer date since the atmosphere has seasonal loading patterns. The results of those simulations can be seen in 
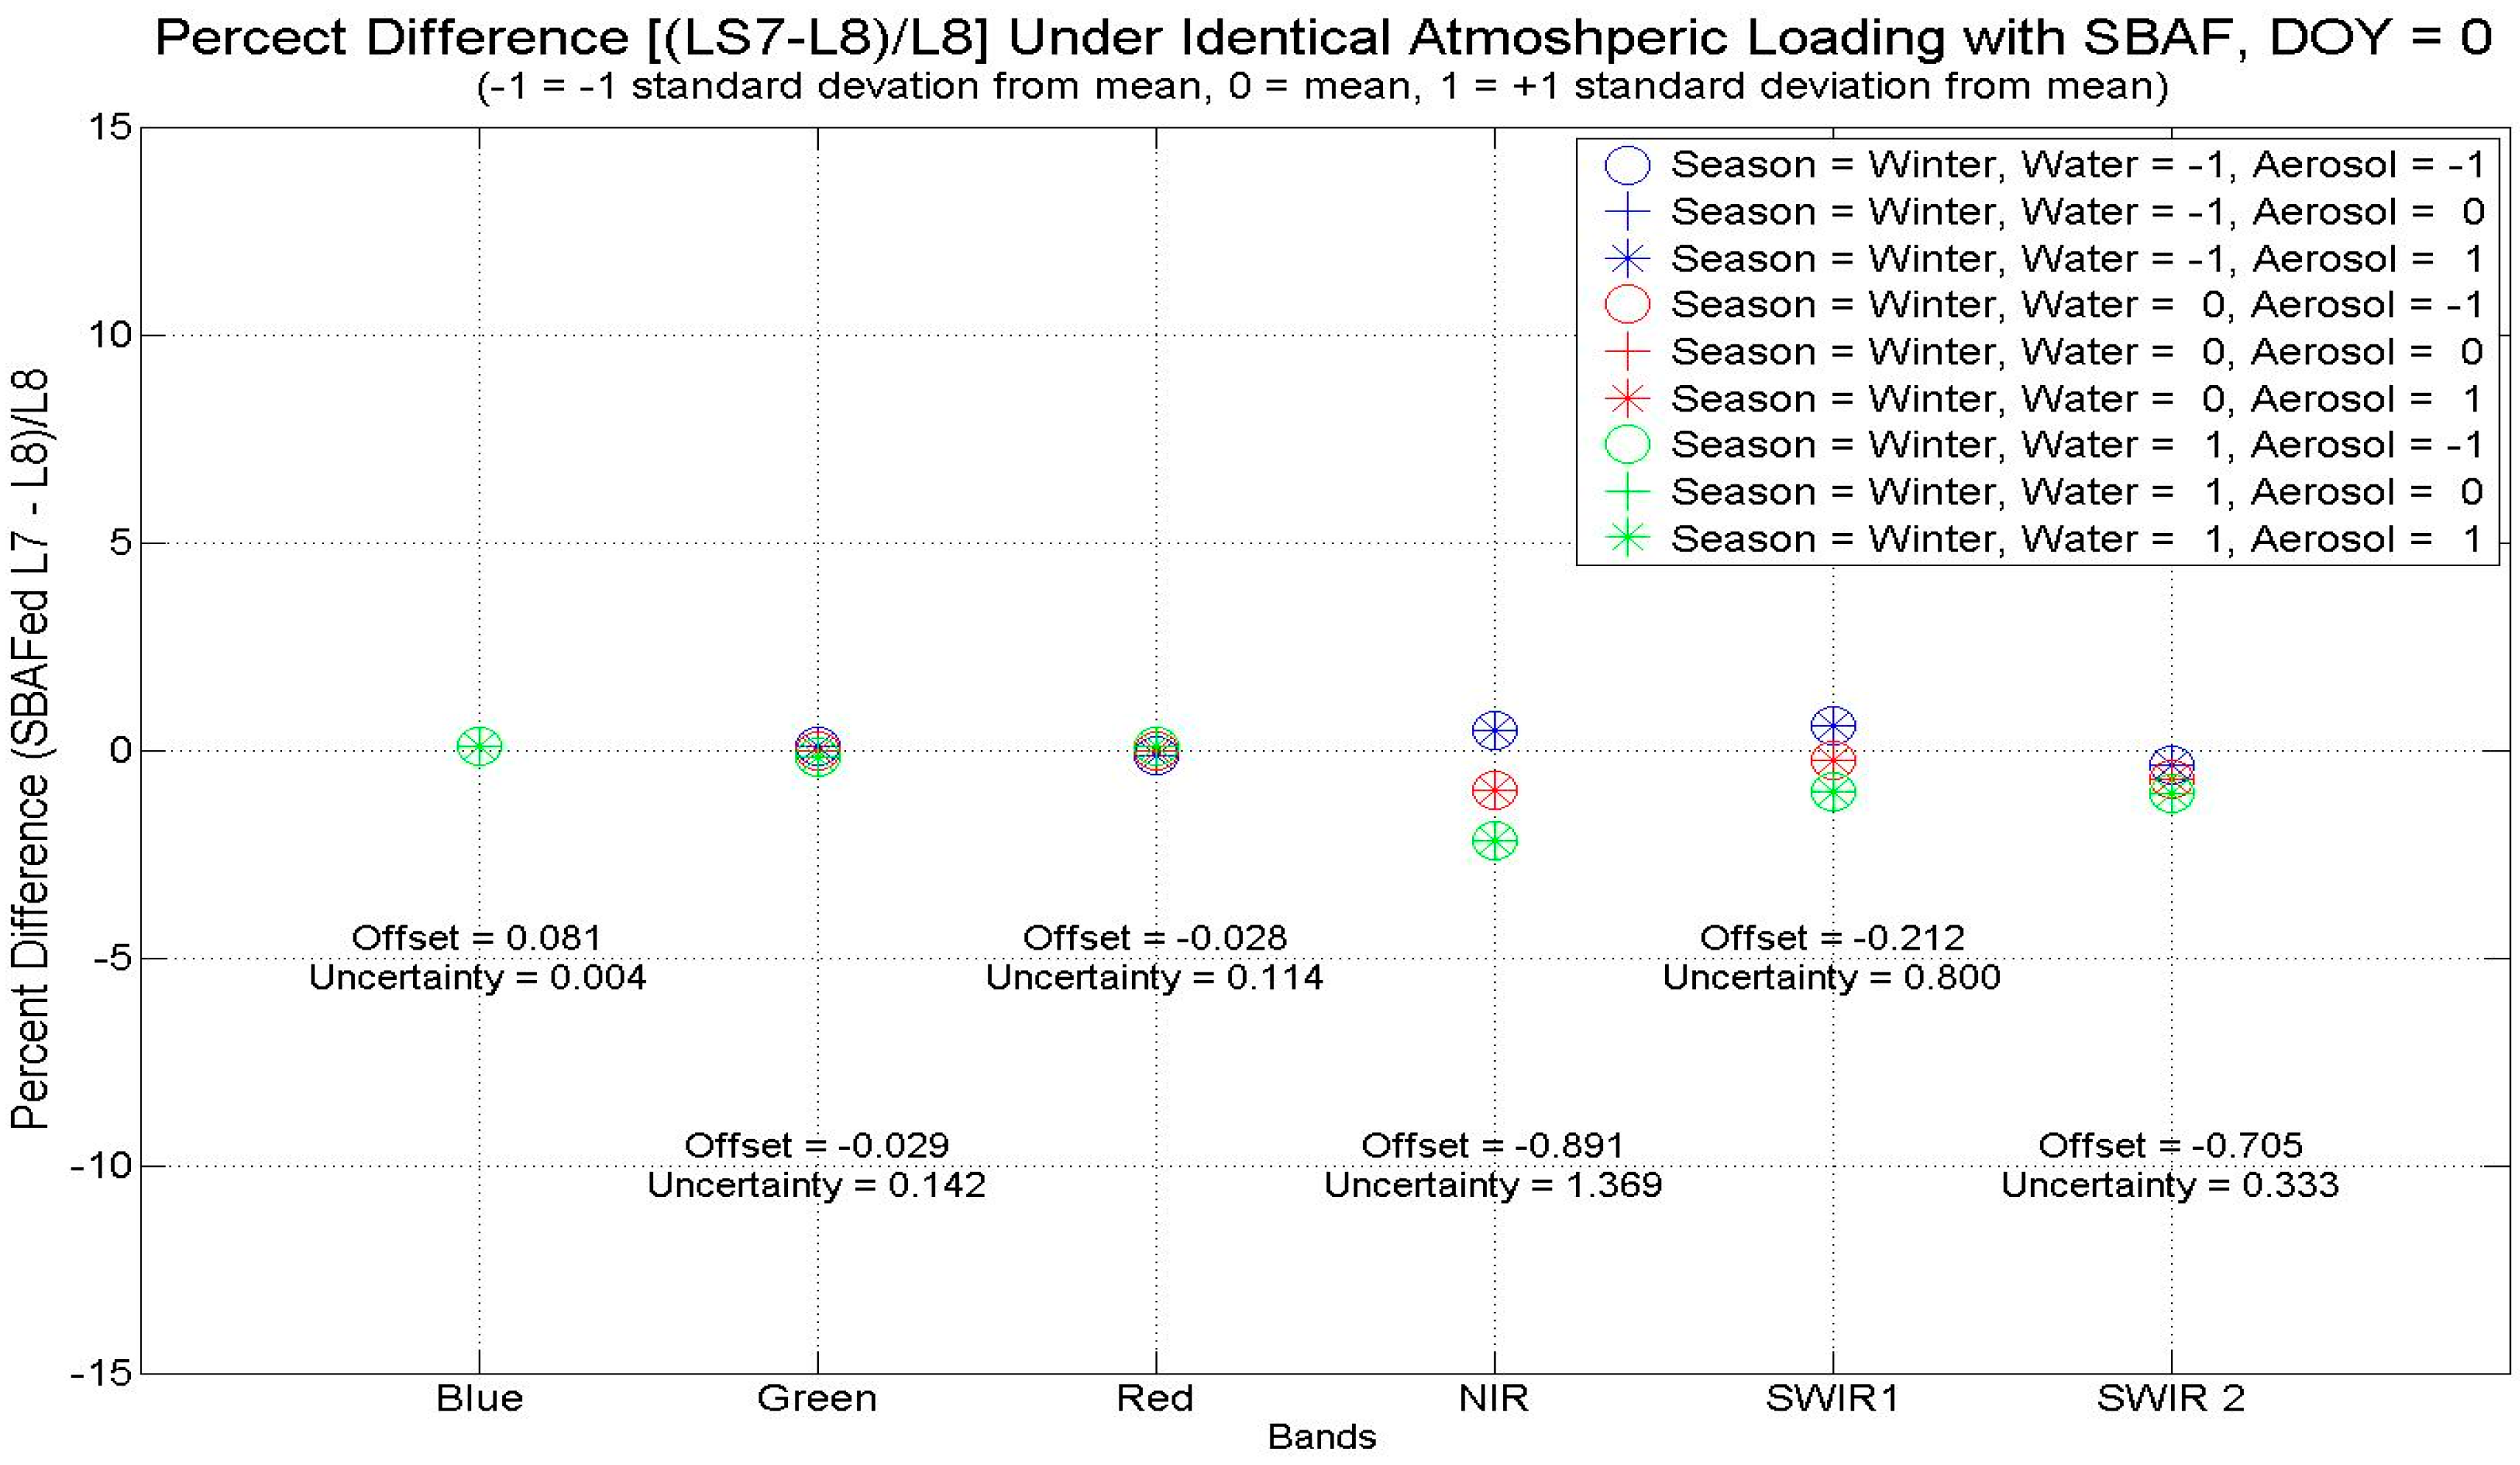
Figure 13 where all 9 scenarios are plotted for both Landsat 7 and 8. After that an atmospherically independent SBAF is applied and the percent difference between the sensors is plotted for the 9 different cases in Figure 14 and Figure 15; this provides the percentage difference between ETM+ and OLI for summer and winter respectively. We can observe that a minor offset exists between the two sensors across the bands. This offset is due to the fact the SBAF correction was calculated as a generic year averaged SBAF and is not date specific. Ideally a SBAF should be calculated for each individual scene pair because on any given date the TOA spectral profile is influenced by sun and satellite view geometry and the atmospheric conditions. The bias is a small concern at this point; the spread in the points the bigger concern and as it represents the uncertainty to each band due to atmospheric effects. Looking at the graphs, the effect of various aerosol loadings on cross calibration is negligible at the shorter wavelengths, as indicated by the uncertainties. The results are summarized in Table 3 which shows that if ETM+ and OLI were to image the target at the same time through the same atmosphere, the uncertainties due to varying atmosphere loading differences would be less than 1%, except for the NIR bands because of the reasons alluded to in the earlier section.
Figure 13. Radiance levels predicted for the Libya 4 test site.
Remotesensing 06 12619 g013
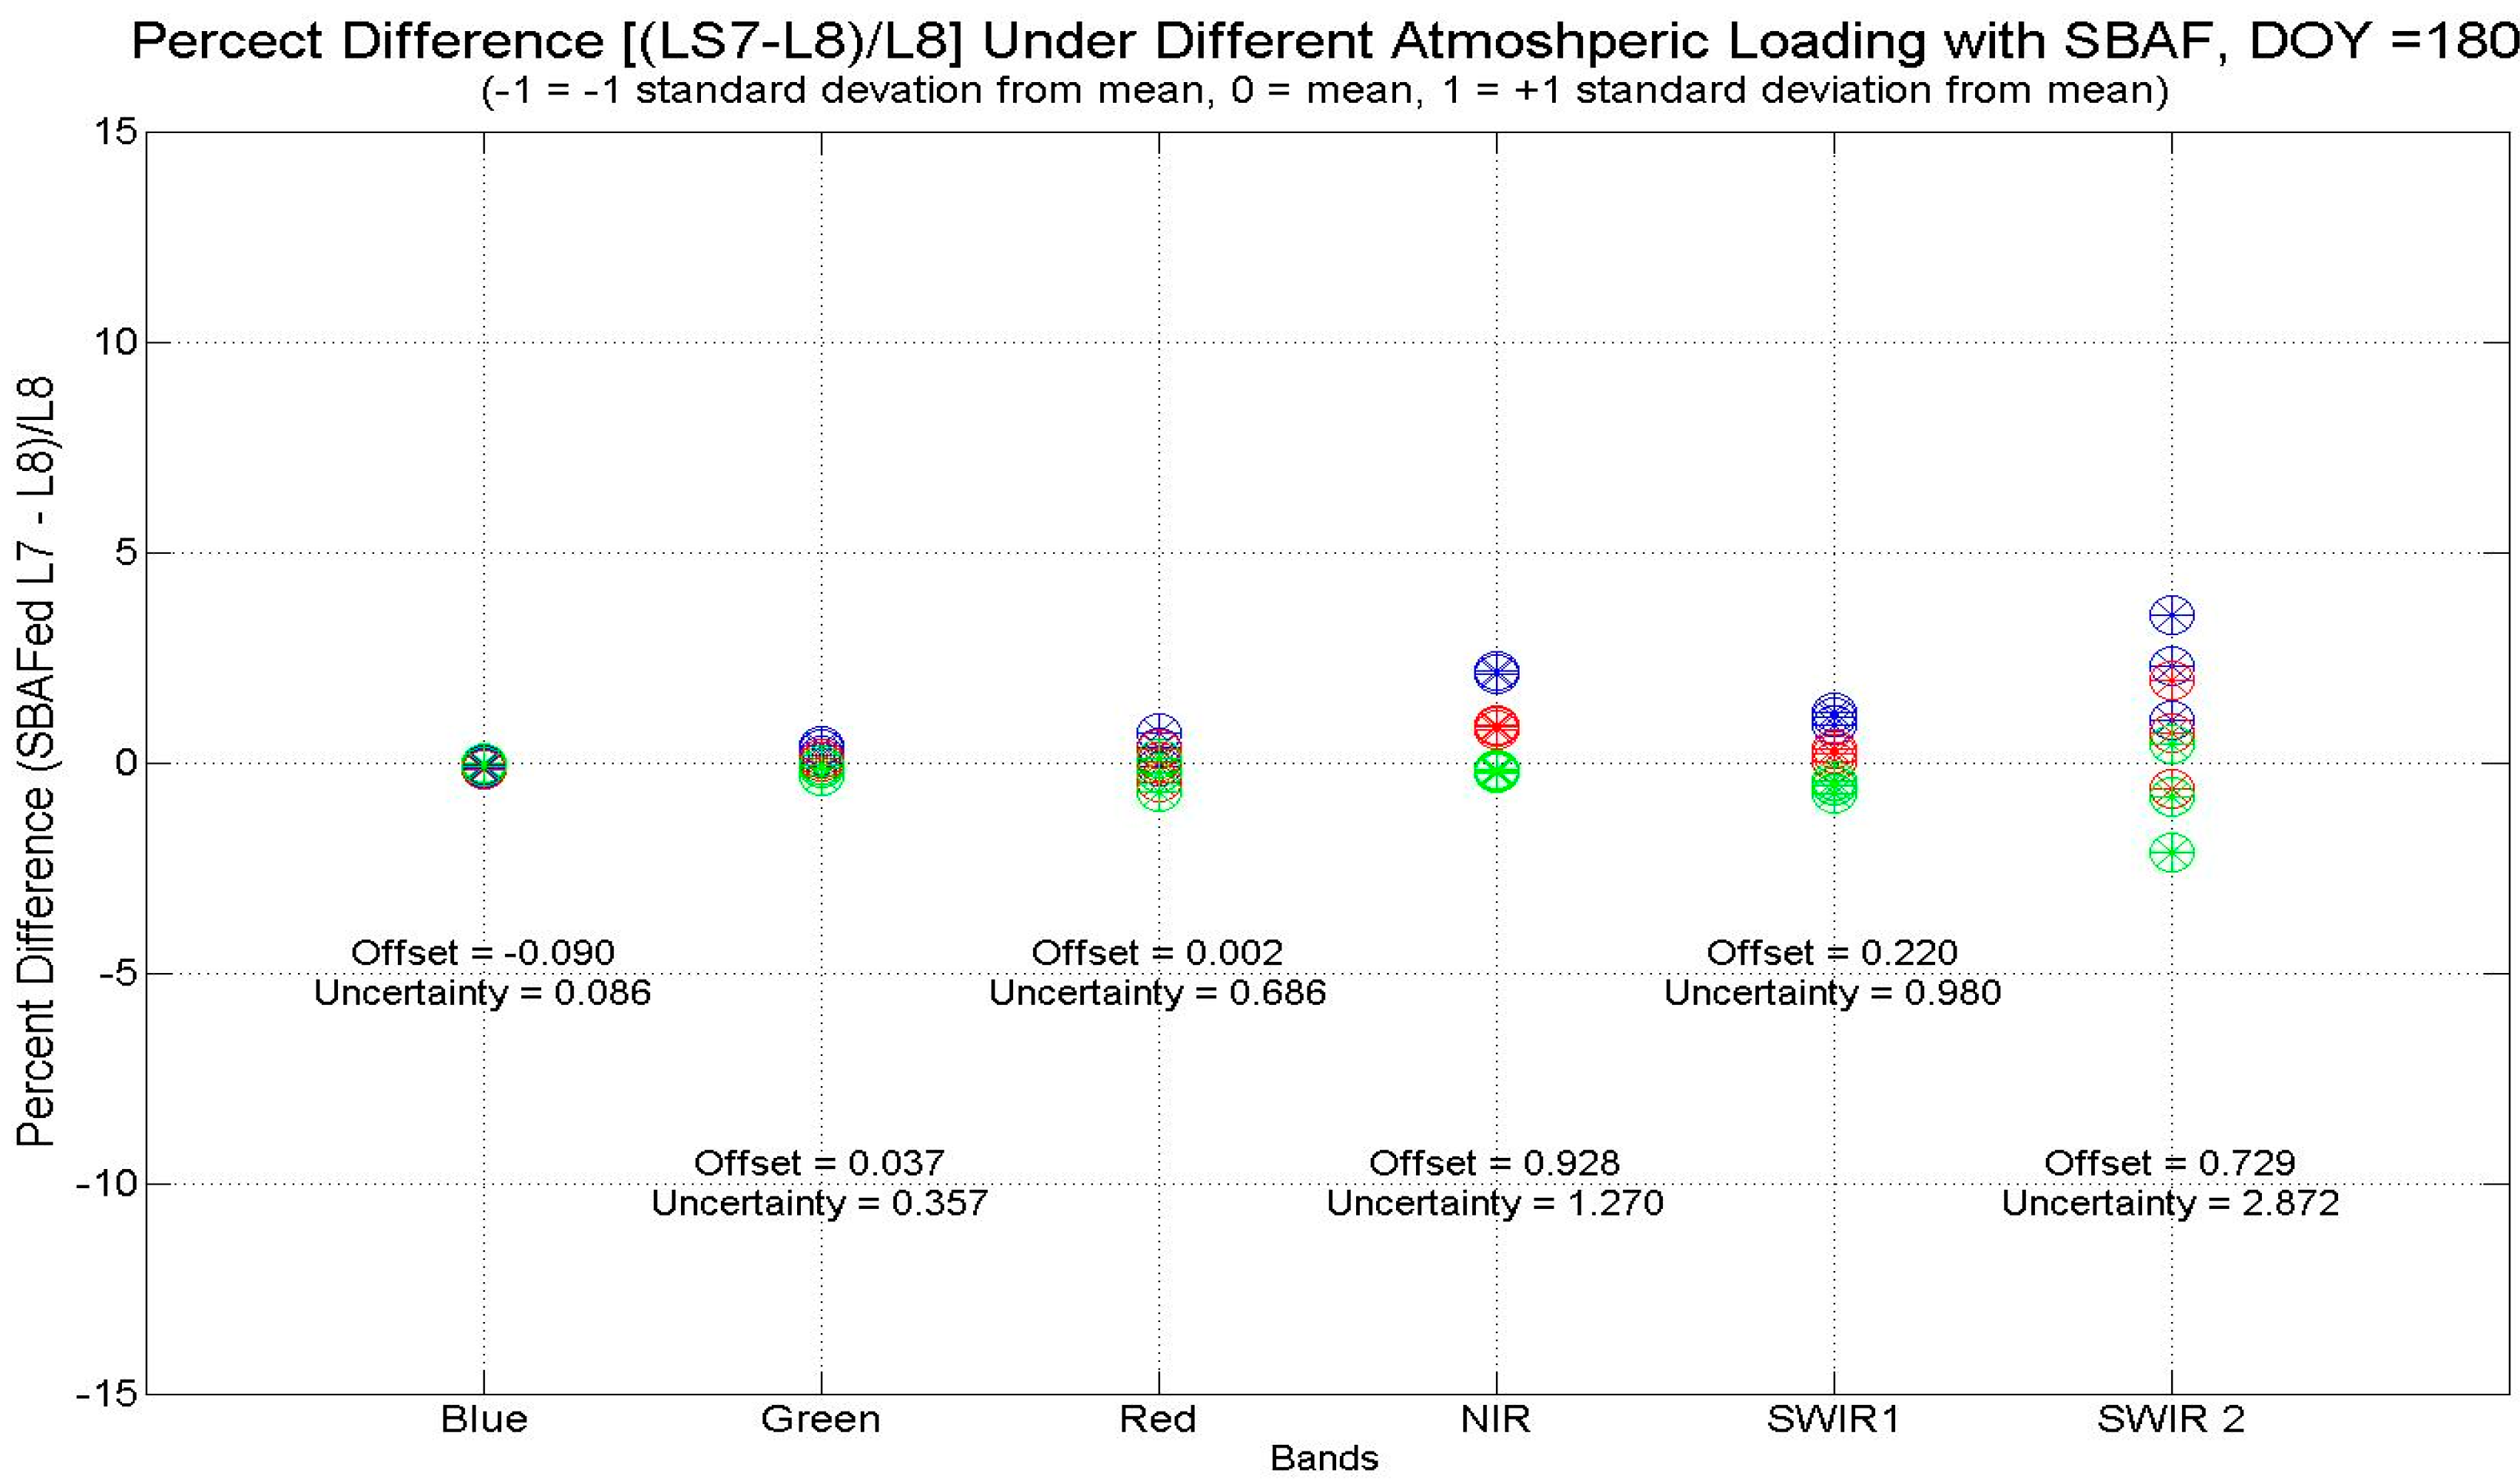
As stated earlier, Landsat 7 and 8 are off cycle by 8 days; this offset leaves the possibility for large fronts to come over, and cause dramatic changes to the atmospheric makeup. So now consider the 9 previous versions of atmospheric loadings, and compare all possible combinations. For every unique loading of the atmosphere it’s compared to the other 9 version (9 × 9) which produce 81 cases. Results of this evaluation are shown in Figure 16. As before the very minor bias is due to the fact that a generic SBAF correction was applied. The spread in the analysis is the more important feature here, and represents the effect of various atmospheric loadings as it applies to cross calibration. As was seen in Figure 15, the effect of aerosol loading has a minimal impact, while the water vapor loading effect is much more pronounced in the NIR and SWIR bands, particularly in the SWIR 2 band. Similarly Figure 16 shows the percentage difference between L7 and L8 for non-coincident looks in the summer months.
Figure 14. Percent difference between L7 and L8 coincident looks—Summer.
Remotesensing 06 12619 g014
Figure 15. Percent difference between L7 and L8 coincident looks—Winter.
Remotesensing 06 12619 g015
Table 3. Atmospheric uncertainty for same day coincident cross calibration over Libya 4.
BlueGreenRedNIRSWIR1SWIR2
Summer0.003%0.116%0.087%1.177%0.679%0.280%
Winter0.004%0.142%0.114%1.369%0.800%0.333%
Figure 16. Percent difference between L7 and L8 non-coincident looks—Summer.
Remotesensing 06 12619 g016
Table 4 shows the results for the uncertainty that could be assigned to atmospheric loading for atmospheres varying between ± one standard deviation of the mean atmosphere for Libya 4. The results show great agreement for all but the SWIR 2, which approached the 3%–4% uncertainty level. This maximum level would represent a change in atmosphere water vapor levels changing from +1 STD “wet” to −1 STD “dry” over the course of 8 days or vice-versa. While this seems to be an extreme possibility based on Figure 12, the likelihood of this occurrence is nonzero.
Table 4. Atmospheric uncertainty for different day cross calibration over Libya 4.
BlueGreenRedNIRSWIR1SWIR2
Summer0.086%0.357%0.686%1.270%0.980%2.872%
Winter0.118%0.440%0.865%1.493%1.204%3.513%

6. Conclusions

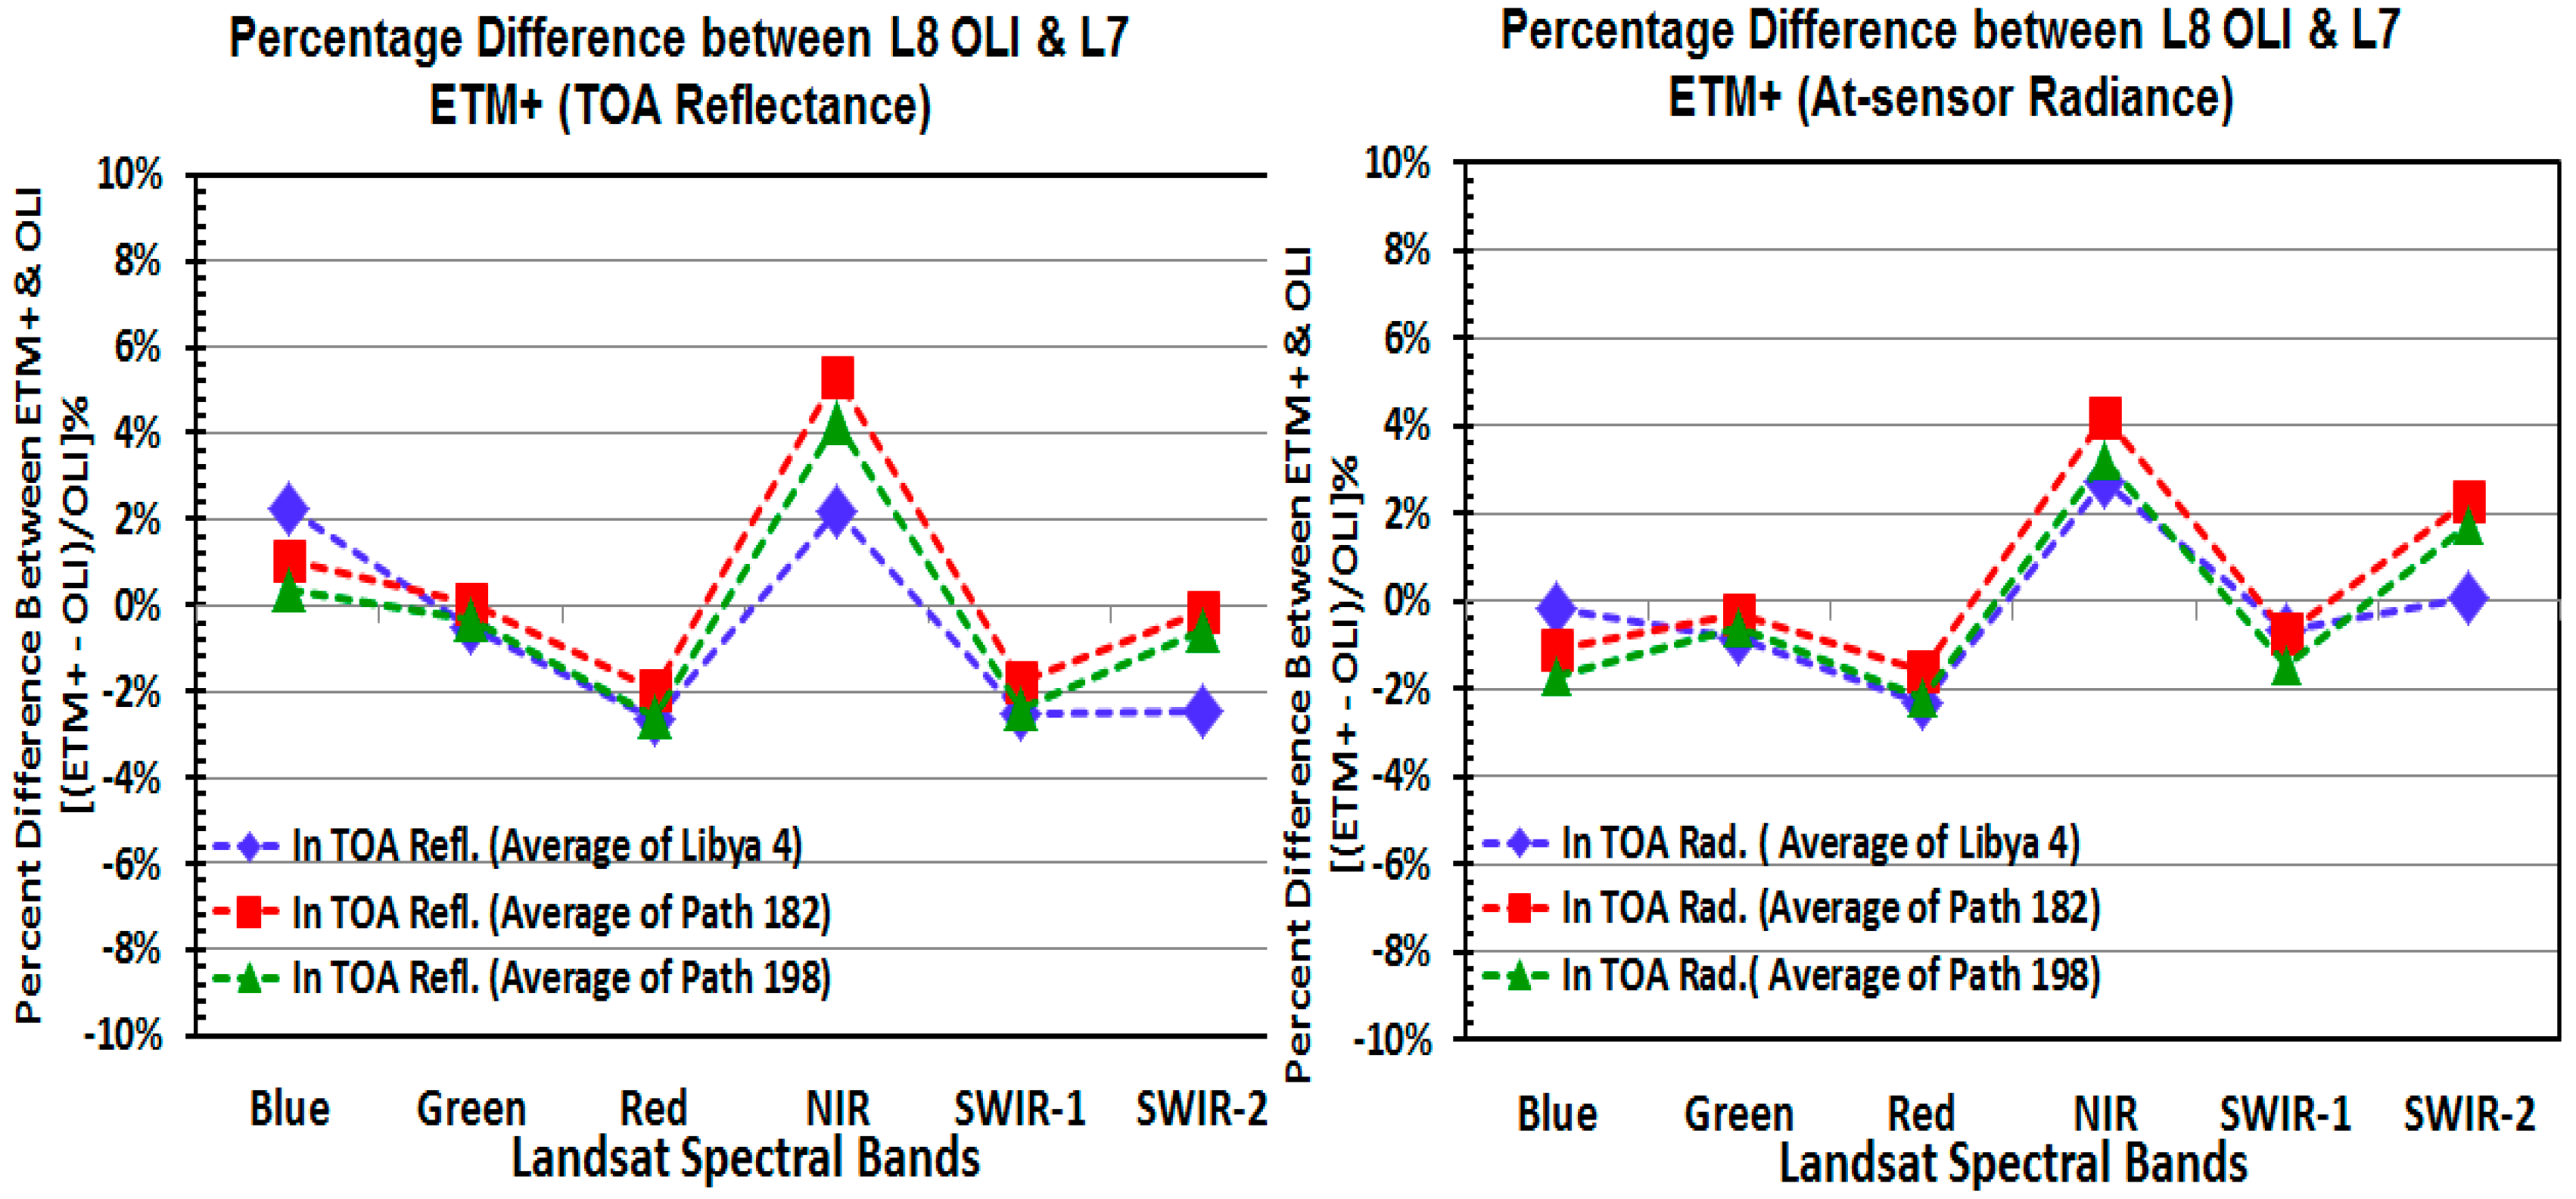
This article presents the results of early cross-calibration between the reflective bands of L8 OLI and L7 ETM+. This article describes a cross-calibration approach based on using time series statistics over the Libya 4 PICS location and using simultaneous collects from the two sensors during the underfly maneuver in March 2013. EO-1 Hyperion images were used to quantify the spectral signature of the applicable target area. Results show that, in general, OLI agrees to better than ±2.5% with ETM+ in both radiance and reflectance space. The deviation from this behavior is the NIR bands where differences approached 4% in both radiance and reflectance space. The radiance and reflectance-based cross-calibration results agreed to ±2%.
It should be noted that differences of 4% are within the ±5% radiance uncertainty requirement for OLI. Also, even in reflectance space, with OLI at ±3% and ETM+ at ±5%, the difference of 4% is within the joint error bars. Studies are on-going to make radiance and reflectance-based calibration more consistent. Therefore, the work presented not only provides a confidence in the radiometric calibration of OLI; it also shows a good radiometric compatibility of the OLI bands to ETM+. The remaining differences and the associated uncertainties can be further understood by knowledge of the intervening atmosphere at the time of overpass. This is especially important as multiple sites are being used for cross calibration and given the fact that the spectral bandpasses are dissimilar, the instruments respond somewhat differently to atmospheric absorption features such as water vapor absorptions. Atmospheric uncertainties due to overpass differences were deemed to be a major source of uncertainty, especially at longer wavelengths as analysis over Libya 4 PICS showed that a difference of 1%–4% can be expected depending on atmospheric conditions at the time of year and overpass. PICS-based calibration has been vital to the general calibration/validation strategy of the Landsat instruments. As more images become available in the archive, the Calibration Validation Team (CVT) at NASA Goddard Space Flight Center (GSFC), the USGS Earth Resources Observation and Science (EROS) Center and SDSU will continue to monitor OLI trending over PICS and this will provide an independent means (other than onboard calibrators) to monitor the stability of the OLI instrument. Future work also includes using PICS-based inter-calibration approaches to validate all the Landsat sensors (Landsat 1–Landsat 8) with respect to a consistent radiometric scale. This work will be done, first in terms of relative calibration and then by absolute calibration.

Acknowledgments

The authors would like to thank the Landsat Calibration/Validation Team at the USGS EROS Data Center and NASA Goddard Space Flight Center for their advice and feedback on this project. We are also grateful to the reviewers and editors for their valuable comments and insights in the article. This work was supported by NASA grant NNX09AH23A from the Landsat Project Science Office, by USGS EROS grant G08AC00031 and under USGS contract #G10PC00044.

Author Contributions

Nischal Mishra from SDSU and Md. Obaidul Haque from SGT, contractor to USGS EROS, processed and analyzed the data from different PICS and preformed the cross-calibration works. Larry Leigh from SDSU ran all the MODTRAN simulation works and quantified the atmospheric uncertainties inherent in the cross-calibration. Dennis Helder and Dave Aaron (SDSU) and Brian Markham (NASA GSFC) provided valuable data analysis and insights into the organization of the various sections of the paper.

Conflicts of Interest

The authors declare no conflict of interest.

References

  1. Irons, J.R.; Dwyer, J.L.; Barsi, J.A. The next Landsat satellite: The Landsat data continuity mission. Remote Sens. Environ. 2012, 122, 11–21. [Google Scholar] [CrossRef]
  2. Irons, J.R.; Masek, J.G. Requirements for a Landsat data continuity mission. Photogramm. Eng. Remote Sens. 2006, 72, 1102–1108. [Google Scholar]
  3. Markham, B.; Barsi, J.; Kvaran, G.; Ong, L.; Kaita, E.; Biggar, S.; Czapla-Myers, J.; Mishra, N.; Helder, D. Landsat-8 operational land imager radiometric calibration and stability. Remote Sens. 2014, 6, 12275–12308. [Google Scholar] [CrossRef]
  4. Markham, B.; Thome, K.J.; Barsi, J.A.; Kaita, E.; Helder, D.L.; Barker, J.L.; Scaramuzza, P.L. Landsat-7 ETM+ on-orbit reflective-band radiometric stability and absolute calibration. IEEE Trans. Geosci. Remote Sens. 2004, 42, 2810–2820. [Google Scholar] [CrossRef]
  5. Pearlman, J.S.; Barry, P.S.; Segal, C.C.; Shepanski, J.; Beiso, D.; Carman, S.L. Hyperion, a space-based imaging spectrometer. IEEE Trans. Geosci. Remote Sens. 2003, 41, 1160–1173. [Google Scholar] [CrossRef]
  6. Thome, K.J. Absolute radiometric calibration of Landsat 7 ETM+ using the reflectance-based method. Remote Sens. Environ. 2001, 78, 27–38. [Google Scholar] [CrossRef]
  7. Biggar, S.F.; Thome, K.J.; Wisniewski, W. Vicarious radometric calibration of EO-1 sensors by reference to high-reflectance ground targets. IEEE Trans. Geosci. Remote Sens. 2003, 41, 1174–1179. [Google Scholar] [CrossRef]
  8. Knight, E. Landsat-8 Operational Land Imager design, characterization and perfomance. Remote Sens. 2014, 6, 10286–10305. [Google Scholar] [CrossRef]
  9. Figoski, J.W.; Zaun, N.; Mooney, T. Performance results for the Landsat OLI spectral filters. Proc. SPIE 2009. [Google Scholar] [CrossRef]
  10. Barsi, J.A.; Lee, K.; Markham, B.; Kvaran, G.; Pedelty, J.A. The spectral response of the Landsat-8 operational land imager. Remote Sens. 2014, 6, 10232–10251. [Google Scholar] [CrossRef]
  11. Chander, G.; Markham, B.L.; Helder, D.L. Summary of current radiometric calibration coefficients for Landsat MSS, TM, ETM+, and EO-1 ALI sensors. Remote Sens. Environ. 2009, 113, 893–903. [Google Scholar] [CrossRef]
  12. Chander, G.; Xiong, X.; Angal, A.; Choi, J. Monitoring on-orbit calibration stability of the Terra MODIS and Landsat 7 ETM+ sensors using pseudo-invariant test sites. Remote Sens. Environ. 2010, 114, 935–939. [Google Scholar]
  13. Using the USGS Landsat 8 Product. Available online: http://landsat.usgs.gov/Landsat8_Using_Product.php (accessed on 6 June 2014).
  14. Cosnefroy, H.; Leroy, M.; Briottet, X. Selection and characterization of Saharan and Arabian desert sites for the calibration of optical satellite sensors. Remote Sens. Environ. 1996, 58, 101–114. [Google Scholar] [CrossRef]
  15. Helder, D.L.; Basnet, B.; Morstad, D.L. Optimized identification of worldwide radiometric pseudo-invariant calibration sites. Can. J. Remote Sens. 2010, 36, 527–539. [Google Scholar] [CrossRef]
  16. Angal, A.; Xiong, X.; Choi, T.; Chander, G.; Mishra, N.; Helder, D.L. Impact of Terra MODIS Collection 6 on long-term trending comparisons with Landsat 7 ETM+ reflective solar bands. Remote Sens. Lett. 2013, 4, 873–881. [Google Scholar] [CrossRef]
  17. Cao, C.; Xiong, X.; Wu, A.; Wu, X. Assessing the consistency of AVHRR and MODIS L1B reflectance for generating Fundamental Climate Data Records. J. Geophys. Res. Atmos. 2008. [Google Scholar] [CrossRef]
  18. Smith, D.L.; Mutlow, C.T.; Rao, C.R.N. Calibration monitoring of the visible and near-infrared channels of the Along-Track Scanning Radiometer-2 by use of stable terrestrial sites. Appl. Opt. 2002, 41, 515–523. [Google Scholar] [CrossRef] [PubMed]
  19. Chander, G.; Mishra, N.; Helder, D.L.; Aaron, D.B.; Amit, A.; Choi, T.; Doelling, D.R. Applications of Spectral Band Adjustment Factors (SBAF) for cross-calibration. IEEE Trans. Geosci. Remote Sens. 2013, 51, 1267–1281. [Google Scholar] [CrossRef]
  20. Lacherade, S.; Fougnie, B.; Henry, P.; Gamet, P. Cross calibration over desert sites: Description, methodology, and operational implementation. IEEE Trans. Geosci. Remote Sens. 2013, 51, 1098–1113. [Google Scholar] [CrossRef]
  21. Govaerts, Y.M.; Stercxs, S.; Adriaensen, S. Optical sensor calibration using simulated radiances over desert sites. In Proceedings of 2012 IEEE International Geoscience and Remote Sensing Symposium (IGARSS), Munich, Germany, 22–27 July 2012; pp. 6932–6035. [CrossRef]
  22. Mishra, N.; Helder, D.L.; Angal, A.; Choi, T.; Xiong, X. Absolute calibration of optical satellite sensors using Libya 4 pseudo invariant calibration site. Remote Sens. 2014, 6, 1327–1346. [Google Scholar] [CrossRef]
  23. Helder, D.L.; Thome, K.J.; Mishra, N.; Chander, G.; Xiong, X.; Angal, A.; Choi, T. Absolute radiometric calibration of Landsat using a pseudo invariant calibration site. IEEE Trans. Geosci. Remote Sens. 2013, 51, 1360–1369. [Google Scholar] [CrossRef]
  24. Helder, D.L.; Karki, S.; Bhatt, R.; Micijevic, E.; Aaron, D.; Jasinski, B. Radiometric calibration of the Landsat MSS sensor series. IEEE Trans. Geosci. Remote Sens. 2012, 50, 2380–2399. [Google Scholar] [CrossRef]
  25. Teillet, P.M.; Markham, B.L.; Irish, R.R.; Barker, J.L.; Fedosejevs, G.; Storey, J.C. Radiometric cross-calibration of the Landsat-7 ETM+ and Landsat-5 TM sensors based on tandem data sets. Remote Sens. Environ. 2001, 78, 39–54. [Google Scholar] [CrossRef]
  26. Chander, G.; Hewison, T.J.; Fox, N.; Wu, X.; Xiong, X.; Blackwell, W.J. Overview of intercalibration of satellite instruments. IEEE Trans. Geosci. Remote Sens. 2013, 51, 1056–1080. [Google Scholar] [CrossRef]
  27. Markham, B.L.; Haque, M.O.; Barsi, J.A.; Micijevic, E.; Helder, D.L.; Thome, K.J.; Aaron, D.; Czapla-Myers, J.S. Landsat 7 ETM+: 12 years on-orbit reflective-band radiometric performance. IEEE Trans. Geosci. Remote Sens. 2012, 50, 2056–2062. [Google Scholar] [CrossRef]
  28. Bhatt, R.; Doelling, D.R.; Wu, A.; Xiong, X.; Scarino, B.R.; Haney, C.O.; Gopalan, A. Initial stability assessment of S-NPP VIIRS reflective solar band calibration using invariant desert and deep convective cloud targets. Remote Sens. 2014, 6, 2809–2826. [Google Scholar] [CrossRef]
  29. Teillet, P.M.; Fedosejevs, G.; Thome, K.J.; Barker, J.L. Impacts of spectral band difference effects on radiometric cross-calibration between satellite sensors in the solar-reflective spectral domain. Remote Sens. Environ. 2007, 110, 393–409. [Google Scholar] [CrossRef]
  30. Henry, P.; Chander, G.; Fougnie, B.; Thomas, C.; Xiong, X. Assessment of spectral band impact on intercalibration over desert sites using simulation based on Eo-1 Hyperion data. IEEE Trans. Geosci. Remote Sens. 2013, 51, 1297–1308. [Google Scholar] [CrossRef]
  31. Chander, G.; Helder, D.L.; Aaron, D.B.; Mishra, N.; Shrestha, A.K. Assessment of spectral, misregistration, and spatial uncertainties inherent in the cross-calibration study. IEEE Trans. Geosci. Remote Sens. 2013, 51, 1282–1296. [Google Scholar] [CrossRef]

