Article

Burned Area Mapping Using Support Vector Machines and the FuzCoC Feature Selection Method on VHR IKONOS Imagery

by
Eleni Dragozi
1,*,
Ioannis Z. Gitas
1,
Dimitris G. Stavrakoudis
1 and
John B. Theocharis
2
1
Laboratory of Forest Management and Remote Sensing, School of Forestry and Natural Environment, Aristotle University of Thessaloniki, Thessaloniki 54124, Greece
2
School of Electrical and Computer Engineering, Faculty of Engineering, Aristotle University of Thessaloniki, Thessaloniki 54124, Greece
*
Author to whom correspondence should be addressed.
Remote Sens. 2014, 6(12), 12005-12036; https://doi.org/10.3390/rs61212005
Submission received: 4 July 2014 / Revised: 30 September 2014 / Accepted: 19 November 2014 / Published: 3 December 2014
(This article belongs to the Special Issue Quantifying the Environmental Impact of Forest Fires)

Abstract

:
The ever increasing need for accurate burned area mapping has led to a number of studies that focus on improving the mapping accuracy and effectiveness. In this work, we investigate the influence of derivative spectral and spatial features on accurately mapping recently burned areas using VHR IKONOS imagery. Our analysis considers both pixel and object-based approaches, using two advanced image analysis techniques: (a) an efficient feature selection method based on the Fuzzy Complementary Criterion (FuzCoC) and (b) the Support Vector Machine (SVM) classifier. In both cases (pixel and object-based), a number of higher-order spectral and spatial features were produced from the original image. The proposed methodology was tested in areas of Greece recently affected by severe forest fires, namely, Parnitha and Rhodes. The extensive comparative analysis indicates that the SVM object-based scheme exhibits higher classification accuracy than the respective pixel-based one. Additionally, the accuracy increased with the addition of derivative features and subsequent implementation of the FuzCoC feature selection (FS) method. Apart from the positive effect in the classification accuracy, the application of the FuzCoC FS method significantly reduces the computational requirements and facilitates the manipulation of the large data volume. In both cases (pixel and objet) the results confirmed that the use of an efficient feature selection method is a prerequisite step when extra information through higher-order features is added to the classification process of VHR imagery for burned area mapping.

Graphical Abstract

1. Introduction

Every year, wildfires affect millions of hectares of forest woodlands and other vegetation, causing the loss of many human and animal lives along with immense economic damage, in terms of resources destroyed and the costs of suppression [1]. Especially in the Mediterranean basin where the present study is mainly focused, the rate of wildfire incidents is increasing with an alarming rate [2].
To overcome the negative impacts of wildfires and preserve sustainability in forest ecosystems, governments are compelled to undertake a variety of restoration and rehabilitation measures [3]. To implement such actions, rapid, reliable, and detailed information regarding the state of the fire-affected areas is required [4]. Furthermore, it has been shown that a successful implementation of the necessary protection measures against any illegal activity in the affected areas, such as uncontrolled expansion of agricultural activities and tourism, encroaching or illegal construction, would require explicit spatial information regarding the location and extent of the burned areas [4,5].
Since the early 1980s, satellite remote sensing has been extensively used for mapping and managing burned areas [6,7]. As a result, up until now a variety of satellite data with different spatial resolutions has been extensively used for mapping fire-affected areas at local, regional and global scale [8]. Traditionally, medium and coarse resolution satellite data such as Landsat TM (30 m), Landsat MSS (80 m), MODIS (250 m), AVHRR (1km), and SPOT-VGT (1 km) have been used for extraction of fire-related information. In recent years, however, the availability of Very High Resolution (VHR) satellite imagery such as IKONOS, WorldView, and QuickBird has provided new possibilities in burned area mapping at local scales [9]. Since fire plays a crucial role in many ecological processes at the local level (e.g., vegetation composition, biodiversity, soil erosion, and the hydrological cycle), the use of VHR data provide very detailed thematic products and consecutively valuable information. Examples of the successful use of VHR imagery in burned area mapping can be found in [10,11] and [12].
Up until now, several classification techniques have been applied in burned area mapping, including maximum likelihood classification [13,14], logistic regression [15], classification and regression trees[14,16] linear and/or nonlinear spectral mixture analysis [17,18], thresholding of Vegetation Indices (VIs) [14,19], Neural Networks [20], Neuro-Fuzzy techniques [21], Support Vector Machines (SVMs) [22,23,24], and Object Based Image Analysis (OBIA) [25,26]. However, the selection of the optimal method each time depends on several factors, such as the scale and the goals of the current project.
ESA has recently developed, applied and validated several algorithms for the regular, consistent and accurate mapping of burned areas across the globe based on three different sensors (ERS-2 ATSR, ENVISAT AATST/MERIS and SPOT Vegetation) [27]. The findings of this research (Fire CCI Project) will be made available to the whole scientific community. However, due to the course spatial resolution of the aforementioned sensors, the produced maps have limited use for local scale applications. The production of such maps at very high spatial resolution is an open research interest.
The goal of generating accurate burned area map products at a local level is usually accomplished using VHR imagery combined with one of the previously mentioned techniques. Specifically, the growing availability of VHR satellite imagery along with the development of advanced image analysis techniques (e.g., OBIA, SVM, Neuro-Fuzzy classification) resulted in the production of accurate burned area maps with limited human interaction [28,29]. In addition to the above, there are recent cases in which the reliability of the resulting thematic (land cover) maps was increased with the inclusion of additional features in the classification process, such as texture and spatial indicators [28,29].
When the use of higher-order features is combined with the application of advanced image analysis techniques, such as feature selection methods and advanced classification methodologies, an increase in accuracy and reliability in land cover mapping has been reported [30,31,32]. Although Vegetation Indices (VIs) and textural features have been exploited as additional sources of information in burned area mapping by [33] and [34], the use of higher-order features has not been yet fully investigated and remains an active topic of research. In particular, none of the previously mentioned studies has evaluated multiple higher-order feature categories neither applied an advanced feature selection technique.
The aim of this work is to map recently burned areas using the Support Vector Machine (SVM) classifier [35] and the FuzCoC feature selection (FS) method [36] on VHR IKONOS imagery. The specific objectives are to:
  • to investigate whether the quality and accuracy of burned area maps produced by an SVM classifier increase with the addition of higher-order features to the original VHR IKONOS spectral bands, and
  • to compare two classification approaches, namely the object-oriented and pixel-based classification approaches, in order to identify which one is the most appropriate for operational burned area mapping.
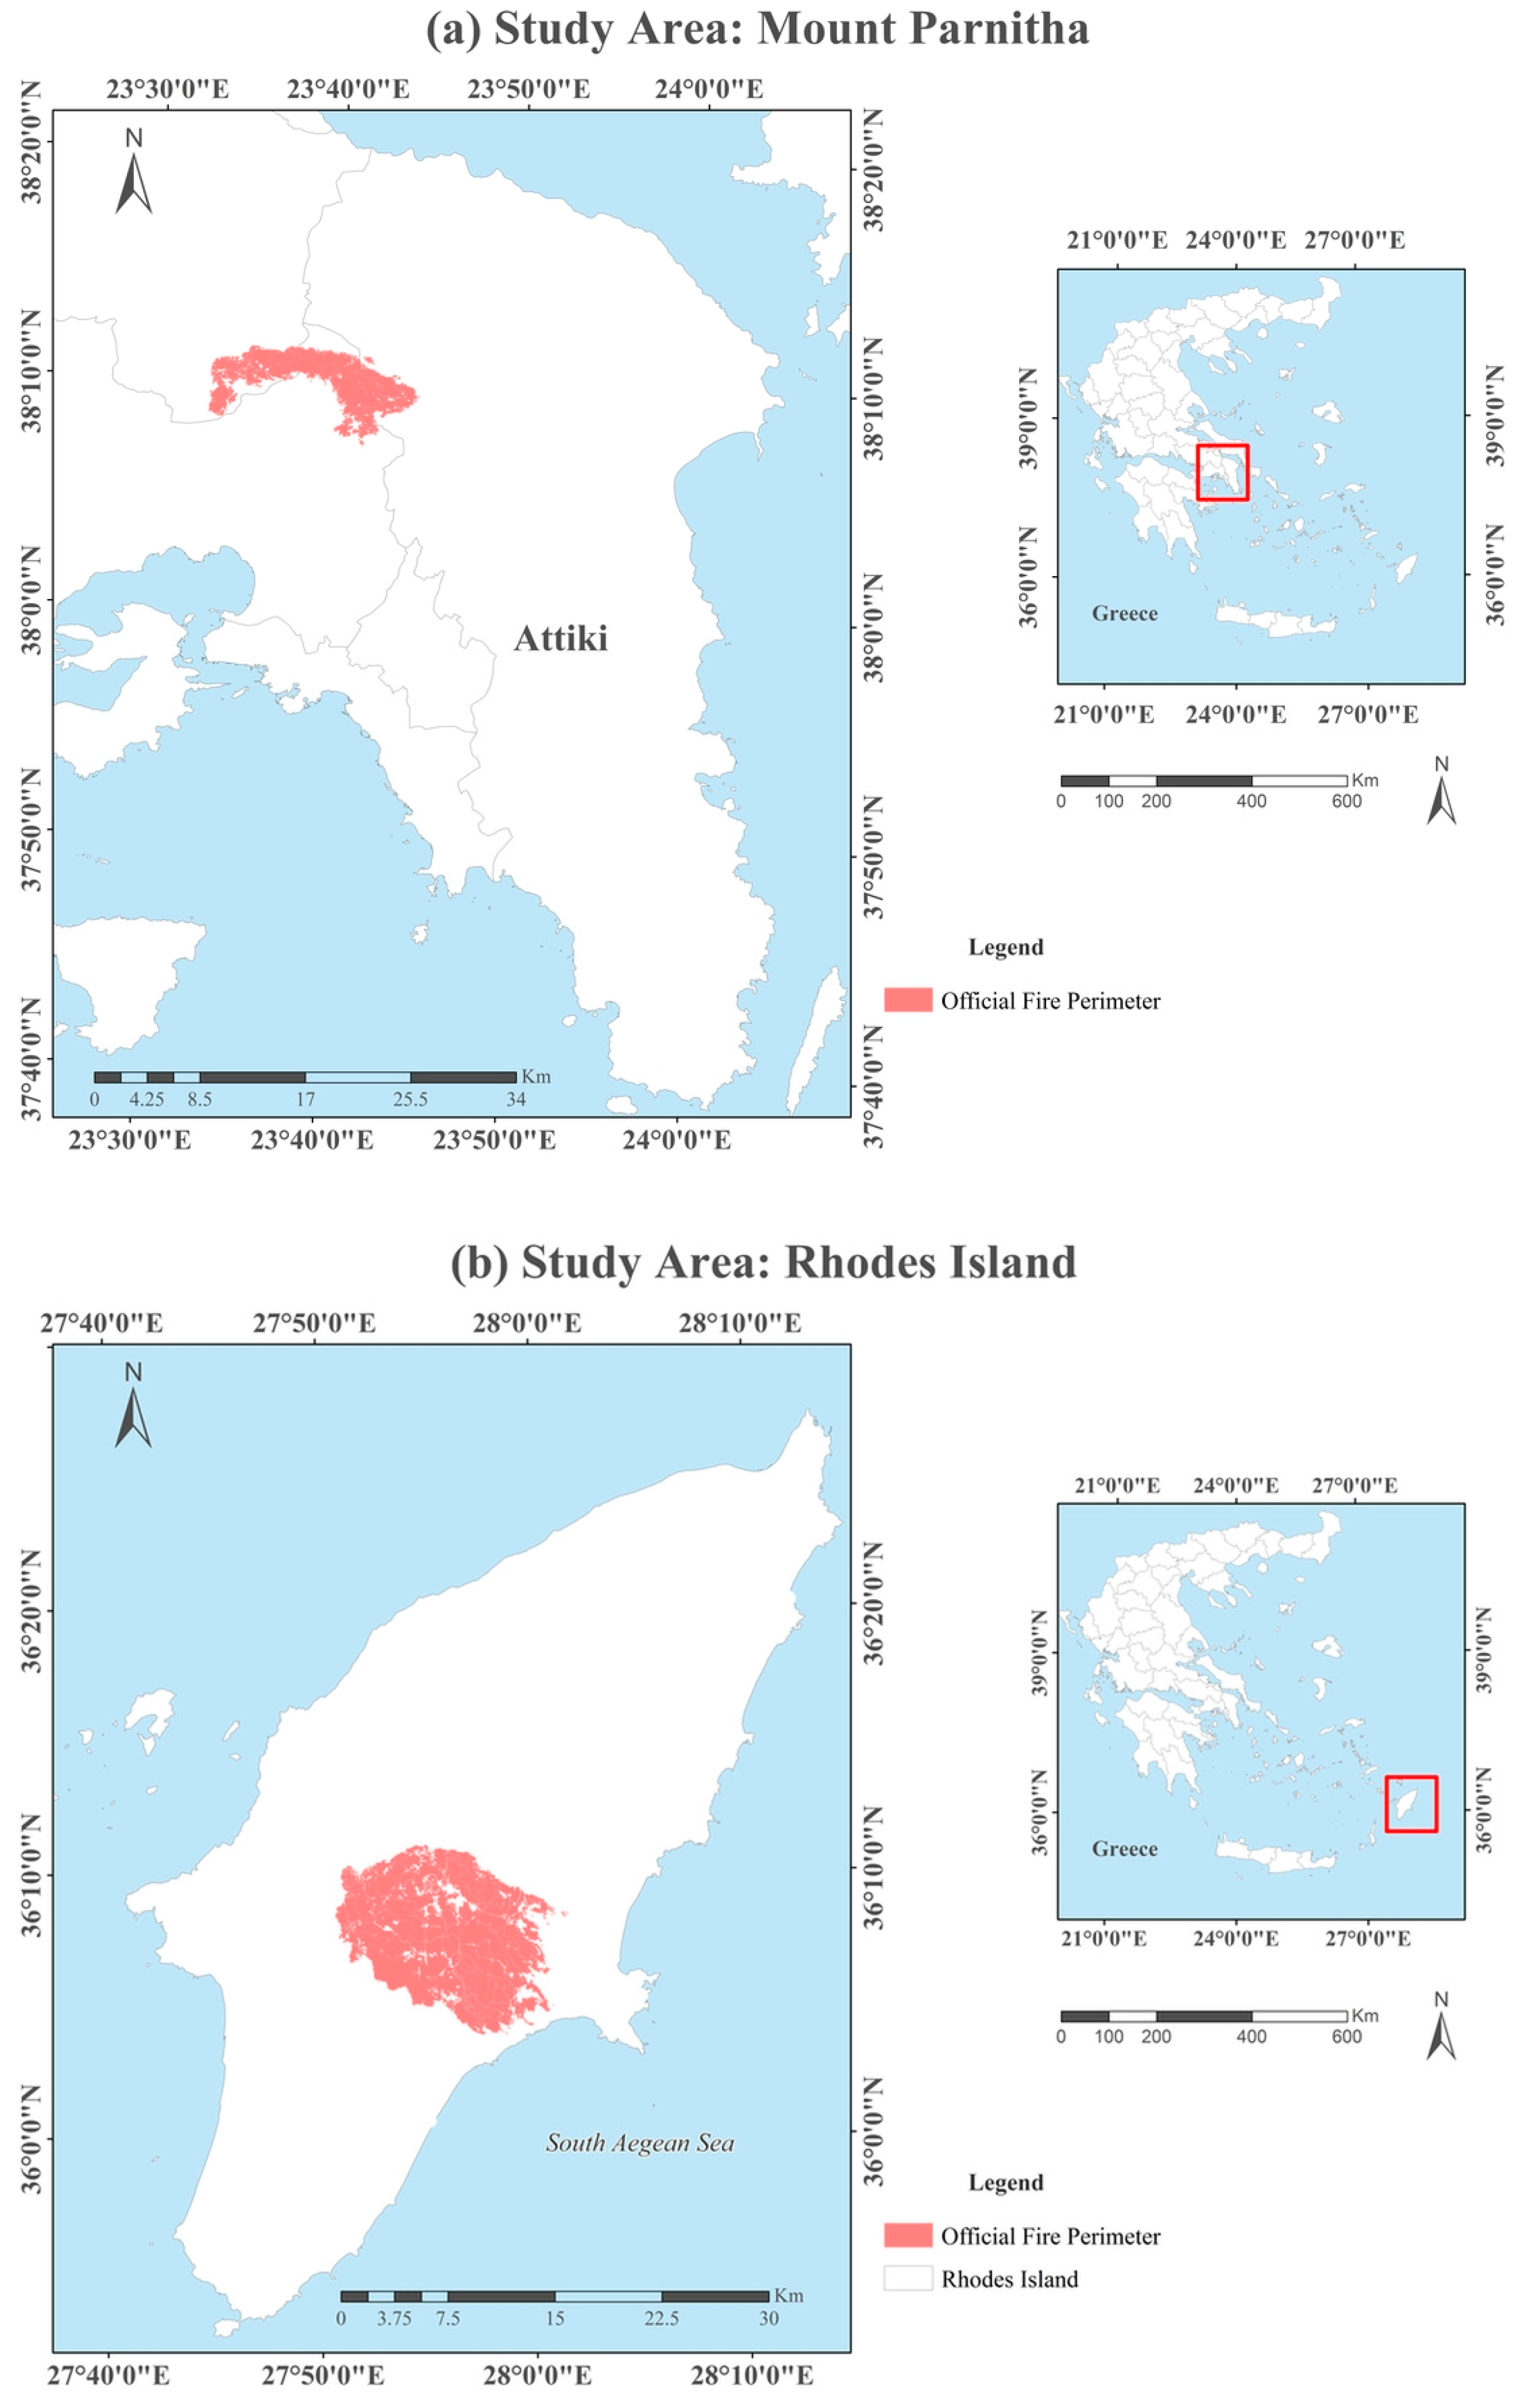
The rest of the paper is organized as follows. Section 2 presents the datasets used in this study, whereas Section 3 describes the proposed methodology. Experimental results along with the validation process are presented in Section 4. Section 5 compares the two approaches (pixel and object) with respect to their potential use on an operational basis. Finally, Section 6 reports some final conclusions.

2. Study Area

The proposed methodology has been tested in two areas of Greece recently affected by severe forest fires. The first one is Mount Parnitha (Figure 1a) which is located in Attica, central part of Greece. The area was affected by a large forest fire (4990.10 hectares) in the summer of 2007. Mount Parnitha is the highest (1413 m) and most extended mountain of Attica and has been declared a national park since 1961. In this region, Mediterranean-type climatic conditions with hot summers and mild winters are characteristically prevailing. The second study area is the Greek island of Rhodes (Figure 1b), which is located in the south-eastern Aegean Sea. Rhodes is the largest of the Dodecanese islands in terms of both land area and population. The large fire on the island of Rhodes occurred in the summer of 2008 (22 July 2008), affecting an area of 11,863.69 hectares.
For the purposes of the analysis we used two pan-sharpened IKONOS images (1m). In both cases the satellite images were captured soon after the fire events. More precisely, the imagery for the case study of Parnitha’s fire was captured on 8 July 2007, ten days after the fire event. In the case of Rhodes’ fire the imagery was captured immediately after the fire event (1 August 2008).
The acquired satellite images were geometrically corrected. In order to assist the validation procedure, two reference maps were created, manually delineating the burned areas on the images. The remaining parts of the images were labeled as “Unburned”.
Figure 1. Location of the study areas. (a) First study area Mount Parnitha, Attiki, Greece (b) Second study area Rhodes Island, Greece.
Remotesensing 06 12005 g001

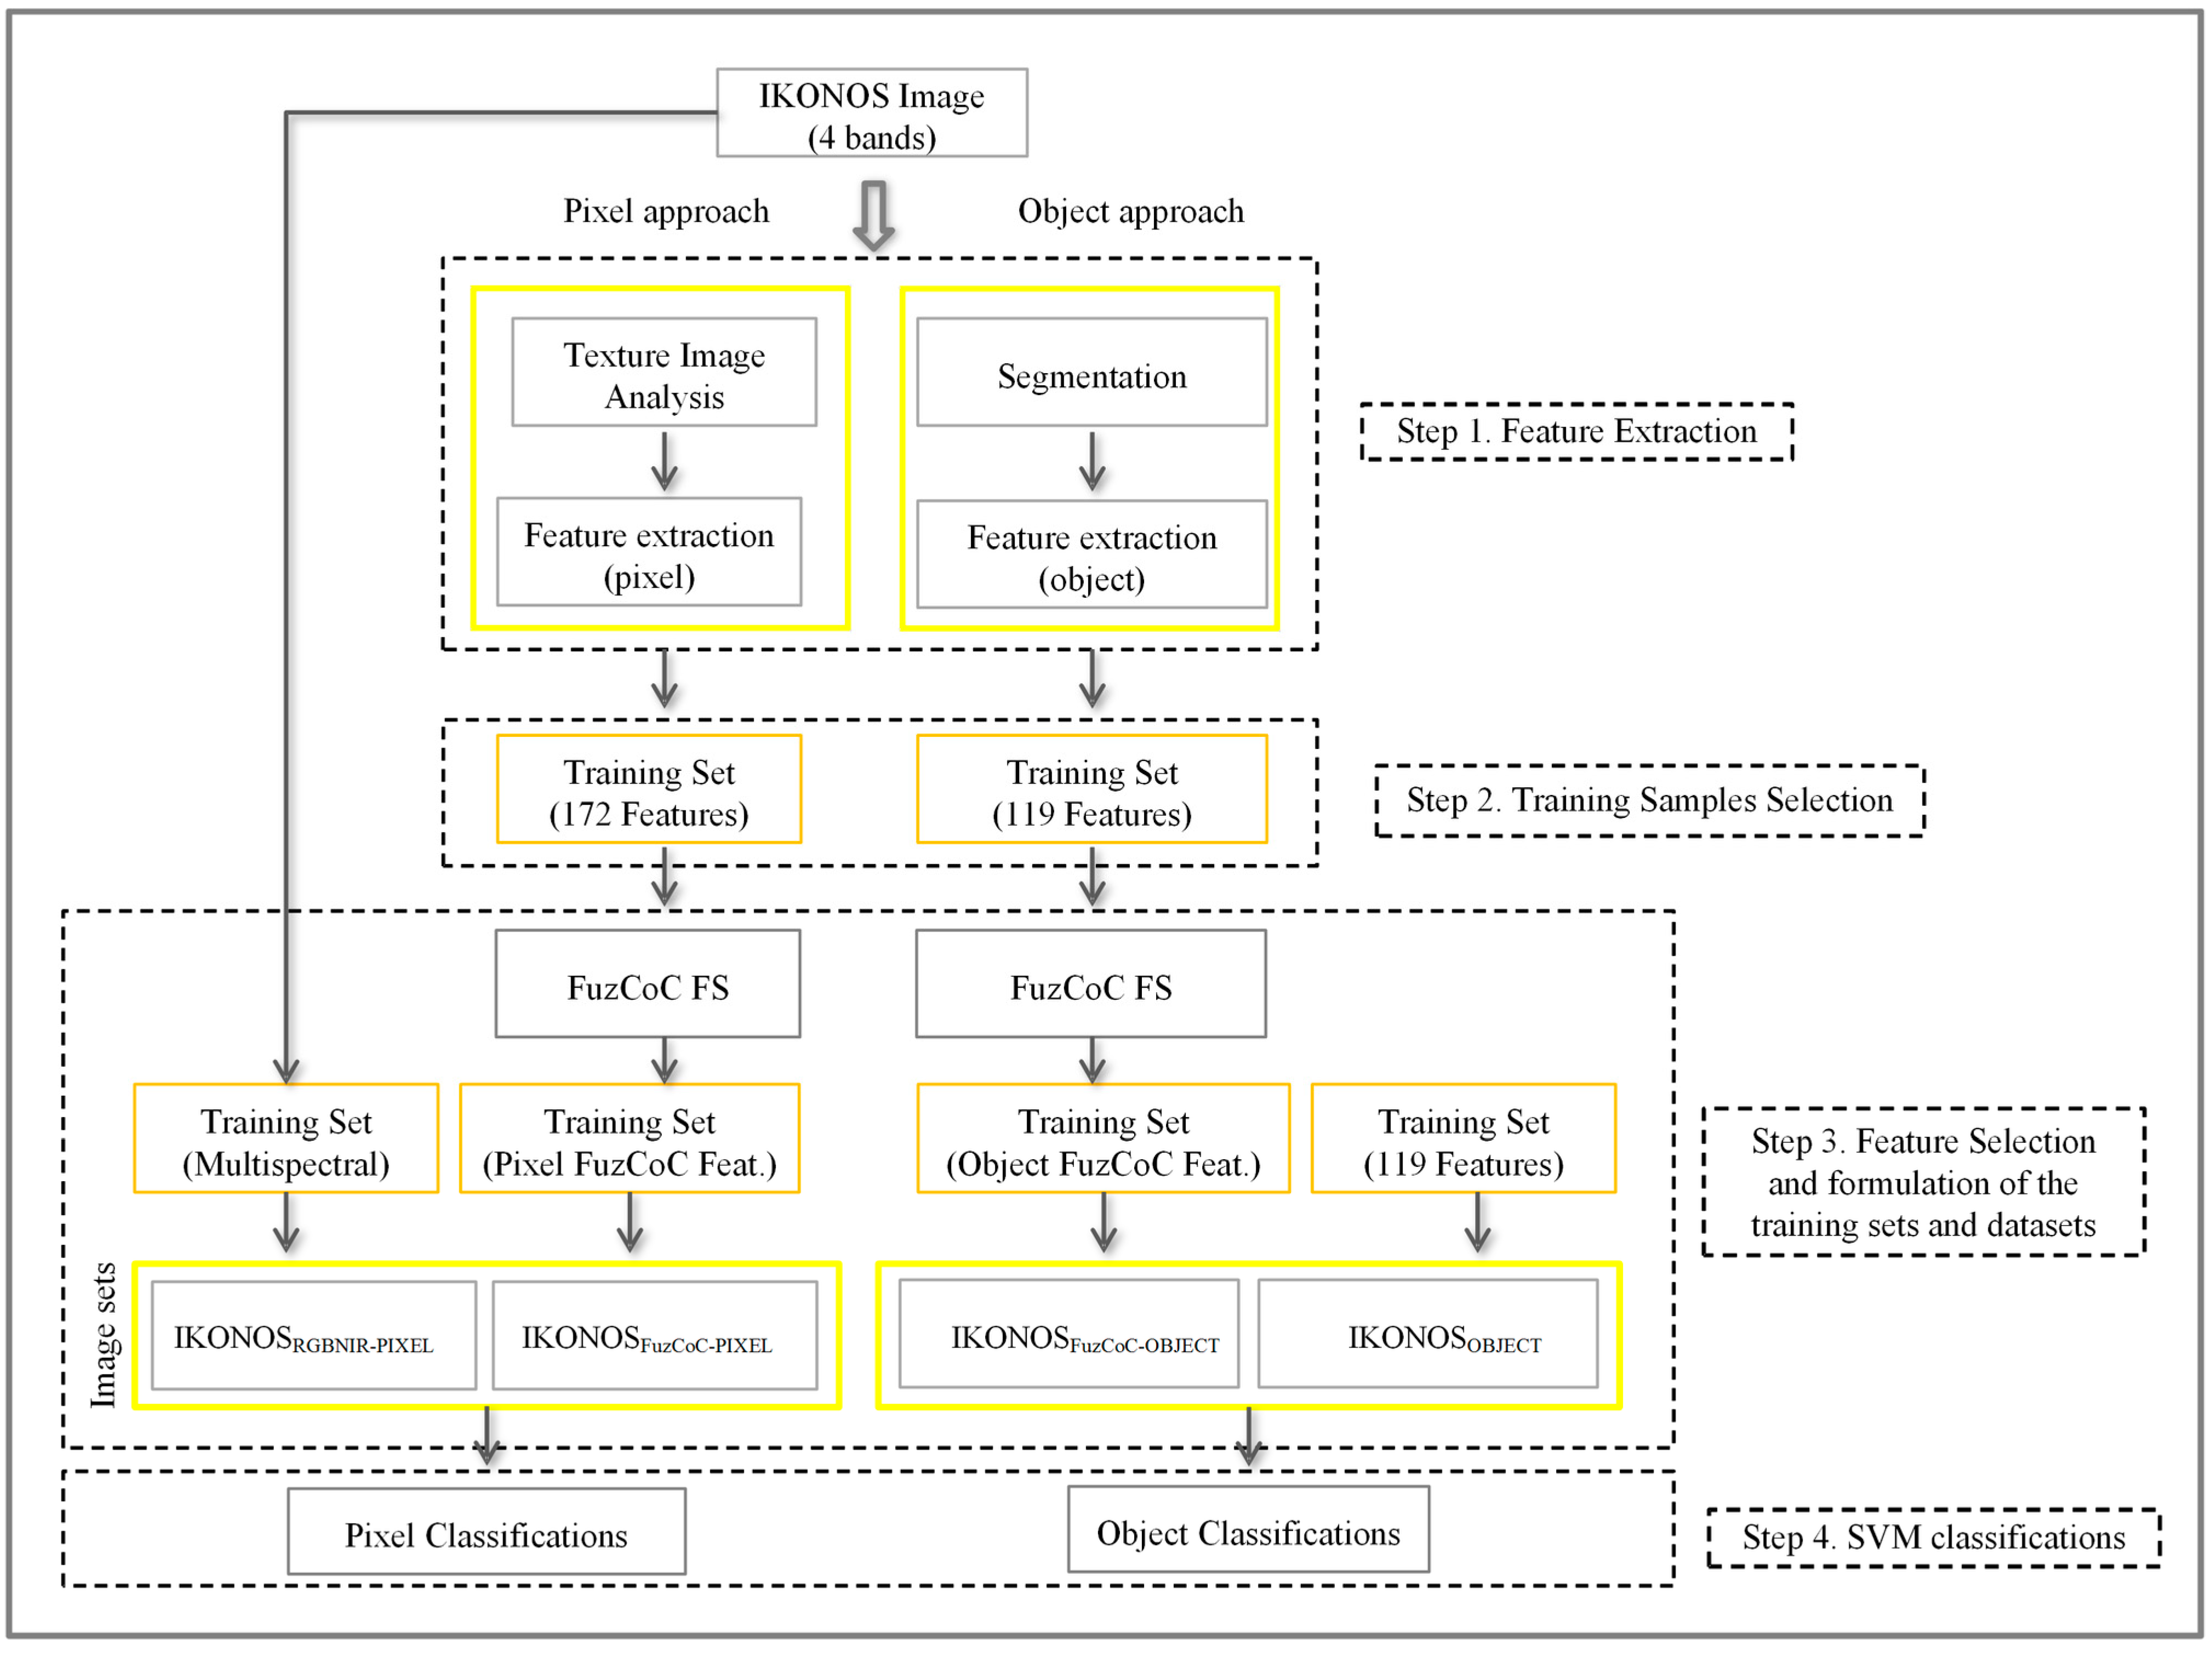
3. Proposed Methodology

The proposed methodology consists of four main steps (Figure 2). The first three involve all the procedures related to the preparation of the datasets for the pixel and object-based classifications, namely, feature derivation, training sets preparation, and feature selection. The fourth step involves the implementation of the pixel and object-based classification models. The developed methodology has been applied to the two study areas independently. The rest of this section provides a detailed description of each step.
Figure 2. Methodology flowchart.
Remotesensing 06 12005 g002

3.1. Step 1: Feature Generation for Pixel and Object-Based Classifications

In the simplest case, remotely sensed data are classified into ground cover classes using the gray-level values from each band of a multispectral image. However, prior research has proven that the use of additional features in conjunction with the original bands of the sensor may significantly increase the accuracy of the classification maps [29]. Particularly in the case of VHR imagery, the derivation of new features based on the multispectral bands of the image adds complementary information to the original dataset. Using the additional information from the derived features, the discrimination between classes is significantly increased, especially in applications where the spectral information is not sufficient for the classification of spectrally similar landscape characteristics [37].
Specifically for the classification of burned areas, where the mapping accuracy is greatly affected by several types of spectral confusion among concrete classes [25], the use of additional features is expected to reduce the classification error and enhance the quality of the derived maps. Examples on the use of additional features in burned area mapping can be found in [19,34,38,39]. However, it should be noted that the evaluation of supplementary features in the field of burned area mapping has not been thoroughly investigated yet.

3.1.1. Feature Sets for the Pixel-Based Classifications

This stage involves all the procedures related to the generation of the IKONOS spatial and spectral features, at pixel level. The stage is divided in two main phases: (a) texture image analysis and (b) feature extraction. In the first phase, we use a texture image analysis technique in order to select the most appropriate windows for the computation of textural measures. Subsequently, in the second phase we extract several spatial and spectral features from the original dataset. Henceforth, the original dataset (the four bands of the IKONOS image) will be referred as IKONOSRGBNIR-PIXEL (Table 1).
Table 1. Spatial and Spectral Features Derived from the IKONOS Image for the Pixel-Based Classifications.
Feature CategoryWindow SizesNumber of Features
Bands-4
Occurrence Measures
(Mean, Entropy, Skewness, Variance)
(11 × 11, 15 × 15, 21 × 21)48
Co-Occurrence Measures
(Mean, Entropy, Homogeneity, Second moment, Variance, Dissimilarity, Correlation, Contrast)
(11 × 11, 15 × 15, 21 × 21)64
LISA (Moran’s I, Getis-Ord Gi, Geary’s C)(5 × 5)12
PCA-4
IHS-3
Tasseled Cap-3
VIs (NDVI)-1
Band Ratio (BN = Blue/NIR)-1
Total 172
To add complementary information to the original spectral bands, we considered the following groups of features:
  • First and second order textural measures (Occurrence measures and Gray-Level Co-occurrence Matrix—GLCMs) [40].
  • Spatial autocorrelation indices (Moran’s I, Getis-Ord and Geary’s C) [41].
  • Spectral features (Principal Component Analysis—PCA) [42], Tasseled Cap [43], and Intensity Hue Saturation (IHS) [44].
  • Vegetation Indices (VIs) [45].
  • Ratios [45].
Overall we extracted 172 features, listed on Table 1. In the following we provide a brief description of the feature set along with the image analysis technique and a short description of the GLCMs. For a more detailed description the interested reader is referred to the aforementioned references.
First and second order measures are the first group of features generated from the IKONOS imagery. First order texture measures are statistics (mean value, variance, etc.) calculated from the original image values and do not consider pixel neighborhood relationships [46,47]. Unlike the first order measures, the computation of the GLCMs considers the relationships among pixels or groups of pixels [46]. Knowledge regarding the inter-pixel relationships allows further analysis of the spatial information contained on the image and thus, better understanding of the existing spatial patterns [40,41,42,43,44,45,46,47,48]. GLCM computation requires the definition of two parameters, namely, window size inter-pixel distance d and direction θ. To calculate the GLCMs in this study, we used the commonly applied parameters θ = 0° and d = 1.
Regarding the selection of the window size, several approaches have been proposed in the literature. However, the most commonly applied practice is the trial and error method [49,50]. At that point it is important to mention that the use of an inappropriate window size is highly probable to introduce erroneous textural information and thus greatly affect the success of the classification [51,52,53]. To facilitate the choice of the most appropriate window sizes for this study, geo-statistical analysis using semivariograms was performed with the help of the GS+ software. The use of semivariograms [54,55] for the determination of the optimal window has been proposed as a promising approach by a numerous studies in remote sensing [56,57].
The geo-statistical analysis was implemented considering several subscenes extracted from the original imagery. More specifically, seventeen sub-scenes were extracted from the two different types of land cover (“Burned” and “Unburned”). Subsequently, semivariograms were calculated for each different land-cover type and the statistical findings were examined to determine the most appropriate window sizes. Based on the results of the semivariogram analysis we reached the conclusion that there is no ideal window size to sufficiently explain all land uses in the IKONOS image. Instead, the interpretation of the analysis results indicated that there are three different window sizes, specifically, 11 × 11, 15 × 15 and 21 × 21, which demonstrated adequate ability in discriminating the burned areas from the different subtypes of the unburned areas.
In addition to the first and second order textural features, we also used three spatial autocorrelation indexes, namely, Moran’s I, Getis-Ord, and Geary’s C, in order to explore the existence of any possible spatial dependency in our data. All of the indexes are Local Indicators of Spatial Association (LISA) and were first introduced in [41].
Apart from the computed spatial features, several other spectral features were calculated from the IKONOS image. Specifically, three different types of transformations were computed using the original image:
  • the principal component analysis (PCA) [42],
  • the intensity-hue-saturation (IHS) [44,58], and
  • the tasseled cap transformation [43].
PCA is a technique commonly employed in order to transform the original remotely sensed data into a substantially smaller dataset, which contains the most informative part of the original bands [42]. However, in this study we simply consider all four PCA components as additional spectral features, rather than for reducing the dimensionality of the image. IHS transforms the original image into a new color space comprising three positioned parameters, namely, intensity (I), hue (H), and saturation (S), in lieu of the spectral bands Red, Green and Blue (RGB) [44]. The tasseled cap transformation produces four data structures which are useful for distinguishing different types of vegetation [43]. As suggested in the aforementioned reference, the fourth feature has low variance and as a result is somewhat noisy. Therefore, we only used the first three features produced by the transformation.
Furthermore, two other groups of features were derived from the IKONOS pan-sharpened image, the Vegetation Indices (VIs) and Ratios. According to [45], VIs are simple and robust techniques to extract quantitative information on the amount of greenness, for every pixel in the image, whereas band ratios are useful for their ability to reduce the effect of several sources of noise. Additionally, band ratios also facilitate the discrimination between soil and vegetation. During the course of this study, the Normalized Difference Vegetation Index (NDVI) and the band ratio BN (Blue/NIR) were used and examined [45].
All the aforementioned features (including the original bands of the image) were linearly scaled to the range [0,1]. The dataset comprising all 172 features (the four bands of the IKONOS image plus the derived features) will be henceforth referred as IKONOSFullSpace-PIXEL.

3.1.2. Image Segmentation and Feature Extraction for Object-Based Classifications

A prerequisite step before classification in object-based image analysis is the segmentation of the image into spatially contiguous and homogeneous regions [59,60]. Especially in the field of remote sensing, the availability of VHR satellite data has boosted the demand for the development of new segmentation algorithms [61]. However, it should be elucidated that not all segmentation techniques are feasible for VHR imagery [62].
In this study, the Fractal Net Evolution Approach (FNEA) [59] was adopted to conduct image segmentation, using the commercially available software eCognition [63]. FNEA is a bottom-up approach and is categorized as a region-based algorithm [59,64]. During this process, the algorithm identifies each pixel as the smallest possible object in the image. Subsequently, pixels are merged into larger groups of pixels, through pair-wise merging, based on several user-defined parameters (scale, color/shape, and smoothness/compactness) [56,60]. The optimal choice of the parameters’ values determines the quality of the segmentation to a significant extent and, consequently, the accuracy of the resulted classification map [65]. In this study, we determined the optimal parameter values through a trial-and-error procedure. Specifically, we tested several parameter values and assessed the obtained results though visual inspection. The optimal parameter values for the segmentation process were determined as those exhibiting the best visual outcome, meaning that the object boundaries matched better the natural borders of the burned areas. For the Parnitha case, the best segmentation result was obtained using the following parameters: layer weight 1 for the blue and green bands, layer weight two for the red and NIR bands, scale 120, color criterion shape 0.2, and compactness 0.8. The same parameters were also applied in the case of Rhodes, resulting however in a slight over-segmentation of the image. Trying to increase the value of the scale parameter, though, constantly resulted in the creation of mixed objects that contained more than one land cover classes (under-segmentation). Therefore, we decided to apply the same parameter values as in the Parnitha case to avoid possible misclassifications of mixed objects, despite the fact that using those parameters the image was slightly over-segmented.
To increase the discrimination between “Burned” and “Unburned” objects during the classification process, several object features (standard deviation, mean values, etc.) were calculated inside the eCognition software. Although the software provides a vast number of features, we considered only a certain number of them. A significant number of features were not feasible to be computed, mainly due to excessively memory requirements. Moreover, other groups of features (e.g., class hierarchy features) did not provide any useful information for the examined classification schemes and were thus not considered. We have ultimately computed 119 features, summarized in Table 2. The datasets derived from that process will be henceforth referred as IKONOSOBJECT. Similarly to the pixel-based case all the aforementioned features have been linearly scaled in the range [0,1].
Table 2. List of object features divided into three categories according eCognition’s categorization.
Feature Categories
(eCognition Categorization)
Object FeaturesNumber of Features
Customized (Indexes)NDVI, NIR/Red, PC2/NIR, Blue/Red4
Layer valuesMean, Standard Deviation, Skewness, Pixel-based, To-neighbors, To-scene, Ratio-to scene, Hue, Saturation, Intensity113
GeometryDensity, Length and Width2
Total 119

3.2. Step 2: Training Samples Selection for SVM Pixel- and Object-Based Classifications

Any classifier created through supervised learning requires a set of training patterns, whose class label is predetermined. Numerous studies of the literature have indicated that the proper selection of the training set influences the success of the classification procedure to a significant extent. To this end, the selected training set should be adequately representative of the spectral responses of each different class [66,67,68]. Especially in the case of VHR images, it is very difficult to select training samples which can express all the spectral variability among classes [45,69]. Therefore, the selection of the most representative and informative training set is a very labor-intensive procedure.

3.2.1. Training Set for Pixel-Based Classifications

In the case of pixel-based classifications, we selected and evaluated several different training sets, in order to find the most informative one, for each one of the different cases (Parnitha and Rhodes). This was a notably demanding procedure in terms of time and computational cost and limited in terms of size by the requirements in computer memory. In this study, the number of the selected training pixels for each class (“Burned” and “Unburned”) was proportional to the area of the classes. As far as sample size is concerned, it should be noted that although the selection of training set affects the classification accuracy, the selection of the ideal training set still remains an open issue [66]. Ultimately, for the Parnitha case we selected a total of 8755 training patterns, 2029 of which belong to the “Burned” class and 6726 to the “Unburned” one. Accordingly, a total of 8512 training patterns were selected for the Rhodes dataset, 2527 for the “Burned” class and 5985 for the “Unburned” one.

3.2.2. Training Set for Object-Based Classification

Regarding the object-based classifications, samples that are typical representatives for each class (“Burned” and “Unburned”) were selected. The number of samples per class was proportional to the percentage of the area occupied by each category in the image. A total of 160 training objects were selected for the Parnitha case, 50 for the “Burned” class and 110 for the “Unburned” one. Accordingly, 3585 training objects were selected for the Rhodes case, 1753 for the “Burned” class and 1832 for the “Unburned” one.

3.3. Step 3: Feature Selection for the Pixel and Object-Based Classifications

Ideally, each feature (e.g., GLCMs) used in the classification process should add an independent source of information [70]. However, two major problems arise with the addition of new features. The first one is the redundant information added in the original dataset, whereas the second one is commonly referred in the literature as Hughes’ phenomenon. According to Hughes [71], for a fixed amount of training data, the classification accuracy as a function of the number of bands reaches a maximum and then declines, because there is limited amount of training data to estimate the large number of parameters needed [71]. Therefore, the addition of new features may lead to a reduction in classification accuracy instead of the expected increase.
In order to avoid any possible decrease in the classification accuracy, a widely used practice in remote sensing is the application of a feature selection (FS) method, as a means of removing the noise and reducing the computational cost [72]. In our case, the number of extracted features for both pixel- and object-based classifications is quite large. To this end, an efficient dimensionality reduction is necessary, in order to retain only the significant features for the subsequent classification of the burned areas. Citing the unreasonably large computational requirements as a major disadvantage of exhaustive search methods in practical applications, previous work justifies the use of a non-exhaustive search procedure in selecting features with high discriminating power from large search spaces [30].
Up until now, a variety of FS techniques have been investigated and applied in many remote sensing classification tasks [73]. The simplest method for finding the optimal subset of features is the trial and error method [74]. Especially in the field of remote sensing, the most widespread technique for reducing the dimensionality of the data is the Principal Component Analysis (PCA) [75]. In this work, we applied an efficient FS filter method to select the most informative and non-redundant features from our dataset, driven by the Fuzzy Complementary Criterion (FuzCoC) [36].
The method relies on the notion of the fuzzy partition vector (FPV), which is a computationally simple local evaluation criterion with respect to patterns. Specifically, an FPV is a vector calculated for each feature, by assigning to each training pattern a fuzzy membership grade denoting the ability of the specific feature to correctly classify the respective pattern, when considered independently from all other features. These membership grades are calculated via a computationally efficient relation, inspired by the class allocation scheme used in fuzzy c-means (FCM). Operating on an iterative filter mode, FuzCoC selects the next feature as the one providing the maximum additional contribution with regard to the information content given by the previously selected features. The additional contribution is expressed as a percentage, with respect to the information contained in the previously selected feature space. The whole process is terminated when no significant additional contribution can be achieved through the inclusion of new features, as determined by a minimum additional contribution threshold tr, selected by the user. The final result is a small co-operative subset of discriminating (highly relevant) and non-redundant features. A detailed description and analysis of the employed FCM-FuzCoC FS algorithm can be found in [36]. In this work we have used the proposed value of tr = 1% for the minimum additional contribution threshold parameter. The application of the FuzCoC FS methodology is similar for both pixel- and object-based classifications, since the algorithm operates on some training set, irrespective of the source of the data.
For Parnitha’s pixel-based classifications the application of the FuzCoC FS methodology resulted in selecting four out of the 172 available features. Similarly, in the case of Rhodes the implementation of the FuzCoC FS method resulted in the selection of three features. Table 3 summarizes the selected features. Ultimately, three different experimental datasets were available for classification, for each study area:
  • IKONOSRGBNIR-PIXEL: The initial four bands of the IKONOS image.
  • IKONOSFullSpace-PIXEL: All 172 available features considered in pixel level.
  • IKONOSFuZCoC-PIXEL: The features selected by the FuzCoC FS algorithm.
For all three cases, the training sets were created considering the same 8755 pixel locations for the Parnitha case and the same 8512 pixel locations for the Rhodes case; only the feature sets were different. We should emphasize that it was not practically feasible to integrate all the extracted features into a single image using common remote sensing software packages. The file size for the entire set of 172 features exceeded the maximum file size imposed by the remote sensing software. This fact also emphasizes the practical importance of feature selection. For comparison purposes, we also consider the second case (IKONOSFullSpace-PIXEL) in our experimental analysis (Section 4). In particular, this case was considered in order to examine the existence of the Hughes’ phenomenon in this specific dataset and to facilitate the understanding of the way the FuzCoC FS method influences the classification process and the accuracy of the final products. Nevertheless, the process of producing the aforementioned derivatives required the employment of advanced programming tools, which are not easily applicable by typical remote sensing users. Further discussion regarding the implementation difficulties of this process will be provided in Section 5.
Table 3. List of the FuzCoC selected features (Pixel Level) for the two cases examined.
Features ParnithaFeatures Rhodes
PCA (Second PCA)GLCM (Mean in the NIR band) (Window size 21 × 21)
Moran’s I (Blue)Occurrence measures (Skewness in the NIR band) (Window size 15 × 15)
Occurrence measures (Skewness in the NIR band) (Window size 11 × 11)GLCM (Correlation in the NIR band) (Window size 21 × 21)
GLCM (Mean in the NIR band) (Window size 15 × 15)-
Table 4. List of the FuzCoC selected features (Object Level) for the two cases examined. Features description can be found on eCognition manual.
Features ParnithaFeatures Rhodes
Ratio (Blue Band)Ratio (Second PCA)
Max.DiffMin Pixel value (RED Band)
Mean of outer border (NIR Band)Mean of outer border (NIR Band)
-Arithmetic Features (NIR/RED)
In the case of object-based classifications, the application of the FuzCoC FS methodology resulted in reducing the initial 119 dimensions to three in the case of Parnitha and four in the case of Rhodes. Table 4 reports the selected features, along with a short description of each feature.
Ultimately, two different experimental datasets were available for each study area:
  • IKONOSOBJECT: All 119 available features considered for object-based classifications.
  • IKONOSFuzCoC-OBJECT: The features selected by the FuzCoC FS algorithm.
According to various studies in the respective literature, all the aforementioned features—either selected or not—have been found useful in assisting the discrimination between different classes in land cover mapping. Some of the feature families presented above have also be found useful in previous burned area mapping tasks [33,34]. Therefore, in this study we followed a rather comprehensive approach, whereby a large number of candidate features was initially extracted (maximum information content available) and the most important ones were subsequently selected by the employed feature selection method (small number of highly informative features).

3.4. Step 4: SVM Pixel and Object-Based Classification Models

Classifications in this study were performed using the SVM classifier, which is widely applied in the field of pattern recognition in the last few years [24]. In its original form, SVM is a binary classifier, which finds the optimal separating hyperplane between two classes [35]. The SVM classifier can effectively solve both linear and non-linear classification problems. In the latter case, a kernel function transforms the non-linearly separable dataset into a high-dimensional feature space, where the problem can be solved linearly [35]. There are three commonly used kernel functions, namely, the Radial Basis Function (RBF) kernel, the Sigmoid kernel, and the Polynomial kernel [76,77]. RBF is the most widely applied kernel in remote sensing applications [78,79] and was therefore used in this study.
In our case, the SVM was applied to differentiate the “Burned” from the “Unburned” areas. The application of the classifier requires the determination of two parameters by the user: (a) the constant C, which is a penalty value for misclassification errors, and (b) γ, which is a parameter controlling the width of the Gaussian RBF kernel [35]. The selection of the optimal parameter values in this study was performed though a cross-validation procedure. Specifically, the optimal parameters C and γ in our experiment were determined using a 5-fold cross-validation on the training set of each case, using a grid of possible values C = {2−5, 2−3, …, 215} and γ = {2−15, 2−13, …, 23}. Subsequently, an SVM model was built using the selected parameters and the whole training set, which was subsequently employed to classify the whole image. The selected parameters for each dataset are reported in Table 5. We should note that the application of SVM does not differentiate for pixel and object-based classification, since the classifier is not actually aware of the source of the data.
Ultimately, five thematic maps were produced and examined:
  • SVMFullSpace-PIXEL: The pixel-based classification map produced by applying the SVM on the dataset composed of all the 172 features.
  • SVMRGBNIR-PIXEL: The pixel-based classification map produced by applying the SVM on the original IKONOS image (four bands).
  • SVMFuzCoC-PIXEL: The pixel-based classification map produced by applying the SVM on the augmented dataset including the higher-order features, after employing the FuzCoC FS methodology.
  • SVMOBJECT: The object-based classification map produced by applying the SVM on the segmented image, using all the 119 calculated object features.
  • SVMFuzCoC-OBJECT: The object-based classification map produced by applying the SVM on the segmented image, after employing the FuzCoC FS methodology.
Since SVM is not available in the most widely used commercial object image analysis software, we implemented a Graphical User Interface (GUI) in MATLAB that used the LIBSVM library [76] for the implementation of SVM. The GUI was used to conduct data scaling and apply the cross-validation procedure for the selection of C and γ values. Moreover, it was used for training the final model and producing the thematic map in object-based classifications. In this case, the objects and the labeled samples were first exported in vector format and then imported in MATLAB. For pixel-based classifications, the final models and the thematic maps were produced using the commercial software ENVI 4.7, whereas the MATLAB GUI was only used for the determination of the two parameters and the estimation of the cross-validation error. As mentioned previously, the large data volume involved in the case of the pixel-based classifications at the full space required the special manipulation through custom MATLAB scripts, as it will be detailed in Section 5.
Table 5. Selected Support Vector Machine (SVM) parameters for each dataset.
ParnithaRhodes
DatasetCγCγ
IKONOSRGBNIR-PIXEL1280.1253276823
IKONOSFullSpace-PIXEL5120.582
IKONOSFuZCoC-PIXEL1280.1253276823
IKONOSOBJECT20.581922−7
IKONOSFuZCoC-OBJECT0.5220480.5

4. Experimental Results

This section presents the obtained results from the application of the proposed methodologies in the Parnitha and Rhodes datasets. Pixel-based and object-based classifications for the Parnitha datasets are presented first, followed by the results obtained by Rhodes classifications. The two approaches in both cases are subsequently compared in terms of their effectiveness in burned areas mapping.
To assess the classification models’ ability to map burned areas accurately, we estimated the agreement between the burned area maps resulting from the classification process and the reference map. For each individual classification, the confusion matrix has been used to provide a basic description of the thematic maps accuracy [80]. The statistical measures derived from that matrices, namely, the Kappa index of agreement (KIA), overall accuracy (OA), producer’s accuracy (PA), and user’s accuracy (UA) [81] were used to describe the accuracy of the derived maps. Additionally, the accuracy of the produced maps was also assessed using the probability of false alarm (Pf) metric [82]:
P f = M f n M f f + M n n
where Mff is the number of correctly classified fire pixels, Mnn is the number of correctly classified non-fire pixels, Mnf is the number of pixels assigned as non-fire by the classification while assigned as fire in the reference map and Mfn is the number of pixels assigned as fire by the classification while assigned as non-fire in the reference map. In our case, the Pf metric describes the probability a pixel to be erroneously classified as “Burned”.
All maps were converted to raster images of 1m pixel size and an image-to-image comparison was performed using all pixels. To do so, the resulting maps were compared with a reference map featuring the two classes, namely, “Burned” and “Unburned”, same as the two classifications. All of the aforementioned statistical measures were calculated using all pixels of the image.

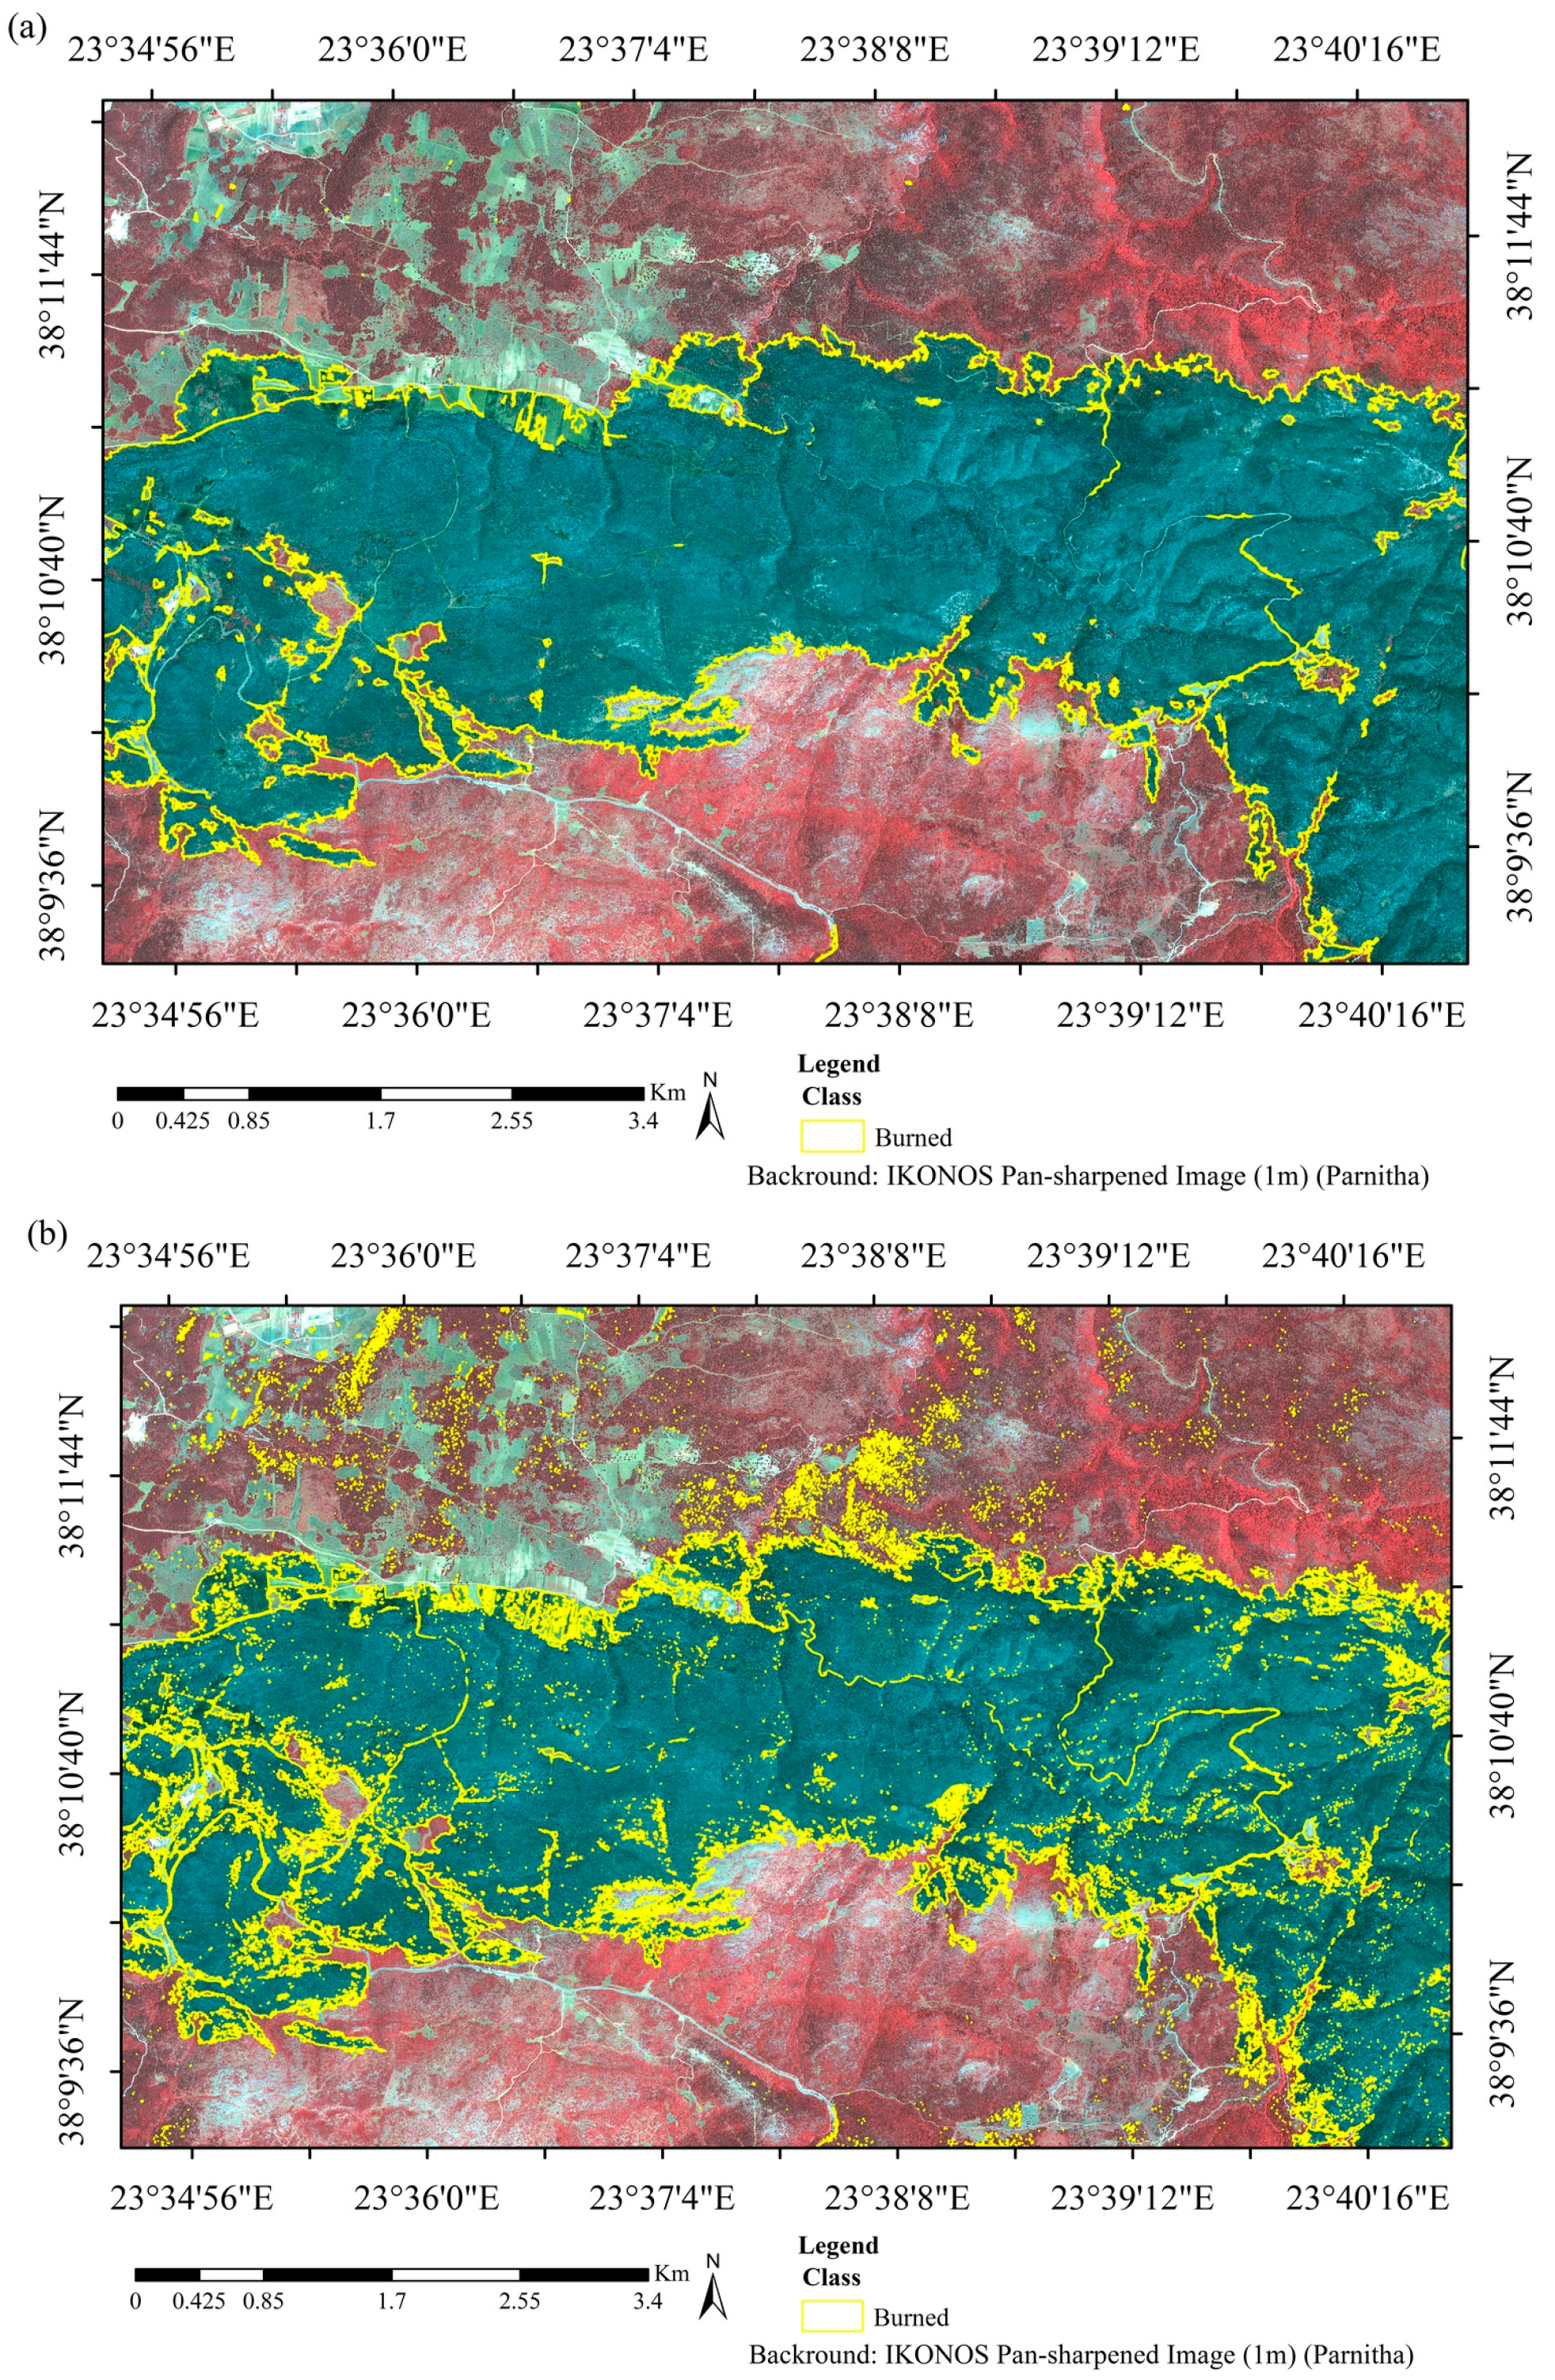
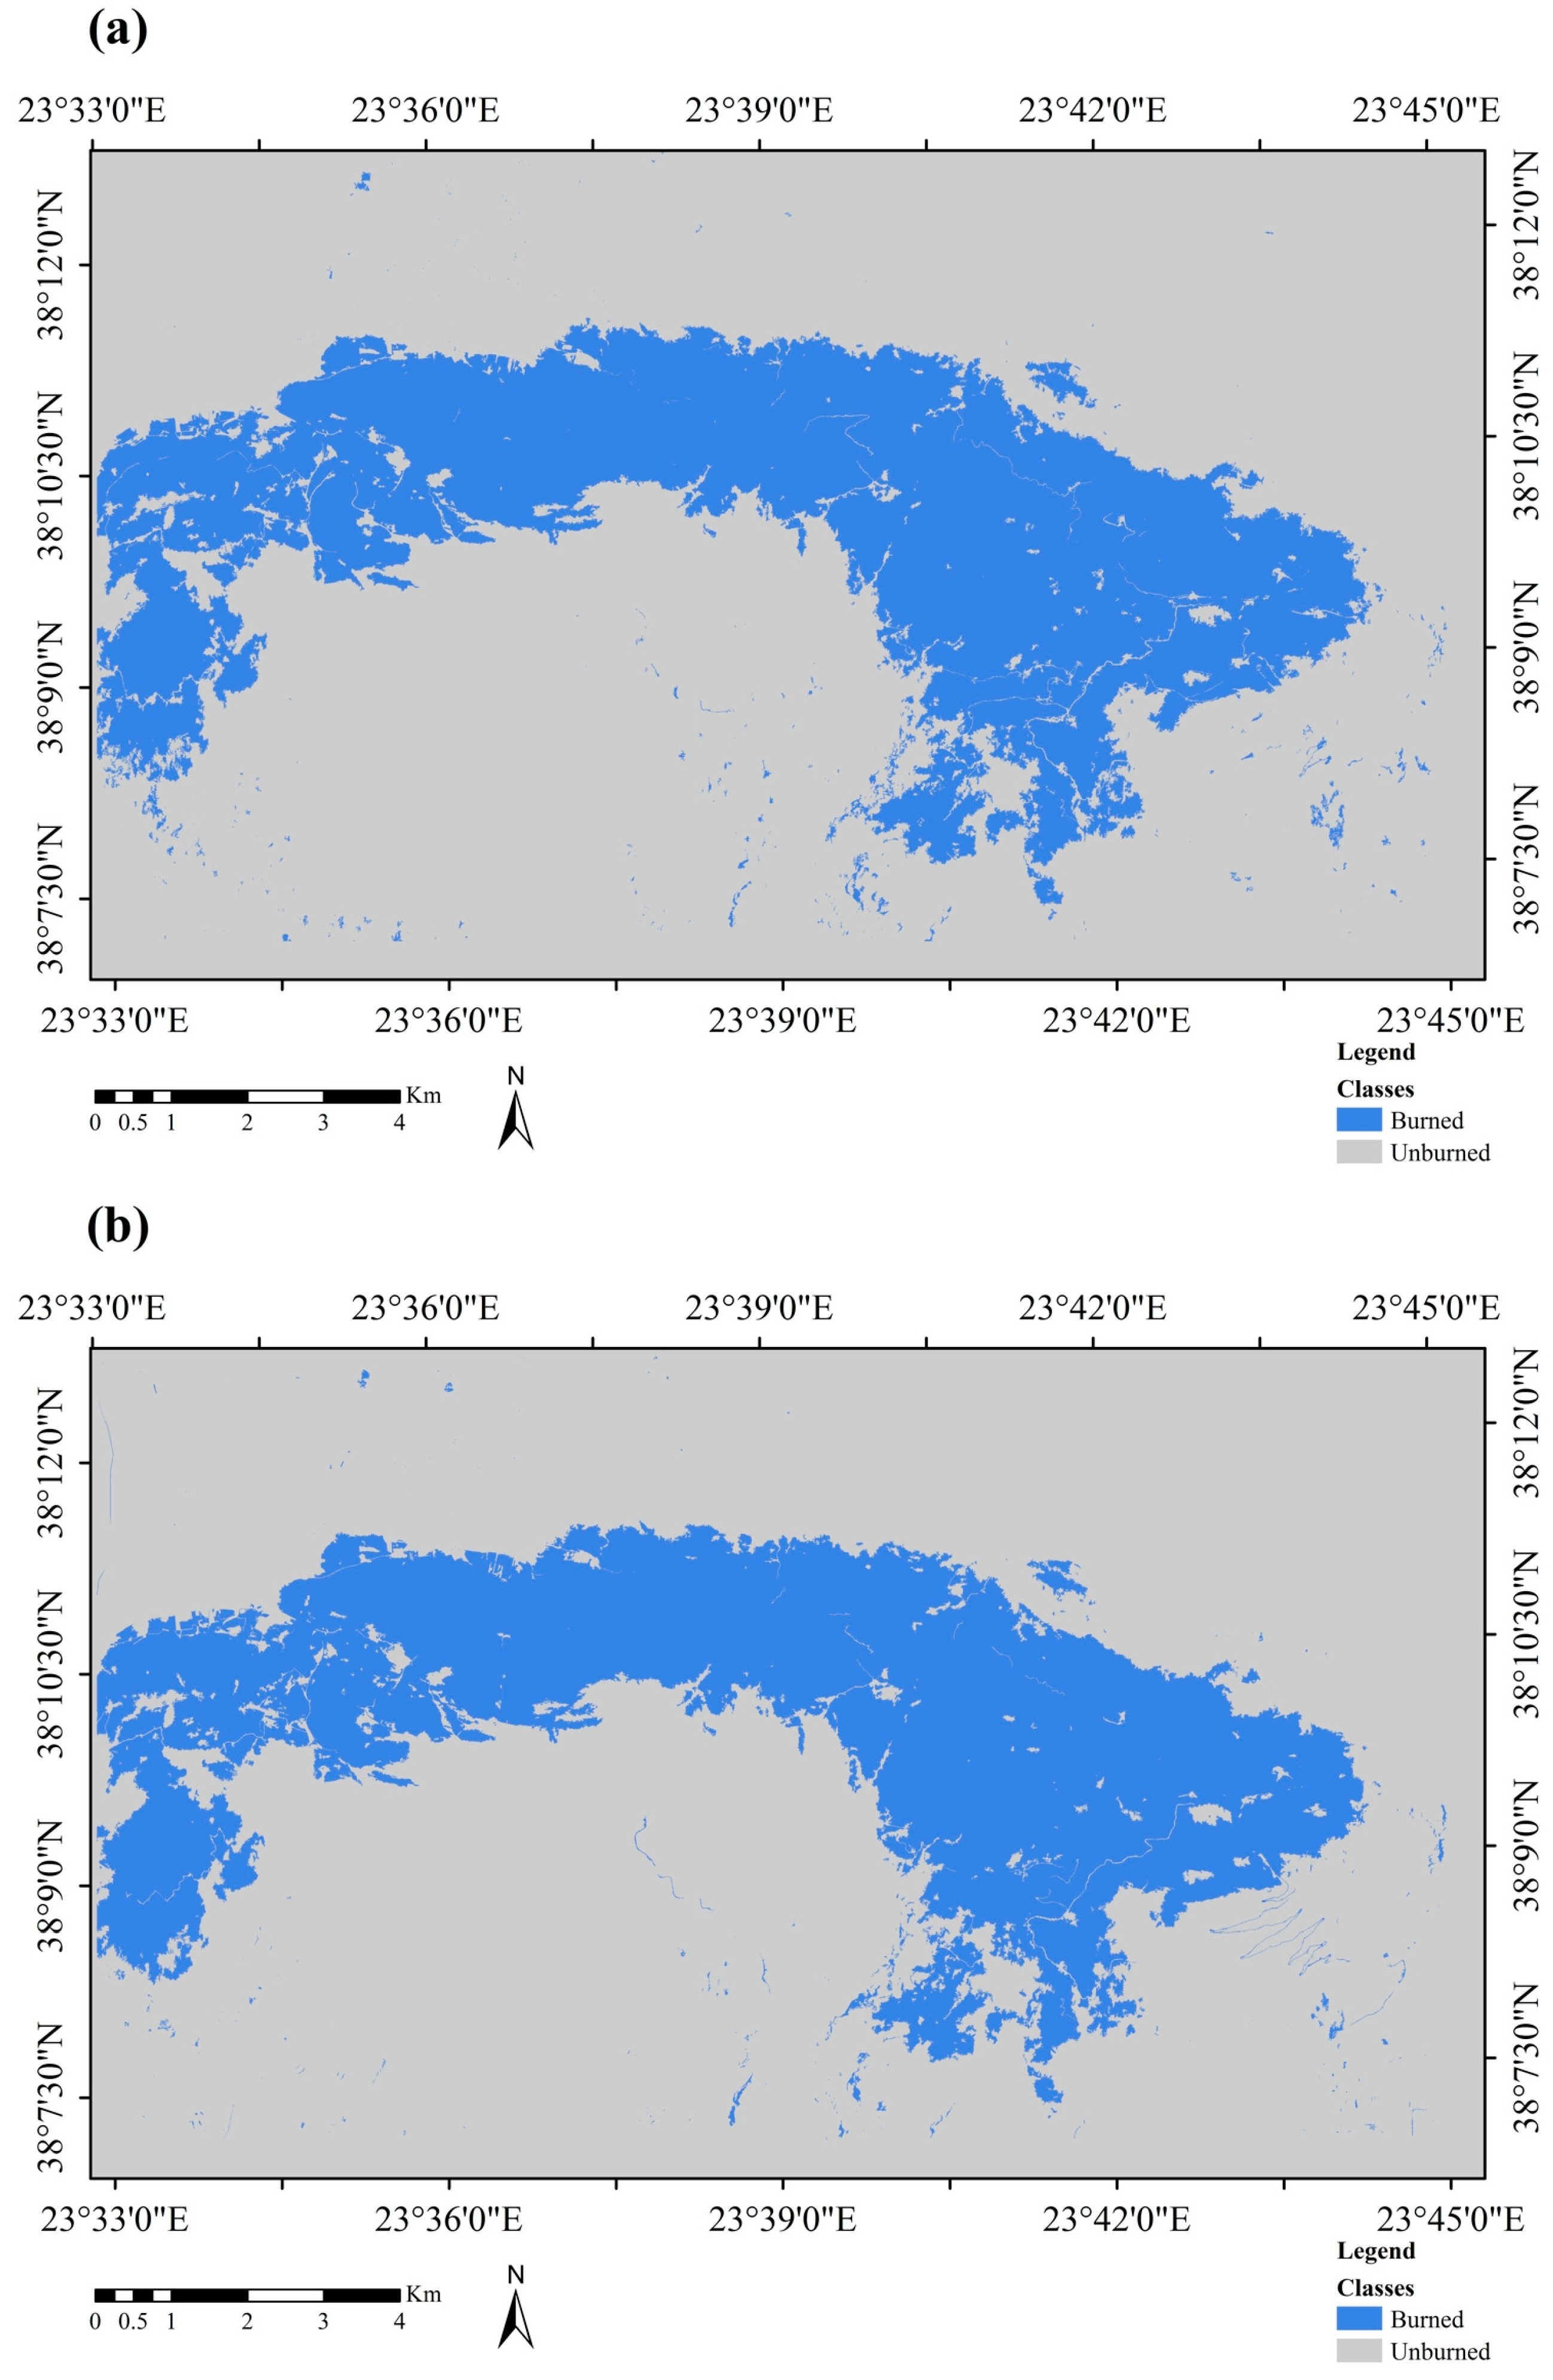
4.1. SVM Pixel-Based Classification Results for the Parnitha Dataset

In this section, the mapping products derived from the SVM pixel-based classifications are initially presented. The first objective of the present study is to evaluate whether the addition of extra features to the original IKONOS bands increases or not the accuracy and the quality of the burned area maps. To this end, we compared three thematic maps derived from three different feature sets, namely, the full space (172 features), the reduced space (the four FuzCoC selected features, see Section 3.3), and original spectral space (the four bands of the IKONOS image).
The obtained results (Table 6) indicate that the use of the higher-order features increases the classification accuracies of the derived burned area maps. Additionally, no Hughes’ phenomenon is present in our case, since the classification accuracy is maximized when all the 172 features are considered (OA 97.47%, KIA = 0.934). The classification based on the dataset with the reduced space achieved marginally lower classification accuracy (OA 97.27%, KIA = 0.928) in comparison to the classification based on the IKONOSFullSpace-PIXEL dataset. However, in both cases (full space and reduced space), the thematic maps attained higher overall classification accuracies in comparison to the thematic map derived from the IKONOSRGBNIR-PIXEL dataset (OA of 95.95%, KIA = 0.894). The SVMFuzCoC-PIXEL classification resulted in higher UA, particularly in the case of the “Burned” class, where the difference with respect to the other two classifications (SVMRGBNIR-PIXEL and SVMFullSpace-PIXEL) is substantial (approximately 4% in both cases). This implies that the SVM classifier in the reduced space is less prone to overestimate the “Burned” class (that is, it produces fewer misclassification in unburned areas) compared to the other two cases. Moreover, the probability of false alarm Pf is more than 2.5 times lower in the case of SVMFuzCoC-PIXEL, which means that this scheme is less prone to misclassify non-fire pixels than the classification scheme in the two other cases. These results reveal that SVM performed better in the datasets where additional information was included.
In addition to the quantitative measures presented so far, a visual assessment of the burned area maps was also carried out. In order to preserve space, this analysis considers only the two main cases of interest, that is, the SVMRGBNIR-PIXEL and SVMFuzCoC-PIXEL classifications, since the SVMFullSpace-PIXEL case involves many practical inefficiencies. Figure 3 presents the resulting burned area maps in both cases, along with the reference map. A careful examination of the maps reveals that SVMRGBNIR-PIXEL produced a much higher number of misclassifications than the SVMFuzCoC-PIXEL case, especially in unburned areas. This fact highlights the practical significance of the difference between the two classifications, regarding the UA and Pf discussed above. Although the absolute value of Pf in both cases is very small, the higher noise level in the SVMRGBNIR-PIXEL map is quite distinguishable within the unburned areas.
Table 6. Accuracy measures for SVM pixel-based classifications (Parnitha).
ClassificationClassPAUAOAKIAPf
SVMFullSpace-PIXELBurned95.9994.4297.470.9340.015
Unburned98.0098.58
SVMRGBNIR-PIXELBurned91.0993.2495.950.8940.018
Unburned97.6796.89
SVMFuzCoC-PIXELBurned92.3797.0897.270.9280.007
Unburned99.0297.35
A closer examination of the SVMRGBNIR-PIXEL map revealed that the misclassified pixels were mainly located in shadowed areas (mainly tree shadows). Furthermore, commission errors (areas erroneously classified as “Burned”) were observed on bare soil, roads, and recently ploughed fields, whereas omission errors (areas erroneously classified as “Unburned”) were observed on areas with surface fires, slightly burned vegetation, and burned rocky areas. Especially in the case of the rocky sites inside the burned forested areas, the algorithm failed to correctly classify them as burned. This was not unexpected due to the high spectral similarity of those pixels (burned rocky areas) with other unburned pixels. The classifier correctly mapped rocks as unburned areas (since rock does not get burned), although those areas would be mapped within the burned area perimeter in operational burned area mapping. Errors were also observed on the borders of the two classes.
Examination and visual interpretation of the SVMFuzCoC-PIXEL map revealed that the classification quality was higher comparatively to the SVMRGBNIR-PIXEL map, mainly due to the reduced noise effects. Figure 4 depicts a detail of the two maps inside the burned are perimeter. It becomes apparent that the SVMRGBNIR-PIXEL map is affected by a much higher degree of the salt-and-pepper effect than the SVMFuzCoC-PIXEL map, which exhibits reduced noise effects. Moreover, the classes in the SVMFuzCoC-PIXEL were characterized from greater homogeneity comparatively to the respective classes in the SVMRGBNIR-PIXEL. Misclassification errors were also found in the same areas as in the previous classification (SVMFuzCoC-PIXEL) examined. Nevertheless, it should be mentioned that in both cases it was difficult for the classifier to correctly delimit the boundaries of the unburned vegetation patches.
Figure 3. SVM pixel-based burned area maps for the Parnitha dataset: (a) reference map, (b) SVMRGBNIR-PIXEL classification, and (c) SVMFuzCoC-PIXEL classification.
Remotesensing 06 12005 g003
Figure 4. Delineation of the unburned patches in the pixel-based classifications and the reduced noise effects after the FuzCoC feature selection: (a) SVMRGBNIR-PIXEL classification and (b) SVMFuzCoC-PIXEL classification. The blue areas depict the burned areas after classifications. The background of the figures is a false composite (NIR-Red-Green) of the IKONOS image.
Remotesensing 06 12005 g004
In conclusion, the numerical and visual comparison of the burned area maps indicated that the use of selected FuzCoC features along with the SVM classifier resulted in a map product with higher accuracy and reliability.

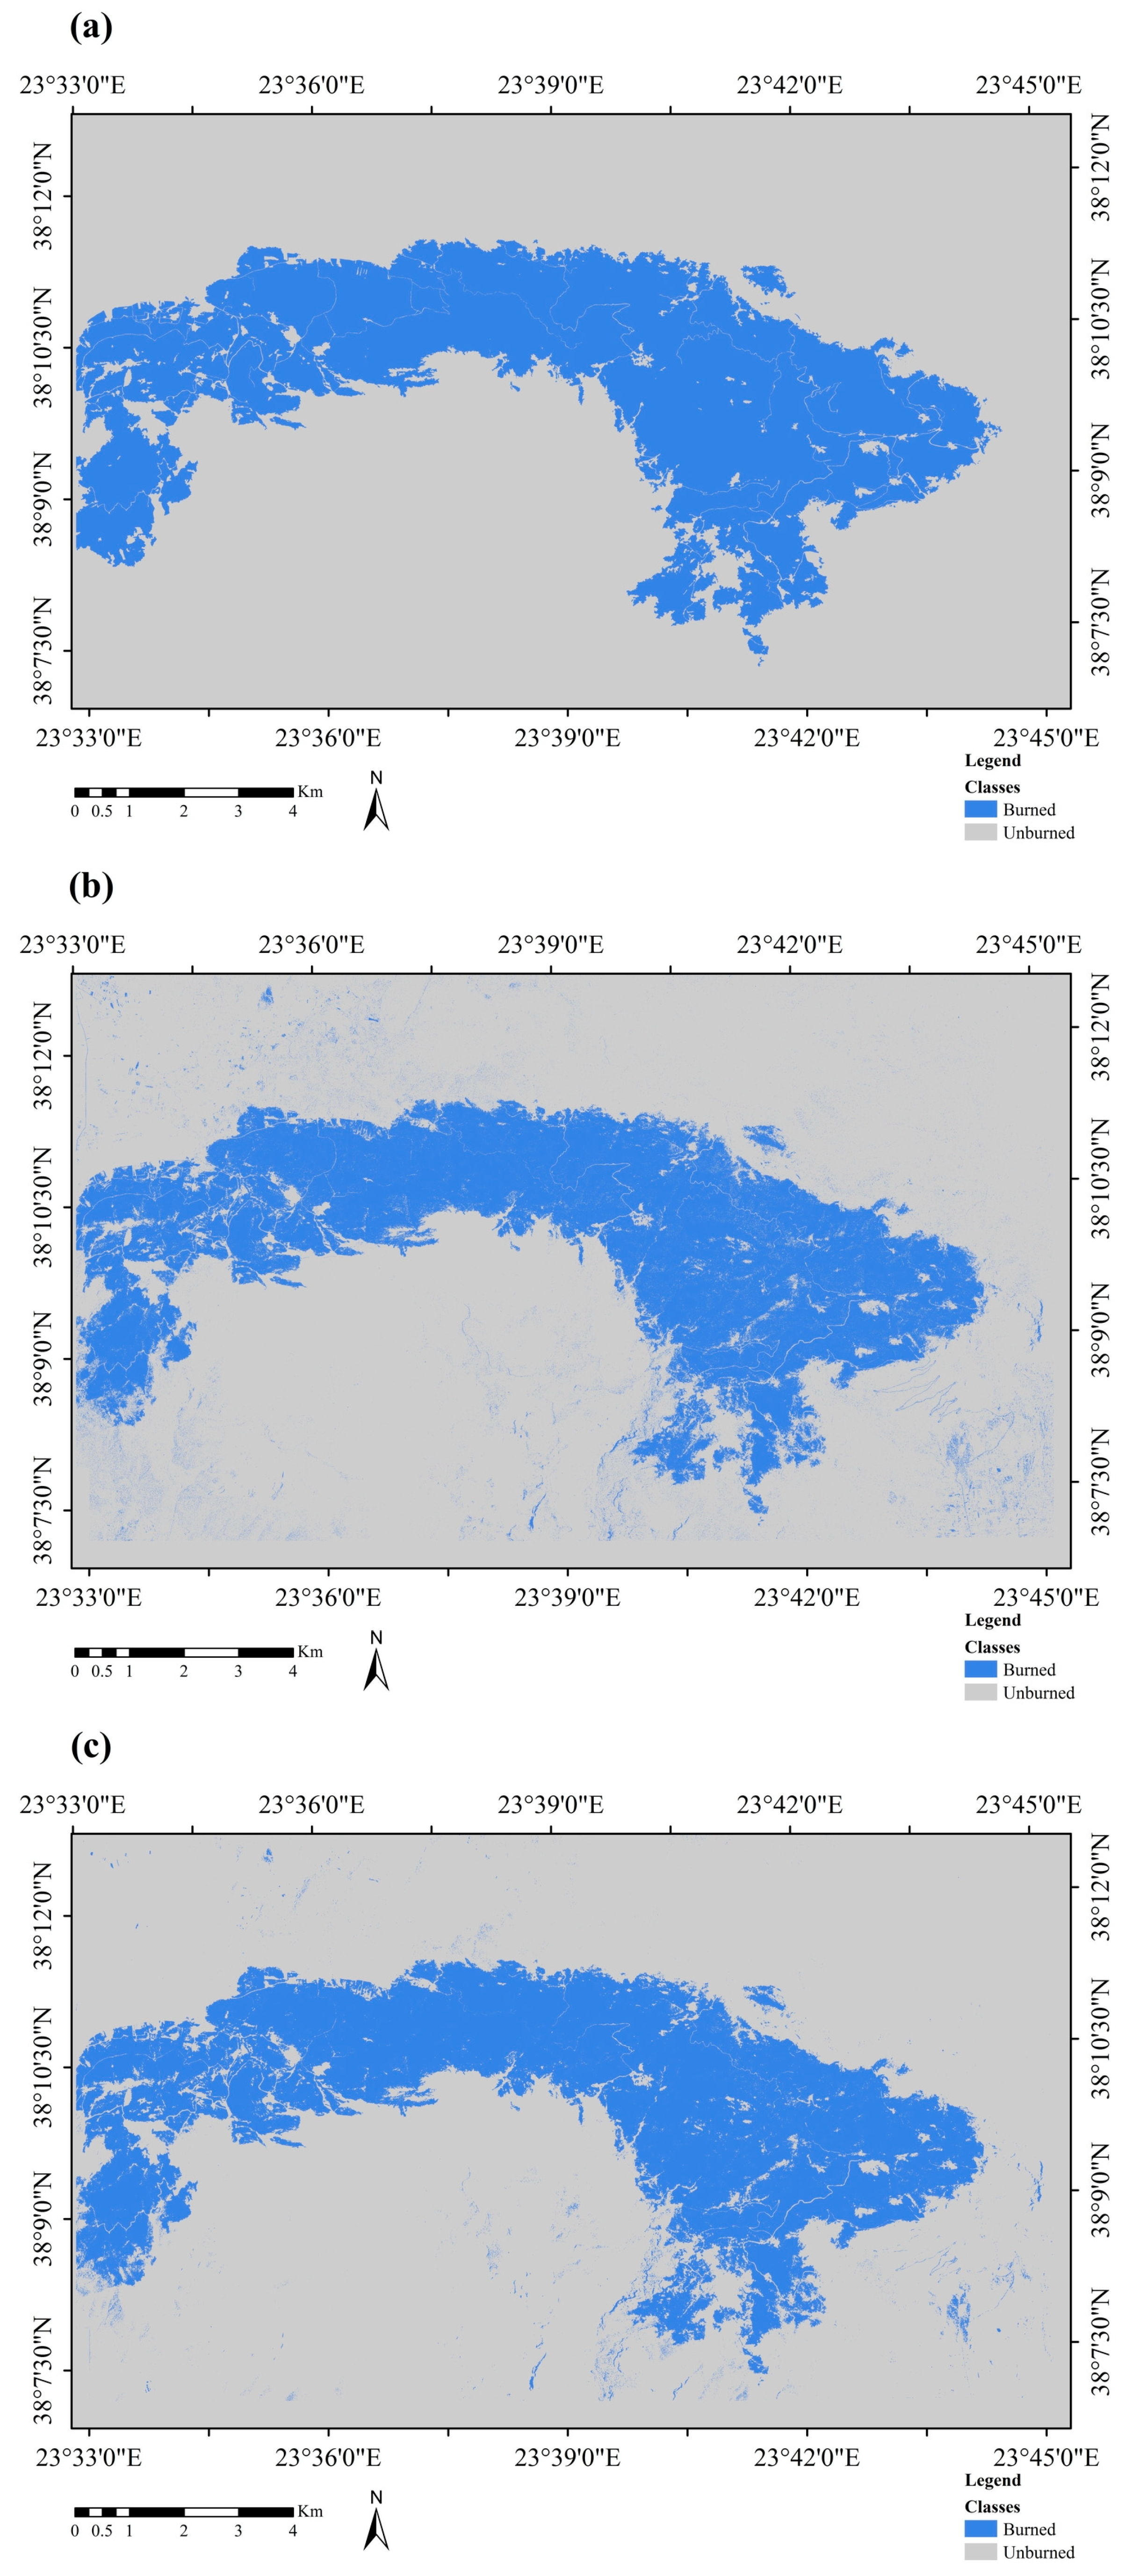
4.2. SVM Object-Based Classification Results for the Parnitha Dataset

This section presents the results obtained from the implementation of the SVM object-based classification models. Table 7 reports the results of the accuracy assessment procedure for both cases (with and without FS). The obtained results suggest that both methods achieve highly accurate classifications. In particular, the SVMOBJECT classification attained an OA of 97.17% (KIA = 0.926), whereas the SVMFuzCoC-OBJECT an OA of 97.85% (KIA = 0.943). Similarly to the pixel-based classifications, the application of the SVM in the reduced feature space (the three features selected by the FuzCoC FS methodology) resulted in increased UA for the “Burned” class compared to the full space classification, although the difference is somewhat smaller in this case (2.49%). Moreover, the value of Pf for the SVMFuzCoC-OBJECT classification is more than two times smaller than that for the SVMOBJECT classification.
Table 7. Accuracy measures for SVM object-based classifications (Parnitha).
ClassificationClassPAUAOAKIAPf
SVMOBJECTBurned94.6494.5697.170.9260.015
Unburned98.0898.11
SVMFuzCoC-OBJECTBurned94.6497.0597.850.9430.007
Unburned98.9998.13
Figure 5. SVM object based burned area maps for the Parnitha dataset: (a) SVMOBJECT classification and (b) SVMFuzCoC-OBJECT classification.
Remotesensing 06 12005 g005
In order to explain the misclassification errors in the burned area maps, a visual examination of the classification maps was also conducted, which is depicted in Figure 5. In general, both burned area maps show a reasonably accurate visual depiction of the classes of interest in this area. The main misclassifications were observed in objects with shadows, bare soil, roads, surface fire, slightly burned vegetation, objects with old dry vegetation (especially coniferous) and recently ploughed fields. Moreover, misclassifications were observed in mixed objects, that is, objects containing both classes, namely, “Burned” and “Unburned”. In these cases, the segmentation process failed to partition the image in homogeneous regions, leading to the creation of objects with two classes. This problem exists mainly in dense forested areas which suffered from surface fires and in bare lands with sparsely distributed shrubs. Considering this fact, it seems that the segmentation process is of great importance for the accuracy of the classification and should be further investigated.
The SVM classifier applied on the IKONOSFuzCoC-OBJECT dataset performed slightly better inside the burned area, as compared to the SVM applied on the IKONOSOBJECT dataset. Finally, a visual examination of the classifications revealed that in both cases the SVM classifier correctly classifies the unburned islands of vegetation. An example of unburned patches inside the fire perimeter is depicted in Figure 6 for both cases.
Figure 6. An example of unburned patches in the object-based classifications: (a) SVMOBJECT classification and (b) SVMFuzCoC-OBJECT classification. The blue areas depict the burned areas after classifications.
Remotesensing 06 12005 g006
Besides the fact that both SVM models yielded high classification performances, the classifier demonstrated very high ability in discriminating the different classes inside and outside the fire perimeter. Particularly inside the fire perimeter, the classifier exhibited high ability in discriminating the unburned vegetation patches. As it was expected, the application of the object-based approach significantly reduced the salt-and-paper effect, compared to the pixel-based approaches. Moreover, in both approaches (pixel and object) the reduced space classifications resulted in the lowest Pf values. Finally, it should be emphasized that the use of the FuzCoC FS methodology significantly reduced the classification time and maintained high accuracy in the burned area map product.

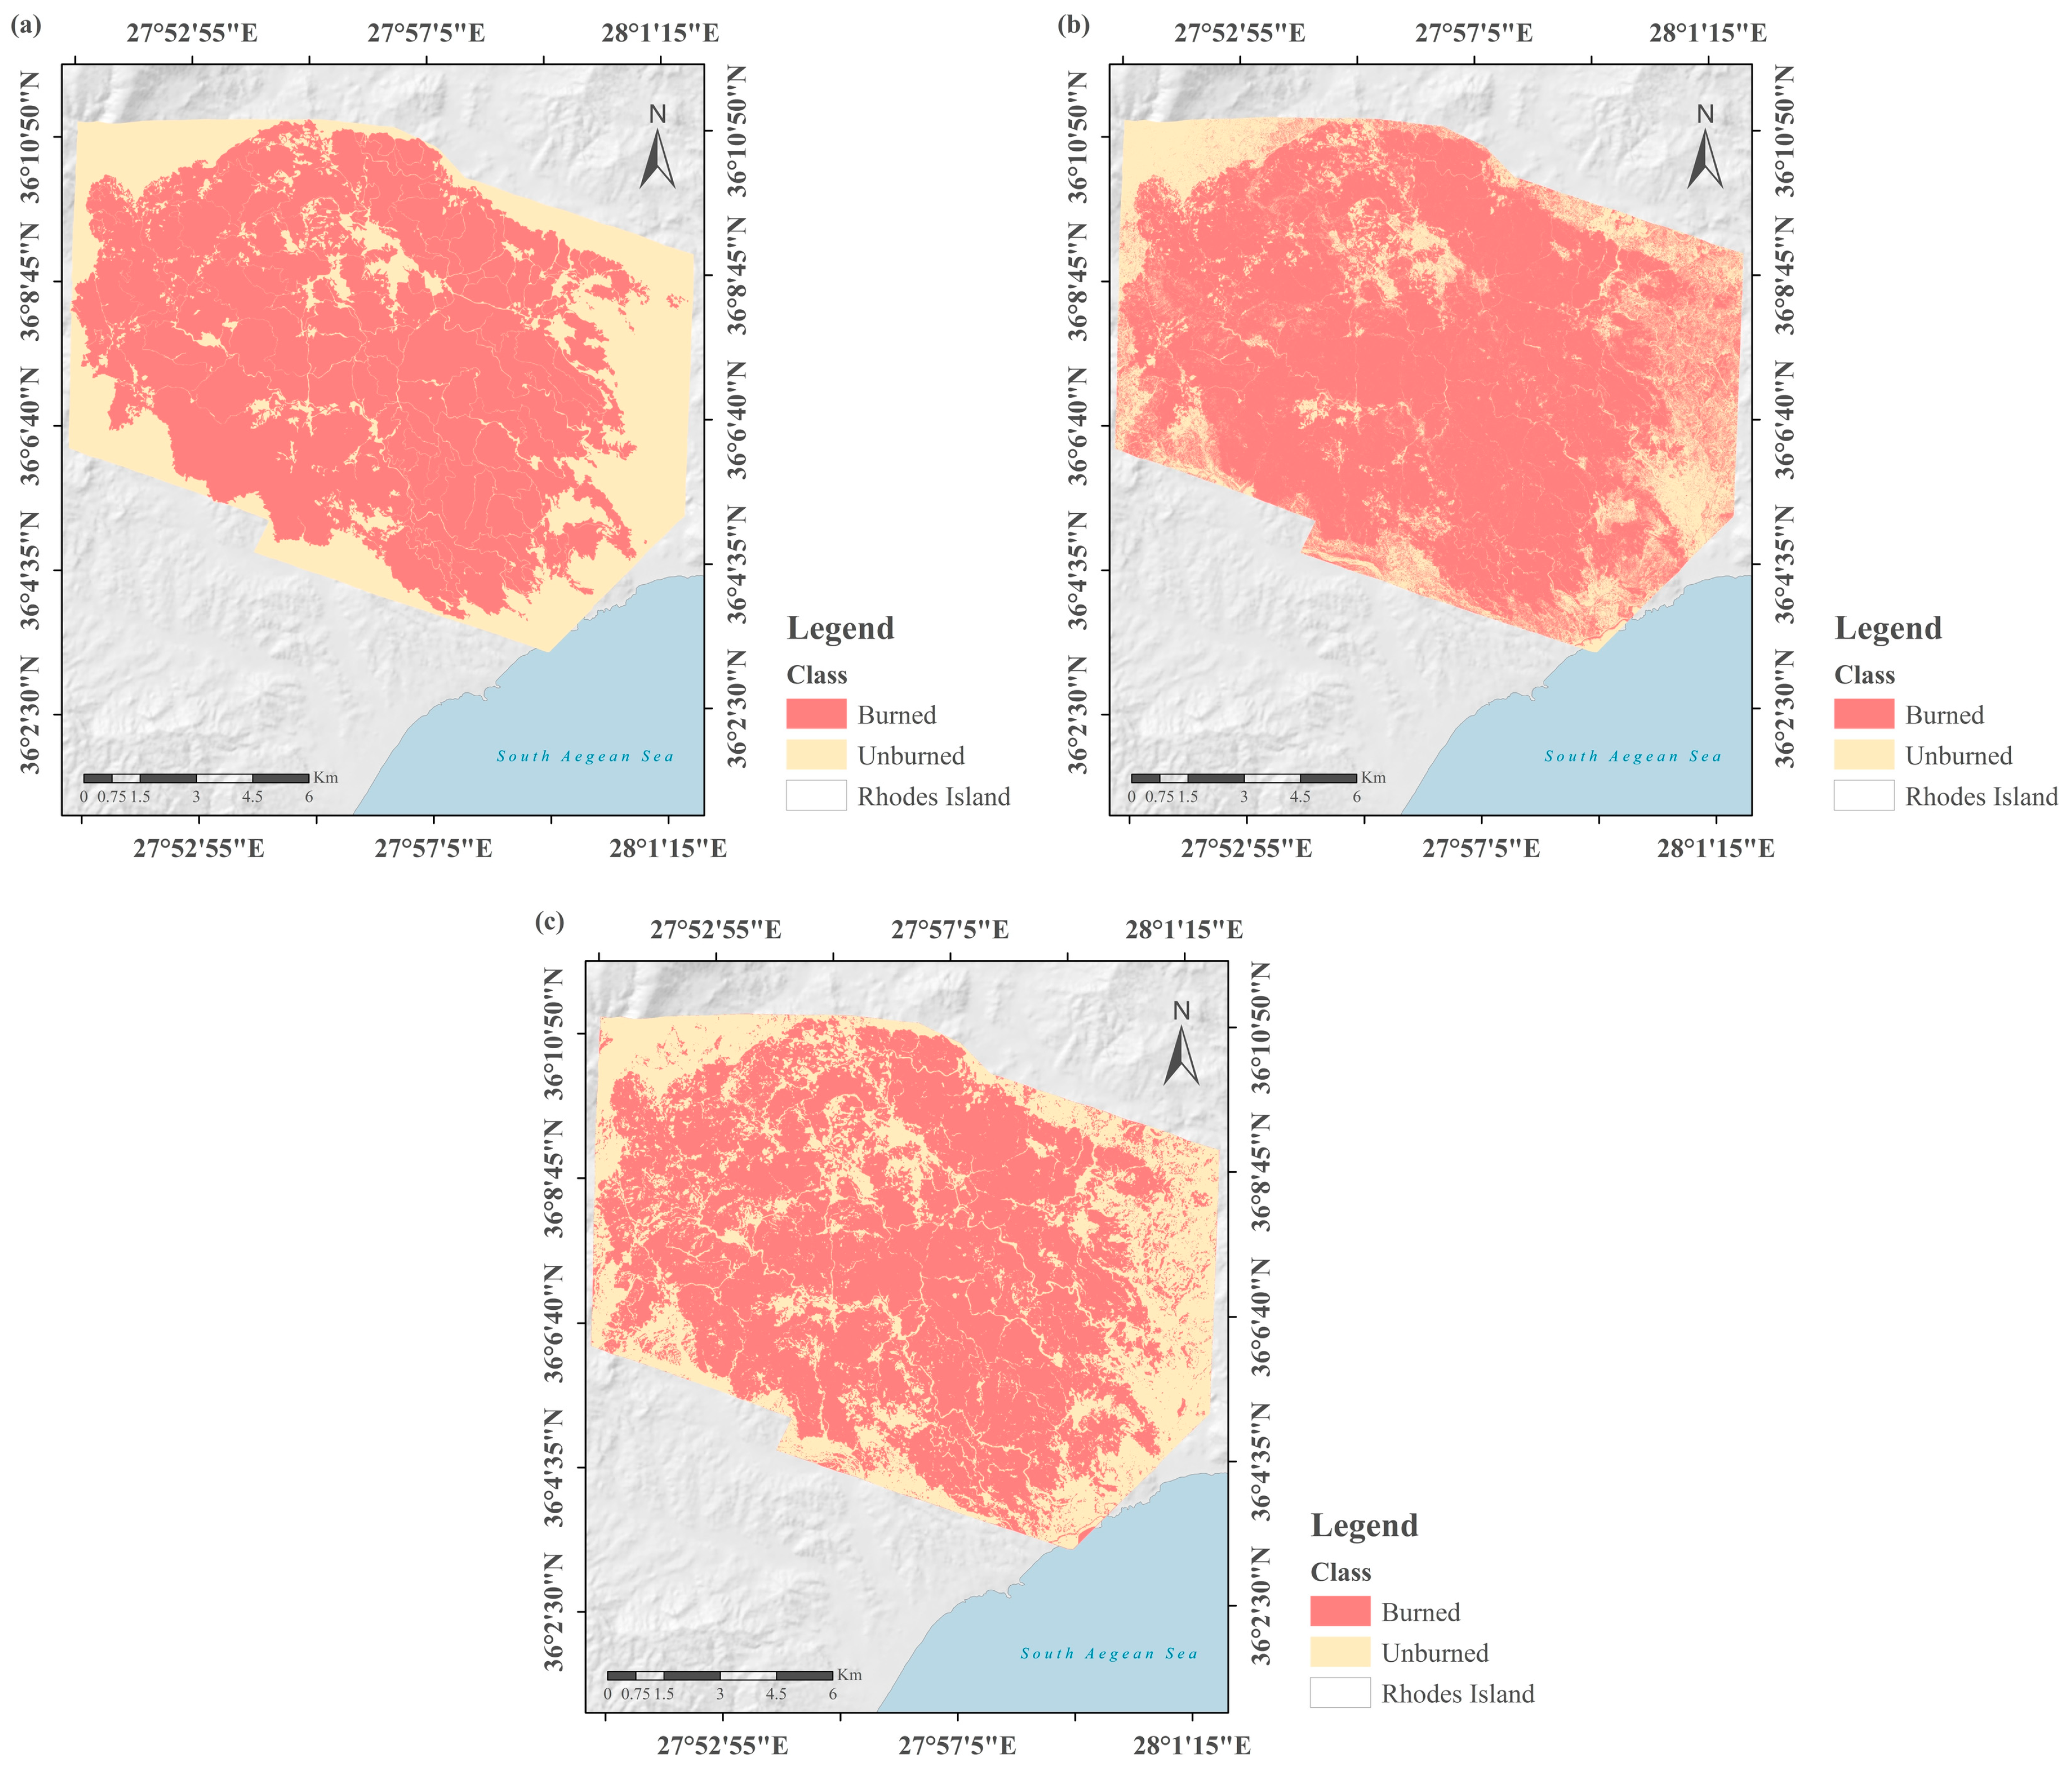
4.3. SVM Pixel-Based Classification Results for the Rhodes Dataset

Here we present the application of the SVM pixel-based classification procedure on the second study (island of Rhodes). The obtained results (Table 8) indicate that the highest OA was attained using all the available features (SVMFullSpace-PIXEL), which is approximately 2.5% higher than the respective accuracy obtained using the reduced space (SVMFuzCoC-PIXEL). The accuracy considering only the original space (SVMRGBNIR-PIXEL) is substantially lower than either one of the two other cases. It is also evident that the Rhodes burned area mapping task constitutes a harder classification problem than the Parnitha one and, therefore, the differences between the three approaches (original, full, and reduced space, respectively) are larger. Consequently, the gains from the use of extra features along with an FS process become more obvious. In all cases, the SVM exhibits the tendency to overestimate the “Burned” class, a fact that can be easily perceived from the much lower PAs for the “Unburned” class. The SVMFuzCoC-PIXEL exhibits a rather more balanced behavior in that respect, which is reflected in the smallest Pf value observed for this case, although its OA is lower than the SVMFullSpace-PIXEL classification. A lower Pf value means that the SVM classifier is less prone to misclassify non-fire pixels.
Table 8. Accuracy measures for SVM pixel-based classifications (Rhodes).
ClassificationClassPAUAOAKIAPf
SVMFullSpace-PIXELBurned95.2090.3689.970.7660.075
Unburned79.3289.02
SVMRGBNIR-PIXELBurned95.2983.1283.860.6040.154
Unburned60.5686.33
SVMFuzCoC-PIXELBurned89.4791.8287.590.7220.060
Unburned83.7779.62
In order to examine and compare the quality of the classification, we also conducted a visual inspection of the derived maps. Similarly to the analysis of Section 4.1, we concentrate on the two main cases of interest, that is, the SVMRGBNIR-PIXEL and the SVMFuzCoC-PIXEL (Figure 7). A close inspection of the classifications reveals that the SVMFuzCoC-PIXEL map is of rather higher quality compared to the SVMRGBNIR-PIXEL one, mainly due to the reduced noise effects. The SVMRGBNIR-PIXEL map exhibits severe overestimation of the “Burned” class, with a large number of pixels outside the fire perimeter being misclassified. Conversely, the SVMFuzCoC-PIXEL underestimates the “Burned” class inside the fire perimeter to some extent, but this effect is much milder than the overestimation one of the former classification.
Figure 7. SVM pixel-based burned area maps for the Rhodes dataset: (a) reference map, (b) SVMRGBNIR-PIXEL classication, and (c) SVMFuzCoC-PIXEL classification.
Remotesensing 06 12005 g007

4.4. SVM Object-Based Classifications for the Rhodes Dataset

This final subsection presents the application of the object-based approach to the Rhodes dataset. The quantitative results are reported in Table 9. It is evident that the application of the FuzCoC FS resulted in substantially increased classification accuracy compared to the initial feature space, especially inside the burned area. More specifically, an OA of 79.26% (KIA = 0.477) was achieved by the SVM classification in the full space and an OA of 92.39% (KIA = 0.830) for the classification in the reduced space. All class-specific accuracies are substantially increased in the latter case, with the difference being greater for the “Unburned” class. This is attributed to the fact that a higher number of unburned areas inside the fire perimeter have been erroneously characterized as burned ones. The latter is also verified by the respective Pf values, which in the case of the SVMFuzCoC-OBJECT is approximately two times smaller than the SVMOBJECT one, indicating that the former classification model is less prone in misclassifying unburned areas than the respective SVMOBJECT model.
Table 9. Accuracy measures for Rhodes SVM object-based classifications
ClassificationClassPAUAOAKIAPf
SVMOBJECTBurned87.2484.3079.260.4770.114
Unburned59.3064.90
SVMFuzCoC-OBJECTBurned92.8895.6792.390.8300.051
Unburned91.4386.30
In addition to the numerical results presented above, a visual inspection of the classification maps has also been conducted (Figure 8). The two maps differ in terms of the location and the pattern of their respective omission and commission errors. Specifically, the map produced based on the dataset with the FuzCoC selected features (Figure 8b) misclassified relatively small areas across the whole scene, especially outside the fire perimeter. Inside the fire perimeter the classifier succeed in accurately differentiating the burned from the unburned areas. On the other hand, a visual inspection of the map derived from the SVMOBJECT model (Figure 8a) revealed that the SVM classifier exhibited the tendency to overestimate the class “Burned” against “Unburned” class. In the SVMOBJECT case the salt-and-pepper effect was minimized compared to the SVMFuzCoC-OBJECT one, but at the expense of misclassifying a substantially higher number of unburned objects within the fire perimeter (patches of healthy vegetation, bare soil, low vegetation areas and roads) as burned ones (Figure 8a).
According to the above, the classification quality of the map derived from the SVMFuzCoC-OBJECT is higher compared to the respective one derived from the SVMOBJECT model. The land cover types which are typically incorrectly classified in burned area mapping (e.g., shadows, bare soils, etc.) were still misclassified in both cases.
Figure 8. SVM object based burned area maps for the Rhodes dataset (a) SVMOBJECT classification (b) SVMFuzCoC-OBJECT classification.
Remotesensing 06 12005 g008

5. Discussion

A collateral aim of this work is to examine and compare the developed methodologies with respect to their potential use on an operational basis. In general, any developed burned area mapping methodology should meet the following criteria in order to be applicable on operational basis: it should be rapid, reliable and automated [9]. Hence, the evaluation of the developed burned area mapping methods of the current study should also take into account the aforementioned criteria.
Beginning with the pixel-based classification schemes, it is important to note that the whole pre-processing procedure until the stage of the classification was very time-consuming. During the procedure, the generation of a large volume of data required considerable storage capacity. The manipulation of such high-volume data was very time-consuming and the computational demands were extremely high. Specifically in the case of the full space pixel-based classifications, the aforementioned difficulties were immense. The process of the production of the thematic maps from the datasets with all the available features (172) required special treatment, using advanced programming tools. For this case, the images were split into multiple parts (over 250 pieces in each different case) and each different part was classified separately. To formulate the final thematic maps, the various parts of the initial datasets were merged back together. These processes are not easily applicable by typical remote sensing users and it is practically impossible to be conducted using common remote sensing software. To this end, the use of a FS method is considered of great importance when additional information is added on the original dataset and the whole classification process must be carried out using the simplest, easiest and fastest way. Even for the original or the reduced spaces, though, the computational and storage requirements of the pixel-based approach was still very high, due the large size of the VHR image. Overall, despite the rapid advent of computation systems technology, the high computational demand of these approaches will remain a deterrent factor on a long term basis, especially if we consider the need for regional-wide or nation-wide burned area mapping at multiple time points.
Considering the object-based classification schemes, the whole process of object extraction, FS and subsequent classification was less complicated, labor-intensive, and time-consuming than the pixel-based pre-processing counterparts. It should be noted that in any case examined (pixel and object), the FS process greatly decreased the volume of data that had to be processed, both in terms of storage requirements and computational demands with respect to the full area classification. Although these requirements are much less for the object-based approach than the pixel-based one, the relative gains from the application of the FS procedure are still substantial.
Currently, neither of the classification approaches are fully automated and rapid. To this end, none of the developed methodologies meet the operational criteria described above. However, the comparison between the pixel and the object-based approaches indicate that the latter fulfills these criteria to a higher degree. Thus, if it becomes possible to incorporate all the processes required for the implementation of the proposed object-based classification scheme into a single software in the near future, then it will be possible to conduct the classifications in a semi-automated way. The procedure cannot be fully automated since several parameters need to be adjusted.
The discussion presented so far indicates that the object-based classification scheme is more appropriate than the pixel-based one, in mapping recently burned areas using VHR imagery. The previous findings are further reinforced by the results of the numerical and visual comparison of the derived thematic maps. Generally, the maps produced from both approaches were more or less very accurate. In particular, all the classifications in the case of Parnitha exceeded 95% OA, whereas the accuracy of the produced thematic maps in the case Rhodes exceeded 87% percent when considering the additional features. The experimental analysis presented above reveals that the use of advanced features along with the FuzCoC FS had a positive effect with respect to classifications accuracy in both pixel-based and object-based classifications.
The experimental results from the pixel-based classifications shows that in both cases examined (Parnitha and Rhodes), the SVM classifier performed better in the datasets were additional features were included (with and without FS). The implementation of the SVM classifier in the full space (172 features) resulted in all cases in slightly higher classification accuracy compared to the reduced space (FS selected features) classification. Despite that, the gains from the implementation of the FS method in terms of computational demands and data manipulation equalizes the slight loss in the classification accuracy. Moreover, the visual inspection of the pixel-based derived maps reveals two more gains from the addition of higher-order features. The first one is the reduction of the salt-and-pepper effect and the second one is the increase of homogeneity inside the classes of interest. The depiction of the reality in the produced maps based on the reduced space was always higher in comparison to the maps based on the original datasets.
Focusing on the SVM object-based classification schemes, it becomes apparent that the application of the FuzCoC FS resulted in increased accuracies compared to the full feature space, for both the Parnitha and the Rhodes object-based classifications. The difference in the former case is practically negligent (0.68% difference in OA), whereas in the latter case a substantial difference of more than 13% in OA is observed. The magnitude of the increase in classification accuracy is problem-dependent. The Parnitha dataset defines a much simpler classification task, since both object-based classification exhibit OA higher than 97%. However, Rhodes’ study area is characterized by a far more heterogeneous terrain and the gains from the FS procedure are much higher.
A comparison of the numerical results between the pixel-based and the object-based approaches reveals that the latter compares favorably to the former, exhibiting higher overall accuracy. The gains in accuracy after the implementation of the SVM object-based classification appear to be marginal for the Parnitha case. However, in the case of Rhodes the gains in accuracy are quite substantial (4.8% difference in OA). Regarding the visual inspection of the pixel and object classifications, the classes in the object-based classifications were more homogeneous and the classes’ depiction was more realistic. An example is given in Figure 9, which depicts a detail of the thematic maps obtained from the SVMFuzCoC-OBJECT and the SVMFuzCoC-PIXEL classifications in Parnitha. It can be easily observed that the object-based classification resulted in a much more homogeneous “Burned” area characterization. Taking also into consideration the practical inefficiencies of the pixel-based approach, the object-based approach is deemed more appropriate for the production of accurate and realistic burned area maps.
The land cover types which are usually incorrectly classified in burned area mapping (e.g., shadows, bare soils, etc.) were still misclassified in both SVM approaches for all cases (full, reduced, and original space). However, the number of the erroneously classified areas was significantly diminished using the object-based approach. Particularly for the case of shadowed areas, the application of SVM on objects exhibits higher discriminating ability comparatively to the SVM on pixels. Figure 10 presents an illustrative example of such a case.
Due to the high costs involved in the acquisition of VHR images, the analysis of the current study was unfortunately confined in two study areas only. The experiments in these two study areas were conducted independently from each another. To this end, we cannot infer any further about the transferability of the proposed methodology. Taking a closer look at the features selected by FuzCoC for the two test areas (Table 3 and Table 4), we can observe that certain features are selected in both cases (apart perhaps from the size of the window). Nevertheless, an analysis of this sort would require a much larger number of test cases, so that the intersection of the most frequently selected features could be identified in a statistically robust manner. In any case, the investigation of the herein proposed methodology’s transferability properties—or the discussion of whether this is possible altogether—is outside the scope of the present study and constitutes the subject of a future work.
Presently, acquiring a large number of VHR imagery seems very difficult, either due to their high purchase cost or due to their limited availability within a very short time framework. Satellite imaging start-ups such as Skybox and Planet Labs are expected to considerably alleviate these difficulties, by providing low cost high resolution imagery in a timely manner. The aim of these two start-up companies—and similar ones—is to set to launch a large number of small imaging satellites which will be able to revisit and photograph huge areas of the planet several times each day. The provision of high spatial- and temporal-resolution images in low prices is expected to pave the way for new innovations in many scientific fields, including the field of burned area mapping.
Figure 9. The enhanced quality of the burned area maps (Parnitha) after the implementation of the object-based approach. (a) The homogeneous “Burned” class (yellow color) in the SVMFuzCoC-OBJECT classification. (b) The overestimated “Burned” class in the SVMFuzCoC-PIXEL classification.
Remotesensing 06 12005 g009
Figure 10. The enhanced quality of the burned area maps (Parnitha) in the shadowed areas after the implementation of the object-based approach: (a) Unburned areas in the SVMFuzCoC-OBJECT classification. (b) SVMFuzCoC-PIXEL classification. (Red color: shadowed areas wrongly classified as burned. Yellow color: Unburned areas).
Remotesensing 06 12005 g010

6. Conclusions

In this paper, we investigated the influence of the higher order spectral and spatial features for accurately mapping recently burned areas, using IKONOS imagery. Our analysis considers both pixel-based and object-based approaches, using two advanced image analysis techniques: an efficient filtering method based on FuzCoC and the SVM classifier. In both cases the implementation of SVM on VHR imagery resulted in the production of burned area maps of very high classification accuracies. However, a closer examination of the results revealed that the quality of the burned area maps derived from the object-based image analysis is higher compared to the respective maps from the pixel-based image analysis.
The results from the SVM pixel-based classifications indicate that the use of the additional features (with and without feature selection) instead of the original spectral bands improves the accuracy and reliability of the produced burned area map. However, SVM’s performance inside the class “Burned” was higher in the case of the FuzCoC selected feature space in both areas examined (Parnitha and Rhodes). Moreover, the application of the FuzCoC FS methodology substantially reduced the salt-and-pepper effect and improved class homogeneity inside the main class of interest, that is, the “Burned area” class. Nevertheless, the classification using the dataset with all the available features is practically almost impossible to be conducted using the common remote sensing software. Therefore, the use of an efficient dimensionality reduction method should be regarded as a perquisite step when additional information is added in the classification process.
The experimental results from the SVM object-based classifications in the full space (119 extracted features) and in the reduced space (FuzCoC selected features), showed that the latter results in increased classification accuracies. The absolute gains in accuracy were marginal for the easier classification task of the Parnitha dataset, but the difference was substantial for the more challenging Rhodes dataset. These findings support the argument that an efficient feature selection pre-filtering procedure is always beneficial in conjunction with the object-based image analysis.
The examination and comparison of the two developed classification schemes regarding their use on an operational basis shows that the proposed methodologies present some implementation challenges. Nevertheless, the object-based classification schemes meet the requirements for operational burned area mapping to a higher degree compared to the pixel-based approaches. More specifically, the object-based approach is less labor-intensive and time-consuming than the pixel-based one. Additionally, the burned area maps derived from the SVM object-based classification scheme are more accurate and reliable than the pixel-based burned area maps. Presently, the main drawback of the object-oriented SVM methods is the fact that they are not implemented in a single software interface. Overall, our paper makes a strong case over the use of advanced image analysis techniques in burned area mapping. Future incorporation of those techniques in a commercial software will open perspectives in operational burned area mapping.

Acknowledgments

This research work was conducted as part of the project “National Observatory of Forest Fires (NOFFi)” which is done in collaboration with the Greek Special Secretariat for Forests and financially supported by the Green Fund.

Author Contributions

Eleni Dragozi proposed the employed methodology and developed the research design, performed the experimental analysis, manuscript writing, and results interpretation. Ioannis Gitas contributed to the research design, results interpretation, discussion writing and manuscript revision. Dimitris Stavrakoudis developed the Graphic User Interface in MATLAB that was used for the feature selection process and the consequent application of the SVM classifier. He also contributed in the interpretation of the obtained results and manuscript writing. John Theocharis contributed to the research design, discussion writing and results interpretation.

Conflicts of Interest

The authors declare no conflict of interest.

References

  1. FAO. Fire Management Global Assessment 2006; Food and Agriculture Organization of the United Nations: Rome, Italy, 2007. [Google Scholar]
  2. FAO. State of the World’s Forests; Food and Agriculture Organization of the United Nations: Rome, Italy, 2012. [Google Scholar]
  3. FOREST EUROPE Liaison Unit Oslo; United Nations Economic Commission for Europe (UNECE); Food and Agriculture Organization of the United Nations (FAO). State of Europe’s Forests 2011: Status and Trends in Sustainable Forest Management in Europe; EFI EUROFOREST Portal: Oslo, Norway, 2011. [Google Scholar]
  4. Pereira, J.M.; Chuvieco, E.; Beaudoin, A.; Desbois, N. Remote sensing of burned areas: A review. In Report of the Megafires Project ENVCT96-0256; Chuvieco, E., Ed.; Universidad de Alcala: Alcala de Henares, Spain, 1997; pp. 127–183. [Google Scholar]
  5. Gitas, I.Z.; Mitri, G.H.; Ventura, G. Object-based image classification for burned area mapping of Creus Cape, Spain, using NOAA-AVHRR imagery. Remote Sens. Environ. 2004, 92, 409–413. [Google Scholar] [CrossRef]
  6. Richards, J.A; Milne, A.K. Mapping fire burns and vegetation regeneration using principal components analysis. In Proceeding of 1983 International Geoscience and Remote Sensing Symposium (IGARSS’83), San Francisco, CA, USA, 3l August–2 September 1983.
  7. Chuvieco, E.; Congalton, R.G. Mapping and inventory of forest fires from digital processing of TM data. Geocarto Int. 1988, 3, 41–53. [Google Scholar] [CrossRef]
  8. Lentile, L.B.; Holden, Z.A.; Smith, A.M. S.; Falkowski, M.J.; Hudak, A.T.; Morgan, P.; Lewis, S.A.; Gessler, P.E.; Benson, N.C. Remote sensing techniques to assess active fire characteristics and post-fire effects. Int. J. Wildland Fire 2006, 15, 319–345. [Google Scholar] [CrossRef]
  9. Boschetti, M.; Stroppiana, D.; Brivio, P.A. Mapping burned areas in a Mediterranean environment using soft integration of spectral indices from high-resolution satellite images. Earth Interact. 2010, 14, 1–20. [Google Scholar] [CrossRef]
  10. Mitri, G.H.; Gitas, I.Z. Fire type mapping using object-based classification of Ikonos imagery. Int. J. Wildland Fire 2006, 15, 457–462. [Google Scholar] [CrossRef]
  11. Mitri, G.H.; Gitas, I.Z. Mapping the severity of fire using object-based classification of IKONOS imagery. Int. J. Wildland Fire 2008, 17, 431–442. [Google Scholar] [CrossRef]
  12. Polychronaki, A.; Ioannis, I.Z. Burned area mapping in Greece using SPOT-4 HRVIR images and object-based image analysis. Remote Sens. 2012, 4, 424–438. [Google Scholar] [CrossRef]
  13. Henry, M.C. Comparison of single- and multi-date landsat data for mapping wildfire scars in Ocala National Forest, Florida. Photogramm. Eng. Remote Sens. 2008, 74, 881–891. [Google Scholar] [CrossRef]
  14. Mallinis, G.; Koutsias, N. Comparing ten classification methods for burned area mapping in a Mediterranean environment using Landsat TM satellite data. Int. J. Remote Sens. 2012, 33, 4408–4433. [Google Scholar] [CrossRef]
  15. Koutsias, N.; Karteris, M. Logistic regression modelling of multitemporal Thematic Mapper data for burned area mapping. Int. J. Remote Sens. 1998, 19, 3499–3514. [Google Scholar] [CrossRef]
  16. Kontoes, C.C.; Poilvé, H.; Florsch, G.; Keramitsoglou, I.; Paralikidis, S. A comparative analysis of a fixed thresholding vs. a classification tree approach for operational burn scar detection and mapping. Int. J. Appl. Earth Obs. Geoinf. 2009, 11, 299–316. [Google Scholar] [CrossRef]
  17. Ustin, S. Manual of Remote Sensing: Remote Sensing for Natural Resource Management and Environmental Monitoring; Wiley: Hoboken, NJ, USA, 2004. [Google Scholar]
  18. Quintano, C.; Fernández-Manso, A.; Fernández‐Manso, O.; Shimabukuro, Y.E. Mapping burned areas in Mediterranean countries using spectral mixture analysis from a uni-temporal perspective. Int. J. Remote Sens. 2006, 27, 645–662. [Google Scholar] [CrossRef]
  19. Smith, A.M. S.; Drake, N.A.; Wooster, M.J.; Hudak, A.T.; Holden, Z.A.; Gibbons, C.J. Production of Landsat ETM+ reference imagery of burned areas within Southern African savannahs: Comparison of methods and application to MODIS. Int. J. Remote Sens. 2007, 28, 2753–2775. [Google Scholar] [CrossRef]
  20. Pu, R.; Gong, P. Determination of burnt scars using logistic regression and neural network techniques from a single post-fire Landsat 7 ETM + image. Photogramm. Eng. Remote Sens. 2004, 70, 841–850. [Google Scholar] [CrossRef]
  21. Mitrakis, N.E.; Mallinis, G.; Koutsias, N.; Theocharis, J.B. Burned area mapping in Mediterranean environment using medium-resolution multi-spectral data and a neuro-fuzzy classifier. Int. J. Image Data Fusion 2011, 3, 299–318. [Google Scholar] [CrossRef]
  22. Cao, X.; Chen, J.; Matsushita, B.; Imura, H.; Wang, L. An automatic method for burn scar mapping using support vector machines. Int. J. Remote Sens. 2009, 30, 577–594. [Google Scholar] [CrossRef]
  23. Zammit, O.; Descombes, X.; Zerubia, J. Assessment of different classification algorithms for burnt land discrimination. In Proceedings of 2007 IEEE International Geoscience and Remote Sensing Symposium (IGARSS 2007), Barcelona, Spain, 23–28 July 2007; pp. 3000–3003.
  24. Zammit, O.; Descombes, X.; Zerubia, J. Burnt area mapping using support vector machines. For. Ecol. Manag. 2006, 234, S240. [Google Scholar] [CrossRef]
  25. Mitri, G.H.; Gitas, I.Z. A semi-automated object-oriented model for burned area mapping in the Mediterranean region using Landsat-TM imagery. Int. J. Wildland Fire 2004, 13, 367–376. [Google Scholar] [CrossRef]
  26. Polychronaki, A.; Gitas, I.Z. The development of an operational procedure for burned-area mapping using object-based classification and ASTER imagery. Int. J. Remote Sens. 2010, 31, 1113–1120. [Google Scholar] [CrossRef]
  27. Burned area detection and merging development, 2012. ESA CCI Aerosol Website. Available online: https://www.esa-fire-cci.org/webfm_send/445 (accessed on 21 October 2014).
  28. Moustakidis, S.; Mallinis, G.; Koutsias, N.; Theocharis, J.B.; Petridis, V. SVM-based fuzzy decision trees for classification of high spatial resolution remote sensing images. IEEE Trans. Geosci. Remote Sens. 2012, 50, 149–169. [Google Scholar] [CrossRef]
  29. Stavrakoudis, D.G.; Theocharis, J.B.; Zalidis, G.C. A boosted genetic fuzzy classifier for land cover classification of remote sensing imagery. ISPRS J. Photogramm. Remote Sens. 2011, 66, 529–544. [Google Scholar] [CrossRef]
  30. Mountrakis, G.; Im, J.; Ogole, C. Support vector machines in remote sensing: A review. ISPRS J. Photogramm. Remote Sens. 2011, 66, 247–259. [Google Scholar] [CrossRef]
  31. Stavrakoudis, D.G.; Galidaki, G.N.; Gitas, I.Z.; Theocharis, J.B. A genetic fuzzy-rule-based classifier for land cover classification from hyperspectral imagery. IEEE Trans. Geosci. Remote Sens. 2012, 50, 130–148. [Google Scholar] [CrossRef]
  32. Stavrakoudis, D.G.; Galidaki, G.N.; Gitas, I.Z.; Theocharis, J.B. Reducing the complexity of genetic fuzzy classifiers in highly-dimensional classification problems. Int. J. Comput. Intell.Syst. 2012, 5, 254–275. [Google Scholar] [CrossRef]
  33. Smith, A.M.S.; Wooster, M.J.; Powell, A.K.; Usher, D. Texture based feature extraction: Application to burn scar detection in Earth observation satellite sensor imagery. Int. J. Remote Sens. 2002, 23, 1733–1739. [Google Scholar] [CrossRef]
  34. Alonso-Benito, A.; Hernandez-Leal, P.A.; Gonzalez-Calvo, A.; Arbelo, M.; Barreto, A. Analysis of different methods for burnt area estimation using remote sensing and ground truth data. In Proceedings of 2008 IEEE International Geoscience and Remote Sensing Symposium (IGARSS 2008), Boston, MA, USA, 7–11 July 2008.
  35. Vapnik, A. The Nature of Statistical Learning Theory; Springer-Verlag: New York, NY, USA, 1995. [Google Scholar]
  36. Moustakidis, S.P.; Theocharis, J.B.; Giakas, G. Feature selection based on a fuzzy complementary criterion: Application to gait recognition using ground reaction forces. Comput. Meth. Biomech. Biomed. Eng. 2011, 15, 627–644. [Google Scholar] [CrossRef]
  37. Ouma, Y.O.; Tetuko, J.; Tateishi, R. Analysis of co-occurrence and discrete wavelet transform textures for differentiation of forest and non-forest vegetation in very-high-resolution optical-sensor imagery. Int. J. Remote Sens. 2008, 29, 3417–3456. [Google Scholar] [CrossRef]
  38. Feng, D.; Xin, Z.; Pengyu, F.; Lihui, C. A new method for burnt scar mapping using spectral indices combined with Support Vector Machines. In Proceedings of the First International Conference on Agro-Geoinformatics, Shanghai, China, 2–4 August 2012; pp. 1–4.
  39. Koutsias, N.; Karteris, M.; Chuvieco, E. The use of intensity-hue-saturation transformation of Landsat-5 Thematic Mapper data for burned land mapping. Photogramm. Eng. Remote Sens. 2000, 66, 829–840. [Google Scholar]
  40. Haralick, R.M.; Shanmugam, K.; Dinstein, I.H. Textural features for image classification. IEEE Trans. Syst., Man Cybern. 1973, SMC-3, 610–621. [Google Scholar] [CrossRef]
  41. Anselin, L. Local indicators of spatial association—LISA. Geogr. Anal. 1995, 27, 93–115. [Google Scholar] [CrossRef]
  42. Jensen, J.R. Introductory Digital Image Processing: A Remote Sensing Perspective, 2 ed.; Prentice-Hall Press: Upper Saddle River, NJ, United States, 1996. [Google Scholar]
  43. Horne, J.H. A tasseled cap transformation for IKONOS images. In Proceedings of ASPRS 2003 Annual Conference, Anchorage, Alaska, 5–9 May 2003; pp. 60–70.
  44. Chikr El-Mezouar, M.; Taleb, N.; Kpalma, K.; Ronsin, J. An IHS-based fusion for color distortion reduction and vegetation enhancement in IKONOS imagery. IEEE Trans. Geosci. Remote Sens. 2011, 49, 1590–1602. [Google Scholar]
  45. Chuvieco, E.; Huete, A. Fundamentals of Satellite Remote Sensing; CRC Press: London, UK, 2009. [Google Scholar]
  46. Srinivasan, G.N; Shobha, G. Statistical texture analysis. Proc. World Acad. Sci., Eng. Technol. 2008, 36, 1264–1269. [Google Scholar]
  47. Unser, M. Sum and difference histograms for texture classification. IEEE Trans. Pattern Anal. Mach. Intell. 1986, PAMI-8, 118–125. [Google Scholar] [CrossRef]
  48. Haralick, R.M.; Shapiro, L.G. Computer and Robot Vision; Addison-Wesley Longman Publishing Co., Inc.: Boston, MA, USA, 1991; p. 608. [Google Scholar]
  49. Marceau, D.J.; Howarth, P.J.; Dubois, J.M.; Gratton, D.J. Evaluation of the grey-level co-occurrence matrix method for land-cover classification using SPOT imagery. IEEE Trans. Geosci. Remote Sens. 1990, 28, 513–519. [Google Scholar] [CrossRef]
  50. Soh, L.K.; Tsatsoulis, C. Texture analysis of SAR sea ice imagery using gray level co-occurrence matrices. IEEE Trans. Geosci. Remote Sens. 1999, 37, 780–795. [Google Scholar] [CrossRef]
  51. Pesaresi, M. The Remotely Sensed City: Concepts and Applications about the Analysis of the Contemporary Built-Up Environment Using Advanced Space Technologies; EC Joint Research Centre: Ispra, Italy, 2000. [Google Scholar]
  52. Murray, H.; Lucieer, A.; Williams, R. Texture-based classification of sub-Antarctic vegetation communities on Heard Island. Int. J. Appl. Earth Obs. Geoinf. 2010, 12, 138–149. [Google Scholar] [CrossRef]
  53. Puissant, A.; Hirsch, J.; Weber, C. The utility of texture analysis to improve per‐pixel classification for high to very high spatial resolution imagery. Int. J. Remote Sens. 2005, 26, 733–745. [Google Scholar] [CrossRef]
  54. Curran, P.J. The semivariogram in remote sensing: An introduction. Remote Sens. Environ. 1988, 24, 493–507. [Google Scholar] [CrossRef]
  55. Woodcock, C.E.; Strahler, A.H.; Jupp, D.L.B. The use of variograms in remote sensing: I. Scene models and simulated images. Remote Sens. Environ. 1988, 25, 323–348. [Google Scholar] [CrossRef]
  56. Berberoglu, S.; Curran, P.J.; Lloyd, C.D.; Atkinson, P.M. Texture classification of Mediterranean land cover. Int. J. Appl. Earth Obs. Geoinf. 2007, 9, 322–334. [Google Scholar] [CrossRef]
  57. Onojeghuo, A.O.; Blackburn, G.A. Mapping reedbed habitats using texture-based classification of QuickBird imagery. Int. J. Remote Sens. 2011, 32, 8121–8138. [Google Scholar] [CrossRef]
  58. Zhang, Y.; Hong, G. An IHS and wavelet integrated approach to improve pan-sharpening visual quality of natural colour IKONOS and QuickBird images. Inf. Fusion 2005, 6, 225–234. [Google Scholar] [CrossRef]
  59. Baatz, M.; Schäpe, A. Multiresolution segmentation: An optimization approach for high quality multi-scale image segmentation. Angew. Geogr. Inf. Verarb. 2000, XII, 12–23. [Google Scholar]
  60. Duro, D.C.; Franklin, S.E.; Dubé, M.G. A comparison of pixel-based and object-based image analysis with selected machine learning algorithms for the classification of agricultural landscapes using SPOT-5 HRG imagery. Remote Sens. Environ. 2012, 118, 259–272. [Google Scholar] [CrossRef]
  61. Blaschke, T. Object based image analysis for remote sensing. ISPRS J. Photogramm. Remote Sens. 2010, 65, 2–16. [Google Scholar] [CrossRef]
  62. Li, H.; Gu, H.; Han, Y.; Yang, J. Object-oriented classification of high-resolution remote sensing imagery based on an improved colour structure code and a support vector machine. Int. J. Remote Sens. 2010, 31, 1453–1470. [Google Scholar] [CrossRef]
  63. Benz, U.C.; Hofmann, P.; Willhauck, G.; Lingenfelder, I.; Heynen, M. Multi-resolution, object-oriented fuzzy analysis of remote sensing data for GIS-ready information. ISPRS J. Photogramm. Remote Sens. 2004, 58, 239–258. [Google Scholar] [CrossRef]
  64. Van Coillie, F.M.B.; Verbeke, L.P.C.; De Wulf, R.R. Feature selection by genetic algorithms in object-based classification of IKONOS imagery for forest mapping in Flanders, Belgium. Remote Sens. Environ. 2007, 110, 476–487. [Google Scholar]
  65. Myint, S.W.; Gober, P.; Brazel, A.; Grossman-Clarke, S.; Weng, Q. Per-pixel vs. object-based classification of urban land cover extraction using high spatial resolution imagery. Remote Sens. Environ. 2011, 115, 1145–1161. [Google Scholar] [CrossRef]
  66. Foody, G.M.; Mathur, A. Toward intelligent training of supervised image classifications: Directing training data acquisition for SVM classification. Remote Sens. Environ. 2004, 93, 107–117. [Google Scholar] [CrossRef]
  67. Foody, G.M.; Mathur, A. The use of small training sets containing mixed pixels for accurate hard image classification: Training on mixed spectral responses for classification by a SVM. Remote Sens. Environ. 2006, 103, 179–189. [Google Scholar] [CrossRef]
  68. Foody, G.M.; Mathur, A.; Sanchez-Hernandez, C.; Boyd, D.S. Training set size requirements for the classification of a specific class. Remote Sens. Environ. 2006, 104, 1–14. [Google Scholar] [CrossRef]
  69. Markham, B.L; Townshend, J.R.G. Land cover classification accuracy as a function of sensor spatial resolution. In Proceedings of International Symposium on Remote Sensing of Environment, Ann Arbor, MI, USA, 11–15 May 1981; pp. 1075–1990.
  70. Pal, M.; Foody, G.M. Feature selection for classification of hyperspectral data by SVM. IEEE Trans. Geosci. Remote Sens. 2010, 48, 2297–2307. [Google Scholar] [CrossRef]
  71. Hughes, G. On the mean accuracy of statistical pattern recognizers. IEEE Trans. Inf. Theory 1968, 14, 55–63. [Google Scholar] [CrossRef]
  72. Piedra-Fernández, J.A.; Cantón-Garbín, M.; Wang, J.Z. Feature selection in AVHRR ocean satellite images by means of filter methods. IEEE Trans. Geosci. Remote Sens. 2010, 48, 4193–4203. [Google Scholar] [CrossRef]
  73. Lu, D.; Weng, Q. A survey of image classification methods and techniques for improving classification performance. Int. J. Remote Sens. 2007, 28, 823–870. [Google Scholar] [CrossRef]
  74. Shackelford, A.K.; Davis, C.H. A hierarchical fuzzy classification approach for high-resolution multispectral data over urban areas. IEEE Trans. Geosci. Remote Sens. 2003, 41, 1920–1932. [Google Scholar] [CrossRef]
  75. Xiuping, J.; Richards, J.A. Segmented principal components transformation for efficient hyperspectral remote-sensing image display and classification. IEEE Trans. Geosci. Remote Sens. 1999, 37, 538–542. [Google Scholar] [CrossRef]
  76. Chang, C.-C.; Lin, C.-J. LIBSVM: A library for support vector machines. ACM Trans. Intell. Syst. Technol. 2011, 2, 1–27. [Google Scholar] [CrossRef]
  77. Gunn, S.R. Support Vector Machines for Classification and Regression; University of Southampton: Southampton, UK, 1998. [Google Scholar]
  78. Melgani, F.; Bruzzone, L. Classification of hyperspectral remote sensing images with support vector machines. IEEE Trans. Geosci. Remote Sens. 2004, 42, 1778–1790. [Google Scholar] [CrossRef]
  79. Waske, B.; Benediktsson, J.A. Fusion of support vector machines for classification of multisensor data. IEEE Trans. Geosci. Remote Sens. 2007, 45, 3858–3866. [Google Scholar] [CrossRef]
  80. Foody, G.M. Status of land cover classification accuracy assessment. Remote Sens. Environ. 2002, 80, 185–201. [Google Scholar] [CrossRef]
  81. Congalton, R.G.; Green, K. Assessing the Accuracy of Remotely Sensed Data: Principles and Practices; CRC Press: New York, NY, USA, 2008. [Google Scholar]
  82. Giglio, L.; Csiszar, I.; Restás, Á.; Morisette, J.T.; Schroeder, W.; Morton, D.; Justice, C.O. Active fire detection and characterization with the advanced spaceborne thermal emission and reflection radiometer (ASTER). Remote Sens. Environ. 2008, 112, 3055–3063. [Google Scholar] [CrossRef]

